FORM 6-K
SECURITIES AND EXCHANGE COMMISSION
Washington, D.C. 20549
Report of Foreign Issuer
Pursuant to Rule 13a-16 or 15d-16
of the Securities Exchange Act of 1934
For the month of February 2010
Commission File Number: 1-33659
COSAN LIMITED
(Translation of registrant’s name into English)
Av. Juscelino Kubitschek, 1726 – 6th floor
São Paulo, SP 04543-000 Brazil
(Address of principal executive offices)
Indicate by check mark whether the registrant files or will file annual reports under cover of Form 20-F or Form 40-F:
| Form 20-F | X | Form 40-F |
Indicate by check mark if the registrant is submitting the Form 6-K in paper as permitted by Regulation S-T Rule 101(b)(1):
| Yes | No | X |
Indicate by check mark if the registrant is submitting the Form 6-K in paper as permitted by Regulation S-T Rule 101(b)(7):
| Yes | No | X |
Indicate by check mark whether by furnishing the information contained in this Form, the Registrant is also thereby furnishing the information to the Commission pursuant to Rule 12g3-2(b) under the Securities Exchange Act of 1934:
| Yes | No | X |
If “Yes” is marked, indicate below the file number assigned to the registrant in connection with Rule 12g3-2(b): N/A
COSAN LIMITED
Item | |
| 1. | Communication regarding 3rd Quarter Fiscal Year 2010 earnings release |
Item 1
Sugar prices reach record levels
São Paulo, February 1, 2010 - COSAN LIMITED (NYSE: CZZ; Bovespa: CZLT11) and COSAN S.A. INDÚSTRIA E COMÉRCIO (Bovespa: CSAN3) disclose today their results referring to the third quarter of the 2010 fiscal year (3Q’10). The results presented below are consolidated in accordance with Brazilian accounting policies.
Marcelo Martins, CFO & IRO Luiz Felipe Jansen de Mello, Investors Relations ri@cosan.com.br www.cosan.com.br | 3Q’10 Highlights o Record net revenue in 3Q’10 of R$3.8 billion, 48.1% higher than last year’s net revenue in the same quarter. o New record EBITDA affected by the Company’s enrollment in the Refis (Tax Recovery Program) | |
 |
 | Summary of Financial and Operating Information (R$MM) - Cosan S.A. | |||||||||||
| 3Q'09 | 3Q'10 | YTD'09 | YTD'10 | |||||||||
| 438.1 | 379.2 | Ethanol Sold (millions liters) | 1,058.3 | 1,586.6 | ||||||||
| 808.8 | 887.2 | Sugar Sold (thousand tonnes) | 2,340.3 | 2,976.8 | ||||||||
| 864.4 | 1,460.0 | Fuels Sold (million liters) | 3,565.5 | 4,150.3 | ||||||||
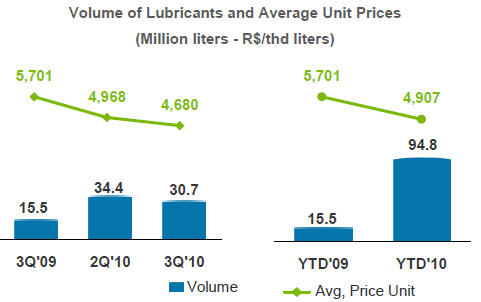
| 15.5 | 30.7 | Lubes Sold (million liters) | 84.7 | 94.8 | ||||||||
 | 2,565.6 | 3,800.5 | Net sales | 3,920.3 | 10,941.9 | |||||||
| 378.0 | 460.0 | l | Gross profit | 559.5 | 1,351.5 | |||||||
| 14.7% | 12.1% | Gross Margin | 14.3% | 12.4% | ||||||||
| 58.5 | 253.0 | l | Operating income (loss) | (609.6) | 1,016.4 | |||||||
| 2.3% | 6.7% | Operating margin | -15.5% | 9.3% | ||||||||
| 340.4 | 490.4 | l | EBITDA | 552.1 | 1,157.2 | |||||||
| 13.3% | 12.9% | EBITDA Margin | 14.1% | 10.6% | ||||||||
| 465.3 | 508.4 | l | EBITDAH | 725.3 | 1,319.3 | |||||||
| 17.3% | 13.3% | EBITDAH Margin | 17.7% | 11.9% | ||||||||
| 5.2 | 167.8 | l | Income (loss) before minority interest | (434.5) | 669.4 | |||||||
| 5.2 | 167.1 | l | Net income (loss) | (433.6) | 677.8 | |||||||
| 0.2% | 4.4% | Profit (loss) Margin | -11.1% | 6.2% | ||||||||
| 432.4 | 401.0 | Capex | 1,011.5 | 1,180.7 | ||||||||
| 3,113.3 | 4,300.8 | l | Net Debt | 3,113.3 | 4,300.8 | |||||||
| 3,728.1 | 4,963.9 | l | Shareholders' & Minorities Equity | 3,728.1 | 4,963.9 | |||||||
1
A. Market Overview According to UNICA, the sugarcane growers’ association, crushed cane volume in Brazil’s Central-South totaled 527.0 million tonnes through January 16, 2010, 5.5% up on the same period in the previous harvest. Given the heavy rainfall, the TSR (total sugar recoverable) fell by 7.23% over the previous season to 130.86kg/t. The production mix prioritized sugar production compared to the year before, with sugar and ethanol absorbing 43.17% and 56.83% of the TSR, respectively. As a result, sugar production totaled 28.4 million tonnes, 6.54% up year-on-year, hydrous ethanol output came to 16.8 billion liters, up by 3.7%, and anhydrous ethanol production stood at 6.1 billion liters, down by 28.7%. More than 70 mills were still crushing in the second week of January. UNICA’s initial estimates pointed to total crushed cane volume of 550 million tonnes, with production of 31.2 million tonnes of sugar and 26.3 billion liters of ethanol, numbers that were not achieved due to the exceptionally heavy rainfall. According to its latest publication, crushed volume could have reached 580 million tonnes under normal conditions. On the other hand, Thailand’s harvest is improving substantially and crushed volume is expect to reach approximately 71 million tonnes, versus 67 million last year, with sugar output of 7.5 million tonnes, resulting in exports of close to 5 million tonnes, 8% up on the previous harvest. The European Union’s main sugar producers, Germany and France, expect higher output this year thanks to favorable weather conditions during planting, which encouraged the EU to issue export licenses totaling 1.35 million tonnes, slightly below the maximum limit of 1.375 million tonnes established by the WTO. It also approved exports of 500,000 tonnes outside these licenses, given that international prices were higher than in Europe, enabling producers to export without subsidies. According to UNICA, however, EU current excess production is result of sugar inventories accumulated over the past crops, when international prices for this product was below EU’s, therefore exports should be limited to the volumes established by the WTO. In India, rainfall delayed the beginning of crushing in the state of Maharashtra and protests over the minimum sugarcane price in Uttar Pradesh resulted in larger volumes of cane being allocated to the production of gur and kandshari (types of raw brown sugar), as well as animal feed (in the previous harvest, 23% of cane went to the production of products other than sugar). Consequently, overall production estimates were once again revised down, this time to around 15 million tonnes, putting even more pressure on the country’s low inventories. In addition, fueled by low yields, domestic sugar prices continued to move up, reaching Rs3.311/quintal (US$709.5/t), 87.6% up on the same quarter last year. In Russia, floundering inventories and expectations of lower yields (close to 30 tonnes of sugar beet per hectare, versus the record of 36.3 t/ha in the previous harvest), led the government to impose a new sugar import tariff band during the inter-harvest period. Between January and April 2010, the tariff will be US$140/t, whereas between May and July it will be variable and may reach as low as US$50/t if the NY#11 price |
2
remains above 22 US¢/lb in the first three quarters of the year, substantially less than the US$165/t in the same period last year. China has also been suffering. Some producing regions have been affected by prolonged drought while others have been hit by frost and blizzards, which not only damage the sugarcane, but also jeopardize sugar distribution, forcing the government to auction part of its strategic inventories. Nevertheless, domestic prices continue to increase and the country may be forced to resort to imports in 2010. Indonesia has also been impacted by higher domestic prices. Consequently, its government allocated import licenses for 500,000 tonnes of white sugar, expected to arrive between December 2009 and April 2010. During the quarter, the major hedge funds, plus smaller funds and speculators, reduced their long sugar positions to an average of 190,000 lots, equivalent to 18% of all open contracts, 13.0% down year-on-year. | ||
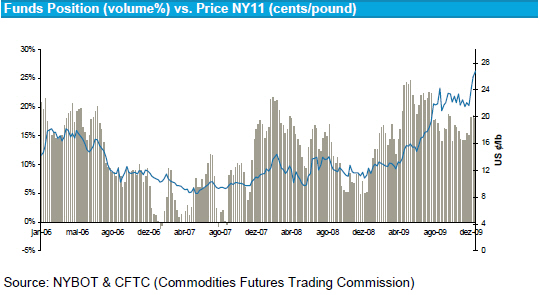 | ||
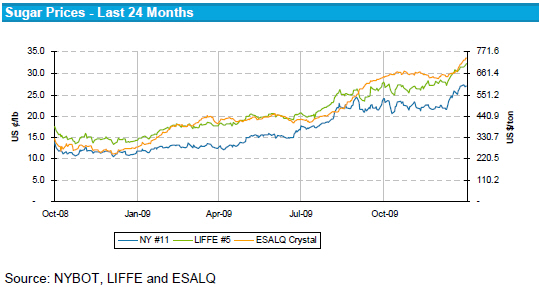
Despite the news from Thailand and the EU, sugar supply and demand forecasts remained unfavorable, pushing up international raw sugar prices by 12.8% over 2Q’10 and 99.6% over 3Q09 to 23.15 US¢/lb. Thanks to the period appreciation of the Real against the dollar, prices in Reais averaged 40.28 R$¢/lb, 53.0% up year-on-year and 5.4% more than the previous quarter. The first future maturity of the NY#11 contract, expiring in March 2010, closed 2009 at 26.95 US¢/lb, reflecting the need to advance supply and defer consumption. International refined sugar averaged US$613.76/t in 3Q’10, 89.2% and 17.3% higher than the 3Q’09 and 2Q’10, respectively, outpacing the raw sugar upturn. The white premium averaged US$116.05/t in the period, thanks to increased demand for refined sugar. The Real continued to appreciate in 3Q’10, averaging R$1.74/US$, 6.9% up on the quarter before, and closing at R$1.74/US$, versus R$1.78/US$ in September 2009 and R$2.34/US$ in December 2008. Domestic crystal sugar prices (ESALQ) averaged R$57.65 per 50Kg bag, 21.7% up on the previous three months and 84.4% more than 3Q’09, reflecting low yields due to heavy harvest rainfall and booming sugar exports, which totaled 19.6 million tonnes between April and December, 21.7% up year-on-year. |
3
 | ||
Domestic hydrous ethanol prices (ESALQ) averaged R$0.957/liter in 3Q’10, 30% up on 3Q’09 and 30.4% more than the previous three months, while anhydrous prices averaged R$1.099/liter, 22.6% up year-on-year and 31.1% improvement over 2Q’10. These prices reflect flagging inter-harvest inventories due to the continuing acceleration of demand (in turn due to growth in vehicle sales despite the financial crisis) and reduced supply due to the heavy rainfall. The window for ethanol exports to Europe and the United States (directly or under the Caribbean Agreement, which allows Caribbean ethanol exports without the ¢US$54/gallon) remains closed, chiefly due to the profitable domestic market price, making exports substantially less competitive. | ||
 | ||
| According to Brazil’s National Petroleum Agency (ANP), the average hydrous ethanol/gasoline price parity (weighted by the size of the fleet) closed 3Q’10 at 71.1%. In early January, the parity was above 70% in the state of São Paulo, the country’s biggest consumption center, leading consumers with flex-fuel vehicles to opt for C gasoline (a blend of 75% A gasoline and 25% anhydrous ethanol) instead of hydrous ethanol, thereby increasing the consumption of anhydrous. Given this scenario, and seeking to minimize the impact on inter-harvest ethanol supply, in January 2010, the Brazilian government reduced the ratio of |
4
anhydrous ethanol in the C gasoline blend from 25% to 20% for February, March and April 2010, which should reduce period demand for this product by around 300 million liters. According to Anfavea, the auto manufacturers’ association, new flex-fuel vehicle sales totaled 690,500 units in 3Q’10, accounting for 86.6% of new car sales. In calendar year 2009, flex-fuel vehicle sales were 13.9% higher than in 2008. | ||
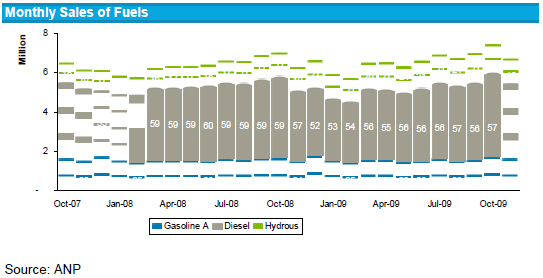 | ||
| According to the ANP (National Oil Agency), diesel sales volume in October and November, 2009 (December data are not available yet) reached 8.1 billion liters, 5.2% higher compared to the same months of 2008. Gasoline A fuel volume also showed a slight increase of 4.3% in such period, reaching 3.3 billion liters. Ethanol showed the highest demand increase, due to an increased flex-fuel fleet, reaching 2.7 billion liters, 13.7% higher than Oct and Nov/09. | ||
| B. Production Data |
| 3Q'09 | 3Q'10 | Production Highlights | YTD'09 | YTD'10 | |||||
| 8,190 | 14,228 | Crushed Cane (thd tons) | 42,388 | 50,133 | |||||
| 4,283 | 5,778 | Own Cane (thd tons) | 21,405 | 23,443 | |||||
| 3,907 | 8,450 | Suppliers (thd tons) | 20,983 | 26,690 | |||||
| Production | |||||||||
| 452 | 662 | Raw Sugar (thd tons) | 2,522 | 2,519 | |||||
| 139 | 274 | Refined Sugar (thd tons) | 656 | 994 | |||||
| 187 | 228 | Anhydous Ethanol (thd cbm) | 734 | 623 | |||||
| 148 | 303 | Hydrous Ethanol (thd cbm) | 929 | 1,202 | |||||
| 138.1 | 126.6 | Sugarcane TSR (kg/ton) | 139.1 | 129.8 | |||||
| 52.2% | 68.4% | Mechanization (%) | 50.8% | 64.5% |
| In 3Q’10, Cosan crushed 14.2 million tons of sugarcane, out of which approximately 41% of its own and 59% coming from suppliers, with 68% of mechanic harvesting. Despite the unseasonal rain levels, which lowered the number of days available for crushing this year to 70% of use of the installed capacity, as well as the change in fiscal year, the volume of sugarcane processed in the accumulated up to 3Q’10 shows a growth of 18.2% in relation to the compared period, especially due to the merger of NovAmérica. Also, as an effect of excessive rain, the TRS quantity obtained in 3Q’10 was 8.3% lower than that of the same quarter in the 2008/09 crop, resulting in a production of 936 thousand |
5
| tons of sugar, out of which 70.7% was raw sugar and 29.3% was refined sugar, and 531 million liters of ethanol, out of which 42.9% was anhydrous ethanol and 57.1% was hydrated ethanol. | |||
| C. Operating Performance | |||
| (i) | In view of the alteration of the fiscal year of 2009, which had an earlier ending, on March 31, 2009, the periods related to 3Q’09 and 3Q’10 are displaced, that is, 3Q’09 comprises the months of November and December, 2008, and of January, 2009, while 3Q’10 comprises the months of October, November and December, 2009; | ||
| (ii) | The depreciation presented in the statements and analysis of result had its criteria changed for this fiscal year, to reflect the depreciation included in the COGS (Cost of Goods Sold) and in operating expenses (SG&A), as opposed to the previous fiscal year, when depreciation was shown based on production, that is, by entry into production of the goods and services provided, in addition to the depreciation assessed in operating expenses. It must be stressed that the depreciation included in operating expenses did not undergo any change of criterion, only production depreciation; | ||
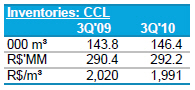
| (iii) | CCL only started to be consolidated in December, 2008, so CCL figures disclosed for 3Q’09 and YTD’09 comprises only the months of December, 2008 and January, 2009. In view of the fact that these periods cannot be compared and on an extraordinary basis, the comparison of 3Q’10 CCL results will be made with 2Q’10 this quarter; | ||
| (iv) | As already commented in previous letters, NovAmérica’s results started to be consolidated as from June, 2009, so there is no comparison between the results of 3Q’10 and 3Q’09. | ||
6
| 3Q'09 | 3Q'10 | Income Statement (R$MM) | YTD'09 | YTD'10 | |||||||
| 2,565.6 | 3,800.5 | Net Operating Revenue | 3,920.3 | 10,941.9 | |||||||
| (2,187.6) | (3,340.5) | (-) | Cost of Goods Sold | (3,360.8) | (9,590.4) | ||||||
| 378.0 | 460.0 | (=) | Gross Profit | 559.5 | 1,351.5 | ||||||
| 14.7% | 12.1% | Gross Margin | 14.3% | 12.4% | |||||||
| (156.8) | (218.4) | (-) | Selling Expenses | (331.1) | (639.3) | ||||||
| (72.3) | (117.9) | (-) | General & Adm. Expenses | (197.6) | (323.4) | ||||||
| 120.2 | 217.0 | (±) | Other Operating Expenses | 116.1 | 292.0 | ||||||
| 71.1 | 149.7 | (+) | Depreciation & Amortization | 405.2 | 476.4 | ||||||
| 340.4 | 490.4 | (=) | EBITDA | 552.1 | 1,157.2 | ||||||
| 13.3% | 12.9% | EBITDA Margin | 14.1% | 10.6% | |||||||
| 465.3 | 508.4 | (=) | EBITDAH (Adjusted by Hedge) | 725.3 | 1,319.3 | ||||||
| 17.3% | 13.3% | EBITDAH Margin | 17.7% | 11.9% | |||||||
| (159.2) | (78.3) | (±) | Net Financial Expenses | (624.0) | 434.0 | ||||||
| 13.6 | (9.4) | (±) | Equity Income | 13.5 | (12.9) | ||||||
| (65.2) | - | (-) | Goodwill Amortization | (145.9) | (85.6) | ||||||
| 58.5 | 253.0 | (=) | Profit Before Income Tax | (609.6) | 1,016.4 | ||||||
| (53.3) | (85.3) | (±) | Income Tax | 175.0 | (347.0) | ||||||
| 0.0 | (0.7) | (±) | Minority Interests | 0.9 | 8.3 | ||||||
| 5.2 | 167.1 | (=) | Net Profit (Loss) | (433.6) | 677.8 | ||||||
| 0.2% | 4.4% | Net Margin | -11.1% | 6.2% | |||||||
Net Revenues | ||
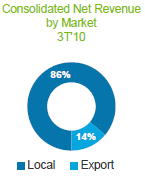 | The net revenues amounted to R$3.8 billion in the quarter. The major contribution to such increase came from CCL, with revenues of R$2.7 billion in the period, representing 71.0% of net invoicing. Among the fuel, diesel accounted for 46.0% of revenues, followed by gasoline with 43.5% and ethanol with 9.5%. Sales of lubricants represented 3.8% of the restated net revenues. In CAA, sugar and ethanol accounted for 63.0% and 28.3% of the total revenues, respectively. Sales to the foreign market represented 43.9% of CAA’s net revenues in the quarter, versus 60.3% in the previous period, mainly due to sugar sales increase in the domestic market as a result of the NovAmérica merger. 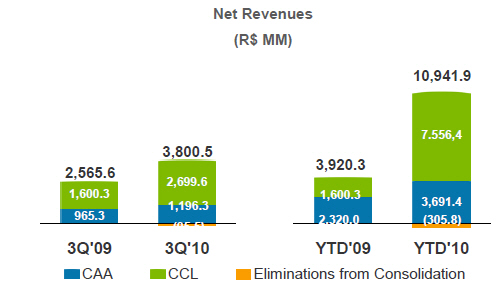 | |
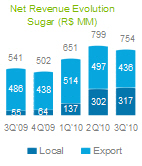 | CAA - Sugar The 39.4% growth in the sugar revenue, comparing this year’s quarter to the same quarter in the previous year, going from R$540.6 million in 3Q’09 to R$753.8 million in 3Q’10 is a result of the greater volume sold (9.7% higher in 3Q’10 than in 3Q’09) and the increase in average unit price (27.2% higher in 3Q’10 than in 3Q’09). In addition, sales of sugar |
7
by NovAmérica are more concentrated in the domestic market, raising the share of this market, in which average prices obtained were 55.4% higher than that of the international market, still reflecting price fixations previously established. 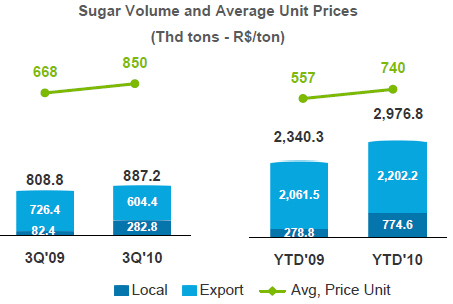 | ||
 | In the foreign market, the average sugar price, of R$722/ton, represented an appreciation of 7.9% when compared to 3Q’09. As explained in previous letters, sugar revenue in the foreign market reflects the results of prices fixed in previous periods. In this quarter, shipped volumes reflect fixations established throughout the last 6 months, presenting an average price of ¢US$17.74/lb. On the other hand, sales in the domestic market, the share of which went from 10.2% of the volume sold in 3Q’09 to 31.9% in the current quarter, almost immediately reflected market prices. | |
| CAA – Ethanol | ||
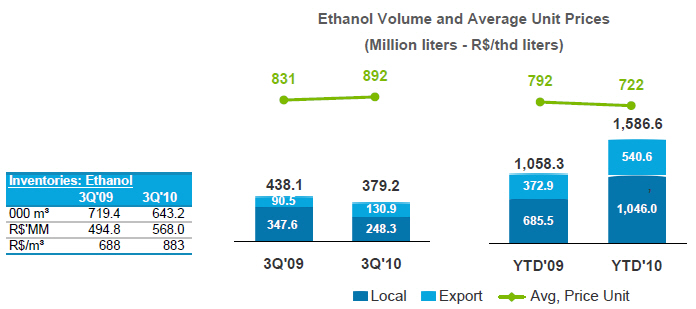
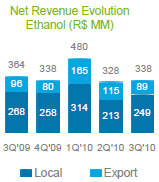 | In spite of prices being 7.3% higher when we compare 3Q’10 to 3Q’09, ethanol revenues (R$338.3 million in the quarter) were 7.1% lower than the obtained in 3Q’09. This negative outcome is mainly due to reduction in volumes sold, dropping from 438.1 million liters in 3Q’09 to 379.2 million liters in 3Q’10 and also due to the mix of sales between the domestic and foreign market, the latter having prices significantly below in the compared quarters, due to export contracts executed in the beginning of the fiscal year, at prices lower than current ones. Such effects were partially offset by internal market prices, which were 30.2% higher when compared to 3Q’10 and 3Q’09 quarters (R$771/m3 in 3Q’09 versus R$1.004/m3 in 3Q’10). |
8
CAA – Other Products and Services Revenues with other products and services showed an increase of 71.8%, from R$60.7 million to R$104.3 million. | ||
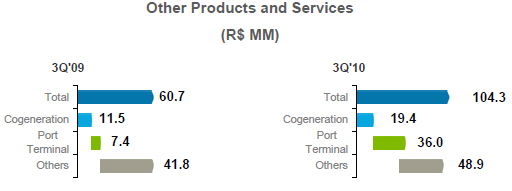 | ||
Cogeneration Revenues of energy cogeneration units totaled R$19.4 million in 3Q’10 versus R$11.5 million in 3Q’09. This variation between the compared quarters basically reflects the commissioning of the Costa Pinto and Rafard mills and the merger of the NovAmérica results, through Tarumã and Maracaí. It is worth mentioning that, in the middle of the 3Q’10, the cogeneration units completed the deliveries of all volumes contracted through energy auctions and bilateral contracts to this crop, therefore the exceeding energy was commercialized on a spot basis, in which prices averaged R$16/MWh, lowering this quarter’s average prices when comparing to past quarters. | ||
| Cogeneration | 3Q'10 | YTD'10 | ||||
| Volume Sold (MWh) | 177,721 | 533,261 | ||||
| Price (R$/MWh) | 94.83 | 150.98 | ||||
| Revenues (R$ thd) | 16,854 | 80,511 | ||||
| Revenues - Steam (R$ thd) | 2,580 | 7,408 | ||||
Rumo In 3Q’10, Rumo Logística revenues amounted R$36.0 million, with 2.2 million tons of shipped sugar, despite the heavy raining in the period. |
9
| Out of that total, 1.7 million tons, or R$26 million of revenues, came from services rendered to third parties. |
| Rumo | 3Q'10 | YTD'10 | |||
| Loading (thd tons) | 2,247.0 | 6,832.0 | |||
| Price (R$/ton) | 16.0 | 17.6 | |||
| Revenues (R$ thd) | 36,029 | 120,243 | |||
Others Other two important invoicing items in this category were sales of products Da Barra Alimentos (R$14.1 million in 3Q’10) and Diesel Oil (R$12.7 million in 3Q’10). | ||
| CCL – Fuels | ||
  | Revenues from the fuel distribution business increased R$313.8 million, or 14.1% comparing the 3Q’10 to the 2Q’10. With the recovery in ethanol prices, exceeding, in many Brazilian states the 70% parity, part of the flex fuel car owners stopped fueling their cars with ethanol and shifted to gasoline instead. Therefore, the higher revenues from CCL fuels distribution business was result of (i) R$163.8 million from the 18.0% increase in sales of gasoline and (ii) R$45.9 million from the 24.2% recovery in ethanol prices. 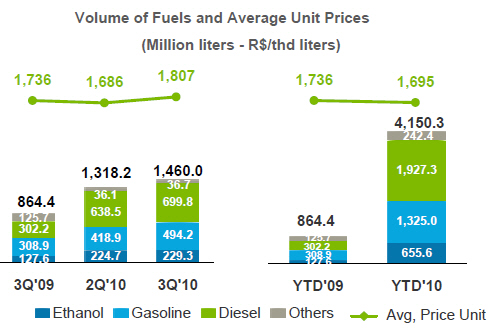 | |
| CCL – Lubricants | ||
 | In the lubricants business, sales were lower than those in 2Q’10 by 15.8%, or R$27.0 million, affected by the following factors: Þ Reduction of R$ 18.1 million, caused by the 10.6% drop in the volume sold which was, chiefly, result of lower demand, reflecting typical seasonality of year-end sales; Þ Due to a lower participation of added value products in the sales mix and punctual prices reductions in 3Q’10, unit prices were reduced by 5.8% |
10
 | ||
Cost of Goods Sold | ||
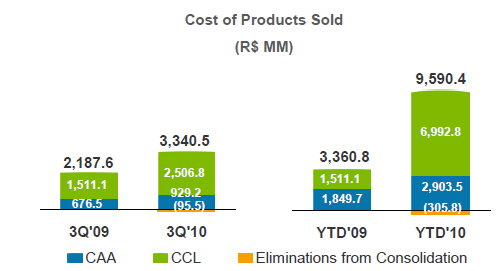 | ||
| The large increment in the cost of goods sold reflects the consolidation of the distribution of fuels and lubricants business, that increased COGS by R$ 2,506.8 million in this quarter, compared to R$1,511.1 million in 3Q’09. |
| 3Q'09 | 3Q'10 | Cost of Goods Sold | YTD'09 | YTD'10 | ||||||
| (2,187.6) | (3,340.5) | Cost of Goods Sold (R$MM) | (3,360.8) | (9,590.4) | ||||||
| (330.3) | (516.4) | Sugar | (970.0) | (1,470.5) | ||||||
| (303.7) | (314.2) | Ethanol | (735.8) | (1,178.5) | ||||||
| (42.6) | (98.6) | Other Products & Services - CA | (143.9) | (254.4) | ||||||
| (1,511.1) | (2,506.8) | CCL | (1,511.1) | (6,992.8) | ||||||
| - | 95.5 | Eliminations from Consolidation | - | 305.8 | ||||||
| Average Unit Cost (R$) | - | - | ||||||||
| 408 | 582 | Unit COGS of Sugar (R$/ton) | 418 | 457 | ||||||
| 693 | 829 | Unit COGS of Ethanol (R$/thousand liters) | 697 | 716 | ||||||
| 1,717 | 1,682 | Unit COGS of CCL (R$/thd liters) | 1,717 | 1,647 | ||||||
CAA Sugar and Ethanol cost of products sold showed an increase of 31%, or R$196.7 million, when compared with costs from 3Q’09. The main reasons for such increase in the COGS are: (i) a 9.7% increase in the volume of sugar sold in the compared period, (ii) increase in the share |
11
of sugar in the domestic market, which has higher value added, and (iii) origination of sugar especially for sales in the domestic market. Other factors negatively influenced the costs of products sold that are common to sugar and ethanol; in short, such effects were: | ||
Þ In view of increase in sugar prices both domestic and foreign markets and also due to recovery of ethanol in the domestic market, the TRS price, according to Consecana’s formula, which defines the compensation of suppliers and land leases, raised by 23.1%, going from R$0.2653 in 3Q’09 to R$0.3267 in 3Q’10; | ||
Þ Increase in the costs of production and processing of sugar and ethanol due to poor yield of sucrose (TSR), which dropped from 138.17kg per ton to 129.14kg per ton of sugarcane in 3Q’10, that is, 6.5% shorter than the previous fiscal year, due to excessive rain in the period between harvests; | ||
Þ Offsetting part of the negative impacts above, cutting, loading and transportation (CCT) costs presented the effects of the consolidation of the mechanization process, which covered 64.5% of the areas harvested up to December 31, 14% higher than the 2008/09 harvest. This category of CCT was R$4.78/ton of cane lower than the traditional cutting process, which is carried out with the burning of sugarcane straw. | ||
| CCL | ||
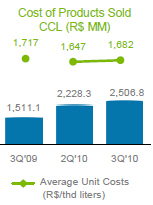 | CCL’s COGS totaled R$2,506.8 million in 3Q’10, representing a 12.5% increase when compared to 2Q’10. In unit terms, costs varied by 2.4% in the period, which increase was mainly due to (i) the increase of 21.4% in ethanol costs in the compared period, reflecting the price recovery of such product at the mills and (ii) the increase in the commercialized volume of gasoline. Part of such increases was compensated by an improvement in the cost of lubricants costs, a reduction of 4.9% in the period, reflecting a sales mix with a lower participation of value added products. Gross Profit With these results, 3Q’10 showed a gross profit of R$460.0 million, an increase of 21.7% compared to the same period in the previous year, with a 12.1% margin. In CAA, ethanol continues to operate with low margins, of 7.1% versus 16.6% of the same comparison period, whereas sugar showed a positive margin of 31.5%, benefiting, in part, from higher prices in the international market and greater participation of sugar sold in the domestic market. In CCL, in turn, the unit gross margin (R$/m3) of the lubricants division remained as the most profitable, followed by the gasoline margin. |
12
| 3Q'09 | 3Q'10 | Gross Margin | YTD'09 | YTD'10 | |||||
| Average Unit COGS | |||||||||
| 260 | 268 | Sugar (R$/ton) | 142 | 246 | |||||
| 138 | 63 | Ethanol (R$/thd liters) | 97 | (21) | |||||
| 101 | 129 | CCL (R$/thd liters) | 101 | 133 | |||||
| Gross Margin % | |||||||||
| 38.9% | 31.5% | Sugar | 25.5% | 33.3% | |||||
| 16.6% | 7.1% | Ethanol | 12.3% | -2.9% | |||||
| 5.6% | 7.1% | CCL | 5.6% | 7.5% | |||||
Selling Expenses CAA’s selling expenses in 3Q’10 were 17.7% higher compared to 3Q’09, mainly due to NovAmérica’s merger (R$23.0 million), which did not have its results consolidated at CAA in 3Q’09. Excluding these effects, selling expenses decreased 6.8% (R$88.0 million in 3Q’10 versus R$94.4 million in 3Q’09), justified by a smaller volume of sugar exported in 3Q’10 as opposed to 3Q’09 (726.4 thd ton versus 604.4 thd ton, respectively). |
| 3Q'09 | 3Q'10 | Selling Expenses | YTD'09 | YTD'10 | |||||
| (156.8) | (218.4) | Selling Expenses (R$MM) | (331.1) | (639.3) | |||||
| (94.4) | (111.1) | CAA | (268.8) | (343.9) | |||||
| (62.3) | (107.3) | CCL | (62.3) | (295.4) | |||||
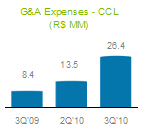
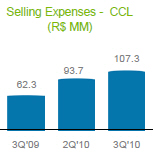 | Increase of 14.5% in CCL’s Selling expenses, as opposed to 2Q’10, refer mainly to marketing expenses, aiming to increasing brand exposure and ethanol visibility, as well as increase in expenses with maintenance and repairs expenses, to improve the image of service stations. General and Administrative Expenses General and administrative expenses of R$117.9 million, representing 3.1% of the net revenues in 3Q’10, showed a significant increase (63.1%) in relation to the R$72.3 million of 3Q’09, mainly due to the incoming of CCL expenses (R$26.4 million) and NovAmérica (R$6.6 million). Excluding CCL and NovAmérica impacts, general and administrative expenses grew 44% (R$84.9 million in 3Q’10 versus R$72.3 million in 3Q’09). The growth of general and administrative expenses was mainly leveraged by the following factors: (i) expenses related to the adoption of book-entry of Stock Options accounting, which started to be recognized only in this fiscal year, as per Technical Opinion CPC10; (ii) referring to the provisioning of amounts payable on account of variable compensation of the management and employees, in view of better results verified, and (iii) higher expenditures with consulting services, aimed at projects such as the CAN and EVA implementation. | |
 | Regarding CCL, administrative expenses increase of R$ 12.9 million this quarter, as opposed to 2Q’10. This increase is mainly due to non-recurring effects of expenditures with consulting services, occurred in the quarter, provision for Profit Sharing (PLR) and bonus, as well as a positive impact due to the reversion of the provision for contingencies, occurred in 2Q’10 but not repeated in 3Q’10. |
13
| 3Q'09 | 3Q'10 | General & Administrative Expenses | YTD'09 | YTD'10 | ||||||
| (72.3) | (117.9) | G&A Expenses (R$MM) | (197.6) | (323.4) | ||||||
| (63.9) | (91.5) | CAA | (189.2) | (267.2) | ||||||
| (8.4) | (26.4) | CCL | (8.4) | (56.2) | ||||||
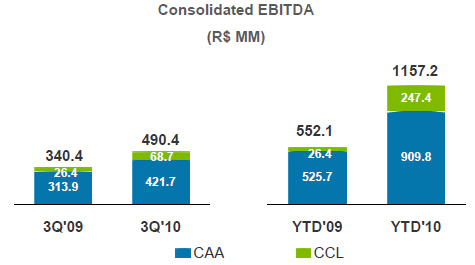
EBITDA Depreciations and amortizations of R$149.7 million, 110.5% higher than those registered in 3Q’09 (R$71.1 million), are mainly due to the changed in the criteria determining the depreciation adjusted to EBITDA calculations, as previously mentioned. In 3Q’09, the criteria for recognizing depreciation in the result was based on production and, with the end of the productive harvest, acknowledged amounts were shorter. With the new criteria adopted, part of the depreciations and amortizations of the production remain in the inventory, and are only included in the result as the products are sold. Thus, excluding this non-cash effect of operating costs and expenses, the Company showed an EBITDA of R$490.4 million, versus R$340.4 million in the same period of the previous year. Out of this amount, R$421.7 million were generated by CAA, and the highest impact (R$211.6 million) is a result of the Company’s decision to adhere to the Refis Program, as explained later in section F. CCL’s contribution was of R$68.7 million, compared to R$86.3 million in the previous quarter, mostly affected by non-recurring expenses stated in Selling Expenses, General and Administrative expenses above. | ||
 | ||
Financial Results The net financial result was negative by R$78.3 million in 3Q’10 as opposed to R$159.2 million in the same quarter of the previous year. From this negative result, R$128.1 million are due to less expenses with net exchange variation, in view of the exposure of assets and liabilities in foreign currency and considering that the Real appreciated only 2% in relation to the dollar in 3Q’10, as opposed to the 21% appreciation in 3Q’09. The derivatives result was positive by R$ 18.0 million in 3Q’10 (R$125.0 million in 3Q’09), represented by a loss of R$33.9 million with commodities derivatives, compensated by gains of R$ 51.9 million with currency derivatives. |
14
| Interest on Financial debt totaled R$111.3 million this quarter, as opposed to R$95.2 million in the same quarter of the previous year. This increase is mainly due to the indebtedness of Cosan Alimentos (former NovAmérica), which was only consolidated as of June, 2009, and because the indebtedness assumed to acquire CCL impacted only two months of 3Q’09 |
| 3Q'09 | 3Q'10 | Financial Expenses, Net (R$MM) | YTD'09 | YTD'10 | |||||
| (95.2) | (111.3) | Interest on Financial Debt | (176.2) | (312.8) | |||||
| 19.4 | 14.1 | Financial Investments Income | 55.0 | 41.7 | |||||
| (75.8) | (97.2) | (=) | Sub-total: Interest on Net Financial Debt | (121.2) | (271.1) | ||||
| (28.5) | (47.2) | Other interest and monetary variation | (95.5) | (88.7) | |||||
| (179.0) | 50.1 | Exchange Variation | (578.9) | 629.0 | |||||
| 125.0 | 18.0 | Gains (losses) with Derivatives | 173.1 | 162.1 | |||||
| (0.9) | (2.0) | CPMF Taxes, Banking Fees and Other | (1.6) | (2.9) | |||||
| (159.2) | (78.3) | (=) | Net Financial Expenses | (624.0) | 434.0 | ||||
| The position of volumes and prices fixed on December 31, 2009, with the purpose of hedging prices of sugar, ethanol and the currency exchange rate is as follows: |
| Summary of Hedge on December 31, 2009: | Fiscal Year | ||||
| 2009/10 | 2010/11 | 2011/12 | |||
| Sugar | |||||
| Sugar #11 (NY) - * | |||||
| Volume (thd tons) | 861.4 | 1,249.6 | 119.0 | ||
| Average Price (¢US$/lb) | 20.7 | 20.5 | 18.8 | ||
| London #5 | |||||
| Volume (thd tons) | 70.0 | 50.0 | - | ||
| Average Price (US$/ton) | 591.4 | 567.2 | - | ||
| FX | |||||
| US$ | |||||
| Volume (US$ million) | 103.3 | 624.2 | - | ||
| Average Price (R$/US$) | 1,808 | 1,882 | - | ||
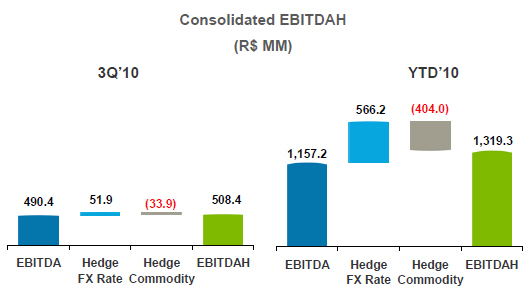
EBITDAH The EBITDAH for the quarter was of R$508.4 million, as opposed to R$465.3 million in the same quarter last year. Hedge results of these periods, though, cannot be compared, since, as from 4Q’09, according to changes in the Brazilian accounting policies, the results from derivatives began to reflect the adjustments to the portfolio of contracted and open derivative positions at market value in the period, which is already performed under US GAAP. Therefore, the results from derivatives no longer reflects the amount of gains or losses with derivatives associated with the volume of operating revenue in the period, but rather the adjustment of open derivative positions to their fair value independent of the objected being hedged by the derivatives. The result of R$508.4 million in the quarter was affected by a net positive derivative effect of R$18 million, as demonstrated below: |
15
 | ||
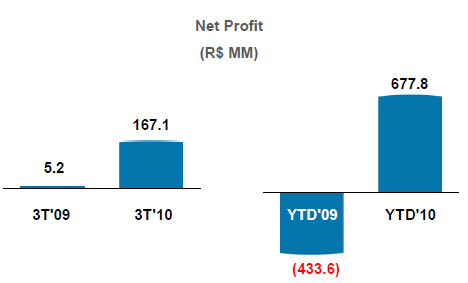
Net Profit Cosan ended 3Q’10 with a net profit of R$167.1 million, as opposed to R$ 5.2 million in the same quarter of the previous year. This result was strongly impacted by the appropriation of Refis gains, in the amount of R$211.6 million, and negatively affected by reductions in the sales volumes of sugar and ethanol. | ||
 | ||
| D. Financial Situation | ||
| The Company closed 3Q’10 with gross financial debt of R$5,164.9 million, 1.8% down on the R$5,258.3 recorded at the end of 2Q’10. In November 2009, the Company implemented several measures to improve its debt profile, including full payment of the promissory notes, 2009 senior notes, bank credit certificates and debentures, the last two resulting from the acquisition of NovAmérica, and the contracting of (i) US$ 430 million in export pre-payments maturing in 5 years, (ii) US$ 100 million in export credit notes (NCE) maturing in 3 years; (iii) R$ 300 million in export credit certificates (CCE) maturing in 2 years. In addition, the BNDES (Brazilian Development Bank) disbursed part of the funding for Jataí and Gasa. |
16
| Debt per Type (R$MM) | 2Q'10 | 3Q'10 | % ST | Var. | |||
| Foreign Currency | 2,717.8 | 3,591.8 | 874.0 | ||||
| Perpetual Notes | 809.6 | 792.8 | 1.2% | (16.8) | |||
| Senior Notes 2017 | 719.4 | 716.7 | 2.8% | (2.7) | |||
| Senior Notes 2009 | 66.4 | - | 0.0% | (66.4) | |||
| Senior Notes 2014 | 630.5 | 632.3 | 3.6% | 1.7 | |||
| IFC | 83.0 | 90.9 | 100.0% | 8.0 | |||
| FX Advances | 91.0 | 223.2 | 100.0% | 132.2 | |||
| Pre-Export Contracts | 95.1 | 960.0 | 20.7% | 864.9 | |||
| Export Credit Notes | 222.9 | 176.0 | 0.0% | (46.9) | |||
| Local Currency | 2,540.5 | 1,573.0 | (967.4) | ||||
| Promissory Notes | 1,233.7 | - | 0.0% | (1,233.7) | |||
| BNDES | 714.8 | 844.8 | 6.5% | 130.0 | |||
| Finame (BNDES) | 210.0 | 156.1 | 31.0% | (53.9) | |||
| Working Capital | 20.5 | 20.0 | 21.7% | (0.5) | |||
| Overdraft | 36.7 | 42.0 | 100.0% | 5.3 | |||
| Credit Banking Notes | 217.4 | 121.1 | 100.0% | (96.4) | |||
| Debentures | 152.6 | - | 0.0% | (152.6) | |||
| Credit Notes | - | 334.5 | 10.9% | 334.5 | |||
| CDCA | - | 60.2 | 50.2% | 60.2 | |||
| PROINFA | - | 42.2 | 0.0% | 42.2 | |||
| Expenses with Placement of Debt | (45.2) | (47.7) | 32.4% | (2.5) | |||
| Gross Debt | 5,258.3 | 5,164.9 | 17.2% | (93.4) | |||
| Cash and Marktable Securities | 948.6 | 864.1 | (84.6) | ||||
| Net Debt | 4,309.7 | 4,300.8 | (8.9) |
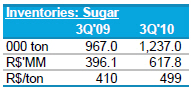
Also at the end 3Q’10, Cosan’s cash position totaled R$864.1 million, reducing its net debt to R$4,300.8 or 3.0 times EBITDA in the last 12 months. This EBITDA is calculated using CCL’s and CAA’s last 12 month EBITDA and NovAmérica’s annualized last 7 month EBITDA. The debt profile improved substantially, given that of the 17.2% of the total corresponding to short-term debt, approximately R$400 million was in advances on foreign exchange contracts (ACC) and in part of exports prepayment, both products linked to the Company’s exports. A further R$90 million also classified as short-term referred to the debt with the IFC, which the Company decided to prepay due to its high cost, given that a portion is linked to the Group’s operating cash flow. In addition, we preferred to initiate new negotiations with IFC in order to create a new loan agreement that properly reflect the Company’s current financial and ownership situation. | ||
| E. Investments | ||
Cosan totaled R$ 413.9 million in its investment flow for 3Q’10. Out of the total amount of investments, R$ 401.0 million were invested in Capex, that is, investments in fixed assets. The substantial difference when one analyses the total investment flow in 3Q’10 as opposed to 3Q’09, is the fact that, in the same period of the previous year, the amount was disbursed for CCL acquisition. The operating Capex of R$210.1 million is related to the maintenance of the sugarcane plantations, industrial mills and to several projects to improve the efficiency of already existing assets. This quarter we accelerated expansion projects of sugar plants that, when concluded, will raise our sugar production capacity by 400 thd ton/year. |
17
| 3Q'09 | 3Q'10 | Capex (R$MM) | YTD'09 | YTD'10 | |||||
| 17.4 | 48.2 | l | Sugar Cane Planting Costs | 96.9 | 164.6 | ||||
| 45.4 | 36.7 | l | Inter-harvest Maintenance Costs | 60.2 | 63.2 | ||||
| 95.0 | 104.7 | l | Projects CAA | 229.4 | 232.6 | ||||
| 4.8 | 20.5 | l | Projects CCL | 4.8 | 39.7 | ||||
| 162.7 | 210.1 | (=) | Operating Capex | 391.3 | 500.2 | ||||
| 103.5 | 93.5 | l | Co-generation Projects | 272.4 | 264.4 | ||||
| 166.3 | 97.5 | l | Greenfield | 347.9 | 416.1 | ||||
| 432.4 | 401.0 | (=) | Capex | 1,011.5 | 1,180.7 | ||||
| 1,533.7 | 14.7 | l | Investments | 1,595.9 | (14.6) | ||||
| - | (1.8) | l | Cash received on Sale of Fixed Assets | - | (121.0) | ||||
| 1,966.1 | 413.9 | (=) | Investment Cash Flow | 2,607.4 | 1,045.1 | ||||
Capex on 3Q’10’s is 7.3% lower than the same period in the previous year, especially due to the slowdown of disbursements in greenfield projects that were about to be concluded. On the other hand, operating projects significantly increased, as described below. The planting in 3Q’09 was reduced to adapt cane levels to the installed capacity. In 3Q’10, investments in the renewal of the planting were retaken, increasing the invested amount to R$ 48.2 million, throughout 8,400 hectares. This amount also includes the soil preparation in areas not yet planted. Inter-harvest maintenance investments were 19% lower than in the previous year, even with the inclusion of the NovAmérica units, since 3Q’09 comprises months from November to January, and this last month is typically strong in inter-harvest maintenance. Several CAA projects used up R$ 104.7 million, and have the purpose of expanding crushing capacity at existing units, increasing capacity at sugar plants, internal infrastructure and environmental and processes improvements. CCL’s capex in 3Q’10 was of R$ 20.5 million, 166% higher than in the previous quarter. The main investments were concentrated in the infrastructure area, aiming at supporting the company’s growth plans, such as the reopening of the Belém and Governador Valadares terminals, and the beginning of the construction of the Alto Taquari terminal. Additionally, investments were made in image improvement and in the expansion of the Esso network gas stations chain. Investments in power cogeneration were of R$93.5 million in the period, 9.6% lower than the same period in the previous fiscal year; especially due to the current stage of the works in progress, if compared to the works in the conclusion stage as of 3Q’09, which used up a high amount of resources. The capex for Cosan’s greenfield projects was of R$97.5 million in the period, associated with the stage of conclusion stage of the Jataí (Goiás) and Caarapó (Mato Grosso do Sul) projects. In 3Q’10, the CCL capex shows investments of R$ 20.5 million in improvements to service stations, terminals expansion and renovation, and interventions in the lubricants plant. The 165% increase, compared to the previous quarter, can be explained by the retaking of the works pace and service stations branding. |
18
| F. Effects of the Program for Paying Tax debts in Installments (“Refis”) | ||
| During the 3Q’10, the Company adhered to the program for paying tax debts in installments, set by the Brazilian Government in accordance with law No. 11.941/09 and Provisional Measure MP 470/09. In the scope of the program, Cosan had reductions in contingent tax liabilities, mainly related to the IPI Tax, which generated a benefit in the quarter, recognized in the entry of other operating revenues, in the amount of R$ 211.6 million. Additionally, this program also enabled the company to use income tax losses credits in the amount of approximately R$ 204 million, to reduce tax obligations that were previously being the subject contest of dispute by the Company. This last benefit, in spite of not impacting the result under the accounting point of view, benefited the Company, in the sense that the mentioned tax credits of the Income Tax are used only as the Company profits according to tax criteria, and are limited to 30% of the same in each annual period. | ||
| G. Material Facts | ||
In November 2009, the Company’s first greenfield project began operations in the city of Jataí, in Goiás state. With a crushing capacity of 4 million tonnes p.a., the Jataí plant is considered to be among the most modern in Brazil and the world, thanks to its exceptionally high level of automation. Also on this quarter, the Caarapó greenfield Project, which Cosan assumed with the acquisition of NovAmérica, started operating. On November 24th, the Company acquired a 26.7% of participation in TEAS, an ethanol port terminal in Santos, for the amount of R$20 million, becoming the owner of 66.67% of this society’s total and voting capital On December 24, 2009, Rumo Logística notified ALL – América Latina Logística S.A. that as of that date the long-term agreements entered into by the two parties in March 2009 were valid and executable in all their terms and conditions, in the form set forth therein. The object of the agreements include the transportation by ALL of bulk sugar and other byproducts, with the expansion of the parties’ operational capacity through investments of around R$ 1.2 billion in rights of way, yards, rail cars, locomotives and terminals to be realized by Rumo in ALL’s network. By January 20, 2010, Rumo had already transported approximately 230,000 tonnes of sugar through ALL’s network. The period for the exercise of subscription warrants conferred during the capital increase of Cosan S.A. on November 10, 2008, expired on December 31, 2009. A total of 54,987,554 warrants were exercised, increasing the Company's capital by 32,992,531 new shares. Cosan Limited exercised all of the warrants it held, subscribing to 26,996,089 new Cosan S.A. shares and increasing the latter’s capital by R$ 431,937,424.00, while other shareholders were responsible for |
19
| exercising warrants corresponding to 5,996,442 new shares, equivalent to R$ 95,943,072.00. |
| Shareholder | Common shares | % | |||
| Cosan Limited | 253,703,323 | 62.40 | |||
| Rezende Barbosa | 44,300,389 | 10.90 | |||
| Novo Mercado | 108,539,605 | 26.70 | |||
| Total | 406,543,317 | 100.00 |
| In December 2009, Cosan and Amyris announced a partnership to implement Amyris’ technology in one of the Group’s plants to produce high added-value biofuels, involving investments of up to R$ 50 million. In addition to sugar and ethanol, the unit will also be capable of producing a chemical compound resulting from the fermentation of sugarcane juice and yeast. Both companies are still studying the details regarding the implementation and funding of these operations. For Cosan, investments in the development of new renewable energy sources such as biofuels are strategic, and the partnership with Amyris underlines this commitment. | ||
| H. Guidance | ||
This section contains guidance ranges for selected key parameters of the Company. Note that statements in other sections of this letter may also contain projections. These projections and guidance are merely estimates and indicative, and should not be construed as a guarantee of future performance. This guidance takes into consideration the operations held by the Cosan group today, which includes CCL, NovAmérica Agroenergia (10 months) and Rumo Logística, as well as the typical and known sugar, ethanol and cogeneration operations of Cosan. |
| Guidance | 2008FY | 2009FY | 2010FY | ||
| Crushed Cane Volume (thousand tons) | 40,315 | 43,127 | +20% ≤ ∆ ≤ +30% | ||
| Sugar Volume Sold (thousand tons) | 3,147 | 3,052 | +30% ≤ ∆ ≤ +50% | ||
| Ethanol Volume Sold (million liters) | 1,568 | 1,495 | +40% ≤ ∆ ≤ +60% | ||
| Revenues (R$MM) | 2,736 | 6,270 | +110% ≤ ∆ ≤ +140% | ||
| EBITDA (R$MM) | 183 | 718 | +100% ≤ ∆ ≤ +120% | ||
| Net Profit/Loss (R$MM) | (48) | (474) | * | ||
| Capex (R$MM) | 1,053 | 1,346 | +20% ≤ ∆ ≤ +40% |
| * The Net profit (loss) is very sensitive to FX variations. Considering today’s FX rate of R$1.89/US$, it is expected that the FY’09 net loss of R$473.8 million will be reverted to net profit in the next fiscal year. |
20
| I. Attachments | ||
| 1. Net Revenues |
| 3Q'09 | 3Q'10 | Sales Composition (R$MM) | YTD'09 | YTD'10 | |||||||
| 2,565.6 | 3,800.5 | Net Operating Revenue | 3,920.3 | 10,941.9 | |||||||
| 540.6 | 753.8 | l | Sugar Revenue - CAA | 1,302.7 | 2,203.7 | ||||||
| 54.6 | 317.3 | Local | 169.7 | 756.1 | |||||||
| 486.0 | 436.5 | Export | 1,133.0 | 1,447.7 | |||||||
| 364.0 | 338.3 | l | Ethanol Revenue - CAA | 838.5 | 1,145.5 | ||||||
| 268.0 | 249.3 | Local | 517.3 | 776.2 | |||||||
| 96.0 | 89.0 | Export | 321.2 | 369.3 | |||||||
| 60.7 | 104.3 | l | Other Revenue - CAA | 178.7 | 342.1 | ||||||
| 55.4 | 104.3 | Local | 163.6 | 325.0 | |||||||
| 5.3 | 0.0 | Export | 15.2 | 17.1 | |||||||
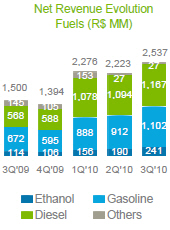
| 1,500.2 | 2,537.0 | l | Fuels Revenue - CCL | 1,500.2 | 7,035.7 | ||||||
| 114.3 | 240.7 | Ethanol | 114.3 | 586.5 | |||||||
| 672.4 | 1,102.4 | Gasoline | 672.4 | 2,902.3 | |||||||
| 568.2 | 1,166.5 | Diesel | 568.2 | 3,339.3 | |||||||
| 145.3 | 27.4 | Other | 145.3 | 207.6 | |||||||
| 88.2 | 143.9 | l | Lubes Revenue - CCL | 88.2 | 465.1 | ||||||
| 12.0 | 18.7 | l | Other Revenue - CCL | 12.0 | 55.6 | ||||||
| - | (95.5) | l | Eliminations from Consolidation | - | (305.8) | ||||||
2. Volume Sold |
| 3Q'09 | 3Q'10 | Volume Sold | YTD'09 | YTD'10 | |||||||
| 808.8 | 887.2 | Sugar (thd tons) | 2,340.3 | 2,976.8 | |||||||
| 82.4 | 282.8 | Local | 278.8 | 774.6 | |||||||
| 726.4 | 604.4 | Export | 2,061.5 | 2,202.2 | |||||||
| 438.1 | 379.2 | Ethanol (MM liters) | 1,058.3 | 1,586.6 | |||||||
| 347.6 | 248.3 | Local | 685.5 | 1,046.0 | |||||||
| 90.5 | 130.9 | Export | 372.9 | 540.6 | |||||||
| 864.4 | 1,460.0 | Fuels (MM liters) | 864.4 | 4,150.3 | |||||||
| 127.6 | 229.3 | Ethanol | 127.6 | 655.6 | |||||||
| 308.9 | 494.2 | Gasoline | 308.9 | 1,325.0 | |||||||
| 302.2 | 699.8 | Diesel | 302.2 | 1,927.3 | |||||||
| 125.7 | 36.7 | Others | 125.7 | 242.4 | |||||||
| 15.5 | 30.7 | Lubes (MM liters) | 15.5 | 94.8 | |||||||
3. Average Prices |
| 3Q'09 | 3Q'10 | Average Price | YTD'09 | YTD'10 | ||||||
| 668 | 850 | Sugar (R$/ton) | 557 | 740 | ||||||
| 663 | 1,122 | Local | 609 | 976 | ||||||
| 669 | 722 | Export | 550 | 657 | ||||||
| 831 | 892 | Ethanol (R$/thd liters) | 792 | 722 | ||||||
| 771 | 1,004 | Local | 755 | 742 | ||||||
| 1,060 | 680 | Export | 861 | 683 | ||||||
| 1,736 | 1,738 | Fuels (R$/Thd liters) | 1,736 | 1,695 | ||||||
| 896 | 1,050 | Ethanol | 896 | 895 | ||||||
| 2,176 | 2,231 | Gasoline | 2,176 | 2,190 | ||||||
| 1,880 | 1,667 | Diesel | 1,880 | 1,733 | ||||||
| 1,156 | 745 | Others | 1,156 | 856 | ||||||
| 5,701 | 4,680 | Lubes (R$/Thd liters) | 5,701 | 4,907 | ||||||
21
J. Financial Statements of Cosan S.A. – BR GAAP
| Income Statement | Apr'07 | Apr'08 | Mar'09 | Apr'08 | Jul'08 | Oct'08 | Jan'09 | Mar'09 | Jun'09 | Sep'09 | Dec'09 | ||||||||||||||||||||||||||||||||||
| (In million of reais) | FY'07 | FY'08 | FY'09 | 4Q'08 | 1Q'09 | 2Q'09 | 3Q'09 | 4Q'09 | 1Q'10 | 2Q'10 | 3Q'10 | ||||||||||||||||||||||||||||||||||
| Gross Operating Revenue | 3,902.9 | 2,978.6 | 6,732.8 | 916.4 | 692.7 | 760.1 | 2,746.4 | 2,533.6 | 3,843.5 | 3,907.2 | 4,145.1 | ||||||||||||||||||||||||||||||||||
| (-) | Sales Taxes and Deductions | (297.8 | ) | (242.5 | ) | (462.7 | ) | (73.4 | ) | (53.1 | ) | (45.0 | ) | (180.7 | ) | (183.8 | ) | (277.4 | ) | (331.9 | ) | (344.6 | ) | ||||||||||||||||||||||
| (=) | Net Operating Revenue | 3,605.1 | 2,736.2 | 6,270.1 | 843.0 | 639.6 | 715.1 | 2,565.6 | 2,349.8 | 3,566.1 | 3,575.3 | 3,800.5 | |||||||||||||||||||||||||||||||||
| (-) | Cost of Goods Sold and Services Rendered | (2,481.1 | ) | (2,387.1 | ) | (5,470.7 | ) | (693.6 | ) | (626.0 | ) | (547.1 | ) | (2,187.6 | ) | (2,109.9 | ) | (3,198.4 | ) | (3,051.5 | ) | (3,340.5 | ) | ||||||||||||||||||||||
| (=) | Gross Profit | 1,123.9 | 349.0 | 799.4 | 149.4 | 13.6 | 167.9 | 378.0 | 239.9 | 367.7 | 523.8 | 460.0 | |||||||||||||||||||||||||||||||||
| Margin | 31.2% | 12.8% | 12.7% | 17.7% | 2.1% | 23.5% | 14.7% | 10.2% | 10.3% | 14.7% | 12.1% | ||||||||||||||||||||||||||||||||||
| (-) | Operating Income (Expenses): | (556.6 | ) | (418.0 | ) | (1,508.5 | ) | (161.8 | ) | (94.9 | ) | (754.7 | ) | (319.6 | ) | (339.4 | ) | 117.9 | (246.1 | ) | (206.9 | ) | |||||||||||||||||||||||
| (-) | Selling | (282.0 | ) | (301.3 | ) | (432.6 | ) | (74.9 | ) | (85.7 | ) | (88.6 | ) | (156.8 | ) | (101.5 | ) | (209.6 | ) | (211.3 | ) | (218.4 | ) | ||||||||||||||||||||||
| (-) | General and Administrative | (246.2 | ) | (210.2 | ) | (275.9 | ) | (57.7 | ) | (59.7 | ) | (65.7 | ) | (72.3 | ) | (78.2 | ) | (89.3 | ) | (116.2 | ) | (117.9 | ) | ||||||||||||||||||||||
| (-) | Financial Income (Expenses), Net | 158.0 | 284.3 | (817.4 | ) | 1.0 | 86.9 | (551.8 | ) | (159.2 | ) | (193.4 | ) | 433.4 | 78.9 | (78.3 | ) | ||||||||||||||||||||||||||||
| (±) | Earnings (Losses) on Equity Investments | (0.1 | ) | 6.6 | 14.0 | 6.4 | 0.2 | (0.3 | ) | 13.6 | 0.5 | (3.6 | ) | 0.0 | (9.4 | ) | |||||||||||||||||||||||||||||
| (-) | Goodwill Amortization | (223.7 | ) | (201.4 | ) | (196.5 | ) | (40.6 | ) | (40.4 | ) | (40.4 | ) | (65.2 | ) | (50.5 | ) | (85.6 | ) | - | - | ||||||||||||||||||||||||
| (±) | Other Operating Income (Expenses), Net | 37.3 | 4.0 | 199.9 | 4.0 | 3.9 | (8.0 | ) | 120.2 | 83.7 | 72.5 | 2.5 | 217.0 | ||||||||||||||||||||||||||||||||
| (=) | Operating Income (Loss) | 567.3 | (69.0 | ) | (709.1 | ) | (12.4 | ) | (81.3 | ) | (586.7 | ) | 58.5 | (99.5 | ) | 485.6 | 277.8 | 253.0 | |||||||||||||||||||||||||||
| Margin | 15.7% | -2.5% | -11.3% | -1.5% | -12.7% | -82.0% | 2.3% | -4.2% | 13.6% | 7.8% | 6.7% | ||||||||||||||||||||||||||||||||||
| (±) | Income and Social Contribution Taxes | (203.9 | ) | 18.7 | 234.7 | 6.6 | 22.4 | 205.9 | (53.3 | ) | 59.6 | (157.9 | ) | (103.8 | ) | (85.3 | ) | ||||||||||||||||||||||||||||
| (±) | Minority Interest | (6.2 | ) | 2.5 | 0.6 | 0.5 | 0.8 | 0.1 | 0.0 | (0.4 | ) | 9.6 | (0.6 | ) | (0.7 | ) | |||||||||||||||||||||||||||||
| (=) | Net Income (Loss) for the Year | 357.0 | (48.0 | ) | (474.0 | ) | (5.0 | ) | (58.0 | ) | (381.0 | ) | 5.0 | (40.0 | ) | 337.0 | 173.0 | 167.0 | |||||||||||||||||||||||||||
| Margin | 9.9% | -1.8% | -7.6% | -0.6% | -9.1% | -53.3% | 0.2% | -1.7% | 9.5% | 4.8% | 4.4% | ||||||||||||||||||||||||||||||||||
| l | EBITDA | 930.0 | 182.9 | 718.0 | 49.9 | 29.2 | 182.5 | 340.4 | 165.9 | 311.2 | 355.7 | 490.4 | |||||||||||||||||||||||||||||||||
| Margin | 25.8% | 6.7% | 11.5% | 5.9% | 4.6% | 25.5% | 13.3% | 7.1% | 8.7% | 9.9% | 12.9% | ||||||||||||||||||||||||||||||||||
| l | EBITDAH (Ebitda adjusted by Hedge) | 855.7 | 407.8 | 765.7 | 31.0 | 74.4 | 185.5 | 465.3 | 40.4 | 472.0 | 338.9 | 508.4 | |||||||||||||||||||||||||||||||||
| Margin | 24.2% | 13.8% | 12.1% | 3.8% | 10.9% | 25.8% | 17.3% | 1.8% | 12.7% | 9.5% | 13.3% | ||||||||||||||||||||||||||||||||||
| l | Depreciation & Amortization | 297.0 | 341.3 | 427.2 | 29.1 | 157.2 | 176.8 | 71.1 | 22.0 | 169.9 | 156.8 | 149.7 | |||||||||||||||||||||||||||||||||
| Balance Sheet | Apr'07 | Apr'08 | Mar'09 | Apr'08 | Jul'08 | Oct'08 | Jan'09 | Mar'09 | Jun'09 | Sep'09 | Dec'09 | |||||||||||||||||||||||||||||||||
| (In million of reais) | FY'07 | FY'08 | FY'09 | 4Q'08 | 1Q'09 | 2Q'09 | 3Q'09 | 4Q'09 | 1Q'10 | 2Q'10 | 3Q'10 | |||||||||||||||||||||||||||||||||
| Cash and Cash Equivalents | 1,217.1 | 1,010.1 | 719.4 | 1,010.1 | 633.9 | 1,276.3 | 689.7 | 719.4 | 932.9 | 948.6 | 864.1 | |||||||||||||||||||||||||||||||||
| Restricted Cash | 35.9 | 79.6 | 11.8 | 79.6 | 79.4 | 0.2 | 11.9 | 11.8 | 40.1 | 149.5 | 172.1 | |||||||||||||||||||||||||||||||||
| Derivative Financial Instruments | 1.6 | 6.9 | 17.0 | 6.9 | 9.0 | 8.6 | 6.1 | 17.0 | 86.6 | 97.4 | 72.0 | |||||||||||||||||||||||||||||||||
| Trade Accounts Receivable | 112.3 | 215.2 | 599.2 | 215.2 | 115.5 | 215.9 | 459.0 | 599.2 | 585.6 | 589.7 | 511.1 | |||||||||||||||||||||||||||||||||
| Inventories | 503.4 | 570.5 | 1,106.2 | 570.5 | 905.6 | 1,439.9 | 1,643.7 | 1,106.2 | 1,149.9 | 1,531.5 | 1,936.8 | |||||||||||||||||||||||||||||||||
| Advances to Suppliers | 211.4 | 226.1 | 206.0 | 226.1 | 252.3 | 287.0 | 239.9 | 206.0 | 386.1 | 336.7 | 241.2 | |||||||||||||||||||||||||||||||||
| Related Parties | - | 16.3 | 57.2 | 16.3 | 1.1 | 28.4 | 35.8 | 57.2 | 36.1 | 21.6 | 24.6 | |||||||||||||||||||||||||||||||||
| Deferred Income and Social Contribution Taxes | 38.1 | - | 42.5 | - | - | - | - | 42.5 | 53.5 | 48.1 | 29.2 | |||||||||||||||||||||||||||||||||
| Recoverable Taxes | 54.0 | 129.8 | 265.4 | 129.8 | 121.3 | 160.6 | 240.7 | 265.4 | 299.0 | 342.9 | 307.8 | |||||||||||||||||||||||||||||||||
| Other Assets | 50.9 | 17.9 | 50.3 | 17.9 | 21.9 | 37.1 | 82.3 | 50.3 | 32.7 | 41.7 | 54.0 | |||||||||||||||||||||||||||||||||
| Current Assets | 2,224.7 | 2,272.4 | 3,074.9 | 2,272.4 | 2,140.0 | 3,453.9 | 3,409.0 | 3,074.9 | 3,602.6 | 4,107.9 | 4,212.8 | |||||||||||||||||||||||||||||||||
| Accounts Receivable from Federal Government | 318.4 | 342.2 | 323.4 | 342.2 | 342.2 | 342.2 | 342.2 | 323.4 | 326.4 | 329.0 | 331.4 | |||||||||||||||||||||||||||||||||
| CTN's-Restricted Brazilian Treasury Bills | 123.3 | 151.7 | 177.6 | 151.7 | 164.8 | 170.9 | 175.5 | 177.6 | 184.7 | 189.3 | 194.6 | |||||||||||||||||||||||||||||||||
| Deferred Income and Social Contribution Taxes | 242.5 | 357.0 | 700.0 | 357.0 | 386.7 | 567.8 | 665.0 | 700.0 | 644.6 | 551.5 | 334.2 | |||||||||||||||||||||||||||||||||
| Advances to Suppliers | - | 77.3 | 48.0 | 77.3 | 88.2 | 93.6 | 125.3 | 48.0 | 55.5 | 85.1 | 132.5 | |||||||||||||||||||||||||||||||||
| Related Parties | - | - | - | - | - | - | - | - | 153.2 | 151.8 | 149.9 | |||||||||||||||||||||||||||||||||
| Other Assets | 112.4 | 94.4 | 132.4 | 94.4 | 124.1 | 124.0 | 159.1 | 132.4 | 185.4 | 190.2 | 210.8 | |||||||||||||||||||||||||||||||||
| Investments | 93.2 | 120.3 | 278.2 | 120.3 | 124.2 | 184.7 | 280.5 | 278.2 | 181.3 | 196.5 | 194.0 | |||||||||||||||||||||||||||||||||
| Property, Plant and Equipment | 2,015.7 | 2,776.3 | 3,493.9 | 2,776.3 | 2,882.8 | 3,020.8 | 3,389.0 | 3,493.9 | 4,516.4 | 4,671.4 | 4,871.5 | |||||||||||||||||||||||||||||||||
| Goodwill | 1,133.2 | 1,160.7 | 2,418.8 | 1,160.7 | 1,115.6 | 1,074.5 | 2,493.8 | 2,418.8 | 2,724.3 | 2,737.5 | 2,765.5 | |||||||||||||||||||||||||||||||||
| Noncurrent Assets | 4,038.6 | 5,079.9 | 7,572.5 | 5,079.9 | 5,228.5 | 5,578.5 | 7,630.4 | 7,572.5 | 8,971.7 | 9,102.3 | 9,184.4 | |||||||||||||||||||||||||||||||||
| (=) Total Assets | 6,263.4 | 7,352.4 | 10,647.4 | 7,352.4 | 7,368.5 | 9,032.4 | 11,039.4 | 10,647.4 | 12,574.3 | 13,210.2 | 13,397.2 | |||||||||||||||||||||||||||||||||
| Loans and Financings | 117.2 | 78.2 | 1,449.5 | 78.2 | 74.2 | 311.0 | 1,480.6 | 1,449.5 | 1,127.4 | 1,184.7 | 892.6 | |||||||||||||||||||||||||||||||||
| Derivatives Financial Instruments | 45.3 | 50.7 | 66.9 | 50.7 | 19.3 | 32.6 | 49.5 | 66.9 | 98.9 | 215.4 | 232.9 | |||||||||||||||||||||||||||||||||
| Trade Accounts Payable | 113.8 | 191.0 | 456.1 | 191.0 | 331.6 | 489.9 | 518.2 | 456.1 | 662.8 | 712.5 | 712.1 | |||||||||||||||||||||||||||||||||
| Salaries Payable | 63.3 | 80.7 | 93.2 | 80.7 | 119.0 | 143.0 | 77.7 | 93.2 | 152.3 | 180.9 | 133.0 | |||||||||||||||||||||||||||||||||
| Taxes and Social Contributions Payable | 126.2 | 116.1 | 168.6 | 116.1 | 115.0 | 109.7 | 163.2 | 168.6 | 189.8 | 230.9 | 201.0 | |||||||||||||||||||||||||||||||||
| Related Parties | 0.7 | - | 5.2 | - | - | - | 2.5 | 5.2 | 4.5 | 3.8 | 50.5 | |||||||||||||||||||||||||||||||||
| Other Liabilities | 125.4 | 49.9 | 85.8 | 49.9 | 34.4 | 126.1 | 66.6 | 85.8 | 134.1 | 100.7 | 123.4 | |||||||||||||||||||||||||||||||||
| Current Liabilities | 591.7 | 566.5 | 2,325.2 | 566.5 | 693.4 | 1,212.3 | 2,358.2 | 2,325.2 | 2,369.7 | 2,629.0 | 2,345.5 | |||||||||||||||||||||||||||||||||
| Loans and Financing | 2,819.9 | 2,106.2 | 2,885.5 | 2,106.2 | 2,047.9 | 2,679.3 | 2,904.5 | 2,885.5 | 4,091.4 | 4,667.4 | 4,859.1 | |||||||||||||||||||||||||||||||||
| Taxes and Social Contributions Payable | 338.5 | 359.3 | 328.8 | 359.3 | 351.5 | 346.1 | 336.0 | 328.8 | 335.5 | 288.9 | 255.7 | |||||||||||||||||||||||||||||||||
| Provision for Legal Proceedings | 728.0 | 832.4 | 1,105.9 | 832.4 | 849.8 | 873.1 | 1,114.1 | 1,105.9 | 1,135.5 | 1,143.4 | 755.7 | |||||||||||||||||||||||||||||||||
| Related Parties | - | - | 405.2 | - | - | - | 405.3 | 405.2 | 341.5 | - | - | |||||||||||||||||||||||||||||||||
| Pension Fund | - | - | 60.4 | - | - | - | 58.5 | 60.4 | 61.0 | 62.3 | 61.6 | |||||||||||||||||||||||||||||||||
| Other Liabilities | 134.0 | 144.4 | 139.9 | 144.4 | 141.3 | 138.4 | 134.8 | 139.9 | 169.2 | 168.4 | 155.8 | |||||||||||||||||||||||||||||||||
| Noncurrent Liabilities | 4,020.4 | 3,442.3 | 4,925.5 | 3,442.3 | 3,390.5 | 4,037.0 | 4,953.1 | 4,925.5 | 6,134.1 | 6,330.3 | 6,087.8 | |||||||||||||||||||||||||||||||||
| Minority Shareholders' Interest | 20.2 | 17.7 | 30.9 | 17.7 | 17.0 | 20.3 | 31.5 | 30.9 | 29.9 | 30.4 | 47.0 | |||||||||||||||||||||||||||||||||
| Capital | 1,192.7 | 2,935.3 | 3,819.8 | 2,935.3 | 2,935.3 | 3,815.3 | 3,815.3 | 3,819.8 | 4,153.9 | 4,155.3 | 4,687.7 | |||||||||||||||||||||||||||||||||
| Capital Reserve | - | �� | - | 41.7 | - | - | (4.2 | ) | (4.2 | ) | 41.7 | 45.1 | 50.2 | 50.1 | ||||||||||||||||||||||||||||||
| Profits Reserve | 227.3 | 180.2 | - | 180.2 | 180.2 | 180.2 | 180.2 | - | - | - | - | |||||||||||||||||||||||||||||||||
| Legal Reserve | 16.0 | 16.0 | - | 16.0 | 16.0 | 16.0 | 16.0 | - | - | - | - | |||||||||||||||||||||||||||||||||
| Revaluation Reserves | 195.0 | 194.4 | - | 194.4 | 194.2 | 193.8 | 93.2 | - | - | - | - | |||||||||||||||||||||||||||||||||
| Accumulated losses | - | - | (495.7 | ) | - | (57.9 | ) | (438.2 | ) | (403.9 | ) | (495.7 | ) | (158.4 | ) | 15.0 | 179.1 | |||||||||||||||||||||||||||
| Shareholders' Equity | 1,631.0 | 3,325.8 | 3,365.7 | 3,325.8 | 3,267.7 | 3,762.8 | 3,696.6 | 3,365.7 | 4,040.7 | 4,220.5 | 4,917.0 | |||||||||||||||||||||||||||||||||
| (=) Total Liabilities & Shareholders' Equity | 6,263.4 | 7,352.4 | 10,647.4 | 7,352.4 | 7,368.5 | 9,032.4 | 11,039.4 | 10,647.4 | 12,574.3 | 13,210.2 | 13,397.2 | |||||||||||||||||||||||||||||||||
22
| Cash Flow Statement | Apr'07 | Apr'08 | Mar'09 | Apr'08 | Jul'08 | Oct'08 | Jan'09 | Mar'09 | Jun'09 | Sep'09 | Dec'09 | |||||||||||||||||||||||||||||||||
| (In millions of reais) | FY'07 | FY'08 | FY'09 | 4Q'08 | 1Q'09 | 2Q'09 | 3Q'09 | 4Q'09 | 1Q'10 | 2Q'10 | 3Q'10 | |||||||||||||||||||||||||||||||||
| Net Income (Loss) for the Year | 357.3 | (47.8 | ) | (473.8 | ) | (5.3 | ) | (58.1 | ) | (380.7 | ) | 5.2 | (40.2 | ) | 337.3 | 173.4 | 167.1 | |||||||||||||||||||||||||||
| Non-cash Adjustments: | ||||||||||||||||||||||||||||||||||||||||||||
| Earnings (Losses) from Equity Investments | 0.1 | (6.6 | ) | (14.0 | ) | (6.4 | ) | (0.2 | ) | 0.3 | (13.6 | ) | (0.5 | ) | 3.6 | (0.0 | ) | 9.4 | ||||||||||||||||||||||||||
| Depreciation & Amortization | 297.0 | 341.3 | 427.2 | 29.1 | 157.2 | 176.8 | 71.1 | 22.0 | 169.9 | 156.8 | 149.7 | |||||||||||||||||||||||||||||||||
| Losses (Gains) in Fixed Assets Disposals | 8.4 | (1.2 | ) | (208.9 | ) | (8.1 | ) | 1.2 | 4.5 | 3.0 | (217.6 | ) | (103.2 | ) | 0.8 | 1.1 | ||||||||||||||||||||||||||||
| Goodwill Amortization | 223.7 | 201.4 | 196.5 | 40.6 | 40.4 | 40.4 | 65.2 | 50.5 | 85.6 | - | - | |||||||||||||||||||||||||||||||||
| Accrued Financial Expenses | (190.6 | ) | (116.0 | ) | 932.5 | (37.2 | ) | (26.2 | ) | 572.0 | 297.8 | 89.0 | (287.8 | ) | (84.0 | ) | (60.5 | ) | ||||||||||||||||||||||||||
| Other Non-cash Items | 119.7 | (42.4 | ) | (197.9 | ) | (0.7 | ) | (32.2 | ) | (162.9 | ) | 49.3 | (52.1 | ) | 133.1 | 74.0 | (154.1 | ) | ||||||||||||||||||||||||||
| (=) Adjusted Net Profit (Loss) | 815.5 | 328.8 | 661.5 | 12.1 | 82.0 | 250.4 | 478.0 | (148.9 | ) | 338.5 | 321.0 | 112.6 | ||||||||||||||||||||||||||||||||
| (±) Variation on Assets and Liabilities | (148.0 | ) | (360.1 | ) | (234.5 | ) | 323.9 | (129.5 | ) | (399.0 | ) | (140.7 | ) | 434.7 | 195.7 | (312.9 | ) | (142.7 | ) | |||||||||||||||||||||||||
| (=) Cash Flow from Operating Activities | 667.5 | (31.3 | ) | 427.0 | 335.9 | (47.4 | ) | (148.6 | ) | 337.3 | 285.8 | 534.2 | 8.1 | (30.1 | ) | |||||||||||||||||||||||||||||
| Additions on Investments, Net of Cash Received | �� | (83.7 | ) | (160.5 | ) | (1,823.6 | ) | (155.9 | ) | (0.7 | ) | (61.4 | ) | (1,533.7 | ) | (227.7 | ) | 58.5 | (29.2 | ) | (14.7 | ) | ||||||||||||||||||||||
| Additions on Property, Plant and Equipment | (684.2 | ) | (1,053.1 | ) | (1,346.1 | ) | (474.4 | ) | (264.8 | ) | (314.3 | ) | (432.4 | ) | (334.6 | ) | (420.6 | ) | (359.1 | ) | (401.0 | ) | ||||||||||||||||||||||
| Cash Received on Sale of Fixed Asset | - | 12.2 | 372.1 | 12.2 | 1.6 | (1.6 | ) | - | 372.1 | 117.7 | 1.5 | 1.8 | ||||||||||||||||||||||||||||||||
| (=) Cash Flow from Investment Activities | (767.9 | ) | (1,201.4 | ) | (2,797.6 | ) | (618.1 | ) | (263.9 | ) | (377.4 | ) | (1,966.1 | ) | (190.3 | ) | (244.3 | ) | (386.8 | ) | (413.9 | ) | ||||||||||||||||||||||
| Additions of Debt | 854.7 | 198.3 | 1,478.0 | (25.5 | ) | 3.0 | 315.8 | 1,196.4 | (37.1 | ) | 172.9 | 1,045.8 | 1,665.5 | |||||||||||||||||||||||||||||||
| Payments of Principal and Interest on Debt | (375.6 | ) | (839.4 | ) | (257.2 | ) | (52.2 | ) | (67.8 | ) | (26.7 | ) | (148.3 | ) | (14.4 | ) | (127.8 | ) | (317.3 | ) | (1,838.4 | ) | ||||||||||||||||||||||
| Capital Increase | 6.9 | 1,742.6 | 884.5 | - | - | 880.0 | - | 4.5 | - | 1.4 | 532.4 | |||||||||||||||||||||||||||||||||
| Treasury Stock | - | - | (4.2 | ) | - | - | (4.2 | ) | - | - | - | - | - | |||||||||||||||||||||||||||||||
| Capital Increase at subsidiaries | - | - | 15.4 | - | - | 3.5 | - | 11.9 | - | - | - | |||||||||||||||||||||||||||||||||
| Dividends | - | (75.8 | ) | - | (75.8 | ) | - | - | - | - | - | - | - | |||||||||||||||||||||||||||||||
| Other | - | - | (36.6 | ) | (2.4 | ) | - | - | (5.9 | ) | (30.7 | ) | (121.4 | ) | (335.4 | ) | - | |||||||||||||||||||||||||||
| (=) Cash Flows from Financing Activities | 486.0 | 1,025.7 | 2,079.9 | (155.9 | ) | (64.8 | ) | 1,168.4 | 1,042.2 | (65.8 | ) | (76.3 | ) | 394.4 | 359.5 | |||||||||||||||||||||||||||||
| (=) Total Cash Flow | 385.6 | (207.0 | ) | (290.7 | ) | (438.1 | ) | (376.2 | ) | 642.4 | (586.7 | ) | 29.7 | 213.6 | 15.7 | (84.6 | ) | |||||||||||||||||||||||||||
| (+) Cash & Equivalents, Beginning | 831.5 | 1,217.1 | 1,010.1 | 1,448.2 | 1,010.1 | 633.9 | 1,276.3 | 689.7 | 719.4 | 932.9 | 948.6 | |||||||||||||||||||||||||||||||||
| (=) Cash & Equivalents, Closing | 1,217.1 | 1,010.1 | 719.4 | 1,010.1 | 633.9 | 1,276.3 | 689.7 | 719.4 | 932.9 | 948.6 | 864.1 | |||||||||||||||||||||||||||||||||
| Credit Statistics (LTM) | Apr'07 | Apr'08 | Mar'09 | Apr'08 | Jul'08 | Oct'08 | Jan'09 | Mar'09 | Jun'09 | Sep'09 | Dec'09 | |||||||||||||||||||||||||||||||||
| (In million of reais) | FY'07 | FY'08 | FY'09 | 4Q'08 | 1Q'09 | 2Q'09 | 3Q'09 | 4Q'09 | 1Q'10 | 2Q'10 | 3Q'10 | |||||||||||||||||||||||||||||||||
| Net Operating Revenues | 3,605.1 | 2,736.2 | 6,270.1 | 2,736.2 | 2,784.1 | 2,871.6 | 4,763.3 | 6,270.1 | 9,196.6 | 12,056.9 | 13,291.7 | |||||||||||||||||||||||||||||||||
l Gross Profit | 1,123.9 | 349.0 | 799.4 | 349.0 | 318.9 | 410.5 | 708.9 | 799.4 | 1,153.6 | 1,509.4 | 1,591.4 | |||||||||||||||||||||||||||||||||
l EBITDA | 930.0 | 182.9 | 718.0 | 182.9 | 159.6 | 264.0 | 602.1 | 718.0 | 1,000.0 | 1,173.1 | 1,323.1 | |||||||||||||||||||||||||||||||||
l EBIT | 633.1 | (158.4 | ) | 290.8 | (158.4 | ) | (213.5 | ) | (147.0 | ) | 167.7 | 290.8 | 560.2 | 753.3 | 824.7 | |||||||||||||||||||||||||||||
l Encargos Financeiros da Dívida Líquida | 127.8 | 106.2 | 179.9 | 106.2 | 91.9 | 85.2 | 136.1 | 179.9 | 247.0 | 308.4 | 329.8 | |||||||||||||||||||||||||||||||||
l Net Profit | 357.3 | (47.8 | ) | (473.8 | ) | (47.8 | ) | (119.6 | ) | (515.5 | ) | (438.9 | ) | (473.8 | ) | (78.4 | ) | 475.6 | 637.5 | |||||||||||||||||||||||||
| Liquid Funds | ||||||||||||||||||||||||||||||||||||||||||||
l Cash and Cash Equivalents | 1,217.1 | 1,010.1 | 719.4 | 1,010.1 | 633.9 | 1,276.3 | 689.7 | 719.4 | 932.9 | 1,098.2 | 864.1 | |||||||||||||||||||||||||||||||||
| Short-Term Debt | ||||||||||||||||||||||||||||||||||||||||||||
l Loans and Financings | 109.0 | 69.3 | 1,442.7 | 69.3 | 62.9 | 298.6 | 1,475.3 | 1,442.7 | 1,115.9 | 1,171.6 | 886.5 | |||||||||||||||||||||||||||||||||
| Long-Term Debt | ||||||||||||||||||||||||||||||||||||||||||||
l Loans and Financings | 2,324.8 | 1,562.5 | 2,312.3 | 1,562.5 | 1,474.9 | 2,101.7 | 2,327.6 | 2,312.3 | 3,508.5 | 4,086.8 | 4,278.4 | |||||||||||||||||||||||||||||||||
| Total Debt | 2,433.8 | 1,631.8 | 3,755.0 | 1,631.8 | 1,537.7 | 2,400.3 | 3,802.9 | 3,755.0 | 4,624.4 | 5,258.3 | 5,164.9 | |||||||||||||||||||||||||||||||||
| Net Debt | 1,216.7 | 621.7 | 3,035.6 | 621.7 | 903.8 | 1,124.0 | 3,113.3 | 3,035.6 | 3,691.5 | 4,160.2 | 4,300.8 | |||||||||||||||||||||||||||||||||
| Current Assets | 2,224.7 | 2,272.4 | 3,074.9 | 2,272.4 | 2,140.0 | 3,453.9 | 3,409.0 | 3,074.9 | 3,602.6 | 4,107.9 | 4,212.8 | |||||||||||||||||||||||||||||||||
| Current Liabilities | 591.7 | 566.5 | 2,325.2 | 566.5 | 693.4 | 1,212.3 | 2,358.2 | 2,325.2 | 2,369.7 | 2,629.0 | 2,345.5 | |||||||||||||||||||||||||||||||||
| Shareholders' Equity | 1,631.0 | 3,325.8 | 3,365.7 | 3,325.8 | 3,267.7 | 3,762.8 | 3,696.6 | 3,365.7 | 4,040.7 | 4,220.5 | 4,917.0 | |||||||||||||||||||||||||||||||||
| Capex - Property, Plant and Equipment | 684.2 | 1,053.1 | 1,346.1 | 1,053.1 | 1,147.4 | 1,324.5 | 1,485.9 | 1,346.1 | 1,501.9 | 1,546.7 | 1,515.3 | |||||||||||||||||||||||||||||||||
l Capex - Operational | 598.0 | 781.9 | 565.0 | 781.9 | 796.9 | 762.7 | 727.5 | 565.0 | 588.7 | 626.5 | 673.9 | |||||||||||||||||||||||||||||||||
| EBITDA Margin | 25.8 | % | 6.7 | % | 11.5 | % | 6.7 | % | 5.7 | % | 9.2 | % | 12.6 | % | 11.5 | % | 10.9 | % | 9.7 | % | 10.0 | % | ||||||||||||||||||||||
l Gross Profit Margin | 31.2 | % | 12.8 | % | 12.7 | % | 12.8 | % | 11.5 | % | 14.3 | % | 14.9 | % | 12.7 | % | 12.5 | % | 12.5 | % | 12.0 | % | ||||||||||||||||||||||
l EBIT Margin | 17.6 | % | -5.8 | % | 4.6 | % | -5.8 | % | -7.7 | % | -5.1 | % | 3.5 | % | 4.6 | % | 6.1 | % | 6.2 | % | 6.2 | % | ||||||||||||||||||||||
l Net Profit Margin | 9.9 | % | -1.7 | % | -7.6 | % | -1.7 | % | -4.3 | % | -18.0 | % | -9.2 | % | -7.6 | % | -0.9 | % | 3.9 | % | 4.8 | % | ||||||||||||||||||||||
| Net Debt ÷ Shareholders' Equity | ||||||||||||||||||||||||||||||||||||||||||||
l Net Debt % | 42.7 | % | 15.8 | % | 47.4 | % | 15.8 | % | 21.7 | % | 23.0 | % | 45.7 | % | 47.4 | % | 47.7 | % | 49.6 | % | 46.7 | % | ||||||||||||||||||||||
l Shareholders' Equity % | 57.3 | % | 84.2 | % | 52.6 | % | 84.2 | % | 78.3 | % | 77.0 | % | 54.3 | % | 52.6 | % | 52.3 | % | 50.4 | % | 53.3 | % | ||||||||||||||||||||||
| Long-Term Payable Debt to Equity Ratio | 1.4 | x | 0.5 | x | 0.7 | x | 0.5 | x | 0.5 | x | 0.6 | x | 0.6 | x | 0.7 | x | 0.9 | x | 1.0 | x | 0.9 | x | ||||||||||||||||||||||
| Liquidity Ratio (Current Assets ÷ Current Liabilities) | 3.8 | x | 4.0 | x | 1.3 | x | 4.0 | x | 3.1 | x | 2.8 | x | 1.4 | x | 1.3 | x | 1.5 | x | 1.6 | x | 1.8 | x | ||||||||||||||||||||||
| Net Debt ÷ EBITDA | 1.3 | x | 3.4 | x | 4.2 | x | 3.4 | x | 5.7 | x | 4.3 | x | 5.2 | x | 4.2 | x | 3.7 | x | 3.5 | x | 3.3 | x | ||||||||||||||||||||||
l Short-Term Net Debt ÷ EBITDA | 0.1 | x | 0.4 | x | 2.0 | x | 0.4 | x | 0.4 | x | 1.1 | x | 2.5 | x | 2.0 | x | 1.1 | x | 1.0 | x | 0.7 | x | ||||||||||||||||||||||
| Net Debt ÷ (EBITDA - Capex) | 4.9 | x | -0.7 | x | -4.8 | x | -0.7 | x | -0.9 | x | -1.1 | x | -3.5 | x | -4.8 | x | -7.4 | x | -11.1 | x | -22.4 | x | ||||||||||||||||||||||
l Net Debt ÷ (EBITDA - Operational Capex) | 3.7 | x | -1.0 | x | 19.8 | x | -1.0 | x | -1.4 | x | -2.3 | x | -24.8 | x | 19.8 | x | 9.0 | x | 7.6 | x | 6.6 | x | ||||||||||||||||||||||
| Interest Cover (EBITDA ÷ Net Financial Exp.) | 7.3 | x | 1.7 | x | 4.0 | x | 1.7 | x | 1.7 | x | 3.1 | x | 4.4 | x | 4.0 | x | 4.0 | x | 3.8 | x | 4.0 | x | ||||||||||||||||||||||
l Interest Cover (EBITDA - Op.Capes)÷Net Fin.) | 2.6 | x | -5.6 | x | 0.9 | x | -5.6 | x | -6.9 | x | -5.9 | x | -0.9 | x | 0.9 | x | 1.7 | x | 1.8 | x | 2.0 | x | ||||||||||||||||||||||
| Avg. Debt Cost (Net.Fin.Exp. ÷ Net Debt) | 10.5 | % | 17.1 | % | 5.9 | % | 17.1 | % | 10.2 | % | 7.6 | % | 4.4 | % | 5.9 | % | 6.7 | % | 7.4 | % | 7.7 | % | ||||||||||||||||||||||
23
L. Financial Statements of Cosan Ltd – US GAAP
| Income Statement | Apr'07 | Apr'08 | Apr'09 | Apr'08 | Jul'08 | Oct'08 | Jan'09 | Apr'09 | Jun'09 | Sep'09 | Dec'09 | |||||||||||||||||||||||||||||||||
| (In millions of U.S. dollars) | FY'07 | FY'08 | FY'09 | 4Q'08 | 1Q'09 | 2Q'09 | 3Q'09 | 4Q'09 | 1Q'10 | 2Q'10 | 3Q'10 | |||||||||||||||||||||||||||||||||
| Net sales | 1,679.1 | 1,491.2 | 2,926.5 | 485.3 | 394.0 | 383.8 | 1,103.4 | 1,045.3 | 1,720.3 | 1,915.7 | 2,209.5 | |||||||||||||||||||||||||||||||||
| (-) Cost of goods sold | (1,191.3 | ) | (1,345.6 | ) | (2,621.9 | ) | (418.4 | ) | (398.9 | ) | (320.2 | ) | (950.3 | ) | (952.4 | ) | (1,561.4 | ) | (1,655.5 | ) | (1,965.3 | ) | ||||||||||||||||||||||
| (=) Gross profit | 487.8 | 145.6 | 304.6 | 66.9 | (4.9 | ) | 63.6 | 153.0 | 92.8 | 158.8 | 260.1 | 244.3 | ||||||||||||||||||||||||||||||||
| (-) Selling expenses | (133.8 | ) | (168.6 | ) | (213.3 | ) | (44.9 | ) | (53.0 | ) | (47.9 | ) | (67.6 | ) | (44.7 | ) | (102.1 | ) | (115.1 | ) | (128.0 | ) | ||||||||||||||||||||||
| (-) General and administrative expenses | (121.1 | ) | (115.1 | ) | (140.1 | ) | (30.5 | ) | (36.3 | ) | (34.9 | ) | (42.2 | ) | (26.8 | ) | (7.9 | ) | (62.8 | ) | (106.7 | ) | ||||||||||||||||||||||
| (=) Operating income (loss) | 232.9 | (138.1 | ) | (48.8 | ) | (8.5 | ) | (94.2 | ) | (19.2 | ) | 43.2 | 21.4 | 48.9 | 82.3 | 9.6 | ||||||||||||||||||||||||||||
| Operating margin | 13.9% | -9.3% | -1.7% | -1.8% | -23.9% | -5.0% | 3.9% | 2.0% | 2.8% | 4.3% | 0.4% | |||||||||||||||||||||||||||||||||
| (-) Other income (expense): | ||||||||||||||||||||||||||||||||||||||||||||
| Financial | 289.4 | 116.8 | (370.8 | ) | 119.3 | 26.5 | (234.4 | ) | (137.2 | ) | (25.7 | ) | 215.7 | 64.1 | (80.4 | ) | ||||||||||||||||||||||||||||
| Other | 16.3 | (3.7 | ) | (2.3 | ) | (1.8 | ) | (3.5 | ) | (8.1 | ) | 6.6 | 2.7 | (7.9 | ) | 0.9 | 155.5 | |||||||||||||||||||||||||||
| (=) Income (loss) before income taxes | 538.5 | (25.0 | ) | (421.9 | ) | 109.0 | (71.2 | ) | (261.7 | ) | (87.3 | ) | (1.6 | ) | 256.7 | 147.3 | 84.7 | |||||||||||||||||||||||||||
| (-) Income taxes expense (benefit) | (188.8 | ) | 19.8 | 144.7 | (27.9 | ) | 23.2 | 94.5 | (1.7 | ) | 28.7 | (76.5 | ) | (49.4 | ) | (52.3 | ) | |||||||||||||||||||||||||||
| (=) Income (loss) before equity | 349.7 | (5.2 | ) | (277.2 | ) | 81.1 | (48.0 | ) | (167.2 | ) | (89.1 | ) | 27.1 | 180.1 | 97.9 | 32.4 | ||||||||||||||||||||||||||||
| (±) Equity in income of affiliates | (0.0 | ) | (0.2 | ) | 6.1 | 2.3 | 0.1 | 1.2 | 5.2 | (0.3 | ) | (1.7 | ) | 0.0 | (3.8 | ) | ||||||||||||||||||||||||||||
| (±) Minority interest in net (income) loss | (173.0 | ) | 22.0 | 83.0 | (26.1 | ) | 18.6 | 52.0 | 19.3 | (6.9 | ) | (55.8 | ) | (34.0 | ) | (7.3 | ) | |||||||||||||||||||||||||||
| (=) Net income (loss) | 176.7 | 16.6 | (188.1 | ) | 57.3 | (29.3 | ) | (114.1 | ) | (64.6 | ) | 19.9 | 122.6 | 63.9 | 21.3 | |||||||||||||||||||||||||||||
| Margin | 10.5% | 1.1% | -6.4% | 11.8% | -7.4% | -29.7% | -5.9% | 1.9% | 7.1% | 3.3% | 1.0% | |||||||||||||||||||||||||||||||||
l EBITDA | 436.5 | 94.3 | 239.6 | 15.0 | 14.6 | 72.2 | 92.2 | 60.7 | 140.3 | 190.9 | 338.8 | |||||||||||||||||||||||||||||||||
| Margin | 26.0% | 6.3% | 8.2% | 3.1% | 3.7% | 18.8% | 8.4% | 5.8% | 8.2% | 10.0% | 15.3% | |||||||||||||||||||||||||||||||||
l EBIT | 249.2 | (141.8 | ) | (51.1 | ) | (10.3 | ) | (97.7 | ) | (27.3 | ) | 49.9 | 24.1 | 40.9 | 83.1 | 165.1 | ||||||||||||||||||||||||||||
| Margin | 14.8% | -9.5% | -1.7% | -2.1% | -24.8% | -7.1% | 4.5% | 2.3% | 2.4% | 4.3% | 7.5% | |||||||||||||||||||||||||||||||||
l Depreciation and amortization | 187.4 | 236.1 | 290.7 | 25.3 | 112.3 | 99.5 | 42.3 | 36.6 | 99.3 | 107.7 | 173.7 | |||||||||||||||||||||||||||||||||
| Balance Sheet | Apr'07 | Apr'08 | Mar'09 | Apr'08 | Jul'08 | Oct'08 | Jan'09 | Mar'09 | Jun'09 | Se´p'09 | Dec'09 | |||||||||||||||||||||||||||||||||
| (In millions of U.S. dollars) | FY'07 | FY'08 | FY'09 | 4Q'08 | 1Q'09 | 2Q'09 | 3Q'09 | 4Q'09 | 1Q'10 | 2Q'10 | 3Q'10 | |||||||||||||||||||||||||||||||||
| Assets | ||||||||||||||||||||||||||||||||||||||||||||
| Current assets: | ||||||||||||||||||||||||||||||||||||||||||||
| Cash and cash equivalents | 316.5 | 68.4 | 508.8 | 68.4 | 86.3 | 62.6 | 100.5 | 508.8 | 676.3 | 769.1 | 516.7 | |||||||||||||||||||||||||||||||||
| Restricted cash | 17.7 | 47.2 | 5.1 | 47.2 | 50.7 | 0.1 | 5.1 | 5.1 | 20.5 | 84.1 | 98.8 | |||||||||||||||||||||||||||||||||
| Marketable securities | 281.9 | 1,014.5 | - | 1,014.5 | 804.2 | 771.5 | 397.0 | - | - | - | - | |||||||||||||||||||||||||||||||||
| Derivative financial instruments | 65.2 | 31.5 | 7.4 | 31.5 | 65.3 | 86.8 | 3.7 | 7.4 | 44.4 | 54.8 | 41.4 | |||||||||||||||||||||||||||||||||
| Trade accounts receivable, net | 55.2 | 126.9 | 258.9 | 126.9 | 73.0 | 101.9 | 197.9 | 258.9 | 300.1 | 331.6 | 293.5 | |||||||||||||||||||||||||||||||||
| Inventories | 247.5 | 337.7 | 477.8 | 337.7 | 577.6 | 680.5 | 709.5 | 477.8 | 589.2 | 861.3 | 1,112.3 | |||||||||||||||||||||||||||||||||
| Advances to suppliers | 104.0 | 133.7 | 89.0 | 133.7 | 160.8 | 135.5 | 103.5 | 89.0 | 200.8 | 189.4 | 138.6 | |||||||||||||||||||||||||||||||||
| Deferred income taxes | - | - | 114.6 | - | - | - | 25.7 | 114.6 | 153.2 | 192.8 | 176.8 | |||||||||||||||||||||||||||||||||
| Other current assets | 51.6 | 103.2 | 66.0 | 103.2 | 99.7 | 132.6 | 158.4 | 66.0 | 69.0 | 56.1 | 54.1 | |||||||||||||||||||||||||||||||||
| 1,139.5 | 1,863.0 | 1,527.5 | 1,863.0 | 1,917.6 | 1,971.5 | 1,701.3 | 1,527.5 | 2,053.5 | 2,539.3 | 2,432.2 | ||||||||||||||||||||||||||||||||||
| Noncurrent assets: | ||||||||||||||||||||||||||||||||||||||||||||
| Property, plant and equipment, net | 1,194.1 | 2,018.1 | 2,271.8 | 2,018.1 | 2,217.3 | 1,738.6 | 1,828.8 | 2,271.8 | 3,178.1 | 3,554.3 | 3,737.0 | |||||||||||||||||||||||||||||||||
| Goodwill | 491.9 | 772.6 | 888.8 | 772.6 | 823.4 | 623.4 | 1,197.3 | 888.8 | 1,464.2 | 1,592.5 | 1,624.4 | |||||||||||||||||||||||||||||||||
| Intangible assets, net | 94.0 | 106.1 | 230.7 | 106.1 | 111.8 | 81.8 | 73.1 | 230.7 | 240.5 | 256.9 | 255.3 | |||||||||||||||||||||||||||||||||
| Accounts Receivable from Federal Government | 156.5 | 202.8 | 139.7 | 202.8 | 218.4 | 161.8 | 147.7 | 139.7 | 167.3 | 185.1 | 190.3 | |||||||||||||||||||||||||||||||||
| Other non-current assets | 177.5 | 306.4 | 362.6 | 306.4 | 345.3 | 322.0 | 536.5 | 362.6 | 491.7 | 580.5 | 635.0 | |||||||||||||||||||||||||||||||||
| 2,113.9 | 3,406.1 | 3,893.6 | 3,406.1 | 3,716.3 | 2,927.5 | 3,783.5 | 3,893.6 | 5,541.6 | 6,169.2 | 6,442.0 | ||||||||||||||||||||||||||||||||||
| (=) Total assets | 3,253.4 | 5,269.1 | 5,421.1 | 5,269.1 | 5,634.0 | 4,899.0 | 5,484.7 | 5,421.1 | 7,595.1 | 8,708.6 | 8,874.2 | |||||||||||||||||||||||||||||||||
| Liabilities and shareholders' equity | ||||||||||||||||||||||||||||||||||||||||||||
| Current liabilities: | ||||||||||||||||||||||||||||||||||||||||||||
| Trade accounts payable | 55.9 | 114.4 | 197.2 | 114.4 | 212.0 | 235.8 | 223.7 | 197.2 | 339.8 | 401.3 | 409.3 | |||||||||||||||||||||||||||||||||
| Taxes payable | 57.5 | 62.9 | 69.0 | 62.9 | 67.4 | 47.4 | 66.1 | 69.0 | 92.9 | 125.1 | 115.4 | |||||||||||||||||||||||||||||||||
| Salaries payable | 31.1 | 47.8 | 40.2 | 47.8 | 75.8 | 67.5 | 33.5 | 40.2 | 78.0 | 101.7 | 76.4 | |||||||||||||||||||||||||||||||||
| Current portion of long-term debt | 36.1 | 38.2 | 781.7 | 38.2 | 33.2 | 134.2 | 786.7 | 781.7 | 582.9 | 673.0 | 542.9 | |||||||||||||||||||||||||||||||||
| Derivative financial instruments | 9.8 | 55.0 | 28.9 | 55.0 | 102.1 | 112.1 | 83.3 | 28.9 | 50.7 | 121.1 | 133.8 | |||||||||||||||||||||||||||||||||
| Dividends payable | 37.3 | - | - | - | - | - | - | - | - | - | - | |||||||||||||||||||||||||||||||||
| Deferred income taxes | - | - | - | - | - | 10.3 | - | - | - | - | - | |||||||||||||||||||||||||||||||||
| Other liabilities | 46.5 | 40.8 | 47.6 | 40.8 | 29.4 | 28.5 | 30.2 | 47.6 | 87.1 | 70.7 | 111.0 | |||||||||||||||||||||||||||||||||
| 274.2 | 359.1 | 1,164.7 | 359.1 | 519.8 | 635.7 | 1,223.6 | 1,164.7 | 1,231.5 | 1,493.0 | 1,388.8 | ||||||||||||||||||||||||||||||||||
| Long-term liabilities: | ||||||||||||||||||||||||||||||||||||||||||||
| Long-term debt | 1,342.5 | 1,249.3 | 1,251.1 | 1,249.3 | 1,291.4 | 1,257.4 | 1,246.5 | 1,251.1 | 2,249.1 | 2,632.3 | 2,802.2 | |||||||||||||||||||||||||||||||||
| Estimated liability for legal proceedings | 379.2 | 494.1 | 497.6 | 494.1 | 545.0 | 414.1 | 546.4 | 497.6 | 607.5 | 672.6 | 464.8 | |||||||||||||||||||||||||||||||||
| Taxes payable | 106.9 | 170.4 | 151.5 | 170.4 | 181.9 | 133.4 | 187.1 | 151.5 | 184.7 | 178.3 | 220.6 | |||||||||||||||||||||||||||||||||
| Advances from customers | 24.3 | - | - | - | - | - | - | - | - | - | - | |||||||||||||||||||||||||||||||||
| Deferred income taxes | 141.6 | 101.8 | 40.4 | 101.8 | 83.6 | - | - | 40.4 | 84.0 | 118.3 | 245.4 | |||||||||||||||||||||||||||||||||
| Pension Fund | - | - | - | - | - | - | - | - | - | - | - | |||||||||||||||||||||||||||||||||
| Other long-term liabilities | 47.5 | 101.7 | 175.0 | 101.7 | 103.3 | 107.7 | 181.6 | 175.0 | 213.2 | 224.6 | 219.5 | |||||||||||||||||||||||||||||||||
| 2,042.0 | 2,117.4 | 2,115.6 | 2,117.4 | 2,205.3 | 1,912.7 | 2,161.5 | 2,115.6 | 3,338.5 | 3,826.2 | 3,952.4 | ||||||||||||||||||||||||||||||||||
| Minority interest in consolidated subsidiaries | 463.6 | 796.8 | 544.5 | 796.8 | 839.7 | 602.8 | 530.7 | 544.5 | 1,037.8 | 1,181.8 | 1,296.7 | |||||||||||||||||||||||||||||||||
| Shareholders' equity: | ||||||||||||||||||||||||||||||||||||||||||||
| Common stock | 1.0 | 2.3 | 2.7 | 2.3 | 2.3 | 2.7 | 2.7 | 2.7 | 2.7 | 2.7 | 2.7 | |||||||||||||||||||||||||||||||||
| Additional paid-in capital | 354.0 | 1,723.1 | 1,926.7 | 1,723.1 | 1,724.6 | 1,920.9 | 1,922.0 | 1,926.7 | 1,964.7 | 1,961.8 | 1,927.3 | |||||||||||||||||||||||||||||||||
| Accumulated other comprehensive income | 36.7 | 171.8 | (243.6 | ) | 171.8 | 273.1 | (130.9 | ) | (246.2 | ) | (243.6 | ) | (13.1 | ) | 146.1 | 188.1 | ||||||||||||||||||||||||||||
| Retained earnings (losses) | 81.9 | 98.5 | (89.6 | ) | 98.5 | 69.2 | (44.9 | ) | (109.5 | ) | (89.6 | ) | 33.0 | 96.9 | 118.3 | |||||||||||||||||||||||||||||
| Total shareholders' equity | 473.6 | 1,995.7 | 1,596.2 | 1,995.7 | 2,069.1 | 1,747.8 | 1,569.0 | 1,596.2 | 1,987.3 | 2,207.6 | 2,236.3 | |||||||||||||||||||||||||||||||||
| (=) Total liabilities and shareholders' equity | 3,253.4 | 5,269.1 | 5,421.1 | 5,269.1 | 5,634.0 | 4,899.0 | 5,484.7 | 5,421.1 | 7,595.1 | 8,708.6 | 8,874.2 | |||||||||||||||||||||||||||||||||
| Cash and cash equivalents | 316.5 | 68.4 | 508.8 | 68.4 | 86.3 | 62.6 | 100.5 | 508.8 | 676.3 | 769.1 | 516.7 | |||||||||||||||||||||||||||||||||
| Marketable securities | 281.9 | 1,014.5 | - | 1,014.5 | 804.2 | 771.5 | 397.0 | - | - | - | - | |||||||||||||||||||||||||||||||||
| Advances from customers | 24.3 | 15.6 | 11.3 | 15.6 | 15.3 | 15.2 | 14.3 | 11.3 | 7.1 | 8.1 | - | |||||||||||||||||||||||||||||||||
| Other liabilities | 22.2 | 25.2 | 36.3 | 25.2 | 14.1 | 13.3 | 15.9 | 36.3 | 80.0 | 62.6 | 111.0 | |||||||||||||||||||||||||||||||||
24
| Cash Flow Statement | Apr'07 | Apr'08 | Mar'09 | Apr'08 | Jul'08 | Oct'08 | Jan'09 | Mar'09 | Jun'09 | Sep'09 | Dec'09 | |||||||||||||||||||||||||||||||||
| (In millions of U.S. dollars) | FY'07 | FY'08 | FY'09 | 4Q'08 | 1Q'09 | 2Q'09 | 3Q'09 | 4Q'09 | 1Q'10 | 2Q'10 | 3Q'10 | |||||||||||||||||||||||||||||||||
l Cash flow from operating activities: | ||||||||||||||||||||||||||||||||||||||||||||
| Net income (loss) for the year/quarter | 176.7 | 16.6 | (188.1 | ) | 57.3 | (29.3 | ) | (114.1 | ) | (64.6 | ) | 19.9 | 122.6 | 63.9 | 21.3 | |||||||||||||||||||||||||||||
Adjustments to reconcile net income (loss) to cash provided by operating activities: | ||||||||||||||||||||||||||||||||||||||||||||
| Depreciation and amortization | 187.4 | 236.1 | 290.7 | 25.3 | 112.3 | 99.5 | 42.3 | 36.6 | 99.3 | 107.7 | 173.7 | |||||||||||||||||||||||||||||||||
| Deferred income and social contribution taxes | 150.2 | (52.4 | ) | (145.3 | ) | 14.0 | (31.6 | ) | (86.7 | ) | 13.9 | (40.9 | ) | 66.6 | 59.3 | 52.3 | ||||||||||||||||||||||||||||
| Interest, monetary and exchange variation | 116.3 | (43.7 | ) | 497.3 | (2.5 | ) | (14.5 | ) | 327.5 | 2.2 | 182.1 | (136.3 | ) | (67.9 | ) | (57.8 | ) | |||||||||||||||||||||||||||
| Minority interest in net income of subsidiaries | 173.0 | (22.0 | ) | (83.0 | ) | 26.1 | (18.6 | ) | (52.0 | ) | (19.3 | ) | 6.9 | 55.8 | 34.0 | 7.3 | ||||||||||||||||||||||||||||
| Others | (176.8 | ) | 15.2 | 14.5 | 8.7 | 9.2 | 5.4 | (55.0 | ) | 54.9 | 12.2 | (47.8 | ) | 13.2 | ||||||||||||||||||||||||||||||
| 626.8 | 149.8 | 386.1 | 128.9 | 27.5 | 179.7 | (80.5 | ) | 259.5 | 220.3 | 149.3 | 210.0 | |||||||||||||||||||||||||||||||||
| Decrease/increase in operating assets and liabilities: | ||||||||||||||||||||||||||||||||||||||||||||
| Trade accounts receivable, net | 48.2 | (57.1 | ) | (23.7 | ) | (62.2 | ) | 63.9 | (63.7 | ) | 26.5 | (50.5 | ) | 56.5 | (8.5 | ) | 46.9 | |||||||||||||||||||||||||||
| Inventories | (54.1 | ) | (31.7 | ) | (85.9 | ) | 253.5 | (214.0 | ) | (197.2 | ) | 96.0 | 229.3 | 88.4 | (178.6 | ) | (198.8 | ) | ||||||||||||||||||||||||||
| Advances to suppliers | (38.7 | ) | (8.4 | ) | 21.1 | 8.6 | (16.8 | ) | (12.1 | ) | 22.8 | 27.2 | (38.8 | ) | 7.3 | 27.0 | ||||||||||||||||||||||||||||
| Trade accounts payable | (43.2 | ) | 33.7 | 33.4 | (12.2 | ) | 90.1 | 54.8 | (83.8 | ) | (27.6 | ) | 24.1 | 30.3 | 0.9 | |||||||||||||||||||||||||||||
| Derivative financial instruments | (155.0 | ) | 90.4 | 4.4 | (79.6 | ) | 11.3 | (4.8 | ) | 56.0 | (58.1 | ) | (16.2 | ) | 57.9 | 25.5 | ||||||||||||||||||||||||||||
| Taxes payable | (36.6 | ) | (19.6 | ) | (17.1 | ) | (17.1 | ) | (7.9 | ) | (5.0 | ) | (1.2 | ) | (2.9 | ) | (29.3 | ) | (29.7 | ) | (0.6 | ) | ||||||||||||||||||||||
| Other assets and liabilities, net | (63.4 | ) | (99.4 | ) | (61.8 | ) | 23.0 | 16.2 | (126.6 | ) | 23.5 | 25.0 | 33.0 | (12.1 | ) | 11.2 | ||||||||||||||||||||||||||||
| (342.8 | ) | (92.2 | ) | (129.6 | ) | 114.0 | (57.1 | ) | (354.6 | ) | 139.8 | 142.4 | 117.7 | (133.3 | ) | (88.0 | ) | |||||||||||||||||||||||||||
| (=) Net cash provided by operating actitivities | 284.0 | 57.6 | 256.6 | 242.9 | (29.6 | ) | (174.9 | ) | 59.2 | 401.9 | 338.0 | 16.0 | 122.0 | |||||||||||||||||||||||||||||||
l Cash flow from investing activities: | ||||||||||||||||||||||||||||||||||||||||||||
| Restricted cash | 47.0 | (25.9 | ) | 29.3 | (11.1 | ) | 0.1 | 37.4 | (8.3 | ) | 0.1 | (14.5 | ) | (63.0 | ) | (14.6 | ) | |||||||||||||||||||||||||||
| Marketable securities | 97.0 | (671.0 | ) | 558.8 | 191.8 | (202.4 | ) | (123.4 | ) | 791.6 | 93.0 | - | - | - | ||||||||||||||||||||||||||||||
| Acquisition of property, plant and equipment | (356.2 | ) | (642.9 | ) | (606.2 | ) | (300.8 | ) | (169.3 | ) | (143.9 | ) | (131.7 | ) | (161.2 | ) | (227.0 | ) | (211.5 | ) | (239.6 | ) | ||||||||||||||||||||||
| Acquisitions, net of cash acquired | (39.4 | ) | (102.0 | ) | (930.4 | ) | (100.8 | ) | 0.8 | (45.2 | ) | (671.5 | ) | (214.5 | ) | (2.1 | ) | 2.1 | (239.7 | ) | ||||||||||||||||||||||||
| Other | - | - | 160.7 | - | - | - | (65.5 | ) | 226.2 | 92.4 | (8.8 | ) | (14.1 | ) | ||||||||||||||||||||||||||||||
| (=) Net cash used in investing actitivities | (251.6 | ) | (1,441.7 | ) | (787.8 | ) | (220.8 | ) | (370.8 | ) | (275.2 | ) | (85.4 | ) | (56.4 | ) | (151.2 | ) | (281.3 | ) | (507.9 | ) | ||||||||||||||||||||||
l Cash flow from financing activities: | ||||||||||||||||||||||||||||||||||||||||||||
| Proceeds from issuance of common stock | 3.2 | 1,118.4 | 200.0 | - | - | 196.2 | 0.0 | 3.8 | - | 0.7 | 303.7 | |||||||||||||||||||||||||||||||||
| Capital increase on subsidiary from minority interest | - | 324.4 | 11.2 | 11.7 | - | - | - | 11.2 | (62.2 | ) | (0.3 | ) | (1.3 | ) | ||||||||||||||||||||||||||||||
| Dividends Paid | - | (44.9 | ) | - | (44.9 | ) | - | - | - | - | - | - | - | |||||||||||||||||||||||||||||||
| Additions of financial debt | 424.6 | 117.5 | 789.5 | 117.5 | - | 174.5 | 630.4 | (15.4 | ) | 88.6 | 596.8 | 996.1 | ||||||||||||||||||||||||||||||||
| Payments of financial debt | (205.0 | ) | (492.1 | ) | (111.1 | ) | (171.2 | ) | (39.8 | ) | (26.2 | ) | (37.1 | ) | (8.0 | ) | (69.2 | ) | (351.4 | ) | (1,064.4 | ) | ||||||||||||||||||||||
| Other | - | - | (17.8 | ) | - | - | - | - | (17.8 | ) | - | - | - | |||||||||||||||||||||||||||||||
| (=) Net cash provided by financing actitivities | 222.8 | 1,023.3 | 871.9 | (86.9 | ) | (39.8 | ) | 344.6 | 593.4 | (26.2 | ) | (42.8 | ) | 245.8 | 234.0 | |||||||||||||||||||||||||||||
| Effect of exchange rate changes on cash and cash equivalents | 32.1 | 112.6 | 99.7 | 49.8 | 458.1 | 81.8 | (529.2 | ) | 89.0 | 23.5 | 112.4 | 11.6 | ||||||||||||||||||||||||||||||||
| (=) Variation in cash & equivalents | 287.3 | (248.2 | ) | 440.4 | (15.0 | ) | 17.9 | (23.7 | ) | 37.9 | 408.3 | 167.5 | 92.9 | (140.3 | ) | |||||||||||||||||||||||||||||
| (+) Cash and cash equivalents at beginning of year | 29.2 | 316.5 | 68.4 | 83.4 | 68.4 | 86.3 | 62.6 | 100.5 | 508.8 | 676.3 | 769.1 | |||||||||||||||||||||||||||||||||
| (=) Cash and cash equivalents at end of year | 316.5 | 68.4 | 508.8 | 68.4 | 86.3 | 62.6 | 100.5 | 508.8 | 676.3 | 769.1 | 628.9 | |||||||||||||||||||||||||||||||||
25
Cosan Limited
Condensed Consolidated Financial Statements
For the nine-month periods ended
December 31, 2009 and January 31, 2009
COSAN LIMITED
CONDENSED CONSOLIDATED FINANCIAL STATEMENTS
CONTENTS
| Report of independent registered public accounting firm | 1 |
| Condensed consolidated balance sheets | 2 |
| Condensed consolidated statements of operations | 4 |
Condensed consolidated statements of shareholders’ equity and comprehensive income (loss) | 5 |
| Condensed consolidated statements of cash flows | 6 |
| Notes to the condensed consolidated financial statements | 7 |
Report of independent registered public accounting firm
To the Board of Directors and Shareholders of
Cosan Limited
We have reviewed the condensed consolidated balance sheet of Cosan Limited and subsidiaries as of December 31, 2009, the related condensed consolidated statements of operations and cash flows for the nine-month periods ended December 31, 2009 and January 31, 2009 and the condensed consolidated statement of shareholders’ equity and comprehensive income (loss) for the nine-month period ended December 31, 2009. These financial statements are the responsibility of the Company's management.
We conducted our review in accordance with the standards of the Public Company Accounting Oversight Board (United States). A review of interim financial information consists principally of applying analytical procedures and making inquiries of persons responsible for financial and accounting matters. It is substantially less in scope than an audit conducted in accordance with the standards of the Public Company Accounting Oversight Board, the objective of which is the expression of an opinion regarding the financial statements taken as whole. Accordingly, we do not express such an opinion.
Based on our review, we are not aware of any material modifications that should be made to the condensed consolidated financial statements referred to above for them to be in conformity with U.S. generally accepted accounting principles.
We have previously audited, in accordance with the standards of the Public Company Accounting Oversight Board (United States), the consolidated balance sheet of Cosan Limited and subsidiaries as of March 31, 2009, and the related consolidated statements of operations, shareholders’ equity and cash flows for the eleven-month period then ended not presented herein and in our report dated June 19, 2009, we expressed an unqualified opinion on those consolidated financial statements. In our opinion, the information set forth in the accompanying condensed consolidated balance sheet as of March 31, 2009, is fairly stated, in all material respects, in relation to the consolidated balance sheet from which it has been derived.
| São Paulo, Brazil | ERNST & YOUNG |
| January 31, 2010 | Auditores Independentes S.S. |
| CRC2SP015199/O-8 | |
| Luiz Carlos Nannini | |
| Accountant CRC 1SP171638/O-7 |
1
COSAN LIMITED
Condensed consolidated balance sheets
December 31, 2009 and March 31, 2009
(In thousands of U.S. dollars, except share data)
(Unaudited) December 31, 2009 | March 31, 2009 | |||||||
| Assets | ||||||||
| Current assets: | ||||||||
| Cash and cash equivalents | 516,709 | 508,784 | ||||||
| Restricted cash | 98,811 | 5,078 | ||||||
| Derivative financial instruments | 41,359 | 7,352 | ||||||
| Trade accounts receivable, less allowances: December 31, 2009 – $32,508; March 31, 2009 – $21,241 | 293,533 | 258,863 | ||||||
| Inventories | 1,112,331 | 477,792 | ||||||
| Advances to suppliers | 138,550 | 88,991 | ||||||
| Recoverable taxes | 176,778 | 114,641 | ||||||
| Other current assets | 54,127 | 65,956 | ||||||
| 2,432,198 | 1,527,457 | |||||||
| Property, plant, and equipment, net | 3,736,977 | 2,271,828 | ||||||
| Goodwill | 1,624,431 | 888,793 | ||||||
| Intangible assets, net | 255,283 | 230,741 | ||||||
| Accounts receivable from Federal Government | 190,343 | 139,700 | ||||||
| Judicial deposits | 104,527 | 73,975 | ||||||
| Other non-current assets | 530,473 | 288,608 | ||||||
| 6,442,034 | 3,893,645 | |||||||
| Total assets | 8,874,232 | 5,421,102 | ||||||
2
(Unaudited) December 31, 2009 | March 31, 2009 | |||||||
| Liabilities and shareholders’ equity | ||||||||
| Current liabilities: | ||||||||
| Trade accounts payable | 409,314 | 197,220 | ||||||
| Taxes payable | 115,426 | 69,042 | ||||||
| Salaries payable | 76,367 | 40,237 | ||||||
| Current portion of long-term debt | 542,867 | 781,664 | ||||||
| Derivative financial instruments | 133,750 | 28,894 | ||||||
| Other liabilities | 111,045 | 47,641 | ||||||
| 1,388,769 | 1,164,698 | |||||||
| Long-term liabilities: | ||||||||
| Long-term debt | 2,802,154 | 1,251,095 | ||||||
| Estimated liability for legal proceedings and labor claims | 464,818 | 497,648 | ||||||
| Taxes payable | 220,553 | 151,476 | ||||||
| Deferred income taxes | 245,400 | 40,377 | ||||||
| Other long-term liabilities | 219,517 | 175,043 | ||||||
| 3,952,442 | 2,115,639 | |||||||
| Shareholders’ equity: | ||||||||
| Common shares class A1, $.01 par value. 1,000,000,000 shares authorized; 174,355,341 shares issued and outstanding | 1,743 | 1,743 | ||||||
| Common shares class B1, $.01 par value. 96,332,044 shares authorized, issued and outstanding | 963 | 963 | ||||||
| Common shares class B2, $.01 par value. 92,554,316 shares authorized | - | - | ||||||
| Additional paid-in capital | 1,927,288 | 1,926,733 | ||||||
| Accumulated other comprehensive income (loss) | 188,071 | (243,607 | ) | |||||
| Retained earnings (accumulated losses) | 118,265 | (89,595 | ) | |||||
| Equity attributable to shareholders of Cosan Ltd | 2,236,330 | 1,596,237 | ||||||
| Equity attributable to noncontrolling interests | 1,296,691 | 544,528 | ||||||
| Total shareholders’ equity | 3,533,021 | 2,140,765 | ||||||
| Total liabilities and shareholders’ equity | 8,874,232 | 5,421,102 | ||||||
See accompanying notes to condensed consolidated financial statements.
3
COSAN LIMITED
Condensed consolidated statements of operations
Nine-month period ended December 31, 2009 and January 31, 2009
(In thousands of U.S. dollars, except share data)
(Unaudited)
December 31, 2009 | January 31, 2009 | |||||||
| Net sales | 5,845,469 | 1,881,184 | ||||||
| Cost of goods sold | (5,182,198 | ) | (1,669,419 | ) | ||||
| Gross profit | 663,271 | 211,765 | ||||||
| Selling expenses | (345,159 | ) | (168,561 | ) | ||||
| General and administrative expenses | (177,394 | ) | (113,389 | ) | ||||
| Operating income (loss) | 140,718 | (70,185 | ) | |||||
| Other income (expenses): | ||||||||
| Financial income | 102,266 | 276,433 | ||||||
| Financial expenses | 97,231 | (621,535 | ) | |||||
| Gain on tax recovery program | 121,554 | - | ||||||
| Other | 26,878 | (4,978 | ) | |||||
| Income (loss) before income taxes and equity in income (loss) of affiliates | 488,647 | (420,265 | ) | |||||
| Income taxes (expense) benefit | (178,298 | ) | 115,964 | |||||
| Income (loss) before equity in income of affiliates | 310,349 | (304,301 | ) | |||||
| Equity income (loss) of affiliates | (5,464 | ) | 6,400 | |||||
| Net income (loss) | 304,885 | (297,901 | ) | |||||
| Less net loss (income) attributable to noncontrolling interests | (97,025 | ) | 89,882 | |||||
| Net income (loss) attributable to Cosan Ltd | 207,860 | (208,019 | ) | |||||
| Per-share amounts attributable to Cosan Ltd | ||||||||
| Earnings (loss) from continuing operations | ||||||||
| Basic and diluted | 0.77 | (0.86 | ) | |||||
| Weighted number of shares outstanding | ||||||||
| Basic and diluted | 270,687,385 | 241,758,037 | ||||||
See accompanying notes to condensed consolidated financial statements.
4
COSAN LIMITED
Condensed consolidated statements of shareholders’ equity and comprehensive income (loss)
Nine-month period ended December 31, 2009
(In thousands of U.S. dollars, except share data)
(Unaudited)
| Common stock | ||||||||||||||||||||||||||||||||||||
Common number of class A shares | Common number of class B shares | Common amount of class A shares | Common amount of class B shares | Additional paid-in capital | Retained earnings (accumulated loss) | Accumulated other comprehensive income (loss) | Noncontrolling interests | Total | ||||||||||||||||||||||||||||
| Balances at March 31. 2009 | 174,355,341 | 96,332,044 | 1,743 | 963 | 1,926,733 | (89,595 | ) | (243,607 | ) | 544,528 | 2,140,765 | |||||||||||||||||||||||||
| Acquisition of Teaçu | - | - | - | - | 41,340 | - | - | 86,954 | 128,294 | |||||||||||||||||||||||||||
| Issuance of subsidiary shares to non controlling interest | - | - | - | - | 9,840 | - | (1,735 | ) | 246,123 | 254,228 | ||||||||||||||||||||||||||
| Acquisition of non-controlling interest in subsidiary | - | - | - | - | (14,324 | ) | - | - | (9,273 | ) | (23,597 | ) | ||||||||||||||||||||||||
| Sale of warrants in subsidiary | - | - | - | - | (4,594 | ) | - | - | 4,594 | - | ||||||||||||||||||||||||||
| Exercise of stock options in subsidiary | - | - | - | - | (2,572 | ) | - | - | 5,854 | 3,282 | ||||||||||||||||||||||||||
| Exercise of common stock warrants in subsidiary | - | - | - | - | (31,040 | ) | - | - | 62,232 | 31,192 | ||||||||||||||||||||||||||
| Acquisition of TEAS | - | - | - | - | - | - | - | 9,075 | 9,075 | |||||||||||||||||||||||||||
| Stock compensation | - | - | - | - | 1,905 | - | - | 1,139 | 3,044 | |||||||||||||||||||||||||||
| Net income | - | - | - | - | - | 207,860 | - | 97,025 | 304,885 | |||||||||||||||||||||||||||
| Pension plan | - | - | - | - | - | - | (82 | ) | (49 | ) | (131 | ) | ||||||||||||||||||||||||
| Unrealized gain on available-for-sale securities | - | - | - | - | - | - | 5,450 | - | 5,450 | |||||||||||||||||||||||||||
| Currency translation adjustment | - | - | - | - | - | - | 428,045 | 248,489 | 676,534 | |||||||||||||||||||||||||||
| Total comprehensive loss | 989,782 | |||||||||||||||||||||||||||||||||||
| Balances at September 30. 2009 | 174,355,341 | 96,332,044 | 1,743 | 963 | 1,927,288 | 118,265 | 188,071 | 1,296,691 | 3,533,021 | |||||||||||||||||||||||||||
See accompanying notes to condensed consolidated financial statements.
5
COSAN LIMITED
Condensed consolidated statements of cash flows
Nine-month period ended December 31, 2009 and January 31, 2009
(In thousands of U.S. dollars)
(Unaudited)
December 31, 2009 | January 31, 2009 | |||||||
| Cash flow from operating activities: | ||||||||
| Net income (loss) attributable to Cosan Limited | 207,860 | (208,019 | ) | |||||
| Adjustments to reconcile net income to cash provided by operating activities: | ||||||||
| Depreciation and amortization | 380,791 | 254,145 | ||||||
| Deferred income and social contribution taxes | 178,298 | (104,394 | ) | |||||
| Interest, monetary and exchange variation | (262,024 | ) | 315,225 | |||||
| Gain on tax recovery program | (112,162 | ) | - | |||||
| Net loss (income) attributable to noncontrolling interests | 97,025 | (89,882 | ) | |||||
| Others | (28,558 | ) | (40,415 | ) | ||||
| Decrease/increase in operating assets and liabilities | ||||||||
| Trade accounts receivable, net | 94,947 | 26,789 | ||||||
| Inventories | (288,984 | ) | (315,188 | ) | ||||
| Advances to suppliers | (4,520 | ) | (6,087 | ) | ||||
| Trade accounts payable | 55,264 | 61,033 | ||||||
| Derivative financial instruments | 67,138 | 62,483 | ||||||
| Taxes payable | (59,581 | ) | (14,173 | ) | ||||
| Taxes recoverable | (5,111 | ) | - | |||||
| Other assets and liabilities, net | 37,227 | (86,819 | ) | |||||
| Net cash used in operating activities | 357,610 | (145,302 | ) | |||||
| Cash flows from investing activities: | ||||||||
| Restricted cash | (92,059 | ) | 29,245 | |||||
| Marketable securities | - | 465,735 | ||||||
| Acquisitions, net of cash acquired | (239,659 | ) | (715,948 | ) | ||||
| Acquisition of property, plant and equipment | (678,093 | ) | (444,959 | ) | ||||
| Other | 69,472 | 65,463 | ||||||
| Net cash used in investing activities | (940,339 | ) | (731,390 | ) | ||||
| Cash flows from financing activities: | ||||||||
| Related parties | (63,858 | ) | - | |||||
| Proceeds from issuance of common stock | 304,426 | 196,224 | ||||||
| Additions of long-term debts | 1,681,429 | 804,927 | ||||||
| Payments of long-term debts | (1,485,016 | ) | (103,083 | ) | ||||
| Net cash provided by financing activities | 436,981 | 898,068 | ||||||
| Effect of exchange rate changes on cash and cash equivalents | 153,673 | 10,749 | ||||||
| Net increase in cash and cash equivalents | 7,925 | 32,125 | ||||||
| Cash and cash equivalents at beginning of year | 508,784 | 68,377 | ||||||
| Cash and cash equivalents at end of year | 516,709 | 100,502 | ||||||
| Supplemental cash flow information | ||||||||
| Cash paid during the year for: | ||||||||
| Interest | 146,042 | 70,897 | ||||||
| Income tax | 2,189 | - | ||||||
See accompanying notes to condensed consolidated financial statements.
6
COSAN LIMITED
Notes to the condensed consolidated financial statements (Continued)
(In thousands of U.S. dollars, unless otherwise stated)
| 1. | Operations |
Cosan Limited (“Cosan” and “the Company”) was incorporated in Bermuda as an exempted company on April 30, 2007. In connection with its incorporation, Cosan Limited issued 1,000 shares of common stock for US$10.00 to Mr. Rubens Ometto Silveira Mello, who indirectly controls Cosan S.A. Indústria e Comércio and its subsidiaries (“Cosan S.A.”).
The companies included in the consolidated financial statements have as their primary activity the production of ethanol and sugar, and the marketing and distribution of fuel and lubricants in Brazil. They are constantly pursuing opportunities to capitalize on the growing demand for ethanol and sugar in the world. They are focused on increasing production capacity through expansion of existing facilities, development of greenfield projects and, as opportunities present themselves, acquisitions.
Cosan S.A. was the predecessor to Cosan and was the primary operating business in the consolidated group prior to a reorganization in August, 2007. In contemplation of an initial public offering on August 1, 2007, Aguassanta Participações S.A. and Usina Costa Pinto S.A. Açúcar e Álcool, controlling shareholders of Cosan S.A. and both indirectly controlled by Mr. Rubens Ometto Silveira Mello, the controlling shareholder, contributed their common shares of Cosan S.A. to Cosan in exchange for 96,332,044 of our class B1 common shares. The common shares contributed to the Company by Aguassanta Participações S.A. and Usina Costa Pinto S.A. Açúcar e Álcool consisted of 96,332,044 common shares of Cosan, representing 51.0% of Cosan S.A. outstanding common shares. As a result of this reorganization Cosan Ltd. became the controlling shareholder of Cosan S.A.. The reorganization was accounted for as a reorganization of companies under common control in a manner similar to a pooling of interests.
On August 17, 2007, the Company concluded its global offering of 111,678,000 class A common shares which resulted in gross proceeds in the amount of US$1,171,027. As a result of the global offering, Cosan’s shares are traded on the New York Stock Exchange (NYSE) and on the São Paulo Stock Exchange (Bovespa) by BDR (Brazilian Depositary Receipts).
The costs directly attributable to the offering were charged against the gross proceeds of the offering in a total amount of US$52,594. Therefore the net proceeds related to the IPO totaled US$1,118,433.
7
COSAN LIMITED
Notes to the condensed consolidated financial statements (Continued)
(In thousands of U.S. dollars, unless otherwise stated)
| 1. | Operations (Continued) |
On April 23, 2008, Cosan S.A. entered into an agreement with ExxonMobil International Holding B.V., or “Exxon”, for the acquisition of 100% of the outstanding shares of Esso Brasileira de Petróleo Ltda. and its subsidiaries (“Essobrás”), a distributor and seller of fuels and producer and seller of lubricants and specialty petroleum products of ExxonMobil in Brazil. On December 1, 2008 the Company completed the acquisition. On January 16, 2009 the Company changed the corporate name of Essobrás to Cosan Combustíveis e Lubrificantes S.A. (“Cosan CL”).
On July 17, 2008, the Board Directors approved the modification of the fiscal year end from April 30 to March 31 of each year. Therefore the income statement and cash flow information presented in these financial statements lack comparison to the prior period represented by the nine-month period ended January 31, 2009.
On August 28, 2008, Cosan S.A. announced the incorporation of a new affiliate named Radar Propriedades Agrícolas S.A. (“Radar”), which engages in farm real estate investments in Brazil by identifying and acquiring rural properties likely to experience an increase in value and acquiring them for later leasing and/or sale. The initial capital contribution was US$185,000, of which US$35,000 was invested by Cosan (18.92%) and US$150,000 by another shareholder (81.08%). On August 25, 2009, an additional capital contribution of US$33,262, was approved, of which US$6,293 (18.92%) was invested by Cosan and the remainder by the other shareholder. On December 15, 2009, an additional capital contribution of US$8,911, was approved, of which US$1,659 (18.92%) was invested by Cosan and the remainder by the other shareholder.
On April 09, 2009, Cosan S.A. entered into an agreement with Rezende Barbosa S.A. Administração e Participações (“Rezende Barbosa”) to acquire 100% of the outstanding shares of Teaçu Armazéns Gerais S.A. (“Teaçu”). Teaçu operates a port terminal concession in the city of Santos. See further discussion regarding this acquisition at Note 3.
On June 17, 2009, Cosanpar Participações S.A. (“Cosanpar”), a wholly-owned subsidiary of Cosan S.A. sold its equity interest in Jacta Participações S.A. (“Jacta”), a distributor of aviation fuel that was acquired in the Essobrás acquisition, to Shell Brasil Ltda. for US$59,234 cash. The results of operations of Jacta were recorded in the fuel distribution segment. The carrying value of the net assets sold was US$40,084, which resulted in a gain net of taxes of US$19,150.
8
COSAN LIMITED
Notes to the condensed consolidated financial statements (Continued)
(In thousands of U.S. dollars, unless otherwise stated)
| 1. | Operations (Continued) |
On June 18, 2009, Cosan S.A. entered into an agreement with Rezende Barbosa to acquire 100% of the outstanding shares of Curupay S.A. Participações (“Curupay”). The principal investment of Curupay was 100% of the outstanding shares of Cosan Alimentos S.A. (former Nova América S.A. Agroenergia). Cosan Alimentos S.A. (“Cosan Alimentos”) is a producer of sugar, ethanol and energy co-generation which also operates in trading and logistics. See further discussion regarding this acquisition at Note 3.
On November 24, 2009, Cosan S.A. entered into an agreement with Crystalsev Comércio e Representação Ltda and Plínio Nastari Consultoria e Participações Ltda to acquire 26,7% of the outstanding shares of TEAS Terminal Exportador de Álcool de Santos S.A. (“TEAS”). As a result, this increased its ownership percentage from 40,0% to 66,7% of the TEAS’s capital. TEAS operates a port terminal concession in the city of Santos. See further discussion regarding this acquisition at Note 3.
| 2. | Presentation of the consolidated financial statements |
a. Basis of reporting for interim financial statements
In the opinion of management, the unaudited condensed consolidated financial statements reflect all adjustments (consisting of normal recurring accruals) considered necessary for a fair presentation of the Company’s results for the periods presented. Interim results for the nine-month period ended December 31, 2009, are not necessarily indicative of the results that may be expected for the fiscal year.
The unaudited condensed consolidated financial statements include the accounts of Cosan and its subsidiaries. All significant intercompany transactions have been eliminated.
These financial statements should be read in conjunction with Cosan`s annual financial statements for the fiscal year ended March 31, 2009.
The accounts of Cosan are maintained in U.S. Dollars and the accounts of its subsidiaries are maintained in Brazilian reais, which have been translated into U.S. dollars in accordance with Accounting Standards Codification 830 “Foreign Currency Matters”.
The exchange rate of the Brazilian real (R$) to the US$ was R$1.7412=US$ 1.00 at December 31, 2009 and R$2.3152=US$1.00 at March 31, 2009.
9
COSAN LIMITED
Notes to the condensed consolidated financial statements (Continued)
(In thousands of U.S. dollars, unless otherwise stated)
| 2. | Presentation of the consolidated financial statements (Continued) |
b. Use of estimates
The preparation of condensed consolidated financial statements in conformity with U.S. GAAP requires management to make estimates and assumptions that affect the amounts reported in the condensed consolidated financial statements and accompanying notes. Actual results could differ from these estimates. These estimates and assumptions are reviewed and updated regularly to reflect recent experience.
c. Recently issued accounting standards
FASB Accounting Standards Codification
In September 2009, the Accounting Standards Codification (“ASC”) became the source of authoritative U.S. GAAP recognized by the Financial Accounting Standards Board (“FASB”) for nongovernmental entities, except for certain FASB Statements not yet incorporated into ASC. Rules and interpretive releases of the SEC under federal securities laws are also sources of authoritative U.S. GAAP for registrants. The authoritative guidance mentioned in these financial statements includes the applicable ASC reference.
Subsequent Events
We adopted ASC 855, Subsequent Events, which established general accounting standards and disclosure for subsequent events, during the nine-month period ended December 31, 2009. In accordance with ASC 855, the Company has evaluated subsequent events through January 31, 2010, the date the financial statements were issued.
Noncontrolling Interests
Effective April 1, 2009, the Company adopted new accounting guidance ASC 810, which changed the accounting for and the reporting of an entity’s minority ownership. Such minority ownership, previously referred to as minority interest, is now referred to as noncontrolling interests. The adoption of this guidance resulted in the reclassification of amounts previously attributable to minority interest and classified in the mezzanine outside of shareholders’ equity, to a separate component of stockholders’ equity titled “Noncontrolling Interests” in the accompanying condensed consolidated balance sheets and statement of changes in equity.
10
COSAN LIMITED
Notes to the condensed consolidated financial statements (Continued)
(In thousands of U.S. dollars, unless otherwise stated)
| 2. | Presentation of the consolidated financial statements (Continued) |
c. Recently issued accounting standards (Continued)
Noncontrolling Interests (Continued)
Additionally, net income and comprehensive income attributable to noncontrolling interests are shown separately from consolidated net income and comprehensive income in the accompanying condensed consolidated statements of operations and statements of changes in equity. Prior period financial statements have been reclassified to conform to the current year presentation as required by the authoritative guidance.
New Accounting Pronouncements
The following accounting standards have been issued, but as of December 31, 2009 are not yet effective and have not been adopted by the Company.
SFAS No. 166, Accounting for Transfers of Financial Assets – an amendment of FASB Statement No. 140 (“SFAS No. 166”)
In June 2009, the FASB issued SFAS No. 166, which removes the concept of a qualifying special-purpose entity (“QSPE”) from SFAS No. 140, Accounting for Transfers and Servicing of Financial Assets and Extinguishments of Liabilities-a replacement of FASB Statement No. 125. The QSPE concept had initially been established to facilitate off-balance sheet treatment for certain securitizations. SFAS No. 166 also removes the exception from applying FASB Interpretation (“FIN”) No. 46(R), Consolidation of Variable Interest Entities (“FIN No. 46(R)”), to QSPEs. SFAS No. 166 has not been incorporated into ASC and is effective for fiscal years beginning after November 15, 2009, or April 1, 2010 for Cosan. The Company does not believe the adoption of SFAS No. 166 will have a material impact on its financial statements.
11
COSAN LIMITED
Notes to the condensed consolidated financial statements (Continued)
(In thousands of U.S. dollars, unless otherwise stated)
| 2. | Presentation of the consolidated financial statements (Continued) |
c. Recently issued accounting standards (Continued)
New Accounting Pronouncements (Continued)
SFAS No. 167, Amendments to FASB Interpretation No. 46(R) (“SFAS No. 167”)
In June 2009, the FASB issued SFAS No. 167, which amends FIN 46(R) to among other things, require an entity to qualitatively rather than quantitatively assess the determination of the primary beneficiary of a variable interest entity (“VIE”). This determination should be based on whether the entity has 1) the power to direct matters that most significantly impact the activities of the VIE and 2) the obligation to absorb losses or the right to receive benefits of the VIE that could potentially be significant to the VIE. Other key changes include: the requirement for an ongoing reconsideration of the primary beneficiary, the criteria for determining whether service provider or decision maker contracts are variable interests, the consideration of kick-out and removal rights in determining whether an entity is a VIE, the types of events that trigger the reassessment of whether an entity is a VIE and the expansion of the disclosures previously required under FASB Staff Position (“FSP”) FAS 140-4 and FIN 46(R), Disclosures by Public Entities (Enterprises) about Transfers of Financial Assets and Interests in Variable Interest Entities. SFAS No. 167 has not been incorporated into ASC and is effective for fiscal years beginning after November 15, 2009, or April 1, 2010 for Cosan. The Company does not believe the adoption of FAS No. 166 will have a material impact on its financial statements.
SFAS No. 168, FASB Codification and the Hierarchy of GAAP (“SFAS No. 168”)
In June 2009, the FASB issued SFAS No. 168, which identifies the sources of accounting principles and the framework for selecting the principles used in the preparation of financial statements of nongovernmental entities that are presented in conformity with U.S. GAAP. SFAS No. 168 replaces SFAS No. 162, The Hierarchy of Generally Accepted Accounting Principles, and establishes the FASB Accounting Standards Codification (“the Codification”) as the single source of authoritative guidance recognized by the FASB. Under the Codification, all guidance carries an equal level of authority. SFAS No. 168 has not been incorporated into ASC and is effective for interim and annual periods ending after September 15, 2009, or the quarter ending September 30, 2009 for the Company. We adopted this guidance effective July 1, 2009, with no impact on our consolidated results of operations or financial position.
12
COSAN LIMITED
Notes to the condensed consolidated financial statements (Continued)
(In thousands of U.S. dollars, unless otherwise stated)
| 3. | Acquisitions |
a. Teaçu Armazéns Gerais S.A.
On April 9, 2009, Cosan S.A., through its 90% owned subsidiary, Copsapar Participações S.A., which owns 100% of Novo Rumo Logística S.A. (“Novo Rumo”), acquired 100% of the outstanding shares of Teaçu Armazéns Gerais S.A. (“Teaçu”) from Rezende Barbosa S.A. Administração e Participações (“Rezende Barbosa”) for $52,985 cash and issuance of 90,736,131 shares of Novo Rumo, equivalent to 28.82% of its share capital. Teaçu holds a port concession in the city of Santos and operates a terminal dedicated to exporting sugar and other agricultural products. This acquisition combines the Santos port operations previously held separately by Cosan S.A. and Teaçu.
As a result of this transaction, Cosan S.A. reduced its indirect share ownership in Novo Rumo to 64.06%.
The acquisition-date fair value of the consideration transferred totaled $150,501, which consisted of the following:
| Cash | 52,985 | |||
| Common stock at estimated fair value | 97,516 | |||
| Total | 150,501 |
The fair value of the 90,736,131 common shares issued was provisionally determined at the acquisition date and is being reviewed in order to finalize the purchase price.
13
COSAN LIMITED
Notes to the condensed consolidated financial statements (Continued)
(In thousands of U.S. dollars, unless otherwise stated)
| 3. | Acquisitions (Continued) |
a. Teaçu Armazéns Gerais S.A. (Continued)
The following table summarizes the estimated fair values of the assets acquired and liabilities assumed at the acquisition date. The company is in the process of obtaining valuations of certain intangible assets and fixed assets; thus, the provisional measurements of intangible assets, goodwill and deferred income tax assets are subject to change.
| Description | ||||
| Property, plant and equipment | 40,224 | |||
| Inventories | 973 | |||
| Other assets | 29,012 | |||
| Long-term debt including current installments | (18,780 | ) | ||
| Trade accounts payable | (361 | ) | ||
| Estimated liability for legal proceedings and labor claims | (976 | ) | ||
| Other liabilities | (1,922 | ) | ||
| Net assets acquired | 48,170 | |||
| Provisional purchase price, net of cash acquired | 150,222 | |||
| Goodwill | 102,052 | |||
The provisional goodwill of $102,052 arising from the acquisition, which will be substantially deductible for tax purposes, consists largely of the synergies and economies of scale expected from combining the port operations of Cosan S.A. and Teaçu. The provisional goodwill was assigned to the sugar segment.
The amounts of Teaçu’s revenue and earnings included in Cosan S.A.’s consolidated income statement for the nine-month period ended January 31, 2009, and the revenue and earnings of the combined entity had the acquisition date been May 1, 2008, are:
| Revenue | Earnings (loss) | |||||||
| Actual from April 9, 2009 – December 31, 2009 (*) | 29,067 | 3,315 | ||||||
| Supplemental pro forma from May 1, 2008 – January 31, 2009 | 1,902,726 | (296,895 | ) | |||||
(*) Revenues and earnings represent the full nine-month period ended December 31, 2009.
14
COSAN LIMITED
Notes to the condensed consolidated financial statements (Continued)
(In thousands of U.S. dollars, unless otherwise stated)
| 3. | Acquisitions (Continued) |
b. Curupay S.A. Participações
On June 18, 2009, Cosan S.A. acquired 100% of the outstanding shares of Curupay S.A. Participações from Rezende Barbosa, through the issuance of 44,300,389 common shares valued at $7.25 per share (fair value at the acquisition date) and a total purchase price of US$321,087. The assets acquired include the non-controlling interest in Novo Rumo representing 28.82% of its outstanding shares which were issued in the Teaçu acquisition, and 100% of the outstanding shares of two operating companies, Nova América S.A. Trading and Cosan Alimentos (collectively referred to as “Nova América”). Nova América is a producer of sugar, ethanol and energy co-generation and also operates in trading and logistics.
With the acquisition of the noncontrolling interest of Novo Rumo, Cosan S.A. increased its share ownership in Novo Rumo to 92.88%. This transaction was a change in ownership interest without a loss of control and accounted for as a transaction in shareholders’ equity of Cosan S.A.
The following table summarizes the assets acquired and liabilities assumed in relation to Nova América. These amounts are preliminary as valuations of certain intangible assets, fixed assets and other assets and liabilities are currently in process.
| Description | ||||
| Property, plant and equipment | 370,651 | |||
| Noncontrolling interest in Novo Rumo | 62,476 | |||
| Inventories | 63,572 | |||
| Account receivables | 62,377 | |||
| Other assets | 251,267 | |||
| Long-term debt including current installments | (606,118 | ) | ||
| Trade accounts payable | (81,563 | ) | ||
| Related parties | (16,591 | ) | ||
| Estimated liability for legal proceedings and labor claims | (7,009 | ) | ||
| Taxes and contributions payable | (28,821 | ) | ||
| Other liabilities | (66,155 | ) | ||
| Net assets acquired | 4,086 | |||
| Purchase price, net of cash acquired | 294,605 | |||
| Goodwill | 290,519 | |||
The provisional goodwill of $290,519 arising from the acquisition consists largely of the synergies and economies of scale expected from combining the ethanol and sugar operations of Cosan S.A. and Nova America. US$207,285 of the provisional goodwill was assigned to the sugar segment and US$83,234 was assigned to the ethanol segment.
15
COSAN LIMITED
Notes to the condensed consolidated financial statements (Continued)
(In thousands of U.S. dollars, unless otherwise stated)
| 3. | Acquisitions (Continued) |
b. Curupay S.A. Participações (Continued)
The amounts of Nova America’s revenue and earnings included in Cosan S.A.’s consolidated income statement for the nine-month period ended January 31, 2009, and the revenue and earnings of the combined entity had the acquisition date been May 1, 2008, are:
| Revenue | Earnings | |||||||
| Actual from June 18, 2009 – December 31, 2009 | 407,364 | 25,208 | ||||||
| Supplemental pro forma from April 1, 2009 – December 31, 2009 | 5,938,413 | 202,657 | ||||||
| Supplemental pro forma from May 1, 2008 – January 31, 2009 | 2,382,518 | (225,201 | ) | |||||
c. TEAS Terminal Exportador de Álcool de Santos S.A.
On November 24, 2009, Cosan S.A. acquired, for $11,574 cash, an additional 26.7% interest, represented by 10,527,295 common shares, of TEAS Terminal Exportador de Álcool de Santos S.A. (“TEAS”) from Crystalsev Comércio e Representação Ltda and Plínio Nastari Consultoria e Participações Ltda. As a result of this transaction, Cosan S.A. increased its direct share ownership in TEAS from 40.0% to 66.7% and obtained control of TEAS. TEAS holds a port concession in the city of Santos and operates a terminal dedicated to exporting ethanol.
The acquisition date fair value of the consideration transferred totaled US$22,800, which consisted of the following:
| Cash | 11,574 | |||
| Acquisition date fair value of initial 40% investment (*) | 11,226 | |||
| Total | 22,800 |
(*) Provisionally calculated based on the book value, the Company is finalizing its fair value calculation of its previously held interest.
16
COSAN LIMITED
Notes to the condensed consolidated financial statements (Continued)
(In thousands of U.S. dollars, unless otherwise stated)
| 3. | Acquisitions (Continued) |
c. TEAS Terminal Exportador de Álcool de Santos S.A. (Continued)
The following table summarizes the estimated fair values of the assets acquired and liabilities assumed at the acquisition date. The company is in the process of obtaining valuations of certain intangible assets and fixed assets; thus, the provisional measurements of intangible assets, fixed assets and goodwill are subject to change.
| Description | ||||
| Property, plant and equipment | 12,089 | |||
| Other assets | 489 | |||
| Trade accounts payable | (74 | ) | ||
| Other liabilities | (206 | ) | ||
| Fair value of non-controlling interest (*) | (3,574 | ) | ||
| Net assets acquired | 8,724 | |||
| Provisional purchase price, net of cash acquired | 12,917 | |||
| Goodwill | 4,193 | |||
(*) Provisionally calculated based on the book value, the Company is finalizing its fair value calculation of non controlling interest.
The provisional goodwill of $4,193 arising from the acquisition consists largely of the synergies and economies of scale expected from combining the port operations of Cosan S.A. and TEAS. The provisional goodwill was assigned to the ethanol segment.
The amounts of TEAS’s revenue and earnings included in Cosan S.A.’s consolidated income statement for the nine-month period ended January 31, 2009, and the revenue and earnings of the combined entity had the acquisition date been May 1, 2008, are:
| Revenue | Earnings | |||||||
| Actual from November 24, 2009 – December 31, 2009 | 100 | 18 | ||||||
| Supplemental pro forma from April 1, 2009 – December 31, 2009 | 5,848,212 | 208,045 | ||||||
| Supplemental pro forma from May 1, 2008 – January 31, 2009 | 1,883,948 | (207,807 | ) | |||||
17
COSAN LIMITED
Notes to the condensed consolidated financial statements (Continued)
(In thousands of U.S. dollars, unless otherwise stated)
| 3. | Acquisitions (Continued) |
d. Logispot Armazens Gerais Ltda. (“Logispot”)
On November 12, 2009, Cosan S.A., through its subsidiary Rumo Logística S.A., acquired a 14.28% interest in Logispot, represented by 166,590 common shares, for $11,606 cash. Logispot is a logistics hub and warehouse based in the city of Sumaré.
| 4. | Derivative financial instruments |
Cosan enters into derivative financial instruments with various counterparties and uses derivatives to manage the overall exposures related to sugar price variations in the international market, interest rate and exchange rate variation. The instruments are commodity futures contracts, forward currency agreements, interest rate and foreign exchange swap contracts, and option contracts. Cosan recognizes all derivatives on the balance sheet at fair value.
The following table summarizes the notional value of derivative financial instruments as well as the related amounts recorded in balance sheet accounts:
| Notional amounts | Carrying value asset (liability) | |||||||||||||||
| December 31, 2009 | March 31, 2009 | December 31, 2009 | March 31, 2009 | |||||||||||||
| Commodities derivatives | ||||||||||||||||
| Future contracts: | ||||||||||||||||
| Purchase commitments - sugar | 66,214 | 61 | 1,939 | (4 | ) | |||||||||||
| Purchase commitments - oil | 43,692 | - | 2,228 | - | ||||||||||||
| Sell commitments | 375,602 | 182,943 | (42,948 | ) | 4,163 | |||||||||||
| Swap agreements | 56,594 | - | 3,630 | - | ||||||||||||
| Options: | ||||||||||||||||
| Purchased | 186,599 | - | 5,319 | - | ||||||||||||
| Written | 416,111 | 64,366 | (90,670 | ) | (2,906 | ) | ||||||||||
| Foreign exchange derivatives | ||||||||||||||||
| Forward contracts: | ||||||||||||||||
| Sale commitments | 298,435 | 184,653 | (132 | ) | (23,035 | ) | ||||||||||
| Swap agreements | ||||||||||||||||
| Swap agreements – Senior notes 2009 | - | 246,501 | (2,949 | ) | ||||||||||||
| Swap agreements – Interest Libor | 99,317 | - | 552 | - | ||||||||||||
| Future contracts | ||||||||||||||||
| Sale commitments | 331,048 | 372,230 | 17,698 | 3,189 | ||||||||||||
| Options | ||||||||||||||||
| Purchased | 559,673 | - | 9,993 | - | ||||||||||||
| Total assets | 41,359 | 7,352 | ||||||||||||||
| Total liabilities | (133,750 | ) | (28,894 | ) | ||||||||||||
18
COSAN LIMITED
Notes to the condensed consolidated financial statements (Continued)
(In thousands of U.S. dollars, unless otherwise stated)
| 4. | Derivative financial instruments (Continued) |
When quoted market prices were not available, fair values were based on estimates using discounted cash flows or other valuation techniques
| 5. | Inventories |
| December 31, 2009 | March 31, 2009 | |||||||
| Finished goods: | ||||||||
| Sugar | 354,827 | 47,195 | ||||||
| Ethanol | 323,600 | 86,809 | ||||||
| Lubricants | 43,725 | 38,852 | ||||||
| Fuel (Gasoline, Diesel and Ethanol) | 124,100 | 74,582 | ||||||
| Others | 4,744 | 6,674 | ||||||
| 850,996 | 254,112 | |||||||
| Annual maintenance cost of growing crops | 179,849 | 167,576 | ||||||
| Others | 81,486 | 56,104 | ||||||
| 1,112,331 | 477,792 | |||||||
| 6. | Taxes |
Cosan Ltd. is incorporated in Bermuda which has no income taxes. The following relates to Brazilian taxes of Cosan S.A. and its subsidiaries.
Cosan S.A. and its subsidiaries file income tax returns in the Brazilian federal jurisdiction. These subsidiaries are no longer subject to Brazilian federal income tax examinations by tax authorities for years before December 31, 2003.
Taxes payable are summarized as follows:
| December 31, 2009 | March 31, 2009 | |||||||
| Tax Recovery Program – Federal REFIS | - | 69,516 | ||||||
| Special Tax Payment Program – PAES | 250 | 28,912 | ||||||
| Tax Recovery from Brazilian Law No 11.941/09 and MP 470/09 | 180,722 | - | ||||||
| Income Tax and Social Contribution | 90,472 | 71,747 | ||||||
| Others | 64,535 | 50,343 | ||||||
| 335,979 | 220,518 | |||||||
| Current liabilities | (115,426 | ) | (69,042 | ) | ||||
| Long-term liabilities | 220,553 | 151,476 | ||||||
19
COSAN LIMITED
Notes to the condensed consolidated financial statements (Continued)
(In thousands of U.S. dollars, unless otherwise stated)
| 6. | Taxes (Continued) |
On May 27, 2009 and October 13, 2009, Law 11.941 and MP 470 were approved by the Brazilian government creating a tax recovery program, permitting the taxpayer to settle its federal tax debts, previous recovery programs, and other federal taxes under court discussions with discounts on previously charged penalties and interest and in installments.
Additionally, it was permitted for the taxpayer to offset a portion of the penalties and interest due with its balance of income tax loss carry forwards. MP470 also allowed taxpayers to use tax losses to offset the principal balance related to IPI taxes (credit premium, note 9).
During the third quarter of 2009, Cosan S.A. and subsidiaries joined the tax recovery program and the following effects were recorded:
| Taxes payable and recorded contingencies | 423,753 | |||
| Gain on tax recovery programs | (121,554 | ) | ||
| Tax loss carryfowards | (117,105 | ) | ||
| Installments paid | (6,425 | ) | ||
| Interest | 2,053 | |||
| Payable as of December 31, 2009 | 180,722 |
Cosan accounts for unrecognized tax benefits in accordance with ASC 740, Accounting for Uncertainly in Income Taxes. A reconciliation of the beginning and ending amount of unrecognized tax benefits recorded as noncurrent taxes payable, is as follows:
| Balance at March 31, 2009 | 53,995 | |||
| Accrued interest on unrecognized tax benefit | 1,933 | |||
| Effect of foreign currency translation | 17,800 | |||
| Settlements | (37 | ) | ||
| Balance at December 31, 2009 | 73,691 |
It is possible that the amount of unrecognized tax benefits will change in the next twelve months, however, an estimate of the range of the possible change cannot be made at this time due to the long time to reach a settlement agreement or decision with the taxing authorities.
20
COSAN LIMITED
Notes to the condensed consolidated financial statements (Continued)
(In thousands of U.S. dollars, unless otherwise stated)
| 7. | Long-term debt |
Long-term debt is summarized as follows:
Index | Average annual interest rate | December 31, 2009 | March 31, 2009 | ||||||||||
| Resolution No. 2471 (PESA) | IGP-M | 4.0 | % | 293,097 | 215,572 | ||||||||
| Resolution No. 2471 | Corn price | 12.50 | % | 72 | 59 | ||||||||
| Senior notes due 2009 | US Dollar | 9.0 | % | - | 37,386 | ||||||||
| Senior notes due 2014 | US Dollar | 9,5 | % | 363,115 | - | ||||||||
| Senior notes due 2017 | US Dollar | 7.0 | % | 412,289 | 405,389 | ||||||||
| IFC | US Dollar | 7.4 | % | 52,213 | 49,362 | ||||||||
| Perpetual notes | US Dollar | 8.3 | % | 455,973 | 456,463 | ||||||||
| BNDES | TJLP | 2.6 | % | 485,167 | 99,561 | ||||||||
| Floating rate notes | Libor | 2.8 | % | - | 151,207 | ||||||||
| Promissory notes | DI | 3.00 | % | - | 501,888 | ||||||||
| Export credit notes | DI | 3.90 | % | 293,189 | - | ||||||||
| Credit Notes | DI | 5.60 | % | 69,527 | - | ||||||||
| Export credit notes | US Dollar | 2.00 | % | 551,359 | - | ||||||||
| Others | Various | Various | 369,020 | 115,872 | |||||||||
| 3,345,021 | 2,032,759 | ||||||||||||
| Current liability | (542,867 | ) | (781,664 | ) | |||||||||
| Long-term debt | 2,802,154 | 1,251,095 | |||||||||||
Long-term debt has the following scheduled maturities:
| 2011 | 337,669 | |||
| 2012 | 444,400 | |||
| 2013 | 123,434 | |||
| 2014 | 110,394 | |||
| 2015 | 50,166 | |||
| 2016 | 48,789 | |||
| 2017 | 446,570 | |||
| 2018 and thereafter | 1,240,732 | |||
| 2,802,154 |
Resolution No. 2471 - Special Agricultural Financing Program (Programa Especial de Saneamento de Ativos), or PESA
To extend the repayment period of debts incurred by Brazilian agricultural producers, the Brazilian government passed Law 9.138 followed by Central Bank Resolution 2,471, which, together, formed the PESA program. PESA offered certain agricultural producers with certain types of debt the opportunity to acquire Brazilian treasury bills (“CTNs”) in an effort to restructure their agricultural debt. The face value of the Brazilian treasury bills was the equivalent of the value of the restructured debt and was for a term of 20 years.
21
COSAN LIMITED
Notes to the condensed consolidated financial statements (Continued)
(In thousands of U.S. dollars, unless otherwise stated)
| 7. | Long-term debt (Continued) |
Resolution No. 2471 - Special Agricultural Financing Program (Programa Especial de Saneamento de Ativos), or PESA (Continued)
The acquisition price was calculated by the present value, discounted at a rate of 12% per year or at the equivalent of 10.4% of its face value. The CTNs were deposited as a guarantee with a financial institution and cannot be renegotiated until the outstanding balance is paid in full. The outstanding balance associated with the principal is adjusted in accordance with the IGP-M until the expiration of the restructuring term, which is also 20 years, at which point the debt will be discharged in exchange for the CTNs. Because the CTNs will have the same face value as the outstanding balance at the end of the term, it will not be necessary to incur additional debt to pay PESA debt.
On July 31, 2003, the Central Bank issued Resolution 3,114, authorizing the reduction of up to five percentage points of PESA related interest rates, effectively lowering the above-mentioned rates to 3%, 4% and 5%, respectively. The CTNs held by Cosan as of December 31, 2009 and March 31, 2009 amounted to US$111,756 and US$113,877, respectively, and are classified as Other non-current assets.
Senior notes due 2017
On January 26, 2007, the wholly-owned subsidiary Cosan Finance Limited issued US$400,000 of senior notes in the international capital markets. These senior notes, listed on the Luxembourg Stock Exchange, mature in November 2017 and bear interest at a rate of 7% per annum, payable semi-annually. The senior notes are guaranteed by Cosan, and its subsidiary, Cosan Açúcar e Álcool.
Senior notes due 2014
On August 4, 2009, the indirect subsidiary CCL Finance Limited issued US$ 350,000 of senior notes in the international capital markets. These senior notes, listed on the Luxembourg Stock Exchange, mature in August 2014 and bear interest at a rate of 9,5% per annum, payable semi-annually in February and August of each year, from February of 2010.
22
COSAN LIMITED
Notes to the condensed consolidated financial statements (Continued)
(In thousands of U.S. dollars, unless otherwise stated)
| 7. | Long-term debt (Continued) |
Perpetual notes
On January 24 and February 10, 2006, Cosan issued perpetual notes which are listed on the Luxembourg Stock Exchange - EURO MTF. These notes bear interest at a rate of 8.25% per year, payable quarterly on May 15, August 15, November 15 and February 15 of each year, beginning May 15, 2006.
These notes may, at the discretion of Cosan, be redeemed on any interest payment date subsequent to February 15, 2011. The notes are guaranteed by Cosan and by Cosan Açúcar e Álcool.
Promissory Notes
On November 17, 2008, the Company issued one series of 44 registered promissory notes for US$613,941. The notes which are due in one year, will bear interest, due at maturity, at the average rates of DI - Interbank Deposits plus 3%.
On November 12, 2009, the Company fully paid this debt. At this date, the amount paid totaled US$703,801.
Export Pre-payment Notes
During the third quarter of 2009, the Company obtained funds from export pre-payment notes at the total amount of US$530,000. The export pre-payment notes are due from 2012 through 2014, and bear interest of Libor plus 5.2%
Covenants
Cosan and its subsidiaries are subject to certain restrictive covenants related to their indebtedness, including the following: limitation on transactions with shareholders and affiliated companies; limitation on payment of dividends and other payments affecting subsidiaries; and limitation on guarantees granted on assets.
At December 31, 2009, Cosan was in compliance with its debt covenants.
23
COSAN LIMITED
Notes to the condensed consolidated financial statements (Continued)
(In thousands of U.S. dollars, unless otherwise stated)
| 8. | Related parties |
| Assets | ||||||||
| December 31, 2009 | March 31, 2009 | |||||||
| Cosan Alimentos | - | 13,123 | ||||||
| Rezende Barbosa S.A. Administração e Participações | 90,296 | - | ||||||
| Vertical UK LLP | 2,152 | 11,597 | ||||||
| Others | 7,773 | - | ||||||
| 100,221 | 24,720 | |||||||
| Current (*) | (14,151 | ) | (24,720 | ) | ||||
| Noncurrent (*) | 86,070 | - | ||||||
| Liabilities | ||||||||
| December 31, 2009 | March 31, 2009 | |||||||
| Nova América S.A. Agrícola | 14,541 | - | ||||||
| Logispot Armazéns Gerais S.A. | 8,610 | - | ||||||
| Others | 5,827 | - | ||||||
| 28,978 | - | |||||||
| Current (*) | (28,978 | ) | - | |||||
| Noncurrent | - | - | ||||||
(*) included in other current and noncurrent assets or liabilities captions
Cosan conducts some of its operations through various joint ventures and other partnership forms which are principally accounted for using the equity method. The income statement includes the following amounts resulting from transactions with related parties:
| December 31, 2009 | January 31, 2009 | |||||||
| Transactions involving assets | ||||||||
| Cash received due to the sale of finished products and assets and services held, net of payments | (109,642 | ) | (263,734 | ) | ||||
| Sale of finished products and services in a affiliated company | 98,320 | 109,423 | ||||||
| Sale of Buildings | - | 16,685 | ||||||
| Sale of Interest in subsidiaries | - | 147,709 | ||||||
| Added through acquisition | 73,338 | - | ||||||
| Transactions involving liabilities | ||||||||
| Payment of financial resources, net of funding | 27,560 | (3,036 | ) | |||||
| Cash received (payment) to Cosan Limited | (170,457 | ) | 213,179 | |||||
| Financial income (expense) | (41,573 | ) | 285 | |||||
The purchase and sale of products are carried out at arm’s length and unrealized profit or losses with consolidated companies have been eliminated.
24
COSAN LIMITED
Notes to the condensed consolidated financial statements (Continued)
(In thousands of U.S. dollars, unless otherwise stated)
| 8. | Related parties (Continued) |
In addition, as of December 31, 2009, the Company and its subsidiaries lease 54,000 hectares (unaudited) of land (35,599 hectares (unaudited) in 2008) from affiliated companies. These leases are carried out on an arm’s length basis, and the rent is calculated based on sugarcane tons per hectare, valued according to price established by CONSECANA (São Paulo State Council of Sugarcane, Sugar and Ethanol Producers).
A receivable of US$90,296 with Rezende Barbosa S.A. Administração e Participações related to credits assumed by Rezende Barbosa, in connection with the acquisition of Cosan Alimentos and intercompany loans at the annual interest rate equivalent to 9,25%.
The amount receivable from the affiliate Vertical UK LLP, located in British Virgin Islands, refers to ethanol trading, whith an average maturity date of 30 days.
The payable to Logispot is related to the remaining payment in connection with the interest acquired. (Note 3)
During the nine-month period the Company executed lease contracts with Radar to formalize land leases that were already in existence, with an average lease term of 19 years. Total lease expense in the nine-month period was US$9,377.
| 9. | Estimated liability for legal proceedings and labor claims and commitments |
December 31, 2009 | March 31, 2009 | |||||||
| Tax contingencies | 374,656 | 430,342 | ||||||
| Civil and labor contingencies | 90,162 | 67,306 | ||||||
| 464,818 | 497,648 | |||||||
Cosan S.A. and its subsidiaries are parties in various ongoing labor claims, civil and tax proceedings in Brazil arising in the normal course of its business. Respective provisions for contingencies were recorded considering those cases in which the likelihood of loss has been rated as probable. Management believes resolution of these disputes will have no effect significantly different than the estimated amounts accrued.
25
COSAN LIMITED
Notes to the condensed consolidated financial statements (Continued)
(In thousands of U.S. dollars, unless otherwise stated)
| 9. | Estimated liability for legal proceedings and labor claims and commitments (Continued) |
Judicial deposits recorded by Cosan under non-current assets, amounting to US$104,527 at December 31, 2009 (US$73,975 at March 31, 2009) have been made for certain of these suits. Judicial deposits are restricted assets of Cosan placed on deposit with the court and held in judicial escrow pending legal resolution of the related legal proceedings. Judicial deposits include US$66,601 related to exposures of Cosan CL prior to its acquisition by Cosan. If the Company prevails in the defense of these exposures, these related judicial deposits must be refunded to the seller.
The tax contingencies as of December 31, 2009 and March 31, 2009 are described as follows:
| December 31, 2009 | March 31, 2009 | |||||||
| Credit premium – IPI | - | 116,256 | ||||||
| PIS and Cofins | 79,413 | 62,556 | ||||||
| IPI credits | 2,907 | 40,049 | ||||||
| Contribution to IAA | 44,833 | 36,672 | ||||||
| IPI – Federal VAT | 54,750 | 23,626 | ||||||
| ICMS credits | 33,243 | 19,966 | ||||||
| Compensation with Finsocial | 98,091 | 70,693 | ||||||
| Other | 61,419 | 60,524 | ||||||
| 374,656 | 430,342 | |||||||
On May 27, 2009, the paragraph 1st and 3rd of Brazilian Law No 9718/98 that regulated the collection of PIS and Cofins (federal tax contributions) on exchange variation and other financial income was revoked by Law No 11941/09. The Company is evaluating its ongoing judicial demands related to the legal obligations not paid related to the increase in the calculation basis of PIS and Cofins. Once the absence of errors or flaws in the ongoing demands is confirmed, the Company will revaluate the maintenance of the provision for the respective legal obligations in its financial statements.
Cosan S.A. and its subsidiaries opted to settle tax related claims in installments as provided by Brazilian Law No 11.941/09 and in MP 470/09. The Company and its subsidiaries used accumulated tax losses to pay the related fines and interest. Consequently there was a full reduction of the claims related to IPI tax credit, as well as the installment payment of other federal taxes, that were recorded as Taxes Payable (note 6).
26
COSAN LIMITED
Notes to the condensed consolidated financial statements (Continued)
(In thousands of U.S. dollars, unless otherwise stated)
| 9. | Estimated liability for legal proceedings and labor claims and commitments (Continued) |
In addition to the aforementioned claims, Cosan and its subsidiaries are involved in other contingent liabilities relating to tax, civil and labor claims and environmental matters, which have not been recorded, considering their current stage and the likelihood of unfavorable outcomes rated as possible. These claims are broken down as follows:
December 31, 2009 | March 31, 2009 | |||||||
| Withholding Income Tax | 95,055 | 69,730 | ||||||
| ICMS – State VAT | 135,302 | 77,052 | ||||||
| IAA - Sugar and Ethanol Institute | 42,565 | 31,610 | ||||||
| IPI - Federal Value-added tax | 174,389 | 100,722 | ||||||
| INSS | 1,247 | 795 | ||||||
| PIS and COFINS | 33,130 | 15,529 | ||||||
| Civil and labor | 136,233 | 94,599 | ||||||
| Other | 49,009 | 34,851 | ||||||
| 666,930 | 424,888 | |||||||
The subsidiary Cosan Açúcar e Álcool has several indemnification suits filed against the Federal Government. The suits relate to product prices that did not conform to the reality of the market, which were mandatorily established at the time the sector was under the Government‘s control.
In connection with one of these suits, a final and unappealable decision in the amount of US$149,121 was rendered in September 2006 in favor of the Company. This has been recorded as a gain in the statement of operations in 2007. Since the recorded amount is substantially composed of interest and monetary restatement, it was recorded in Financial income and in a non-current receivable on the balance sheet. In connection with the settlement process, the form of payment continues to be negotiated with the government.
The amount is subject to interest and inflation adjustment by an official index. Lawyers fees in the amount of US$18,783 relating to this suit have been recorded in General and administrative expenses in 2007 and remain unpaid at December 31, 2009.
At December 31, 2009, these receivables totaled US$190,343 and US$22,841 (US$139,700 and US$16,764 at March 31, 2009), corresponding to related suit and lawyers’ fees, respectively.
27
COSAN LIMITED
Notes to the condensed consolidated financial statements (Continued)
(In thousands of U.S. dollars, unless otherwise stated)
| 10. | Shareholders’ equity |
a. Capital
As of December 31, 2009 and March 31, 2009, Cosan Limited’s share capital consists of:
| Shareholder | Class A1 shares | % | Class B1 shares | % | ||||||||||||
| Queluz Holding Limited | 11,111,111 | 6.37 | 66,321,766 | 68.85 | ||||||||||||
| Usina Costa Pinto S.A. Açúcar e Álcool | - | - | 30,010,278 | 31.15 | ||||||||||||
| Aguassanta Participaçơes S.A. | 5,000,000 | 2.87 | - | - | ||||||||||||
| Gávea Funds | 33,333,333 | 19.12 | - | - | ||||||||||||
| Others | 124,910,897 | 71.64 | - | - | ||||||||||||
| Total | 174,355,341 | 100.00 | 96,332,044 | 100.0 | ||||||||||||
On September 19, 2008, Cosan S.A. undertook a capital subscription of 55,000,000 common shares which was completed on October 20, 2008. Since a number of the noncontrolling interests did not exercise their subscription rights, the Company acquired 54,993,482 of the shares for US$456,034, and the minority shareholders acquired the remaining 6,518 shares for US$50. In connection with this subscription, the shareholders received one Subscription Warrant (Warrant) for each new share. Each Warrant grants its holder the right to subscribe 0.6 common shares, with the distribution of fractional shares not being permitted. Therefore, the Company received Warrants, which are valid through December 31, 2009, to purchase 32,996,089 additional common shares of Cosan S.A.. Since Cosan S.A. is a consolidated subsidiary, the Warrants recorded by Cosan S.A. have been eliminated in consolidation.
On September 14, 2009, the Company sold to third parties 10,000,000 of the Warrants for US$14,362, which resulted in a gain which is recorded as financial income. The basis of the Warrants which were sold, amounting to US$4,594, has been reclassified from additional paid-in capital to noncontrolling interest. At December 31, 2009, 54,987,552 warrants have been exercised, of which 44,993,482 were exercised by the Company, 9,994,070 were exercised by noncontrolling shareholders and the remaining 12,448 warrants expired. The exercise of the warrants of Cosan S.A. resulted in the issuance of 32,992,531 common shares, valued at US$301,145. Of this amount, the Company received 26,996,089 common shares valued at US$267,753.
28
COSAN LIMITED
Notes to the condensed consolidated financial statements (Continued)
(In thousands of U.S. dollars, unless otherwise stated)
| 10. | Shareholders’ equity (Continued) |
In connection with the acquisition of Curupay, Cosan S.A. issued 44,300,389 new common shares (note 3). Since these shares were issued to noncontrolling interests, this diluted the Company’s ownership interest which resulted in an increase in additional paid-in capital of US$9,840.
| 11. | Deferred gain on sale of investments in subsidiaries |
Agrícola Ponte Alta S.A. is a subsidiary whose principal assets are land used for the growing of sugarcane for Cosan. On December 15, 2008, the shareholders approved a partial spin-off of the assets of Ponte Alta and created four new subsidiaries. Agricultural land was then transferred from Ponte Alta to each of the entities. On December 30, 2008, two of the entities, Nova Agrícola Ponte Alta S.A. and Terras da Ponte Alta S.A. were sold to Radar, an affiliate company accounted for by the equity method. The selling price was fair value, US$123,596, which resulted in a gain of US$47,080. This gain has previously been deferred since there were no lease contracts executed for the land, which was being used by Cosan for a monthly fee. During the current period the lease contracts were executed, and the gain is being amortized to profit and loss over the 19 year average term of the leases.
During the nine-month period ended December 31, 2009, Cosan S.A. has amortized a gain of US$2,464 related to this sale-leaseback transaction.
| 12. | Share-based compensation |
In the ordinary and extraordinary general meeting held on August 30, 2005, the guidelines for the outlining and structuring of a stock option plan for Cosan S.A. officers and employees were approved, thus authorizing the issue of up to 5% of shares comprising Cosan S.A.’s share capital. This stock option plan was outlined to attract and retain services rendered by officers and key employees, offering them the opportunity to become shareholders of Cosan S.A. On September 22, 2005, Cosan S.A.’s board of directors approved the distribution of stock options corresponding to 4,302,780 common shares to be issued or purchased by Cosan S.A. related to 3.25% of the share capital at the time, authorized by the annual/extraordinary meeting. The remaining 1.75% remained to be distributed. On September 22, 2005, the officers and key employees were informed regarding the key terms and conditions of the share-based compensation arrangement.
29
COSAN LIMITED
Notes to the condensed consolidated financial statements (Continued)
(In thousands of U.S. dollars, unless otherwise stated)
| 12. | Share-based compensation (Continued) |
According to the fair value at the grant date, the exercise price is US$2.64 per share which does not include any discount. The exercise price was calculated before the valuation mentioned above based on an expected private equity deal which did not occur. Options may be exercised after a one-year vesting period starting November 18, 2005, at the maximum percentage of 25% per year of the total stock options offered by Cosan S.A. The options for each 25% have a five-year period to be exercised.
On September 11, 2007, the board of directors approved an additional distribution of stock options, in connection with the stock option plan mentioned above, corresponding to 450,000 common shares to be issued or purchased by Cosan S.A. related to 0.24% of the share capital at September 22, 2005. The remaining 1.51% may still be distributed.
On August 7, 2009, the board of directors approved an additional distribution of stock options, in connection with the stock option plan mentioned above, corresponding to 165,657 common shares to be issued or purchased by Cosan S.A. Such options were issued without a vesting period, therefore the intrinsic value at grant date was the basis for calculating the fair value of the options, at US$9,82 per option, and an expense of US$1,071 was fully recorded by the company.
The exercise of options may be settled only through issuance of new common shares or treasury shares.
The employees that leave Cosan S.A. before the vesting period will forfeit 100% of their rights. However, if the employment is terminated by Cosan S.A. without cause, the employees will have the right to exercise 100% of their options of that particular year plus the right to exercise 50% of the options of the following year.
The fair value of share-based awards was estimated using a binominal model with the following assumptions:
| Options granted on September 22, 2005 | Options granted on September 11, 2007 | |||||||
| Grant price - in U.S. dollars | 3.51 | 3.51 | ||||||
| Expected life (in years) | 7.5 | 7.5 | ||||||
| Interest rate | 14.52 | % | 9.34 | % | ||||
| Volatility | 34.00 | % | 46.45 | % | ||||
| Dividend yield | 1.25 | % | 1.47 | % | ||||
| Weighted-average fair value at grant date - in U.S. dollars | 7.09 | 10.45 | ||||||
As of December 31, 2009, the amount of US$ 1,832 related to the unrecognized compensation cost related to stock options is expected to be recognized in 12 months.
30
COSAN LIMITED
Notes to the condensed consolidated financial statements (Continued)
(In thousands of U.S. dollars, unless otherwise stated)
| 12. | Share-based compensation (Continued) |
As of December 31, 2009 there were 670,976 options outstanding with a weighted-average exercise price of US$3.51.
| 13. | Fair value measurements |
Effective May 1, 2008, Cosan adopted ASC 820, Fair Value Measurements (SFAS 157), for all financial instruments and non-financial instruments accounted for at fair value on a recurring basis. ASC 820 establishes a new framework for measuring fair value and expands related disclosures. Broadly, the ASC 820 framework requires fair value to be determined based on the exchange price that would be received for an asset or paid to transfer a liability (an exit price) in the principal or most advantageous market for the asset or liability in an orderly transaction between market participants. ASC 820 establishes market or observable inputs as the preferred source of values, followed by assumptions based on hypothetical transactions in the absence of market inputs.
The valuation techniques required by ASC 820 are based upon observable and unobservable inputs. Observable inputs reflect market data obtained from independent sources, while unobservable inputs reflect market assumptions. These two types of inputs create the following fair value hierarchy:
Level 1 - Quoted prices for identical instruments in active markets.
Level 2 - Quoted prices for similar instruments in active markets; quoted prices for identical or similar instruments in markets that are not active; and model-derived valuations whose inputs are observable or whose significant value drivers are observable.
Level 3 - Significant inputs to the valuation model are unobservable.
The following section describes the valuation methodologies Cosan uses to measure different financial instruments at fair value.
31
COSAN LIMITED
Notes to the condensed consolidated financial statements (Continued)
(In thousands of U.S. dollars, unless otherwise stated)
| 13. | Fair value measurements (Continued) |
Derivatives
Cosan uses closing prices for derivatives included in Level 1, which are traded either on exchanges or liquid over-the-counter markets.
The remainder of the derivatives portfolio is valued using internal models, most of which are primarily based on market observable inputs including interest rate curves and both forward and spot prices for currencies and commodities. Derivative assets and liabilities included in Level 2 primarily represent interest rate swaps, foreign currency swaps and commodity forward contracts.
The following table presents our assets and liabilities measured at fair value on a recurring basis at December 31, 2009.
| Level 1 | Level 2 | Total | ||||||||||
| Assets | ||||||||||||
| Derivatives | 5,319 | 36,040 | 41,359 | |||||||||
| Total | 5,319 | 36,040 | 41,359 | |||||||||
| Liabilities | ||||||||||||
| Derivatives | 90,669 | 43,081 | 133,750 | |||||||||
| Total | 90,669 | 43,081 | 133,750 | |||||||||
| 14. | Segment information |
a. Segment information
The following information about segments is based upon information used by Cosan’s senior management to assess the performance of operating segments and decide on the allocation of resources. Cosan’s reportable segments are business units in Brazil that target different industry segments. Each reportable segment is managed separately because of the need to specifically address customer needs in these different industries. Cosan has four segments: sugar, ethanol, fuel distribution and others group. The operations of these segments are based solely in Brazil.
32
COSAN LIMITED
Notes to the condensed consolidated financial statements (Continued)
(In thousands of U.S. dollars, unless otherwise stated)
| 14. | Segment information (Continued) |
a. Segment information (Continued)
The sugar segment mainly operates and produces a broad variety of sugar products, including raw (also known as very high polarization - VHP sugar), organic, crystal and refined sugars, and sells these products to a wide range of customers in Brazil and abroad. Cosan exports the majority of the sugar produced through international commodity trading companies. Cosan’s domestic customers include wholesale distributors, food manufacturers and retail supermarkets, through which it sells its “Da Barra” and “União” branded products.
The ethanol segment substantially produces and sells fuel ethanol, both hydrous and anhydrous (which has a lower water content than hydrous ethanol) and industrial ethanol. Cosan’s principal ethanol product is fuel ethanol, which is used both as an automotive fuel and as an additive in gasoline, and is mainly sold in the domestic market by fuel distribution companies. Consumption of hydrous ethanol in Brazil is increasing as a result of the introduction of flex fuel vehicles that can run on either gasoline or ethanol (or a combination of both) to the Brazilian market in 2003. In addition, Cosan sells liquid and gel ethanol products used mainly in the production of paint and cosmetics and alcoholic beverages for industrial clients in various sectors.
With the acquisition of Cosan CL a new fuel distribution segment has been created. The fuel distribution segment is engaged in the distribution in Brazil of oil products, ethanol and lubricants as well as the operation of convenience stores. The network to which the fuel distribution segment distributes such products is comprised of more than 1,500 service stations.
The accounting policies underlying the financial information provided for the segments are based on Brazilian GAAP. We evaluate segment performance based on information generated from the statutory accounting records.
Others segment is comprised by selling cogeneration of electricity, diesel and corporate activities.
No asset information is provided by reportable segment due to the fact that the majority of the assets used in production of sugar and ethanol are the same.
33
COSAN LIMITED
Notes to the condensed consolidated financial statements (Continued)
(In thousands of U.S. dollars, unless otherwise stated)
| 14. | Segment information (Continued) |
a. Segment information (Continued)
Measurement of segment profit or loss and segment assets
Cosan S.A. evaluates performance and allocates resources based on return on capital and profitable growth. The primary measurement used by management to measure the financial performance of Cosan S.A. is adjusted EBIT (earnings before interest and taxes excluding special items such as impairment and restructuring, integration costs, one-time gains or losses on sales of assets, acquisition, and other items similar in nature). The accounting policies of the reportable segments are the same as those described in the summary of significant accounting policies.
December 31, 2009 | January 31, 2009 | |||||||
| Net sales — Brazilian GAAP | ||||||||
| Sugar | 1,154,354 | 624,617 | ||||||
| Ethanol | 591,640 | 402,199 | ||||||
| Fuel distribution | 3,913,405 | 749,011 | ||||||
| Others | 182,365 | 104,341 | ||||||
| Total | 5,841,764 | 1,880,168 | ||||||
| Reconciling items to U.S. GAAP | ||||||||
| Sugar | 4,113 | 777 | ||||||
| Fuel distribution | (408 | ) | 239 | |||||
| Total | 3,705 | 1,016 | ||||||
| Total net sales | 5,845,469 | 1,881,184 | ||||||
34
COSAN LIMITED
Notes to the condensed consolidated financial statements (Continued)
(In thousands of U.S. dollars, unless otherwise stated)
| 14. | Segment information (Continued) |
a. Segment information (Continued)
Measurement of segment profit or loss and segment assets (Continued)
December 31, 2009 | January 31, 2009 | |||||||
| Segment operating income (loss) - Brazilian GAAP | ||||||||
| Sugar | 75,794 | 5,970 | ||||||
| Ethanol | 28,735 | 3,844 | ||||||
| Fuel distribution | 80,951 | (5,565 | ) | |||||
| Others | 8,762 | 681 | ||||||
| Operating income (loss) — Brazilian GAAP | 194,242 | 4,930 | ||||||
| Reconciling items to U.S. GAAP | ||||||||
| Depreciation and amortization expenses | ||||||||
| Sugar | (32,619 | ) | (29,125 | ) | ||||
| Ethanol | (18,667 | ) | (18,754 | ) | ||||
| Fuel distribution | (2,702 | ) | - | |||||
| Others | (5,525 | ) | (3,998 | ) | ||||
| (59,513 | ) | (51,877 | ) | |||||
| Other adjustments | ||||||||
| Sugar | 5,024 | (13,068 | ) | |||||
| Ethanol | 2,667 | (8,415 | ) | |||||
| Fuel distribution | (2,415 | ) | 38 | |||||
| Others | 713 | (1,793 | ) | |||||
| 5,989 | (23,238 | ) | ||||||
| Total sugar | 48,199 | (36,223 | ) | |||||
| Total ethanol | 12,735 | (23,325 | ) | |||||
| Fuel distribution | 75,834 | (5,527 | ) | |||||
| Total others | 3,950 | (5,110 | ) | |||||
| Operating income (loss) — U.S. GAAP | 140,718 | (70,185 | ) | |||||
35
COSAN LIMITED
Notes to the condensed consolidated financial statements (Continued)
(In thousands of U.S. dollars, unless otherwise stated)
| 14. | Segment information (Continued) |
b. Sales by principal customers
Sugar
The following table sets forth the amount of sugar that we sold to our principal customers during the nine-month period ended December 31, 2009 and January 31, 2009 as a percentage of either domestic or international sales of sugar:
Market | Customer | December 31, 2009 | January 31, 2009 | |||||||
| International | Sucres et Denrées | 21 | % | 15.2 | % | |||||
| Ceval Internacional Limited | 9 | % | - | |||||||
| Cargill Incorporation Ltd. | 5 | % | - | |||||||
| Cargill International S.A. | 4 | % | 6.4 | % | ||||||
| Coimex Trading Ltd | 8 | % | 5.8 | % | ||||||
| Ableman Trading Limited | 4 | % | 5.5 | % | ||||||
| Fluxo – Cane Overseas Ltd | 1 | % | 24.2 | % | ||||||
| Tate & Lyle International | 1 | % | 8.7 | % | ||||||
Ethanol
The following table sets forth the amount of ethanol that we sold to our principal customers during the nine-month period ended December 31, 2009 and January 31, 2009 as a percentage of either domestic or international sales of ethanol:
| Market | Customer | December 31, 2009 | January 31, 2009 | |||||||
| International | Vertical UK LLP | 10 | % | 16.6 | % | |||||
| Kolmar Petrochemicals | 5 | % | - | |||||||
| Morgan Stanley Capital Group Inc. | 5 | % | 3.5 | % | ||||||
| Alcotra S.A. | 3 | % | 1.1 | % | ||||||
| Sekab Biofuels & Chemicals | 2 | % | 6.3 | % | ||||||
| Vitol Inc. | - | 2.2 | % | |||||||
| Bauche Energy SA - Buyer | 4 | % | 2.2 | % | ||||||
| Bauche Energy Br Com Imp Exp Ltda. | - | 1.9 | % | |||||||
| Astra Oil Company LLC | 4 | % | - | |||||||
| Domestic | Shell Brasil Ltda. | 18 | % | 18.2 | % | |||||
| Petrobrás Distribuidora S.A. | 12 | % | 7.4 | % | ||||||
| Cia Brasileira de Petróleo Ipiranga | 9 | % | 5.4 | % | ||||||
| Euro Petróleo do Brasil Ltda. | 6 | % | 12.5 | % | ||||||
| Alesat Combustíveis S.A. | 5 | % | 3.2 | % | ||||||
| Chevron Brasil Ltda. | 1 | % | 3.2 | % | ||||||
| Cia Nacional de Alcool | 3 | % | - | |||||||
36
COSAN LIMITED
Notes to the condensed consolidated financial statements (Continued)
(In thousands of U.S. dollars, unless otherwise stated)
| 14. | Segment information (Continued) |
b. Sales by principal customers (Continued)
Fuel distribution
The following table sets forth the amount of fuel distribution that we sold to our principal customers during the nine-month period ended December 31, 2009 as a percentage of either domestic or international sales of fuel distribution:
| Market | Customer | December 31, 2009 | January 31, 2009 | |||||||
| Domestic | Mime Distribuidora de Petróleo Ltda. | 2 | % | 1.5 | % | |||||
| Tam Linhas Aéreas S.A. | 1 | % | 3.6 | % | ||||||
| All – América Latina Logística Malha Sul S.A. | 1 | % | - | |||||||
| Auto Posto Túlio Ltda. | 1 | % | 1.2 | % | ||||||
| Posto Iccar Ltda. | 1 | % | 1.2 | % | ||||||
| Iberia L.A.E. | - | 1.1 | % | |||||||
| 15. | Subsequent events |
IFC – International Finance Corporation (“IFC”)
On January 15, 2009, the Company fully paid the debt with IFC, in the amount of US$51,838, with final maturity date in January, 2013.
37
Cosan S.A. Indústria e Comércio
Condensed Consolidated Financial Statements
For the nine-month periods ended December 31, 2009 and January 31, 2009
COSAN S.A. INDÚSTRIA E COMÉRCIO
CONDENSED CONSOLIDATED FINANCIAL STATEMENTS
CONTENTS
| Report of independent registered public accounting firm | 1 |
| Condensed consolidated balance sheets | 2 |
| Condensed consolidated statements of operations | 4 |
| Condensed consolidated statements of shareholders’ equity and comprehensive | |
| income (loss) | 5 |
| Condensed consolidated statements of cash flows | 6 |
| Notes to the condensed consolidated financial statements | 7 |
Report of independent registered public accounting firm
To the Board of Directors and Shareholders of
Cosan S.A. Indústria e Comércio
We have reviewed the condensed consolidated balance sheet of Cosan S.A. Indústria e Comércio and subsidiaries as of December 31, 2009, the related condensed consolidated statements of operations and cash flows for the nine-month periods ended December 31, 2009 and January 31, 2009 and the condensed consolidated statement of shareholders’ equity and comprehensive income (loss) for the nine-month period ended December 31, 2009. These financial statements are the responsibility of the Company's management.
We conducted our review in accordance with the standards of the Public Company Accounting Oversight Board (United States). A review of interim financial information consists principally of applying analytical procedures and making inquiries of persons responsible for financial and accounting matters. It is substantially less in scope than an audit conducted in accordance with the standards of the Public Company Accounting Oversight Board, the objective of which is the expression of an opinion regarding the financial statements taken as whole. Accordingly, we do not express such an opinion.
Based on our review, we are not aware of any material modifications that should be made to the condensed consolidated financial statements referred to above for them to be in conformity with U.S. generally accepted accounting principles.
We have previously audited, in accordance with the standards of the Public Company Accounting Oversight Board (United States), the consolidated balance sheet of Cosan S.A. Indústria e Comércio and subsidiaries as of March 31, 2009, and the related consolidated statements of operations, shareholders’ equity and cash flows for the eleven-month period then ended not presented herein and in our report dated June 19, 2009, we expressed an unqualified opinion on those consolidated financial statements. In our opinion, the information set forth in the accompanying condensed consolidated balance sheet as of March 31, 2009, is fairly stated, in all material respects, in relation to the consolidated balance sheet from which it has been derived.
| São Paulo, Brazil | ERNST & YOUNG | |
| January 31, 2010 | Auditores Independentes S.S. | |
| CRC2SP015199/O-8 | ||
| Luiz Carlos Nannini | ||
| Accountant CRC 1SP171638/O-7 |
1
COSAN S.A. INDÚSTRIA E COMÉRCIO
Condensed consolidated balance sheets
December 31, 2009 and March 31, 2009
(In thousands of U.S. dollars, except share data)
(Unaudited) December 31, | March 31, | |||||||
| 2009 | 2009 | |||||||
| Assets | ||||||||
| Current assets: | ||||||||
| Cash and cash equivalents | 496,254 | 310,710 | ||||||
| Restricted cash | 98,811 | 5,078 | ||||||
| Derivative financial instruments | 41,359 | 7,352 | ||||||
| Trade accounts receivable, less allowances: December 31, 2009 – $32,508; March 31, 2009 – $21,241 | 293,533 | 258,863 | ||||||
| Inventories | 1,112,331 | 477,793 | ||||||
| Advances to suppliers | 138,550 | 88,991 | ||||||
| Recoverable taxes | 176,778 | 114,641 | ||||||
| Other current assets | 54,025 | 62,145 | ||||||
| 2,411,641 | 1,325,573 | |||||||
| Property, plant, and equipment, net | 3,585,821 | 2,114,188 | ||||||
| Goodwill | 1,551,984 | 803,270 | ||||||
| Intangible assets, net | 253,560 | 228,950 | ||||||
| Accounts receivable from federal government | 190,343 | 139,700 | ||||||
| Judicial deposits | 104,527 | 73,975 | ||||||
| Other non-current assets | 511,779 | 277,028 | ||||||
| 6,198,014 | 3,637,111 | |||||||
| Total assets | 8,609,655 | 4,962,684 | ||||||
2
(Unaudited) December 31, | March 31, | |||||||
| 2009 | 2009 | |||||||
| Liabilities and shareholders’ equity | ||||||||
| Current liabilities: | ||||||||
| Trade accounts payable | 408,993 | 197,009 | ||||||
| Taxes payable | 115,426 | 69,273 | ||||||
| Salaries payable | 76,367 | 40,237 | ||||||
| Current portion of long-term debt | 517,361 | 630,260 | ||||||
| Derivative financial instruments | 133,750 | 28,894 | ||||||
| Other liabilities | 111,044 | 47,946 | ||||||
| 1,362,941 | 1,013,619 | |||||||
| Long-term liabilities: | ||||||||
| Long-term debt | 2,799,224 | 1,246,994 | ||||||
| Estimated liability for legal proceedings and labor claims | 464,818 | 497,648 | ||||||
| Taxes payable | 220,553 | 149,621 | ||||||
| Due to Cosan Limited | - | 175,000 | ||||||
| Deferred income taxes | 245,401 | 40,377 | ||||||
| Other long-term liabilities | 163,738 | 116,429 | ||||||
| 3,893,734 | 2,226,069 | |||||||
| Shareholders’ equity | ||||||||
| Cosan shareholders’ equity: | ||||||||
| Common stock, no par value. Authorized 406,543,317 shares; issued and outstanding 406,543,317 at December 31, 2009 and 328,284,884 shares at March 31, 2009 | 2,419,844 | 1,945,741 | ||||||
| Treasury stock | (1,979 | ) | (1,979 | ) | ||||
| Common stock warrants | - | 25,273 | ||||||
| Additional paid-in capital | 379,648 | 167,610 | ||||||
| Accumulated other comprehensive income (accumulated loss) | 380,015 | (280,888 | ) | |||||
| Retained earnings (losses) | 143,057 | (146,099 | ) | |||||
| Equity attributable to shareholders of Cosan | 3,320,585 | 1,709,658 | ||||||
| Equity attributable to noncontrolling interests | 32,395 | 13,338 | ||||||
| Total shareholders’ equity | 3,352,980 | 1,722,996 | ||||||
| Total liabilities and shareholders' equity | 8,609,655 | 4,962,684 | ||||||
See accompanying notes to condensed consolidated financial statements.
3
COSAN S.A. INDÚSTRIA E COMÉRCIO
Condensed consolidated statements of operations
Nine-month period ended December 31, 2009 and January 31, 2009
(In thousands of U.S. dollars, except share data)
(Unaudited)
| December 31, | January 31, | |||||||
| 2009 | 2009 | |||||||
| Net sales | 5,845,469 | 1,881,184 | ||||||
| Cost of goods sold | (5,179,260 | ) | (1,666,035 | ) | ||||
| Gross profit | 666,209 | 215,149 | ||||||
| Selling expenses | (345,159 | ) | (168,561 | ) | ||||
| General and administrative expenses | (175,801 | ) | (110,223 | ) | ||||
| Operating income (loss) | 145,249 | (63,635 | ) | |||||
| Other income (expenses): | ||||||||
| Financial income | 84,953 | 271,475 | ||||||
| Financial expenses | 91,154 | (621,463 | ) | |||||
| Gain on tax recovery program | 121,554 | - | ||||||
| Other | 26,882 | (4,978 | ) | |||||
| Income (loss) before income taxes and equity in income (loss) of affiliates | 469,792 | (418,601 | ) | |||||
| Income taxes benefit (expense) | (178,298 | ) | 115,964 | |||||
| Income (loss) before equity in income (loss) of affiliates | 291,494 | (302,637 | ) | |||||
| Equity income (loss) of affiliates | (5,413 | ) | 6,400 | |||||
| Net income (loss) | 286,081 | (296,237 | ) | |||||
| Net (income) loss attributable to noncontrolling interests | 3,075 | (2,395 | ) | |||||
| Net income (loss) attributable to Cosan | 289,156 | (298,632 | ) | |||||
| Per-share amounts attributable to Cosan | ||||||||
| Net income (loss) | ||||||||
| Basic | 0.79 | (1.01 | ) | |||||
| Diluted | 0.78 | (1.01 | ) | |||||
| Weighted number of shares outstanding | ||||||||
| Basic | 365,931,831 | 295,303,737 | ||||||
| Diluted | 370,136,214 | 295,303,737 | ||||||
See accompanying notes to condensed consolidated financial statements.
4
COSAN S.A. INDÚSTRIA E COMÉRCIO
Condensed consolidated statements of shareholders’ equity and comprehensive income (loss)
Nine-month period ended December 31, 2009
(In thousands of U.S. dollars, except share data)
(Unaudited)
| Retained | Accumulated | |||||||||||||||||||||||||||||||||||||||||||
| Common stock | Treasury stock | Common stock | Additional | earnings | other | Non | Total | |||||||||||||||||||||||||||||||||||||
| warrants | paid-in | (accumulated | comprehensive | controlling | Shareholders | |||||||||||||||||||||||||||||||||||||||
| shares | Amount | Shares | Amount | Number | Amount | capital | loss) | income (loss) | interest | equity | ||||||||||||||||||||||||||||||||||
| Balances at March 31, 2009 | 328,284,884 | 1,945,741 | 343,139 | (1,979 | ) | 55,000,000 | 25,273 | 167,610 | (146,099 | ) | (280,888 | ) | 13,338 | 1,722,996 | ||||||||||||||||||||||||||||||
| Acquisition of Teaçu | - | - | - | - | - | - | 60,009 | - | - | 68,285 | 128,294 | |||||||||||||||||||||||||||||||||
| Issuance of common shares in business combination | 44,300,389 | 169,553 | - | - | - | - | 123,557 | - | - | (62,476 | ) | 230,634 | ||||||||||||||||||||||||||||||||
| Exercise of stock options | 965,513 | 13,857 | - | - | - | - | (10,576 | ) | - | - | - | 3,281 | ||||||||||||||||||||||||||||||||
| Exercise of common stock warrants | 32,992,531 | 290,693 | - | - | (55,000,000 | ) | (25,273 | ) | 35,725 | - | - | - | 301,145 | |||||||||||||||||||||||||||||||
| Acquisition of TEAS | - | - | - | - | - | - | - | - | - | 9,076 | 9,076 | |||||||||||||||||||||||||||||||||
| Share based compensation | - | - | - | - | - | - | 3,323 | - | - | - | 3,323 | |||||||||||||||||||||||||||||||||
| Net income | - | - | - | - | - | - | - | 289,156 | - | (3,075 | ) | 286,081 | ||||||||||||||||||||||||||||||||
| Pension plan | - | - | - | - | - | - | - | - | (133 | ) | - | (133 | ) | |||||||||||||||||||||||||||||||
| Currency translation adjustment | - | - | - | - | - | - | - | - | 661,036 | 7,247 | 668,283 | |||||||||||||||||||||||||||||||||
| Total comprehensive income | 957,554 | |||||||||||||||||||||||||||||||||||||||||||
| Balances at December 31, 2009 | 406,543,317 | 2,419,844 | 343,139 | (1,979 | ) | - | - | 379,648 | 143,057 | 380,015 | 32,395 | 3,352,980 | ||||||||||||||||||||||||||||||||
See accompanying notes to condensed consolidated financial statements.
5
COSAN S.A. INDÚSTRIA E COMÉRCIO
Condensed consolidated statements of cash flows
Nine-month period ended December 31, 2009 and January 31, 2009
(In thousands of U.S. dollars)
(Unaudited)
| December 31, | January 31, | |||||||
| 2009 | 2009 | |||||||
| Cash flow from operating activities | ||||||||
| Net (loss) income for the period attributable to Cosan | 289,156 | (298,632 | ) | |||||
| Adjustments to reconcile net income to cash provided by operating activities: | ||||||||
| Depreciation and amortization | 379,497 | 250,762 | ||||||
| Deferred income and social contribution taxes | 178,298 | (104,394 | ) | |||||
| Interest, monetary and exchange variation | (264,046 | )) | 465,168 | |||||
| Gain on tax recovery program | (112,162 | ) | - | |||||
| Others | (31,683 | ) | (36,699 | ) | ||||
| Decrease/increase in operating assets and liabilities | ||||||||
| Trade accounts receivable, net | 94,947 | 26,789 | ||||||
| Inventories | (288,984 | ) | (315,188 | ) | ||||
| Advances to suppliers | (4,520 | ) | (6,087 | ) | ||||
| Trade accounts payable | 55,264 | 59,980 | ||||||
| Derivative financial instruments | 67,138 | 62,483 | ||||||
| Taxes payable | (59,581 | ) | (14,173 | ) | ||||
| Other assets and liabilities, net | 28,291 | (41,644 | ) | |||||
| Net cash provided by (used in) operating activities | 331,615 | 48,365 | ||||||
| Cash flows from investing activities: | ||||||||
| Restricted cash | (92,059 | ) | 29,245 | |||||
| Marketable securities | - | 207,091 | ||||||
| Cash received from sales of noncurrent assets | 69,472 | - | ||||||
| Others | 8,409 | 69,026 | ||||||
| Acquisition of property, plant and equipment | (678,093 | ) | (444,960 | ) | ||||
| Acquisitions, net of cash acquired | (715,948 | ) | ||||||
| Net cash used in investing activities | (692,271 | ) | (855,546 | ) | ||||
| Cash flows from financing activities: | ||||||||
| Related parties | (262,340 | ) | - | |||||
| Proceeds from issuance of common stock | 304,426 | 456,084 | ||||||
| Treasury stock | - | (1,979 | ) | |||||
| Additions of long-term debts | 1,656,427 | 654,927 | ||||||
| Increase of capital in subsidiary for minority stockholders | - | 5,172 | ||||||
| Payments of long-term debts | (1,311,464 | ) | (103,169 | ) | ||||
| Other | - | 100 | ||||||
| Net cash provided by financing activities | 387,049 | 1,011,135 | ||||||
| Effect of exchange rate changes on cash and | ||||||||
| cash equivalents | 159,151 | (144,967 | ) | |||||
| Net increase in cash and cash equivalents | 185,544 | 58,987 | ||||||
| Cash and cash equivalents at beginning of period | 310,710 | 38,832 | ||||||
| Cash and cash equivalents at end of period | 496,254 | 97,819 | ||||||
| Supplemental cash flow information | ||||||||
| Cash paid during the period for: | ||||||||
| Interest | 146,042 | 70,897 | ||||||
| Income taxes | 2,189 | - | ||||||
| Non cash transaction | ||||||||
| Acquisition paid with equity | 321,087 | - | ||||||
See accompanying notes to condensed consolidated financial statements.
6
COSAN S.A. INDÚSTRIA E COMÉRCIO
Notes to the condensed consolidated financial statements
(In thousands of U.S. dollars, unless otherwise stated)
(Unaudited)
| 1. | Operations |
Cosan S.A. Indústria e Comércio and subsidiaries (“Cosan” or “the Company”) is incorporated under the laws of the Federative Republic of Brazil. Cosan shares are traded on the São Paulo Stock Exchange (Bovespa).
Cosan Limited, a company incorporated in Bermuda, is the controlling shareholder of Cosan, holding a 62.27% interest therein as of December 31, 2009 (68.89% as of March 31, 2009). The change in interest was mainly related to the issuance of shares for the acquisition of Curupay S.A. Participações (Note 3) and exercise of common stock warrants (Note 11). The class “A” common shares of Cosan Limited are traded on the New York Stock Exchange (NYSE) and Bovespa.
The companies included in the consolidated financial statements have as their primary activity the production of ethanol and sugar, and the marketing and distribution of fuel and lubricants in Brazil.
On April 23, 2008, the Company entered into an agreement with ExxonMobil International Holding B.V., or “Exxon”, for the acquisition of 100% of the outstanding shares of Esso Brasileira de Petróleo Ltda. and its subsidiaries (“Essobrás”), a distributor and seller of fuels and producer and seller of lubricants and specialty petroleum products of ExxonMobil in Brazil. On December 1, 2008 the Company completed the acquisition. On January 16, 2009 the Company changed the corporate name of Essobrás to Cosan Combustíveis e Lubrificantes S.A. (“Cosan CL”).
On August 29, 2008 the Company held an Annual and Special General Shareholders Meeting and unanimously approved the modification of the end of its fiscal year from April 30 to March 31 of each year. Therefore the income statement and cash flow information presented in these financial statements lack comparison to the prior period represented by the nine-month period ended January 31, 2009.
On August 28, 2008, the Company announced the incorporation of a new affiliate named Radar Propriedades Agrícolas S.A. (“Radar”), which engages in farm real estate investments in Brazil by identifying and acquiring rural properties likely to experience an increase in value and acquiring them for later leasing and/or sale. The initial capital contribution was US$185,000, of which US$35,000 was invested by Cosan (18.92%) and US$150,000 by another shareholder (81.08%). On August 25, 2009, an additional capital contribution of US$33,262, was approved, of which US$6,293 (18.92%) was invested by Cosan and the remainder by the other shareholder. On December 15, 2009, an additional capital contribution of US$8,911, was approved, of which US$1,659 (18.92%) was invested by Cosan and the remainder by the other shareholder.
7
COSAN S.A. INDÚSTRIA E COMÉRCIO
Notes to the condensed consolidated financial statements (Continued)
(In thousands of U.S. dollars, unless otherwise stated)
(Unaudited)
| 1. | Operations (Continued) |
On April 09, 2009, the Company entered into an agreement with Rezende Barbosa S.A. Administração e Participações (“Rezende Barbosa”) to acquire 100% of the outstanding shares of Teaçu Armazéns Gerais S.A. (“Teaçu”). Teaçu operates a port terminal concession in the city of Santos. See further discussion regarding this acquisition at Note 3.
On June 17, 2009, Cosanpar Participações S.A. (“Cosanpar”), a wholly-owned subsidiary of Cosan sold its equity interest in Jacta Participações S.A. (“Jacta”), a distributor of aviation fuel that was acquired in the Essobrás acquisition, to Shell Brasil Ltda. for US$59,234 cash. The results of operations of Jacta were recorded in the fuel distribution segment. The carrying value of the net assets sold was US$40,084, which resulted in a gain of US$19,150.
On June 18, 2009, the Company entered into an agreement with Rezende Barbosa to acquire 100% of the outstanding shares of Curupay S.A. Participações (“Curupay”). The principal investment of Curupay was 100% of the outstanding shares of Cosan Alimentos S.A. (former Nova América S.A. Agroenergia). Cosan Alimentos S.A. (“Cosan Alimentos”) is a producer of sugar, ethanol and energy co-generation which also operates in trading and logistics. See further discussion regarding this acquisition at Note 3.
On November 24, 2009, the Company entered into an agreement with Crystalsev Comércio e Representação Ltda and Plínio Nastari Consultoria e Participações Ltda to acquire 26,7% of the outstanding shares of TEAS Terminal Exportador de Álcool de Santos S.A. (“TEAS”). As a result, this increased its ownership percentage from 40.0% to 66.7% of the TEAS’s capital. TEAS operates a port terminal concession in the city of Santos. See further discussion regarding this acquisition at Note 3.
8
COSAN S.A. INDÚSTRIA E COMÉRCIO
Notes to the condensed consolidated financial statements (Continued)
(In thousands of U.S. dollars, unless otherwise stated)
(Unaudited)
| 2. | Presentation of the consolidated financial statements |
| a. | Basis of reporting for interim financial statements |
In the opinion of management, the unaudited condensed consolidated financial statements reflect all adjustments (consisting of normal recurring accruals) considered necessary for a fair presentation of the Company’s results for the periods presented. Interim results for the nine-month period ended December 31, 2009, are not necessarily indicative of the results that may be expected for the fiscal year.
The unaudited condensed consolidated financial statements include the accounts of Cosan and its subsidiaries. All significant intercompany transactions have been eliminated.
These financial statements should be read in conjunction with Cosan`s annual financial statements for the fiscal year ended March 31, 2009.
The accounts of Cosan and its subsidiaries are maintained in Brazilian reais, which is the functional currency. The accounts have been translated into U.S. dollars in accordance with Accounting Standards Codification 830 “Foreign Currency Matters”.
The exchange rate of the Brazilian real (R$) to the US$ was R$1.7412=US$ 1.00 at December 31, 2009 and R$2.3152=US$1.00 at March 31, 2009.
| b. | Use of estimates |
The preparation of condensed consolidated financial statements in conformity with U.S. GAAP requires management to make estimates and assumptions that affect the amounts reported in the condensed consolidated financial statements and accompanying notes. Actual results could differ from these estimates. These estimates and assumptions are reviewed and updated regularly to reflect recent experience.
9
COSAN S.A. INDÚSTRIA E COMÉRCIO
Notes to the condensed consolidated financial statements (Continued)
(In thousands of U.S. dollars, unless otherwise stated)
(Unaudited)
| 2. | Presentation of the consolidated financial statements (Continued) |
| c. | Recently issued accounting standards |
FASB Accounting Standards Codification
In September 2009, the Accounting Standards Codification (“ASC”) became the source of authoritative U.S. GAAP recognized by the Financial Accounting Standards Board (“FASB”) for nongovernmental entities, except for certain FASB Statements not yet incorporated into ASC. Rules and interpretive releases of the SEC under federal securities laws are also sources of authoritative U.S. GAAP for registrants. The authoritative guidance mentioned in these financial statements includes the applicable ASC reference.
Subsequent Events
We adopted ASC 855, Subsequent Events, which established general accounting standards and disclosure for subsequent events,during the nine-month period ended December 31, 2009. In accordance with ASC 855, the Company has evaluated subsequent events through January 31, 2010, the date the financial statements were issued.
Noncontrolling Interests
Effective April 1, 2009, the Company adopted new accounting guidance ASC 810, which changed the accounting for and the reporting of an entity’s minority ownership. Such minority ownership, previously referred to as minority interest, is now referred to as noncontrolling interests. The adoption of this guidance resulted in the reclassification of amounts previously attributable to minority interest and classified in the mezzanine outside of shareholders’ equity, to a separate component of stockholders’ equity titled “Noncontrolling Interests” in the accompanying condensed consolidated balance sheets and statement of changes in equity.
Additionally, net income and comprehensive income attributable to noncontrolling interests are shown separately from consolidated net income and comprehensive income in the accompanying condensed consolidated statements of operations and statements of changes in equity. Prior period financial statements have been reclassified to conform to the current year presentation as required by the authoritative guidance.
10
COSAN S.A. INDÚSTRIA E COMÉRCIO
Notes to the condensed consolidated financial statements (Continued)
(In thousands of U.S. dollars, unless otherwise stated)
(Unaudited)
| 2. | Presentation of the consolidated financial statements (Continued) |
| c. | Recently issued accounting standards (Continued) |
New Accounting Pronouncements
The following accounting standards have been issued, but as of December 31, 2009 are not yet effective and have not been adopted by the Company.
SFAS No. 166, Accounting for Transfers of Financial Assets – an amendment of FASB Statement No. 140 (“SFAS No. 166”)
In June 2009, the FASB issued SFAS No. 166, which removes the concept of a qualifying special-purpose entity (“QSPE”) from SFAS No. 140, Accounting for Transfers and Servicing of Financial Assets and Extinguishments of Liabilities-a replacement of FASB Statement No. 125. The QSPE concept had initially been established to facilitate off-balance sheet treatment for certain securitizations. SFAS No. 166 also removes the exception from applying FASB Interpretation (“FIN”) No. 46(R), Consolidation of Variable Interest Entities (“FIN No. 46(R)”), to QSPEs. SFAS No. 166 has not been incorporated into ASC and is effective for fiscal years beginning after November 15, 2009, or April 1, 2010 for Cosan. The Company does not believe the adoption of SFAS No. 166 will have a material impact on its financial statements.
11
COSAN S.A. INDÚSTRIA E COMÉRCIO
Notes to the condensed consolidated financial statements (Continued)
(In thousands of U.S. dollars, unless otherwise stated)
(Unaudited)
| 2. | Presentation of the consolidated financial statements (Continued) |
| c. | Recently issued accounting standards (Continued) |
New Accounting Pronouncements (Continued)
SFAS No. 167, Amendments to FASB Interpretation No. 46(R) (“SFAS No. 167”)
In June 2009, the FASB issued SFAS No. 167, which amends FIN 46(R) to among other things, require an entity to qualitatively rather than quantitatively assess the determination of the primary beneficiary of a variable interest entity (“VIE”). This determination should be based on whether the entity has 1) the power to direct matters that most significantly impact the activities of the VIE and 2) the obligation to absorb losses or the right to receive benefits of the VIE that could potentially be significant to the VIE. Other key changes include: the requirement for an ongoing reconsideration of the primary beneficiary, the criteria for determining whether service provider or decision maker contracts are variable interests, the consideration of kick-out and removal rights in determining whether an entity is a VIE, the types of events that trigger the reassessment of whether an entity is a VIE and the expansion of the disclosures previously required under FASB Staff Position (“FSP”) SFAS 140-4 and FIN 46(R), Disclosures by Public Entities (Enterprises) about Transfers of Financial Assets and Interests in Variable Interest Entities. SFAS No. 167 has not been incorporated into ASC and is effective for fiscal years beginning after November 15, 2009, or April 1, 2010 for Cosan. The Company does not believe the adoption of SFAS No. 166 will have a material impact on its financial statements.
SFAS No. 168, FASB Codification and the Hierarchy of GAAP (“SFAS No. 168”)
In June 2009, the FASB issued SFAS No. 168, which identifies the sources of accounting principles and the framework for selecting the principles used in the preparation of financial statements of nongovernmental entities that are presented in conformity with U.S. GAAP. SFAS No. 168 replaces SFAS No. 162, The Hierarchy of Generally Accepted Accounting Principles, and establishes the FASB Accounting Standards Codification (“the Codification”) as the single source of authoritative guidance recognized by the FASB. Under the Codification, all guidance carries an equal level of authority. SFAS No. 168 has not been incorporated into ASC and is effective for interim and annual periods ending after September 15, 2009, or the quarter ending September 30, 2009 for Cosan. We adopted this guidance effective July 1, 2009, with no impact on our consolidated results of operations or financial position.
12
COSAN S.A. INDÚSTRIA E COMÉRCIO
Notes to the condensed consolidated financial statements (Continued)
(In thousands of U.S. dollars, unless otherwise stated)
(Unaudited)
| 3. | Acquisitions |
| a. | Teaçu Armazéns Gerais S.A. |
On April 9, 2009, Cosan S.A. Indústria e Comércio, through its 90% owned subsidiary, Copsapar Participações S.A., which owns 100% of Novo Rumo Logística S.A. (“Novo Rumo”), acquired 100% of the outstanding shares of Teaçu Armazéns Gerais S.A. (“Teaçu”) from Rezende Barbosa S.A. Administração e Participações (“Rezende Barbosa”) for $52,985 cash and issuance of 90,736,131 shares of Novo Rumo, equivalent to 28.82% of its share capital. Teaçu holds a port concession in the city of Santos and operates a terminal dedicated to exporting sugar and other agricultural products. This acquisition combines the Santos port operations previously held separately by Cosan S.A. and Teaçu.
As a result of this transaction, Cosan S.A. reduced its indirect share ownership in Novo Rumo to 64.06%.
The acquisition-date fair value of the consideration transferred totaled $150,501, which consisted of the following:
| Cash | 52,985 | |||
| Common stock at estimated fair value | 97,516 | |||
| Total | 150,501 |
The fair value of the 90,736,131 common shares issued was provisionally determined at the acquisition date and is being reviewed in order to finalize the purchase price.
13
COSAN S.A. INDÚSTRIA E COMÉRCIO
Notes to the condensed consolidated financial statements (Continued)
(In thousands of U.S. dollars, unless otherwise stated)
(Unaudited)
| 3. | Acquisitions (Continued) |
a. Teaçu Armazéns Gerais S.A. (Continued)
The following table summarizes the estimated fair values of the assets acquired and liabilities assumed at the acquisition date. The company is in the process of obtaining valuations of certain intangible assets and fixed assets; thus, the provisional measurements of intangible assets, goodwill and deferred income tax assets are subject to change.
| Description | ||||
| Property, plant and equipment | 40,224 | |||
| Inventories | 973 | |||
| Other assets | 29,012 | |||
| Long-term debt including current installments | (18,780 | ) | ||
| Trade accounts payable | (361 | ) | ||
| Estimated liability for legal proceedings and labor claims | (976 | ) | ||
| Other liabilities | (1,922 | ) | ||
| Net assets acquired | 48,170 | |||
| Provisional purchase price, net of cash acquired | 150,222 | |||
| Goodwill | 102,052 | |||
The provisional goodwill of $102,052 arising from the acquisition, which will be substantially deductible for tax purposes, consists largely of the synergies and economies of scale expected from combining the port operations of Cosan S.A. and Teaçu. The provisional goodwill was assigned to the sugar segment.
The amounts of Teaçu’s revenue and earnings included in Cosan S.A.’s consolidated income statement for the nine-month period ended January 31, 2009, and the revenue and earnings of the combined entity had the acquisition date been May 1, 2008, are:
| Revenue | Earnings (loss) | |||||||
| Actual from April 9, 2009 – December 31, 2009 (*) | 29,067 | 3,315 | ||||||
| Supplemental pro forma from May 1, 2008 – January 31, 2009 | 1,902,726 | (296,895 | ) | |||||
(*) Revenues and earnings represent the full nine-month period ended December 31, 2009.
14
COSAN S.A. INDÚSTRIA E COMÉRCIO
Notes to the condensed consolidated financial statements (Continued)
(In thousands of U.S. dollars, unless otherwise stated)
(Unaudited)
| 3. | Acquisitions (Continued) |
b. Curupay S.A. Participações
On June 18, 2009, Cosan S.A. acquired 100% of the outstanding shares of Curupay S.A. Participações from Rezende Barbosa, through the issuance of 44,300,389 common shares valued at $7.25 per share (fair value at the acquisition date) and a total purchase price of US$321,087. The assets acquired include the non-controlling interest in Novo Rumo representing 28.82% of its outstanding shares which were issued in the Teaçu acquisition, and 100% of the outstanding shares of two operating companies, Nova América S.A. Trading and Cosan Alimentos (collectively referred to as “Nova América”). Nova América is a producer of sugar, ethanol and energy co-generation and also operates in trading and logistics.
With the acquisition of the noncontrolling interest of Novo Rumo, Cosan S.A. increased its share ownership in Novo Rumo to 92.88%. This transaction was a change in ownership interest without a loss of control and accounted for as a transaction in shareholders’ equity.
The following table summarizes the assets acquired and liabilities assumed in relation to Nova América. These amounts are preliminary as valuations of certain intangible assets, fixed assets and other assets and liabilities are currently in process.
| Description | ||||
| Property, plant and equipment | 370,651 | |||
| Noncontrolling interest in Novo Rumo | 62,476 | |||
| Inventories | 63,572 | |||
| Account receivables | 62,377 | |||
| Other assets | 251,267 | |||
| Long-term debt including current installments | (606,118 | ) | ||
| Trade accounts payable | (81,563 | ) | ||
| Related parties | (16,591 | ) | ||
| Estimated liability for legal proceedings and labor claims | (7,009 | ) | ||
| Taxes and contributions payable | (28,821 | ) | ||
| Other liabilities | (66,155 | ) | ||
| Net assets acquired | 4,086 | |||
| Purchase price, net of cash acquired | 294,605 | |||
| Goodwill | 290,519 | |||
15
COSAN S.A. INDÚSTRIA E COMÉRCIO
Notes to the condensed consolidated financial statements (Continued)
(In thousands of U.S. dollars, unless otherwise stated)
(Unaudited)
| 3. | Acquisitions (Continued) |
b. Curupay S.A. Participações (Continued)
The provisional goodwill of $290,519 arising from the acquisition consists largely of the synergies and economies of scale expected from combining the ethanol and sugar operations of Cosan S.A. and Nova America. US$207,285 of the provisional goodwill was assigned to the sugar segment and US$83,234 was assigned to the ethanol segment.
The amounts of Nova America’s revenue and earnings included in Cosan S.A.’s consolidated income statement for the nine-month period ended January 31, 2009, and the revenue and earnings of the combined entity had the acquisition date been May 1, 2008, are:
| Revenue | Earnings | |||||||
| Actual from June 18, 2009 – December 31, 2009 | 407,364 | 25,208 | ||||||
| Supplemental pro forma from April 1, 2009 – December 31, 2009 | 5,938,413 | 283,953 | ||||||
| Supplemental pro forma from May 1, 2008 – January 31, 2009 | 2,382,518 | (315,814 | ) | |||||
c. TEAS Terminal Exportador de Álcool de Santos S.A.
On November 24, 2009, the Company acquired, for $11,574 cash, an additional 26.7% interest, represented by 10,527,295 common shares, of TEAS Terminal Exportador de Álcool de Santos S.A. (“TEAS”) from Crystalsev Comércio e Representação Ltda and Plínio Nastari Consultoria e Participações Ltda. As a result of this transaction, Cosan S.A. increased its direct share ownership in TEAS from 40.0% to 66.7% and obtained control of TEAS. TEAS holds a port concession in the city of Santos and operates a terminal dedicated to exporting ethanol.
The acquisition date fair value of the consideration transferred totaled US$22,800, which consisted of the following:
| Cash | 11,574 | |||
| Acquisition date fair value of initial 40% investment (*) | 11,226 | |||
| Total | 22,800 |
(*) Provisionally calculated based on the book value, the Company is finalizing its fair value calculation of its previously held interest.
16
COSAN S.A. INDÚSTRIA E COMÉRCIO
Notes to the condensed consolidated financial statements (Continued)
(In thousands of U.S. dollars, unless otherwise stated)
(Unaudited)
| 3. | Acquisitions (Continued) |
c. TEAS Terminal Exportador de Álcool de Santos S.A. (Continued)
The following table summarizes the estimated fair values of the assets acquired and liabilities assumed at the acquisition date. The company is in the process of obtaining valuations of certain intangible assets and fixed assets; thus, the provisional measurements of intangible assets, fixed assets and goodwill are subject to change.
| Description | ||||
| Property, plant and equipment | 12,089 | |||
| Other assets | 489 | |||
| Trade accounts payable | (74 | ) | ||
| Other liabilities | (206 | ) | ||
| Fair value of non-controlling interest (*) | (3,574 | ) | ||
| Net assets acquired | 8,724 | |||
| Provisional purchase price, net of cash acquired | 12,917 | |||
| Goodwill | 4,193 | |||
(*) Provisionally calculated based on the book value, the Company is finalizing its fair value calculation of non controlling interest.
The provisional goodwill of $4,193 arising from the acquisition consists largely of the synergies and economies of scale expected from combining the port operations of Cosan S.A. and TEAS. The provisional goodwill was assigned to the ethanol segment.
The amounts of TEAS’s revenue and earnings included in Cosan S.A.’s consolidated income statement for the nine-month period ended January 31, 2009, and the revenue and earnings of the combined entity had the acquisition date been May 1, 2008, are:
| Revenue | Earnings | |||||||
| Actual from November 24, 2009 – December 31, 2009 | 100 | 18 | ||||||
| Supplemental pro forma from April 1, 2009 – December 31, 2009 | 5,848,212 | 289,341 | ||||||
| Supplemental pro forma from May 1, 2008 – January 31, 2009 | 1,883,948 | 298,420 | ||||||
17
COSAN S.A. INDÚSTRIA E COMÉRCIO
Notes to the condensed consolidated financial statements (Continued)
(In thousands of U.S. dollars, unless otherwise stated)
(Unaudited)
| 3. | Acquisitions (Continued) |
d. Logispot Armazens Gerais Ltda. (“Logispot”)
On November 12, 2009, Cosan S.A., through its subsidiary Rumo Logística S.A., acquired a 14.28% interest in Logispot, represented by 166,590 common shares, for $11,606 cash. Logispot is a logistics hub and warehouse based in the city of Sumaré.
| 4. | Derivative financial instruments |
Cosan enters into derivative financial instruments with various counterparties and uses derivatives to manage the overall exposures related to sugar price variations in the international market, interest rate and exchange rate variation. The instruments are commodity futures contracts, forward currency agreements, interest rate and foreign exchange swap contracts, and option contracts. Cosan recognizes all derivatives on the balance sheet at fair value.
The following table summarizes the notional value of derivative financial instruments as well as the related amounts recorded in balance sheet accounts:
| Notional amounts | Carrying value asset (liability) | |||||||||||||||
| December 31, 2009 | March 31, 2009 | December 31, 2009 | March 31, 2009 | |||||||||||||
| Commodities derivatives | ||||||||||||||||
| Future contracts: | ||||||||||||||||
| Purchase commitments - sugar | 66,214 | 61 | 1,939 | (4 | ) | |||||||||||
| Purchase commitments - oil | 43,692 | - | 2,228 | - | ||||||||||||
| Sell commitments | 375,602 | 182,943 | (42,948 | ) | 4,163 | |||||||||||
| Swap agreements | 56,594 | - | 3,630 | - | ||||||||||||
| Options: | ||||||||||||||||
| Purchased | 186,599 | - | 5,319 | - | ||||||||||||
| Written | 416,111 | 64,366 | (90,670 | ) | (2,906 | ) | ||||||||||
| Foreign exchange derivatives | ||||||||||||||||
| Forward contracts: | ||||||||||||||||
| Sale commitments | 298,435 | 184,653 | (132 | ) | (23,035 | ) | ||||||||||
| Swap agreements | ||||||||||||||||
| Swap agreements – Senior notes 2009 | - | 246,501 | (2,949 | ) | ||||||||||||
| Swap agreements – Interest Libor | 99,317 | - | 552 | - | ||||||||||||
| Future contracts | ||||||||||||||||
| Sale commitments | 331,048 | 372,230 | 17,698 | 3,189 | ||||||||||||
| Options | ||||||||||||||||
| Purchased | 559,673 | - | 9,993 | - | ||||||||||||
| Total assets | 41,359 | 7,352 | ||||||||||||||
| Total liabilities | (133,750 | ) | (28,894 | ) | ||||||||||||
18
COSAN S.A. INDÚSTRIA E COMÉRCIO
Notes to the condensed consolidated financial statements (Continued)
(In thousands of U.S. dollars, unless otherwise stated)
(Unaudited)
| 4. | Derivative financial instruments (Continued) |
When quoted market prices were not available, fair values were based on estimates using discounted cash flows or other valuation techniques.
| 5. | Inventories |
December 31, 2009 | March 31, 2009 | |||||||
| Finished goods: | ||||||||
| Sugar | 354,827 | 47,195 | ||||||
| Ethanol | 323,600 | 86,809 | ||||||
| Lubricants | 43,725 | 38,852 | ||||||
| Fuel (Gasoline, Diesel and Ethanol) | 124,100 | 74,582 | ||||||
| Others | 4,744 | 6,674 | ||||||
| 850,996 | 254,112 | |||||||
| Annual maintenance cost of growing crops | 179,849 | 167,576 | ||||||
| Others | 81,486 | 56,105 | ||||||
| 1,112,331 | 477,793 | |||||||
| 6. | Taxes payable |
December 31, 2009 | March 31, 2009 | |||||||
| Tax Recovery Program – Federal REFIS | - | 69,516 | ||||||
| Special Tax Payment Program – PAES | 250 | 28,912 | ||||||
| Tax Recovery from Brazilian Law No 11.941/09 and MP 470/09 | 180,722 | - | ||||||
| Income Tax and Social Contribution | 90,472 | 71,747 | ||||||
| Others | 64,535 | 48,719 | ||||||
| 335,979 | 218,894 | |||||||
| Current liabilities | (115,426 | ) | (69,273 | ) | ||||
| Long-term liabilities | 220,553 | 149,621 | ||||||
On May 27, 2009 and October 13, 2009, Law 11.941 and MP 470 were approved by the Brazilian government creating a tax recovery program, permitting the taxpayer to settle its federal tax debts, previous recovery programs, and other federal taxes under court discussions with discounts on previously charged penalties and interest and in installments.
19
COSAN S.A. INDÚSTRIA E COMÉRCIO
Notes to the condensed consolidated financial statements (Continued)
(In thousands of U.S. dollars, unless otherwise stated)
(Unaudited)
| 6. | Taxes payable (Continued) |
Additionally, it was permitted for the taxpayer to offset a portion of the penalties and interest due with its balance of income tax loss carry forwards. MP470 also allowed taxpayers to use tax losses to offset the principal balance related to IPI taxes (credit premium, note 9).
During the third quarter of 2009, Cosan S.A. and subsidiaries joined the tax recovery program and the following effects were recorded:
| Taxes payable and recorded contingencies | 423,753 | |||
| Gain on tax recovery programs | (121,554 | ) | ||
| Tax loss carryfowards | (117,105 | ) | ||
| Installments paid | (6,425 | ) | ||
| Interest | 2,052 | |||
| Payable as of December 31, 2009 | 180,722 |
The Company and its subsidiaries file income tax returns in the Brazilian federal jurisdiction. These subsidiaries are no longer subject to Brazilian federal income tax examinations by tax authorities for years before December 31, 2003.
Cosan accounts for unrecognized tax benefits in accordance with ASC 740, Accounting for Uncertainly in Income Taxes. A reconciliation of the beginning and ending amount of unrecognized tax benefits recorded as noncurrent taxes payable, is as follows:
| Balance at March 31, 2009 | 53,995 | |||
| Accrued interest on unrecognized tax benefit | 1,933 | |||
| Effect of foreign currency translation | 17,800 | |||
| Settlements | (37 | ) | ||
| Balance at December 31, 2009 | 73,691 |
It is possible that the amount of unrecognized tax benefits will change in the next twelve months, however, an estimate of the range of the possible change cannot be made at this time due to the long time to reach a settlement agreement or decision with the taxing authorities.
20
COSAN S.A. INDÚSTRIA E COMÉRCIO
Notes to the condensed consolidated financial statements (Continued)
(In thousands of U.S. dollars, unless otherwise stated)
(Unaudited)
| 7. | Long-term debt |
Long-term debt is summarized as follows:
Index | Average annual interest rate | December 31, 2009 | March 31, 2009 | |||||||||||
| Resolution No. 2471 (PESA) | IGP-M | 4.0% | 291,076 | 213,314 | ||||||||||
| Senior notes due 2009 | US Dollar | 9.0% | - | 37,343 | ||||||||||
| Senior notes due 2014 | US Dollar | 9.5% | 363,115 | - | ||||||||||
| Senior notes due 2017 | US Dollar | 7.0% | 411,589 | 404,589 | ||||||||||
| IFC | US Dollar | 7.4% | 52,227 | 49,379 | ||||||||||
| Perpetual notes | US Dollar | 8.3% | 455,304 | 455,304 | ||||||||||
| BNDES | TJLP | 2.6% | 485,167 | 99,561 | ||||||||||
| Promissory notes | DI | 3.0% | - | 501,888 | ||||||||||
| Export credit notes | DI | 2.4% | 192,096 | - | ||||||||||
| Export credit notes | DI | 8.8% | 101,093 | - | ||||||||||
| Credit notes | DI | 3.9% | 69,527 | - | ||||||||||
| Export pre-payment notes | US Dollar | Libor + 5.2% | 551,359 | - | ||||||||||
| Others | Various | Various | 344,032 | 115,876 | ||||||||||
| 3,316,585 | 1,877,254 | |||||||||||||
| Current portion | (517,361 | ) | (630,260 | ) | ||||||||||
| Long-term debt | 2,799,224 | 1,246,994 | ||||||||||||
Long-term debt has the following scheduled maturities:
| 2011 | 337,302 | ||||
| 2012 | 444,031 | ||||
| 2013 | 123,067 | ||||
| 2014 | 110,015 | ||||
| 2015 | 49,790 | ||||
| 2016 | 48,414 | ||||
| 2017 | 446,210 | ||||
| 2018 and thereafter | 1,240,395 | ||||
| 2,799,224 |
Resolution No. 2471 - Special Agricultural Financing Program (Programa Especial de Saneamento de Ativos), or PESA
To extend the repayment period of debts incurred by Brazilian agricultural producers, the Brazilian government passed Law 9.138 followed by Central Bank Resolution 2,471, which, together, formed the PESA program. PESA offered certain agricultural producers with certain types of debt the opportunity to acquire Brazilian treasury bills (“CTNs”) in an effort to restructure their agricultural debt. The face value of the Brazilian treasury bills was the equivalent of the value of the restructured debt and was for a term of 20 years.
21
COSAN S.A. INDÚSTRIA E COMÉRCIO
Notes to the condensed consolidated financial statements (Continued)
(In thousands of U.S. dollars, unless otherwise stated)
(Unaudited)
| 7. | Long-term debt (Continued) |
Resolution No. 2471 - Special Agricultural Financing Program (Programa Especial de Saneamento de Ativos), or PESA (Continued)
The acquisition price was calculated by the present value, discounted at a rate of 12% per year or at the equivalent of 10.4% of its face value. The CTNs were deposited as a guarantee with a financial institution and cannot be renegotiated until the outstanding balance is paid in full. The outstanding balance associated with the principal is adjusted in accordance with the IGP-M until the expiration of the restructuring term, which is also 20 years, at which point the debt will be discharged in exchange for the CTNs. Because the CTNs will have the same face value as the outstanding balance at the end of the term, it will not be necessary to incur additional debt to pay PESA debt.
On July 31, 2003, the Central Bank issued Resolution 3,114, authorizing the reduction of up to five percentage points of PESA related interest rates, effectively lowering the above-mentioned rates to 3%, 4% and 5%, respectively. The CTNs held by Cosan as of December 31, 2009 and March 31, 2009 amounted to US$111,756 and US$113,877, respectively, and are classified as Other non-current assets.
Senior notes due 2017
On January 26, 2007, the wholly-owned subsidiary Cosan Finance Limited issued US$400,000 of senior notes in the international capital markets. These senior notes, listed on the Luxembourg Stock Exchange, mature in November 2017 and bear interest at a rate of 7% per annum, payable semi-annually. The senior notes are guaranteed by Cosan, and its subsidiary, Cosan Açúcar e Álcool.
Senior notes due 2014
On August 4, 2009, the indirect subsidiary CCL Finance Limited issued US$ 350,000 of senior notes in the international capital markets. These senior notes, listed on the Luxembourg Stock Exchange, mature in August 2014 and bear interest at a rate of 9,5% per annum, payable semi-annually in February and August of each year, from February of 2010.
22
COSAN S.A. INDÚSTRIA E COMÉRCIO
Notes to the condensed consolidated financial statements (Continued)
(In thousands of U.S. dollars, unless otherwise stated)
(Unaudited)
| 7. | Long-term debt (Continued) |
Perpetual notes
On January 24 and February 10, 2006, Cosan issued perpetual notes which are listed on the Luxembourg Stock Exchange - EURO MTF. These notes bear interest at a rate of 8.25% per year, payable quarterly on May 15, August 15, November 15 and February 15 of each year, beginning May 15, 2006.
These notes may, at the discretion of Cosan, be redeemed on any interest payment date subsequent to February 15, 2011. The notes are guaranteed by Cosan and by Cosan Açúcar e Álcool.
Promissory Notes
On November 17, 2008, the Company issued one series of 44 registered promissory notes for US$613,941. The notes which are due in one year, will bear interest, due at maturity, at the average rates of DI - Interbank Deposits plus 3%.
On November 12, 2009, the Company fully paid this debt. At this date, the amount paid totaled US$703,801.
Export Pre-payment Notes
During the third quarter of 2009, the Company obtained funds from export pre-payment notes at the total amount of US$530,000. The export pre-payment notes are due from 2012 through 2014, and bear interest of Libor plus 5.2%
Covenants
Cosan and its subsidiaries are subject to certain restrictive covenants related to their indebtedness, including the following: limitation on transactions with shareholders and affiliated companies; limitation on payment of dividends and other payments affecting subsidiaries; and limitation on guarantees granted on assets.
At December 31, 2009, Cosan was in compliance with its debt covenants.
23
COSAN S.A. INDÚSTRIA E COMÉRCIO
Notes to the condensed consolidated financial statements (Continued)
(In thousands of U.S. dollars, unless otherwise stated)
(Unaudited)
| 8. | Related parties |
| Assets | ||||||||
December 31, 2009 | March 31, 2009 | |||||||
| Cosan Alimentos | - | 13,123 | ||||||
| Rezende Barbosa S.A. Administração e Participações | 90,296 | - | ||||||
| Vertical UK LLP | 2,152 | 11,597 | ||||||
| Others | 7,773 | - | ||||||
| 100,221 | 24,720 | |||||||
| Current (*) | (14,151 | ) | (24,720 | ) | ||||
| Noncurrent (*) | 86,070 | - | ||||||
| Liabilities | ||||||||
December 31, 2009 | March 31, 2009 | |||||||
| Cosan Limited | - | 175,307 | ||||||
| Nova América S.A. Agrícola | 14,541 | - | ||||||
| Logispot Armazéns Gerais S.A. | 8,610 | - | ||||||
| Others | 5,827 | 1,926 | ||||||
| 28,978 | 177,233 | |||||||
| Current (*) | (28,978 | ) | (2,233 | ) | ||||
| Noncurrent | - | 175,000 | ||||||
(*) included in other current and noncurrent assets or liabilities captions
Cosan conducts some of its operations through various joint ventures and other partnership forms which are principally accounted for using the equity method. The income statement includes the following amounts resulting from transactions with related parties:
December 31, 2009 | January 31, 2009 | |||||||
| Transactions involving assets | ||||||||
| Cash received due to the sale of finished products and assets and services held, net of payments | (109,642 | ) | (263,734 | ) | ||||
| Sale of finished products and services in a affiliated company | 98,320 | 109,423 | ||||||
| Sale of Buildings | - | 16,685 | ||||||
| Sale of Interest in subsidiaries | - | 147,709 | ||||||
| Added through acquisition | 73,338 | - | ||||||
| Transactions involving liabilities | ||||||||
| Payment of financial resources, net of funding | 27,560 | (3,036 | ) | |||||
| Cash received (payment) to Cosan Limited | (170,457 | ) | 213,179 | |||||
| Financial income (expense) | (41,573 | ) | 285 | |||||
The purchase and sale of products are carried out at arm’s length and unrealized profit or losses with consolidated companies have been eliminated.
24
COSAN S.A. INDÚSTRIA E COMÉRCIO
Notes to the condensed consolidated financial statements (Continued)
(In thousands of U.S. dollars, unless otherwise stated)
(Unaudited)
| 8. | Related parties (Continued) |
In addition, as of December 31, 2009, the Company and its subsidiaries lease 54,000 hectares (unaudited) of land (35,599 hectares (unaudited) in 2008) from affiliated companies. These leases are carried out on an arm’s length basis, and the rent is calculated based on sugarcane tons per hectare, valued according to price established by CONSECANA (São Paulo State Council of Sugarcane, Sugar and Ethanol Producers).
The amount receivable from Cosan Alimentos S.A. (“Cosan Alimentos”, former Nova América S.A. – Agroenergia) refered to an intercompany loan subject to interest equivalent to 100% of CDI.
A receivable of US$90,296 with Rezende Barbosa S.A. Administração e Participações related to credits assumed by Rezende Barbosa, in connection with the acquisition of Cosan Alimentos and intercompany loans at the annual interest rate equivalent to 9,25%.
The amount receivable from the affiliate Vertical UK LLP, located in British Virgin Islands, refers to ethanol trading, with an average maturity date of 30 days.
The payable to Cosan Limited related to Floating Rate Notes issued by Cosan CL., equivalent to US$175,000, with original maturity in 2018. Such balance bore variable interest equivalent to the quarterly Libor rate plus interest of 2.8% p.a., paid quarterly. On August 25, 2009, Cosan CL fully paid this debt with the proceeds from the issuance of the Senior Notes due 2014 (Note 7).
The payable to Logispot is related to the remaining payment in connection with the interest acquired. (Note 3)
During the nine-month period the Company executed lease contracts with Radar to formalize land leases that were already in existence, with an average lease term of 19 years. Total lease expense in the nine-month period was US$9,377.
25
COSAN S.A. INDÚSTRIA E COMÉRCIO
Notes to the condensed consolidated financial statements (Continued)
(In thousands of U.S. dollars, unless otherwise stated)
(Unaudited)
| 9. | Estimated liability for legal proceedings and labor claims and commitments |
December 31, 2009 | March 31, 2009 | |||||||
| Tax contingencies | 374,656 | 430,342 | ||||||
| Civil and labor contingencies | 90,162 | 67,306 | ||||||
| 464,818 | 497,648 | |||||||
Cosan and its subsidiaries are parties in various ongoing labor claims, civil and tax proceedings in Brazil arising in the normal course of its business. Respective provisions for contingencies were recorded considering those cases in which the likelihood of loss has been rated as probable. Management believes resolution of these disputes will have no effect significantly different than the estimated amounts accrued.
Judicial deposits recorded by Cosan under non-current assets, amounting to US$104,527 at December 31, 2009 (US$73,975 at March 31, 2009) have been made for certain of these suits. Judicial deposits are restricted assets of Cosan placed on deposit with the court and held in judicial escrow pending legal resolution of the related legal proceedings. Judicial deposits include US$66,601 related to exposures of Cosan CL prior to its acquisition by Cosan. If the Company prevails in the defense of these exposures, these related judicial deposits must be refunded to the seller.
The tax contingencies as of December 31, 2009 and March 31, 2009 are described as follows:
December 31, 2009 | March 31, 2009 | |||||||
| Credit premium – IPI | - | 116,256 | ||||||
| PIS and Cofins | 79,413 | 62,556 | ||||||
| IPI credits | 2,907 | 40,049 | ||||||
| Contribution to IAA | 44,833 | 36,672 | ||||||
| IPI – Federal VAT | 54,750 | 23,626 | ||||||
| ICMS credits | 33,243 | 19,966 | ||||||
| Compensation with Finsocial | 98,091 | 70,693 | ||||||
| Other | 61,419 | 60,524 | ||||||
| 374,656 | 430,342 | |||||||
26
COSAN S.A. INDÚSTRIA E COMÉRCIO
Notes to the condensed consolidated financial statements (Continued)
(In thousands of U.S. dollars, unless otherwise stated)
(Unaudited)
| 9. | Estimated liability for legal proceedings and labor claims and commitments (Continued) |
On May 27, 2009, the paragraph 1st and 3rd of Brazilian Law No 9718/98 that regulated the collection of PIS and Cofins (federal tax contributions) on exchange variation and other financial income was revoked by Law No 11941/09. The Company is evaluating its ongoing judicial demands related to the legal obligations not paid related to the increase in the calculation basis of PIS and Cofins. Once the absence of errors or flaws in the ongoing demands is confirmed, the Company will revaluate the maintenance of the provision for the respective legal obligations in its financial statements.
The Company and its subsidiaries opted to settle tax related claims in installments as provided by Brazilian Law No 11.941/09 and in MP 470/09. The Company and its subsidiaries used accumulated tax losses to pay the related fines and interest. Consequently there was a full reduction of the claims related to IPI tax credit, as well as the installment payment of other federal taxes, that were recorded as Taxes Payable (note 6).
In addition to the aforementioned claims, Cosan and its subsidiaries are involved in other contingent liabilities relating to tax, civil and labor claims and environmental matters, which have not been recorded, considering their current stage and the likelihood of unfavorable outcomes rated as possible. These claims are broken down as follows:
December 31, 2009 | March 31, 2009 | |||||||
| Withholding Income Tax | 95,055 | 69,730 | ||||||
| ICMS – State VAT | 135,302 | 77,052 | ||||||
| IAA - Sugar and Ethanol Institute | 42,565 | 31,610 | ||||||
| IPI - Federal Value-added tax | 174,389 | 100,722 | ||||||
| INSS | 1,247 | 795 | ||||||
| PIS and COFINS | 33,130 | 15,529 | ||||||
| Civil and labor | 136,233 | 94,599 | ||||||
| Other | 49,009 | 34,851 | ||||||
| 666,930 | 424,888 | |||||||
The subsidiary Cosan Açúcar e Álcool has several indemnification suits filed against the Federal Government. The suits relate to product prices that did not conform to the reality of the market, which were mandatorily established at the time the sector was under the Government‘s control.
27
COSAN S.A. INDÚSTRIA E COMÉRCIO
Notes to the condensed consolidated financial statements (Continued)
(In thousands of U.S. dollars, unless otherwise stated)
(Unaudited)
| 9. | Estimated liability for legal proceedings and labor claims and commitments (Continued) |
In connection with one of these suits, a final and unappealable decision in the amount of US$149,121 was rendered in September 2006 in favor of the Company. This has been recorded as a gain in the statement of operations in 2007. Since the recorded amount is substantially composed of interest and monetary restatement, it was recorded in Financial income and in a non-current receivable on the balance sheet. In connection with the settlement process, the form of payment continues to be negotiated with the government.
The amount is subject to interest and inflation adjustment by an official index. Lawyers fees in the amount of US$18,783 relating to this suit have been recorded in General and administrative expenses in 2007 and remain unpaid at December 31, 2009.
At December 31, 2009, these receivables totaled US$190,343 and US$22,841 (US$139,700 and US$16,764 at March 31, 2009), corresponding to related suit and lawyers’ fees, respectively.
| 10. | Shareholders’ equity |
On September 19, 2008, the board of directors approved a capital increase of US$456,084 through issuance of 55,000,000 previously unissued registered common shares without par value in a private subscription at an issuance price of US$8.29 each. The subscribers of each new share also received one Subscription Warrant (Warrant) which resulted in 55,000,000 Warrants being issued. Each Warrant grants its holder the right to subscribe 0.6 common shares, with the distribution of fractional shares not being permitted. Therefore, the Warrants issued allowed the holders to purchase 33,000,000 shares. The Warrants were valid from their issue date to December 31, 2009. The exercise price of each amount of Warrants which totals one share is US$8.29 per share. As of December 31, 2009, 49,987,552 Warrants were exercised, the remaining 12,448 warrants expired.
October 22, 2008 was the deadline to exercise the right of capital subscription, approved in the meeting of the board of directors on September 19, 2008. Since a large number of the minority shareholders did not exercise their preemptive rights, Cosan Limited, the controlling shareholder, subscribed for and paid up 54,993,482 common shares valued at US$456,034, and the minority shareholders subscribed for and paid up 6,518 common shares, valued at US$50. As a result, Cosan Limited increased its holding of company’s common shares from 171,172,252 to 226,165,734. This increased their ownership percentage from 62.81% to 69.05% of the Company’s capital.
28
COSAN S.A. INDÚSTRIA E COMÉRCIO
Notes to the condensed consolidated financial statements (Continued)
(In thousands of U.S. dollars, unless otherwise stated)
(Unaudited)
| 10. | Shareholders’ equity (Continued) |
On March 6, 2009, the Board of Directors approved a capital increase of US$1,945 through issuance of 736,852 new common shares, with no par value, for purposes of meeting the needs of the Stock Option Plan, due to exercise of such options by qualifying executives.
On June 18, 2009, the shareholders approved a capital increase of US$169,533 through the issuance of 44,300,389 new common shares, with no par value, for purposes of the acquisition of Curupay. As part of this acquisition Cosan acquired noncontrolling interest in Novo Rumo in the amount of US$62,476, which has been accounted for as an equity transaction, with a dilution of noncontrolling interest. (Note 3).
On July 15, 2009, the Board of Directors approved a capital increase of US$6,074 through issuance of 224,819 new common shares, with no par value, for purposes of meeting the needs of the Stock Option Plan, due to exercise of such options by qualifying executives.
On August 7, 2009, the Board of Directors approved a capital increase of US$440 through issuance of 50 new common shares, with no par value, at an issue price of US$9.00, due to exercise of subscription warrants by the holders.
On October 5, 2009, the Board of Directors approved a capital increase of US$1,772 through issuance of 169,500 new common shares, with no par value, for purposes of meeting the needs of the Stock Option Plan, due to exercise of such options by qualifying executives.
On October 29, 2009, the Board of Directors approved a capital increase of US$236,168 through issuance of 23,753,953 new common shares, with no par value, at an issue price of US$9.00, due to exercise of subscription warrants by Cosan Limited, the controlling shareholder. As a result, Cosan Limited increased its holding of company’s common shares from 226,165,734 to 249,919,687. This increased their ownership percentage from 60.64% to 62.99% of the Company’s capital.
On December 15, 2009, the Board of Directors approved a capital increase of US$830 through issuance of 84,000 new common shares, with no par value, at an issue price of US$9.00, due to exercise of subscription warrants by the holders. On the same day, the Board of Directors approved a capital increase of US$6,011 through issuance of 571,194 new common shares, with no par value, for purposes of meeting the needs of the Stock Option Plan, due to exercise of such options by qualifying executives.
29
COSAN S.A. INDÚSTRIA E COMÉRCIO
Notes to the condensed consolidated financial statements (Continued)
(In thousands of U.S. dollars, unless otherwise stated)
(Unaudited)
| 10. | Shareholders’ equity (Continued) |
On December 22, 2009, the Board of Directors approved a capital increase of US$78,647 through issuance of 8,072,976 new common shares, with no par value, at an issue price of US$9.00, due to the exercise of subscription warrants by Cosan Limited and other holders. Cosan Limited exercised 5,403,560 subscription warrants which resulted in an issuance of 3,242,136 new common shares and other holders exercised 8,051,400 subscription warrants which resulted in an issuance of 4,830,840 new common shares. As a result, Cosan Limited increased its holding of company’s common shares from 249,919,687 to 253,161,823, which increased their ownership percentage from 62.89% to 63.19% of the Company’s capital.
On December 31, 2009, the Board of Directors approved a capital increase of US$10,772 through issuance of 1,081,552 new common shares, with no par value, at an issue price of US$9.00, due to exercise of subscription warrants by the holders. This decreased Cosan Limited’s ownership percentage from 62.27% of the Company’s capital
As of December 31, 2009, the Company’s capital is represented by 406,543,317 common shares (328,284,884 as of March 31, 2009), with no par value.
| 11. | Deferred gain on sale of investments in subsidiaries |
Agrícola Ponte Alta S.A. is a subsidiary whose principal assets are land used for the growing of sugarcane for Cosan. On December 15, 2008, the shareholders approved a partial spin-off of the assets of Ponte Alta and created four new subsidiaries. Agricultural land was then transferred from Ponte Alta to each of the entities. On December 30, 2008, two of the entities, Nova Agrícola Ponte Alta S.A. and Terras da Ponte Alta S.A. were sold to Radar, an affiliate company accounted for by the equity method. The selling price was fair value, US$123,596, which resulted in a gain of US$47,080. This gain has previously been deferred since there were no lease contracts executed for the land, which was being used by Cosan for a monthly fee. During the current period the lease contracts were executed, and the gain is being amortized to profit and loss over the 19 year average term of the leases.
During the nine-month period ended December 31, 2009, the Company has amortized a gain of US$2,464 related to this sale-leaseback transaction.
30
COSAN S.A. INDÚSTRIA E COMÉRCIO
Notes to the condensed consolidated financial statements (Continued)
(In thousands of U.S. dollars, unless otherwise stated)
(Unaudited)
| 12. | Share-based compensation |
In the ordinary and extraordinary general meeting held on August 30, 2005, the guidelines for the outlining and structuring of a stock option plan for Cosan officers and employees were approved, thus authorizing the issue of up to 5% of shares comprising Cosan’s share capital. This stock option plan was outlined to attract and retain services rendered by officers and key employees, offering them the opportunity to become shareholders of Cosan. On September 22, 2005, Cosan’s board of directors approved the distribution of stock options corresponding to 4,302,780 common shares to be issued or purchased by Cosan related to 3.25% of the share capital at the time, authorized by the annual/extraordinary meeting. The remaining 1.75% remained to be distributed. On September 22, 2005, the officers and key employees were informed regarding the key terms and conditions of the share-based compensation arrangement.
According to the fair value at the grant date, the exercise price is US$2.64 per share which does not include any discount. The exercise price was calculated before the valuation mentioned above based on an expected private equity deal which did not occur. Options may be exercised after a one-year vesting period starting November 18, 2005, at the maximum percentage of 25% per year of the total stock options offered by Cosan. The options for each 25% have a five-year period to be exercised.
On September 11, 2007, the board of directors approved an additional distribution of stock options, in connection with the stock option plan mentioned above, corresponding to 450,000 common shares to be issued or purchased by Cosan related to 0.24% of the share capital at September 22, 2005. The remaining 1.51% may still be distributed.
On August 7, 2009, the board of directors approved an additional distribution of stock options, in connection with the stock option plan mentioned above, corresponding to 165,657 common shares to be issued or purchased by Cosan. Such options were issued without a vesting period, therefore the intrinsic value at grant date was the basis for calculating the fair value of the options, at US$9,82 per option, and an expense of US$1,071 was fully recorded by the company.
The exercise of options may be settled only through issuance of new common shares or treasury shares.
The employees that leave Cosan before the vesting period will forfeit 100% of their rights. However, if the employment is terminated by Cosan without cause, the employees will have the right to exercise 100% of their options of that particular year plus the right to exercise 50% of the options of the following year.
31
COSAN S.A. INDÚSTRIA E COMÉRCIO
Notes to the condensed consolidated financial statements (Continued)
(In thousands of U.S. dollars, unless otherwise stated)
(Unaudited)
| 12. | Share-based compensation (Continued) |
The fair value of share-based awards was estimated using a binominal model with the following assumptions:
| Options granted on September 22, 2005 | Options granted on September 11, 2007 | |||||||
| Grant price - in U.S. dollars | 3.51 | 3.51 | ||||||
| Expected life (in years) | 7.5 | 7.5 | ||||||
| Interest rate | 14.52% | 9.34% | ||||||
| Volatility | 34.00% | 46.45% | ||||||
| Dividend yield | 1.25% | 1.47% | ||||||
| Weighted-average fair value at grant date - in U.S. dollars | 7.09 | 10.45 | ||||||
As of December 31, 2009, the amount of US$ 1,832 related to the unrecognized compensation cost related to stock options is expected to be recognized in 12 months.
As of December 31, 2009 there were 670,976 options outstanding with a weighted-average exercise price of US$3.51.
| 13. | Fair value measurements |
Effective May 1, 2008, Cosan adopted ASC 820, Fair Value Measurements (SFAS 157), for all financial instruments and non-financial instruments accounted for at fair value on a recurring basis. ASC 820 establishes a new framework for measuring fair value and expands related disclosures. Broadly, the ASC 820 framework requires fair value to be determined based on the exchange price that would be received for an asset or paid to transfer a liability (an exit price) in the principal or most advantageous market for the asset or liability in an orderly transaction between market participants. ASC 820 establishes market or observable inputs as the preferred source of values, followed by assumptions based on hypothetical transactions in the absence of market inputs.
32
COSAN S.A. INDÚSTRIA E COMÉRCIO
Notes to the condensed consolidated financial statements (Continued)
(In thousands of U.S. dollars, unless otherwise stated)
(Unaudited)
| 13. | Fair value measurements (Continued) |
The valuation techniques required by ASC 820 are based upon observable and unobservable inputs. Observable inputs reflect market data obtained from independent sources, while unobservable inputs reflect market assumptions. These two types of inputs create the following fair value hierarchy:
Level 1 - Quoted prices for identical instruments in active markets.
Level 2 - Quoted prices for similar instruments in active markets; quoted prices for identical or similar instruments in markets that are not active; and model-derived valuations whose inputs are observable or whose significant value drivers are observable.
Level 3 - Significant inputs to the valuation model are unobservable.
The following section describes the valuation methodologies Cosan uses to measure different financial instruments at fair value.
Derivatives
Cosan uses closing prices for derivatives included in Level 1, which are traded either on exchanges or liquid over-the-counter markets.
The remainder of the derivatives portfolio is valued using internal models, most of which are primarily based on market observable inputs including interest rate curves and both forward and spot prices for currencies and commodities. Derivative assets and liabilities included in Level 2 primarily represent interest rate swaps, foreign currency swaps and commodity forward contracts.
The following table presents our assets and liabilities measured at fair value on a recurring basis at December 31, 2009.
| Level 1 | Level 2 | Total | ||||||||||
| Assets | ||||||||||||
| Derivatives | 5,319 | 36,040 | 41,359 | |||||||||
| Total | 5,319 | 36,040 | 41,359 | |||||||||
| Liabilities | ||||||||||||
| Derivatives | 90,669 | 43,081 | 133,750 | |||||||||
| Total | 90,669 | 43,081 | 133,750 | |||||||||
33
COSAN S.A. INDÚSTRIA E COMÉRCIO
Notes to the condensed consolidated financial statements (Continued)
(In thousands of U.S. dollars, unless otherwise stated)
(Unaudited)
| 14. | Segment information |
a. Segment information
The following information about segments is based upon information used by Cosan’s senior management to assess the performance of operating segments and decide on the allocation of resources. Cosan’s reportable segments are business units in Brazil that target different industry segments. Each reportable segment is managed separately because of the need to specifically address customer needs in these different industries. Cosan has four segments: sugar, ethanol, fuel distribution and others group. The operations of these segments are based solely in Brazil.
The sugar segment mainly operates and produces a broad variety of sugar products, including raw (also known as very high polarization - VHP sugar), organic, crystal and refined sugars, and sells these products to a wide range of customers in Brazil and abroad. Cosan exports the majority of the sugar produced through international commodity trading companies. Cosan’s domestic customers include wholesale distributors, food manufacturers and retail supermarkets, through which it sells its “Da Barra” and “União” branded products.
The ethanol segment substantially produces and sells fuel ethanol, both hydrous and anhydrous (which has a lower water content than hydrous ethanol) and industrial ethanol. Cosan’s principal ethanol product is fuel ethanol, which is used both as an automotive fuel and as an additive in gasoline, and is mainly sold in the domestic market by fuel distribution companies. Consumption of hydrous ethanol in Brazil is increasing as a result of the introduction of flex fuel vehicles that can run on either gasoline or ethanol (or a combination of both) to the Brazilian market in 2003. In addition, Cosan sells liquid and gel ethanol products used mainly in the production of paint and cosmetics and alcoholic beverages for industrial clients in various sectors.
With the acquisition of Cosan CL a new fuel distribution segment has been created. The fuel distribution segment is engaged in the distribution in Brazil of oil products, ethanol and lubricants as well as the operation of convenience stores. The network to which the fuel distribution segment distributes such products is comprised of more than 1,500 service stations.
The accounting policies underlying the financial information provided for the segments are based on Brazilian GAAP. We evaluate segment performance based on information generated from the statutory accounting records.
34
COSAN S.A. INDÚSTRIA E COMÉRCIO
Notes to the condensed consolidated financial statements (Continued)
(In thousands of U.S. dollars, unless otherwise stated)
(Unaudited)
| 14. | Segment information (Continued) |
a. Segment information (Continued)
Others segment is comprised by selling cogeneration of electricity, diesel and corporate activities.
No asset information is provided by reportable segment due to the fact that the majority of the assets used in production of sugar and ethanol are the same.
Measurement of segment profit or loss and segment assets
Cosan S.A. evaluates performance and allocates resources based on return on capital and profitable growth. The primary measurement used by management to measure the financial performance of Cosan S.A. is adjusted EBIT (earnings before interest and taxes excluding special items such as impairment and restructuring, integration costs, one-time gains or losses on sales of assets, acquisition, and other items similar in nature). The accounting policies of the reportable segments are the same as those described in the summary of significant accounting policies.
December 1, 2009 | January 31, 2009 | |||||||
| Net sales — Brazilian GAAP | ||||||||
| Sugar | 1,154,354 | 624,617 | ||||||
| Ethanol | 591,640 | 402,199 | ||||||
| Fuel distribution | 3,913,404 | 749,011 | ||||||
| Others | 182,366 | 104,342 | ||||||
| Total | 5,841,764 | 1,880,168 | ||||||
| Reconciling items to U.S. GAAP | ||||||||
| Sugar | 4,113 | 777 | ||||||
| Fuel distribution | (408 | ) | 239 | |||||
| Total | 3,705 | 1,016 | ||||||
| Total net sales | 5,845,469 | 1,881,184 | ||||||
35
COSAN S.A. INDÚSTRIA E COMÉRCIO
Notes to the condensed consolidated financial statements (Continued)
(In thousands of U.S. dollars, unless otherwise stated)
(Unaudited)
| 14. | Segment information (Continued) |
a. Segment information (Continued)
Measurement of segment profit or loss and segment assets (Continued)
December 31, 2009 | January 31, 2009 | |||||||
| Segment operating income (loss) – Brazilian GAAP | ||||||||
| Sugar | 76,416 | (50,952 | ) | |||||
| Ethanol | 28,971 | (32,809 | ) | |||||
| Fuel distribution | 81,615 | (4,526 | ) | |||||
| Others | 8,834 | (7,106 | ) | |||||
| Operating income (loss) — Brazilian GAAP | 195,836 | (95,393 | ) | |||||
| Reconciling items to U.S. GAAP | ||||||||
| Depreciation and amortization expenses | ||||||||
| Sugar | (30,089 | ) | 28,449 | |||||
| Ethanol | (17,707 | ) | 18,319 | |||||
| Fuel distribution | - | 237 | ||||||
| Others | (5,234 | ) | 3,911 | |||||
| (53,030 | ) | 50,916 | ||||||
| Other adjustments | ||||||||
| Sugar | 3,640 | (9,899 | ) | |||||
| Ethanol | 2,142 | (6,374 | ) | |||||
| Fuel distribution | (3,893 | ) | (1,489 | ) | ||||
| Others | 554 | (1,396 | ) | |||||
| 2,443 | (19,158 | ) | ||||||
| Total sugar | 49,967 | (32,402 | ) | |||||
| Total ethanol | 13,406 | (20,864 | ) | |||||
| Fuel distribution | 77,722 | (5,778 | ) | |||||
| Total others | 4,154 | (4,591 | ) | |||||
| Operating income (loss) — U.S. GAAP | 145,249 | (63,635 | ) | |||||
36
COSAN S.A. INDÚSTRIA E COMÉRCIO
Notes to the condensed consolidated financial statements (Continued)
(In thousands of U.S. dollars, unless otherwise stated)
(Unaudited)
| 14. | Segment information (Continued) |
b. Sales by principal customers
Sugar
The following table sets forth the amount of sugar that we sold to our principal customers during the nine-month period ended December 31, 2009 and January 31, 2009 as a percentage of either domestic or international sales of sugar:
| Market | Customer | December 31, 2009 | January 31, 2009 | |||||
| International | Sucres et Denrées | 21% | 15.2% | |||||
| Ceval Internacional Limited | 9% | - | ||||||
| Cargill Incorporation Ltd. | 5% | - | ||||||
| Cargill International S.A. | 4% | 6.4% | ||||||
| Coimex Trading Ltd | 8% | 5.8% | ||||||
| Ableman Trading Limited | 4% | 5.5% | ||||||
| Fluxo – Cane Overseas Ltd | 1% | 24.2% | ||||||
| Tate & Lyle International | 1% | 8.7% | ||||||
Ethanol
The following table sets forth the amount of ethanol that we sold to our principal customers during the nine-month period ended December 31, 2009 and January 31, 2009 as a percentage of either domestic or international sales of ethanol:
| Market | Customer | December 31, 2009 | January 31, 2009 | |||||
| International | Vertical UK LLP | 10% | 16.6% | |||||
| Kolmar Petrochemicals | 5% | - | ||||||
| Morgan Stanley Capital Group Inc. | 5% | 3.5% | ||||||
| Alcotra S.A. | 3% | 1.1% | ||||||
| Sekab Biofuels & Chemicals | 2% | 6.3% | ||||||
| Vitol Inc. | - | 2.2% | ||||||
| Bauche Energy AS - Buyer | 4% | 2.2% | ||||||
| Bauche Energy Br Com Imp Exp Ltda. | - | 1.9% | ||||||
| Astra Oil Company LLC | 4% | - | ||||||
| Domestic | Shell Brasil Ltda. | 18% | 18.2% | |||||
| Petrobrás Distribuidora S.A. | 12% | 7.4% | ||||||
| Cia Brasileira de Petróleo Ipiranga | 9% | 5.4% | ||||||
| Euro Petróleo do Brasil Ltda. | 6% | 12.5% | ||||||
| Alesat Combustíveis S.A. | 5% | 3.2% | ||||||
| Chevron Brasil Ltda. | 1% | 3.2% | ||||||
| Cia Nacional de Alcool | 3% | 3.2% | ||||||
37
COSAN S.A. INDÚSTRIA E COMÉRCIO
Notes to the condensed consolidated financial statements (Continued)
(In thousands of U.S. dollars, unless otherwise stated)
(Unaudited)
| 14. | Segment information (Continued) |
b. Sales by principal customers (Continued)
The following table sets forth the amount of fuel distribution that we sold to our principal customers during the nine-month period ended December 31, 2009 as a percentage of either domestic or international sales of fuel distribution:
Fuel distribution
| Market | Customer | December 31, 2009 | January 31, 2009 | |||||
| Domestic | Mime Distribuidora de Petróleo Ltda. | 2% | 1.5% | |||||
| Tam Linhas Aéreas S.A. | 1% | 3.6% | ||||||
| All – América Latina Logística Malha Sul S.A. | 1% | - | ||||||
| Auto Posto Túlio Ltda. | 1% | 1.2% | ||||||
| Posto Iccar Ltda. | 1% | 1.2% | ||||||
| Iberia L.A.E. | - | 1.1% | ||||||
| 15. | Subsequent events |
IFC – International Finance Corporation (“IFC”)
On January 15, 2009, the Company fully paid the debt with IFC, in the amount of US$51,838, with final maturity date in January, 2013.
38
Parent Company and Consolidated Quarterly Financial Information
Cosan S.A. Indústria e Comércio
December 31, 2009
COSAN S.A. INDÚSTRIA E COMÉRCIO
PARENT COMPANY AND CONSOLIDATED QUARTERLY FINANCIAL INFORMATION
December 31, 2009
Contents
| Special review report of independent auditors | 1 |
| Unaudited quarterly financial information | |
| Unaudited balance sheets | 3 |
| Unaudited statements of operations | 5 |
| Unaudited statements of cash flows | 7 |
| Unaudited statement of changes in shareholders’ equity | 11 |
| Notes to the unaudited quarterly financial information | 12 |
A free translation from Portuguese into English of Special Review Report of Independent Auditors on Quarterly Financial Information prepared in Brazilian currency in accordance with the accounting practices adopted in Brazil
Special review report of independent auditors
The Board of Directors and Shareholders of
Cosan S.A. Indústria e Comércio
| 1. | We have performed a special review of the accompanying Quarterly Financial Information of Cosan S.A. Indústria e Comércio (parent company and consolidated) for the quarter and nine-month period ended December 31, 2009, including the balance sheets, statements of operations and cash flows, report on the Company’s performance and explanatory notes, prepared under the management’s responsibility. |
| 2. | Our review was conducted in accordance with the specific procedures determined by the Brazilian Institute of Independent Auditors (IBRACON) and the Federal Board of Accountancy (CFC), which comprised principally: (a) inquiries of and discussions with the management responsible for the Company’s accounting, financial and operational areas about the criteria adopted for the preparation of the Quarterly Financial Information; and (b) review of information and subsequent events which have, or could have, significant effects on the Company’s operations and financial position. |
| 3. | Based on our special review, we are not aware of any material modification that should be made to the Quarterly Financial Information referred to above for it to comply with specific standards established by the Brazilian Securities and Exchange Commission (CVM) applicable to the preparation of the Quarterly Financial Information. |
1
| 4. | As mentioned in Note 2, the accounting practices adopted in Brazil were modified during 2008 and the effects of its first time adoption were only recorded by the Company and its subsidiaries during the fourth quarter of the previous year and disclosed in the March 31, 2009 financial statements. The statements of operations and cash flows, for the quarter and nine-month period ended January 31, 2009, presented in conjunction with the information for the current quarter, were not adjusted for comparative purposes, as permitted by Ofício-Circular/CVM/SNC/SEP No. 02/2009. |
São Paulo, January 31, 2010
ERNST & YOUNG
Auditores Independentes S.S.
CRC 2SP015199/O-6
Luiz Carlos Nannini
Accountant CRC 1SP171638/O-7
2
A free translation from Portuguese into English of financial statements prepared in Brazilian currency in accordance with accounting practices adopted in Brazil
COSAN S.A. INDÚSTRIA E COMÉRCIO
Unaudited Balance sheets
December 31, 2009 and September 30, 2009
(In thousands of reais)
| Parent Company | Consolidated | ||||||||||||||||
| December 31, 2009 | September 30, 2009 | December 31, 2009 | September 30, 2009 | ||||||||||||||
| Assets | |||||||||||||||||
| Current assets | |||||||||||||||||
| Cash and cash equivalents | Note 4 | 510,845 | 177,599 | 864,077 | 948,647 | ||||||||||||
| Restricted cash | 172,050 | 145,837 | 172,050 | 149,533 | |||||||||||||
| Trade accounts receivable | Note 5 | 37,926 | 78,995 | 511,100 | 589,668 | ||||||||||||
| Derivative financial instruments | Note 19 | 81,325 | 97,427 | 72,014 | 97,427 | ||||||||||||
| Inventories | Note 6 | 582,700 | 453,717 | 1,936,791 | 1,531,522 | ||||||||||||
| Advances to suppliers | 88,214 | 102,204 | 241,244 | 336,748 | |||||||||||||
| Related parties | Note 7 | 550,241 | 637,178 | 24,639 | 21,613 | ||||||||||||
| Deferred income and social contribution taxes | Note 12.b | - | - | 29,155 | 48,108 | ||||||||||||
| Recoverable taxes | 109,925 | 117,075 | 307,805 | 342,894 | |||||||||||||
| Other assets | 10,408 | 7,775 | 53,968 | 41,691 | |||||||||||||
| 2,143,634 | 1,817,807 | 4,212,843 | 4,107,851 | ||||||||||||||
| Noncurrent assets | |||||||||||||||||
| Long-term receivables | |||||||||||||||||
| Accounts receivable from federal government | Note 14 | - | - | 331,426 | 329,049 | ||||||||||||
| CTNs-Restricted Brazilian Treasury Bills | Note 13 | 29,553 | 28,755 | 194,590 | 189,342 | ||||||||||||
| Deferred income and social contribution taxes | Note 12.b | 5,264 | 98,360 | 334,214 | 551,487 | ||||||||||||
| Advances to suppliers | 25,629 | 18,214 | 132,461 | 85,130 | |||||||||||||
| Related parties | Note 7 | - | - | 149,866 | 151,821 | ||||||||||||
| Other assets | 14,379 | 4,972 | 210,799 | 190,150 | |||||||||||||
| Permanent assets | |||||||||||||||||
| Investments | Note 8 | 5,558,392 | 5,377,928 | 194,046 | 196,497 | ||||||||||||
| Property, plant and equipment | Note 9 | 757,720 | 761,425 | 4,871,534 | 4,671,373 | ||||||||||||
| Intangible | Note 10 | 395,637 | 395,637 | 2,765,466 | 2,737,464 | ||||||||||||
| 6,711,749 | 6,534,990 | 9,184,402 | 9,102,313 | ||||||||||||||
| Total assets | 8,930,208 | 8,503,098 | 13,397,245 | 13,210,164 | |||||||||||||
3
| Parent Company | Consolidated | ||||||||||||||||
| December 31, 2009 | September 30, 2009 | December 31, 2009 | September 30, 2009 | ||||||||||||||
| Liabilities and shareholders’ equity | |||||||||||||||||
| Current liabilities | |||||||||||||||||
| Loans and financing | Note 13 | 479,412 | 444,697 | 892,636 | 1,184,658 | ||||||||||||
| Derivative financial instruments | 232,884 | 215,142 | 232,884 | 215,405 | |||||||||||||
| Trade accounts payable | 177,747 | 172,149 | 712,139 | 712,502 | |||||||||||||
| Salaries payable | 40,869 | 61,413 | 132,971 | 180,904 | |||||||||||||
| Taxes and social contributions payable | Note 11 | 24,393 | 44,832 | 200,979 | 230,925 | ||||||||||||
| Related parties | Note 7 | 197,143 | 124,286 | 50,456 | 3,838 | ||||||||||||
| Other liabilities | 34,795 | 25,215 | 123,440 | 100,728 | |||||||||||||
| Total current liabilities | 1,187,243 | 1,087,734 | 2,345,505 | 2,628,960 | |||||||||||||
| Noncurrent liabilities | |||||||||||||||||
| Loans and financing | Note 13 | 1,707,465 | 1,903,754 | 4,859,073 | 4,667,395 | ||||||||||||
| Taxes and social contributions payable | Note 11 | 60,141 | 48,478 | 255,715 | 288,850 | ||||||||||||
| Related parties | Note 7 | 946,342 | 966,397 | - | - | ||||||||||||
| Provision for judicial demands | Note 14 | 76,431 | 239,778 | 755,650 | 1,143,377 | ||||||||||||
| Pension Plan | Note 22 | - | - | 61,582 | 62,287 | ||||||||||||
| Other liabilities | 35,611 | 36,485 | 155,785 | 168,394 | |||||||||||||
| Total noncurrent liabilities | 2,825,990 | 3,194,892 | 6,087,805 | 6,330,303 | |||||||||||||
| Minority shareholders’ interest | - | - | 46,960 | 30,429 | |||||||||||||
| Shareholders’ equity | Note 15 | ||||||||||||||||
| Capital | 4,687,722 | 4,155,316 | 4,687,722 | 4,155,316 | |||||||||||||
| Treasury stock | (4,186 | ) | (4,186 | ) | (4,186 | ) | (4,186 | ) | |||||||||
| Capital reserves | 54,308 | 54,384 | 54,308 | 54,384 | |||||||||||||
| Currency translation adjustment | (2,956 | ) | - | (2,956 | ) | - | |||||||||||
| Retained earnings | 182,087 | 14,958 | 182,087 | 14,958 | |||||||||||||
| Total shareholders’ equity | 4,916,975 | 4,220,472 | 4,916,975 | 4,220,472 | |||||||||||||
| Total liabilities and shareholders’ equity | 8,930,208 | 8,503,098 | 13,397,245 | 13,210,164 | |||||||||||||
See accompanying notes.
4
COSAN S.A. INDÚSTRIA E COMÉRCIO
Unaudited statements of operations
Quarters ended December 31, 2009 and January 31, 2009
(In thousands of reais, except for the earnings (loss) per share)
| Parent Company | Consolidated | |||||||||||||||
| December 31, 2009 | January 31, 2009 | December 31, 2009 | January 31, 2009 | |||||||||||||
| Gross operating revenue | ||||||||||||||||
| Sales of goods and services | 514,709 | 536,284 | 4,145,134 | 2,746,351 | ||||||||||||
| Taxes and sales deductions | (35,403 | ) | (32,951 | ) | (344,634 | ) | (180,718 | ) | ||||||||
| Net operating revenue | 479,306 | 503,333 | 3,800,500 | 2,565,633 | ||||||||||||
| Cost of goods sold and services rendered | (391,272 | ) | (353,375 | ) | (3,340,517 | ) | (2,187,601 | ) | ||||||||
| Gross profit | 88,034 | 149,958 | 459,983 | 378,032 | ||||||||||||
| Operating income (expenses) | ||||||||||||||||
| Selling expenses | (33,966 | ) | (41,570 | ) | (218,374 | ) | (156,752 | ) | ||||||||
| General and administrative expenses | (53,653 | ) | (14,895 | ) | (116,304 | ) | (70,842 | ) | ||||||||
| Management fees | (1,628 | ) | (1,423 | ) | (1,628 | ) | (1,423 | ) | ||||||||
| Financial income (expenses), net | (54,963 | ) | 64,130 | (78,285 | ) | (159,183 | ) | |||||||||
| Earnings (losses) on equity investments | 151,619 | (57,312 | ) | (9,360 | ) | 13,551 | ||||||||||
| Goodwill amortization | - | (16,488 | ) | - | (65,159 | ) | ||||||||||
| Other operating income (expenses), net | 79,363 | (115,779 | ) | 217,012 | 120,226 | |||||||||||
| 86,772 | (83,337 | ) | (206,939 | ) | (319,582 | ) | ||||||||||
| Operating income | 174,806 | 66,621 | 253,044 | 58,450 | ||||||||||||
| Income before income and social contribution taxes | 174,806 | 66,621 | 253,044 | 58,450 | ||||||||||||
| Income and social contribution taxes | (7,677 | ) | (61,413 | ) | (85,257 | ) | (53,285 | ) | ||||||||
| Minority shareholders’ interest | - | - | (658 | ) | 43 | |||||||||||
| Net income for the period | 167,129 | 5,208 | 167,129 | 5,208 | ||||||||||||
| Earnings per share – in Reais | 0.41 | 0.02 | ||||||||||||||
See accompanying notes.
5
COSAN S.A. INDÚSTRIA E COMÉRCIO
Unaudited statements of operations
Nine-month periods ended December 31, 2009 and January 31, 2009
(In thousands of reais, except for the earnings (loss) per share)
| Parent Company | Consolidated | ||||||||||||||||
| December 31, 2009 | January 31, 2009 | December 31, 2009 | January 31, 2009 | ||||||||||||||
| Gross operating revenue | |||||||||||||||||
| Sales of goods and services | 1,741,694 | 1,281,662 | 11,895,875 | 4,199,121 | |||||||||||||
| Taxes and sales deductions | (93,613 | ) | (76,058 | ) | (953,936 | ) | (278,822 | ) | |||||||||
| Net operating revenue | 1,648,081 | 1,205,604 | 10,941,939 | 3,920,299 | |||||||||||||
| Cost of goods sold and services rendered | (1,377,328 | ) | (1,002,193 | ) | (9,590,439 | ) | (3,360,763 | ) | |||||||||
| Gross profit | 270,753 | 203,411 | 1,351,500 | 559,536 | |||||||||||||
| Operating income (expenses) | |||||||||||||||||
| Selling expenses | (114,353 | ) | (105,967 | ) | (639,261 | ) | (331,066 | ) | |||||||||
| General and administrative expenses | (156,539 | ) | (92,114 | ) | (318,054 | ) | (193,372 | ) | |||||||||
| Management fees | Note | (5,353 | ) | (4,272 | ) | (5,353 | ) | (4,272 | ) | ||||||||
| Financial income (expenses), net | Note | 331,975 | (313,808 | ) | 434,037 | (624,027 | ) | ||||||||||
| Earnings (losses) on equity investments | Note | 411,162 | (166,858 | ) | (12,885 | ) | 13,458 | ||||||||||
| Goodwill amortization | - | (49,465 | ) | - | (145,949 | ) | |||||||||||
| Realization of goodwill through sale | - | - | (85,589 | ) | - | ||||||||||||
| Other operating income (expenses), net | 86,147 | (14,061 | ) | 292,016 | 116,127 | ||||||||||||
| 553,039 | (746,545 | ) | (335,089 | ) | (1,169,101 | ) | |||||||||||
| Operating income (loss) | 823,792 | (543,134 | ) | 1,016,411 | (609,565 | ) | |||||||||||
| Income (loss) before income and social contribution taxes | 823,792 | (543,134 | ) | 1,016,411 | (609,565 | ) | |||||||||||
| Income and social contribution taxes | Note | (146,027 | 109,528 | (346,973 | ) | 175,030 | |||||||||||
| Minority shareholders’ interest | - | - | 8,327 | 929 | |||||||||||||
| Net income (loss) for the period | 677,765 | (433,606 | ) | 677,765 | (433,606 | ) | |||||||||||
| Earnings (loss) per share – in Reais | 1.67 | (1.33 | ) | ||||||||||||||
See accompanying notes.
6
COSAN S.A. INDÚSTRIA E COMÉRCIO
Unaudited statements of cash flows – indirect method
Quarters ended December 31, 2009 and January 31, 2009
(In thousands of reais)
| Parent Company | Consolidated | |||||||||||||||
| December 31, 2009 | January 31, 2009 | December 31, 2009 | January 31, 2009 | |||||||||||||
| Cash flows from operating activities | ||||||||||||||||
| Net income for the period | 167,129 | 5,208 | 167,129 | 5,208 | ||||||||||||
| Adjustments to reconcile net income (loss) for the period to cash provided by or used in operating activities | ||||||||||||||||
| Depreciation and amortization | 46,141 | 25,021 | 149,671 | 71,136 | ||||||||||||
| Losses (earnings) on equity investments | (151,619 | ) | 57,312 | 9,360 | (13,551 | ) | ||||||||||
| Net book value of long lived assets disposed of | 43 | (32,810 | ) | 1,053 | (328,436 | ) | ||||||||||
| Goodwill amortization | - | 16,488 | 65,159 | |||||||||||||
| Deferred income and social contribution taxes | 7,677 | 60,408 | 58,948 | 51,856 | ||||||||||||
| Set-up (reversal) of provision for legal claims, net | 214 | 6,926 | 4,137 | (6,268 | ) | |||||||||||
| Set-up (reversal) of provision for devaluation of permanent equity interest | - | - | - | 22 | ||||||||||||
| Minority interest | - | - | 658 | (43 | ) | |||||||||||
| Gain from Law 11,941/MP 470 | (79,433 | ) | - | (211,649 | ) | - | ||||||||||
| Recognized granted shares | (76 | ) | - | (76 | ) | - | ||||||||||
| Interest, monetary and exchange variation, net | 42,101 | 83,270 | (47,873 | ) | 297,788 | |||||||||||
| Others | (1,764 | ) | - | 5,246 | 3,739 | |||||||||||
| Variation in assets and liabilities | ||||||||||||||||
| Trade accounts receivables | 39,173 | 52,254 | 76,491 | 79,101 | ||||||||||||
| Inventories | (117,182 | ) | 88,996 | (342,805 | ) | 139,812 | ||||||||||
| Advances to suppliers | 6,575 | 12,463 | 48,173 | 15,359 | ||||||||||||
| Taxes recoverable | 7,150 | (4,814 | ) | 24,555 | (19,799 | ) | ||||||||||
| Trade accounts payables | 5,598 | (55,348 | ) | (492 | ) | (159,486 | ) | |||||||||
| Salaries payable | (20,544 | ) | (36,135 | ) | (48,002 | ) | (93,059 | ) | ||||||||
| Taxes and social contributions payables | 6,428 | 1,251 | 8,059 | (8,182 | ) | |||||||||||
| Derivative financial instruments | 7,631 | (65,009 | ) | 20,375 | (65,009 | ) | ||||||||||
| Other liabilities | (18,182 | ) | 14,724 | 46,899 | (29,483 | ) | ||||||||||
| Net cash provided by (used in) operating activities | (52,940 | ) | 230,205 | (30,143 | ) | 5,842 | ||||||||||
| Cash flows from investments activities | ||||||||||||||||
| Investments, net of cash received | (29,471 | ) | (934,192 | ) | (14,732 | ) | (1,533,708 | ) | ||||||||
| Acquisition of property, plant and equipment | (53,944 | ) | (50,888 | ) | (400,983 | ) | (432,389 | ) | ||||||||
| Others | 203 | 33,316 | 1,783 | 331,441 | ||||||||||||
| Net cash used in investments activities | (83,212 | ) | (1,127,956 | ) | (413,932 | ) | (1,634,656 | ) | ||||||||
7
COSAN S.A. INDÚSTRIA E COMÉRCIO
Unaudited statements of cash flows – indirect method (Continued)
Quarters ended December 31, 2009 and January 31, 2009
(In thousands of reais)
| Parent Company | Consolidated | |||||||||||||||
| December 31, 2009 | January 31, 2009 | December 31, 2009 | January 31, 2009 | |||||||||||||
| Cash flows from financial activities | ||||||||||||||||
| Capital increase | 532,406 | - | 532,406 | - | ||||||||||||
| Loans and financing | 1,136,396 | 1,108,706 | 1,665,512 | 1,196,368 | ||||||||||||
| Amortization of principal and interest on loans and financing, advances from customers. | (1,335,786 | ) | (52,918 | ) | (1,838,413 | ) | (148,307 | ) | ||||||||
| Related parties | 136,382 | (163,973 | ) | - | (5,903 | ) | ||||||||||
| Net cash provided by financing activities | 469,398 | 891,815 | 359,505 | 1,042,158 | ||||||||||||
| Net cash increase (decrease) in cash and cash equivalents | 333,246 | 170,256 | (84,570 | ) | (586,656 | ) | ||||||||||
| Cash and cash equivalents at the beginning of the period | 177,599 | 319,216 | 948,647 | 1,276,308 | ||||||||||||
| Cash and cash equivalents at the end of the period | 510,845 | 489,472 | 864,077 | 689,652 | ||||||||||||
See accompanying notes.
8
COSAN S.A. INDÚSTRIA E COMÉRCIO
Unaudited statements of cash flows – indirect method
Nine-month periods ended December 31, 2009 and January 31, 2009
(In thousands of reais)
| Parent Company | Consolidated | |||||||||||||||
| December 31, 2009 | January 31, 2009 | December 31, 2009 | January 31, 2009 | |||||||||||||
| Cash flows from operating activities | ||||||||||||||||
| Net income (loss) for the period | 677,765 | (433,606 | ) | 677,765 | (433,606 | ) | ||||||||||
| Adjustments to reconcile net income (loss) for the period to cash provided by or used in operating activities | ||||||||||||||||
| Depreciation and amortization | 162,957 | 160,607 | 476,393 | 405,180 | ||||||||||||
| Losses (earnings) on equity investments | (411,162 | ) | 166,858 | 12,885 | (13,458 | ) | ||||||||||
| Net book value of long lived assets disposed of | (84 | ) | (31,625 | ) | (101,284 | ) | (323,759 | ) | ||||||||
| Goodwill amortization | - | 49,465 | 85,589 | 145,949 | ||||||||||||
| Deferred income and social contribution taxes | 146,027 | (101,836 | ) | 269,460 | (167,951 | ) | ||||||||||
| Set-up (reversal) of provision for legal claims. net | (1,283 | ) | 12,410 | 7,519 | 19,591 | |||||||||||
| Minority interest | - | - | (8,327 | ) | (929 | ) | ||||||||||
| Recognized granted shares | 8,467 | - | 8,467 | - | ||||||||||||
| Gain from Law 11,941/MP 470 | (79,433 | ) | - | (211,649 | ) | - | ||||||||||
| Interest, monetary and exchange variation, net | (288,900 | ) | 535,092 | (419,670 | ) | 843,534 | ||||||||||
| Others | (12,401 | ) | (7,925 | ) | 3,747 | (5,094 | ) | |||||||||
| Variation in assets and liabilities | ||||||||||||||||
| Trade accounts receivables | 44,143 | (6,822 | ) | 165,321 | 87,234 | |||||||||||
| Inventories | (203,653 | ) | (292,447 | ) | (503,179 | ) | (721,001 | ) | ||||||||
| Advances to suppliers | (35,523 | ) | (22,525 | ) | (7,870 | ) | (61,767 | ) | ||||||||
| Taxes recoverable | (20,162 | ) | (22,899 | ) | (8,899 | ) | (50,679 | ) | ||||||||
| Trade accounts payables | 84,873 | 81,621 | 96,225 | 139,459 | ||||||||||||
| Salaries payable | 11,156 | (8,452 | ) | 21,953 | (30,797 | ) | ||||||||||
| Taxes and social contributions payables | 12,370 | (13,181 | ) | (45,093 | ) | (36,172 | ) | |||||||||
| Derivative financial instruments | (58,607 | ) | 76,220 | (43,393 | ) | 76,220 | ||||||||||
| Other assets/liabilities, net | (24,120 | ) | 17,162 | 36,207 | (63,148 | ) | ||||||||||
| Net cash used in operating activities | 12,430 | 158,117 | 512,167 | (191,194 | ) | |||||||||||
| Cash flows from investments activities | ||||||||||||||||
| Investments, net of cash received | (48,715 | ) | (1,801,421 | ) | 14,642 | (1,595,851 | ) | |||||||||
| Acquisition of property. plant and equipment | (139,394 | ) | (145,150 | ) | (1,180,696 | ) | (1,011,535 | ) | ||||||||
| Cash received on sale of investment | 512 | 33,640 | 120,964 | 332,412 | ||||||||||||
| Net cash provided by (used in) investments activities | (187,597 | ) | (1,912,931 | ) | (1,045,090 | ) | (2,274,974 | ) | ||||||||
9
COSAN S.A. INDÚSTRIA E COMÉRCIO
Unaudited statements of cash flows – indirect method (Continued)
Nine-month periods ended December 31, 2009 and January 31, 2009
(In thousands of reais)
| Parent Company | Consolidated | ||||||||||||||||
December 31, 2009 | January 31, 2009 | December 31, 2009 | January 31, 2009 | ||||||||||||||
| Cash flows from financial activities | |||||||||||||||||
| Capital increase | 533,780 | 880,000 | 533,780 | 883,476 | |||||||||||||
| Purchase of treasury stocks | - | (4,186 | ) | - | (4,186 | ) | |||||||||||
| Loans and financing | 1,188,635 | 1,232,532 | 2,884,171 | 1,515,144 | |||||||||||||
| Amortization of principal and interest on loans and financing, advances from customers | (1,516,692 | ) | (114,103 | ) | (2,283,521 | ) | (242,799 | ) | |||||||||
| Related parties | 91,563 | (675,114 | ) | (456,786 | ) | (5,903 | ) | ||||||||||
| Dividends paid | - | - | - | - | |||||||||||||
| Net cash provided by (used in) financing activities | 297,286 | 1,319,129 | 677,644 | 2,145,732 | |||||||||||||
| Net cash increase (decrease) in cash and cash equivalents | 122,119 | (435,685 | ) | 144,721 | (320,436 | ) | |||||||||||
| Cash and cash equivalents at the beginning of the period | 388,726 | 1,244,373 | 719,356 | 1,010,088 | |||||||||||||
| Cash and cash equivalents at the end of the period | 510,845 | 808,688 | 864,077 | 689,652 | |||||||||||||
See accompanying notes.
10
COSAN S.A. INDÚSTRIA E COMÉRCIO
Unaudited statement of changes in shareholders’ equity
Quarter and Nine-month period ended December 31, 2009
(In thousands of reais)
Capital | Treasury shares | Capital Reserves | Accumulated losses | Currency translation adjustment | Total | |||||||||||||||||||
| Balances as of September 30, 2009 | 4,155,316 | (4,186 | ) | 54,384 | 14,958 | - | 4,220,472 | |||||||||||||||||
| Capital increase | 532,406 | 532,406 | ||||||||||||||||||||||
| Recognized granted shares | (76 | ) | (76 | ) | ||||||||||||||||||||
| Currency translation adjustments | (2,956 | ) | (2,956 | ) | ||||||||||||||||||||
| Net income for the period | 167,129 | 167,129 | ||||||||||||||||||||||
| Balances as of December 31, 2009 | 4,687,722 | (4,186 | ) | 54,308 | 182,087 | (2,956 | ) | 4,916,975 | ||||||||||||||||
Capital | Treasury shares | Capital Reserves | Accumulated losses | Currency translation adjustment | Total | |||||||||||||||||||
| Balances as of March 31, 2009 | 3,819,770 | (4,186 | ) | 45,841 | (495,678 | ) | - | 3,365,747 | ||||||||||||||||
| Capital increase | 867,952 | 867,952 | ||||||||||||||||||||||
| Recognized granted shares | 8,467 | 8,467 | ||||||||||||||||||||||
| Currency translation adjustments | (2,956 | ) | (2,956 | ) | ||||||||||||||||||||
| Net income for the period | 677,765 | 677,765 | ||||||||||||||||||||||
| Balances as of December 31, 2009 | 4,687,722 | (4,186 | ) | 54,308 | 182,087 | (2,956 | ) | 4,916,975 | ||||||||||||||||
See accompanying notes.
11
COSAN S.A. INDÚSTRIA E COMÉRCIO
Notes to the unaudited quarterly financial information (Continued)
December 31, 2009
(In thousands of reais)
| 1. | Operations |
The primary activity of Cosan S.A. Indústria e Comércio (“Company” or “Cosan”), with principal place of business in the city of Barra Bonita, São Paulo, and its subsidiaries, is the manufacturing and trading of sugar, ethanol and co-generation of electricity from sugarcane both of their own plantations and third parties, as well as the distribution of fuel and lubricants. The Company has 23 producing units, located in e São Paulo, Goiás and Mato Grosso do Sul States, with a nominal capacity of milling 60 million tons of sugarcane per year, producing varied qualities of raw and refined sugar, anhydrous and hydrated ethanol. The Company activities are also linked with those of its subsidiary Cosan Operadora Portuária S.A. (“Cosan Portuária”), Teaçu Armazéns Gerais S.A. (“Teaçu”) and TEAS - Terminal Exportador de Álcool de Santos S.A. (“TEAS”), which consist mainly in the Company’s logistic support to export of sugar and ethanol.
The Company, through its subsidiary Cosan Combustíveis e Lubrificantes S.A. (“Cosan CL”), operates in 40 fuel distribution bases in Brazil and ranks as one of the four biggest fuel distributors in Brazil, with a distribution network of nearly 1,500 gas stations across Brazil, which sell 5 billion liters of fuels, 160 million cubic meters of NGV and 127 thousand cubic meters of lubricants. Accordingly, the Company expanded its business model and became the first integrated renewable energy company, acting from the plantation of sugar cane to the distribution and retail sale of fuels.
At the Annual and Special Meeting held on August 29, 2008, the Company’s shareholders changed year end to March 31 of each year. As a consequence, the statements of operations and of cash flows for the quarter and the nine-month period of the previous year relate to the quarter and nine-month period ended January 31, 2009, and not to December 31, 2008, therefore, are not comparable to those of the current quarter and six-month period ended January 31, 2010.
During the nine-month period ended December 31, 2009, the Company and its subsidiaries carried out a number of corporate operations, the main of which being the association among the groups Cosan and Rezende Barbosa and controlling shareholding acquisition of TEAS, the details of which are described in Note 8 hereto.
During the quarter ended December 31, 2009, capital contributions to the Company, totaling R$532,406 were made, as described in Note 15.
12
COSAN S.A. INDÚSTRIA E COMÉRCIO
Notes to the unaudited quarterly financial information (Continued)
December 31, 2009
(In thousands of reais)
| 2. | Basis of preparation and presentation of the quarterly information |
The Company’s quarterly information were prepared based on the accounting practices adopted in Brazil and on the rules issued by the Brazilian Securities and Exchange Commission (“CVM”), observing the accounting guidelines set forth in corporation law (Law Nº 6,404/76) which include the new provisions established, amended and repealed by Law Nº 11,638, of December 28, 2007 (“Law 11,638/07”) and by Law Nº 11941, of May 27, 2009 (“Law 11,941/09”).
The accounting practices adopted in Brazil were amended during 2008 and the effects of their first-time adoption were recorded by the Company during the fourth quarter of 2008 and disclosed in the financial statements of March 31, 2009. The quarterly information for the quarter and nine-month periods ended January 31, 2009, presented in conjunction with the quarterly information for the quarter and nine-month period ended December 31, 2009, was not adjusted for comparison purposes, as allowed by CVM/SNC/SEP Official Memorandum Nº 02/2009. On January 31, 2009, the impacts of these new accounting practices on the results for the quarter and nine-month period are as follows:
| Parent Company | Consolidated | |||||||||||||||
| 11/01/08 to 01/31/09 | 05/01/08 to 01/31/09 | 11/01/08 to 01/31/09 | 05/01/08 to 01/31/09 | |||||||||||||
| Balances before the amendments from Laws No. 11,638/07 and 11,941/09 | 5,208 | (433,606 | ) | 5,208 | (433,606 | ) | ||||||||||
| Lease– CPC 06 | 2,032 | 2,186 | 2,032 | 2,186 | ||||||||||||
| Shares issuance costs – CPC 08 | - | - | (22,059 | ) | - | |||||||||||
| Recorded stock options grants – CPC 10 | (3,646 | ) | (10,939 | ) | (3,646 | ) | (10,939 | ) | ||||||||
| Derivative financial instruments – CPC 14 | (184,244 | ) | (135,142 | ) | (184,244 | ) | (135,142 | ) | ||||||||
| Deferred income tax and social contribution on temporary adjustments | 61,952 | 45,205 | 69,452 | 45,205 | ||||||||||||
| Equity investment adjustments effect | (2,755 | ) | - | - | - | |||||||||||
| Minority Shareholders’ portion | - | - | 11,804 | - | ||||||||||||
| (126,661 | ) | (98,690 | ) | (126,661 | ) | (98,690 | ) | |||||||||
| Balances adjusted to the amendments from Laws No. 11,638/07 and 11,941/09 | (121,453 | ) | (532,296 | ) | (121,453 | ) | (532,296 | ) | ||||||||
13
COSAN S.A. INDÚSTRIA E COMÉRCIO
Notes to the unaudited quarterly financial information (Continued)
December 31, 2009
(In thousands of reais)
| 2. | Basis of preparation and presentation of the quarterly information (Continued) |
The quarterly information for the parent company and consolidated, including accompanying notes, except as otherwise stated, are presented in thousands of reais.
The results for the quarter and nine-month period ended December 31, 2009 are not necessarily an indication of results that may be expected for the year ending March 31, 2010.
Non-financial information presented in these financial statements was not reviewed by independent auditors.
| 3. | Summary of significant accounting practices |
The quarterly information was prepared in accordance with principles, practices and criteria consistent with those adopted when preparing the financial statements for March 31, 2009 and should be read in conjunction therewith.
Consolidation of quarterly information
The consolidated quarterly information was prepared in accordance with the basic principles of consolidation. The consolidation process includes the following principal procedures:
(i) Intercompany assets and liabilities are eliminated; (ii) Equity investments in subsidiaries, proportionate to the parent company interest in the shareholders’ equity of subsidiaries, are eliminated; (iii) Intercompany revenues and expenses are eliminated; and (iv) Significant unearned intercompany income is eliminated, when relevant.
The financial year adopted by the companies included in the consolidation coincides with that of the Company and accounting policies were consistently applied in the consolidated companies, in line with those used on March 31, 2009.
14
COSAN S.A. INDÚSTRIA E COMÉRCIO
Notes to the unaudited quarterly financial information (Continued)
December 31, 2009
(In thousands of reais)
| 3. | Summary of significant accounting practices (Continued) |
The main consolidated companies are listed below:
| Direct and indirect interest as of | ||||||||
| 12/31/09 | 09/30/09 | |||||||
| Administração de Participações Aguassanta Ltda. | 91.5 | % | 91.5 | % | ||||
| Cosan Açúcar e Álcool S.A (1) | 99.6 | % | 99.6 | % | ||||
| Águas da Ponte Alta S.A. | 99.6 | % | 99.6 | % | ||||
| Vale da Ponte Alta S.A. | 99.6 | % | 99.6 | % | ||||
| Agrícola Ponte Alta S.A. | 99.6 | % | 99.6 | % | ||||
| Cosan Centroeste S.A. Açúcar e Álcool | 99.6 | % | 99.6 | % | ||||
| Barra Bioenergia S.A. | 99.6 | % | 99.6 | % | ||||
| DaBarra Alimentos Ltda. | 99.6 | % | 99.6 | % | ||||
| Bonfim Nova Tamoio – BNT Agrícola Ltda. | 99.6 | % | 99.6 | % | ||||
| Benálcool Açúcar e Álcool S.A. | 99.6 | % | 99.6 | % | ||||
| Barrapar Participações Ltda. | 99.6 | % | 99.6 | % | ||||
| Aliança Indústria e Comercio de açúcar e Álcool S.A. | 99.6 | % | 99.6 | % | ||||
| Cosan Distribuidora de Combustíveis Ltda. | 99.9 | % | 99.9 | % | ||||
| Cosan S.A. Bioenergia | 100.0 | % | 100.0 | % | ||||
| Cosan International Universal Corporation | 100.0 | % | 100.0 | % | ||||
| Cosan Finance Limited | 100.0 | % | 100.0 | % | ||||
| Grançucar S.A. Refinadora de Açúcar | 100.0 | % | 100.0 | % | ||||
| Cosan Combustíveis e Lubrificantes S.A. | 100.0 | % | 100.0 | % | ||||
| Copsapar Participações S.A. | 90.0 | % | 90.0 | % | ||||
| Novo Rumo Logística S.A. | 92.9 | % | 92.9 | % | ||||
| Rumo Logística S.A. | 92.9 | % | 92.9 | % | ||||
| Cosan Operadora Portuária S.A. | 92.9 | % | 92.9 | % | ||||
| Teaçu Armazéns Gerais S.A. | 92.9 | % | 92.9 | % | ||||
| Nova América S.A. – Trading (2) | - | 100.0 | % | |||||
| Teas Terminal Exportador de Álcool de Santos S.A. (3) | 66.7 | % | 40.0 | % | ||||
| Cosan Alimentos S.A. (previously known as Nova América S.A. – Agroenergia) | 100.0 | % | 100.0 | % | ||||
| (1) | Previously known as Usina da Barra S.A. Açúcar e Álcool; |
| (2) | Merged into Cosan Alimentos S.A.; and |
| (3) | Interest increase through controlling shareholding acquisition (Note 8). |
| 4. | Cash and cash equivalents |
| Parent Company | Consolidated | |||||||||||||||
| 12/31/09 | 09/30/09 | 12/31/09 | 09/30/09 | |||||||||||||
| Cash | 146 | 144 | 246 | 243 | ||||||||||||
“Overnight” investments | - | - | 16,158 | 30,625 | ||||||||||||
| Bank checking accounts | 12,934 | 16,183 | 57,885 | 64,345 | ||||||||||||
| Amounts pending foreign exchange closing | 279,025 | 1,582 | 283,871 | 24,659 | ||||||||||||
| Marketable securities | 218,740 | 159,690 | 505,917 | 828,775 | ||||||||||||
| 510,845 | 177,599 | 864,077 | 948,647 | |||||||||||||
The balance of Overnight investments refers to financial investments in US dollars made with highly-rated banks, are remunerated according to the Federal Funds rate and may be promptly redeemed.
15
COSAN S.A. INDÚSTRIA E COMÉRCIO
Notes to the unaudited quarterly financial information (Continued)
December 31, 2009
(In thousands of reais)
| 4. | Cash and cash equivalents (Continued) |
Amounts pending foreign exchange closing refer to receipts of funds in foreign currency from customers located abroad, whose foreign exchange closing with the applicable financial institutions had not occurred as of the balance sheet date. Moreover, on December 31, 2009, said balance included funds from advanced payments and capital increase of the parent company Cosan Limited.
The balances of Marketable Securities mainly correspond to investments in Bank Deposit Certificates – CDB, allowing immediate redemption, at highly-rated banks and accrue in average 100.0% of the Interbank Deposit Certificate - CDI.
| 5. | Trade accounts receivable |
| Parent Company | Consolidated | |||||||||||||||
| 12/31/09 | 09/30/09 | 12/31/09 | 09/30/09 | |||||||||||||
| Domestic | 24,839 | 26,924 | 528,322 | 577,109 | ||||||||||||
| International | 13,895 | 52,913 | 39,381 | 72,432 | ||||||||||||
| (-) Allowance for doubtful accounts | (808 | ) | (842 | ) | (56,603 | ) | (59,873 | ) | ||||||||
| 37,926 | 78,995 | 511,100 | 589,668 | |||||||||||||
| 6. | Inventories |
| Parent Company | Consolidated | |||||||||||||||
| 12/31/09 | 09/30/09 | 12/31/09 | 09/30/09 | |||||||||||||
| Finished goods: | ||||||||||||||||
| Sugar | 242,735 | 162,676 | 617,825 | 479,833 | ||||||||||||
| Ethanol | 167,628 | 114,227 | 568,024 | 315,383 | ||||||||||||
| Fuels and lubricants | - | - | 292,216 | 243,985 | ||||||||||||
| Harvest costs | 120,334 | 119,052 | 313,153 | 322,022 | ||||||||||||
| Supplies and other | 58,325 | 64,623 | 173,470 | 191,180 | ||||||||||||
| Provision for inventory realization and obsolescence | (6,322 | ) | (6,861 | ) | (27,897 | ) | (20,881 | ) | ||||||||
| 582,700 | 453,717 | 1,936,791 | 1,531,522 | |||||||||||||
16
COSAN S.A. INDÚSTRIA E COMÉRCIO
Notes to the unaudited quarterly financial information (Continued)
December 31, 2009
(In thousands of reais)
| 7. | Related parties |
| Assets | ||||||||||||||||
| Parent Company | Consolidated | |||||||||||||||
| 12/31/09 | 09/30/09 | 12/31/09 | 09/30/09 | |||||||||||||
| Cosan Açúcar e Álcool S.A. | 39,127 | 219,915 | - | - | ||||||||||||
| Cosan Alimentos S.A. | 503,144 | 400,916 | - | - | ||||||||||||
| Rezende Barbosa S.A. Administração e Participações | - | - | 157,223 | 159,175 | ||||||||||||
| Vertical UK LLP | 3,717 | 9,801 | 3,747 | 12,974 | ||||||||||||
| Other | 4,253 | 6,546 | 13,535 | 1,285 | ||||||||||||
| 550,241 | 637,178 | 174,505 | 173,434 | |||||||||||||
| Current | (550,241 | ) | (637,178 | ) | (24,639 | ) | (21,613 | ) | ||||||||
| Noncurrent | - | - | 149,866 | 151,821 | ||||||||||||
| Liabilities | ||||||||||||||||
| Parent Company | Consolidated | |||||||||||||||
| 12/31/09 | 09/30/09 | 12/31/09 | 09/30/09 | |||||||||||||
| Cosan Finance Limited | 695,605 | 697,829 | - | - | ||||||||||||
| CCL Finance Limited | 316,048 | 315,191 | - | - | ||||||||||||
| Cosan Combustíveis e Lubrificantes S.A. | 52,283 | 50,781 | - | - | ||||||||||||
| Nova América S.A. Agrícola | - | - | 25,318 | - | ||||||||||||
| Logispot Armazéns Gerais S.A. | - | - | 14,992 | - | ||||||||||||
| Other | 79,549 | 26,882 | 10,146 | 3,838 | ||||||||||||
| 1,143,485 | 1,090,683 | 50,456 | 3,838 | |||||||||||||
| Current | (197,143 | ) | (124,286 | ) | (50,456 | ) | (3,838 | ) | ||||||||
| Noncurrent | 946,342 | 966,397 | - | - | ||||||||||||
17
COSAN S.A. INDÚSTRIA E COMÉRCIO
Notes to the unaudited quarterly financial information (Continued)
December 31, 2009
(In thousands of reais)
| 7. | Related parties (Continued) |
| Parent Company | ||||||||||||||||
| 10/01/09 to 12/31/09 | 11/01/08 to 01/31/09 | 10/01/09 to 12/31/09 | 11/01/08 to 01/31/09 | |||||||||||||
| Transactions involving assets | ||||||||||||||||
| Remittance of financial resources. Net of receipts and credit assignments | 15,543 | 25,630 | 692,831 | 593,846 | ||||||||||||
| Transfer of advances for future capital increase to investments | - | (1,396,202 | ) | - | (1,396,202 | ) | ||||||||||
| Sale of finished goods and services (1) | 45,017 | 46,818 | 109,028 | 113,688 | ||||||||||||
| Purchase of finished goods and services (1) | (167,794 | ) | (32,732 | ) | (531,686 | ) | (182,191 | ) | ||||||||
| Sale of finished goods and services to related parties | 11,319 | 36,539 | 66,722 | 81,170 | ||||||||||||
| Sale of properties to related company | - | 32,337 | - | 32,337 | ||||||||||||
| Financial income | 8,978 | 200,764 | 17,027 | 248,849 | ||||||||||||
| (86,937 | ) | (1,086,846 | ) | 353,922 | (508,503 | ) | ||||||||||
| Transactions involving liabilities | ||||||||||||||||
| Proceeds received as financial resources, net of payments | 54,169 | (83,797 | ) | 124,008 | (72,161 | ) | ||||||||||
| Proceedings from export prepayments | - | - | 321,755 | - | ||||||||||||
| Financial expenses (income) | (1,367 | ) | 98,481 | (182,230 | ) | 300,782 | ||||||||||
| 52,802 | 14,684 | 263,533 | 228,621 | |||||||||||||
| Consolidated | ||||||||||||||||
| 10/01/09 to 12/31/09 | 11/01/08 to 01/31/09 | 10/01/09 to 12/31/09 | 11/01/08 to 01/31/09 | |||||||||||||
| Transactions involving assets | ||||||||||||||||
| Remittance of financial resources. Net of receipts and credit assignments | (40,317 | ) | (381,009 | ) | (207,332 | ) | (511,138 | ) | ||||||||
| Sale of finished goods and services (1) | 362,652 | 87,237 | 939,500 | 338,144 | ||||||||||||
| Purchase of finished goods and services (1) | (362,652 | ) | (87,237 | ) | (939,500 | ) | (338,144 | ) | ||||||||
| Sale of finished goods and services to related parties | 41,388 | 69,815 | 185,923 | 212,071 | ||||||||||||
| Sale of properties to related company | - | 32,337 | - | 32,337 | ||||||||||||
| Sale of interest to affiliated company | - | 286,272 | - | 286,272 | ||||||||||||
| Addition by incorporation | - | - | 138,682 | - | ||||||||||||
| 1,071 | 7,415 | 117,273 | 19,542 | |||||||||||||
| Transactions involving liabilities | ||||||||||||||||
| Payments of financial resources | 47,985 | (5,903 | ) | 52,116 | (5,903 | ) | ||||||||||
| Payment of Floating Rate Notes | - | 413,158 | (322,333 | ) | 413,158 | |||||||||||
| Financial Income | (1,367 | ) | 552 | (78,615 | ) | 552 | ||||||||||
| 46,618 | 407,807 | (348,832 | ) | 407,807 | ||||||||||||
| (1) | It consists of operations carried out between Cosan’s direct and indirect subsidiaries included in the consolidation. |
The purchase and sale transactions are carried out at prices and under conditions similar to those existing in the market.
18
COSAN S.A. INDÚSTRIA E COMÉRCIO
Notes to the unaudited quarterly financial information (Continued)
December 31, 2009
(In thousands of reais)
| 7. | Related parties (Continued) |
The amount receivable from Cosan Açúcar e Álcool S.A. (“Cosan Açúcar e Álcool” previously known as Usina da Barra S.A. Açúcar e Álcool) refers to funds remitted to indirect subsidiary Cosan Centroeste S.A. on behalf of Cosan Açúcar e Álcool, which are not subject to interest.
The amount receivable from Cosan Alimentos S.A. (“Cosan Alimentos”, previously known as Nova América S.A. – Agroenergia) refers to an intercompany loan not subject to interest.
The receivable from Rezende Barbosa S.A. Administração e Participações is related to credits assumed by Rezende Barbosa, in connection with the acquisition of Cosan Alimentos and intercompany loans, which are subject to the US dollar exchange variation and annual average interest of 9.25%.
The amount receivable from the affiliate Vertical UK LLP, located in British Virgin Islands, refers to ethanol trading, with average maturity date of 30 days.
The balance payable to Cosan Finance Limited refers to future sugar export prepayment loan agreements to be settled in 2014, 2015 and 2016, which are subject to the US dollar exchange variation and Libor annual interest rate, plus spread from 4.75% to 4.85% per year.
The balance payable to CCL Finance Limited refers to prepayment contracts for future sugar exports to be settled in 2014, which is subject to US Dollar exchange variation and annual interest of 9.5%.
The balance payable to Cosan CL consists mainly to fund remitted to Cosan, with no interest thereon.
The amount payable to Nova América S.A. relates to sugarcane raw material purchased by Cosan Alimentos, whose payment is scheduled for the beginning of the next crop.
The balance payable to Logispot Armazéns Gerais S.A. (“Logispot”) refers to the outstanding payment of interest acquired, the details of which are described in Note 8.
At December 31, 2009, the Company and its subsidiary Cosan Açúcar e Álcool were lessees of approximately 54,000 hectares of related companies land ((information not reviewed) under the same control as Cosan and its affiliate Radar Propriedades Agrícolas S.A., which is controlled by another shareholder. These operations are carried out under conditions and prices similar to those prevailing in the market, calculated based on sugarcane tons per hectare, valued in accordance with the price established by CONSECANA.
19
COSAN S.A. INDÚSTRIA E COMÉRCIO
Notes to the unaudited quarterly financial information (Continued)
December 31, 2009
(In thousands of reais)
| 8. | Investments |
Parent Company | ||||||||||||||||||||||||||||||||||||||||
Investee | Investor | |||||||||||||||||||||||||||||||||||||||
Shareholders’ equity | Profit (loss) of the period | Interest % | Investments | Earnings (losses) on equity investments | ||||||||||||||||||||||||||||||||||||
12/31/09 | 04/01/09 to 12/31/09 | 12/31/09 | 09/30/09 | 12/31/09 | 09/30/09 | 10/01/09 to 12/31/09 | 11/01/08 to 01/31/09 | 04/01/09 to 12/31/09 | 05/01/08 to 01/31/09 | |||||||||||||||||||||||||||||||
| Administração de Participações Aguassanta Ltda. | 135,934 | 8,341 | 91.5 | 91.5 | 124,911 | 119,405 | 5,506 | (4,805 | ) | 9,312 | (16,140 | ) | ||||||||||||||||||||||||||||
| Cosan Açúcar e Álcool S.A. | 2,775,396 | 163,786 | 95.1 | 95.1 | 2,650,059 | 2,533,796 | 116,263 | (46,929 | ) | 197,216 | (157,662 | ) | ||||||||||||||||||||||||||||
| Copsapar Participações S.A. | 189,589 | (8,331 | ) | 90.0 | 90.0 | 170,629 | 169,226 | 1,403 | 4,265 | (7,499 | ) | 4,265 | ||||||||||||||||||||||||||||
| Novo Rumo Logística S.A. | 265,368 | (23,487 | ) | 28.8 | 28.8 | 76,479 | 75,848 | 631 | - | 1,599 | ||||||||||||||||||||||||||||||
| TEAS - Terminal Exportador de Álcool de Santos S.A. (2) | 47,674 | 1,246 | 66.7 | 40.0 | 39,123 | 18,975 | 146 | 152 | 507 | 549 | ||||||||||||||||||||||||||||||
| Cosan S.A. Bioenergia | 132,754 | (3,534 | ) | 100.0 | 100.0 | 132,754 | 140,093 | (7,339 | ) | (3,277 | ) | (3,534 | ) | (3,998 | ) | |||||||||||||||||||||||||
| Radar Propriedades Agrícolas S.A. | 812,110 | 13,009 | 18.9 | 18.9 | 153,642 | 151,137 | (441 | ) | 1,080 | 623 | (407 | ) | ||||||||||||||||||||||||||||
| Cosan International Universal Corporation | 1,030 | (9,033 | ) | 100.0 | 100.0 | 1,030 | 8,992 | (7,817 | ) | 205 | (9,033 | ) | 4,791 | |||||||||||||||||||||||||||
| Cosan Finance Limited | 23,247 | 1,738 | 100.0 | 100.0 | 23,247 | 23,211 | 517 | 2,675 | 1,738 | 9,477 | ||||||||||||||||||||||||||||||
| Cosanpar Participações S.A. (1) | - | - | - | - | - | - | - | (22,596 | ) | 72,212 | (22,596 | ) | ||||||||||||||||||||||||||||
| Cosan Combustíveis e Lubrificantes S.A. | 1,874,569 | 188,481 | 100.0 | 100.0 | 1,874,543 | 1,844,021 | 30,522 | - | 116,210 | - | ||||||||||||||||||||||||||||||
| Cosan Alimentos S.A. | 289,849 | 100.0 | 100.0 | 289,849 | 268,587 | 21,262 | - | 45,799 | - | |||||||||||||||||||||||||||||||
| Other investments | - | - | - | - | 22,126 | 24,637 | (9,034 | ) | 11,918 | (13,988 | ) | 14,863 | ||||||||||||||||||||||||||||
| 5,558,392 | 5,377,928 | 151,619 | (57,312 | ) | 411,162 | (166,858 | ) | |||||||||||||||||||||||||||||||||
| (1) | Company merged into Cosan CL; and |
| (2) | The investment balance on December 31, 2009 includes goodwill from the acquisition of shares amounting to R$7,340. |
| Parent Company | Consolidated | |||||||
| Opening balances | 5,377,928 | 196,497 | ||||||
| Earnings (losses) on equity investments | 151,619 | (9,360 | ) | |||||
| Acquisition of investments | 22,131 | 25,999 | ||||||
| Goodwill on share acquisition | 7,340 | - | ||||||
| Currency translation adjustment | (626 | ) | - | |||||
| Write-off due to consolidation | - | (19,090 | ) | |||||
| Closing balances | 5,558,392 | 194,046 | ||||||
20
COSAN S.A. INDÚSTRIA E COMÉRCIO
Notes to the unaudited quarterly financial information (Continued)
December 31, 2009
(In thousands of reais)
| 8. | Investments (Continued) |
Business combination with Grupo Rezende Barbosa
a. Rumo Logística S.A.
According to the shareholders’ agreement executed on April 9, 2008, the port concessions and assets for sugar export owned by the Company and by Rezende Barbosa S.A. Administração e Participações (“Rezende Barbosa”) were concentrated on Novo Rumo Logística S.A. (“Novo Rumo”), which is indirectly controlled by the Company.
On April 10, 2009 the Company and Rezende Barbosa, parent company of Grupo Nova América integrated the port terminals of Cosan and Teaçu Armazéns Gerais S.A. (“Teaçu”), a subsidiary of Rezende Barbosa. As a consequence of this operation, which involved the payment of R$121,331 and the issuance of shares of Novo Rumo, the Company acquired 100% of Teaçu, becoming the indirect holder of a 64.06% interest of Rumo, and 28.82% remained held by Rezende Barbosa. This operation resulted in a R$66,968 goodwill classified as Intangible assets.
In addition, the capital reorganization resulted in a total net capital loss of R$31,190, recorded in results for the period as Other operating income (expenses), net.
b. Curupay Participações S.A.
At a Special General Meeting held on June 18, 2009 the Company’s shareholders approved the acquisition of Curupay S.A. Participações (“Curupay”), then a subsidiary of Rezende Barbosa, through the issuance of 44,300,389 common shares for R$334,172.
Beginning that date, the Company incorporated in its net asset the Curupay’s investments, comprising (i) 28.82% interest in Novo Rumo, (ii) 100% direct interest in Nova América S.A. Trading, and (iii) 100% direct and indirect interest in Cosan Alimentos (previously known as Nova América S.A. – Agroenergia) and subsidiaries. As a consequence of this transaction, the Company increased to 92.88% its direct and indirect interest in Novo Rumo, generating R$3,052 of capital gain, recorded in the results for the period as Other operating income (expenses), net.
21
COSAN S.A. INDÚSTRIA E COMÉRCIO
Notes to the unaudited quarterly financial information (Continued)
December 31, 2009
(In thousands of reais)
8. | Investments (Continued) |
At the end of that operation, the Company recorded R$18,194 goodwill, arising from the equity variation between the date of net assets calculation at book value and the date of approval of Curupay’s merger by the Company shareholders on June 18, 2009.
For purposes of consolidation of Cosan Alimentos and Nova América S.A. Trading, the opening balance taken into consideration was that of net assets adjusted to the Company’s accounting practices on June 1, 2009.
On November 18, 2009, Nova América S.A. Trading was merged into Cosan Alimentos.
Sale of equity interest to Shell do Brasil Ltda. (“Shell”)
On June 17, 2009, Cosanpar sold to Shell its equity interest in Jacta Participações S.A. (“Jacta”), which concentrated the aviation fuel business, for R$115,601. As a result of this operation, Cosanpar fully wrote off the cost of R$22,504 and related goodwill of R$85,589, generating a R$7,508 net gain on this transaction, recorded in the results for the period as Other operating income (expenses), net and Realization of goodwill through sale, respectively.
Acquisition of interest
a. TEAS Santos Ethanol Exporting Terminal (“TEAS”)
On November 24, 2009, the Company acquired 10,527,295 common shares issued by TEAS for R$20,002, increasing its interest by 26.67%, to 66.67% of the voting capital of TEAS. As a result, the company recorded goodwill of R$7,340, to be economically justified through a report issued by a specialized company.
For purposes of consolidation of TEAS, the opening balance was considered to be the shareholders’ equity adjusted to the Company’s accounting practices on December 1, 2009.
b. Logispot Armazéns Gerais S.A. (“Logispot”)
On November 12, 2009, Cosan, through its subsidiary Rumo Logística S.A., acquired 166,590 common shares issued by Logispot, the equivalent to 14.28% of Logispot's capital, for R$$19,992, R$5,000 of which was paid n cash and the outstanding balance to be paid in 12 monthly, consecutive and equal installments.
22
COSAN S.A. INDÚSTRIA E COMÉRCIO
Notes to the unaudited quarterly financial information (Continued)
December 31, 2009
(In thousands of reais)
| 9. | Property, plant and equipment |
| Parent Company | ||||||||||||||||||||
| 12/31/09 | 09/30/09 | |||||||||||||||||||
| Average annual depreciation rates (%) | Cost | Accumulated depreciation/ amortization | Net | Net | ||||||||||||||||
| Land and rural properties | - | 59,591 | - | 59,591 | 59,591 | |||||||||||||||
| Machinery, equipment and installations | 12 | 499,591 | (292,516 | ) | 207,075 | 205,832 | ||||||||||||||
| Aircraft | 10 | 13,395 | (12,562 | ) | 833 | 1,206 | ||||||||||||||
| Vehicles | 22 | 64,152 | (38,544 | ) | 25,608 | 27,280 | ||||||||||||||
| Furniture, fixtures and computer equipment | 18 | 73,834 | (35,852 | ) | 37,982 | 38,855 | ||||||||||||||
| Buildings and improvements | 4 | 172,540 | (32,732 | ) | 139,808 | 137,384 | ||||||||||||||
| Construction in progress | - | 56,135 | - | 56,135 | 48,137 | |||||||||||||||
| Sugarcane planting costs | 20 | 437,332 | (222,407 | ) | 214,925 | 219,851 | ||||||||||||||
| Parts and components to be periodically replaced | 100 | 15,763 | - | 15,763 | 23,289 | |||||||||||||||
| 1,392,333 | (634,613 | ) | 757,720 | 761,425 | ||||||||||||||||
| Consolidated | ||||||||||||||||||||
| 12/31/09 | 09/30/09 | |||||||||||||||||||
| Average annual depreciation rates (%) | Cost | Accumulated depreciation/ amortization | Net | Net | ||||||||||||||||
| Land and rural properties | - | 207,596 | - | 207,596 | 206,802 | |||||||||||||||
| Machinery, equipment and installations | 11 | 2,918,049 | (1,495,201 | ) | 1,422,848 | 1,249,821 | ||||||||||||||
| Aircraft | 10 | 18,822 | (12,657 | ) | 6,165 | 1,905 | ||||||||||||||
| Vehicles | 19 | 232,650 | (140,763 | ) | 91,887 | 85,115 | ||||||||||||||
| Furniture, fixtures and computer equipment | 18 | 179,227 | (114,845 | ) | 64,382 | 66,110 | ||||||||||||||
| Buildings and improvements | 4 | 1,034,862 | (310,234 | ) | 724,628 | 710,360 | ||||||||||||||
| Construction in progress | - | 1,525,414 | - | 1,525,414 | 1,402,247 | |||||||||||||||
| Sugarcane planting costs | 20 | 1,352,829 | (672,962 | ) | 679,867 | 704,337 | ||||||||||||||
| Parts and components to be periodically replaced | 100 | 75,262 | (34,549 | ) | 40,713 | 69,364 | ||||||||||||||
| Advances for fixed asset purchases | - | 91,558 | - | 91,558 | 158,147 | |||||||||||||||
| Others | 10 | 27,552 | (11,076 | ) | 16,476 | 17,165 | ||||||||||||||
| 7,663,821 | (2,792,287 | ) | 4,871,534 | 4,671,373 | ||||||||||||||||
The consolidated balance of construction in progress and advances for fixed asset purchases corresponds, substantially, to investments in co-generation capacity, upgrading, expansion e preparation of industrial plants, expanding warehousing capacity, and advances for machinery and equipment purchases by electric power co-generation plants.
23
COSAN S.A. INDÚSTRIA E COMÉRCIO
Notes to the unaudited quarterly financial information (Continued)
December 31, 2009
(In thousands of reais)
| 10. | Intangible assets |
| Refers mainly to goodwill paid for expected future profitability, amortized on a straight-line basis over 5 to 10 years until March 31, 2009, as set forth in CPC Technical Pronouncement No. 13, approved by CVM Resolution Nº 565, of December 17, 2008. At December 31, 2009 and September 30, 2009, the balances are as follows: |
| Parent Company | ||||||||||||||||
| 12/31/09 | 09/30/09 | |||||||||||||||
| Cost | Accumulated amortization | Net | Net | |||||||||||||
| Goodwill on the acquisition of JVM Participações S.A. | 63,720 | (53,100 | ) | 10,620 | 10,620 | |||||||||||
| Goodwill on the acquisition of Grupo Mundial | 127,953 | (40,518 | ) | 87,435 | 87,435 | �� | ||||||||||
| Goodwill on the payment of capital of Mundial | 21,142 | (6,342 | ) | 14,800 | 14,800 | |||||||||||
| Goodwill on the acquisition of Corona (ABC 125 and ABC 126) | 267,824 | (84,811 | ) | 183,013 | 183,013 | |||||||||||
| Goodwill on the acquisition of Usina Açucareira Bom Retiro S.A. | 115,165 | (33,590 | ) | 81,575 | 81,575 | |||||||||||
| Goodwill on the incorporation of Curupay (Cosan Alimentos) | 18,194 | - | 18,194 | 18,194 | ||||||||||||
| 613,998 | (218,361 | ) | 395,637 | 395,637 | ||||||||||||
| Consolidated | ||||||||||||||||
| 12/31/09 | 09/30/09 | |||||||||||||||
| Cost | Accumulated amortization | Net | Net | |||||||||||||
| Goodwill on the acquisition of JVM Participações S.A. | 63,720 | (53,100 | ) | 10,620 | 10,620 | |||||||||||
| Goodwill on the acquisition of Cosan Açúcar e Álcool | 35,242 | (34,684 | ) | 558 | 558 | |||||||||||
| Goodwill on the constitution of FBA | 22,992 | (18,585 | ) | 4,407 | 4,407 | |||||||||||
| Goodwill on the acquisition of Univalem S.A. Açúcar e Álcool | 24,118 | (19,100 | ) | 5,018 | 5,018 | |||||||||||
| Goodwill on the acquisition of Grupo Destivale | 69,918 | (27,424 | ) | 42,494 | 42,494 | |||||||||||
| Goodwill on the acquisition of Grupo Mundial | 127,953 | (40,518 | ) | 87,435 | 87,435 | |||||||||||
| Goodwill on the payment of capital of Mundial | 21,142 | (6,342 | ) | 14,800 | 14,800 | |||||||||||
| Goodwill on the acquisition of Corona | 818,831 | (255,815 | ) | 563,016 | 563,016 | |||||||||||
| Goodwill on the acquisition of Usina Açucareira Bom Retiro S.A. | 115,165 | (33,590 | ) | 81,575 | 81,575 | |||||||||||
| Goodwill on the acquisition of Usina Santa Luiza | 47,053 | (4,705 | ) | 42,348 | 42,348 | |||||||||||
| Goodwill on the acquisition of Benálcool | 167,300 | (18,053 | ) | 149,247 | 149,247 | |||||||||||
| Goodwill on the acquisition of Aliança | 1,860 | - | 1,860 | 1,860 | ||||||||||||
| Goodwill on the acquisition of Cosan CL (1) | 1,497,971 | (134,395 | ) | 1,363,576 | 1,342,914 | |||||||||||
| Goodwill on the acquisition of Teaçu (2) | 66,968 | - | 66,968 | 66,968 | ||||||||||||
| Goodwill on the incorporation of Curupay (Cosan Alimentos) (3) | 18,194 | - | 18,194 | 18,194 | ||||||||||||
| Goodwill on the acquisition of Açúcar União trade mark (4) | 74,832 | (57,371 | ) | 17,461 | 17,461 | |||||||||||
| Goodwill on the acquisition of Destilaria Paraguaçu (4) | 166,656 | - | 166,656 | 166,656 | ||||||||||||
| Goodwill on the subscription of shares of Nova América (4) | 121,893 | - | 121,893 | 121,893 | ||||||||||||
| Goodwill on the subscription of shares of TEAS (5) | 7,340 | - | 7,340 | - | ||||||||||||
| 3,469,148 | (703,682 | ) | 2,765,466 | 2,737,464 | ||||||||||||
| (1) | As mentioned in Note 8, on June 17, 2009 Cosanpar sold to Shell its equity interest in Jacta, fully realizing the R$85,589 goodwill on that investment. |
| (2) | Goodwill generated in the ports integration of groups Cosan and Rezende Barbosa, described in note 8. |
| (3) | As mentioned in Note 8, in the business combination between groups Cosan and Rezende Barbosa, through the incorporation of Curupay, the Company recorded a R$18,194 goodwill. |
| (4) | As mentioned in Note 8, goodwill incorporated on business combination. |
| (5) | Goodwill from interest increase, as per Note 8. |
24
COSAN S.A. INDÚSTRIA E COMÉRCIO
Notes to the unaudited quarterly financial information (Continued)
December 31, 2009
(In thousands of reais)
| 11. | Taxes and social contributions payable |
| Parent Company | Consolidated | |||||||||||||||
| 12/31/09 | 09/30/09 | 12/31/09 | 09/30/09 | |||||||||||||
| ICMS – State VAT | 3 | 15,875 | 21,755 | 63,920 | ||||||||||||
| IPI | 252 | 486 | 25,371 | 29,339 | ||||||||||||
| INSS – Social Security | 4,870 | 5,969 | 16,129 | 19,950 | ||||||||||||
| PIS – Social Integration Program | 390 | 364 | 4,544 | 4,229 | ||||||||||||
| COFINS – Social Security Financing | 1,795 | 1,675 | 20,828 | 20,667 | ||||||||||||
| Installment payments – Law 11,941/09 and MP 470 | 67,797 | 10,675 | 314,673 | 25,803 | ||||||||||||
| Tax Recovery Program – REFIS | - | - | - | 222,462 | ||||||||||||
| Special Tax Payment Program – PAES | - | 50,427 | 436 | 82,028 | ||||||||||||
| Income and social contribution taxes payable | 1,974 | 1,965 | 29,218 | 34,627 | ||||||||||||
| Other | 7,453 | 5,874 | 23,740 | 16,750 | ||||||||||||
| 84,534 | 93,310 | 456,694 | 519,775 | |||||||||||||
| Current liabilities | (24,393 | ) | (44,832 | ) | (200,979 | ) | (230,925 | ) | ||||||||
| Noncurrent liabilities | 60,141 | 48,478 | 255,715 | 288,850 | ||||||||||||
Noncurrent amounts will become due as follows:
| Parent Company | Consolidated | |||||||||||||||
| 12/31/09 | 09/30/09 | 12/31/09 | 09/30/09 | |||||||||||||
| 13 to 24 months | 8,865 | 15,004 | 36,527 | 56,958 | ||||||||||||
| 25 to 36 months | 7,138 | 14,232 | 34,745 | 55,865 | ||||||||||||
| 37 to 48 months | 4,409 | 10,422 | 31,182 | 49,356 | ||||||||||||
| 49 to 60 months | 4,213 | 4,188 | 30,734 | 36,851 | ||||||||||||
| 61 to 72 months | 4,187 | 1,026 | 26,325 | 33,109 | ||||||||||||
| 73 to 84 months | 4,187 | 1,026 | 20,139 | 31,791 | ||||||||||||
| 85 to 96 months | 3,811 | 1,026 | 15,690 | 16,163 | ||||||||||||
| Thereafter | 23,331 | 1,554 | 60,373 | 8,757 | ||||||||||||
| 60,141 | 48,478 | 255,715 | 288,850 | |||||||||||||
25
COSAN S.A. INDÚSTRIA E COMÉRCIO
Notes to the unaudited quarterly financial information (Continued)
December 31, 2009
(In thousands of reais)
| 11. | Taxes and social contributions payable (Continued) |
Tax debt installments – Law 11,941/09 and MP 470/09
On September 30, 2009, the Company and its indirect controlled subsidiary Bomfim Nova Tamoio – BNT Agrícola Ltda. opted by the installment program provided by Law 11,941/09, related to: (i) remaining balance of its regular installment payments; and, (ii) remaining installments balance previously included in the REFIS program, respectively.
During the quarter ended December 31, 2009, the Company and its subsidiaries Cosan Açúcar e Álcool S.A., Benálcool Açúcar e Álcool S.A. and Administração de Participações Aguassanta Ltda. opted for the payment in installments as per Law 11,941/09 and Provisional Measure 470/09.
The effects of that installment option are as follows:
| 12/31/09 | ||||||||
| Parent Company | Consolidated | |||||||
| Taxes and social contributions payable | 153,394 | 572,944 | ||||||
| Tax claims with risk deemed as probable | 165,897 | 390,260 | ||||||
| Liabilities with third-parties | - | (24,047 | ) | |||||
| Legal deductions | (85,754 | ) | (201,319 | ) | ||||
| 233,537 | 737,838 | |||||||
| Reversal of original provisions (*) | (79,433 | ) | (211,649 | ) | ||||
| Deferred income and social contribution taxes | (85,554 | ) | (203,904 | ) | ||||
| Payments after adhesion to installment program | (1,550 | ) | (11,187 | ) | ||||
| Interest | 797 | 3,575 | ||||||
| Outstanding balance | 67,797 | 314,673 | ||||||
(*) Recorded to the period’s income as Other operating revenues (expenses), net (Note 18).
The company is currently assessing the inclusion of other debts in the installment program provided by Law No 11,941/09.
The Company and its subsidiaries must comply with several conditions to continue benefiting from the installment payment programs, particularly with the regular payment of the installments as required by law.
General considerations
Under the self-assessment tax system adopted in Brazil, income tax returns filed may be audited by tax authorities for a period of five years from their filling.
26
COSAN S.A. INDÚSTRIA E COMÉRCIO
Notes to the unaudited quarterly financial information (Continued)
December 31, 2009
(In thousands of reais)
| 12. | Income and social contribution taxes |
| a) | Reconciliation of income and social contribution tax expenses: |
| Parent Company | ||||||||||||||||
| 10/01/09 to 12/31/09 | 11/01/08 to 01/31/09 | 04/01/09 to 12/31/09 | 05/01/08 to 01/31/09 | |||||||||||||
| Income (loss) before income and social contribution taxes | 174,806 | 66,621 | 823,792 | (543,134 | ) | |||||||||||
| Income and Social Contribution taxes at nominal rate (34%) | (59,434 | ) | (22,651 | ) | (280,089 | ) | 184,666 | |||||||||
| Adjustments to calculate effective rate: | ||||||||||||||||
| Earnings (losses) on equity investments | 51,550 | (19,486 | ) | 139,795 | (56,732 | ) | ||||||||||
| Non-deductible goodwill amortization | - | (569 | ) | - | (1,707 | ) | ||||||||||
| Non-deductible donations and contributions | (801 | ) | (149 | ) | (1,676 | ) | (1,744 | ) | ||||||||
| Recognized granted shares | 26 | - | (2,879 | ) | - | |||||||||||
| Tax effect of the adhesion to the installment program of Law No 11,941/2009 and MP 470 | (836 | ) | - | (836 | ) | - | ||||||||||
| Taxable income assessed in subsidiaries abroad | - | (11,545 | ) | - | (11,545 | ) | ||||||||||
| Revaluation reserve realization | - | (7,429 | ) | - | (7,429 | ) | ||||||||||
| Inventory loss and differences | (49 | ) | (15 | ) | (329 | ) | 409 | |||||||||
| Other | 1,867 | 431 | (13 | ) | 3,610 | |||||||||||
| Total current and deferred taxes | (7,677 | ) | (61,413 | ) | (146,027 | ) | 109,528 | |||||||||
| Effective rate | 4.39 | % | 92.19 | % | 17.73 | % | - | |||||||||
27
COSAN S.A. INDÚSTRIA E COMÉRCIO
Notes to the unaudited quarterly financial information (Continued)
December 31, 2009
(In thousands of reais)
| 12. | Income and social contribution taxes (Continued) |
| a) | Reconciliation of income and social contribution tax expenses: (Continued) |
| Consolidated | ||||||||||||||||
| 10/01/09 to 12/31/09 | 11/01/08 to 01/31/09 | 04/01/09 to 12/31/09 | 05/01/08 to 01/31/09 | |||||||||||||
| Income (loss) before income and social contribution taxes | 253,044 | 58,450 | 1,016,411 | (609,565 | ) | |||||||||||
| Income and Social Contribution taxes at nominal rate (34%) | (86,035 | ) | (19,873 | ) | (345,580 | ) | 207,252 | |||||||||
| Adjustments to calculate effective rate: | ||||||||||||||||
| Earnings (losses) on equity investments | (3,182 | ) | 4,607 | (4,381 | ) | 4,576 | ||||||||||
| Non-deductible goodwill amortization | - | (1,415 | ) | - | (4,245 | ) | ||||||||||
| Non-deductible donations and contributions | (1,402 | ) | (293 | ) | (2,711 | ) | (2,576 | ) | ||||||||
| Recognized granted shares | 26 | - | (2,879 | ) | - | |||||||||||
| Tax effect in the adhesion to the installment program of Law No 11.941/2009 and MP470 | 493 | - | 493 | - | ||||||||||||
| Taxable income assessed in subsidiaries abroad | - | (11,545 | ) | - | (11,545 | ) | ||||||||||
| Revaluation reserve realization | - | (27,203 | ) | - | (27,203 | ) | ||||||||||
| Inventory loss and differences | 22 | (12 | ) | (1,311 | ) | 777 | ||||||||||
| Other | 4,821 | 2,449 | 9,396 | 7,994 | ||||||||||||
| Total current and deferred taxes | (85,257 | ) | (53,285 | ) | (346,973 | ) | 175,030 | |||||||||
| Effective rate | 33.69 | % | 91.16 | % | 34.14 | % | - | |||||||||
| b) | Deferred income and social contribution tax assets: |
| Parent Company | ||||||||||||||||||||
| 12/31/09 | 09/30/09 | |||||||||||||||||||
| Base | IRPJ 25% | CSSL 9% | Total | Total | ||||||||||||||||
| Provision for judicial demands and other temporary differences (1) | 256,560 | 64,140 | 23,090 | 87,230 | 119,075 | |||||||||||||||
| Foreign exchange variation | (534,107 | ) | (133,527 | ) | (48,069 | ) | (181,596 | ) | (170,246 | ) | ||||||||||
| Income tax losses | 293,000 | 73,250 | - | 73,250 | 109,942 | |||||||||||||||
| Social contribution tax losses | 293,102 | - | 26,380 | 26,380 | 39,589 | |||||||||||||||
| Deferred taxes - noncurrent assets | 3,863 | 1,401 | 5,264 | 98,360 | ||||||||||||||||
| Consolidated | ||||||||||||||||||||
| 12/31/09 | 09/30/09 | |||||||||||||||||||
| Base | IRPJ 25% | CSSL 9% | Total | Total | ||||||||||||||||
| Provision for judicial demands and other temporary differences (1) | 1,162,138 | 290,535 | 104,592 | 395,127 | 485,718 | |||||||||||||||
| Foreign exchange variation | (630,751 | ) | (157,688 | ) | (56,768 | ) | (214,456 | ) | (204,815 | ) | ||||||||||
| Income tax losses | 534,045 | 133,511 | - | 133,511 | 233,508 | |||||||||||||||
| Social contribution tax losses | 546,521 | - | 49,187 | 49,187 | 85,184 | |||||||||||||||
| Deferred taxes | 266,358 | 97,011 | 363,369 | 599,595 | ||||||||||||||||
| Current assets | (29,155 | ) | (48,108 | ) | ||||||||||||||||
| Noncurrent assets | 334,214 | 551,487 | ||||||||||||||||||
(1) Presented net of deferred income and social contribution tax liabilities.
28
COSAN S.A. INDÚSTRIA E COMÉRCIO
Notes to the unaudited quarterly financial information (Continued)
December 31, 2009
(In thousands of reais)
| 12. | Income and social contribution taxes (Continued) |
| b) | Deferred income and social contribution tax assets: (Continued) |
Deferred income and social contribution tax on accumulated loss must be realized within 10 years, according to the Company’s and its subsidiaries’ expected profitability shown in financial projections prepared by management, which were examined by the Company’s supervisory board and submitted to the Board of Directors in the Annual General Shareholders Meeting for the year ended March 31, 2009.
Recovery of such tax credits is estimated to occur in the following years:
| Parent Company | Consolidated | |||||||||||||||
| 12/31/09 | 09/30/09 | 12/31/09 | 09/30/09 | |||||||||||||
| 2011 | 48 | 901 | 15,986 | 27,233 | ||||||||||||
| 2012 | 566 | 10,580 | 36,341 | 59,868 | ||||||||||||
| 2013 | 1,199 | 22,395 | 62,216 | 102,496 | ||||||||||||
| 2014 | 1,674 | 31,281 | 83,546 | 137,635 | ||||||||||||
| From 2015 to 2017 | 1,441 | 26,929 | 91,964 | 151,502 | ||||||||||||
| From 2018 to 2019 | 336 | 6,274 | 44,161 | 72,753 | ||||||||||||
| 5,264 | 98,360 | 334,214 | 551,487 | |||||||||||||
The tax credit recovery estimates were based on taxable profit projections, taking into consideration several financial and business assumptions on the balance sheet preparation date. During the quarter ended December 31, 2009, the estimated deadline for realization of deferred taxes did not change in relation to that disclosed in the financial statements at March 31, 2009.
29
COSAN S.A. INDÚSTRIA E COMÉRCIO
Notes to the unaudited quarterly financial information (Continued)
December 31, 2009
(In thousands of reais)
| 13. | Loans and financing |
| Financial charge (1) | Parent Company | Consolidated | Collaterals (2) | |||||||||||||||||||||||||||||
| Purpose | Index | Annual average interest rate | 12/31/09 | 9/30/09 | 12/31/09 | 9/30/09 | Final maturity | 12/31/09 | 9/30/09 | |||||||||||||||||||||||
| Senior Notes Due 2009 | Dollar (US) | 9.0% interest | - | 66,399 | - | 66,399 | November/2009 | - | - | |||||||||||||||||||||||
| Senior Notes Due 2014 | Dollar (US) | 9.5% interest | - | - | 632,256 | 629,969 | August/2014 | - | - | |||||||||||||||||||||||
| Senior Notes Due 2017 | Dollar (US) | 7.0% interest | - | - | 716,659 | 719,400 | February/2017 | - | - | |||||||||||||||||||||||
| Perpetual bonuses | Dollar (US) | 8.3% interest | 792,775 | 809,575 | 792,775 | 809,575 | - | - | - | |||||||||||||||||||||||
| IFC | Dollar (US) | 7.4% interest | 90,937 | 82,957 | 90,937 | 82,957 | January/2013 | Chattel mortgage | Chattel mortgage | |||||||||||||||||||||||
| Pre-shipment export finance (ACC) | Dollar (US) | 7.6% interest | 200,972 | 53,492 | 223,187 | 90,982 | March/2010 | - | - | |||||||||||||||||||||||
| Commercial promissory notes | DI – Interbank Deposits | 3.0% interest | - | 1,233,706 | - | 1,233,706 | November/2009 | Chattel mortgage | Chattel mortgage | |||||||||||||||||||||||
| Resolution No. 2471 | IGP-M | 4.0% interest | 96,276 | 96,262 | 586,705 | 593,583 | December/2020 | National Treasury Certificates and mortgage on land | National Treasury Certificates and mortgage on land | |||||||||||||||||||||||
| Change in the price of corn | 12.5% interest | 121 | 129 | 121 | 129 | October/2025 | ||||||||||||||||||||||||||
| BNDES (3) | Long-term interest rate (TJLP) | 2.6% interest | - | - | 844,772 | 714,760 | January/2022 | Credit rights from energy sale agreements | Credit rights from energy sale agreements | |||||||||||||||||||||||
| Bank Credit Certificate | DI – Interbank deposits | 3.9% interest | - | - | 121,060 | 217,443 | November/2009 | - | - | |||||||||||||||||||||||
| (Subordinated) debentures | DI – Interbank deposits | 3.3% interest | - | - | - | 152,556 | August/2010 | - | - | |||||||||||||||||||||||
| Credit notes | DI – Interbank deposits | 2.4% interest | 304,213 | - | 334,477 | 134,151 | September/2011 | - | - | |||||||||||||||||||||||
| Dollar (US) | 8.8% interest | 176,042 | - | 176,042 | 88,766 | January/2010 | - | - | ||||||||||||||||||||||||
| Prepayments | DI – Interbank deposits | 0.6% interest | - | - | - | 3,041 | December/2011 | - | - | |||||||||||||||||||||||
| Dollar (US) | 2.6% interest | - | - | - | 92,043 | November/2010 | - | - | ||||||||||||||||||||||||
| Dollar (US) | 5.2% interest | 524,906 | - | 960,027 | - | September/2014 | - | - | ||||||||||||||||||||||||
| Others | Sundry | Sundry | 21,817 | 22,770 | 320,448 | 267,773 | Sundry | Mortgage, inventories and chattel mortgage of financed assets | Mortgage, inventories and chattel mortgage of financed assets | |||||||||||||||||||||||
| Expenses with placement of securities | (21,164 | ) | (16,839 | ) | (47,739 | ) | (45,190 | ) | - | - | - | |||||||||||||||||||||
| 2,186,877 | 2,348,451 | 5,751,709 | 5,852,053 | |||||||||||||||||||||||||||||
| Current | (479,412 | ) | (444,697 | ) | (892,636 | ) | (1,184,658 | ) | ||||||||||||||||||||||||
| Non-current | 1,707,465 | 1,903,754 | 4,859,073 | 4,667,395 | ||||||||||||||||||||||||||||
| (1) | Financial charges at December 31, 2009, except as otherwise stated; |
| (2) | All loans and financing are backed by promissory notes and guarantees provided by the Company and its subsidiaries and by majority shareholders, plus the aforesaid security interest; and, |
| (3) | It comprises funds raised by the subsidiary Cosan S.A. Bioenergia and indirect controlled subsidiary Cosan Centroeste S.A. Açúcar e Álcool earmarked for the financing of co-generation projects and Greenfields. |
30
COSAN S.A. INDÚSTRIA E COMÉRCIO
Notes to the unaudited quarterly financial information (Continued)
December 31, 2009
(In thousands of reais)
| 13. | Loans and financing (Continued) |
Noncurrent loans, deducted the transaction costs amortization, have the following scheduled maturities:
| Parent Company | Consolidated | |||||||||||||||
| 12/31/09 | 09/30/09 | 12/31/09 | 09/30/09 | |||||||||||||
| 13 to 24 months | 326,037 | 945,416 | 586,001 | 1,143,290 | ||||||||||||
| 25 to 36 months | 501,554 | 17,331 | 718,163 | 158,933 | ||||||||||||
| 37 to 48 months | 811 | 44,002 | 214,724 | 127,260 | ||||||||||||
| 49 to 60 months | 8 | 1,251 | 194,179 | 705,295 | ||||||||||||
| 61 to 72 months | 8 | 8 | 84,696 | 74,686 | ||||||||||||
| 73 to 84 months | 8 | 8 | 82,302 | 69,444 | ||||||||||||
| 85 to 96 months | 8 | 8 | 776,941 | 779,817 | ||||||||||||
| Thereafter | 879,031 | 895,730 | 2,202,067 | 1,608,670 | ||||||||||||
| 1,707,465 | 1,903,754 | 4,859,073 | 4,667,395 | |||||||||||||
Resolution No. 2,471
From 1998 to 2000, the Company and its subsidiaries renegotiated their debt related to agricultural funding with several financial institutions, thereby reducing their financial cost to annual interest rates below 10% and guaranteeing the amortization of the updated principal amount with the assignment and transfer of CTNs - Restricted Brazilian Treasury Bills redeemable on the debt maturity dates, using the tax incentive introduced by Resolution No. 2471, issued by the Central Bank of Brazil on February 26, 1998. On December 31, 2009, these certificates, classified as noncurrent assets, amounted to R$29,553 (R$28,755 at September 30, 2009), at the parent company and R$194,590 (R$189,342 at September 30, 2009) at consolidated. Payments pursuant to such certificates are remunerated based on the IGP-M variation plus annual interest of 12%. Upon payment of the debt, the redemption value should be similar to the amount of the renegotiated debt. Interest referring to these financings is paid annually and principal is to be entirely settled in 2020 at the Company, and in 2025 at consolidated.
Senior Notes due in 2017
On January 26, 2007, the wholly-owned subsidiary Cosan Finance Limited issued Senior Notes in the international capital markets under Rule 144A and Regulation S of the U.S. Securities Act of 1933, in the amount of US$400 million. These Senior Notes bear interest at a rate of 7% per annum, payable semi-annually in February and August of each year.
31
COSAN S.A. INDÚSTRIA E COMÉRCIO
Notes to the unaudited quarterly financial information (Continued)
December 31, 2009
(In thousands of reais)
| 13. | Loans and financing (Continued) |
Senior Notes due in 2014
On August 4, 2009, the indirect subsidiary CCL Finance Limited issued US$350 million of Senior Notes in the international capital markets according to Regulations S and 144A that bear interest at a rate of 9.5% per annum, payable semi-annually in February and August of each year, from February 2010.
Perpetual Bonds
On January, 24 and February 10, 2006, the Company issued perpetual bonds in the international market in accordance with Regulations S and Rule 144A, in the amount of US$450 million for qualified institutional investors. Perpetual bonds are listed in the Luxemburg Stock Exchange - EURO MTF and bear interest of 8.25% per year, payable quarterly on the 15th of May, August, November and February of each year, beginning May 15, 2006. These bonds may, at the discretion of the Company, be redeemed as from February 15, 2011 on any interest payment date, for their face value. Perpetual bonds are secured by the Company and Cosan Açúcar e Álcool.
Commercial Promissory Notes
On November 17, 2008, the Company issued 44 nominal promissory notes of a single series at the price of R$25,000 each, whose offering reached R$1,100,000.
On November 12, 2009, the Company made the complete payment of this financing facility, totaling R$1,249,745.
32
COSAN S.A. INDÚSTRIA E COMÉRCIO
Notes to the unaudited quarterly financial information (Continued)
December 31, 2009
(In thousands of reais)
| 13. | Loans and financing (Continued) |
Debentures (subordinated)
On August 13, 2008 the controlled Nova América S.A. – Agroenergia issued 1 simple debenture, subordinated, nominative, book entry and non-convertible into shares, with nominal value at the issuance date of R$150,000, which was subscribed and fully-paid in August 21, 2008.
On October 29, 2009, Cosan Alimentos S.A. made the full advanced payment of the debentures, totaling R$154,995.
Advanced payments
During the quarter ended December 31, 2009, the Company and its subsidiary Cosan Alimentos S.A. funded R$924,327, the equivalent to US$530 million as advances for future sugar exports to the settled in 2012 and 2014. Exchange rate variation and annual interests based on the Libor rate, plus 5.2% spread p.a. are levied over these advances.
Restrictive covenants in the loan and financing agreements
The Company and its subsidiaries are subject to certain restrictive covenants contained in loan and financing agreements, the most significant being: (i) limitation of transactions with shareholders and affiliates; (ii) limitation in payment of dividends and other payment restrictions which affect subsidiaries; and (iii) limitation of concession of warranty on assets.
All restrictive covenants have been fully met by the Company and its subsidiaries.
Expenses with issuance of Notes
Expenses incurred with the issuance of Senior (2014 and 2017) and Commercial Promissory are recorded net in the respective financings, in current and noncurrent liabilities, and amortized up to the respective maturity date of the notes. Specifically for Perpetual Bonds, amortization is calculated through their redemption date, namely February 15, 2011, at the Company’s option.
33
COSAN S.A. INDÚSTRIA E COMÉRCIO
Notes to the unaudited quarterly financial information (Continued)
December 31, 2009
(In thousands of reais)
| 14. | Provision for legal liabilities |
| Parent Company | Consolidated | |||||||||||||||
| 12/31/09 | 09/30/09 | 12/31/09 | 09/30/09 | |||||||||||||
| Tax | 68,922 | 232,609 | 780,663 | 1,170,140 | ||||||||||||
| Civil and labor | 20,789 | 20,441 | 156,989 | 154,337 | ||||||||||||
| 89,711 | 253,050 | 937,652 | 1,324,477 | |||||||||||||
| Judicial deposits | (13,280 | ) | (13,272 | ) | (182,002 | ) | (181,100 | ) | ||||||||
| 76,431 | 239,778 | 755,650 | 1,143,377 | |||||||||||||
The Company and its subsidiaries are party to various ongoing labor claims, civil and tax proceedings arising from the normal course of their business.
Respective provisions for judicial demands were recorded considering those cases in which the likelihood of loss has been rated as probable based on the opinion of legal advisors. Management believes resolution of these disputes will have no effect significantly different than the estimated amounts accrued.
The main tax judicial demands at December 31, 2009, which reflect the adhesion to the installment program of Law No 11,941/09 and Provisional Measure 470/09, compared to September 30, 2009 are as follows:
| Parent Company | Consolidated | |||||||||||||||
| Description | 12/31/09 | 09/30/09 | 12/31/09 | 09/30/09 | ||||||||||||
| Premium credit – IPI | - | 150,752 | - | 276,722 | ||||||||||||
| PIS and Cofins | 6,924 | 17,704 | 138,274 | 147,905 | ||||||||||||
| IPI credits (NT) | - | - | 5,062 | 95,031 | ||||||||||||
| Contribution to IAA | - | - | 78,063 | 86,413 | ||||||||||||
| IPC-89 | - | - | 85,348 | 84,154 | ||||||||||||
| Finsocial | - | - | 170,796 | 168,556 | ||||||||||||
| IPI – Federal VAT | 8,653 | 9,711 | 95,331 | 61,201 | ||||||||||||
| ICMS credits | 16,143 | 15,697 | 57,882 | 57,216 | ||||||||||||
| Income tax and social contribution | 3,697 | 5,377 | 42,963 | 44,291 | ||||||||||||
| Others | 33,505 | 33,368 | 106,944 | 148,651 | ||||||||||||
| 68,922 | 232,609 | 780,663 | 1,170,140 | |||||||||||||
On May 27, 2009, the paragraph 1st and 3rd of Law No 9,718/98 that regulated the collection of PIS and Cofins (federal tax contributions) on exchange variation and other financial income was revoked by Law 11,941/09. The Company is in process of evaluation of its ongoing judicial demands related to the unpaid legal obligations related to the increase of calculation basis of PIS and Cofins. Once the absence of errors or flaws in the ongoing demands is confirmed, the Company will reassess the maintenance of the accounting records of the respective legal obligations in its financial statements.
34
COSAN S.A. INDÚSTRIA E COMÉRCIO
Notes to the unaudited quarterly financial information (Continued)
December 31, 2009
(In thousands of reais)
| 14. | Provision for judicial demands (Continued) |
As presented in Note 11, during the quarter ended December 31, 2009, the Company and its subsidiaries Cosan Açúcar e Álcool S.A., Benálcool Açúcar e Álcool S.A. and Administração de Participações Aguassanta Ltda. opted for the payment in installments as per Law 11,941/09 and Provisional Measure 470/09, related to ongoing legal demands involving undue use of IPI credit premium.
In addition, the Company and its subsidiaries utilize accumulated tax losses to pay these demands as well as the fines and interest thereof. Subsequently, the claims related to credit premium - IPI were fully paid for in installments, as well as installments of other federal taxes, which were recorded under taxes and contributions payable.
As regards tax, labor and civil claims whose likelihood of unfavorable outcome is rated as possible are as follows:
| Parent Company | Consolidated | |||||||||||||||
| Description | 12/31/09 | 09/30/09 | 12/31/09 | 09/30/09 | ||||||||||||
| ICMS – State VAT | 28,804 | 26,986 | 235,587 | 182,610 | ||||||||||||
| IAA – Sugar and Ethanol Institute | - | - | 74,115 | 73,887 | ||||||||||||
| Withholding income tax | 165,464 | 164,267 | 165,509 | 164,313 | ||||||||||||
| IPI – Federal VAT | 16,214 | 15,842 | 303,646 | 301,438 | ||||||||||||
| INSS | 11 | 11 | 2,172 | 2,140 | ||||||||||||
| PIS/Cofins | 11,539 | 11,385 | 57,686 | 36,691 | ||||||||||||
| Civil and labor | 39,439 | 38,841 | 237,209 | 240,221 | ||||||||||||
| Others | 30,115 | 38,571 | 85,334 | 141,601 | ||||||||||||
| 291,586 | 295,903 | 1,161,258 | 1,142,901 | |||||||||||||
Contingent credits
| i) | Accounts receivable from Federal Government |
On February 28, 2007, subsidiary Cosan Açúcar e Álcool recognized gain of R$318,358, corresponding to a lawsuit filed against federal government claiming indemnification for damages since prices of its products, at the time the sector was subject to government control, were imposed not observing the prevailing reality of the sector created by government control itself. A final decision in favor of the subsidiary was handed down. The referred to gain was recorded in the statement of income for the year, the contra entry being to noncurrent assets of the Company, in receivables from lawsuit for damages.
35
COSAN S.A. INDÚSTRIA E COMÉRCIO
Notes to the unaudited quarterly financial information (Continued)
December 31, 2009
(In thousands of reais)
| 14. | Provision for judicial demands (Continued) |
Contingent credits (Continued)
| i) | Accounts receivable from Federal Government (Continued) |
The Company is awaiting the final decision on the form of payment, which will probably be through government securities issued in connection with court ordered debts, to be received in 10 years, after a final decision is handed down.
In 2008, there was review of the criteria for determining monetary restatement in the Federal Court Calculations Manual, which did not consider interest restatement as from January 2003. In view of this, subsidiary reversed at March 31, 2009, the amount of R$18,768 from its noncurrent assets, debited to the statement of income for the year, in financial income (expense), net account. Consequently, lawyers’ fees calculated in proportion to the assets, recorded in noncurrent liabilities, in other liabilities account, were reduced by R$2,253, credited to the same account in the statement of operations.
At December 31, 2009, these amounts totaled R$331,426 and R$39,771 (R$329,049 and R$39,486 at September 30, 2009), corresponding to the referred to case and lawyers’ fees, respectively.
The subsidiary Cosan Açúcar e Álcool has other claims for damages of this nature filed against the Federal Government, which are not recognized in accounting due to the procedural progress of such suits.
36
COSAN S.A. INDÚSTRIA E COMÉRCIO
Notes to the unaudited quarterly financial information (Continued)
December 31, 2009
(In thousands of reais)
| 15. | Shareholders’ equity |
| a) | Capital |
On October 5, 2009, the Board of Directors approved a capital increase of R$1,036 upon issue of 169,500 new book-entry, registered common shares with no par value, in connection with the “Company’s Stock Option Plan” and with the exercise of such options by the eligible executives, at the issue price of R$6.11 per share, set on the terms of the stock option plan. After the share issue, the Company’s capital amounted to R$4,156,352 and is comprised of 372,979,642 book-entry, registered common shares with no par value.
On October 29, 2009, the Board of Directors approved a capital increase of R$380,063 upon issue of 23,753,953 new book-entry, registered common shares with no par value, at the issue price of R$16.00, due to exercise of 39,589,922 subscription warrants by Cosan Limited, under the Board of Directors deliberation terms at the September 19, 2008 meeting (note 15.d). After the share issue, the Company’s capital amounted to R$4,536,415, within the limit of authorized capital, as described on article 6 of the Company’s bylaws, represented by 396,733,595 book-entry, registered common shares with no par value.
On December 15, 2009, the Board of Directors approved a capital increase of R$4,834 upon issue of 655,194 new shares, due to: (i) exercise of 140,000 subscription warrants, totaling 84,000 new shares; and (ii) 571,194 new shares, for purposes of meeting the needs of the share-based plan, due to exercise of such options by qualifying executives. With the issuance of new shares, the Company’s capital corresponds to R$4,541,249 represented by 397,388,789 registered common shares, nominated and with no par value.
The Board of Directors’ Meeting held on December 22, 2009 approved the capital increase in the amount of R$129,168, upon issue of 8,072,976 new Company shares, at the issue price of R$16.00, in view of the exercise of 13,454,960 subscription bonus. Of this total, the parent company Cosan Limited exercised the right to 5,403,560 subscription warrants, the equivalent to 3,242,136 new shares. In view of the capital increase approved at the meeting, the Company’s capital stock increased to R$4,670,417, divided into 405,461,765 book-entry, registered common shares with no par value.
37
COSAN S.A. INDÚSTRIA E COMÉRCIO
Notes to the unaudited quarterly financial information (Continued)
December 31, 2009
(In thousands of reais)
| 15. | Shareholders’ equity (Continued) |
| a) | Capital (Continued) |
In addition, the Board of Directors’ Meeting held on December 31, 2009 approved a new capital increase of R$17,305, upon issue of 1,081,552 new shares, in view of the exercise of 1,802,588 subscription warrants, thus increasing the Company’s capital to R$4,687,722, within the limit of authorized capital, divided into 406,543,317 book-entry, registered common shares with no par value.
As of December 31, 2009, the Company’s capital is represented by 406,543,317 book-entry, registered common shares (372,810,142 at September 30, 2009) with no par value.
| b) | Treasury shares |
On December 31, 2009 and September 30, 2009, the Company held in treasury 343,139 book entry common registered shares with no par value, whose market value per share, as of that date, amounted to R$25.60 and R$19.56, respectively.
| c) | Recorded granted shares |
These consist of the expenses of the share-based plan (Note 22), in compliance with Brazilian CPC Technical Pronouncement Nº 10 – Share-based payment, approved by Brazilian SEC (CVM) Resolution Nº 562/08.
38
COSAN S.A. INDÚSTRIA E COMÉRCIO
Notes to the unaudited quarterly financial information (Continued)
December 31, 2009
(In thousands of reais)
| 15. | Shareholders’ equity (Continued) |
| d) | Share subscription warrants |
According to the meeting of the Board of Directors held on September 19, 2008, 1 (one) share purchase warrant issued by the Company was assigned as an additional advantage to the subscribers for a new share, which shall entitle the holder to subscribe for Cosan’s shares through certain conditions. A total of 55,000,000 stock purchase single series warrants without par value were issued. The holder was entitled to subscribe for 0.6 (zero point six) of a common share, the delivery of fractional shares being voided. The stock purchase warrant was valid from its issuance until December 31, 2009, and may be exercised at the holder’s discretion, except for the days a Company’s General Meeting is held, who shall express its intention through a request for exercise to be delivered in writing to Cosan. The price of exercise of each quantity of stock purchase warrants totaling 1 (one) share was R$16.00.
At December 31, 2009, 49,987,552 warrants had been exercised, the remaining 12,448 warrants expired.
| 16. | Management compensation |
Management compensation is made solely through the payment of management fees, which are separately disclosed in the statements of operations.
39
COSAN S.A. INDÚSTRIA E COMÉRCIO
Notes to the unaudited quarterly financial information (Continued)
December 31, 2009
(In thousands of reais)
| 17. | Financial income (expenses), net |
| Parent Company | ||||||||||||||||
| 10/01/09 to 12/31/09 | 11/01/08 to 01/31/09 | 04/01/09 to 12/31/09 | 05/01/08 to 01/31/09 | |||||||||||||
| Financial expenses | ||||||||||||||||
Interest (1) | (87,780 | ) | (101,031 | ) | (250,992 | ) | (208,888 | ) | ||||||||
| Monetary variation losses | (11,675 | ) | 171 | (27,803 | ) | (5,584 | ) | |||||||||
| Exchange variation losses | 39,974 | (201,934 | ) | 578,909 | (612,233 | ) | ||||||||||
Results from derivatives (3) | (14,054 | ) | (127,064 | ) | 30,351 | (230,166 | ) | |||||||||
| Others | (48 | ) | (383 | ) | (244 | ) | (612 | ) | ||||||||
| (73,583 | ) | (430,241 | ) | 330,221 | (1,057,483 | ) | ||||||||||
| Financial income | ||||||||||||||||
Interest (1) | 14,628 | (7,591 | ) | 30,439 | 47,045 | |||||||||||
| Exchange variation gains | (150 | ) | (54 | ) | (904 | ) | 1,431 | |||||||||
Monetary variation gains (2) | 2,032 | 239,998 | (43,300 | ) | 247,441 | |||||||||||
Results from derivatives (3) | - | 254,164 | - | 407,191 | ||||||||||||
| Earnings from marketable securities | 2,044 | 7,841 | 15,149 | 40,469 | ||||||||||||
| Others | 66 | 13 | 370 | 98 | ||||||||||||
| 18,620 | 494,371 | 1,754 | 743,675 | |||||||||||||
| (54,963 | ) | 64,130 | 331,975 | (313,808 | ) | |||||||||||
| Consolidated | ||||||||||||||||
| 10/01/09 to 12/31/09 | 11/01/08 to 01/31/09 | 04/01/09 to 12/31/09 | 05/01/08 to 01/31/09 | |||||||||||||
| Financial expenses | ||||||||||||||||
Interest (1) | (192,705 | ) | (142,043 | ) | (451,659 | ) | (287,346 | ) | ||||||||
| Monetary variation losses | (17,242 | ) | 804 | (41,890 | ) | (33,900 | ) | |||||||||
| Exchange variation losses | 24,311 | (204,872 | ) | 534,051 | (620,341 | ) | ||||||||||
Results from derivatives (3) | 18,026 | (129,205 | ) | 162,228 | (234,042 | ) | ||||||||||
| Others | (4,363 | ) | (899 | ) | (5,803 | ) | (1,851 | ) | ||||||||
| (171,973 | ) | (476,215 | ) | 196,927 | (1,177,480 | ) | ||||||||||
| Financial income | ||||||||||||||||
Interest (1) | 51,526 | 17,977 | 95,382 | 40,251 | ||||||||||||
| Exchange variation gains | 1,511 | (348 | ) | 4,791 | 9,291 | |||||||||||
Monetary variation gains (2) | 25,793 | 25,834 | 94,806 | 41,476 | ||||||||||||
Results from derivatives (3) | - | 254,164 | - | 407,191 | ||||||||||||
| Earnings from marketable securities | 14,134 | 19,357 | 41,705 | 55,017 | ||||||||||||
| Others | 724 | 48 | 426 | 227 | ||||||||||||
| 93,688 | 317,032 | 237,110 | 553,453 | |||||||||||||
| (78,285 | ) | (159,183 | ) | 434,037 | (624,027 | ) | ||||||||||
| (1) | Included in the quarter and nine-month period ended January 31, 2009 the results from currency and interest rate swap contracts; |
| (2) | Includes foreign exchange gains (losses) on assets and liabilities denominated in foreign currency; and |
| (3) | Includes results from transactions in futures, options swaps and NDF. |
40
COSAN S.A. INDÚSTRIA E COMÉRCIO
Notes to the unaudited quarterly financial information (Continued)
December 31, 2009
(In thousands of reais)
| 18. | Other net operating income (expenses) |
| Parent Company | ||||||||||||||||
10/01/09 to 12/31/09 | 11/01/08 to 01/31/09 | 04/01/09 to 12/31/09 | 05/01/08 to 01/31/09 | |||||||||||||
| Reversal (Set-up) of provision for legal claims | (214 | ) | (6,926 | ) | 1,283 | (12,410 | ) | |||||||||
| Gain on sale of investment interest | - | - | 3,052 | - | ||||||||||||
| Reversal (Set-up) of provision for devaluation of permanent equity interest | - | - | - | 3,342 | ||||||||||||
| Gain from Law No 11.941/09 and MP 470/09 | 79,433 | - | 79,433 | - | ||||||||||||
| Scrap sales revenue | 267 | 319 | 1,072 | 1,538 | ||||||||||||
| Rent and lease income | 654 | 692 | 2,113 | 2,049 | ||||||||||||
| Others expenses, net | (777 | ) | (9,864 | ) | (806 | ) | (8,580 | ) | ||||||||
| 79,363 | (15,779 | ) | 86,147 | (14,061 | ) | |||||||||||
| Consolidated | ||||||||||||||||
10/01/09 to 12/31/09 | 11/01/08 to 01/31/09 | 04/01/09 to 12/31/09 | 05/01/08 to 01/31/09 | |||||||||||||
| Reversal (Set-up) of provision for legal claims | (4,137 | ) | (6,268 | ) | (7,519 | ) | (32,127 | ) | ||||||||
| Gain on sale of investment interest | - | 113,036 | 93,097 | 113,036 | ||||||||||||
| Gain on sale of properties | - | 18,399 | 18,399 | |||||||||||||
| Loss on business combination, net | - | - | (28,138 | ) | - | |||||||||||
| Rent and lease income | 1,754 | 1,929 | 5,610 | 5,528 | ||||||||||||
| Gain from Law No 11.941/09 and MP 470/09 | 211,649 | - | 211,649 | - | ||||||||||||
| Reversal (Set-up) of provision for devaluation of permanent equity interest | - | - | - | 3,342 | ||||||||||||
| Scrap sales revenue | 796 | 631 | 3,455 | 5,403 | ||||||||||||
| Others expenses, net | 6,950 | (7,501 | ) | 13,862 | 2,546 | |||||||||||
| 217,012 | 120,226 | 292,016 | 116,127 | |||||||||||||
41
COSAN S.A. INDÚSTRIA E COMÉRCIO
Notes to the unaudited quarterly financial information (Continued)
December 31, 2009
(In thousands of reais)
| 19. | Financial instruments |
| a) | Risk management |
The Company and its subsidiaries are exposed to market risks, especially: (i) volatility in the price of sugar, and; (ii) volatility in foreign exchange rates. In order to manage these risks, the Company adopts policies and procedures approved by Management through its Risk Committee. These documents establish limits, continuous monitoring of exposures, counterparties and financial instruments approved for trading. Financial instruments and risks are managed through the definition of strategies, establishment of control systems and determination of foreign exchange, interest rate and price exposure limits.
42
COSAN S.A. INDÚSTRIA E COMÉRCIO
Notes to the unaudited quarterly financial information (Continued)
December 31, 2009
(In thousands of reais)
| 19. | Financial instruments (Continued) |
| a) | Risk management (Continued) |
As of December 31, 2009 and September 30, 2009, the fair values of transactions involving derivative financial instruments are as follows:
| Parent Company | Consolidated | |||||||||||||||||||||||||||||||
| Notional value | Fair value | Notional value | Fair value | |||||||||||||||||||||||||||||
| 12/31/09 | 09/30/09 | 12/31/09 | 09/30/09 | 12/31/09 | 09/30/09 | 12/31/09 | 09/30/09 | |||||||||||||||||||||||||
| Price risk | ||||||||||||||||||||||||||||||||
| Commodity derivatives | ||||||||||||||||||||||||||||||||
| Futures contracts | ||||||||||||||||||||||||||||||||
| Sale commitments | 653,998 | 562,916 | (74,781 | ) | (53,519 | ) | 653,998 | 562,916 | (74,781 | ) | (53,519 | ) | ||||||||||||||||||||
| (Sugar price hedge) | ||||||||||||||||||||||||||||||||
| Sugar purchase commitments | 115,291 | 67,912 | 3,377 | 4,319 | 115,291 | 67,912 | 3,377 | 4,319 | ||||||||||||||||||||||||
| (Increase in average price) | ||||||||||||||||||||||||||||||||
| Heating oil purchase commitments | 76,076 | 50,813 | 3,879 | 1,288 | 76,076 | 50,813 | 3,879 | 1,288 | ||||||||||||||||||||||||
| (Increase in average price) | ||||||||||||||||||||||||||||||||
| Options | ||||||||||||||||||||||||||||||||
| Call | 724,533 | 537,390 | (157,874 | ) | (146,090 | ) | 724,533 | 537,390 | (157,874 | ) | (146,090 | ) | ||||||||||||||||||||
| (Increase in average price) | ||||||||||||||||||||||||||||||||
| Put | 324,907 | 331,792 | 9,261 | 16,627 | 324,907 | 331,792 | 9,261 | 16,627 | ||||||||||||||||||||||||
| (Sugar price hedge) | ||||||||||||||||||||||||||||||||
| Swap contracts | ||||||||||||||||||||||||||||||||
| Sugar Swap | 98,542 | 100,630 | 6,320 | 8,219 | 98,542 | 100,630 | 6,320 | 8,219 | ||||||||||||||||||||||||
| (Ethanol price hedge) | ||||||||||||||||||||||||||||||||
| (209,818 | ) | (169,156 | ) | (209,818 | ) | (169,156 | ) | |||||||||||||||||||||||||
| Foreign exchange risk | ||||||||||||||||||||||||||||||||
| Foreign exchange derivatives | ||||||||||||||||||||||||||||||||
| Futures contracts | ||||||||||||||||||||||||||||||||
| Sale commitments | 519,635 | 1,588,234 | (229 | ) | 19,338 | 519,635 | 1,588,234 | (229 | ) | 19,338 | ||||||||||||||||||||||
| (Cash flow hedge) | ||||||||||||||||||||||||||||||||
| Purchase commitments | 741,591 | (8,982 | ) | 741,591 | (8,982 | ) | ||||||||||||||||||||||||||
| (Increase in cash flow) | ||||||||||||||||||||||||||||||||
| Forward contracts | ||||||||||||||||||||||||||||||||
| Sale commitments | 576,420 | 1,027,349 | 30,815 | 31,765 | 576,420 | 1,027,349 | 30,815 | 31,765 | ||||||||||||||||||||||||
| (Cash flow hedge) | ||||||||||||||||||||||||||||||||
| Options | ||||||||||||||||||||||||||||||||
| Put | 974,502 | 468,000 | 17,400 | 15,871 | 974,502 | 468,000 | 17,400 | 15,871 | ||||||||||||||||||||||||
| (Cash flow hedge) | ||||||||||||||||||||||||||||||||
| Swap contracts | ||||||||||||||||||||||||||||||||
| Currency translation risk transference | 322,023 | 322,023 | 9,311 | (2,079 | ) | 322,023 | 322,023 | |||||||||||||||||||||||||
| (Cash flow hedge) | ||||||||||||||||||||||||||||||||
| Senior Notes 2009 | 570,700 | (4,472 | ) | 570,700 | (4,472 | ) | ||||||||||||||||||||||||||
| (Cash flow hedge) | ||||||||||||||||||||||||||||||||
| Export credit note | 17,802 | (2,354 | ) | |||||||||||||||||||||||||||||
| (Cash flow hedge) | ||||||||||||||||||||||||||||||||
| 57,297 | 51,441 | 47,986 | 51,166 | |||||||||||||||||||||||||||||
| Interest rate risk | ||||||||||||||||||||||||||||||||
| Interest rate derivative | ||||||||||||||||||||||||||||||||
| Libor swap contracts | ||||||||||||||||||||||||||||||||
| Interest rate hedge (assets: floating /liabilities: fixed) | 172,930 | 962 | 172,930 | 962 | ||||||||||||||||||||||||||||
| (Cash flow hedge) | ||||||||||||||||||||||||||||||||
| 962 | 962 | |||||||||||||||||||||||||||||||
| (151,559 | ) | (117,715 | ) | (160,870 | ) | (117,990 | ) | |||||||||||||||||||||||||
| Total assets | 81,325 | 97,427 | 72,014 | 97,427 | ||||||||||||||||||||||||||||
| Total liabilities | (232,884 | ) | (215,142 | ) | (232,884 | ) | (215,417 | ) | ||||||||||||||||||||||||
43
COSAN S.A. INDÚSTRIA E COMÉRCIO
Notes to the unaudited quarterly financial information (Continued)
December 31, 2009
(In thousands of reais)
| 19. | Financial instruments (continued) |
| a) | Risk management (Continued) |
Counterparties – The Company operates commodity derivatives in futures and options markets on the New York Board of Trade (NYBOT) and the London International Financial Futures and Options Exchange (LIFFE). The Company operates foreign exchange derivatives on BM&FBovespa and OTC contracts registered with CETIP with banks Unibanco - União de Bancos Brasileiros S.A, Banco Bradesco S.A., Banco UBS Pactual S.A., Banco Barclays S.A. and Banco Morgan Stanley Witter S.A.
Guarantee margins – The Company’s derivative operations on commodity exchanges (NYBOT, LIFFE and BM&FBovespa) require an initial guarantee margin. The brokers with whom the Company operates on these commodity exchanges offer credit limits for these margins. At December 31, 2009, the credit limit for the initial margin totals R$99,107 (R$102,164 at September 30, 2009). For operations with BM&FBovespa, at December 31, 2009, the Company had R$90,041 (R$169,005 at September 30, 2009) in Bank Deposit Certificates (CDB) offered in guarantee. The Company’s OTC derivative operations do not require guarantee margins.
The results of operations involving derivative financial instruments settled during the period and included in the statement of income for the quarter and nine-month periods ended December 31, 2009 and January 31, 2009 were as follows:
| Parent Company | ||||||||||||||||
| 10/01/09 to 12/31/09 | 11/01/08 to 01/31/09 | 04/01/09 to 12/31/09 | 05/01/08 to 01/31/09 | |||||||||||||
| Commodity derivatives | (36,669 | ) | 25,872 | 364,835 | 52,967 | |||||||||||
| Foreign exchange derivatives | 22,615 | 101,228 | (334,484 | ) | 124,058 | |||||||||||
| (14,054 | ) | 127,100 | 30,351 | 177,025 | ||||||||||||
| Financial income (Note 17) | - | 254,164 | - | 407,191 | ||||||||||||
| Financial expenses (Note 17) | (14,054 | ) | (127,064 | ) | 30,351 | (230,166 | ) | |||||||||
| Consolidated | ||||||||||||||||
| 10/01/09 to 12/31/09 | 11/01/08 to 01/31/09 | 04/01/09 to 12/31/09 | 05/01/08 to 01/31/09 | |||||||||||||
| Commodity derivatives | (33,919 | ) | 26,240 | (404,012 | ) | 51,600 | ||||||||||
| Foreign exchange derivatives | 51,945 | 98,719 | 566,240 | 121,549 | ||||||||||||
| 18,026 | 124,959 | 162,228 | 173,149 | |||||||||||||
| Financial income (Note 17) | - | 254,164 | - | 407,191 | ||||||||||||
| Financial expenses (Note 17) | 18,026 | (129,205 | ) | 162,228 | (234,042 | ) | ||||||||||
44
COSAN S.A. INDÚSTRIA E COMÉRCIO
Notes to the unaudited quarterly financial information (Continued)
December 31, 2009
(In thousands of reais)
| 19. | Financial instruments (Continued) |
| b) | Price risk |
The Company has derivatives with the objective of mitigating its exposure to sugar price oscillation in the international market. Derivative operations allow ensuring minimum average profit for future production. The Company actively manages the contracted positions, also the result of these activities is monitored daily. through effective mark-to-market controls and price impact simulations in order to allow adjusting targets and strategies due to changes in market conditions.
At December 31, 2009, the Company had: (i) 643,169 sugar tons (588,931 tons at September 30, 2009), hedged by futures contracts, with a negative adjustment to market value estimated at R$71,405 (negative adjustment of R$49,200 at September 30, 2009); (ii) 504,163 sugar tons (504,163 tons at September 30, 2009) hedged by derivative contracts in the collars structure (put and call), which fair value is negative adjusted in R$64,126 (negative adjustment of R$63,268 at September 30, 2009); (iii) 378,732 sugar tons (201,686 tons at September 30, 2009), linked to purchase options sold, with a negative adjustment to market value estimated at R$84,486 (negative adjustment of R$66,194 at September 30, 2009); and (iv) 21,672 heating oil gallons (15,876, gallons at September 30, 2009) hedged by future contracts which fair value is positive adjusted in R$3,879 (positive adjustment of R$1,288 at September 30, 2009).
The fair value of these derivatives was measured through observable factors, such as market quotation.
45
COSAN S.A. INDÚSTRIA E COMÉRCIO
Notes to the unaudited quarterly financial information (Continued)
December 31, 2009
(In thousands of reais)
| 19. | Financial instruments (Continued) |
| b) | Price risk (Continued) |
| Derivatives | Put / Call | Market | Contract | Maturity | # of Contracts | Strike | Average Price | Fair Value | Notional (units) | Notional (R$ thou) | Fair Value (R$ thou) | |||||||||||||||||||||||||||||
| Future Contract | Call | LIFFE | White Sugar | May/10 | 200 | - | ¢/T 597.25 | ¢/T 688.70 | 10,000 | T | 10,399 | (1,592 | ) | |||||||||||||||||||||||||||
| Future Contract | Call | LIFFE | White Sugar | Aug/10 | 600 | - | ¢/T 567.08 | ¢/T 632.00 | 30,000 | T | 29,622 | (3,391 | ) | |||||||||||||||||||||||||||
| Future Contract | Call | LIFFE | White Sugar | Oct/10 | 200 | - | ¢/T 537.63 | ¢/T 581.80 | 10,000 | T | 9,361 | (769 | ) | |||||||||||||||||||||||||||
| Future Contract | Call | NYBOT | #11 | Mar/10 | 4,403 | - | ¢/lb 23.15 | ¢/lb 26.95 | 223,683 | T | 198,766 | (32,639 | ) | |||||||||||||||||||||||||||
| Future Contract | Call | NYBOT | #11 | Mal/10 | 150 | - | ¢/lb 24.48 | ¢/lb 25.23 | 7,620 | T | 7,160 | (221 | ) | |||||||||||||||||||||||||||
| Future Contract | Call | NYBOT | #11 | Jul/10 | 5,225 | - | ¢/lb 20.59 | ¢/lb 23.02 | 265,443 | T | 209,783 | (24,779 | ) | |||||||||||||||||||||||||||
| Swap | Call | NYBOT | #11 | Oct/10 | 1,970 | - | ¢/lb 20.65 | ¢/lb 21.85 | 100,081 | T | 79,333 | (4,585 | ) | |||||||||||||||||||||||||||
| Future Contract | Call | NYBOT | #11 | Oct/10 | 2,624 | - | ¢/lb 20.53 | ¢/lb 21.85 | 133,305 | T | 105,030 | (6,780 | ) | |||||||||||||||||||||||||||
| Future Contract | Call | NYBOT | #11 | May/11 | 100 | - | ¢/lb 19.32 | ¢/lb 19.42 | 5,080 | T | 3,768 | (20 | ) | |||||||||||||||||||||||||||
| Future Contract | Call | NYBOT | #11 | Jul/11 | 22 | - | ¢/lb 18.06 | ¢/lb 18.18 | 1,118 | T | 775 | (5 | ) | |||||||||||||||||||||||||||
| Subtotal of sugar future contract – sales | 786,330 | T | 653,998 | (74,781 | ) | |||||||||||||||||||||||||||||||||||
| Future Contract | Put | NYBOT | #11 | Mar/10 | 150 | - | ¢/lb 26.08 | ¢/lb 26.95 | (7,620 T | ) | (7,628 | ) | 256 | |||||||||||||||||||||||||||
| Future Contract | Put | NYBOT | #11 | May/10 | 150 | - | ¢/lb 25.33 | ¢/lb 25.23 | (7,620 T | ) | (7,410 | ) | (29 | ) | ||||||||||||||||||||||||||
| Future Contract | Put | NYBOT | #11 | Jul/10 | 10 | - | ¢/lb 21.18 | ¢/lb 23.02 | (508 T | ) | (413 | ) | 36 | |||||||||||||||||||||||||||
| Future Contract | Put | NYBOT | #11 | Mar/11 | 2,508 | - | ¢/lb 20.41 | ¢/lb 21.05 | (127,412 T | ) | (99,840 | ) | 3,114 | |||||||||||||||||||||||||||
| Subtotal of sugar future contract – purchased | (143.161 T | ) | 3,377 | |||||||||||||||||||||||||||||||||||||
| Future Contract | Put | NYMEX | Heating Oil | Feb/10 | 251 | - | ¢/gln 202.08 | ¢/gln 211.56 | (10,542) gln)) | (37,094 | ) | 1,740 | ||||||||||||||||||||||||||||
| Future Contract | Put | NYMEX | Heating Oil | Mar/10 | 265 | - | ¢/gln 201.15 | ¢/gln 212.19 | (11,130 gln) | (38,982 | ) | 2,139 | ||||||||||||||||||||||||||||
| Subtotal of HO future contract – purchased | (21.672 gln) | (76,076 | ) | 3,879 | ||||||||||||||||||||||||||||||||||||
| Subtotal of Futures | 462,631 | (67,525 | ) | |||||||||||||||||||||||||||||||||||||
| Call | Call | NYBOT | #11 | Mar/10 | 985 | 16.00 | ¢/lb 1.39 | ¢/lb 10.96 | 50,040 | T | 30,734 | (21,053 | ) | |||||||||||||||||||||||||||
| Call | Call | NYBOT | #11 | Mar/10 | 985 | 17.00 | ¢/lb 1.14 | ¢/lb 9.96 | 50,040 | T | 32,655 | (19,132 | ) | |||||||||||||||||||||||||||
| Call | Call | NYBOT | #11 | Mar/10 | 2,000 | 18.00 | ¢/lb 1.13 | ¢/lb 8.96 | 101,605 | T | 70,205 | (34,947 | ) | |||||||||||||||||||||||||||
| Call | Call | NYBOT | #11 | May/10 | 1,400 | 32.00 | ¢/lb 0.62 | ¢/lb 1.00 | 71,123 | T | 87,366 | (2,730 | ) | |||||||||||||||||||||||||||
| Call | Call | NYBOT | #11 | May/10 | 500 | 35.00 | ¢/lb 0.55 | ¢/lb 0.65 | 25,401 | T | 34,128 | (634 | ) | |||||||||||||||||||||||||||
| Call | Call | NYBOT | #11 | Jul/10 | 5,987 | 20.00 | ¢/lb 1.30 | ¢/lb 4.19 | 304,154 | T | 233,510 | (48,920 | ) | |||||||||||||||||||||||||||
| Call | Call | NYBOT | #11 | Jul/10 | 50 | 30.00 | ¢/lb 0.62 | ¢/lb 1.09 | 2,540 | T | 2,925 | (106 | ) | |||||||||||||||||||||||||||
| Call | Call | NYBOT | #11 | Oct/10 | 2,153 | 20.50 | ¢/lb 1.78 | ¢/lb 3.30 | 109,378 | T | 86,073 | (13,856 | ) | |||||||||||||||||||||||||||
| Call | Call | NYBOT | #11 | Oct/10 | 1,784 | 21.00 | ¢/lb 1.87 | ¢/lb 3.05 | 90,631 | T | 70,060 | (10,611 | ) | |||||||||||||||||||||||||||
| Call | Call | NYBOT | #11 | Oct/10 | 50 | 30.00 | ¢/lb 0.70 | ¢/lb 0.95 | 2,540 | T | 2,925 | (93 | ) | |||||||||||||||||||||||||||
| Call | Call | NYBOT | #11 | Mar/11 | 1,485 | 24.50 | ¢/lb 1.82 | ¢/lb 2.00 | 75,442 | T | 70,951 | (5,792 | ) | |||||||||||||||||||||||||||
| Subtotal of calls sold | 882.895 | T | 724,533 | (157,874 | ) | |||||||||||||||||||||||||||||||||||
| Put | Put | NYBOT | #11 | Jul/10 | 5,987 | 16.50 | ¢/lb 2.33 | ¢/lb 0.33 | 304,154 | T | 192,646 | 3,853 | ||||||||||||||||||||||||||||
| Put | Put | NYBOT | #11 | Oct/10 | 2,153 | 17.00 | ¢/lb 2.42 | ¢/lb 0.65 | 109,378 | T | 71,377 | 2,729 | ||||||||||||||||||||||||||||
| Put | Put | NYBOT | #11 | Oct/10 | 1,784 | 17.50 | ¢/lb 2.71 | ¢/lb 0.77 | 90,631 | T | 60,883 | 2,679 | ||||||||||||||||||||||||||||
| Subtotal of Put – purchased | 504.163 | T | 324,907 | 9,261 | ||||||||||||||||||||||||||||||||||||
| Subtotal of options – collars | 504.163 | T | 392,643 | (64,126 | ) | |||||||||||||||||||||||||||||||||||
| Subtotal of options – calls | 378.732 | T | 331,890 | (84,486 | ) | |||||||||||||||||||||||||||||||||||
| Swap | Put | OTC | #11 | Oct/10 | 985 | ¢/lb 25.50 | ¢/lb 1.67 | 50,040 | T | 48,983 | 3,208 | |||||||||||||||||||||||||||||
| Swap | Put | OTC | #11 | Oct/10 | 985 | ¢/lb 25.80 | ¢/lb 1.62 | 50,040 | T | 49,559 | 3,112 | |||||||||||||||||||||||||||||
| Subtotal of Swaps | 100,081 | T | 98,542 | 6,320 | ||||||||||||||||||||||||||||||||||||
| Subtotal of commodities | 1,285,706 | (209,818 | ) | |||||||||||||||||||||||||||||||||||||
46
COSAN S.A. INDÚSTRIA E COMÉRCIO
Notes to the unaudited quarterly financial information (Continued)
December 31, 2009
(In thousands of reais)
| 19. | Financial instruments (Continued) |
| c) | Foreign exchange risk |
The Company has derivatives in order to mitigate its exposure to the effect of foreign exchange rate fluctuations on its revenue from exports. The exchange rate derivatives together with the commodity price derivatives allow ensuring minimum average profit from future production. The Company actively manages contracted positions, and the result of such activities is monitored daily. through effective mark-to-market controls and price impact simulations in order to allow adjusting targets and strategies due to changes in market conditions. The fair value of these derivatives was measured based on estimates that use discounted cash flows based on market curves.
At December 31, 2009, the Company had US$1,154,868 thousand (US$1, 360,600 thousand at September 30, 2009) hedged by future, forward and option contracts traded in BM&FBovespa and OTC, with a positive adjustment to market value estimated at R$47,986 (positive adjustment of R$51,178 at September 30, 2009).
| Derivatives | Put / Call | Market | Contract | Date | # of Contracts | Strike | Average Price | Fair Value | Notional (units) | Notional (R$ thou) | Fair Value (R$ thou) | |||||||||||||||||||||||||
| (R$/US$) | (R$/US$) | (R$/US$) | (US$ thou) | (US$ thou) | (US$ thou) | |||||||||||||||||||||||||||||||
| Future Contract | Call | BM&FBovespa | Dollar | Jan/10 | 1,125 | - | $ | 1.7421 | $ | 1.7412 | $ | 6 | 97,992 | 49 | ||||||||||||||||||||||
| Future Contract | Call | BM&FBovespa | Dollar | Mar/10 | 460 | - | $ | 1.7629 | $ | 1.7631 | $ | 23,000 | 40,546 | (5 | ) | |||||||||||||||||||||
| Future Contract | Call | BM&FBovespa | Dollar | Jul/10 | 1,825 | - | $ | 1.8087 | $ | 1.8098 | $ | 91,250 | 165040 | (103 | ) | |||||||||||||||||||||
| Future Contract | Call | BM&FBovespa | Dollar | Dec/10 | 1,400 | - | $ | 1.8731 | $ | 1.8745 | $ | 70,000 | 131,114 | (100 | ) | |||||||||||||||||||||
| Future Contract | Call | BM&FBovespa | Dollar | Jan/11 | 900 | - | $ | 1.8876 | $ | 1.8892 | $ | 45,000 | 84,944 | (69 | ) | |||||||||||||||||||||
| Subtotal of future contract – sales | $ | 285,500 | 519,635 | (229 | ) | |||||||||||||||||||||||||||||||
| Forward Contract | Call | OTC/Cetip | NDF | Feb/10 | 1 | - | $ | 2.0056 | $ | 1.7523 | $ | 1,000 | 2,006 | 252 | ||||||||||||||||||||||
| Forward Contract | Call | OTC/Cetip | NDF | Apr/10 | 1 | - | $ | 1.8666 | $ | 1.7746 | $ | 23,000 | 42,932 | 2,073 | ||||||||||||||||||||||
| Forward Contract | Call | OTC/Cetip | NDF | Jul/10 | 1 | - | $ | 1.8945 | $ | 1.8092 | $ | 46,000 | 87,147 | 3,758 | ||||||||||||||||||||||
| Forward Contract | Call | OTC/Cetip | NDF | Aug/10 | 1 | - | $ | 1.9360 | $ | 1.8222 | $ | 50,000 | 96,800 | 50,000 | ||||||||||||||||||||||
| Forward Contract | Call | OTC/Cetip | NDF | Sep/10 | 1 | - | $ | 1.9165 | $ | 1.8355 | $ | 75,000 | 143,738 | 5,713 | ||||||||||||||||||||||
| Forward Contract | Call | OTC/Cetip | NDF | Oct/10 | 1 | - | $ | 2.0320 | $ | 1.8479 | $ | 5,000 | 10,160 | 858 | ||||||||||||||||||||||
| Forward Contract | Call | OTC/Cetip | NDF | Oct/10 | 1 | - | $ | 2.0080 | $ | 1.8485 | $ | 23,000 | 46,184 | 3,419 | ||||||||||||||||||||||
| Forward Contract | Call | OTC/Cetip | NDF | Nov/10 | 1 | - | $ | 1.9980 | $ | 1.8610 | $ | 73,800 | 147,454 | 9,341 | ||||||||||||||||||||||
| Subtotal of forward contract | $ | 296,800 | 576,420 | 30,815 | ||||||||||||||||||||||||||||||||
| Put Onshore | Put | BM&FBovespa | Dollar | Jan/10 | 4,000 | $ | 1.6000 | $ | 3.8000 | $ | 0.0010 | $ | 200,000 | 320,000 | 0 | |||||||||||||||||||||
| Put Onshore | Put | BM&FBovespa | Dollar | Apr/10 | 6,800 | $ | 1.7500 | $ | 70.800 | $ | 44.6560 | $ | 340,000 | 595,000 | 15,183 | |||||||||||||||||||||
| Subtotal of Put Onshore | $ | 540,000 | 915,000 | 15,183 | ||||||||||||||||||||||||||||||||
| Put Onshore | Put | OTC | Dollar | Feb/11 | 475 | $ | 1.8000 | $ | 103.7832 | $ | 57.5004 | $ | 23,768 | 42,782 | 1,367 | |||||||||||||||||||||
| Put Onshore | Put | OTC | Dollar | Feb/11 | 176 | $ | 1.9000 | $ | 162.4785 | $ | 96.6138 | $ | 8,800 | 16,720 | 850 | |||||||||||||||||||||
| Subtotal of Put Onshore | $ | 32,568 | 59,502 | 2,217 | ||||||||||||||||||||||||||||||||
| Total of foreign exchange for exports | $ | 1,154,868 | 2,070,558 | 47,986 | ||||||||||||||||||||||||||||||||
| Swap | Put | OTC/Cetip | Dollar/DI | 1 | - | US$/57.49% CDI | $ | 175,000 | 322,023 | 9,311 | ||||||||||||||||||||||||||
| Swap | Call | OTC/Cetip | Dollar/DI | 1 | - | 57.49%CDI/US$ | $ | (175,000 | ) | (322,023 | ) | (9,311 | ) | |||||||||||||||||||||||
| Total foreign exchange | $ | 1,154,868 | 2,070,558 | 47,986 | ||||||||||||||||||||||||||||||||
47
COSAN S.A. INDÚSTRIA E COMÉRCIO
Notes to the unaudited quarterly financial information (Continued)
December 31, 2009
(In thousands of reais)
| 19. | Financial instruments (Continued) |
| c) | Foreign exchange risk (Continued) |
The Company does not use derivative financial instruments to hedge foreign exchange exposure from balance sheet. At December 31, 2009 and September 30, 2009, the Company and its subsidiaries presented the following net balance sheet exposure to US dollar:
| Consolidated | ||||||||||||||||
| 12/31/09 | 09/30/09 | |||||||||||||||
| R$ | US$ (thousand) | R$ | US$ (thousand) | |||||||||||||
| Amounts pending foreign exchange closing | 283,871 | 163,032 | 24,659 | 13,868 | ||||||||||||
| Overnight | 16,158 | 9,280 | 30,625 | 17,223 | ||||||||||||
| Trade notes receivable - foreign | 39,381 | 22,617 | 72,432 | 40,736 | ||||||||||||
| Foreign currency-denominated loans | (490,148 | ) | (281,500 | ) | (262,715 | ) | (147,750 | ) | ||||||||
| Advances from customers | (960,027 | ) | (551,359 | ) | (92,043 | ) | (51,765 | ) | ||||||||
| Senior Notes due in 2009 | - | - | (66,399 | ) | (37,343 | ) | ||||||||||
| Senior Notes due in 2014 | (632,256 | ) | (363,115 | ) | (629,969 | ) | (354,293 | ) | ||||||||
| Senior Notes due in 2017 | (716,659 | ) | (411,589 | ) | (719,400 | ) | (404,589 | ) | ||||||||
| Perpetual bonds | (792,775 | ) | (455,304 | ) | (809,575 | ) | (455,303 | ) | ||||||||
| Derivative financial instruments, net | 11,180 | 6,421 | 31,555 | 17,746 | ||||||||||||
| Foreign exchange exposure, net | (3,241,275 | ) | (1,861,517 | ) | (2,420,830 | ) | (1,361,470 | ) | ||||||||
| d) | Interest rate risk |
The Company monitors fluctuations of the several interest rates to which its assets and liabilities are pegged and, in the event of increased volatility of such rates, it may engage in transactions with derivatives so as to minimize such risks. At December 31, 2009, the Company had US$100 million hedged by swap contracts traded in the over-the-counter market, whose market value is assessed positively at R$962.
| Price risk: outstanding commodities derivatives on December 31, 2009 | ||||||||||||||||||||||
| Derivative | Call/ Put | Market | Contract | Table | Number of contracts | Strike | Average price | Fair price | Notional | Notional | Fair value | |||||||||||
| (R$ thou) | (R$ thou) | (R$ thou) | ||||||||||||||||||||
| Swap | Put | OCT/Cetip | Fix/Libor 3 month | 1 | - | 1.199% / Libor | 3 month | $100.000 | 172.930 | 962 | ||||||||||||
| Total swap | $100.000 | 172.930 | 962 | |||||||||||||||||||
48
COSAN S.A. INDÚSTRIA E COMÉRCIO
Notes to the unaudited quarterly financial information (Continued)
December 31, 2009
(In thousands of reais)
| 19. | Financial instruments (Continued) |
| e) | Credit risk |
A significant portion of sales made by the Company and its subsidiaries is for a selected group of best-in-class counterparts, i.e. trading companies, fuel distribution companies and large supermarket chains. In the fuel distribution activity, the diversity of the receivables, the selected clients and the follow up of financing terms of sales by business segment and individual position limits are procedures adopted to minimize eventual default in the accounts receivable. Credit risk is managed through specific rules of client acceptance, credit rating and setting of limits for customer exposure, including the requirement of a letter of credit from major banks and obtaining actual warranties on given credit, when applicable. Management believes that the risk of credit is substantially covered by the allowance for doubtful accounts.
The Company and its subsidiaries historically have not recorded material losses on trade accounts receivable.
| f) | Debt acceleration risk |
As of December 31, 2009, the Company was a party to loan and financing agreements with covenants generally applicable to these operations, including requirements related to cash generation, debt to equity ratio and others. These covenants are being fully complied with by the Company or are in process of renegotiation and do not place any restrictions on its operations.
| g) | Market values |
As of December 31, 2009 and September 30, 2009, the fair values of cash, marketable securities and trade accounts receivable and payable approximate the respective amounts recorded in the consolidated financial statements, due to their short-term nature.
The fair value of the Senior Notes maturing in 2014 and 2017, as described in Note 13, according to their market value, were 105.75% and 99.38%, respectively, of their face value at December 31, 2009.
The fair value of Perpetual Bonds as described in Note 13, according to its market value, was 90.40% of its face value at December 31, 2009.
49
COSAN S.A. INDÚSTRIA E COMÉRCIO
Notes to the unaudited quarterly financial information (Continued)
December 31, 2009
(In thousands of reais)
| 19. | Financial instruments (Continued) |
| g) | Market values (Continued) |
As for the other loan and financing arrangements, their respective fair values substantially approximate the amounts recorded in the quarterly information considering that such instruments are subject to variable interest rates.
| h) | Sensitivity analysis |
Pursuant to CVM Rule Nº 475 issued on December 17, 2008, following is the sensitivity analysis of the fair value of financial instruments, in accordance with the types of risks deemed to be significant by the Company:
Assumptions for the Sensitivity Analysis
For the analysis, the Company adopted three scenarios, being one probable and two that may have effects from impairment of the fair value of the Company’s derivative financial instruments. Impacts on operations were not considered, but only on the variable that impacts the value of derivative financial instruments. The definition of the probable scenario included the market data at December 31, 2009, the same one which determine the fair value of the derivatives at that date and therefore there are no differences in relation to the fair value of the derivative financial instruments. The possible adverse and remote scenarios were established in view of adverse impacts of 25% and 50% on the curves in the prices of the U.S. dollar and sugar:
Source: Unit: | Sugar #11 NYBOT ¢/lb | Sugar Ref. LIFFE US$/ton | Heating Oil NYNIEX US$/gallon | Dollar BM&FBovespa R$/US$ | ||||||||||||
| Jan-10 | - | - | 211.88 | 1.7412 | ||||||||||||
| Feb-10 | - | - | 211.56 | 1.7536 | ||||||||||||
| Mar-10 | 26.95 | 710.20 | 212.19 | 1.7631 | ||||||||||||
| Apr-10 | - | - | 212.63 | 1.7752 | ||||||||||||
| May-10 | 25.23 | 688.70 | 213.19 | 1.7863 | ||||||||||||
| Jun-10 | - | - | 213.82 | 1.7980 | ||||||||||||
| Jul-10 | 23.02 | - | 215.29 | 1.8098 | ||||||||||||
| Aug-10 | - | 632.00 | 217.09 | 1.8230 | ||||||||||||
| Sep-10 | - | - | 219.39 | 1.8364 | ||||||||||||
| Oct-10 | 21.85 | 581.80 | 221.92 | 1.8492 | ||||||||||||
| Nov-10 | - | - | 224.27 | 1.8618 | ||||||||||||
| Dec-10 | - | 550.30 | 226.60 | 1.8745 | ||||||||||||
| Jan-11 | - | - | 228.80 | 1.8892 | ||||||||||||
| Feb-11 | - | - | 230.20 | 1.9037 | ||||||||||||
| Mar-11 | 21.05 | 536.90 | 230.70 | 1.9169 | ||||||||||||
| Apr-11 | - | - | 229.80 | 1.9315 | ||||||||||||
| May-11 | 19.42 | 525.80 | 229.35 | 1.9451 | ||||||||||||
| Jun-11 | - | - | 229.60 | 1.9592 | ||||||||||||
| Jul-11 | 18.18 | - | 1.9728 | |||||||||||||
50
COSAN S.A. INDÚSTRIA E COMÉRCIO
Notes to the unaudited quarterly financial information (Continued)
December 31, 2009
(In thousands of reais)
| 19. | Financial instruments (Continued) |
| h) | Sensitivity analysis (Continued) |
Sensitivity Chart
Following is the sensitivity chart on the change in the fair value of the Company’s financial instruments:
| Impacts in P&L (*) | |||||||||||||
| Risk factor | Probable Scenario | Possible Scenario (25%) | Remote Scenario (50%) | ||||||||||
| Price risk | |||||||||||||
| Goods derivatives | |||||||||||||
Futures contracts: | |||||||||||||
Sale commitments | Sugar price spike | (74,781 | ) | (191,453 | ) | (380,532 | ) | ||||||
Purchase commitments | Sugar price decline | 3,377 | (32,023 | ) | (64,364 | ) | |||||||
Purchase commitments | Heating oil price decline | 3,879 | (20,148 | ) | (40,334 | ) | |||||||
Options: | |||||||||||||
Put | Sugar price spike | (157,874 | ) | (136,907 | ) | (340,845 | ) | ||||||
Call | Sugar price spike | 9,261 | (9,261 | ) | (9,261 | ) | |||||||
| Swap contracts | Sugar price decline | 6,320 | (44,111 | ) | (66,398 | ) | |||||||
| Sugar exports (1) | Sugar price spike | (111,259 | ) | 319,076 | 632,588 | ||||||||
| Lubricant cost | Heating oil price spike | (3,879 | ) | 20,148 | 40,334 | ||||||||
| Exchange rate risk | |||||||||||||
| Exchange rate derivatives | |||||||||||||
Futures contracts: | |||||||||||||
Sale commitments | R$/US$ exchange rate appreciation | (229 | ) | (129,966 | ) | (259,932 | ) | ||||||
Forward contract: | |||||||||||||
Sale commitments | R$/US$ exchange rate appreciation | 30,815 | (134,256 | ) | (270,228 | ) | |||||||
| Option: | |||||||||||||
Call | R$/US$ exchange rate appreciation | 17,400 | (17,400 | ) | (17,400 | ) | |||||||
| Swap contracts | Labor curve decline | 962 | (1,010 | ) | (2,021 | ) | |||||||
| Exports (2) | R$/US$ exchange rate appreciation | (47,986 | ) | 281,622 | 547,560 | ||||||||
| Net foreign exchange exposure (3) | R$/US$ exchange rate appreciation | (275,505 | ) | (1,154,699 | ) | (2,033,893 | ) | ||||||
(*) Projected results to occur up to 12 months from December 31, 2009.
| (1) | The sensitivity on sugar exports reflects the 25% and 50% increase scenarios (versus the scenarios for reduction in the underlying derivative financial instruments) on the price of sugar in relation to the volume of sugar equivalent to notional in derivative financial instruments contracted in order to hedge the Company against such variations; |
| (2) | The sensitivity on exports reflects the 25% and 50% increase scenarios (versus the scenarios for reduction in the underlying derivative financial instruments) on the R$ : US$ exchange rate in the future in relation to the volume of U.S. dollars equivalent to notional in derivative financial instruments contracted in order to hedge the Company against such variations. |
| (3) | Net foreign exchange exposure of R$3,241,275, equivalent to US$1.861,517 thousand. The probable scenario considers the maintenance of total net exposure basis in the balance sheet for the following 12 months, and the projected exchange rate for January 31, 2011, related to its value in December 31, 2009, that was R$1,7412/US$. |
51
COSAN S.A. INDÚSTRIA E COMÉRCIO
Notes to the unaudited quarterly financial information (Continued)
December 31, 2009
(In thousands of reais)
| 20. | Insurance |
At December 31, 2009, the Company and its subsidiaries maintain insurance coverage against fire, thunderbolts and explosions of any nature for the whole sugar and ethanol inventory and for buildings, equipment and installations at plants.
The Company does not foresee any difficulties to renew its insurance policies and believes that the coverage established is reasonable in terms of amounts and consistent with Brazilian industry standards.
The scope of our audit work did not include a review of the sufficiency of the insurance coverage, which, as determined by the Company management, was considered sufficient to cover any claims.
| 21. | Stock option plan |
At the Annual and Special General Meeting held on August 30, 2005, the Guidelines for the Outlining and Structuring of a Stock Option Plan for Company’s officers and employees were approved, thus authorizing the issue of up to 5% of the Company’s share capital. The stock option plan was designed to obtain and retain the services rendered by senior officers and employees, offering them the opportunity to become shareholders of the Company. On September 22, 2005, the Board of Directors approved the distribution of stock options corresponding to 4.302.780 common shares to be issued or purchased by the Company related to 3.25% of the share capital at the time, authorized by the Annual/Special General Meeting. On that same date, eligible officers were informed of the material terms and conditions of the share-based compensation agreement.
On September 11, 2007, the Board of Directors approved the distribution of stock options, corresponding to 450,000 common shares to be issued or purchased by the Company related to 0.24% of the share capital at the time, authorized by the Annual/Special General Meeting. On that same date, the eligible officer was informed of the material terms and conditions of the share-based compensation agreement. The remaining 1.51% may still be distributed.
On August 7, 2009, the Board of Directors approved an additional distribution of stock options, with no vesting period, corresponding to 165,657 common shares to be issued or purchased by the Company, following a change in the management members.
52
COSAN S.A. INDÚSTRIA E COMÉRCIO
Notes to the unaudited quarterly financial information (Continued)
December 31, 2009
(In thousands of reais)
| 21. | Stock option plan (Continued) |
Based on the fair value at the issue date, exercise price is R$6.11 (six reais and eleven centavos) per share, without discount. The exercise price was calculated before the above evaluation based on an expected private equity agreement based on that eventually was not made. The options are exercisable over a 3-year period, considering a maximum percentage of 25% p.a. of total stock options offered by the Company, within a period of 5 years.
The options exercised shall be settled only upon issue of new common or treasury shares that the Company may have at each relevant date
Should any holder of stock options cease to be an employee or manager of the Company, by death, retirement or permanent disability of the beneficiary, any options not previously vesting shall become extinct on the date that employee or officer separates from the Company. However, in the case of termination without good cause, the terminated employees shall be entitled to exercise 100% of their options referring to that particular year, on top of exercising 50% of their options in the coming year.
At December 31, 2009 stock options equivalent to 670,976 common shares were not exercised.
Until December 31, 2009, all stock option exercises were settled through the issuance of new common shares. Should the remaining options also be exercised through the issuance of new common shares, the current shareholders’ interest would be reduced by 0.17% after exercising all remaining options.
At December 31, 2009, R$3,465 regarding the unrecognized remuneration cost of stock options will be recognized within nearly nine months (R$3,980 at September 30, 2009, with a deadline of nearly 12 months).
53
COSAN S.A. INDÚSTRIA E COMÉRCIO
Notes to the unaudited quarterly financial information (Continued)
December 31, 2009
(In thousands of reais)
| 22. | Pension plan |
The subsidiary Cosan CL sponsors Previd Exxon - Sociedade de Previdência Privada, a closed-ended supplementary pension entity set up on December 23, 1980, engaged mainly in the supplementation of benefits within certain limits set in its formation deed, to which all employees of the sponsor and their beneficiaries are entitled as social security insured workers.
The actuarial liabilities regarding Previd Exxon were determined in accordance with IBRACON NPC 26, and is shown in non-current liabilities at December 31, 2009 totaling R$61,582 (R$62,287 at September 30, 2009).
During the quarter and nine-month periods ended December 31, 2009, the amount of contributions Cosan CL made to Previd Exxon – Sociedade de Previdência Privada totaled R$1,508 and R$5,054, respectively.
| 23. | Subsequent events |
Approval of the quarterly financial information
On January 29, 2010, this quarterly financial information for the quarter ended and six-month period ended December 31, 2009 was approved by the Company’s Board of Directors.
Advanced Settling of Financing with IFC – International Finance Corporation (“IFC”)
On January 15, 2009, the Company fully settled the financing with IFC, with maturity on January 15, 2013, totaling R$91,805.
54
SIGNATURES
Pursuant to the requirements of the Securities Exchange Act of 1934, the registrant has duly caused this report to be signed on its behalf by the undersigned, thereunto duly authorized.
| COSAN LIMITED | ||||||
| Date: | February 3, 2010 | By: | /s/ Marcelo Eduardo Martins | |||
| Name: | Marcelo Eduardo Martins | |||||
| Title: | Chief Financial Officer and Investor Relations Officer | |||||