FORM 6-K
SECURITIES AND EXCHANGE COMMISSION
Washington, D.C. 20549
Report of Foreign Issuer
Pursuant to Rule 13a-16 or 15d-16
of the Securities Exchange Act of 1934
For the month of February, 2013
Commission File Number: 1-33659
COSAN LIMITED
(Translation of registrant’s name into English)
Av. Juscelino Kubitschek, 1726 – 6th floor
São Paulo, SP 04543-000 Brazil
(Address of principal executive offices)
Indicate by check mark whether the registrant files or will file annual reports under cover of Form 20-F or Form 40-F:
| Form 20-F | X | Form 40-F | ___ |
Indicate by check mark if the registrant is submitting the Form 6-K in paper as permitted by Regulation S-T Rule 101(b)(1):
| Yes | ___ | No | X |
Indicate by check mark if the registrant is submitting the Form 6-K in paper as permitted by Regulation S-T Rule 101(b)(7):
| Yes | ___ | No | X |
COSAN LIMITED
Item | |
| 1. | Earnings Release dated February 6, 2013 for Third Quarter of the Fiscal Year 2013 – October, November, December of 2012 |
Item 1

Earnings Release
Third Quarter of the Fiscal Year 2013 – October, November, December of 2012
Record results in the quarter and
beginning of Comgás Consolidation
São Paulo, February 6, 2013 – COSAN LIMITED (NYSE: CZZ; BM&FBovespa: CZLQ11) and COSAN S.A. INDÚSTRIA E COMÉRCIO (BM&FBovespa: CSAN3) announce today their results for the third quarter of fiscal year 2013 (3Q13), ended December 31, 2012. The results are consolidated in accordance with the accounting principles adopted in Brazil (IFRS).
| Investor Relations Marcelo Martins CFO & IRO Guilherme Machado IR Manager Phillipe Casale IR Analyst E-mail: ri@cosan.com.br Website: www.cosan.com.br/ir | 3Q13 Highlights ● Consolidated Net Revenue reaches R$8.4 billion ● Raízen Combustíveis records EBITDA Margin of R$78.3/cbm (net of non-recurring effects) · Raízen Energia closes quarter with crushing of 17.8 million tonnes ● Rumo records EBITDA of R$98.9 million with EBITDA margin of 44.6% · Beginning of consolidation of Comgás results |
Fiscal Year Definitions:
3Q13 – quarter ended December 31, 2012
3Q12 – quarter ended December 31, 2011
YTD13 – period beginning on the same date as FY13 and ending at the close of 3Q13
YTD12 – period beginning on the same date as FY12 and ending at the close of 3Q12
FY13 – fiscal year beginning on April 1, 2012 and closing on March 31, 2013
FY12 – fiscal year beginning on April 1, 2011 and closing on March 31, 2012.
| Summary of Financial Information – Cosan Consolidated | ||||||||
3Q13 | 3Q12 | Amounts in R$ MM | YTD13 | YTD12 | ||||
| 8,397.1 | 6,310.7 | Net Revenue | 21,555.0 | 18,303.0 | ||||
| 1,057.2 | 639.8 | Gross Profit | 2,303.4 | 1,989.7 | ||||
| 12.6 | % | 10.1 | % | Gross Margin (%) | 10.7 | % | 10.9 | % |
| 738.1 | 240.0 | Operating Profit | 1,247.4 | 4,047.5 | ||||
| 1,194.0 | 494.6 | EBITDA | 2,340.0 | 4,971.3 | ||||
| 14.2 | % | 7.8 | % | EBITDA Margin (%) | 10.9 | % | 27.2 | % |
| - | - | Gross Effects of Raízen's Formation | - | 3,296.9 | ||||
| 1,194.0 | 494.6 | Adjusted EBITDA¹ | 2,340.0 | 1,674.3 | ||||
| 14.2 | % | 7.8 | % | Adjusted EBITDA Margin (%) | 10.9 | % | 9.1 | % |
| 448.1 | 106.7 | Net Income before non-controlling Interest | 751.6 | 2,496.0 | ||||
| 342.3 | 93.8 | Net Income | 608.5 | 2,456.3 | ||||
| - | - | Net Effects of Raízen's Formation | - | 2,131.8 | ||||
| 342.3 | 93.8 | Adjusted Net Income ¹ | 608.5 | 324.5 | ||||
| 4.1 | % | 1.5 | % | Net Adjusted Margin (%) | 2.8 | % | 13.4 | % |
| 555.5 | 453.3 | CAPEX² | 1,348.2 | 1,523.3 | ||||
| 8,832.9 | 3,619.9 | Net Debt | 8,832.9 | 3,619.9 | ||||
| 13,462.9 | 9,433.4 | Shareholders' Equity and Minority Shareholders | 13,462.9 | 9,433.4 | ||||
Note 1: Net of the effects of Raízen’s formation
Note 2: Net of acquisition of interest in other companies and of cash received from divestments

1 of 40
| | Earnings Release Third Quarter of the Fiscal Year 2013 – October, November, December of 2012 |
A. Business Units
On November 5, 2012, according to a Material Fact disclosed to the market, Cosan completed the acquisition of 60.1% of the equity of Companhia de Gás de São Paulo – Comgás (“Comgás”), following its strategy of focusing on energy and infrastructure. On October 26, 2012, São Paulo State’s Sanitation and Energy Regulatory Agency ARSESP authorized the transfer of Comgás’ control.
Starting this quarter, Cosan will include in this report a summary of the financial and operating information of 100% of the results of its subsidiary Comgás, as of November 1, 2012. Therefore, in 3Q13 we will consolidate only two months of Comgás results, as we will explain in further detail below, in the section dedicated to this business unit.
As we have done in prior quarters, we will continue to present a specific section for each business unit, including their key production and operating information, and an analysis of the results, from Net Revenue to EBITDA.
Our business units are as follows:

2 of 40
| | Earnings Release Third Quarter of the Fiscal Year 2013 – October, November, December of 2012 |
Below we present the results by business unit for the third quarter of fiscal year 3Q13 for all units described above. All information reflects 100% of our business units’ financial performance, regardless of Cosan's interest in them.
For comparison with Cosan‘s Consolidated financial information, we considered 50% of the results of Raízen Combustíveis e Energia and 100% of the results of Comgás, Rumo, Radar, and Other Businesses. Adjustments and eliminations represent intercompany balances and transactions.
| Results by Business Unit | 3Q13 | |||||||||||||||||
| Raízen | Raízen | Other | Elimination 50% | Adjustments and | ||||||||||||||
| Comgás | Combustíveis | Energia | Rumo | Radar | Business | Raízen | Eliminations | Consolidated | ||||||||||
| Amounts in R$ MM | ||||||||||||||||||
| Net Revenue | 951.2 | 11,383.8 | 2,605.4 | 221.6 | 15.6 | 377.9 | (6,994.6 | ) | (163.8 | ) | 8,397.1 | |||||||
| Cost of Goods and Services | (705.9 | ) | (10,773.2 | ) | (2,028.8 | ) | (121.4 | ) | - | (275.3 | ) | 6,401.0 | 163.8 | (7,339.9 | ) | |||
| Gross Profit | 245.3 | 610.5 | 576.6 | 100.1 | 15.6 | 102.6 | (593.6 | ) | - | 1,057.2 | ||||||||
| Gross Margin(%) | 25.8 | % | 5.4 | % | 22.1 | % | 45.2 | % | 100.0 | % | 27.2 | % | 0.0 | % | - | 12.6 | % | |
| Selling Expenses | (108.2 | ) | (275.9 | ) | (186.1 | ) | - | - | (56.1 | ) | 231.0 | - | (395.4 | ) | ||||
| General and Administrative Expenses | (57.2 | ) | (87.1 | ) | (123.2 | ) | (15.2 | ) | (6.1 | ) | (57.8 | ) | 105.1 | - | (241.5 | ) | ||
| Other Operating Revenues (Expenses) | (0.9 | ) | 114.1 | 10.2 | (3.9 | ) | 86.9 | 173.4 | (62.2 | ) | - | 317.7 | ||||||
| Depreciation and amortization | 78.1 | 131.0 | 556.2 | 17.8 | 0.2 | 16.1 | (343.6 | ) | - | 455.9 | ||||||||
| EBITDA | 157.1 | 492.7 | 833.7 | 98.9 | 96.6 | 178.2 | (663.2 | ) | - | 1,194.0 | ||||||||
| EBITDA Margin (%) | 16.5 | % | 4.3 | % | 32.0 | % | 44.6 | % | 620.4 | % | 47.2 | % | - | - | 14.2 | % | ||
| EBITDA Margin (R$/cbm) | - | 86.0 | - | - | - | - | - | - | 86.0 | |||||||||
| Results by Business Unit | YTD13 | |||||||||||||||||
| Raízen | Raízen | Other | Elimination 50% | Adjustments and | ||||||||||||||
| Comgás | Combustíveis | Energia | Rumo | Radar | Business | Raízen | Eliminations | Consolidated | ||||||||||
| Amounts in R$ MM | ||||||||||||||||||
| Net Revenue | 951.2 | 32,585.1 | 6,117.9 | 544.4 | 36.5 | 1,064.9 | (19,351.5 | ) | (393.5 | ) | 21,555.0 | |||||||
| Cost of Goods and Services | (705.9 | ) | (30,847.4 | ) | (4,791.0 | ) | (325.4 | ) | (1.7 | ) | (792.8 | ) | 17,819.2 | 393.5 | (19,251.5 | ) | ||
| Gross Profit | 245.3 | 1,737.7 | 1,326.9 | 219.0 | 34.7 | 272.1 | (1,532.3 | ) | - | 2,303.4 | ||||||||
| Gross Margin(%) | 25.8 | % | 5.3 | % | 21.7 | % | 40.2 | % | 95.2 | % | 0.0 | % | 0.0 | % | - | 10.7 | % | |
| Selling Expenses | (108.2 | ) | (761.1 | ) | (442.1 | ) | - | - | (152.7 | ) | 601.6 | - | (862.6 | ) | ||||
| General and Administrative Expenses | (57.2 | ) | (269.0 | ) | (354.9 | ) | (41.4 | ) | (10.1 | ) | (154.2 | ) | 312.0 | - | (574.8 | ) | ||
| Other Operating Revenues (Expenses) | (0.9 | ) | 152.2 | 23.2 | (1.5 | ) | 89.9 | 206.1 | (87.7 | ) | - | 381.4 | ||||||
| Depreciation and amortization | 78.1 | 375.8 | 1,458.5 | 51.5 | 0.7 | 45.1 | (917.2 | ) | - | 1,092.6 | ||||||||
| EBITDA | 157.1 | 1,235.6 | 2,011.6 | 227.6 | 115.2 | 216.4 | (1,623.6 | ) | - | 2,340.0 | ||||||||
| EBITDA Margin (%) | 16.5 | % | 3.8 | % | 32.9 | % | 41.8 | % | 316.0 | % | 20.3 | % | 0.0 | % | 0.0 | % | 10.9 | % |
| EBITDA Margin (R$/cbm) | - | 74.2 | - | - | - | - | - | - | 74.2 | |||||||||
3 of 40
B.1 Raízen Combustíveis
Below you will find the results of Raízen Combustíveis, the business unit that distributes and trades fuels through a network of franchised Shell gas stations, in addition to supplying fuels to industrial clients and distributing aviation fuel.
The results of Raízen Combustíveis for year-to-date 2012 (YTD12) are proforma, considering nine months (April to December, 2011) of operations of Raízen Combustíveis (business combination of Esso and Shell), to allow for comparability between the periods.
Net Revenue
| Book | Book | Sales Breakdown | Book | Pro Forma | ||||||
| 3Q13 | 3Q12 | Chg. | Amounts in R$ MM | YTD13 | YTD12 | Chg. | % | |||
| 11,383.8 | 10,083.2 | 12.9 | % | Net Operating Revenue | 32,585.1 | 29,709.8 | 9.7 | % | ||
| 11,383.8 | 10,083.2 | 12.9 | % | Fuel Sales | 32,585.1 | 29,687.9 | 9.8 | % | ||
| 649.3 | 600.7 | 8.1 | % | Ethanol | 1,743.6 | 1,793.1 | -2.8 | % | ||
| 4,666.4 | 4,316.7 | 8.1 | % | Gasoline | 13,282.0 | 12,443.8 | 6.7 | % | ||
| 4,667.5 | 3,889.9 | 20.0 | % | Diesel | 13,380.6 | 11,854.7 | 12.9 | % | ||
| 1,245.3 | 1,116.2 | 11.6 | % | Aviation | 3,726.9 | 3,136.2 | 18.8 | % | ||
| 155.3 | 159.7 | -2.8 | % | Other Products | 452.1 | 460.2 | -1.7 | % | ||
| - | - | 0.0 | % | Other Services | - | 21.9 | - |
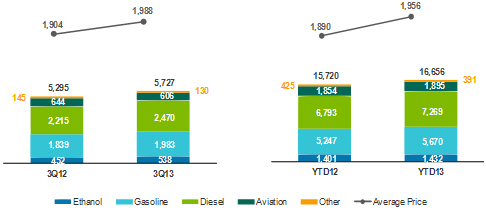
In 3Q13, Raízen Combustíveis’ net revenue grew 12.9% year-on-year to R$11.4 billion, mainly due to the 8.2% increase in total fuel sales volume in the period. The average price of the products sold went up by 4.4%, primarily driven by the rise in price average of gasoline, diesel and aviation fuel. Net revenue rose 4.3% in comparison quarter-on-quarter due to seasonal factors.
Parity between gasoline and ethanol prices was under 70% only in three states in Brazil (São Paulo, Goiás, and Mato Grosso), which led to a higher consumption of gasoline than ethanol in 3Q13. Even though, the volume of ethanol sold rose 19.0% due to lower average prices, which were down 9.3% compared to 3Q12.
4 of 40
| | Earnings Release Third Quarter of the Fiscal Year 2013 – October, November, December of 2012 |
Fuels
Volume (million liters) and Average Unit Price (R$/cbm)

Cost of Goods Sold
| Book | Pro Forma | COGS | Book | Pro Forma | |||||||||
| 3Q13 | 3Q12 | Chg. | % | Amounts in R$ MM | YTD13 | YTD12 | Chg. | % | |||||
| (10,773.2 | ) | (9,530.8 | ) | 13.0 | % | Fuel Sales | (30,847.4 | ) | (28,131.9 | ) | 9.7 | % | |
| Average Unitary Cost | (R$/cbm) | ||||||||||||
| (1,881 | ) | (1,800 | ) | 4.5 | % | Fuel Sales | (1,852 | ) | (1,790 | ) | 3.5 | % |
The cost of goods sold was R$10.8 billion for the quarter, an increase of 13.0% compared to 3Q12 that reached R$9.5 billion. The higher cost in the quarter was due to a higher volume of fuels sold, which accounted for nearly 8% of the cost increase, and higher unit costs, accounted for nearly 4% of the increase in total cost.
The average unit cost was R$1,881/cbm, up 4.5% over 3Q12. Compared to 2Q13, the average unit cost was up 1.8%.
5 of 40
| | Earnings Release Third Quarter of the Fiscal Year 2013 – October, November, December of 2012 |
Gross Profit
| Book | Pro Forma | Gross Profit | Book | Pro Forma | ||||||||
| 3Q13 | 3Q12 | Chg. | % | Amounts in R$ MM | YTD13 | YTD12 | Chg. | % | ||||
| 610.5 | 552.4 | 10.5 | % | Gross Profit | 1,737.7 | 1,577.9 | 10.1 | % | ||||
| 5.4 | % | 5.5 | % | -0.1 | p.p. | Gross Margin (%) | 5.3 | % | 5.3 | % | 0.0 | p.p |
| 106.6 | 104.3 | 2.2 | % | Gross Margin (R$/cbm) | 104.3 | 100.4 | 3.9 | % |
Gross profit was up 10.5% from R$552.4 million in 3Q12 to R$610.5 million in 3Q13. Unit gross margin in reais/cbm was also up, expanding 2.2% over the R$104.3/cbm recorded in 3Q12 to R$106.6/cbm in 3Q13. Year-on-year, Raízen Combustíveis’ gross margin was down 0.1 p.p. to 5.4% in 3Q13.
Selling, General, and Administrative Expenses
| Selling, General & Administrative | ||||||||||||
| Book | Pro Forma | Expenses | Book | Pro Forma | ||||||||
| 3Q13 | 3Q12 | Chg. | % | Amounts in R$ MM | YTD13 | YTD12 | Chg. | % | ||||
| (275.9 | ) | (320.3 | ) | -13.8 | % | Selling Expenses | (761.1 | ) | (851.2 | ) | -10.6 | % |
| (87.1 | ) | (55.1 | ) | 58.1 | % | General and Administrative Expenses | (269.0 | ) | (245.5 | ) | 9.6 | % |
In 3Q13, Raízen Combustíveis’s selling expenses dropped 13.8% to R$275.9 million, compared to R$320.3 million in 3Q12, which included some non-recurring events.
General and administrative expenses were up 58.1% from R$55.1 million in 3Q12 to R$87.1 million in 3Q13, reflecting the current corporate structure of Raízen Combustíveis as opposed to its first year of operation. Compared to 2Q13, expenses fell 5.6%.
Other operating revenues and expenses are basically the results from merchandise fees, convenience store royalties, revenue from leases, fees for the sale of lubricants at Raízen Combustíveis services stations, and revenues from the sale of assets, and totaled R$114.1 million in 3Q13. Of that amount, R$44.1 million refers to the sale of stakes in 13 fuel distribution terminals, including the one located in Araucária, Paraná State. Those sales of interest held by the Distributors occurs in order to adjust the interest in these pools by contractual clauses, and had no impact on the operating capacity or efficiency of Raízen Combustíveis.
6 of 40
| | Earnings Release Third Quarter of the Fiscal Year 2013 – October, November, December of 2012 |
EBITDA
| Book | Pro Forma | EBITDA | Book | Pro Forma | ||||||||
| 3Q13 | 3Q12 | Chg. | % | Amounts in R$ MM | YTD13 | YTD12 | Chg. | % | ||||
| 492.7 | 347.6 | 41.7 | % | EBITDA | 1,235.6 | 954.0 | 29.5 | % | ||||
| 4.3 | % | 3.4 | % | 0.9 | p.p | Margin EBITDA(%) | 3.8 | % | 3.2 | % | 0.6 | p.p |
| 86.0 | 65.6 | 31.0 | % | Margin EBITDA (R$/cbm) | 74.2 | 60.7 | 22.2 | % |
Raízen Combustíveis’s EBITDA rose 41.7% from R$347.6 million in 3Q12 to R$492.7 million in 3Q13. EBITDA margin rose year-on-year 0.9 p.p. to 4.3% in 3Q13, and reached R$86.0/cbm when measured in relation to the volume sold.
Net of the positive effect of the sale of assets mentioned above, Raízen Combustíveis’ EBITDA would have been R$448.6 million with EBITDA margin at R$78.3/cbm in 3Q13.
CAPEX
| Book | Pro Forma | CAPEX | Book | Pro Forma | ||||||
| 3Q13 | 3Q12 | Chg. | % | Amounts in R$ MM | YTD13 | YTD12 | Chg. | % | ||
| 165.8 | 181.2 | -8.5 | % | CAPEX | 523.7 | 303.2 | 72.7 | % |
Raízen Combustíveis’s CAPEX in 3Q13 was R$165.8 million, focused on new contracts and the renewal of existing contracts with resellers, maintenance of the network, and investments in health, safety and the environment (HSE), as well as expenses related to logistics, distribution, and trading.
Also, 93% of the rebranding process of Esso stations to the Shell brand has been completed and is expected to be finalized by March of 2013.
7 of 40
| | Earnings Release Third Quarter of the Fiscal Year 2013 – October, November, December of 2012 |
B.2 Raízen Energia
The following are the results for Raízen Energia, whose core business is the production and sale of a variety of products derived from sugarcane, including raw sugar (Very High Polarization - VHP), anhydrous and hydrous ethanol, as well as ethanol trading activities related to energy cogeneration from sugarcane bagasse.
Production Figures
In 3Q13, Raízen Energia operated 24 sugar, ethanol and energy cogeneration mills, with a crushing capacity of 65 million tonnes of sugarcane per crop year.
| Operational Figures | ||||||||||||
| 3Q13 | 3Q12 | Chg. | % | YTD13 | YTD12 | Chg. | % | |||||
| 17,843 | 8,219 | 117.1 | % | Crushed Sugarcane | 56,221 | 52,959 | 6.2 | % | ||||
| 9,231 | 4,097 | 125.3 | % | Own (‘000 tonnes) | 28,299 | 26,528 | 6.7 | % | ||||
| 8,612 | 4,121 | 109.0 | % | Suppliers (‘000 tonnes) | 27,922 | 26,430 | 5.6 | % | ||||
| 125.2 | 143.6 | -12.8 | % | Sugarcane TRS (kg/tonne) | 133.4 | 136.7 | -2.4 | % | ||||
| 88.9 | % | 86.3 | % | 2.6 | p.p | Mechanization (%) | 91.7 | % | 86.1 | % | 5.6 | p.p |
| Production | ||||||||||||
| 1,361 | 656 | 107.5 | % | Sugar | 4,162 | 3,969 | 4.9 | % | ||||
| 904 | 403 | 124.3 | % | Raw Sugar (‘000 tonnes) | 2,575 | 2,426 | 6.2 | % | ||||
| 457 | 253 | 80.8 | % | White Sugar (‘000 tonnes) | 1,587 | 1,543 | 2.8 | % | ||||
| 628 | 325 | 93.4 | % | Ethanol | 1,903 | 1,921 | -1.0 | % | ||||
| 294 | 101 | 191.1 | % | Anhydrous Ethanol (‘000 cbm) | 833 | 688 | 21.1 | % | ||||
| 334 | 224 | 49.3 | % | Hydrous Ethanol (‘000 cbm) | 1,070 | 1,233 | -13.3 | % |
South-Central Production
Through December 31, 2012, crushing for the 2012/2013 crop in South-Central Brazil totaled 531.35 million tonnes, up 7.4% year-on-year, according to data from the Sugarcane Industries Union – UNICA.
Recovery from the delay in crushing seen during throughout the crop year was chiefly due to the accumulation of biomass above expected levels because of the rains in the first months of the 2012/2013 crop. A few more than 10 production units were in operation in January 2013, adding marginal production to the overall volume of the Central-South region.
However, Total Recoverable Sugar (TRS) per tonne of sugarcane reached 135.64 kg in the 2012/2013 crop, down 1.39% from the 137.54 kg recorded in the 2011/2012 crop.
Raízen Energia
In the quarter, Raízen Energia crushed 17.8 million tonnes of sugarcane, up 117.1% year-on-year, 51.7% of which was own sugarcane. In line with the crop
8 of 40
| | Earnings Release Third Quarter of the Fiscal Year 2013 – October, November, December of 2012 |
behavior seen in the South-Central region, the higher volume of crushed sugarcane reflects crop recovery and extension of the harvest to December 2012, which ended up adding 18 days to the crushing period compared to the same period of the previous year.
Mechanized harvesting of won sugarcane reach 89% in 3Q13, and 92% in the crop year. Sugarcane TSR was 125.2 kg/tonne in the quarter, a decrease of 12.8% compared to 3Q12 (143.6 kg/tonne).
The average age of the sugarcane fields reached 3.4 years, reflecting the renewal of nearly 22% of the proprietary sugarcane plantation areas in the 2012/2013 crop. In 3Q13, Raízen Energia’s production mix was concentrated in sugar, with approximately 53% of sugarcane crushed used to make this product.
Net Revenue
| Sales Breakdown | ||||||||||
| 3Q13 | 3Q12 | Chg. | % | Amounts in R$ MM | YTD13 | YTD12 | Chg. | % | ||
| 2,605.4 | 1,751.4 | 48.8 | % | Net Operating Revenue | 6,117.9 | 6,054.4 | 1.0 | % | ||
| 1,250.4 | 887.6 | 40.9 | % | Sugar Sales | 3,177.4 | 3,247.2 | -2.1 | % | ||
| 233.0 | 310.5 | -25.0 | % | Domestic Market | 700.9 | 958.6 | -26.9 | % | ||
| 1,017.5 | 577.1 | 76.3 | % | Foreign Market | 2,476.4 | 2,288.5 | 8.2 | % | ||
| 937.6 | 744.5 | 25.9 | % | Ethanol Sales | 2,190.0 | 2,370.1 | -7.6 | % | ||
| 332.9 | 480.1 | -30.7 | % | Domestic Market | 799.4 | 1,881.0 | -57.5 | % | ||
| 301.5 | 264.4 | 14.0 | % | Foreign Market | 619.5 | 489.0 | 26.7 | % | ||
| 303.1 | - | n/a | Trading | 771.1 | - | n/a | ||||
| 321.7 | 53.0 | 506.9 | % | Energy Cogeneration | 556.6 | 233.8 | 138.1 | % | ||
| 95.8 | 66.3 | 44.4 | % | Other Products and Services | 193.9 | 203.4 | -4.7 | % |
Raízen Energia’s net revenue totaled R$2.6 billion for the quarter, up 48.8% over the same period of the previous year, when reported revenue was R$1.8 billion. This increase was mainly driven by better sales of sugar, ethanol and energy from cogeneration.
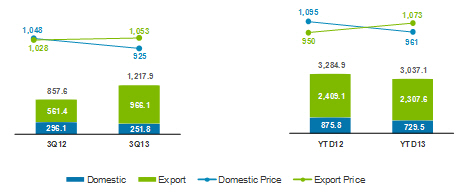
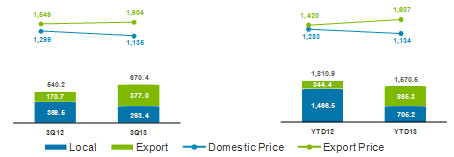
Sugar Sales
In 3Q13, net revenue from sugar sales totaled R$1.3 billion, up 40.9% over 3Q12, and represented 48% of Raízen Energia’s total revenue. The average sugar price in the quarter was R$1,026.7/tonne, down 0.8% over the R$1,035.0/tonne recorded in 3Q12.
The key driver of the increase in net revenue from sugar sales in 3Q13 was the 42.0% rise in the total sugar volume sold to R$362.9 million.
9 of 40
| | Earnings Release Third Quarter of the Fiscal Year 2013 – October, November, December of 2012 |
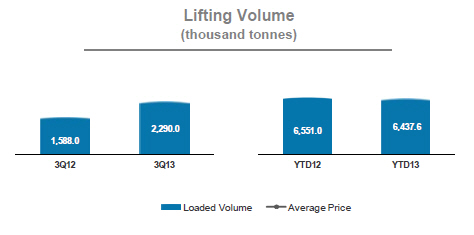
Sugar
Volume (thousand tonnes) and Average Unit Price (R$/tonne)
Sugar Inventories
| Sugar Inventories | ||||
| 3Q13 | 3Q12 | |||
| ´000 tonne | 1,290.9 | 871.9 | ||
| R$'MM | 895.2 | 651.5 | ||
| R$/tonne | 693.5 | 747.3 |
Ethanol Sales
Net revenue from ethanol sales increased 25.9% from R$744.5 million in 3Q12 o R$937.6 million in 3Q13. The average ethanol price was up 1.5% to R$1,398.5/cbm in 3Q13 from R$1,378.1/cbm in 3Q12.
The key factor driving the increase in net revenue was the 24.1%, representing R$193.1 million of increase year-on-year rise in the total volume of ethanol sold in 3Q13.
Ethanol exports represented 56.2% of total sales in the quarter, driven by the higher average price in the foreign market as opposed to the lower average price in the domestic market.
Net revenue from trading activities amounted to R$303.1 million for the quarter and R$771.1 million year-to-date.
10 of 40
| | Earnings Release Third Quarter of the Fiscal Year 2013 – October, November, December of 2012 |
Ethanol
Volume (million liters) and Average Unit Price (R$/cbm)
Ethanol Inventories
| Ethanol Inventories | ||||
| 3Q13 | 3Q12 | |||
| ´000 cbm | 680.8 | 445.8 | ||
| R$'MM | 767.9 | 533.7 | ||
| R$/cbm | 1,128.1 | 1,197.0 |
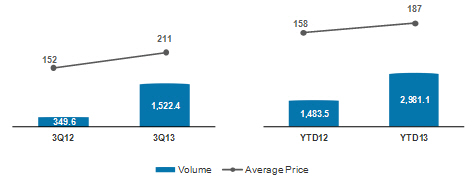
Energy Cogeneration
All of Raízen Energia’s 24 mills generate energy and are self-sufficient, and 13 sell surplus energy from cogeneration.
In 3Q13, net revenue from energy sales reached R$321.7 million, up 506.9% compared to 3Q12, when revenue was R$53.0 million. Sales volume was 1,522.4 thousand MWh at an average price of R$211.3/MWh.
The major factors affecting the growth in net revenue from the sale of energy in 3Q13 were the following:
| · | Higher volume of energy generated and sold in the quarter, with the longer crushing period in the 2012/2013 harvest, extended to December 2012; |
| · | Higher short-term energy prices (spot market) due to low expected rains/outflow in the major reservoirs in the Southeast and Mid-West regions; |
| · | Energy resale transactions in the spot market, which increased the total volume sold in the quarter. |
Cogeneration
11 of 40
| | Earnings Release Third Quarter of the Fiscal Year 2013 – October, November, December of 2012 |
Volume (thousand MWh) and Average Unit Price (R$/MWh)
Other Products and Services
Raízen Energia’s revenue from other products and services totaled R$95.8 million in 3Q13, an increase of 44.4% year-on-year, and includes basically represented sales of steam, molasses, and raw materials to service providers in the agricultural industry.
Cost of Goods Sold
Raízen Energia's cost of goods sold is reported together with the average unit costs, net of the effects of depreciation and amortization (cash cost).
| COGS per Product | ||||||||||||
| 3Q13 | 3Q12 | Chg. | % | Amounts in R$ MM | YTD13 | YTD12 | Chg. | % | ||||
| (2,028.8 | ) | (1,375.8 | ) | 47.5 | % | Cost of Goods Sold | (4,791.0 | ) | (4,821.7 | ) | -0.6 | % |
| (819.0 | ) | (661.0 | ) | 23.9 | % | Sugar | (2,171.9 | ) | (2,386.7 | ) | -9.0 | % |
| (568.7 | ) | (616.2 | ) | -7.7 | % | Ethanol | (1,291.0 | ) | (2,048.7 | ) | -37.0 | % |
| (301.7 | ) | - | n/a | Trading | (728.7 | ) | - | n/a | ||||
| (253.4 | ) | (23.7 | ) | 969.1 | % | Energy Cogeneration | (388.1 | ) | (86.1 | ) | 351.0 | % |
| (86.1 | ) | (74.9 | ) | 15.0 | % | Others | (211.3 | ) | (300.2 | ) | -29.6 | % |
| Average Unitary Costs³ | ||||||||||||
| (464.8 | ) | (582.9 | ) | -20.3 | % | Cash cost of sugar (R$/tonne) | (487.5 | ) | (560.2 | ) | -13.0 | % |
| (965.2 | ) | (843.8 | ) | 14.4 | % | Cash cost of ethanol (R$/’000 liters) | (943.2 | ) | (826.8 | ) | 14.1 | % |
Note 3: Average unit costs represent the cash cost, which is net of plantation and cultivation area depreciation and amortization, agricultural depreciation (machinery and equipment), industrial depreciation, and harvest off-season maintenance.
Raízen Energia’s cost of goods sold totaled R$2.0 billion for the quarter, up 47.5% over 3Q12 (R$1.4 billion). As mentioned before, this increase was mainly driven by higher sales of sugar, ethanol and energy from cogeneration.
Additionally, the 12.8% decrease in the TSR level—from 143.6 kg/tonne in 3Q12 to 125.2 kg/tonne in 3Q13—added to the cost increase because it generated a lower dilution of planting and tratment costs.
Some factors that ended up offsetting the rise in the cost of goods sold by Raízen Energia were:
12 of 40
| | Earnings Release Third Quarter of the Fiscal Year 2013 – October, November, December of 2012 |
| · | Increased productivity of the sugarcane fields—represented by a higher TCH level (tonne of cane per hectare), which was 81.1 in 3Q13, up from 64.2 in 3Q12; |
| · | Decrease of 5.6% in the TSR/kg cost, down from R$0.5026 in 3Q12 to R$0.4743 in 3Q13, which has a direct impact on the cost of sugarcane from suppliers and land leasing. |
Gross Profit
| Gross Profit and Gross Margin per Product | ||||||||||||
| 3Q13 | 3Q12 | Chg. | % | Amounts in R$ MM | YTD13 | YTD12 | Chg. | % | ||||
| 576.6 | 375.6 | 53.5 | % | Gross Profit | 1,326.9 | 1,232.8 | 7.6 | % | ||||
| 431.5 | 226.6 | 90.5 | % | Sugar | 1,005.5 | 860.5 | 16.9 | % | ||||
| 34.5 | % | 25.5 | % | 9.0 | p.p | Sugar Gross Margin (%) | 31.6 | % | 26.5 | % | 5.1 | p.p |
| 54.7 | % | 43.7 | % | 11.1 | p.p | Sugar (Cash) Gross Margin (%) | 53.4 | % | 43.3 | % | 10.1 | p.p |
| 67.2 | 128.3 | -47.6 | % | Ethanol | 170.3 | 321.4 | -47.0 | % | ||||
| 7.2 | % | 17.2 | % | -10.1 | p.p. | Ethanol Gross Margin (%) | 7.8 | % | 13.6 | % | -5.8 | p.p. |
| 31.0 | % | 38.8 | % | -7.8 | p.p. | Ethanol (Cash) Gross Margin (%) | 32.4 | % | 36.8 | % | -4.5 | p.p. |
| 68.3 | 29.3 | 133.1 | % | Energy Cogeneration | 168.5 | 147.7 | 14.1 | % | ||||
| 9.6 | (8.6 | ) | -211.8 | % | Other | (17.4 | ) | (96.8 | ) | -82.0 | % |
Raízen Energia recorded gross profit of R$576.6 million in 3Q13, an increase of 53.5% year-on-year (R$375.6 million in 3Q12). The key drivers of this increase in gross profit were the results recorded in the sale of sugar and cogeneration electric energy.
Gross profit from the sale of sugar was R$431.5 million, or 74.8% of total gross profit, while gross profit from the sale of energy was R$68.3 million, up 133.1% year-on-year. On the other hand, gross profit from the sale of ethanol dropped 47.6% to R$67.2 million in 3Q13 from R$128.3 million in 3Q12.
Selling, General & Administrative Expenses
| Selling, General & Administrative Expenses | ||||||||||||
| 3Q13 | 3Q12 | Chg. | % | Amounts in R$ MM | YTD13 | YTD12 | Chg. | % | ||||
| (186.1 | ) | (119.3 | ) | 56.0 | % | Selling Expenses | (442.1 | ) | (433.8 | ) | 1.9 | % |
| (123.2 | ) | (111.2 | ) | 10.8 | % | General and Administrative Expenses | (354.9 | ) | (317.4 | ) | 11.8 | % |
Raízen Energia’s selling expenses rose 56.0% year-on-year to R$186.1 million in 3Q13. The change in the ethanol sales mix from the domestic to the foreign market raised expenses with freight by R$23.5 million, and was the key driver of the rise in selling expenses for the quarter.
13 of 40
| | Earnings Release Third Quarter of the Fiscal Year 2013 – October, November, December of 2012 |
General and administrative expenses were R$123.2 million, up 10.8% from 3Q12 (R$111.2 million) especially due to the collective wage increase, because the adjustments to Raízen’s current structure were made in 3Q12.
EBITDA
| EBITDA | ||||||||||||
| 3Q13 | 3Q12 | Chg. | % | Amounts in R$ MM | YTD13 | YTD12 | Chg. | % | ||||
| 833.7 | 501.9 | 66.1 | % | EBITDA | 2,011.6 | 1,746.6 | 15.2 | % | ||||
| 32.0 | % | 28.7 | % | 3.3 | p.p | Margin EBITDA (%) | 32.9 | % | 28.8 | % | 4.0 | p.p |
Raízen Energia posted EBITDA of R$833.7 million in 3Q13, up 66.1% over the R$501.9 million recorded in 3Q12. The EBITDA margin rose 3.3 p.p. to 28.7% in 3Q13, up from 32.0% in 3Q12.
Hedge
Volume positions and fixed sugar prices agreed with traders or through derivative financial instruments as at December 31, 2012, and foreign exchange derivatives contracted by Raízen Energia to hedge future cash flows, are as follows:
| Summary of Hedge Operations at December 31st , 2012 | ||
| 2012 / 2013 | 2013 / 2014 | |
| Sugar | ||
| NY #11 | ||
| Volume (‘000 tonne) | 2,696.3 | 750.5 |
| Average Price (¢US$/lb) | 22.57 | 21.95 |
| London #5 | ||
| Volume (‘000 tonne) | - | - |
| Average Price (US$/lb) | - | - |
| Exchange rate | ||
| US$ | ||
| Volume (US$ million) | 1,388.7 | 381.1 |
| Average Price (R$/US$) | 1.9603 | 2.1654 |
14 of 40
| | Earnings Release Third Quarter of the Fiscal Year 2013 – October, November, December of 2012 |
Impacts of Hedge Accounting
Raízen Energia has been using cash flow hedge accounting for certain derivative financial instruments in order to hedge against the price risk for sugar and against the foreign exchange risk for revenues from sugar exports.
The table below shows the expected transfer of gain/loss balances from the shareholders’ equity as at December 31, 2012 to the net operating income of Raízen Energia4 in future years, broken down by coverage period for the following hedging instruments:
| Expiration Period - (R$MM) | ||||||||
| Derivative | Market | Risk | 2012 / 2013 | 2013 / 2014 | Total | |||
| Futures | OTC/NYBOT | NY#11 | 19.5 | 65.6 | 85.1 | |||
| NDF | OTC/CETIP | USD | 2.7 | - | 2.7 | |||
| (=) Hedge Accounting impact | 22.2 | 65.6 | 87.8 | |||||
| (-) Deferred Income Tax | (7.6 | ) | (22.3 | ) | (29.9 | ) | ||
| (=) Asset Valuation Adjustment | 14.7 | 43.3 | 58.0 | |||||
Note 4: The table above shows 100% of the hedge accounting gains/losses reclassified to shareholders’ equity. As Cosan proportionately consolidates Raízen Energia, these effects will impact only 50% of the consolidated results.
CAPEX
| CAPEX | ||||||||||
| 3Q13 | 3Q12 | Chg. | % | Amounts in R$ MM | YTD13 | YTD12 | Chg. | % | ||
| 499.4 | 571.3 | -12.6 | % | Total CAPEX | 1,387.3 | 1,729.5 | -19.8 | % | ||
| 418.8 | 402.0 | 4.2 | % | Operating CAPEX | 1,158.2 | 1,170.8 | -1.1 | % | ||
| 263.1 | 213.9 | 23.0 | % | Biological assets | 737.9 | 720.0 | 2.5 | % | ||
| 75.7 | 155.5 | -51.3 | % | Inter-harvest maintenance costs | 198.6 | 284.6 | -30.2 | % | ||
| 24.1 | 18.6 | 29.8 | % | SSMA and Sustaining | 46.5 | 78.9 | -41.1 | % | ||
| 31.6 | 14.0 | 125.4 | % | Mechanization | 120.7 | 87.3 | 38.2 | % | ||
| 24.4 | - | n/a | Industrial | 54.6 | - | n/a | ||||
| 80.7 | 169.3 | -52.4 | % | Expasion CAPEX | 229.1 | 558.7 | -59.0 | % | ||
| 14.0 | 83.1 | -83.2 | % | Expasion Projects | 70.7 | 353.5 | -80.0 | % | ||
| 26.4 | 43.9 | -39.8 | % | Expasion | 58.8 | 99.4 | -40.8 | % | ||
| 40.2 | 42.3 | -4.9 | % | Other | 99.5 | 105.8 | -5.9 | % |
Raízen Energia‘s CAPEX in 3Q13 was R$499.4 million, down 12.6% over the R$571.3 million reported for 3Q12.
In 3Q13, investments in biological assets totaled R$263.1 million and mostly reflect the renewal of Raízen Energia’s sugarcane fields and the expansion of the planted areas. Investments in off-season maintenance totaled R$75.7 million; and investments in cogeneration focused on the completion of projects at the Barra and Univalem units reached R$14.0 million.
15 of 40
| | Earnings Release Third Quarter of the Fiscal Year 2013 – October, November, December of 2012 |
B.3 Comgás
Below you will find the results of Companhia de Gás de São Paulo, the business unit that distributes and trades natural gas in the concession region of São Paulo State.
Comgás uses the calendar year in its financial reporting. Due to the beginning of the consolidation of Comgás results into Cosan’s financial statements, two different bases were used, as explained below:
| · | Accounting Basis (crop year) |
| o | 3Q13 – two months (November and December of 2012) |
| o | YTD13 – two months (November and December of 2012) |
| · | Proforma (calendar year) |
| o | 4Q12 – three months (October, November, and December of 2012) |
| o | 4Q11 – three months (October, November, and December of 2011) |
| o | 2012 – twelve months (January to December of 2012) |
| o | 2011 – twelve months (January to December of 2011) |
Except as otherwise stated, the analysis that follows compares the results of 4Q12 with 4Q11 (proforma), and represents the whole of Comgás’s operations.
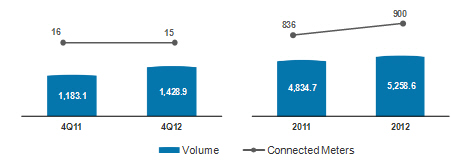
Volumes Sold
| Book | Pro Forma | Pro Forma | 4Q12 x 4Q11 | Operational Figures | Book | Pro Forma | Pro Forma | 2012 x 2011 | |||||
| 3Q13 | 4Q12 | 4Q11 | Chg. | % | Volume ('000 cbm) | YTD13 | 2012 | 2011 | Chg. | % | |||
| 926,317 | 1,428,911 | 1,183,073 | 20.8 | % | Total Gas Sales | 926,317 | 5,258,631 | 4,834,746 | 8.8 | % | |||
| 757,579 | 1,172,121 | 1,172,594 | 0.0 | % | Gas Sales | 757,579 | 4,731,617 | 4,778,862 | -1.0 | % | |||
| 33,044 | 50,469 | 48,399 | 4.3 | % | Residential | 33,044 | 198,872 | 183,028 | 8.7 | % | |||
| 18,849 | 28,274 | 27,993 | 1.0 | % | Commercial | 18,849 | 111,662 | 108,272 | 3.1 | % | |||
| 604,101 | 937,275 | 932,850 | 0.5 | % | Industrial | 604,101 | 3,788,744 | 3,850,930 | -1.6 | % | |||
| 57,015 | 89,344 | 87,553 | 2.0 | % | Co-generation | 57,015 | 357,530 | 345,754 | 3.4 | % | |||
| 44,570 | 66,759 | 75,799 | -11.9 | % | Vehicular | 44,570 | 274,809 | 290,878 | -5.5 | % | |||
| 168,738 | 256,790 | 10,479 | n/a | Thermal Power | 168,738 | 527,014 | 55,884 | n/a | |||||
In 4Q12, Comgás continued with its strategy of focusing on the residential segment, and on developing the commercial and industrial segments.
According to its concession agreement, Comgás has exclusivity in trading and distributing gas for the residential segment until 2029, renewable for an additional 20 years. In 4Q12, the company distributed 50.5 million cbm of gas, an increase of 4.3% compared to 4Q11 (48.4 million cbm). In 2012, the
16 of 40
| | Earnings Release Third Quarter of the Fiscal Year 2013 – October, November, December of 2012 |
residential segment accounted for the consumption of 198.9 million cbm of gas, an increase of 8.7% compared to 2011 (183.0 million cbm). In the year, 3.8% of the gas distributed by Comgás was to this segment, representing a 27.0% contribution margin.
Comgás distributed 111.6 million cbm of gas for the commercial segment in 2012, which represents 2.1% of the total gas distributed in the year, with a contribution margin of 8.8%. Year-on-year, the volume of gas distributed rose 1.0% to 28.3 million cbm in 4Q12. A total of 887 new clients were connected in 2012, accounting for an increase of 3.1% in the volume distributed to the segment compared to 2011.
In the industrial segment, which is the largest in terms of volume sold, Comgás had exclusivity for trading up to May of 2011, and still has exclusivity for distribution until 2029. In 4Q12, the company distributed 937.3 million cbm, an increase of 0.5% compared to 4Q11. In 2012, Comgás distributed 3.79 billion cbm of gas to the industrial segment, a decrease of 1.6% compared to 2011 (3.85 billion cbm). This reduction was chiefly driven by the economic slowdown in Brazil and abroad and reflected the competitiveness issues that the domestic industry is currently facing.
In December of 2012, Comgás had 1,002 clients in this segment, accounting for 72.0% of the total gas consumption for the year and a 56.0% contribution margin.
Natural Gas
Volume of Gas Sold (million cbm) and Connected Meters (thousand units)
17 of 40
| | Earnings Release Third Quarter of the Fiscal Year 2013 – October, November, December of 2012 |
Operating Revenue
| Book | Pro Forma | Pro Forma | 4Q12 x 4Q11 | Sales Breakdown | Book | Pro Forma | Pro Forma | 2012 | x 2011 | |||||||
| 3Q13 | 4Q12 | 4Q11 | Chg. | % | Amounts in R$ MM | YTD13 | 2012 | 2011 | Chg. | % | ||||||
| 1,163.4 | 1,792.0 | 1,328.8 | 34.9 | % | Gross Operating Revenue | 1,163.4 | 6,519.8 | 5,111.5 | 27.6 | % | ||||||
| 1,064.4 | 1,631.3 | 1,227.6 | 32.9 | % | Gas Sales | 1,064.4 | 6,026.3 | 4,753.2 | 26.8 | % | ||||||
| 112.9 | 171.6 | 148.7 | 15.4 | % | Residential | 112.9 | 650.7 | 553.8 | 17.5 | % | ||||||
| 44.9 | 67.2 | 57.5 | 16.8 | % | Commercial | 44.9 | 252.9 | 211.5 | 19.6 | % | ||||||
| 746.4 | 1,148.7 | 893.5 | 28.6 | % | Industrial | 746.4 | 4,345.8 | 3,522.2 | 23.4 | % | ||||||
| 55.1 | 86.0 | 68.6 | 25.4 | % | Cogeneration | 55.1 | 346.6 | 242.8 | 42.7 | % | ||||||
| 64.0 | 97.0 | 3.6 | 2594.4 | % | Thermal Power | 64.0 | 195.8 | 17.4 | 1027.4 | % | ||||||
| 41.1 | 60.8 | 55.6 | 9.4 | % | Vehicular | 41.1 | 234.4 | 205.6 | 14.0 | % | ||||||
| 94.9 | 152.8 | 93.1 | 64.2 | % | Construction Revenue | 94.9 | 447.0 | 326.6 | 36.9 | % | ||||||
| 4.1 | 7.9 | 8.1 | -2.5 | % | Other | 4.1 | 46.5 | 31.7 | 46.5 | % | ||||||
| (212.1 | ) | (324.9 | ) | (260.8 | ) | 24.6 | % | Tax on Sales | (212.1 | ) | (1,240.3 | ) | (1,008.9 | ) | 22.9 | % |
| 951.2 | 1,467.2 | 1,068.0 | 37.4 | % | Net Operating Revenue | 951.2 | 5,279.5 | 4,102.7 | 28.7 | % | ||||||
| 854.6 | 1,307.2 | 967.6 | 35.1 | % | Gas Sales | 854.6 | 4,790.5 | 3,747.5 | 27.8 | % | ||||||
| 94.9 | 152.8 | 93.1 | 64.2 | % | Construction Revenue - ICPC01 | 94.9 | 447.0 | 326.6 | 36.9 | % | ||||||
| 1.8 | 7.2 | 7.3 | -1.6 | % | Other | 1.8 | 41.9 | 28.5 | 47.0 | % |
In 4Q12, Comgás saw an increase of 34.9% in its gross revenue from R$1.3 billion in 4Q11 to R$1.8 billion in 4Q12. In 2012, gross revenue was up 27.6% from R$5.1 billion in 2011 to R$6.5 billion.
Increased tariffs, as approved by ARSESP resolutions no. 340 and 379, were the main drivers of the variations in Natural Gas Sales Revenue. To establish the new rates, the ARSESP considered the increased cost of natural gas, especially imported gas (subject to agency review), impacted by the stronger dollar and the higher average contracted oil price per barrel, key elements for natural gas price formation in Brazil.
In 2012, net revenue from sales and services was the highest ever for Comgás at R$5.3 billion, up 28.7% over the R$4.1 billion in 2011. Net revenue in 4Q12 increased 37.4% over 4Q11 to R$1.5 billion.
Cost of Goods and Services Sold
| Book | Pro Forma | Pro Forma | 4Q12 x 4Q11 | COGS | Book | Pro Forma | Pro Forma | 2012 x 2011 | ||||||||
| 3Q13 | 4Q12 | 4Q11 | Chg. | % | Amounts in R$ MM | YTD13 | 2012 | 2011 | Chg. | % | ||||||
| (705.9 | ) | (1,083.3 | ) | (833.1 | ) | 30.0 | % | Cost of Goods and Services | (705.9 | ) | (3,881.9 | ) | (2,996.6 | ) | 29.5 | % |
| (568.2 | ) | (840.4 | ) | (637.1 | ) | 31.9 | % | Natural Gas | (568.2 | ) | (3,070.9 | ) | (2,310.6 | ) | 32.9 | % |
| (42.9 | ) | (90.1 | ) | (103.0 | ) | -12.6 | % | Transportation and other Gas services | (42.9 | ) | (363.9 | ) | (359.4 | ) | 1.3 | % |
| (94.9 | ) | (152.8 | ) | (93.1 | ) | 64.2 | % | Construction - ICPC 01 | (94.9 | ) | (447.0 | ) | (326.6 | ) | 36.9 | % |
The total cost of goods and services sold, composed of commodity costs, transportation and construction (IFRIC 12) was R$3.9 billion in 2012, up 29.5% over 2011. In the quarter, this figure was up 30.0% year-on-year to R$1.1 billion.
These increases are chiefly explained by the increased cost of natural gas deriving from gas supply contracts priced in U.S. dollars.
According to the methodology of each contract, the cost of gas is adjusted annually by inflation, as measured by the Market Price Index (IGP-M) and quarterly by a basket of fuel oil that varies according to the price of oil per barrel on the international market.
18 of 40
| | Earnings Release Third Quarter of the Fiscal Year 2013 – October, November, December of 2012 |
The differences between real costs incurred and the cost of gas included in the rate charged to customers as per the ARSESP fee structure are accrued to the Regulatory Current Account and are passed through or charged according to regulatory resolutions in periodic adjustments or rate reviews.
Gross Profit
| Book | Pro Forma | Pro Forma | 4Q12 x 4Q11 | Gross Profit | Book | Pro Forma | Pro Forma | 2012 x 2011 | ||||||||
| 3Q13 | 4Q12 | 4Q11 | Chg. | % | Amounts in R$ MM | YTD13 | 2012 | 2011 | Chg. | % | ||||||
| 245.3 | 383.9 | 234.8 | 63.5 | % | Gross Profit | 245.3 | 1,397.7 | 1,106.0 | 26.4 | % | ||||||
| 25.8 | % | 26.2 | % | 22.0 | % | 4.2 | p.p | Gross Margin (%) | 25.8 | % | 26.5 | % | 27.0 | % | -0.5 | p.p. |
Gross profit from Comgás in 2012 was up 26.4% over 2011’s R$1.1 billion to R$1.4 billion. In 4Q12, gross profit was R$383.9 million, compared to R$234.8 million in 4Q11, up 63.5%, primarily explained by transactions in the regulatory current account, inflation adjustments on the margin in May of 2012 and the increased sales volume.
Selling, General & Administrative Expenses
| Pro Forma | Pro Forma | 4Q12 x 4Q11 | Selling, General and Administrative | Book | Pro Forma | Pro Forma | 2012 x 2011 | |||||||
| 4Q12 | 4Q11 | Chg. | % | Amounts in R$ MM | YTD13 | 2012 | 2011 | Chg. | % | |||||
| (40.7 | ) | (28.2 | ) | 44.4 | % | Selling Expenses | (108.2 | ) | (126.5 | ) | (115.7 | ) | 9.3 | % |
| (157.7 | ) | (152.5 | ) | 3.4 | % | General and Administrative Expenses | (57.2 | ) | (590.0 | ) | (512.6 | ) | 15.1 | % |
In 4Q12, Comgás’ selling expenses totaled R$40.7 million, up 44.4% over the same quarter of the previous year. In the year, however, selling expenses increased 9.3% from R$115.7 million in 2011 to R$126.5 million.
General and administrative expenses were R$157.7 million in the quarter, up 3.4% over 4Q11, while in the year, they totaled R$590.0 million, growing 15.1% over the R$512.6 million reported in 2011.
EBITDA
| Pro Forma | Pro Forma | 4Q12 x 4Q11 | EBITDA | Book | Pro Forma | Pro Forma | 2012 x 2011 | |||||||
| 4Q12 | 4Q11 | Chg. | % | Amounts in R$ MM | YTD13 | 2012 | 2011 | Chg. | % | |||||
| 257.5 | 116.1 | 121.8 | % | EBITDA | 157.1 | 742.9 | 523.8 | 41.8 | % | |||||
| 17.5 | % | 10.9 | % | 6.7 | p.p | EBITDA Margin (%) | 16.5 | % | 14.1 | % | 12.8 | % | 1.3 | p.p |
Comgás’ EBITDA reached R$257.5 million in 4Q12, up 121.8% over 4Q11’s R$116.1 million. EBITDA totaled R$961.8 million in the year, up 34.3% over 2011. EBITDA margin closed the year of 2012 at 18.2%, expanding 0.7 p.p. over the previous year, while for the quarter, EBITDA margin was 17.6%, up 6.6 p.p. year-on-year. These variations are mainly due to the increased volume and impacts of the Regulatory Account.
19 of 40
| | Earnings Release Third Quarter of the Fiscal Year 2013 – October, November, December of 2012 |
CAPEX
| Pro Forma | Pro Forma | 4Q12 x 4Q11 | CAPEX | Book | Pro Forma | Pro Forma | 2012 x 2011 | |||||||
| 4Q12 | 4Q11 | Chg. | % | Amounts in R$ MM | YTD13 | 2012 | 2011 | Chg. | % | |||||
| 189.3 | 141.6 | 33.7 | % | CAPEX | 119.8 | 616.2 | 509.7 | 20.9 | % | |||||
In 2012, Comgás invested R$616.2 million, approximately 75% of which was allocated to network expansion programs. These investments reflect Comgas’ strategy of expanding to regions it does not yet serve, in addition to network penetration and growth through integrated projects, as is the case with the Guarulhos, Mogi das Cruzes, Taubaté, Osasco and other projects.
20 of 40
| | Earnings Release Third Quarter of the Fiscal Year 2013 – October, November, December of 2012 |
B.4 Rumo Logística
Below you will find the results of Rumo, Cosan’s logistics business responsible for providing integrated logistics services, storage and port elevation for sugar and other agricultural commodities.
Net Revenue
| Sales breakdown | ||||||||||
3Q13 | 3Q12 | Chg. | Amounts in R$ MM | YTD13 | YTD12 | Chg. | % | |||
| 221.6 | 143.1 | 54.8 | % | Net Operating Revenue | 544.4 | 497.7 | 9.4 | % | ||
| 176.8 | 109.4 | 61.6 | % | Transportation | 420.9 | 359.8 | 17.0 | % | ||
| 41.1 | 29.6 | 38.8 | % | Loading | 113.4 | 123.5 | -8.2 | % | ||
| 3.7 | 4.1 | -8.9 | % | Other | 10.1 | 14.4 | -30.3 | % |
Rumo’s net revenue totaled R$221.6 million in 3Q13, up 54.8% over the R$143.1 million reported in the same period of the previous year.
In the quarter, net revenue from sugar transportation increased 61.6% year-on-year to R$176.8 million or 80% of total net revenue in the period, mainly driven by: (i) the increased sugar export volume in the period as compared to the previous year due to the extension of the harvest; and (ii) better prices as a result of the mix of routes operated in the period.
In 3Q13, sugar was the only product lifted at the Port of Santos and volume totaled 2,290 thousand tonnes, up 44.1% over 3Q12, also a reflection of the late 2012/2013 harvest. YTD13, the volume lifted recovered from the initial delay, reaching 6,437 thousand tonnes, down only 2% over the same period of the previous year.
Rumo’s net revenue grew 9.4% from R$497.7 million in the same period of the previous year to R$544.4 million.
21 of 40
| | Earnings Release Third Quarter of the Fiscal Year 2013 – October, November, December of 2012 |
Cost of Services Provided
| Costs of Services | ||||||||||||
| 3Q13 | 3Q12 | Chg. | % | Amounts in R$ MM | YTD13 | YTD12 | Chg. | % | ||||
| (121.4 | ) | (85.8 | ) | 41.5 | % | Cost of Services | (325.4 | ) | (316.7 | ) | 2.7 | % |
Rumo’s cost of services provided includes railway and highway freight, port elevation, transshipment and storage costs in countryside of São Paulo and at the Port of Santos.
In the quarter, the cost of services provided was up 41.5% over 3Q12 due to the increased volume transported, which also caused greater dilution of fixed costs and driving total cost of services provided to 55% of net revenue, while in 3Q12, this figure accounted for 60% of net revenue.
Gross Profit
| Gross Profit | ||||||||||||
| 3Q13 | 3Q12 | Chg. | % | Amounts in R$ MM | YTD13 | YTD12 | Chg. | % | ||||
| 100.1 | 57.3 | 74.8 | % | Gross Profit | 219.0 | 181.0 | 21.0 | % | ||||
| 45.2 | % | 40.0 | % | 5.2 | p.p | Gross Margin (%) | 40.2 | % | 36.4 | % | 3.9 | p.p |
Rumo’s gross profit totaled R$100.1 million in 3Q13, up 74.8% over the same period of the previous year, while margins expanded 5.2 p.p. to 45.2% in the quarter, compared to 40.0% in 3Q12.
General and Administrative Expenses
| General and Administrative Expenses | ||||||||||||
| 3Q13 | 3Q12 | Chg. | % | Amounts in R$ MM | YTD13 | YTD12 | Chg. | % | ||||
| (15.2 | ) | (9.2 | ) | 65.2 | % | General and Administrative Expenses | (41.4 | ) | (28.7 | ) | 44.3 | % |
General and administrative expenses were R$15.2 million in the quarter, compared to R$9.2 million in 3Q12. This 65.2% increase is chiefly explained by the beginning of operations at Itirapina terminal and consulting services.
EBITDA
| EBITDA | ||||||||||||
| 3Q13 | 3Q12 | Chg. | % | Amounts in R$ MM | YTD13 | YTD12 | Chg. | % | ||||
| 98.9 | 61.2 | 61.6 | % | EBITDA | 227.6 | 192.6 | 18.2 | % | ||||
| 44.6 | % | 42.8 | % | 1.9 | p.p | Margin EBITDA (%) | 41.8 | % | 38.7 | % | 3.1 | p.p |
Rumo’s EBITDA reached R$98.9 million in 3Q13, up 61.6% over 3Q12 with margin up 1.9 p.p. to 44.6%.
22 of 40
| | Earnings Release Third Quarter of the Fiscal Year 2013 – October, November, December of 2012 |
CAPEX
| CAPEX | |||||||||
| 3Q13 | 3Q12 | Chg.% | Amounts in R$ MM | YTD13 | YTD12 | Chg. | % | ||
| 79.3 | 67.0 | 18.4% | CAPEX | 209.6 | 223.4 | -6.2 | % |
In 3Q13, Rumo’s CAPEX was R$79.3 million, growing 18.4% as compared to the R$67.0 million in 3Q12.
The main investments in the period were: (i) R$33.3 million in permanent ways; (ii) R$25.3 million in new railcar and equipment acquisitions; (iii) R$10.7 million in improvements to terminals at the Port of Santos; and (iv) R$10.0 million in other investments.
Year-to-date, total investments R$209.6 million, lower than expected for the period due to delays in environmental licensing for duplication of permanent ways.
23 of 40
| | Earnings Release Third Quarter of the Fiscal Year 2013 – October, November, December of 2012 |
B.5 Radar
Below are the results for Radar, whose main activity is investment in agricultural properties and leasing to the Brazilian rural real estate market.
Radar’s results are presented on two separate bases – accounting and pro-forma – for comparability among the periods.
The major differences between both bases are as follows:
o | Book | |||
o | 3Q13 – three months (October, November, and December of 2012) of Radar’s operations after the consolidation into Cosan; | |||
o | Pro Forma | |||
o | 3Q12 – three months (October, November, and December 2011) of the combination of Radar’s operations with the results of Cosan's lands | |||
o | YTD13 – nine months (April to December of 2012) of the combination of Radar’s operations with the results of Cosan's lands | |||
o | YTD12 – nine months (April to December of 2011) of the combination of Radar’s operations with the results of Cosan's lands | |||
The analysis below compares the 3Q13 results (book) with 3Q12 (pro Forma).
Net Revenue
| Book | Pro Forma | Pro Forma | Pro Forma | |||||||||
| 3Q13 | 3Q12 | Chg. | % | Amounts in R$ MM | YTD13 | YTD12 | Chg. | % | ||||
| 15.6 | 18.0 | -13.4 | % | Net Operating Revenue | 71.5 | 48.0 | 48.9 | % | ||||
| - | - | n/a | Property Sale | 22.1 | - | n/a | ||||||
| 15.6 | 18.0 | -13.4 | % | Land Lease | 49.5 | 48.0 | 3.0 | % | ||||
| - | - | n/a | Cost of Property Sales | (20.1 | ) | - | n/a | |||||
| - | - | n/a | Gain Sale Farms | (20.1 | ) | - | n/a | |||||
| - | - | n/a | Land Lease | - | - | n/a | ||||||
| 15.6 | 18.0 | -13.4 | % | Gross Profit | 51.5 | 48.0 | 7.2 | % | ||||
| 100.0 | % | 100.0 | % | - | Gross Margin (%) | 72.0 | % | 100.0 | % | -28.0 | p.p. |
Radar’s net revenue is derived from the sale of assets and leasing of agricultural lands. In 3Q13, no properties were sold and Radar’s net revenue came from leasing, reaching a total of R$15.6 million, down 13.4% over 3Q12. This reduction is associated with the variation in agricultural commodities prices, as well as other variables that impact land leasing prices.
Radar did not register any cost of services provided in 3Q13 as it did not sell any assets. It should be noted that all costs related to land leasing are incurred by
24 of 40
| | Earnings Release Third Quarter of the Fiscal Year 2013 – October, November, December of 2012 |
the operator of the agricultural properties.In 3Q13, Radar’s gross profit was R$15.6 million, with gross margin at 100%.
General and Administrative Expenses
| Book | Pro Forma | General and Administrative Expenses | Pro Forma | Pro Forma | ||||||||
| 3Q13 | 3Q12 | Chg. | % | Amounts in R$ MM | YTD13 | YTD12 | Chg. | % | ||||
| (6.1 | ) | (14.2 | ) | -57.0% | General and Administrative Expenses | (15.9 | ) | (21.0 | ) | -24.2 | % |
Radar’s general and administrative expenses were R$6.1 million in the quarter, down 57% year-on-year as a result of one-off expenses related to previous transactions that impacted acquired asset transfer taxes (ITBI) incurred in 3Q12.
In addition, in 3Q13, other operating revenues totaled R$86.9 million, basically derived from Radar’s mark-to-market of the property portfolio based on market indexes.
EBITDA
| Book | Pro Forma | EBITDA | Pro Forma | Pro Forma | ||||||||
| 3Q13 | 3Q12 | Chg. | % | Amounts in R$ MM | YTD13 | YTD12 | Chg. | % | ||||
| 96.6 | 249.3 | -61.3% | EBITDA | 127.7 | 273.9 | -53.4 | % | |||||
| 620.4 | % | 1386.9 | % | n/a | Margin EBITDA (%) | 178.5 | % | 570.3 | % | n/a |
In 3Q13, Radar posted EBITDA of R$96.6 million in 3Q13. The 61.3% decline as compared to 3Q12 is mainly explained by fair value accounting, which in 2011 was greater as a result of the first independent evaluation of the full portfolio, showing gains that had not been captured previously.
25 of 40
| | Earnings Release Third Quarter of the Fiscal Year 2013 – October, November, December of 2012 |
B.6 Other Businesses
Below we report the results for our Other Businesses, which consist of manufacturing and distribution activities for the Mobil and Comma brands, base oil distribution, and the corporate structures of Cosan businesses, except for Raízen.
Net Revenue
| Sales breakdown | ||||||||||
| 3Q13 | 3Q12 | Chg. | % | Amounts in R$ MM | YTD13 | YTD12 | Chg. | % | ||
| 377.9 | 263.5 | 43.4 | % | Net Operating Revenue | 1,064.9 | 794.6 | 34.0 | % | ||
| 337.5 | 254.4 | 32.7 | % | Lubricant Sales | 928.9 | 767.4 | 21.0 | % | ||
| 40.4 | 9.1 | 344.3 | % | Other Products and Services | 136.0 | 27.1 | 401.9 | % |
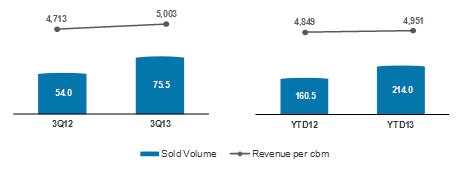
Net revenue from lubricant and other product sales in 3Q13 reached R$377.9 million, up 43.4% over 3Q12’s R$263.5 million. This growth was driven by the consolidation of Comma Oil & Chemical's results, which saw increased sales due to seasonality with autumn/winter in the Northern Hemisphere, increasing demand for winter car care products in the period.
The start of lubricant distribution in Bolivia, Uruguay and Paraguay also helped to raise net revenue. Together with Comma Oil & Chemicals, international operations represented approximately 20% over total revenue. Quarter-on-quarter, net revenue was up 2.2%, mainly due to increased base oil sales in the quarter.
The average unit price of lubricants and base oils sold by Cosan Lubrificantes in 3Q13 increased 6.2% year-on-year to R$5,003/m3.
Lubricants and Base Oils
Volume (million liters) and Average Unit Price (R$/’000 liters)
26 of 40
| | Earnings Release Third Quarter of the Fiscal Year 2013 – October, November, December of 2012 |
Selling, General & Administrative Expenses
| Selling, General and Administrative Expenses | ||||||||||||
| 3Q13 | 3Q12 | Chg. | % | Amounts in R$ MM | YTD13 | YTD12 | Chg. | % | ||||
| (56.1 | ) | (35.1 | ) | 59.8 | % | Selling Expenses | (152.7 | ) | (149.2 | ) | 2.4 | % |
| (57.8 | ) | (50.9 | ) | 13.5 | % | General and Administrative Expenses | (154.2 | ) | (89.8 | ) | 71.6 | % |
In 3Q13, selling expenses increased 59.8% over the same period of the previous year to R$56.1 million, due to the better sales and new investments in marketing campaigns and promotions for Comma Oil & Chemicals.
General and administrative expenses totaled R$57.8 million, up 13.5% over 3Q12 with expansion in the lubricants operation and expenditures with Cosan’s corporate structure.
Other operating revenues from Other Businesses totaled R$173.4 million, basically composed of result of the sale of Cosan Alimentos announced on October 24, 2012.
EBITDA
| EBITDA | ||||||||||||
| 3Q13 | 3Q12 | Chg. | % | Amounts in R$ MM | YTD13 | YTD12 | Chg. | % | ||||
| 178.2 | 2.1 | n/a | EBITDA | 216.4 | 3,329.5 | -93.5 | % | |||||
| - | - | n/a | (-) Gross Effects of Raízen's formation | - | (3,297.0 | ) | n/a | |||||
| 178.2 | 2.1 | n/a | Adjusted EBITDA | 216.4 | 32.6 | 563.3 | % | |||||
| 47.2 | % | 0.8 | % | n/a | Adjusted EBITDA.Margin (%) | 20.3 | % | 4.1 | % | 16.2 | p.p |
Other Businesses posted EBITDA of R$178.2 million, positively impacted by the result of the sale of Cosan Alimentos. Year-to-date, EBITDA was R$216.4 million.
27 of 40
| | Earnings Release Third Quarter of the Fiscal Year 2013 – October, November, December of 2012 |
C. Other Items in the Consolidated Result
Financial Result
| Financial Results | ||||||||||||
| 3Q13 | 3Q12 | Chg. | % | Amounts in R$ MM | YTD13 | YTD12 | Chg. | % | ||||
| (158.2 | ) | (82.6 | ) | 91.5 | % | Gross Debt Charges | (334.6 | ) | (251.4 | ) | 33.1 | % |
| 30.2 | 28.0 | 8.0 | % | Income from Financial Investments | 89.0 | 100.5 | -11.4 | % | ||||
| (127.9 | ) | (54.6 | ) | 134.4 | % | (=) Subtotal: Net Debt Interests | (245.6 | ) | (150.9 | ) | 62.8 | % |
| (8.0 | ) | (12.0 | ) | -32.7 | % | Other Charges and Monetary Variation | 105.3 | (116.3 | ) | n/d | ||
| (16.3 | ) | 7.3 | n/d | Exchange Rate Variation | (296.7 | ) | (179.5 | ) | 65.3 | % | ||
| 43.9 | (7.0 | ) | n/d | Gains (losses) with Derivatives | 44.1 | 2.3 | 1843.0 | % | ||||
| (16.4 | ) | (3.3 | ) | 399.5 | % | Other | (44.4 | ) | (7.4 | ) | 495.7 | % |
| (124.7 | ) | (69.5 | ) | 79.6 | % | (=) Financial, Net | (437.2 | ) | (451.8 | ) | -3.2 | % |
In 3Q13, financial expenses were R$124.7 million, compared to R$69.5 million in 3Q12, mainly as a result of: (i) increased debt charges with the acquisition and consolidation of Comgás; (ii) negative foreign exchange variation in the quarter in the amount of R$16.3 million, compared to a positive variation of R$7.3 million in 3Q12; and (iii) gains with derivatives, basically due to the fair value of options held by Radar, which offset the previous factors.
Mainly Charges on gross debt totaled R$158.2 million in 3Q13, up 91.5% over 3Q12, due to the increased debt balance (including the PESA debt) that increased from R$5.1 billion in 3Q12 to R$11.6 billion in 3Q13 as a result of fundraising for the Comgás acquisition, as well as the consolidation of Comgás’ debt, which increased charges on the debt by R$70.9 million.
Income from financial investments closed the quarter with capital gains in the amount of R$30.2 million, up 8.0% over 3Q12 due to the increased average cash and cash equivalents balance, including cash held by Comgás partially offset by the reduced average domestic interest rate – CDI.
The negative result of foreign exchange variation, which increased quarter-on-quarter, was driven by the depreciation of the Real against the Dollar from R$2.0286/US$ on September 30, 2012 to R$2.0435/US$ on December 31, 2012 , together with the increased exposure to dollar-denominated debt (protected by hedge operations) deriving from the consolidation of Comgás, while in 3Q12, the real depreciated against the dollar by approximately 1% from R$1.8544/US$ on September 30, 2011 to R$1.8758/US$ on December 31, 2011.
The derivatives line includes gains and losses with derivatives, except for those instruments used for hedge accounting purposes or the ineffective portion of such instruments and posted gains in 3Q13.
28 of 40
| | Earnings Release Third Quarter of the Fiscal Year 2013 – October, November, December of 2012 |
Income Tax and Social Contribution
| Income tax and social contribution | ||||||||||||
| 3Q13 | 3Q12 | Chg. | % | Amounts in R$ MM | YTD13 | YTD12 | Chg. | % | ||||
| 616.5 | 170.5 | n/d | Income (loss) before income tax | 875.1 | 3,596.2 | -75.7 | % | |||||
| (168.5 | ) | (63.8 | ) | n/d | Total of Deferred and Current Income Tax and Social Contribution | (128.4 | ) | (867.5 | ) | n/d | ||
| -27.3 | % | -37.4 | % | 10.1 | p.p | Effective Rate (%) | -14.7 | % | -24.1 | % | 9.5 | p.p |
| (56.0 | ) | (69.7 | ) | n/d | Deferred Income Tax Expenses | 82.3 | (989.8 | ) | n/d | |||
| (112.5 | ) | 5.9 | -2000.4 | % | Current Income Tax Expenses | (210.7 | ) | 122.3 | -272.2 | % | ||
| -18.2 | % | 3.5 | % | -21.7 | p.p. | Effective Rate - Current (%) | -24.1 | % | 3.4 | % | -27.5 | p.p. |
In 3Q12, total expenses with Income Tax and Social Contribution (IT/SC) were R$168.5 million, for an effective rate of 27.3%, mainly due to adjustments to taxable income from permanent exclusions of the difference between the non-taxable income of foreign companies.
Net Income
In 3Q13, the Company had net income of R$342.3 million, compared to net income of R$93.8 million in 3Q12 for an increase of R$248.5 million.
Driving this growth was the R$ 498.1 million increase in operating revenue across all business lines, partially offset by the following:
(i) the R$104.7 million rise in IT/SC expenses as a result of increased operating income;
(ii) financial expenses in the amount of R$52.1 million;
(iii) R$92.8 million increase relative to the portion allocated to minority shareholders from Radar and Comgás.
29 of 40
| | Earnings Release Third Quarter of the Fiscal Year 2013 – October, November, December of 2012 |
D. Indebtedness
At the close of 3Q13, Cosan’s consolidated debt (excluding PESA) was R$11.2 billion, compared to R$5.3 billion in 2Q13. The segregated debts of Raízen, of which 50% is consolidated by Cosan, are presented below, together with the remaining debts of the Cosan Group.
Cosan and Subsidiaries
Gross debt in 3Q13 totaled R$8.0 billion, up significantly quarter-on-quarter due to a R$3.3 billion debenture issued for the Comgás acquisition, as well as the consolidation of this subsidiary’s gross debt of R$2.5 billion. In addition, Rumo raised R$90.8 million in the period through the BNDES to expand its investment plan and amortize principal and pay interest in the amount of R$26.6 million and Cosan Biomassa raised R$89.7 million for its plan to develop, produce and sell new industrial technologies related to sugarcane and other biomass.
Raízen
The combined gross debt of Raízen totaled R$6.2 billion at the close of 3Q13, practically stable over 2Q13.
In the quarter, the following changes in principle and interest on the debt were made:
| (i) | Amortization of R$457.9 million related to foreign exchange contract advances, prepayments, credit notes and working capital; |
| (ii) | R$294 million raised under rural credit and working capital facilities; |
| (iii) | Provision for inflation, interest and foreign exchange variations in the amount of R$115.9 million; |
30 of 40
| | Earnings Release Third Quarter of the Fiscal Year 2013 – October, November, December of 2012 |
Cosan – Consolidated
The cash balance totaled R$2.3 billion at the end of the quarter, as compared to R$2.5 billion in 2Q13. The net debt in 3Q13 was R$8.8 billion, compared to R$2.9 billion in 3Q12, equal to leverage of 2.4x pro-forma LTM EBITDA, which includes Comgás and Radar.
| Debt by Type | |||||||||
| Amounts in R$ MM | 3Q13 | 2Q13 | % ST | Chg. | % | ||||
| Senior Notes 2014 | 740.7 | 719.2 | 3 | % | 3.0 | % | |||
| Expenses with Debt Placement | (4.9 | ) | (5.7 | ) | 63 | % | -13.1 | % | |
| BNDES | 1,517.9 | 1,565.7 | 13 | % | -3.1 | % | |||
| Working Capital | 1,104.4 | 963.2 | 16 | % | 14.7 | % | |||
| Prepaid Exports | 1,022.4 | 1,013.8 | 21 | % | 0.8 | % | |||
| Senior Notes 2017 | 841.1 | 821.6 | 3 | % | 2.4 | % | |||
| Advances on Exchange Contracts | 155.0 | 388.1 | 100 | % | -60.0 | % | |||
| Credit Notes | 313.8 | 369.7 | 100 | % | -15.1 | % | |||
| Finame | 152.7 | 170.0 | 42 | % | -10.1 | % | |||
| Finem | 189.0 | 199.1 | 20 | % | -5.1 | % | |||
| Rural Credit | 41.1 | 31.6 | 100 | % | 30.0 | % | |||
| PROINFA | 23.2 | 24.5 | 18 | % | -5.4 | % | |||
| Others | 159.1 | 38.7 | 100 | % | 311.3 | % | |||
| Total Raízen | 6,236.1 | 6,284.1 | - | -0.8 | % | ||||
| Consolidation (50% Raízen) | 3,118.1 | 3,142.0 | - | -0.8 | % | ||||
| Comgás | |||||||||
| Credit Assignment | 59.7 | - | 100 | % | n/a | ||||
| Leasing - Bank IBM | 2.3 | - | 54 | % | n/a | ||||
| Working Capital | 115.0 | - | 100 | % | n/a | ||||
| Promissory Notes | 159.8 | - | 100 | % | n/a | ||||
| EIB | 567.3 | - | 4 | % | n/a | ||||
| 4131 Resolution | 455.3 | - | 66 | % | n/a | ||||
| BNDES | 1,092.3 | - | 24 | % | n/a | ||||
| Debentures | 69.0 | - | 52 | % | n/a | ||||
| Financial Instruments - MTM | (160.4 | ) | - | - | n/a | ||||
| Total Comgás | 2,360.5 | - | - | n/a | |||||
| Rumo | |||||||||
| Finame | 728.5 | 654.2 | 11 | % | 11.4 | % | |||
| Expenses with Placement of Debt | (1.3 | ) | 1.0 | 17 | % | 25 | % | ||
| Total Rumo | 727.2 | 653.2 | - | 11 | % | ||||
| Cosan Other Business | |||||||||
| Credit Notes | 363.1 | 356.4 | - | 2 | % | ||||
| Foreign Expenses | 178.5 | 179.0 | - | -0.3 | % | ||||
| Debentures | 3,344.0 | 1.3 | % | n/a | |||||
| FINEP | 89.8 | 0.1 | % | n/a | |||||
| Expenses with Placement of Debt | (65.0 | ) | (10.2 | ) | - | 537.9 | % | ||
| Perpetual Bonds | 1,041.4 | 1,035.4 | - | 0.6 | % | ||||
| Total | 4,951.8 | 1,560.6 | - | 217.3 | % | ||||
| Total Consolidated | 11,157.5 | 5,355.9 | - | 208 | % | ||||
| Cash and Cash equivalents | 2,324.6 | 2,461.9 | - | 94.4 | % | ||||
| Net Debt | 8,832.9 | 2,893.9 | - | 305.2 | % | ||||
| Note 6: Excluding PESA debt. | |||||||||
31 of 40
| | Earnings Release Third Quarter of the Fiscal Year 2013 – October, November, December of 2012 |
Cosan Consolidated Debt
32 of 40
| | Earnings Release Third Quarter of the Fiscal Year 2013 – October, November, December of 2012 |
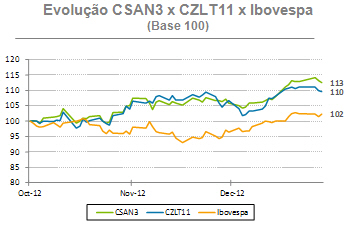
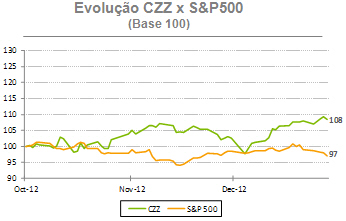
E. Stock Performance
The common shares issued by Cosan S.A. have been listed on BM&FBovespa since 2005, the year of its IPO on the “Novo Mercado” segment under the ticker symbol CSAN3, and are included in the portfolios of the Ibovespa, IBrX, IBrX-50, IBrA, MLCX, ICO2, INDX, ICON, IVBX-2, IGC, IGCT and ITAG indexes.
The shares issued by Cosan Limited, Cosan S.A.'s parent company, have been listed on NYSE since its IPO in 2007, under the ticker symbol CZZ. The company has also issued share deposit certificates (Brazilian Depositary Receipts - BDR) on the BM&FBovespa under the symbol CZLT11.
The tables and graphs below represent the performance of shares issued by the companies:
| 3Q13 Summary | CSAN3 | CZLT11 | CZZ | ||
| Stock Type | Common Share | BDR | Class A | ||
| Listed in | BM&FBovespa | BM&FBovespa | NYSE | ||
| Closing Price in december 12/31/2012 | R$ 41.75 | R$ 32.50 | USD 15.86 | ||
| Higher Price | R$ 42.37 | R$ 36.00 | USD 17.31 | ||
| Average Price | R$ 39.06 | R$ 33.93 | USD 16.34 | ||
| Lower Price | R$ 36.80 | R$ 31.70 | USD 15.42 | ||
| Average Daily Traded Volume | R$ 39.4mm | R$ 6.4mm | USD 17.6 mm | ||
 |  |
33 of 40
| | Earnings Release Third Quarter of the Fiscal Year 2013 – October, November, December of 2012 |
F. Guidance
This section includes the guidance by variation range of some key parameters in the consolidated results of Cosan for the fiscal year of 2013, which began on April 1, 2012 and will end on March 31, 2013. In addition, other parts of this Financial Letter may contain forecasts. Such forecasts and guidance are simply estimates and indications, and do not provide any guarantee of prospective results.
This guidance takes into account the operations currently held by the Cosan group, which include Raízen Energia, Raízen Combustíveis, Rumo, Radar and Other Businesses.
| FY11 | FY12 | FY13 | 1a Revision FY13 | 2a Revision FY13 | ||||
| Net Revenue (R$MM) | 18,063 | 24,097 | 26,000 | ≤ ∆ ≤ 29,000 | 26,000 | ≤ ∆ ≤ 29,000 | 26,000 | ≤ ∆ ≤ 29,000 |
EBITDA (R$MM)(1) | 2,671 | 2,142 | 2,200 | ≤ ∆ ≤ 2,500 | 2,200 | ≤ ∆ ≤ 2,500 | 2,300 | ≤ ∆ ≤ 2,600 |
| CAPEX (R$MM) | 2,500 | 2,137 | 2,100 | ≤ ∆ ≤ 2,400 | 2,100 | ≤ ∆ ≤ 2,400 | 2,100 | ≤ ∆ ≤ 2,400 |
| Volume of crushed sugarcane (‘000 tons) | 54,238 | 52,958 | 52,000 | ≤ ∆ ≤ 55,000 | 54,000 | ≤ ∆ ≤ 56,000 | 56,221 | |
| Volume of sugar sold (‘000 tons) | 4,291 | 3,969 | 3,900 | ≤ ∆ ≤ 4,200 | 3,900 | ≤ ∆ ≤ 4,200 | 3,900 | ≤ ∆ ≤ 4,200 |
| Volume of ethanol sold (millions of liters) | 2,247 | 1,921 | 1,850 | ≤ ∆ ≤ 2,050 | 1,850 | ≤ ∆ ≤ 2,050 | 1,850 | ≤ ∆ ≤ 2,050 |
| Volume of energy sold (‘000 MWh) | 1,254 | 1,233 | 1,650 | ≤ ∆ ≤ 1,850 | 1,650 | ≤ ∆ ≤ 1,850 | 1,650 | ≤ ∆ ≤ 1,850 |
| EBITDA (R$MM) | 2,130 | 2,235 | 2,200 | ≤ ∆ ≤ 2,500 | 2,200 | ≤ ∆ ≤ 2,500 | 2,400 | ≤ ∆ ≤ 2,700 |
| Volume of fuel sold (millions of liters) | - | 20,914 | 21,000 | ≤ ∆ ≤ 23,000 | 21,000 | ≤ ∆ ≤ 23,000 | 21,000 | ≤ ∆ ≤ 23,000 |
| EBITDA (R$MM) | - | 1,305 | 1,300 | ≤ ∆ ≤ 1,500 | 1,300 | ≤ ∆ ≤ 1,500 | 1,500 | ≤ ∆ ≤ 1,700 |
| Volume of loading (‘000 tons) | 7,841 | 7,759 | 8,000 | ≤ ∆ ≤ 10,000 | 8,000 | ≤ ∆ ≤ 10,000 | 8,000 | ≤ ∆ ≤ 10,000 |
| EBITDA (R$MM) | 197 | 211 | 260 | ≤ ∆ ≤ 300 | 250 | ≤ ∆ ≤ 280 | 250 | ≤ ∆ ≤ 280 |
| EBITDA (R$MM) | - | - | - | 120 | ≤ ∆ ≤ 140 | 120 | ≤ ∆ ≤ 140 | |
| Volume of Lubricants and Base Oil (million of liters) | 166 | 205 | 220 | ≤ ∆ ≤ 260 | 220 | ≤ ∆ ≤ 260 | 220 | ≤ ∆ ≤ 260 |
Disclaimer
This document contains forward-looking statements and estimates. These forward-looking statements and estimates are solely forecasts and do not represent any guarantee of prospective results. All stakeholders should know that these statements and estimates are and will be, depending on the case, subject to risks, uncertainties and factors related to the operations and business environment of Cosan and its subsidiaries, and therefore the actual results of these companies may significantly differ from the estimated or implied prospective results contained in forward-looking statements and estimates.
34 of 40
| | Earnings Release Third Quarter of the Fiscal Year 2013 – October, November, December of 2012 |
G. Cosan S.A.
Statement of Income
| Income Statement | Mar' 11 | Jun' 11 | Set' 11 | Dec' 11 | Mar' 12 | Mar' 12 | Jun' 12 | Sep' 12 | Dec' 12 | ||||||||||||||||||
| (in R$ million) | FY11 | 1Q12 | 2Q12 | 3Q12 | 4Q12 | FY12 | 1Q13 | 2Q13 | 3Q13 | ||||||||||||||||||
| (=) | Net Operating Revenue | 18,063.5 | 5,188.0 | 6,804.3 | 6,310.7 | 5,793.9 | 24,096.9 | 6,125.6 | 7,032.3 | 8,397.1 | |||||||||||||||||
(-) Cost of Goods Sold and Services Rendered | (15,150.1 | ) | (4,600.0 | ) | (6,042.4 | ) | (5,670.9 | ) | (5,151.8 | ) | (21,465.0 | ) | (5,651.2 | ) | (6,260.4 | ) | (7,339.9 | ) | |||||||||
| (=) | Gross Profit | 2,913.4 | 588.0 | 761.9 | 639.8 | 642.1 | 2,631.9 | 474.4 | 771.8 | 1,057.2 | |||||||||||||||||
| (-) Operating Income (Expenses): | (1,600.8 | ) | 2,925.9 | (468.3 | ) | (399.8 | ) | (493.7 | ) | 1,564.0 | (307.0 | ) | (430.0 | ) | (319.1 | ) | |||||||||||
(-) Selling | (1,026.0 | ) | (261.2 | ) | (295.3 | ) | (282.0 | ) | (297.9 | ) | (1,136.3 | ) | (212.4 | ) | (254.8 | ) | (395.4 | ) | |||||||||
(-) General and Administrative | (541.0 | ) | (150.0 | ) | (158.2 | ) | (147.5 | ) | (186.2 | ) | (641.9 | ) | (157.7 | ) | (175.7 | ) | (241.5 | ) | |||||||||
| (±) | Other Operating Income (Expenses), Net | (33.8 | ) | 22.0 | 3.2 | 29.6 | 90.7 | 145.6 | 63.1 | 0.5 | 317.7 | ||||||||||||||||
| (±) | Effects of formation of JVs | - | 3,315.1 | (18.2 | ) | - | (100.3 | ) | 3,196.6 | - | - | - | |||||||||||||||
| (=) | Operating Income | 1,312.6 | 3,513.9 | 293.6 | 240.0 | 148.4 | 4,195.9 | 167.5 | 341.8 | 738.1 | |||||||||||||||||
| (±) | Non-Operating Income (Expenses): | (121.5 | ) | 13.2 | (394.9 | ) | (69.4 | ) | 10.3 | (440.9 | ) | (306.5 | ) | 55.8 | (121.5 | ) | |||||||||||
| (±) | Financial results, net | (146.7 | ) | 11.2 | (393.6 | ) | (69.5 | ) | (22.3 | ) | (474.1 | ) | (314.1 | ) | 1.6 | (124.7 | ) | ||||||||||
| (±) | Equity income of associates | 25.19 | 1.96 | (1.30 | ) | 0.01 | 32.60 | 33.27 | 7.63 | 54.2 | 3.2 | ||||||||||||||||
| (=) | Income (Loss) Before taxes | 1,191.1 | 3,527.1 | (101.3 | ) | 170.5 | 158.7 | 3,755.0 | (139.0 | ) | 397.6 | 616.5 | |||||||||||||||
| (±) | Income and Social Contribution Taxes | (414.5 | ) | (1,224.6 | ) | 188.2 | (63.8 | ) | (10.0 | ) | (1,110.2 | ) | 131.4 | (91.3 | ) | (168.5 | ) | ||||||||||
| (±) | Non-controlling interest | (5.00 | ) | (3.11 | ) | (23.67 | ) | (12.97 | ) | 0.80 | (38.96 | ) | (8.50 | ) | (28.8 | ) | (105.8 | ) | |||||||||
| (=) | Net Income for the period from continued operations | 771.6 | 2,299.3 | 63.2 | 93.8 | 149.6 | 2,605.8 | (16.1 | ) | 277.5 | 342.3 | ||||||||||||||||
| Net Income from discontinued operations | (0.9 | ) | 5.8 | - | |||||||||||||||||||||||
| Net income for the period | 771.6 | 2,299.3 | 63.2 | 93.8 | 149.6 | 2,605.8 | (17.0 | ) | 283.2 | 342.3 | |||||||||||||||||
35 of 40
| | Earnings Release Third Quarter of the Fiscal Year 2013 – October, November, December of 2012 |
Cosan S.A.
Balance Sheet
| Balance Sheet | Mar' 11 | Jun' 11 | Set' 11 | Dec' 11 | Mar' 12 | Jun' 12 | Sep' 12 | Dec' 12 | ||||||||||||||||
| (in R$ million) | FY11 | 1Q12 | 2Q12 | 3Q12 | FY12 | 1Q13 | 2Q13 | 3Q13 | ||||||||||||||||
| Cash and Cash Equivalents | 1,254.1 | 1,278.2 | 1,471.7 | 1,194.9 | 1,616.2 | 1,407.2 | 1,892.2 | 2,324.6 | ||||||||||||||||
| Restricted Cash | 187.9 | 60.2 | 52.5 | 88.1 | 94.3 | 131.8 | 87.4 | 90.9 | ||||||||||||||||
| Accounts receivable | 594.9 | 825.2 | 983.7 | 1,022.3 | 963.6 | 960.5 | 1,098.8 | 1,857.3 | ||||||||||||||||
| Derivatives | 55.7 | 60.2 | 29.4 | 59.6 | 19.6 | 114.9 | 75.8 | 115.1 | ||||||||||||||||
| Inventories | 670.3 | 1,002.0 | 1,361.8 | 1,354.4 | 748.2 | 893.5 | 1,477.6 | 1,706.6 | ||||||||||||||||
| Advances to Suppliers | 229.3 | 172.2 | 141.9 | 110.2 | 159.0 | 174.1 | 126.8 | 217.4 | ||||||||||||||||
| Related Parties | 14.7 | 680.3 | 599.7 | 655.8 | 678.4 | 758.5 | 211.1 | 183.6 | ||||||||||||||||
| Recoverable Taxes | 375.0 | 411.7 | 416.0 | 325.0 | 325.1 | 342.2 | 384.3 | 473.7 | ||||||||||||||||
| Assets Held for Sale | 410.7 | 412.0 | - | |||||||||||||||||||||
| Other financial assets | - | - | - | - | 40.1 | 40.1 | 20.9 | - | ||||||||||||||||
| Other credits | 80.4 | 98.9 | 108.1 | 115.9 | 70.8 | 78.7 | 116.6 | 96.5 | ||||||||||||||||
| Current Assets | 3,462.3 | 4,588.9 | 5,164.9 | 4,926.3 | 4,715.1 | 5,312.3 | 5,903.5 | 7,065.6 | ||||||||||||||||
| Deferred Income tax and social contribution | 715.3 | 1,026.4 | 959.7 | 1,108.2 | 543.0 | 528.1 | 431.9 | 405.8 | ||||||||||||||||
| Advances to Suppliers | 46.0 | 27.5 | 39.6 | 49.7 | 21.9 | 28.8 | 35.3 | 41.4 | ||||||||||||||||
| Related Parties | 92.0 | 1,215.4 | 1,176.6 | 1,195.8 | 754.4 | 733.4 | 722.5 | 720.6 | ||||||||||||||||
| Recoverable Taxes | 55.1 | 124.5 | 123.6 | 122.2 | 111.9 | 97.3 | 110.8 | 127.8 | ||||||||||||||||
| Judicial Deposits | 218.4 | 372.5 | 491.1 | 495.6 | 509.2 | 514.6 | 528.2 | 542.1 | ||||||||||||||||
| Other financial assets | 420.4 | 290.3 | 418.6 | 415.5 | 790.4 | 796.8 | 843.1 | 665.3 | ||||||||||||||||
| Other non-current assets | 443.8 | 1,103.6 | 966.5 | 966.2 | 493.2 | 486.5 | 453.4 | 757.1 | ||||||||||||||||
| Investments | 304.1 | 333.9 | 358.1 | 368.6 | 419.0 | 611.9 | 147.9 | 190.1 | ||||||||||||||||
| Investment Property | - | - | - | - | - | - | 2,346.0 | 2,420.7 | ||||||||||||||||
| Biological Assets | 1,561.1 | 795.1 | 717.0 | 767.9 | 968.0 | 1,061.6 | 972.5 | 950.6 | ||||||||||||||||
| Property, Plant and Equipment | 7,980.5 | 8,260.0 | 7,928.8 | 7,835.2 | 7,867.0 | 7,678.3 | 7,000.5 | 7,016.5 | ||||||||||||||||
| Intangible | 3,445.7 | 4,125.3 | 4,531.1 | 4,593.8 | 4,932.3 | 4,878.7 | 5,063.8 | 13,955.1 | ||||||||||||||||
| Non-current Assets | 15,282.4 | 17,674.4 | 17,710.7 | 17,918.7 | 17,410.2 | 17,416.2 | 18,655.9 | 27,793.1 | ||||||||||||||||
| Total Assets | 18,744.7 | 22,263.4 | 22,875.6 | 22,845.0 | 22,125.3 | 22,728.5 | 24,559.4 | 34,858.8 | ||||||||||||||||
| Current portion of long-term debt | 916.4 | 627.1 | 758.7 | 725.7 | 537.1 | 1,206.8 | 1,244.4 | 1,789.6 | ||||||||||||||||
| Derivatives | 132.3 | 94.3 | 29.3 | 15.7 | 9.6 | 40.8 | 12.3 | 14.5 | ||||||||||||||||
| Trade Accounts Payable | 558.8 | 621.6 | 757.5 | 765.4 | 606.0 | 633.3 | 788.0 | 1,449.5 | ||||||||||||||||
| Salaries Payable | 183.6 | 183.3 | 191.5 | 158.2 | 183.7 | 232.5 | 221.2 | 257.1 | ||||||||||||||||
| Taxes payable | 245.3 | 247.1 | 328.9 | 282.4 | 241.7 | 176.0 | 208.9 | 423.2 | ||||||||||||||||
| Dividends payable | 190.3 | 195.7 | 21.2 | 15.9 | 16.8 | 266.8 | 95.6 | 43.1 | ||||||||||||||||
| Related Parties | 41.2 | 186.8 | 163.2 | 228.5 | 175.0 | 169.3 | 189.7 | 140.0 | ||||||||||||||||
| Liabilities held for sale | 112.5 | 118.0 | - | |||||||||||||||||||||
| Other Liabilities | 189.6 | 273.1 | 306.4 | 215.0 | 308.0 | 283.6 | 336.3 | 337.1 | ||||||||||||||||
| Current Liabilities | 2,457.4 | 2,428.9 | 2,556.7 | 2,406.9 | 2,077.9 | 3,121.6 | 3,214.5 | 4,454.1 | ||||||||||||||||
| Long-term debt | 6,274.9 | 3,699.4 | 4,407.8 | 4,402.3 | 4,476.9 | 4,480.2 | 4,455.6 | 9,871.9 | ||||||||||||||||
| Taxes payable | 639.1 | 1,123.0 | 1,180.0 | 1,184.8 | 1,202.6 | 1,183.8 | 1,201.3 | 974.1 | ||||||||||||||||
| Provision for judicial demands | 666.3 | 940.8 | 975.8 | 1,026.7 | 1,051.7 | 1,089.8 | 1,089.5 | 1,133.9 | ||||||||||||||||
| Related Parties | 4.4 | 371.2 | 546.3 | 468.5 | 390.9 | 375.4 | 371.9 | 372.4 | ||||||||||||||||
| Pension | 24.4 | 25.9 | 27.4 | 28.9 | 37.3 | 37.7 | 37.2 | 324.3 | ||||||||||||||||
| Deferred Income taxes | 1,511.0 | 3,546.4 | 3,159.1 | 3,116.5 | 2,443.4 | 2,299.3 | 2,149.8 | 3,516.2 | ||||||||||||||||
| Other non-current liabilities | 382.9 | 814.4 | 752.1 | 777.1 | 828.1 | 769.2 | 732.3 | 748.9 | ||||||||||||||||
| Non-current Assets | 9,502.9 | 10,521.0 | 11,048.4 | 11,004.8 | 10,431.0 | 10,235.5 | 10,037.5 | 16,941.7 | ||||||||||||||||
| Common stock | 4,691.8 | 4,691.8 | 4,691.8 | 4,691.8 | 4,691.8 | 4,691.8 | 4,691.8 | 4,691.8 | ||||||||||||||||
| Treasury shares | (19.4 | ) | (19.4 | ) | (66.3 | ) | (67.7 | ) | (67.7 | ) | (67.7 | ) | (67.7 | ) | (53.0 | ) | ||||||||
| Capital Reserve | 537.5 | 637.8 | 609.9 | 661.3 | 690.5 | 737.2 | 930.3 | 897.2 | ||||||||||||||||
| Profits Reserve | 1,249.0 | 1,249.0 | 1,232.2 | 1,232.2 | 3,837.1 | 3,588.1 | 3,588.1 | 3,587.1 | ||||||||||||||||
| Accumulated earnings | - | 2,299.3 | 2,362.5 | 2,456.3 | - | (17.1 | ) | 266.2 | 608.5 | |||||||||||||||
| Equity attributable to owners of the Company | 6,458.9 | 8,858.6 | 8,830.2 | 8,973.9 | 9,151.8 | 8,932.3 | 9,408.7 | 9,731.6 | ||||||||||||||||
| Equity attributable to non-controlling interests | 325.5 | 454.9 | 440.3 | 459.4 | 464.6 | 439.0 | 1,898.7 | 3,731.4 | ||||||||||||||||
| Total equity | 6,784.3 | 9,313.4 | 9,270.5 | 9,433.4 | 9,616.4 | 9,371.4 | 11,307.4 | 13,462.9 | ||||||||||||||||
| Total liabilities and equity | 18,744.7 | 22,263.4 | 22,875.6 | 22,845.0 | 22,125.3 | 22,728.5 | 24,559.4 | 34,858.8 |
36 of 40
| | Earnings Release Third Quarter of the Fiscal Year 2013 – October, November, December of 2012 |
Cosan S.A.
Statement of Cash Flow
| Statement of Cash Flows | Mar' 11 | Jun' 11 | Set' 11 | Dec' 11 | Mar' 12 | Mar' 12 | Jun' 12 | Sep' 12 | Dec' 12 | Dec' 12 | ||||||||||||||||||||
| (in R$ million) | FY11 | 1Q12 | 2Q12 | 3Q12 | 4Q12 | FY12 | 1Q13 | 2Q13 | 3Q13 | YTD13 | ||||||||||||||||||||
| Net Income | 771.6 | 2,299.3 | 63.2 | 93.8 | 149.6 | 2,605.8 | (139.0 | ) | 397.6 | 616.5 | 875.1 | |||||||||||||||||||
| Non-cash Adjustments: | - | - | - | - | - | - | - | - | - | - | ||||||||||||||||||||
| Depreciation and Amortization | 1,359.0 | 303.7 | 365.5 | 254.6 | 219.0 | 1,142.8 | 259.2 | 377.5 | 455.9 | 1,092.6 | ||||||||||||||||||||
| Biological Assets | (381.9 | ) | (20.9 | ) | 38.8 | 20.0 | (97.9 | ) | (60.1 | ) | (17.5 | ) | 38.4 | 21.9 | 42.8 | |||||||||||||||
| Stock option | - | - | - | 4.8 | 6.0 | 10.8 | 3.3 | 3.3 | 3.3 | 10.0 | ||||||||||||||||||||
| Equity income of associates | (25.19 | ) | (1.96 | ) | 1.31 | (0.01 | ) | (32.60 | ) | (33.27 | ) | (7.63 | ) | (54.15 | ) | (3.19 | ) | (65.0 | ) | |||||||||||
| Losses (Gains) in Fixed Assets Disposals | (35.3 | ) | 17.0 | (11.5 | ) | (27.6 | ) | (71.8 | ) | (93.9 | ) | (58.6 | ) | 16.9 | (233.8 | ) | (275.4 | ) | ||||||||||||
| Deferred Income and Social Contribution Taxes | 329.1 | 1,197.8 | (277.7 | 69.7 | (27.0 | 962.8 | - | - | - | - | ||||||||||||||||||||
| Fair value of investment properties | - | - | - | - | - | - | - | - | (85.9 | ) | (85.9 | ) | ||||||||||||||||||
| Judicial demands' provision | - | - | - | - | - | - | - | 34.5 | (1.2 | ) | 33.3 | |||||||||||||||||||
| Non-controlling interest | 5.00 | 3.11 | 23.67 | 12.97 | (0.80 | ) | 38.96 | - | - | - | - | |||||||||||||||||||
| Interest, monetary and exchange variations, net | 238.5 | (33.7 | ) | 562.3 | 126.6 | (20.0 | ) | 635.1 | 394.5 | (71.0 | ) | 156.4 | 479.9 | |||||||||||||||||
| Effects of formation of JVs | - | (3,315.1 | ) | 18.2 | - | 198.5 | (3,098.5 | ) | - | - | - | - | ||||||||||||||||||
| Other Non-cash Items | 7.5 | 5.2 | (5.2 | ) | - | (5.7 | ) | (5.7 | ) | 0.6 | 12.8 | 36.6 | 50.0 | |||||||||||||||||
| - | - | - | ||||||||||||||||||||||||||||
| Variation on Assets and Liabilities | - | - | - | |||||||||||||||||||||||||||
| Accounts receivable | 164.7 | (123.3 | ) | (105.6 | ) | (38.6 | ) | (93.8 | ) | (361.1 | ) | (68.7 | ) | (13.9 | ) | (133.3 | ) | (215.8 | ) | |||||||||||
| Restricted Cash | (143.0 | ) | 113.5 | 7.7 | (35.5 | ) | (6.2 | ) | 79.5 | (37.5 | ) | 44.7 | (2.3 | ) | 4.9 | |||||||||||||||
| Inventories | 84.58 | (326.63 | (311.82 | ) | (34.70 | ) | 486.37 | (186.78 | ) | (102.56 | ) | (433.20 | ) | (126.57 | ) | (662.3 | ) | |||||||||||||
| Related Parties | (50.1 | ) | (1,033.6 | ) | 142.6 | (87.8 | ) | 227.2 | (751.7 | ) | (83.7 | ) | 6.0 | (0.6 | ) | (78.3 | ) | |||||||||||||
| Advances to Suppliers | 16.8 | (122.1 | ) | 18.2 | 21.5 | (20.9 | ) | (103.3 | ) | (22.0 | ) | 43.3 | 26.5 | 47.8 | ||||||||||||||||
| Accounts payable | (32.36 | ) | 241.24 | 124.96 | 7.99 | (153.98 | ) | 220.21 | 46.73 | 118.72 | (72.14 | ) | 93.3 | |||||||||||||||||
| Salaries payable | 36.2 | 110.9 | 5.1 | (33.3 | ) | 25.5 | 108.2 | 56.1 | (37.2 | ) | (24.0 | ) | (5.0 | ) | ||||||||||||||||
| Provision for judicial demands from legal proceedings | 26.9 | 33.1 | (33.1 | ) | 50.9 | 93.1 | 144.0 | ) | 38.1 | (47.0 | ) | 0.8 | (8.1 | ) | ||||||||||||||||
| Derivatives | 13.3 | (79.8 | ) | (79.8 | ) | (4.4 | ) | 34.0 | (112.3 | ) | 6.0 | 19.7 | 1.5 | 27.2 | ||||||||||||||||
| Taxes payable | - | 908.8 | 15.5 | (59.0 | ) | 21.0 | 886.3 | (87.6 | ) | (58.1 | ) | (105.3 | ) | (251.0 | ) | |||||||||||||||
| Recoverable taxes | - | - | - | - | (17.1 | ) | (17.1 | ) | (14.8 | ) | (35.3 | ) | (8.2 | ) | (58.2 | ) | ||||||||||||||
| Other assets and liabilities, net | (48.3 | ) | 429.6 | (6.8 | ) | (55.0 | ) | (416.9 | ) | (49.1 | ) | (120.4 | ) | 61.0 | 118.5 | 59.1 | ||||||||||||||
| - | - | - | ||||||||||||||||||||||||||||
| Cash Flow from Operating Activities | 2,337.1 | 606.1 | 573.3 | 286.9 | 495.2 | 1,961.5 | 44.7 | 424.7 | 641.4 | 1,110.8 | ||||||||||||||||||||
| - | - | - | ||||||||||||||||||||||||||||
| - | - | - | ||||||||||||||||||||||||||||
| Aquisitions, net of aquired cash and advances for future capital increases | (157.3 | ) | - | - | - | (72.9 | ) | (72.9 | ) | (200.3 | ) | (8.9 | ) | (3,094.4 | ) | (3,303.6 | ) | |||||||||||||
| Contributed cash to Raízen's formation | - | (173.1 | ) | - | - | - | (173.1 | ) | - | - | - | - | ||||||||||||||||||
| Dividends | - | - | - | - | - | - | - | 182.9 | 8.5 | 191.4 | ||||||||||||||||||||
| Additions on Investments, Net of Cash Received | - | - | (99.1 | ) | (0.9 | ) | 57.6 | (42.3 | ) | - | - | - | - | |||||||||||||||||
| Additions on Property, Plant and Equipment | (2,291.6 | ) | (491.5 | ) | (243.3 | ) | (346.3 | ) | (503.4 | ) | (1,584.5 | ) | (281.2 | ) | (274.1 | ) | (424.0 | ) | (979.3 | ) | ||||||||||
| Biological Assets expenses | (745.6 | ) | (217.2 | ) | (117.9 | ) | (107.0 | ) | (109.9 | ) | (552.0 | ) | (160.5 | ) | (76.9 | ) | (131.5 | ) | (369.0 | ) | ||||||||||
| Proceeds from sale of property. plant and equipment | 48.8 | - | 42.3 | 53.8 | 86.0 | 182.1 | 147.6 | 85.7 | 343.7 | 577.0 | ||||||||||||||||||||
| Cash reclassified from discontinued operatios | (29.8 | ) | - | - | (29.8 | ) | ||||||||||||||||||||||||
| Cash received from business combination | - | - | - | - | - | - | 0.1 | 111.7 | 0.5 | 112.2 | ||||||||||||||||||||
| Net Cash Flow from Investment Activities | (3,145.7 | ) | (881.8 | ) | (418.0 | ) | (400.3 | ) | (542.7 | ) | (2,242.8 | ) | (524.2 | ) | 20.3 | (3,297.2 | ) | (3,801.1 | ) | |||||||||||
| - | - | - | ||||||||||||||||||||||||||||
| - | - | - | ||||||||||||||||||||||||||||
| Additions of Debt | 2,719.5 | 1,281.1 | 483.8 | 156.2 | 245.7 | 2,166.7 | 568.7 | 121.7 | 3,515.5 | 4,205.8 | ||||||||||||||||||||
| Payments of Principal and Interest on Debt | (1,967.9 | ) | (1,121.3 | ) | (206.0 | ) | (318.2 | ) | (197.9 | ) | (1,843.4 | ) | (298.1 | ) | (264.7 | ) | (342.1 | ) | (905.0 | ) | ||||||||||
| Capital Increase | 4.0 | - | - | - | - | - | - | - | - | - | ||||||||||||||||||||
| Capital Increase by noncontrolling interests | 400.0 | 139.9 | - | - | 421.0 | 560.9 | - | 595.9 | 52.4 | 648.3 | ||||||||||||||||||||
| Treasury Shares | (15.2 | - | (46.9 | (1.4 | - | (48.3 | - | - | - | - | ||||||||||||||||||||
| Exercise of stock option plan | - | - | - | - | - | - | - | - | 14.7 | 14.7 | ||||||||||||||||||||
| Dividends | (193.1 | ) | - | (192.7 | ) | - | - | (192.7 | ) | - | (412.9 | ) | (152.3 | ) | (565.2 | ) | ||||||||||||||
| Related Parties | 37.1 | - | - | - | - | - | - | - | - | - | ||||||||||||||||||||
| Cash Flows from Financing Activities | 984.3 | 299.8 | 38.2 | (163.4 | ) | 468.8 | 643.4 | 270.6 | 40.0 | 3,088.1 | 3,398.7 | |||||||||||||||||||
| - | - | - | ||||||||||||||||||||||||||||
| Total Cash Flow | 175.7 | 24.1 | 193.5 | (276.8 | ) | 421.3 | 362.1 | (209.0 | ) | 485.0 | 432.4 | 708.4 | ||||||||||||||||||
| - | - | - | ||||||||||||||||||||||||||||
| Cash & Equivalents, Beginning | 1,078.4 | 1,254.1 | 1,278.2 | 1,471.7 | (2,749.8 | ) | 1,254.1 | 1,616.2 | 1,407.2 | 1,892.2 | 1,616.2 | |||||||||||||||||||
| Cash & Equivalents, Closing | 1,254.1 | 1,278.2 | 1,471.7 | 1,194.9 | (2,328.6 | ) | 1,616.2 | 1,407.2 | 1,892.2 | 2,324.6 | 2,324.6 |
37 of 40
| | Earnings Release Third Quarter of the Fiscal Year 2013 – October, November, December of 2012 |
H. Cosan Limited
Statement of Income
| Income Statement | Mar' 10 | Jun' 11 | Set' 11 | Dec' 11 | Mar' 12 | Mar' 12 | Jun' 12 | Sep' 12 | Dec' 12 | |||||||||||||||||||
| (in R$ million) | FY11 | 1Q12 | 2Q12 | 3Q12 | 4Q12 | FY12 | 1Q13 | 2Q13 | 3Q13 | |||||||||||||||||||
| (=) | Net Operating Revenue | 18,063.5 | 5,188.0 | 6,804.3 | 6,310.7 | 5,793.9 | 24,096.9 | 6,125.6 | 7,032.3 | 8,397.1 | ||||||||||||||||||
| (-) | Cost of Goods Sold and Services Rendered | (15,150.1 | ) | (4,600.0 | ) | (6,042.4 | ) | (5,670.9 | ) | (5,151.8 | ) | (21,465.0 | ) | (5,651.2 | ) | (6,260.4 | ) | (7,339.9 | ) | |||||||||
| (=) | Gross Profit | 2,913.4 | 588.0 | 761.9 | 639.8 | 642.1 | 2,631.9 | 474.4 | 771.8 | 1,057.2 | ||||||||||||||||||
| Gross Margin | 16.1 | % | 11.3 | % | 11.2 | % | 10.1 | % | -21.7 | % | 10.9 | % | 7.7 | % | 0.1 | 0.1 | ||||||||||||
| (-) | Operating Income (Expenses): | (1,605.3 | ) | 2,481.6 | (469.7 | ) | (401.1 | ) | (494.9 | ) | 1,116.0 | (308.0 | ) | (431.5 | ) | (334.1 | ) | |||||||||||
| (-) | Selling | (1,026.0 | ) | (261.2 | ) | (295.3 | ) | (270.4 | ) | (309.5 | ) | (1,136.3 | ) | (212.4 | ) | (254.8 | ) | (395.4 | ) | |||||||||
| (-) | General and Administrative | (545.5 | ) | (150.5 | ) | (159.5 | ) | (160.3 | ) | (175.8 | ) | (646.0 | ) | (158.7 | ) | (177.2 | ) | (256.5 | ) | |||||||||
| (±) | Other Operating Income (Expenses), Net | (33.8 | ) | 22.0 | 3.2 | 29.6 | 90.7 | 145.6 | 63.1 | 0.5 | 317.7 | |||||||||||||||||
| (±) | Gain on tax recovery program | - | - | - | - | - | - | - | - | - | ||||||||||||||||||
| (±) | Effects of formation of JVs | - | 2,871.2 | (18.2 | ) | - | (100.3 | ) | 2,752.7 | - | - | - | ||||||||||||||||
| (=) | Operating Income | 1,308.1 | 3,069.5 | 292.2 | 238.8 | 147.3 | 3,747.8 | 166.4 | 340.3 | 723.1 | ||||||||||||||||||
| (±) | Non-Operating Income (Expenses): | (126.0 | ) | 13.5 | (395.8 | ) | (70.6 | ) | 7.7 | (445.3 | ) | (321.0 | ) | 53.0 | (124.0 | ) | ||||||||||||
| (±) | Financial results, net | (151.1 | ) | 11.6 | (394.5 | ) | (70.6 | ) | (24.9 | ) | (478.5 | ) | (318.8 | ) | (1.2 | ) | (127.2 | ) | ||||||||||
| (±) | Equity income of associates | 25.19 | 1.96 | (1.30 | ) | 0.01 | 32.60 | 33.27 | (2.19 | ) | 54.1 | 3.2 | ||||||||||||||||
| (=) | Income (Loss) Before taxes | 1,182.2 | 3,083.1 | (103.6 | ) | 168.1 | 155.0 | 3,302.5 | (154.6 | ) | 393.3 | 599.1 | ||||||||||||||||
| Margin | 6.5 | % | 59.4 | % | -1.5 | % | 2.7 | % | -46.9 | % | 13.7 | % | -2.5 | % | 0.1 | 0.1 | ||||||||||||
| (±) | Income and Social Contribution Taxes | (414.5 | ) | (1,224.6 | ) | 188.2 | (63.8 | ) | (10.0 | ) | (1,110.2 | ) | 131.4 | (91.3 | ) | (168.5 | ) | |||||||||||
| (±) | Non-controlling interest | (296.75 | ) | (872.96 | ) | (47.42 | ) | (48.16 | ) | (42.45 | ) | (1,010.99 | ) | (7.08 | ) | (136.3 | ) | (235.7 | ) | |||||||||
| (=) | Net Income | 470.9 | 985.5 | 37.2 | 56.2 | 102.5 | 1,181.3 | (30.3 | ) | 165.8 | 195.0 | |||||||||||||||||
| Net Income from discontinued operations | (0.93 | ) | 5.8 | - | ||||||||||||||||||||||||
| Net income for the period | (31.24 | ) | 171.5 | 195.0 | ||||||||||||||||||||||||
38 of 40
| | Earnings Release Third Quarter of the Fiscal Year 2013 – October, November, December of 2012 |
Cosan Limited
Balance Sheet
| Balance Sheet | Mar' 11 | Jun' 11 | Set' 11 | Dec' 11 | Mar' 12 | Jun' 12 | Sep' 12 | Dec' 12 | ||||||||||||||
| (in R$ million) | FY11 | 1Q12 | 2Q12 | 3Q12 | FY12 | 1Q13 | 2Q13 | 3Q13 | ||||||||||||||
| Cash and Cash Equivalents | 1,271.8 | 1,295.3 | 1,482.9 | 1,283.4 | 1,654.1 | 1,428.7 | 1,898.8 | 2,331.2 | ||||||||||||||
| Restricted Cash | 187.9 | 60.2 | 52.5 | 88.1 | 94.3 | 131.8 | 87.4 | 90.9 | ||||||||||||||
| Accounts receivable | 594.9 | 825.2 | 983.7 | 1,022.3 | 963.6 | 960.5 | 1,098.8 | 1,857.3 | ||||||||||||||
| Derivatives | 55.7 | 60.2 | 29.4 | 59.6 | 19.6 | 114.9 | 75.8 | 115.1 | ||||||||||||||
| Inventories | 670.3 | 1,002.0 | 1,361.8 | 1,354.4 | 748.2 | 893.5 | 1,477.6 | 1,706.6 | ||||||||||||||
| Advances to Suppliers | 229.3 | 172.2 | 141.9 | 110.2 | - | 174.1 | 126.8 | 217.4 | ||||||||||||||
| Related Parties | 14.7 | 680.3 | 599.7 | 655.8 | 678.4 | 758.5 | 210.6 | 183.1 | ||||||||||||||
| Recoverable Taxes | 375.0 | 411.7 | 416.0 | 325.0 | 325.1 | 342.2 | 384.3 | 473.7 | ||||||||||||||
| Assets Held For Sale | - | 410.7 | 412.0 | - | ||||||||||||||||||
| Other financial assets | - | - | - | - | 40.1 | 52.6 | 20.9 | - | ||||||||||||||
| Other credits | 81.0 | 99.0 | 108.1 | 115.9 | 230.3 | 66.5 | 116.6 | 96.5 | ||||||||||||||
| Current Assets | 3,480.6 | 4,606.2 | 5,176.1 | 5,014.7 | 4,753.6 | 5,334.0 | 5,909.6 | 7,071.8 | ||||||||||||||
| Deferred Income tax and social contribution | 715.3 | 1,026.4 | 959.7 | 1,108.2 | 543.0 | 528.1 | 431.9 | 405.8 | ||||||||||||||
| Advances to Suppliers | 46.0 | 27.5 | 39.6 | 49.7 | 21.9 | 28.8 | 35.3 | 41.4 | ||||||||||||||
| Related Parties | 92.0 | 1,215.4 | 1,176.6 | 1,195.8 | 753.2 | 733.4 | 722.5 | 720.6 | ||||||||||||||
| Recoverable Taxes | 55.1 | 124.5 | 123.6 | 122.2 | 111.9 | 97.3 | 110.8 | 127.8 | ||||||||||||||
| Judicial Deposits | 218.4 | 372.5 | 491.1 | 495.6 | 509.2 | 514.6 | 528.2 | 542.1 | ||||||||||||||
| Other financial assets | 420.4 | 290.3 | 418.6 | 415.5 | 790.4 | 796.8 | 843.1 | 665.3 | ||||||||||||||
| Other non-current assets | 449.3 | 1,108.3 | 972.1 | 971.9 | 498.7 | 492.7 | 459.6 | 763.3 | ||||||||||||||
| Investments | 304.1 | 333.9 | 358.1 | 368.6 | 419.0 | 611.9 | 147.9 | 190.1 | ||||||||||||||
| Investment property | - | - | - | - | - | - | 2,346.0 | 2,420.7 | ||||||||||||||
| Biological Assets | 1,561.1 | 795.1 | 717.0 | 767.9 | 968.0 | 1,061.6 | 972.5 | 950.6 | ||||||||||||||
| Property, Plant and Equipment | 7,980.5 | 8,260.0 | 7,928.8 | 7,835.2 | 7,867.0 | 7,678.3 | 7,000.5 | 7,016.5 | ||||||||||||||
| Intangible | 3,889.6 | 4,125.3 | 4,531.1 | 4,593.8 | 4,932.3 | 4,878.7 | 5,063.8 | 13,955.1 | ||||||||||||||
| Non-current Assets | 15,731.8 | 17,679.2 | 17,716.4 | 17,924.4 | 17,414.5 | 17,422.3 | 18,662.1 | 27,799.4 | ||||||||||||||
| Total Assets | 19,212.4 | 22,285.3 | 22,892.5 | 22,939.2 | 22,168.1 | 22,756.3 | 24,571.7 | 34,871.1 | ||||||||||||||
| Current portion of long-term debt | 957.1 | 666.1 | 805.1 | 773.6 | 540.2 | 1,212.5 | 1,295.2 | 1,843.1 | ||||||||||||||
| Derivatives | 132.3 | 94.3 | 29.3 | 15.7 | 9.6 | 40.8 | 12.3 | 14.5 | ||||||||||||||
| Trade Accounts Payable | 558.8 | 621.6 | 757.5 | 765.4 | 606.0 | 633.3 | 788.0 | 1,449.5 | ||||||||||||||
| Salaries Payable | 183.6 | 183.3 | 191.5 | 158.2 | 183.7 | 232.5 | 221.2 | 257.1 | ||||||||||||||
| Taxes payable | 245.3 | 247.1 | 328.9 | 282.4 | 241.7 | 176.0 | 208.9 | 423.2 | ||||||||||||||
| Dividends payable | 72.2 | 82.9 | 9.1 | 8.7 | 9.7 | 103.2 | 79.8 | 27.2 | ||||||||||||||
| Related Parties | 41.2 | 186.8 | 163.2 | 228.5 | 175.5 | 169.3 | 189.7 | 140.0 | ||||||||||||||
| Liabilities Held for Sale | - | 112.5 | 118.0 | - | ||||||||||||||||||
| Other Liabilities | 190.4 | 273.8 | 307.3 | 215.9 | 308.0 | 284.1 | 336.3 | 351.8 | ||||||||||||||
| Current Liabilities | 2,380.8 | 2,355.9 | 2,591.8 | 2,448.5 | 2,074.5 | 2,964.3 | 3,249.5 | 4,506.4 | ||||||||||||||
| Long-term debt | 6,274.9 | 3,699.4 | 4,407.8 | 4,589.9 | 4,659.2 | 4,682.3 | 4,607.9 | 10,025.1 | ||||||||||||||
| Taxes payable | 639.1 | 1,123.0 | 1,180.0 | 1,184.8 | 1,202.6 | 1,183.8 | 1,201.3 | 974.1 | ||||||||||||||
| Provision for judicial demands | 666.3 | 940.8 | 975.8 | 1,026.7 | 1,051.7 | 1,089.8 | 1,089.5 | 1,133.9 | ||||||||||||||
| Related Parties | 4.4 | 371.2 | 546.3 | 468.5 | 389.7 | 375.4 | 371.9 | 372.4 | ||||||||||||||
| Pension | 24.4 | 25.9 | 27.4 | 28.9 | 37.3 | 37.7 | 37.2 | 324.3 | ||||||||||||||
| Deferred Income taxes | 1,511.0 | 3,546.4 | 3,159.1 | 3,116.5 | 2,443.4 | 2,299.3 | 2,149.8 | 3,516.2 | ||||||||||||||
| Other non-current liabilities | 382.9 | 814.4 | 752.1 | 777.1 | 828.1 | 769.2 | 732.3 | 748.9 | ||||||||||||||
| Non-current Assets | 9,502.9 | 10,521.0 | 11,048.4 | 11,192.3 | 10,612.0 | 10,437.6 | 10,189.8 | 17,095.0 | ||||||||||||||
| Common stock | 5.3 | 5.3 | 5.3 | 5.3 | 5.3 | 5.3 | 5.3 | 5.3 | ||||||||||||||
| Treasury shares | - | - | - | (109.4 | ) | - | - | - | - | |||||||||||||
| Capital Reserve | 3,668.2 | 3,725.5 | 3,718.8 | 3,750.3 | 3,634.7 | 3,631.2 | 3,752.1 | 3,739.9 | ||||||||||||||
| Profits Reserve | - | 1,872.5 | 1,773.6 | (191.4 | ) | - | - | - | - | |||||||||||||
| Accumulated earnings | 887.3 | - | - | 1,824.9 | 1,937.3 | 1,911.6 | 1,929.5 | 2,124.5 | ||||||||||||||
| Equity attributable to owners of the Company | 4,560.9 | 5,603.3 | 5,497.7 | 5,471.1 | 5,577.3 | 5,548.1 | 5,686.9 | 5,869.7 | ||||||||||||||
| Equity attributable to non-controlling interests | 2,767.8 | 3,805.0 | 3,754.5 | 3,827.2 | 3,904.3 | 3,806.3 | 5,445.5 | 7,400.0 | ||||||||||||||
| Total equity | 7,328.7 | 9,408.4 | 9,252.2 | 9,298.3 | 9,481.6 | 9,354.4 | 11,132.4 | 13,269.7 | ||||||||||||||
| Total liabilities and equity | 19,212.4 | 22,285.3 | 22,892.5 | 22,939.2 | 22,168.1 | 22,756.3 | 24,571.7 | 34,871.1 |
39 of 40
| | Earnings Release Third Quarter of the Fiscal Year 2013 – October, November, December of 2012 |
Cosan Limited
Statement of Cash Flow
| Statement of Cash Flows | Mar' 11 | Jun' 11 | Set' 11 | Dec' 11 | Mar' 12 | Mar' 12 | Jun' 12 | Sep' 12 | Dec' 12 | Dec' 12 | ||||||||||||||||||||
| (in R$ million) | FY11 | 1Q12 | 2Q12 | 3Q12 | 4Q12 | FY12 | 1Q13 | 2Q13 | 3Q13 | FY13 | ||||||||||||||||||||
| Net Income | 767.7 | 1,858.1 | 84.6 | (974.2 | ) | 1,223.8 | 2,192.3 | (144.8 | ) | 393.3 | 599.1 | 847.6 | ||||||||||||||||||
| Non-cash Adjustments: | - | - | - | - | - | - | - | - | - | - | ||||||||||||||||||||
| Depreciation and Amortization | 1,359.0 | 303.7 | 365.5 | (669.2 | ) | 1,142.8 | 1,142.8 | 259.2 | 377.5 | 455.9 | 1,092.6 | |||||||||||||||||||
| Biological Assets | (381.9 | ) | (20.9 | ) | 38.8 | (17.9 | ) | (60.1 | ) | (60.1 | ) | (17.5 | ) | 38.4 | 21.9 | 42.8 | ||||||||||||||
| Stock option | - | - | - | - | 10.80 | 10.80 | 3.32 | 3.33 | 3.32 | 10.0 | ||||||||||||||||||||
| Equity income of associates | (25.2 | ) | (1.9 | ) | 1.3 | 0.7 | (33.3 | ) | (33.3 | ) | (7.6 | ) | (54.1 | ) | (3.2 | ) | (65.0 | ) | ||||||||||||
| Losses (Gains) in Fixed Assets Disposals | (35.3 | ) | 17.0 | (11.5 | ) | (5.5 | ) | (93.9 | ) | (93.9 | ) | (58.6 | ) | 16.9 | (233.8 | ) | (275.4 | ) | ||||||||||||
| Deferred Income and Social Contribution Taxes | 329.1 | 1,197.8 | (277.7 | ) | (920.1 | ) | 962.8 | 962.8 | - | - | - | - | ||||||||||||||||||
| Fair value of investment properties | - | - | - | - | - | - | - | - | (85.9 | ) | (85.9 | ) | ||||||||||||||||||
| Judicial demands' provision | - | - | - | - | - | - | - | 34.52 | (1.25 | ) | 33.3 | |||||||||||||||||||
| Interest, monetary and exchange variations, net | 238.5 | (27.6 | ) | 569.6 | (542.0 | ) | 646.5 | 646.5 | 396.7 | (68.5 | ) | 158.8 | 487.0 | |||||||||||||||||
| Effects of formation of JVs | - | (2,871.2 | ) | 18.2 | (2,853.1 | ) | 2,855.2 | (2,850.9 | ) | - | - | - | - | |||||||||||||||||
| Other Non-cash Items | 7.5 | 3.5 | 13.4 | (16.9 | ) | (5.7 | ) | (5.7 | ) | (0.3 | ) | 13.7 | 36.6 | 50.0 | ||||||||||||||||
| - | - | - | - | - | - | - | - | |||||||||||||||||||||||
| Variation on Assets and Liabilities | - | - | - | |||||||||||||||||||||||||||
| Accounts receivable | 164.7 | (123.3 | ) | (105.6 | ) | 228.8 | (361.1 | ) | (361.1 | ) | (68.7 | ) | (13.9 | ) | (133.3 | ) | (215.8 | ) | ||||||||||||
| Restricted Cash | (142.97 | ) | 113.48 | 7.70 | (121.18 | ) | 79.45 | 79.45 | (37.49 | ) | 44.69 | (2.31 | ) | 4.9 | ||||||||||||||||
| Judicial Deposits | - | (108.1 | ) | 108.1 | - | - | - | - | - | - | - | |||||||||||||||||||
| Inventories | 84.6 | (326.6 | ) | (311.8 | ) | 638.4 | (186.8 | ) | (186.8 | ) | (102.6 | ) | (433.2 | ) | (126.6 | ) | (662.3 | ) | ||||||||||||
| Taxes recoverable | - | - | - | - | (17.13 | ) | (17.13 | ) | (22.01 | ) | (28.07 | ) | (8.16 | ) | (58.2 | ) | ||||||||||||||
| Related Parties | - | (1,033.6 | ) | 142.6 | 891.1 | (751.7 | ) | (751.7 | ) | (83.7 | ) | 89.5 | (69.5 | ) | (63.6 | ) | ||||||||||||||
| Advances to Suppliers | 16.8 | (122.1 | ) | 18.2 | 103.9 | (103.3 | ) | (103.3 | ) | - | 21.3 | 26.5 | 47.8 | |||||||||||||||||
| Accounts payable | (32.4 | ) | 241.2 | 125.0 | (366.2 | ) | 220.2 | 220.2 | 46.7 | 118.7 | (72.1 | ) | 93.3 | |||||||||||||||||
| Salaries payable | 36.2 | 110.9 | 5.1 | (116.1 | ) | 108.2 | 108.2 | 56.1 | (37.2 | ) | (24.0 | ) | (5.0 | ) | ||||||||||||||||
| Provision for judicial demands from legal proceedings | 26.9 | 33.1 | (33.1 | ) | - | 144.0 | 144.0 | 38.1 | (47.0 | ) | 0.8 | (8.1 | ) | |||||||||||||||||
| Derivatives | 13.3 | 908.8 | (1,050.0 | ) | 141.2 | (112.3 | ) | (112.3 | ) | 6.0 | 19.7 | 1.5 | 27.2 | |||||||||||||||||
| Taxes payable | (50.1 | ) | (79.2 | ) | 1,003.4 | (924.3 | ) | 886.3 | 886.3 | (87.6 | ) | (58.1 | ) | (105.3 | ) | (251.0 | ) | |||||||||||||
| Other assets and liabilities, net | (49.2 | ) | 532.4 | (120.7 | ) | (411.8 | ) | 134.5 | 134.5 | (140.9 | ) | 82.0 | 118.5 | 59.6 | ||||||||||||||||
| - | - | - | - | - | - | - | - | |||||||||||||||||||||||
| Cash Flow from Operating Activities | 2,327.2 | 605.5 | 591.0 | (5,934.2 | ) | 6,689.3 | 1,951.6 | 34.5 | 513.5 | 557.5 | 1,105.6 | |||||||||||||||||||
| - | - | - | ||||||||||||||||||||||||||||
| Aquisitions, net of aquired cash and advances for future | ||||||||||||||||||||||||||||||
| capital increases | (157.3 | ) | - | - | - | (72.9 | ) | (72.9 | ) | (200.3 | ) | (8.9 | ) | (3,094.4 | ) | (3,303.6 | ) | |||||||||||||
| Contributed cash to Raízen's formation | - | (173.1 | ) | 0.0 | - | - | (173.1 | ) | - | - | - | - | ||||||||||||||||||
| Redemption of shares in subsidiary | - | - | - | - | (99.8 | ) | (99.8 | ) | - | - | - | - | ||||||||||||||||||
| Received Dividends | - | - | - | - | 121.4 | 121.4 | - | - | 191.4 | 191.4 | ||||||||||||||||||||
| Additions on Investments, Net of Cash Received | - | - | (99.1 | ) | (0.9 | ) | 57.6 | (42.3 | ) | - | - | - | - | |||||||||||||||||
| Additions on Property, Plant and Equipment | (2,291.6 | ) | (491.5 | ) | (243.3 | ) | (346.3 | ) | (503.4 | ) | (1,584.5 | ) | (281.2 | ) | (274.1 | ) | (424.0 | ) | (979.3 | ) | ||||||||||
| Sugarcane planting and growing costs | (745.6 | ) | (217.2 | ) | (117.9 | ) | (107.0 | ) | (109.9 | ) | (552.0 | ) | (160.5 | ) | (76.9 | ) | (131.5 | ) | (369.0 | ) | ||||||||||
| Proceeds from sale of property,plant and equipment, intangible and investments | - | - | - | - | ||||||||||||||||||||||||||
| Treasury Shares | - | - | - | - | ||||||||||||||||||||||||||
| Cash received on the acquisition of new business | - | - | - | - | - | - | 0.1 | 111.7 | 0.5 | 112.2 | ||||||||||||||||||||
| Cash Received on Sale of other Fixed Assets | 48.8 | - | 42.3 | 53.8 | 86.0 | 182.1 | 147.6 | 2.2 | 427.3 | 577.1 | ||||||||||||||||||||
| Cash reclassified from discontinued operatios | - | - | - | - | (29.8 | ) | - | - | (29.8 | ) | ||||||||||||||||||||
| Cash Flow from Investment Activities | (3,145.7 | ) | (881.8 | ) | (418.0 | ) | (400.4 | ) | (521.0 | ) | (2,221.1 | ) | (524.2 | ) | (246.1 | ) | (3,030.6 | ) | (3,801.0 | ) | ||||||||||
| - | - | - | ||||||||||||||||||||||||||||
| Financing Activities | - | - | - | |||||||||||||||||||||||||||
| Additions of Debt | 2,719.5 | 1,281.1 | 483.8 | 335.9 | 245.7 | 2,346.4 | 568.7 | 121.7 | 3,515.5 | 4,205.8 | ||||||||||||||||||||
| Payments of Principal and Interest on Debt | (1,971.6 | ) | (1,121.3 | ) | (206.0 | ) | 395.6 | (957.7 | ) | (1,889.4 | ) | (298.1 | ) | (268.8 | ) | (342.1 | ) | (909.0 | ) | |||||||||||
| Capital Increase | 4.0 | - | - | - | - | - | - | - | - | - | ||||||||||||||||||||
| Capital Increase by noncontrolling interests | 400.0 | 139.9 | 0.0 | 139.9 | 281.1 | 560.9 | - | 595.9 | 52.4 | 648.3 | ||||||||||||||||||||
| Treasury Shares | (15.2 | ) | - | (54.4 | ) | (101.2 | ) | 107.4 | (48.3 | ) | - | - | - | - | ||||||||||||||||
| Exercise of stock option plan | - | - | - | - | ||||||||||||||||||||||||||
| Dividends | (193.1 | ) | - | (228.2 | ) | (4.8 | ) | (100.6 | ) | (333.7 | ) | - | (234.2 | ) | (335.2 | ) | (569.4 | ) | ||||||||||||
| Acquisition of shares of subsidiary | 37.1 | - | - | (4.6 | ) | 4.6 | - | (17.2 | ) | - | - | (17.2 | ) | |||||||||||||||||
| Exchange rate variation excluding Cash and Cash Equivalents | (1.2 | ) | 19.3 | (0.4 | ) | (3.1 | ) | 15.8 | - | - | - | - | ||||||||||||||||||
| Cash Flows from Financing Activities | 979.5 | 299.8 | 14.5 | 760.4 | (422.8 | ) | 651.9 | 253.3 | 214.6 | 2,905.2 | 3,373.1 | |||||||||||||||||||
| Impact of foreign currency exchange on cash and cash equivalents | - | - | - | - | - | - | - | (11.8 | ) | (0.7 | ) | |||||||||||||||||||
| Total Cash Flow | 161.0 | 23.5 | 187.5 | (5,574.1 | ) | 5745.504872 | 382.4 | (225.5 | ) | 470.1 | 677.0 | |||||||||||||||||||
| - | - | 0 | - | - | - | - | ||||||||||||||||||||||||
| Cash & Equivalents, Beginning | 1,110.8 | 1,271.8 | 1,295.3 | 1,482.9 | (2,778.1 | ) | 1,271.8 | 1,654.1 | 1,428.7 | 1,654.1 | ||||||||||||||||||||
| Cash & Equivalents, Closing | 1,271.8 | 1,295.3 | 1,482.9 | 1,283.4 | (2,407.4 | ) | 1,654.1 | 1,428.7 | 1,898.8 | 2,331.2 | ||||||||||||||||||||
40 of 40
SIGNATURES
Pursuant to the requirements of the Securities Exchange Act of 1934, the registrant has duly caused this report to be signed on its behalf by the undersigned, thereunto duly authorized.
| COSAN LIMITED | |||||
| Date: | February 7, 2013 | By: | /s/ Marcelo Eduardo Martins | ||
| Name: | Marcelo Eduardo Martins | ||||
| Title: | Chief Financial Officer and Investor Relations Officer | ||||