FORM 6-K
SECURITIES AND EXCHANGE COMMISSION
Washington, D.C. 20549
Report of Foreign Issuer
Pursuant to Rule 13a-16 or 15d-16
of the Securities Exchange Act of 1934
For the month of March, 2015
Commission File Number: 1-33659
COSAN LIMITED
(Translation of registrant’s name into English)
Av. Juscelino Kubitschek, 1327 – 4th floor
São Paulo, SP 04543-000 Brazil
(Address of principal executive offices)
Indicate by check mark whether the registrant files or will file annual reports under cover of Form 20-F or Form 40-F:
| Form 20-F | X | Form 40-F |
Indicate by check mark if the registrant is submitting the Form 6-K in paper as permitted by Regulation S-T Rule 101(b)(1):
| Yes | No | X |
Indicate by check mark if the registrant is submitting the Form 6-K in paper as permitted by Regulation S-T Rule 101(b)(7):
| Yes | No | X |
COSAN LIMITED
Item | |
| 1. | Press Release dated March 18, 2015 regarding results for 4th quarter and Fiscal Year 2014 |
| 2. | Consolidated financial statements at December 31, 2014 and report of independent registered public accounting firm |

Item 1
Net revenue growth of 11% and EBITDA of R$4.0 billion in 2014
São Paulo, March 18, 2015 - COSAN LIMITED S.A. (NYSE: CZZ; BM&FBOVESPA: CZLT33) announces today its results for the fourth quarter of fiscal year 2014 (4Q14)—October, November, and December 2014—and fiscal year 2014. The results are consolidated in accordance with the accounting principles adopted in Brazil and internationally (IFRS).
Earnings Conference Call Portuguese March 19, 2015 11:00 A.M. (Brasilia time) Phone: + 55 11 3193 1001 + 55 11 2820 4001 Access Code: COSAN English March 19, 2015 12:00 A.M. (Brasilia time) Phone (BR): + 55 11 3193 1001 + 55 11 2820 4001 Phone (USA): +1 786 924 6977 Access Code: COSAN | Highlights 2014 |
o Raízen Combustíveis’s EBITDA was R$2.2 billion with growth of 8% in volume sold in 2014 o Raízen Energia's EBITDA was R$2.5 billion with 57 million tons of sugarcane crushed in the 2014/15 harvest o 40% growth in the commercial segment connections in Comgás o Record of 11.1 million tons loaded by Rumo at the Port of Santos |
Investor Relationship | 4Q14 | 4Q13 | Summary of Financial Information - Cosan Consolidated¹ | 2014 | 2013 | |
Email: ri@cosan.com | (Oct-Dec) | (Oct-Dec) | Amount in R$ MM | (Jan-Dec) | (Jan-Dec) | |
Telephone: +55 11 3897 9797 | 10,526.0 | 9,390.0 | Net Revenue | 39,998.7 | 36,165.1 | |
Site: www.cosan.com.br | 1,199.9 | 1,156.5 | Gross Profit | 4,825.7 | 4,606.4 | |
Fiscal Year Definitions: | 11.4% | 12.3% | Gross Margin (%) | 12.1% | 12.7% | |
4Q14 - quarter ended December 30, 2014 | 588.3 | 577.5 | Operating Profit | 2,144.9 | 2,186.5 | |
| 1,096.2 | 1,014.1 | EBITDA | 4,047.1 | 3,953.1 | ||
| 10.4% | 10.8% | EBITDA Margin (%) | 10.1% | 10.9% | ||
4Q13 - quarter ended December 31, 2013 | (6.2) | 4.5 | Equity Pick-up | (29.4) | (10.2) | |
| 69.0 | 344.2 | Net Income before non-controlling Interest | 659.3 | 697.3 | ||
| (29.1) | 132.7 | Net Income | 171.0 | 210.9 | ||
2014 - 12 months beginning January 1, 2014 and closing December 31, 2014 | -0.3% | 1.4% | Net Margin (%) | 0.4% | 0.6% | |
| 666.9 | 806.6 | CAPEX | 2,690.8 | 2,910.1 | ||
2013 - 12 months beginning January 1, 2013 and closing December 31, 2013 | 12,246.3 | 10,548.9 | Proforma Net Debt (w/ preferred shareholders payable in subsidiaries) | 12,246.3 | 10,548.9 | |
| 13,560.2 | 13,374.4 | Shareholders' Equity and Minority Shareholders | 13,560.2 | 13,374.4 | ||
| Note 1: Considering the consolidation of 50% of Raízen Combustíveis and Raízen Energia | ||||||

1 of 19
 | Cosan Limited-Earnings Release 4th Quarter of Fiscal Year 2014 |
Message from the CEO
We ended 2014 with many achievements reflected in our business’s performance. Despite the challenger economic scenario - with the downturn in the Brazilian economy, currency devaluation and high inflation - we were able to achieve the results committed with our shareholders.
We also announced a large corporate restructuring following the simplification of our business model in line with market demands. Gas, Energy and Logistics segments will operate more independently, with a focus on operational efficiency, organic growth and pursuing opportunities in their sectors.
We cannot expect a favorable economic scenario in 2015. It will be a period of great adjustments and high volatility. However, we are confident in our position and Raízen, Comgás, Radar and Lubrificantes are references in their markets.
Additionally, we have a huge challenge related to the integration of Rumo and ALL, recently approved by competent agencies. Our project will transform and expand cargo transportation business in Brazil through an efficient logistics.
Our main focus this year is on cash generation and leverage reduction. We aim to do more with less and to create organic value in operations. These will be the main themes of 2015.
Simplicity, agility, and entrepreneurism will continue to guide us seeking results that create value for our shareholders in our whole business portfolio.
Marcos Marinho Lutz
CEO – Cosan
2 of 19
| Cosan Limited-Earnings Release 4th Quarter of Fiscal Year 2014 |
| A. | Highlights and Business Units |
A.1 Business Units
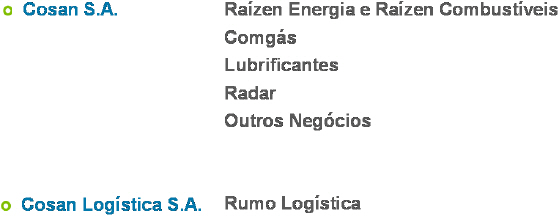
Listed below are the business units that make up Cosan S/A and Cosan Logística S/A, companies that comprise Cosan Limited’s portfolio.
The business units (reportable segments) are organized as follows:
3 of 19
| Cosan Limited-Earnings Release 4th Quarter of Fiscal Year 2014 |
A.2 Cosan Limited’s Consolidated Result
Cosan Limited’s consolidated financial statements considers 100% of the results of Cosan S/A and Cosan Logística S/A.
EBITDA reported herein is in compliance with CVM Rule 527/12, published by the Brazilian Securities and Exchange Commission on October 4, 2012, and may differ from the amounts reported in prior periods as a result of the equity accounting income adjustment. Therefore, EBITDA now consists of operating profit before financial expenses, plus depreciation, amortization and equity accounting.
| 4Q14 | 4Q13 | EBITDA (Reconciliation ICVM 527) | 2014 | 2013 | |||
| (Oct-Dec) | (Oct-Dec) | Chg. % | Amounts in R$ MM | (Jan-Dec) | (Jan-Dec) | Chg. % | |
| (29.1) | 132.7 | n/a | Net Income | 171.0 | 211.0 | (19.)% | |
| (130.0) | (88.9) | 46.3% | (-) Equity Pick-up | (592.0) | (340.2) | 74.% | |
| - | - | n/a | (-) Income from Discontinued Operations | - | 3.4 | -100.% | |
| 92.3 | 209.2 | -55.9% | (+) Minority Shareholders | 471.5 | 472.3 | -0.2% | |
| 17.9 | (155.6) | n/a | (+) Income Taxes | 43.8 | 103.3 | -57.6% | |
| 333.8 | 254.4 | 31.2% | (+) Net Financial Expense (Revenue) | 982.8 | 893.6 | 10.% | |
| 175.2 | 158.7 | 10.4% | (+) Depreciation and Amortization | 679.1 | 598.4 | 13.5% | |
| 460.1 | 510.4 | -9.9% | EBITDA (before ICVM 527) | 1,756.3 | 1,941.9 | -9.6% | |
| 130.0 | 88.9 | 46.3% | (+) Equity Pick-up | 592. | 340.2 | 74.% | |
| 590.2 | 599.3 | -1.5% | EBITDA (after ICVM 527) | 2,348.3 | 2,282.1 | 2.9% |
4 of 19
| Cosan Limited-Earnings Release 4th Quarter of Fiscal Year 2014 |
Below we present 4Q14 and 2014 results by business segment as previously detailed. All information reflect 100% of their financial performance, regardless of Cosan Limited’s interest.
For reconciliation purposes of the consolidated EBITDA, the Adjustments and Eliminations column refers to the elimination of net profits of the business controlled by Cosan for consolidation purposes.
Results by Business Unit 4Q14 | Cosan Energia Proforma | Cosan Logística | CZZ (Parent) | Ajustments and Eliminations | CZZ Proforma |
| Net Revenue | 10,270.2 | 255.7 | - | - | 10,526.0 |
| Cost of Goods and Services | (9,148.5) | (177.6) | - | - | (9,326.1) |
| Gross Profit | 1,121.8 | 78.1 | - | 0.0 | 1,199.9 |
| Gross Margin(%) | 10.9% | 30.6% | n/a | - % | 11.4% |
| Selling Expenses | (429.8) | - | - | - | (429.8) |
| General and Administrative Expenses | (264.8) | (24.2) | (1.2) | 0.0 | (290.2) |
| Other Operating Revenues (Expenses) | 118.7 | (10.3) | - | - | 108.4 |
| Equity Pick-up | (6.2) | (0.0) | (40.3) | 40.3 | (6.2) |
| Depreciation and Amortization | 487.3 | 26.9 | - | - | 514.1 |
| EBITDA | 1,026.9 | 70.5 | (41.5) | 40.3 | 1,096.2 |
| EBITDA Margin (%) | 10.% | 27.6% | n/a | - % | 10.4% |
| Financial income | (432.2) | (13.8) | (6.7) | (0.0) | (452.7) |
| Financial expense | 157.8 | 2.5 | 0.0 | - | 160.4 |
| Foreign exchange gain (losses), net | (349.8) | 0.7 | 13.3 | - | (335.8) |
| Derivatives | 114.1 | - | 5.8 | - | 119.9 |
| Income taxes expenses | 6.5 | (11.3) | - | 0.0 | (4.8) |
| Non-controlling interests | (119.5) | (5.5) | - | 26.9 | (98.1) |
| Profit (loss) for the period | (83.5) | 16.3 | (29.1) | 67.2 | (29.1) |
Results by Business Unit 2014 | Cosan Energia Proforma | Cosan Logística | CZZ (Parent) | Ajustments and Eliminations | CZZ Proforma |
| Net Revenue | 39.083,3 | 915,4 | - | - | 39.998,7 |
| Cost of Goods and Services | (34.562,6) | (610,4) | - | - | (35.173,0) |
| Gross Profit | 4.520,7 | 305,1 | - | 0.0 | 4.825,7 |
| Gross Margin(%) | 11.6% | 33.3% | n/a | - % | 12.1% |
| Selling Expenses | (1.746,3) | - | - | - | (1.746,3) |
| General and Administrative Expenses | (1.004,5) | (87,8) | (19,3) | - | (1.111,6) |
| Other Operating Revenues (Expenses) | 187,8 | 7,8 | - | (18.6) | 177,1 |
| Equity Pick-up | (29,4) | 0,0 | 193,6 | (193.6) | (29,4) |
| Depreciation and Amortization | 1.834,4 | 97,2 | - | - | 1.931,6 |
| EBITDA | 3.762,7 | 322,3 | 174,3 | (212.2) | 4.047,1 |
| EBITDA Margin (%) | 9.6% | 35.2% | n/a | n/a | 10.1% |
| Financial income | (1.416,3) | (66,1) | (20,8) | - | (1.503,2) |
| Financial expense | 506,1 | 31,1 | 1,8 | - | 539,0 |
| Foreign exchange gain (losses), net | (533,9) | 1,3 | 17,2 | - | (515,4) |
| Derivatives | 226,4 | - | (1,4) | - | 225,0 |
| Income taxes expenses | (143.3) | (58.3) | - | - | (201.6) |
| Non-controlling interests | (344.8) | (28.8) | - | (114.7) | (488.3) |
| Results of discontinued operations | 69.4 | - | - | (69.4) | - |
| Profit (loss) for the period | 292.0 | 104.3 | 171.0 | (396.3) | 171.0 |
5 of 19
| Cosan Limited-Earnings Release 4th Quarter of Fiscal Year 2014 |
| A. | Results |
B.1 Cosan S/A - Proforma
We present below the main highlights of Cosan S/A’s results, the Company's business unit responsible for the operations of Raízen Fuels, Raizen Energia, Comgás, Lubricants, Radar and Other Businesses.
Due to the adoption of the IFRS 11 accounting standard – Joint Arrangements, since April 2013, Cosan S/A no longer consolidates Raízen on its balance sheet, income statement and cash flows, and the result of this business unit is only reported under the “Equity Accounting Result”. Due to the relevance of Raízen on Cosan S/A’s financial information, we will report in the table below the proforma results, including Raízen’s proportional interest of 50% in the results.
For complete information on Cosan S/A results, its Earning Release is available at ri.cosan.com.br.
| 4T14 | 4Q13 | COSAN S/A PROFORMA | 2014 | 2013 | |
| (Oct-Dec) | (Oct-Dec) | (Jan-Dec) | (Jan-Dec) | ||
| 10,270.2 | 9,183.5 | Net Revenue | 39,083.3 | 35,247.4 | |
| (9,148.5) | (8,120.4) | Cost of Goods and Services | (34,562.6) | (31,016.1) | |
| 1,121.8 | 1,063.1 | Gross Profit | 4,520.7 | 4,231.3 | |
| 10.9% | 11.6% | Gross Margin(%) | 11.6% | 12.% | |
| (429.8) | (420.2) | Selling Expenses | (1,746.3) | (1,674.8) | |
| (264.8) | (264.3) | General and Administrative Expenses | (1,004.5) | (990.2) | |
| 118.7 | 138.2 | Other Operating Revenues (Expenses) | 187.8 | 350.9 | |
| (6.2) | 4.5 | Equity Pick-up | (29.4) | (10.2) | |
| 487.3 | 412.2 | Depreciation and Amortization | 1,834.4 | 1,699.3 | |
| 1,026.9 | 933.4 | EBITDA | 3,762.7 | 3,606.2 | |
| 10.% | 10.2% | EBITDA Margin (%) | 9.6% | 10.2% | |
| (432.2) | (375.5) | Financial income | (1,416.3) | (1,248.2) | |
| 157.8 | 101.5 | Financial expense | 506.1 | 356.3 | |
| (349.8) | (201.5) | Foreign exchange gain (losses), net | (533.9) | (577.3) | |
| 114.1 | 79.1 | Derivatives | 226.4 | 213.6 | |
| 6.5 | 182.6 | Income taxes expenses | (143.3) | (195.4) | |
| (119.5) | (114.0) | Non-controlling interests | (344.8) | (336.0) | |
| - | 36.4 | Results of discontinued operations | 69.4 | 141.5 | |
| (83.5) | 229.8 | Profit (loss) for the period | 292.0 | 261.3 |
Raízen Combustíveis
For comparison purposes, the following information presented consider 100% of Raízen Combustíveis operations, even though Cosan S/A holds 50% share in the segment.
Raízen Combustíveis closed 2014 with growth of 7.8% of total volume sold, especially gasoline, ethanol and diesel which grew 10.0%, 11.1% and 7.9% respectively. Net revenue for the year reached R$55.7 billion, 14.8% higher than in 2013, driven by higher volumes sold and average prices, primarily by variations in petrol and diesel prices by Petrobras. EBITDA was R$2.1 billion, an 11.7% growth compared to 2013.
6 of 19
| Cosan Limited-Earnings Release 4th Quarter of Fiscal Year 2014 |
Raízen Combustíveis ended 2014 with 5,356 Shell service stations and 944 convenience stores in its network, a growth of 496 stations and 94 stores compared to 2013.
Raízen Energia
For comparison purposes, the following information consider 100% of Raízen Energia operations, even though Cosan S/A holds 50% share in the segment. Additionally, it is worth mentioning that the analysis of Raizen Energia information should consider the crop year that began in April 2014 and will end in March 2015.
Raizen Energia ended 4Q14 with a crushing volume of 57.1 million tons, concluding crushing for the 2014/15 harvest with a 7.1% reduction in the total volume of sugarcane crushed. The main factor for the reduction of the volume crushed was the dry climate throughout the year, which hampered the process of planting and growth of sugarcane, reducing agricultural productivity. The product mix was more focused on sugar (54%) and ethanol (46%).
The volume of sugar and ethanol sold in 4Q14 grew 39.2% and 14.2% respectively, representing 1.3 million tons of sugar and 828,200 m³. The volume of energy sold was 7.7% lower in the quarter, compared to 4Q13, reaching 593,000 MWh. Raízen Energia’s total net revenue in 4Q14 was R$2.6 billion, 24.3% higher compared to the same period last year. EBITDA in the quarter was R$595.1 million, up 53.3%, with an EBITDA margin of 22.5%. EBITDA adjusted by the effects of biological assets was R$655.7 million.
Comgás
Comgás’ volume sold remained stable compared to 2013, with 5.5 million m³ sold in 2014. This stability is due to higher temperatures in 2014 that reduced the consumption of residential units and lowered industrial activity. Comgás’ net revenue was R$6.4 billion in 2014, 0.8% higher than 2013. EBITDA was R$1.4 billion, 7.2% higher compared to the previous year, with an EBITDA margin of 22.5%.
Lubrificantes
Net revenue from the sale of lubricants, base oil resale and other goods and services increased 3.8% in 2014, reaching R$1.6 billion. This result is due to higher average unit price and a 1.3% increase in the volume sold, which totaled 319.8 million m³. EBITDA was R$103.4 million in the year, with a margin of 6.5%.
7 of 19
Radar
Radar ended 2014 with 246,700 hectares of land under its management, with a market value of R$4.6 billion. Net income in 2014 was R$157.6 million, increased by the sale of properties during the year. In 2014, EBITDA was R$193.0 million, down 15.2% compared to 2013 due to the lower valuation of the Company’s own land portfolio.
8 of 19
| Cosan Limited-Earnings Release 4th Quarter of Fiscal Year 2014 |
B.2 Cosan Logística
| 4Q14 | 4Q13 | COSAN LOGÍSTICA | 2014 | 2013 | |
| (Oct-Dec) | (Oct-Dec) | (Jan-Dec) | (Jan-Dec) | ||
| 255.7 | 206.5 | Net Revenue | 915.4 | 917.7 | |
| (177.6) | (113.0) | Cost of Goods and Services | (610.4) | (542.6) | |
| 78.1 | 93.5 | Gross Profit | 305.1 | 375.1 | |
| 30.6% | 45.3% | Gross Margin(%) | 33.3% | 40.9% | |
| (24.2) | (22.6) | General and Administrative Expenses | (87.8) | (74.3) | |
| (10.3) | (1.9) | Other Operating Revenues (Expenses) | 26.4 | (20.4) | |
| (0.0) | (0.0) | Equity Pick-up | (18.6) | (0.0) | |
| 26.9 | 20.0 | Depreciation and Amortization | 97.2 | 77.5 | |
| 70.5 | 89.0 | EBITDA | 322.3 | 358.0 | |
| 27.6% | 43.1% | EBITDA Margin (%) | 35.2% | 39.% | |
| (13.8) | (11.0) | Financial income | (66.1) | (38.1) | |
| 2.5 | 12.6 | Financial expense | 31.1 | 50.2 | |
| 0.7 | 0.3 | Foreign exchange gain (losses), net | 1.3 | 0.4 | |
| (11.3) | (23.8) | Income taxes expenses | (58.3) | (99.7) | |
| (5.5) | (10.7) | Non-controlling interests | (28.8) | (48.4) | |
| 16.3 | 36.4 | Profit (loss) for the period | 104.3 | 144.8 |
Rumo
Rumo reported a record high volume of sugar loaded at the port of Santos, reaching 11.2 million tons in 2014, an increase of 21.1% over 2013. Net revenue for the year was R$915.4 million, in line with 2013. This stability was due to the drop in transportation revenue offset by the growth of the port loading revenue. Cosan Logística’s EBITDA was R$ 322.3 million in 2014, with an EBITDA margin of 35.2%.
9 of 19
| Cosan Limited-Earnings Release 4th Quarter of Fiscal Year 2014 |
C. Other Items in the Consolidated Result
Financial Result
| 4Q14 | 4Q13 | Financial Results | 2014 | 2013 | |||
| (Oct-Dec) | (Oct-Dec) | Chg. % | Amounts in R$ MM | (Jan-Dec) | (Jan-Dec) | Chg. % | |
| (157.1) | (202.7) | -22.5% | Gross Debt Charges | (719.7) | (746.7) | -3.6% | |
| 41.4 | 31.3 | 32.1% | Income from Financial Investments | 139.7 | 122.0 | 14.5% | |
| (115.7) | (171.3) | -32.4% | (=) Subtotal: Net Debt Interests | (580.0) | (624.7) | -7.2% | |
| (84.5) | (55.1) | 53.4% | Other Charges and Monetary Variation | (113.3) | (86.1) | 31.7% | |
| (196.9) | (101.7) | 93.6% | Exchange Rate Variation | (300.5) | (324.6) | -7.4% | |
| 110.1 | 90.8 | 21.3% | Gains (losses) with Derivatives | 161.4 | 230.2 | -29.9% | |
| (46.8) | (17.0) | n/a | Amortization, Debt Cost and Other | (150.4) | (88.4) | 70.1% | |
| (333.8) | (254.4) | 31.2% | (=) Financial, Net | (982.8) | (893.6) | 10.0% |
Financial result for 4Q14 was a net financial expense of R$333.8 million, versus a net debt of R$254.4 million in 4Q13, with an increase of 31.2%, mainly due to:
(i) Debt charges decreased 22.5% year-over-year mainly due to the lower indebtedness level from one period to the other, due to the corporate restructuring in 2Q14.
(ii) Increase of 32.1% on income from financial investments, due to the increase in interest rates in the period, partially offset by the reduction in average cash in the period.
(iii) The negative net result of R$86.8 million from foreign exchange rate variation and derivatives losses in the quarter reflects the valuation of the US Dollar against the Brazilian Real by 8.4% (R$2.6562/US$ on December 31, 2014 compared to R$2.4510/US$ on September 30, 2014), and its impact on debt denominated in dollars.
(iv) Amortization of debt and other costs totaled a net expense of R$46.8 million in 4Q14, mainly due to cost US $ 6.0 million from Cosan S.A. Consent expense.
The financial result for fiscal year 2014 presented net expense of R$982.8 million, while for 2013 it was R$893.6 million. This growth is mainly due to the increase of bank charges in the year, impacted by the corporate restructuring and the payment of a consent fee in the period.
10 of 19
| Cosan Limited-Earnings Release 4th Quarter of Fiscal Year 2014 |
Net Income
| 4Q14 | 4Q13 | Net Income | 2014 | 2013 | |
| (Oct-Dec) | (Oct-Dec) | Amounts in R$ MM | (Jan-Dec) | (Jan-Dec) | |
| (29.1) | 132.7 | Net Income | 171.0 | 211.0 |
Cosan Limited’s net loss was R$29.1 million in the quarter, below the amount in 4Q13, which was R$132.7 million. However, net income during the year was R$171.0 million versus R$215.2 in the same period of 2013.
The main drivers of this change in net income during the period were:
| 4Q | Net Income | FY | |
| (Oct-Dec) | Amounts in R$ MM | (Jan-Dec) | |
| 132.7 | Net Income - 2013 | 211.0 | |
| EBIT variation | |||
| (48.5) | Cosan Energia | (184.1) | |
| (25.3) | Cosan Logística | (55.4) | |
| 7.0 | Outros | (8.1) | |
| - | Adjustments | (18.6) | |
| (66.8) | EBIT Businesses Total | (266.3) | |
| Variation in other lines | |||
| (79.5) | Financial result | (89.3) | |
| 40.2 | Equity pick-up | 250.8 | |
| (173.6) | Income taxes | 59.5 | |
| 117.9 | Non-controlling Interest | 1.9 | |
| - | Discontinued operation | 3.4 | |
| (29.1) | Net Income - 2014 | 171.0 |
| (i) | Increase in the equity accounting result line of R$40.2 million due to Raízen’s results, outlined in previous sections, as well as the impact of foreign exchange rate variations on Raizen’s debt; |
| (ii) | Reduction of R$79.5 million in financial results mainly due to the foreign exchange rate variation and the results from derivatives as described in the Financial Result section; |
| (iii) | EBIT variation and profit of non-controlling shareholders of R$51.1 million. |
11 of 19
| Cosan Limited-Earnings Release 4th Quarter of Fiscal Year 2014 |
D. Loans and Financing
At the close of 4Q14, Cosan Limited’s pro forma consolidated gross debt (excluding PESA) reached R$15.5 billion, compared to R$14.1 billion, an increase of 9.3% over 3Q14.
Cosan Limited pro forma consolidated
Cash and cash equivalents totaled R$3.2 billion at the end of 4Q14 compared to R$2.4 billion in 3Q14. The pro forma net debt (including preferred) for the quarter was R$12.2 billion, compared to R$11.7 billion in 3Q14, equivalent to a leverage of 3.0x considering the pro forma EBITDA of R$4.0 billion in the last 12 months.
| Debt per Business Units (Amount in R$ MM) | |||
| 4Q14 | 3Q14 | ||
| COSAN S/A PROFORMA | (Oct-Dec) | (Jul-Sep) | Chg. % |
| Raízen (50%) | 5,581.7 | 4,870.0 | 14.6% |
| Comgás | 2,803.3 | 2,724.9 | 2.9% |
| Lubrificantes | 261.2 | 244.6 | 6.8% |
| Other business | 3,786.3 | 3,285.3 | n/a |
| Total Debt Proforma | 12,432.4 | 11,124.8 | 11.8% |
| Cash and Cash Equivalents and Securities | (3,098.6) | (2,388.2) | 29.7% |
| Proforma Net Debt | 9,333.8 | 8,736.6 | 6.8% |
| Preferred shareholders payable in subsidiaries | 1,962.7 | 2,036.3 | -3.6% |
| Proforma Net Debt (w/ preferred shareholders payable in subsidiaries) | 11,296.5 | 10,772.9 | 4.9% |
| COSAN LOGÍSTICA | |||
| Rumo | 784.7 | 715.7 | 9.6% |
| Total Debt | 784.7 | 715.7 | 9.6% |
| Cash and Cash Equivalents and Securities | 86.5 | 97.8 | -11.5% |
| Net Debt | 698.2 | 617.9 | 13.0% |
12 of 19
| Cosan Limited-Earnings Release 4th Quarter of Fiscal Year 2014 |
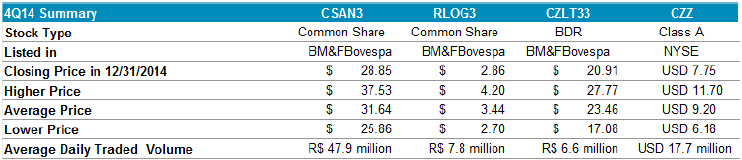
E. Stock Performance
The shares issued by Cosan Limited have been listed on NYSE – New York Stock Exchange, since its IPO in 2007, under the ticker symbol CZZ. The company has also issued share deposit certificates (Brazilian Depositary Receipts – BDR) on the BM&FBovespa under the symbol CZLT33.
The tables and graphs below represent the performance of shares issued by the companies:

13 of 19
| Cosan Limited-Earnings Release 4th Quarter of Fiscal Year 2014 |
Disclaimer
This document contains forward-looking statements and estimates. These forward-looking statements and estimates are solely forecasts and do not represent any guarantee of prospective results. All stakeholders should know that these statements and estimates are and will be, depending on the case, subject to risks, uncertainties and factors related to the operations and business environment of Cosan and its subsidiaries, and therefore the actual results of these companies may significantly differ from the estimated or implied prospective results contained in such forward-looking statements and estimates.
14 of 19
| Cosan Limited-Earnings Release 4th Quarter of Fiscal Year 2014 |
F. Financial Statements
F.1 Cosan Energia
| Cosan Consolidated | 4Q14 | 4Q13 |
| Income statement for the period | 12/31/2014 | 12/31/2013 |
| Net operating revenue | 2,041,186 | 2,011,255 |
| Gross Profit | 540,406 | 558,884 |
| Sales, general and administrative expenses | (390,344) | (345,350) |
| Other operating income (expenses), net | 92,460 | 77,490 |
| Financial revenue | 40,364 | 60,710 |
| Financial expenses | (269,509) | (301,685) |
| Foreign exchange variation | (210,907) | (106,041) |
| Derivative | 104,326 | 92,932 |
| Equity pick up | 130,036 | 91,478 |
| Income and social contribution taxes | (6,649) | 179,439 |
| Equity attributable to non-controlling interests | (113,661) | (124,020) |
| Net Income from discontinued operations | - | 48,557 |
| Net Income (loss) | (83,478) | 232,395 |
| Cosan Consolidated | 4Q14 | 3Q14 |
| Balance sheet | 12/31/2014 | 09/30/2014 |
| Cash and cash equivalents | 1,540,192 | 1,209,732 |
| Securities | 149,735 | 202,352 |
| Accounts receivable | 822,424 | 835,565 |
| Inventories | 347,903 | 321,268 |
| Other current assets | 548,134 | 3,516,540 |
| Investments | 8,535,180 | 8,687,985 |
| Investment property | 2,641,978 | 2,167,221 |
| Biological assets | (0) | (0) |
| Property, plant and equipment | 351,435 | 313,532 |
| Intangible | 9,426,120 | 9,398,821 |
| Other non-current assets | 2,740,614 | 2,641,710 |
| Total Assets | 27,103,712 | 29,294,726 |
| Loans and financing | (7,397,601) | (6,624,781) |
| Suppliers | (971,170) | (881,746) |
| Salaries payable | (101,115) | (99,383) |
| Other current liabilities | (616,590) | (1,562,779) |
| Other non-current liabilities | (5,567,962) | (6,221,007) |
| Net Equity | (12,449,273) | (13,905,030) |
| Total Liabilities | (27,103,712) | (29,294,726) |
15 of 19
| Cosan Limited-Earnings Release 4th Quarter of Fiscal Year 2014 |
F.2 Cosan Logística
| Cosan Logística | 4Q14 | 4Q13 |
| Income statement for the period | 12/31/2014 | 12/31/2013 |
| Net operating revenue | 255,726 | 206,511 |
| Gross profit | 78,131 | 93,477 |
| Sales, general and administrative expenses | (24,199) | (22,574) |
| Other operating income (expenses), net | (10,281) | (1,934) |
| Financial revenue | 2,547 | 12,644 |
| Financial expenses | (13,830) | (11,016) |
| Foreign exchange variation | 740 | 341 |
| Equity pick up | (0) | (0) |
| Income and social contribution taxes | (11,296) | (23,789) |
| Equity attributable to non-controlling interests | (5,530) | (10,730) |
| Net Income (loss) | 16,280 | 36,418 |
| Cosan Logística | 4Q14 | 3Q14 |
| Balance sheet | 12/31/2014 | 09/30/2014 |
| Cash and cash equivalents | 86,487 | 97,765 |
| Accounts receivable | 42,685 | 36,908 |
| Inventories | 5,817 | 6,099 |
| Other current assets | 24,175 | 21,695 |
| Investments | (0) | 0 |
| Property, plant and equipment | 1,084,455 | 1,047,280 |
| Intangible | 860,253 | 834,405 |
| Other non-current assets | 481,483 | 406,374 |
| Total Assets | 2,585,358 | 2,450,526 |
| Loans and financing | (784,709) | (715,698) |
| Suppliers | (141,289) | (114,947) |
| Salaries payable | (19,302) | (16,368) |
| Other current liabilities | (89,960) | (49,677) |
| Other non-current liabilities | (221,850) | (215,847) |
| Net Equity | (1,328,250) | (1,337,989) |
| Total Liabilities | (2,585,358) | (2,450,526) |
16 of 19
| Cosan Limited-Earnings Release 4th Quarter of Fiscal Year 2014 |
F.3 Cosan Limited (Parent company)
| Cosan Limited (Parent company) | 4Q14 | 4Q13 |
| Income statement for the period | 12/31/2014 | 12/31/2013 |
| Sales, general and administrative expenses | (1,203) | (1,206) |
| Other operating income (expenses), net | - | (6,981) |
| Financial revenue | 23 | 221 |
| Financial expenses | (6,669) | (4,322) |
| Foreign exchange variation | 13,257 | 3,997 |
| Derivative | 5,813 | (2,164) |
| Equity pick up | (40,314) | 143,165 |
| Net Income (loss) | (29,092) | 132,709 |
| Cosan Limited (Parent company) | 4Q14 | 3Q14 |
| Balance sheet | 12/31/2014 | 09/30/2014 |
| Cash and cash equivalents | 22,661 | 24,123 |
| Other current assets | 19,658 | 22,569 |
| Investments | 6,132,772 | 6,223,146 |
| Other non-current assets | 10,220 | - |
| Total Assets | 6,185,311 | 6,269,837 |
| Loans and financing | (320,329) | (303,619) |
| Other current liabilities | (12,712) | (18,778) |
| Other non-current liabilities | (7,721) | - |
| Net Equity | (5,844,549) | (5,947,438) |
| Total Liabilities | (6,185,311) | (6,269,837) |
17 of 19
| Cosan Limited-Earnings Release 4th Quarter of Fiscal Year 2014 |
F.4 Cosan Limited
| Cosan Limited | 4Q14 | 4Q13 |
| Income statement for the period | 12/31/2014 | 12/31/2013 |
| Net Operating Revenue | 2,296,912 | 2,217,765 |
| Gross Profit | 618,537 | 652,361 |
| Sales, general and administrative expenses | (415,746) | (369,130) |
| Other operating income (expenses), net | 82,178 | 68,576 |
| Financial revenue | 42,935 | 73,574 |
| Financial expenses | (290,008) | (317,024) |
| Foreign exchange variation | (196,910) | (101,704) |
| Derivative | 110,139 | 90,768 |
| Equity pick up | 130,040 | 89,856 |
| Income and Social Contribution Taxes | (17,945) | 155,650 |
| Equity attributable to non-controlling interests | (92,312) | (210,218) |
| Net Income from discontinued operations | - | (0) |
| Net Income (loss) | (29,092) | 132,709 |
| Cosan Limited | 4Q14 | 3Q14 |
| Balance sheet | 12/31/2014 | 09/30/2014 |
| Cash and cash equivalents | 1,649,340 | 1,330,619 |
| Securities | 149,735 | 202,352 |
| Accounts receivable | 865,109 | 872,473 |
| Inventories | 353,720 | 327,367 |
| Other current assets | 547,202 | 1,089,081 |
| Investments | 8,535,180 | 8,687,859 |
| Investment property | 2,641,978 | 2,167,221 |
| Property, plant and equipment | 1,435,890 | 1,360,812 |
| Intangible | 10,286,373 | 10,233,226 |
| Other non-current assets | 3,231,821 | 3,048,084 |
| Total Assets | 29,696,348 | 29,319,095 |
| Loans and financing | (8,502,640) | (7,644,098) |
| Suppliers | (1,112,459) | (996,693) |
| Salaries payable | (120,416) | (115,751) |
| Other current liabilities | (681,714) | (496,504) |
| Other non-current liabilities | (5,789,814) | (6,436,853) |
| Net Equity | (13,489,303) | (13,629,198) |
| Total Liabilities | (29,696,348) | (29,319,095) |
18 of 19
| Cosan Limited-Earnings Release 4th Quarter of Fiscal Year 2014 |
F.5 Consolidated, including Raízen
| Cosan Limited Proforma | 4Q14 | 4Q13 |
| Income Statement for the period | 12/31/2014 | 12/31/2013 |
| Net Operating Revenue | 10,525,966 | 9,389,991 |
| Gross Profit | 1,199,897 | 1,156,548 |
| Sales, general and administrative expenses | (720,024) | (708,341) |
| Other operating income (expenses), net | 108,430 | 129,318 |
| Financial revenue | 160,382 | 114,413 |
| Financial expenses | (452,701) | (390,821) |
| Foreign exchange variation | (335,818) | (197,189) |
| Derivative | 119,935 | 76,986 |
| Equity pick up | (6,240) | 5,446 |
| Income and Social Contribution Taxes | (4,833) | 158,768 |
| Equity attributable to non-controlling interests | (98,120) | (212,419) |
| Net Income from discontinued operations | (0) | 0 |
| Net Income (loss) | (29,092) | 132,709 |
| Cosan Limited Proforma | 4Q14 | 3Q14 |
| Balance Sheet | 12/31/2014 | 09/30/2014 |
| Cash and cash equivalents | 3,058,050 | 2,209,986 |
| Securities | 149,735 | 202,352 |
| Accounts receivable | 2,007,869 | 1,888,490 |
| Inventories | 2,076,059 | 2,137,958 |
| Other current assets | 1,246,121 | 1,823,292 |
| Investments | 338,800 | 330,152 |
| Investment property | 2,641,978 | 2,167,221 |
| Biological assets | 914,152 | 914,414 |
| Property, plant and equipment | 7,584,036 | 7,515,186 |
| Intangible | 14,064,484 | 14,027,265 |
| Other non-current assets | 4,825,854 | 4,288,228 |
| Total Assets | 38,907,140 | 37,504,545 |
| Loans and Financing | (14,470,324) | (12,895,998) |
| Suppliers | (1,695,764) | (1,561,504) |
| Salaries Payable | (279,925) | (308,224) |
| Other current liabilities | (1,369,292) | (881,747) |
| Other non-current liabilities | (7,531,602) | (8,162,749) |
| Net Equity | (13,560,232) | (13,694,323) |
| Total Liabilities | (38,907,140) | (37,504,545) |
19 of 19
Item 2
Cosan Limited Consolidated financial statements at December 31, 2014 and report of independent registered public accounting firm |
Cosan Limited
Consolidated financial statements
December 31, 2014
Contents
| Report of independent registered public accounting firm | 3 |
| Consolidated statement of financial position | 5 |
Consolidated statement of profit or loss and other comprehensive income | 7 |
| Statement of changes in shareholders’ equity | 9 |
| Consolidated statement of cash flows | 12 |
| Notes to the consolidated financial statements | 14 |
2
Report of Independent Registered Public Accounting Firm
To the Board of Directors and Shareholders
Cosan Limited
In our opinion, the accompanying consolidated statement of financial position and the related consolidated statements of profit or loss and other comprehensive income, of changes in shareholders’ equity and of cash flows present fairly, in all material respects, the financial position of Cosan Limited and its subsidiaries at December 31, 2014 and 2013, and the results of their operations and their cash flows for the year ended December 31, 2014, nine month-period ended December 31, 2013 and for the year ended March 31, 2013 in conformity with International Financial Reporting Standards as issued by the International Accounting Standards Board. Also in our opinion, the Company maintained, in all material respects, effective internal control over financial reporting as of December 31, 2014, based on criteria established in Internal Control - Integrated Framework 2013 issued by the Committee of Sponsoring Organizations of the Treadway Commission (COSO). The Company's management is responsible for these financial statements, for maintaining effective internal control over financial reporting and for its assessment of the effectiveness of internal control over financial reporting, included in “Management’s report on internal control over financial reporting”. Our responsibility is to express opinions on these financial statements and on the Company's internal control over financial reporting based on our integrated audits. We conducted our audits in accordance with the standards of the Public Company Accounting Oversight Board (United States). Those standards require that we plan and perform the audits to obtain reasonable assurance about whether the financial statements are free of material misstatement and whether effective internal control over financial reporting was maintained in all material respects. Our audits of the financial statements included examining, on a test basis, evidence supporting the amounts and disclosures in the financial statements, assessing the accounting principles used and significant estimates made by management, and evaluating the overall financial statement presentation. Our audit of internal control over financial reporting included obtaining an understanding of internal control over financial reporting, assessing the risk that a material weakness exists, and testing and evaluating the design and operating effectiveness of internal control based on the assessed risk. Our audits also included performing such other procedures as we considered necessary in the circumstances. We believe that our audits provide a reasonable basis for our opinions.
A company’s internal control over financial reporting is a process designed to provide reasonable assurance regarding the reliability of financial reporting and the preparation of financial statements for external purposes in accordance with generally accepted accounting principles. A company’s internal control over financial reporting includes those policies and procedures that (i) pertain to the maintenance of records that, in reasonable detail, accurately and fairly reflect the transactions and dispositions of the assets of the company; (ii) provide reasonable assurance that transactions are recorded as necessary to permit preparation of financial statements in accordance with generally accepted accounting principles, and that receipts and expenditures of the company are being made only in accordance with authorizations of management and directors of the company; and (iii) provide reasonable assurance regarding prevention or timely detection of unauthorized acquisition, use, or disposition of the company’s assets that could have a material effect on the financial statements.
3
Because of its inherent limitations, internal control over financial reporting may not prevent or detect misstatements. Also, projections of any evaluation of effectiveness to future periods are subject to the risk that controls may become inadequate because of changes in conditions, or that the degree of compliance with the policies or procedures may deteriorate.
Campinas, Brazil
March 18, 2015
/s/ PricewaterhouseCoopers
PricewaterhouseCoopers
Auditores Independentes
4
Cosan Limited
Consolidated statement of financial position
(In thousands of Brazilian Reais - R$)
| Note | December 31, 2014 | December 31, 2013 | ||||||||||
| Assets | ||||||||||||
| Cash and cash equivalents | 6 | 1,649,340 | 1,509,565 | |||||||||
| Investment securities | 149,735 | 87,978 | ||||||||||
| Trade receivables | 7 | 865,109 | 844,483 | |||||||||
| Derivative financial instruments | 31 | 30,069 | - | |||||||||
| Inventories | 8 | 353,720 | 311,980 | |||||||||
| Receivables from related parties | 11 | 38,357 | 46,788 | |||||||||
| Income tax receivable | 94,100 | 56,340 | ||||||||||
| Other current tax receivable | 9 | 78,818 | 85,433 | |||||||||
| Other financial assets | 10 | 69,683 | 63,054 | |||||||||
| Dividends receivable | 36,130 | 26,350 | ||||||||||
| Other | 174,957 | 217,927 | ||||||||||
| 3,540,018 | 3,249,898 | |||||||||||
| Assets held for sale | 14 | 25,089 | 314,104 | |||||||||
| Total current assets | 3,565,107 | 3,564,002 | ||||||||||
| Trade receivables | 7 | 480,992 | 238,460 | |||||||||
| Deferred tax assets | 20 | 214,164 | 232,188 | |||||||||
| Receivables from related parties | 11 | 212,527 | 504,481 | |||||||||
| Income tax receivable | 8,778 | 49,268 | ||||||||||
| Taxes recoverable | 9 | 17,299 | 18,366 | |||||||||
| Judicial deposits | 21 | 418,385 | 361,554 | |||||||||
| Other financial assets | 10 | 370,497 | 407,107 | |||||||||
| Derivative financial instruments | 31 | 860,509 | 513,934 | |||||||||
| Other non-current assets | 648,669 | 493,340 | ||||||||||
| Investment in associates | 12 | 130,677 | 103,316 | |||||||||
| Investment in joint ventures | 13 | 8,404,503 | 8,498,259 | |||||||||
| Investment properties | 14 | 2,641,978 | 2,281,509 | |||||||||
| Property, plant and equipment | 15 | 1,435,890 | 1,271,910 | |||||||||
| Intangible assets and goodwill | 16 | 10,286,373 | 10,078,040 | |||||||||
| Total non-current assets | 26,131,241 | 25,051,732 | ||||||||||
| Total assets | 29,696,348 | 28,615,734 | ||||||||||
5
Cosan Limited
Consolidated statement of financial position
(In thousands of Brazilian Reais - R$)
| Note | December 31, 2014 | December 31, 2013 | ||||||||||
| Liabilities | ||||||||||||
| Loans and borrowings | 17 | 1,056,353 | 1,050,862 | |||||||||
| Derivative financial instruments | 31 | 13,803 | 50,879 | |||||||||
| Trade payables | 18 | 1,112,459 | 862,429 | |||||||||
| Employee benefits payable | 120,416 | 103,296 | ||||||||||
| Income tax payable | 30,905 | 28,143 | ||||||||||
| Other taxes payable | 19 | 307,741 | 199,056 | |||||||||
| Dividends payable | 33,354 | 92,759 | ||||||||||
| Payables to related parties | 11 | 137,441 | 105,463 | |||||||||
| Other | 158,471 | 157,806 | ||||||||||
| Total current liabilities | 2,970,943 | 2,650,693 | ||||||||||
| Loans and borrowings | 17 | 7,446,287 | 8,042,094 | |||||||||
| Derivative financial instruments | 31 | 319,632 | 280,462 | |||||||||
| Other taxes payable | 19 | 334,565 | 1,010,767 | |||||||||
| Provision for legal proceedings | 21 | 657,779 | 722,458 | |||||||||
| Pension and post-employment benefits | 33 | 301,850 | 339,135 | |||||||||
| Deferred tax liabilities | 20 | 1,739,274 | 1,698,622 | |||||||||
| Preferred shareholders payable in subsidiaries | 22 | 1,926,888 | - | |||||||||
| Other | 509,823 | 551,739 | ||||||||||
| Total non-current liabilities | 13,236,098 | 12,645,277 | ||||||||||
| Total liabilities | 16,207,041 | 15,295,970 | ||||||||||
| Shareholders' equity | ||||||||||||
| Share capital | 5,328 | 5,328 | ||||||||||
| Additional paid in capital | 3,887,109 | 3,828,858 | ||||||||||
| Other comprehensive loss | (165,618 | ) | (84,887 | ) | ||||||||
| Retained earnings | 2,117,739 | 2,136,975 | ||||||||||
| Equity attributable to owners of the parent | 5,844,558 | 5,886,274 | ||||||||||
| Non-controlling interests | 12 | 7,644,749 | 7,433,490 | |||||||||
| Total shareholders' equity | 13,489,307 | 13,319,764 | ||||||||||
| Total shareholders' equity and liabilities | 29,696,348 | 28,615,734 | ||||||||||
The accompanying notes are an integral part of these consolidated financial statements.
6
Cosan Limited
Consolidated statement of profit or loss and other comprehensive income
(In thousands of Brazilian Reais – R$, except earnings per share)
| Note | Twelve months ended December 31, 2014 | Nine months ended December 31, 2013 | Twelve months ended March 31, 2013 | |||||||||||||
| Net sales | 26 | 9,062,304 | 6,878,214 | 4,586,209 | ||||||||||||
| Cost of sales | 27 | (6,413,720 | ) | (4,878,229 | ) | (3,211,309 | ) | |||||||||
| Gross profit | 2,648,584 | 1,999,985 | 1,374,900 | |||||||||||||
| Selling expenses | 27 | (881,543 | ) | (603,965 | ) | (459,433 | ) | |||||||||
| General and administrative expenses | 27 | (668,613 | ) | (466,933 | ) | (419,533 | ) | |||||||||
| Other income (expense), net | 29 | (21,240 | ) | 76,272 | 173,739 | |||||||||||
| Operating expense | (1,571,396 | ) | (994,626 | ) | (705,227 | ) | ||||||||||
| Income before financial results, | ||||||||||||||||
| equity in earnings in and income taxes | 1,077,188 | 1,005,359 | 669,673 | |||||||||||||
| Equity in earnings of investees | ||||||||||||||||
| Equity in earnings of associates | 12 | 3,540 | 5,497 | 70,414 | ||||||||||||
| Equity in earnings of joint ventures | 13 | 588,428 | 242,036 | 603,912 | ||||||||||||
| 591,968 | 247,533 | 674,326 | ||||||||||||||
| Financial results | 28 | |||||||||||||||
| Finance expense | (1,060,802 | ) | (804,606 | ) | (578,005 | ) | ||||||||||
| Finance income | 217,112 | 179,904 | 163,663 | |||||||||||||
| Foreign exchange losses, net | (300,521 | ) | (324,495 | ) | (83,254 | ) | ||||||||||
| Derivatives | 161,363 | 235,485 | 74,483 | |||||||||||||
| (982,848 | ) | (713,712 | ) | (423,113 | ) | |||||||||||
| Profit before taxes | 686,308 | 539,180 | 920,886 | |||||||||||||
| Income tax (expense) benefit | 20 | |||||||||||||||
| Current | (156,502 | ) | (129,976 | ) | (100,049 | ) | ||||||||||
| Deferred | 112,673 | 90,782 | (26,304 | ) | ||||||||||||
| (43,829 | ) | (39,194 | ) | (126,353 | ) | |||||||||||
7
Cosan Limited
Consolidated statement of profit or loss and other comprehensive income
(In thousands of Brazilian Reais – R$, except earnings per share)
| Profit from continuing operations | 642,479 | 499,986 | 794,533 | |||||||||||||
| Profit from discontinued operations, net of tax | - | - | 138,918 | |||||||||||||
| Profit for the period | 642,479 | 499,986 | 933,451 | |||||||||||||
| Other comprehensive income | ||||||||||||||||
| Items that will not be reclassified to profit or loss: | ||||||||||||||||
| Actuarial gain (loss) on defined benefit plan | 46,988 | 42,438 | (52,253 | ) | ||||||||||||
| Taxes on items that will not | ||||||||||||||||
| be reclassified to profit or loss | (15,976 | ) | (14,429 | ) | 17,766 | |||||||||||
| 31,012 | 28,009 | (34,487 | ) | |||||||||||||
| Items that may be reclassified to profit or loss: | ||||||||||||||||
| Foreign currency translation effect | (75,408 | ) | (42,891 | ) | 2,583 | |||||||||||
| Gain (loss) on cash flow hedge in joint ventures and | ||||||||||||||||
| subsidiary | (53,958 | ) | (6,426 | ) | 35,695 | |||||||||||
| Revaluation of investment properties | - | - | 83,318 | |||||||||||||
| Changes in fair value of | ||||||||||||||||
| available for sale securities | 9,110 | 13,753 | 10,806 | |||||||||||||
| Taxes on items that may be | ||||||||||||||||
| reclassified to profit or loss | (3,097 | ) | (4,676 | ) | 103,743 | |||||||||||
| (123,353 | ) | (40,240 | ) | 236,145 | ||||||||||||
| Total other comprehensive income (loss), net of tax | (92,341 | ) | (12,231 | ) | 201,658 | |||||||||||
| Total comprehensive income | 550,138 | 487,755 | 1,135,109 | |||||||||||||
| Net income attributable to: | ||||||||||||||||
| Owners of the Parent (including | ||||||||||||||||
| discontinued operations) | 171,006 | 122,618 | 424,070 | |||||||||||||
| Non-controlling interests | 471,473 | 377,368 | 509,381 | |||||||||||||
| Total comprehensive income attributable to: | ||||||||||||||||
| Owners of the Parent | 90,275 | 96,639 | 541,662 | |||||||||||||
| Non-controlling interests | 459,863 | 391,116 | 593,447 | |||||||||||||
| Basic earnings per share | 24 | |||||||||||||||
| Continuing operations | R$ | 0.65 | R$ | 0.46 | R$ | 1.27 | ||||||||||
| Discontinued operations | - | - | R$ | 0.33 | ||||||||||||
| R$ | 0.65 | R$ | 0.46 | R$ | 1.60 | |||||||||||
| Diluted earnings per share | 24 | |||||||||||||||
| Continuing operations (as revised - Note 24) | R$ | 0.58 | R$ | 0.40 | R$ | 1.21 | ||||||||||
| Discontinued operations | - | - | R$ | 0.33 | ||||||||||||
| R$ | 0.58 | R$ | 0.40 | R$ | 1.54 | |||||||||||
| The accompanying notes are an integral part of these consolidated financial statements. | ||||||||||||||||
8
Cosan Limited
Statement of changes in shareholders’ equity
(In thousands of Brazilian Reais - R$)
| Capital reserve | ||||||||||||||||||||||||||||
| Additional | Other | Equity attributable | Non- | |||||||||||||||||||||||||
| Share | paid in | comprehensive | Retained | to owners | controlling | Total | ||||||||||||||||||||||
| capital | capital | income | earnings | of the parent | interests | equity | ||||||||||||||||||||||
| At April 1, 2012 | 5,328 | 3,811,808 | (176,500 | ) | 1,923,638 | 5,564,274 | 3,862,281 | 9,426,555 | ||||||||||||||||||||
| Profit for the year | - | - | - | 424,070 | 424,070 | 509,381 | 933,451 | |||||||||||||||||||||
| Other comprehensive income | ||||||||||||||||||||||||||||
| Foreign currency translation effects | - | - | (3,381 | ) | - | (3,381 | ) | 5,964 | 2,583 | |||||||||||||||||||
Gain on cash flow hedge in joint ventures | - | - | 22,239 | - | 22,239 | 13,456 | 35,695 | |||||||||||||||||||||
| Revaluation of investment property | - | - | 118,832 | - | 118,832 | 71,903 | 190,735 | |||||||||||||||||||||
| Actuarial loss on defined benefit plan | - | - | (21,486 | ) | - | (21,486 | ) | (13,001 | ) | (34,487 | ) | |||||||||||||||||
| Changes in fair value of | ||||||||||||||||||||||||||||
| available for sale Securities | - | - | 1,388 | - | 1,388 | 5,744 | 7,132 | |||||||||||||||||||||
| Total comprehensive income for the year | - | - | 117,592 | 424,070 | 541,662 | 593,447 | 1,135,109 | |||||||||||||||||||||
| Contributions by and distributions to | ||||||||||||||||||||||||||||
| owners of the Parent | ||||||||||||||||||||||||||||
| Share options exercised - Subsidiaries | - | 10,444 | - | - | 10,444 | 6,320 | 16,764 | |||||||||||||||||||||
| Dividends - non-controlling interests | - | (1,295 | ) | - | - | (1,295 | ) | 1,316 | 21 | |||||||||||||||||||
| Share based compensation - Subsidiaries | - | 8,284 | - | - | 8,284 | 5,012 | 13,296 | |||||||||||||||||||||
| Dividends | - | - | - | (153,657 | ) | (153,657 | ) | (315,259 | ) | (468,916 | ) | |||||||||||||||||
| Total contributions by and distributions to | ||||||||||||||||||||||||||||
| owners of the Parent | - | 17,433 | - | (153,657 | ) | (136,224 | ) | (302,611 | ) | (438,835 | ) | |||||||||||||||||
| Transactions with owners of the Parent | ||||||||||||||||||||||||||||
| Corporate reorganization - Raízen Group | - | 31,693 | - | - | 31,693 | 19,173 | 50,866 | |||||||||||||||||||||
| Acquisition of treasury shares | - | (17,250 | ) | - | - | (17,250 | ) | - | (17,250 | ) | ||||||||||||||||||
| Acquisition of non-controlling interest | - | (2,859 | ) | - | - | (2,859 | ) | (79,641 | ) | (82,500 | ) | |||||||||||||||||
| Business combination COMGÁS | - | 15,754 | - | - | 15,754 | 1,863,331 | 1,879,085 | |||||||||||||||||||||
| Business combination Radar | - | 270 | - | - | 270 | 1,285,593 | 1,285,863 | |||||||||||||||||||||
| Business combination Logispot | ||||||||||||||||||||||||||||
| non-controlling interest | - | - | - | - | - | (32,872 | ) | (32,872 | ) | |||||||||||||||||||
| Total transactions with owners of the Parent | - | 27,608 | - | - | 27,608 | 3,055,584 | 3,083,192 | |||||||||||||||||||||
| At March 31, 2013 | 5,328 | 3,856,849 | (58,908 | ) | 2,194,051 | 5,997,320 | 7,208,701 | 13,206,021 | ||||||||||||||||||||
9
Cosan Limited
Statement of changes in shareholders’ equity
(In thousands of Brazilian Reais - R$)
| Capital reserve | ||||||||||||||||||||||||||||
| Additional | Other | Equity attributable | Non- | |||||||||||||||||||||||||
| Share | paid in | comprehensive | Retained | to owners | controlling | Total | ||||||||||||||||||||||
| capital | capital | income | earnings | of the parent | interests | equity | ||||||||||||||||||||||
| At April 1, 2013 | 5,328 | 3,856,849 | (58,908 | ) | 2,194,051 | 5,997,320 | 7,208,701 | 13,206,021 | ||||||||||||||||||||
| Profit for the nine-month period | - | - | - | 122,618 | 122,618 | 377,368 | 499,986 | |||||||||||||||||||||
| Other comprehensive income | ||||||||||||||||||||||||||||
| Foreign currency translation effects | - | - | (34,984 | ) | - | (34,984 | ) | (7,907 | ) | (42,891 | ) | |||||||||||||||||
| Loss on cash flow hedge in joint ventures | - | - | (4,004 | ) | - | (4,004 | ) | (2,422 | ) | (6,426 | ) | |||||||||||||||||
| Actuarial gain on defined benefit plan | - | - | 11,334 | - | 11,334 | 16,675 | 28,009 | |||||||||||||||||||||
| Changes in fair value of | ||||||||||||||||||||||||||||
| available for sale Securities | - | - | 1,675 | - | 1,675 | 7,402 | 9,077 | |||||||||||||||||||||
| Total comprehensive income for the nine months | - | - | (25,979 | ) | 122,618 | 96,639 | 391,116 | 487,755 | ||||||||||||||||||||
| Contributions by and distributions to | ||||||||||||||||||||||||||||
| owners of the Parent | ||||||||||||||||||||||||||||
| Share options exercised - Subsidiaries | - | 10,120 | - | - | 10,120 | 6,123 | 16,243 | |||||||||||||||||||||
| Dividends - non-controlling interests | - | 889 | - | - | 889 | (589 | ) | 300 | ||||||||||||||||||||
| Share based compensation - Subsidiaries | - | 4,109 | - | - | 4,109 | 2,486 | 6,595 | |||||||||||||||||||||
| Dividends | - | - | - | (179,694 | ) | (179,694 | ) | (148,586 | ) | (328,280 | ) | |||||||||||||||||
| Total contributions by and distributions to | ||||||||||||||||||||||||||||
| owners of the Parent | - | 15,118 | - | (179,694 | ) | (164,576 | ) | (140,566 | ) | (305,142 | ) | |||||||||||||||||
| Transactions with owners of the Parent | ||||||||||||||||||||||||||||
| Acquisition of treasury shares | - | (43,412 | ) | - | - | (43,412 | ) | (26,268 | ) | (69,680 | ) | |||||||||||||||||
| Unclaimed dividends | - | 303 | - | - | 303 | 507 | 810 | |||||||||||||||||||||
| Total transactions with owners of the Parent | - | (43,109 | ) | - | - | (43,109 | ) | (25,761 | ) | (68,870 | ) | |||||||||||||||||
| At December 31, 2013 | 5,328 | 3,828,858 | (84,887 | ) | 2,136,975 | 5,886,274 | 7,433,490 | 13,319,764 | ||||||||||||||||||||
10
Cosan Limited
Statement of changes in shareholders’ equity
(In thousands of Brazilian Reais - R$)
| Capital reserve | ||||||||||||||||||||||||||||
| Additional | Other | Equity attributable | Non- | |||||||||||||||||||||||||
| Share | paid in | comprehensive | Retained | to owners | controlling | Total | ||||||||||||||||||||||
| capital | capital | income | earnings | of the parent | interests | equity | ||||||||||||||||||||||
| At January 1, 2014 | 5,328 | 3,828,858 | (84,887 | ) | 2,136,975 | 5,886,274 | 7,433,490 | 13,319,764 | ||||||||||||||||||||
| Profit for the year | - | - | - | 171,006 | 171,006 | 471,473 | 642,479 | |||||||||||||||||||||
| Other comprehensive income | ||||||||||||||||||||||||||||
| Foreign currency translation effects | - | - | (66,653 | ) | - | (66,653 | ) | (8,755 | ) | (75,408 | ) | |||||||||||||||||
| Loss on cash flow hedge in joint ventures and subsidiary | - | - | (33,687 | ) | - | (33,687 | ) | (20,271 | ) | (53,958 | ) | |||||||||||||||||
| Actuarial gain on defined benefit plan | - | - | 18,285 | - | 18,285 | 12,727 | 31,012 | |||||||||||||||||||||
| Changes in fair value of | ||||||||||||||||||||||||||||
| available for sale Securities | - | - | 1,324 | - | 1,324 | 4,689 | 6,013 | |||||||||||||||||||||
| Total comprehensive income for the year | - | - | (80,731 | ) | 171,006 | 90,275 | 459,863 | 550,138 | ||||||||||||||||||||
| Contributions by and distributions to | ||||||||||||||||||||||||||||
| owners of the Parent | ||||||||||||||||||||||||||||
| Share options exercised - Subsidiaries | - | 28,436 | - | - | 28,436 | 17,111 | 45,547 | |||||||||||||||||||||
| Dividends - non-controlling interests | - | 3,411 | - | - | 3,411 | 857 | 4,268 | |||||||||||||||||||||
| Share based compensation - Subsidiaries | - | 8,073 | - | - | 8,073 | 4,851 | 12,924 | |||||||||||||||||||||
| Dividends | - | - | - | (190,242 | ) | (190,242 | ) | (255,293 | ) | (445,535 | ) | |||||||||||||||||
| Total contributions by and distributions to | ||||||||||||||||||||||||||||
| owners of the Parent | - | 39,920 | - | (190,242 | ) | (150,322 | ) | (232,474 | ) | (382,796 | ) | |||||||||||||||||
| Transactions with owners of the Parent | ||||||||||||||||||||||||||||
| Acquisition of non-controlling interest | - | 18,331 | - | - | 18,331 | (16,130 | ) | 2,201 | ||||||||||||||||||||
| Total transactions with owners of the Parent | - | 18,331 | - | - | 18,331 | (16,130 | ) | 2,201 | ||||||||||||||||||||
| At December 31, 2014 | 5,328 | 3,887,109 | (165,618 | ) | 2,117,739 | 5,844,559 | 7,644,749 | 13,489,307 | ||||||||||||||||||||
The accompanying notes are an integral part of these consolidated financial statements.
11
Cosan Limited
Consolidated statement of cash flows
(In thousands of Brazilian Reais - R$)
| Note | Twelve months ended December 31, 2014 | Nine months ended December 31, 2013 | Twelve months ended March 31, 2013 | |||||||||||||
| Cash flows from operating activities | ||||||||||||||||
| Profit before taxes | 686,308 | 539,180 | 920,886 | |||||||||||||
| Adjustments for: | ||||||||||||||||
| Depreciation and amortization | 15 / 16 | 679,101 | 439,144 | 334,786 | ||||||||||||
| Equity in earnings of associates | 12 | (3,540 | ) | (5,497 | ) | (70,414 | ) | |||||||||
| Equity in earnings of joint ventures | 13 | (588,428 | ) | (242,036 | ) | (603,912 | ) | |||||||||
| (Gain) loss on disposal of assets | 9,958 | 6,922 | (100,349 | ) | ||||||||||||
| Share-based compensation expense | 11 / 34 | 12,924 | 6,595 | 13,295 | ||||||||||||
| Change in fair value of investment property | 14 / 29 | (131,697 | ) | (121,543 | ) | (138,776 | ) | |||||||||
| Provisions for legal proceedings | 51,347 | 80,944 | 49,334 | |||||||||||||
| Indexation charges, interest and | ||||||||||||||||
| exchange gains/losses, net | 1,086,158 | 825,774 | 438,361 | |||||||||||||
| Other | 42,557 | 40,167 | 67,440 | |||||||||||||
| 1,844,688 | 1,569,650 | 910,651 | ||||||||||||||
| Changes in: | ||||||||||||||||
| Restricted cash | - | 18,220 | - | |||||||||||||
| Cash from discontinued operations | - | - | 116,387 | |||||||||||||
| Trade receivables | (268,813 | ) | (254,236 | ) | (62,414 | ) | ||||||||||
| Securities | (98,714 | ) | - | (14,276 | ) | |||||||||||
| Inventories | (40,321 | ) | (28,324 | ) | (33,355 | ) | ||||||||||
| Recoverable taxes | 51,013 | (13,167 | ) | (28,488 | ) | |||||||||||
| Related parties | (112,251 | ) | (8,519 | ) | (104,078 | ) | ||||||||||
| Advances to suppliers | 1,544 | 4,954 | 15,269 | |||||||||||||
| Trade payables | 241,827 | 55,728 | (5,280 | ) | ||||||||||||
| Employee benefits | (58,098 | ) | (14,216 | ) | (55,194 | ) | ||||||||||
| Provisions for legal proceedings | (50,136 | ) | (107,484 | ) | (9,212 | ) | ||||||||||
| Income and other taxes | (458,979 | ) | (156,476 | ) | (313,702 | ) | ||||||||||
| Other | 65,390 | 82,340 | (133,193 | ) | ||||||||||||
| (727,538 | ) | (421,180 | ) | (627,536 | ) | |||||||||||
| Net cash generated by operating activities | 1,117,150 | 1,148,470 | 283,115 | |||||||||||||
| Cash flows from investing activities | ||||||||||||||||
| Acquisitions in associates, net of cash acquired | - | - | (2,995,499 | ) | ||||||||||||
| Capital contribution in associates | (46,259 | ) | (79,594 | ) | (61,014 | ) | ||||||||||
| Dividends received from associates | 3,118 | 3,684 | - | |||||||||||||
| Dividends received from joint ventures | 705,072 | 406,424 | 578,757 | |||||||||||||
| Acquisition of property, plant and | ||||||||||||||||
| equipment and intangible assets | 15 / 16 | (1,063,412 | ) | (976,119 | ) | (649,681 | ) | |||||||||
| Proceeds from sale of property, plant | ||||||||||||||||
| and equipment, intangibles and investments | 1,196 | 65,350 | 220,719 | |||||||||||||
| Proceeds from sale of discontinued operation | 30 | 68,633 | 57,175 | 196,546 | ||||||||||||
| Net cash used by discontinued operation | - | - | (411 | ) | ||||||||||||
| Net cash used in investing activities | (331,652 | ) | (523,080 | ) | (2,710,583 | ) | ||||||||||
12
Cosan Limited
Consolidated statement of cash flows
(In thousands of Brazilian Reais - R$)
| Cash flows from financing activities | ||||||||||||||||
| Loans and borrowings raised | 1,720,385 | 1,072,339 | 6,197,855 | |||||||||||||
| Payment of principal and interest on | ||||||||||||||||
| loans and borrowings | (3,631,292 | ) | (1,460,470 | ) | (2,787,121 | ) | ||||||||||
| Related parties | (1,643 | ) | - | - | ||||||||||||
| Acquisition of non-controlling interest | - | - | (82,500 | ) | ||||||||||||
| Derivative financial instruments | (84,951 | ) | 82,621 | - | ||||||||||||
| Share capital paid in preferred shares | 22 | 1,946,736 | - | - | ||||||||||||
| Dividends paid | (630,233 | ) | (314,446 | ) | (396,462 | ) | ||||||||||
| Treasury shares | - | (69,659 | ) | (17,250 | ) | |||||||||||
| Proceeds from exercise of share options | 45,547 | 16,243 | 16,764 | |||||||||||||
| Net cash (used in) generated by financing activities | (635,451 | ) | (673,372 | ) | 2,931,286 | |||||||||||
| Increase (decrease) in cash and cash equivalents | 150,047 | (47,982 | ) | 503,818 | ||||||||||||
| Cash and cash equivalents at beginning of period | 1,509,565 | 1,544,072 | 1,036,217 | |||||||||||||
| Effects of exchange rate changes on cash held | (10,272 | ) | 13,475 | 4,037 | ||||||||||||
| Cash and cash equivalents at ended of period | 1,649,340 | 1,509,565 | 1,544,072 | |||||||||||||
| Supplemental cash flow information | ||||||||||||||||
| Interest paid | 725,309 | 376,526 | 166,068 | |||||||||||||
| Income taxes paid | 157,285 | 129,539 | 224,640 | |||||||||||||
| Non-cash transactions | ||||||||||||||||
| Offset of tax loss carryforwards - REFIS (Note 19) | 173,559 | - | - | |||||||||||||
| Offset of transaction with joint ventures - REFIS (Note 19) | 231,168 | - | - | |||||||||||||
| The accompanying notes are an integral part of these consolidated financial statements. | ||||||||||||||||
13
Cosan Limited
Notes to the consolidated financial statements
(Amounts in thousands of Brazilian Reais – R$, unless otherwise stated)
| 1 | Operations |
Cosan Limited (“Cosan”) was incorporated in Bermuda on April 30, 2007. Cosan’s class A common shares are traded on the New York Stock Exchange (NYSE) (ticker - CZZ). The BDRs (Brazilian Depositary Receipts) representing Cosan’s class A common shares are listed on the Brazilian Stock Exchange (BM&FBovespa) (ticker - CZLT33). Mr. Rubens Ometto Silveira Mello is the ultimate controlling shareholder of Cosan. Cosan controls its subsidiaries Cosan S.A. Indústria e Comércio (“Cosan S.A.”), Cosan Logística S.A. (“Cosan Log”) through a 62.51 % interest. Cosan, Cosan S.A., Cosan Log and its subsidiaries are collectively referred to as the “Company”.
The Company’s primary activities are in the following business segments: (i) Piped natural gas distribution to part of the State of São Paulo through its subsidiary Companhia de Gás de São Paulo – COMGÁS (“COMGÁS”), which has been consolidated since November 2012; (ii) Logistics services including transportation, port loading and storage of sugar, through its indirect subsidiary Rumo Logística Operadora Multimodal S.A. (“Rumo”); (iii) Purchase, sale and leasing of agricultural land through its subsidiary, Radar Propriedades Agrícolas S.A. ("Radar"); (iv) Production and distribution of lubricants under the Mobil licensed trademark in Brazil, Bolivia, Uruguay and Paraguay, in addition to the European and Asian market using the Comma brand and corporate activities; and (v) other investments, in addition to the corporate structures of the Company (“Cosan’s other business”).
The Company also holds interests in two joint ventures ("JVs"): (i) Raízen Combustíveis S.A. (“Raízen Combustíveis”), a fuel distribution business, and (ii) Raízen Energia S.A. (“Raízen Energia”), which operates in the production and marketing of sugar, ethanol and energy cogeneration, produced from sugar cane bagasse. Cosan and Royal Dutch Shell (“Shell”) share control of the two entities, where each owns 50% of the economic control. Up until the adoption of IFRS11 – Joint Arrangements (“IFRS 11”), these investments were accounted for using the proportional consolidation method. Upon the adoption of IFRS 11, during the nine months ended December 31, 2013, these investments have been accounted for under the equity method (all comparative periods was adjusted to conform to IFRS 11 presentation).
The Annual General Shareholders' Meeting held on July 31, 2013, approved a fiscal year end change from March 31st to December 31st. This was driven by changes in the Company’s investment portfolio, in which other businesses that do not use the harvest year (March 31) have become more significant. With this change, the Company’s fiscal year begins on January 1st, and ends on December 31st of each year. Accordingly, these consolidated financial statements are presented for the year ended December 31, 2014, the nine months ended December 31 (transition period) and for the year ended March 31, 2013.
On October 1, 2014 at the Extraordinary General Meeting (EGM), the Cosan S.A. shareholders’ approved the partial spin-off (the “Partial Spin-off”) of Cosan S.A. and merger of the spun-off portion into Cosan Log, composed of Cosan’s logistics operations. The Partial Spin-off seeks to segregate the Cosan S.A.’s activities in order to allow each business segment to focus on its sector, establishing suitable capital structures for each company. It also seeks to provide the market with greater transparency on each company’s performance, which will allow a better evaluation from shareholders and investors of the individual businesses permitting that resources be allocated accordance to the shareholder’s interests and investment strategy.
14
Cosan Limited
Notes to the consolidated financial statements
(Amounts in thousands of Brazilian Reais – R$, unless otherwise stated)
| 2 | Basis of preparation |
2.1 Statement of compliance
The consolidated financial statements have been prepared in accordance with International Financial Reporting Standards (IFRS) as issued by the International Accounting Standards Board (IASB).
These consolidated financial statements were authorized for issue by the Board of Directors on March 6, 2015.
2.2 Basis of measurement
The consolidated financial statements have been prepared on the historical cost basis except for the following material items in the statement of financial position:
| · | Derivative financial instruments are measured at fair value; |
| · | Non-derivative financial instruments at fair value through profit or loss are measured at fair value; |
| · | Available-for-sale financial assets are measured at fair value; |
| · | Investment property is measured at fair value; and |
| · | Employees’ defined benefit obligations are presented at the present value of the actuarial obligation net of the fair value of plan assets (Note 33). |
2.3 Functional and presentation currency
The consolidated financial statements are presented in Brazilian Reais. However, the functional currency of Cosan Limited is the U.S. Dollar (US$). The Brazilian Real is the functional currency of Cosan S.A., Cosan Log, its subsidiaries and joint ventures, located in Brazil, as it is the currency of the primary economic environment in which they operate, generate and expend cash. The functional currency for the subsidiaries located outside Brazil is U.S. Dollar or the Pound Sterling.
2.4 Use of estimates and judgments
The preparation of the consolidated financial statements in conformity with IFRS requires management to make judgments, estimates and assumptions that affect the application of accounting policies and the reported amounts of assets, liabilities, revenue and expenses at the end of the reporting period. Actual results may differ from these estimates.
Estimates and underlying assumptions are reviewed on an ongoing basis. Revisions to accounting estimates are recognized in the period in which the estimates are revised and in any future periods affected.
Information about critical judgments in applying accounting policies that have the most significant effect on the amounts recognized in the financial statements is included in the following notes:
| · | Notes 15 and 16 – Property, plant and equipment and intangible assets |
The calculation of amortization and depreciation of intangible assets and property, plant and equipment is based on estimated useful lives. In addition, the determination of the fair value
15
Cosan Limited
Notes to the consolidated financial statements
(Amounts in thousands of Brazilian Reais – R$, unless otherwise stated)
of intangible assets and property, plant and equipment acquired in a business combination or arising from the formation of a JV is a significant estimate.
The Company performs annually a review of impairment indicators for intangible assets and property, plant and equipment. Also, an impairment test is undertaken for goodwill. Impairment exists when the carrying value of an asset or cash generating unit exceeds its recoverable amount, which is the higher of its fair value less costs to sell and its value in use. The key assumptions used to determine the recoverable amount of the different cash generating units to which goodwill is allocated are explained in Note 16.
COMGÁS has an agreement for the public concession of gas distribution service in accordance to which the Conceding Authority, at the end of the concession, will hold a significant portion of the infrastructure and controls what services must be rendered and what prices will be applied. This concession agreement represents the right to charge from customers for the supply of gas during the effective period of the agreement. Therefore, the Company recognizes this right as intangible assets.
The amortization of intangible assets reflects the pattern expected for the utilization of the future economic benefits by the Company, which corresponds to the useful lives of the assets comprising the infrastructure consonant to the ARSESP provisions, as disclosed in Note 16.
The amortization of the intangible assets is discontinued when the related asset is fully used or written-off, and no longer is included in the calculation basis of the tariff for the rendering of the concession services, whichever occurs first.
The Company may request only once the extension of the distribution services for another 20 years, being subject to evaluation by the Conceding Authority. When the concession is terminated, the assets linked to the rendering of gas distribution services will be returned to the Conceding Authority, and the Company will be entitled to receive an indemnity to be determined based on assessments and evaluations considering the book values to be calculated at the time
| · | Note 20 – Income taxes and social contribution |
A deferred tax asset is recognized for loss carryforwards to the extent that it is probable that future taxable income will be generated to realize such losses. Significant judgment is required to determine the amount of deferred tax assets that can be recognized, based upon the timing and the level of future taxable income together with future tax planning strategies.
| · | Other non-current asset |
The Company has recognized a receivable in relation to a lawsuit filed against the Federal Government, claiming indemnification due to price controls, for which receipt is virtually certain, as the Supreme Court has passed final judgment against which the Federal Government has no recourse to appeal (Note 21).
Information about assumptions and estimation uncertainties that have a significant risk of material adjustment are as follows:
16
Cosan Limited
Notes to the consolidated financial statements
(Amounts in thousands of Brazilian Reais – R$, unless otherwise stated)
| · | Note 7 – Trade receivables |
Estimate of realization of receivable from contract under arbitration:
The Company’s subsidiaries Rumo is a defendant in a legal action initiated by América Latina Logística S.A. (“ALL”), a provider of rail transport services and lessee of Rumo’s rolling stock, in relation to the investment and transportation contracts entered into in 2009 (Note 7). The Company had requested arbitration to enforce its contractual rights and for ALL to comply with the terms of the agreements. Rail transport services continue to be provided by ALL.
On April 1, 2014, the Board of Directors of ALL accepted an offer by the Company to merger ALL’s activities with Rumo’s through the merger of shares issued by ALL into Rumo (“Stock Merger”). Accordingly, the current shareholders’ of Rumo and ALL will receive shares representing 36.5% and 63.5% of the capital stock of the merged company, respectively.
On May 12, 2014, Rumo and ALL officially suspended the arbitration and all court proceedings related to the performance of the agreements entered in 2009 (Note 7).
The amounts recorded as revenue and as a receivable are for the services provided under the terms of the contract, and represent management’s best estimate of the inflow of economic benefit, and backed by guarantees provided by ALL. However, the final settlement may be for an amount that is higher or lower than the amounts recorded in the financial statements as trade receivables.
| · | Note 31 – Fair value of derivatives and other financial instruments |
When the fair value of financial assets and liabilities cannot be derived from active markets, their fair value is determined using valuation techniques including the discounted cash flow model. The inputs to these models are taken from observable markets where possible, but when this is not feasible, a degree of judgment is required in determining fair values. Judgment is required in the determination of inputs such as liquidity risk, credit risk and volatility. Changes in these variables could affect the reported fair value of financial instruments.
| · | Note 33 – Pension and other post-employment benefit plans |
The cost of defined benefit pension plans and other post-employment and the present value of the pension obligation is determined using actuarial valuations. An actuarial valuation involves the use of various assumptions which may differ from actual results in the future. These include the determination of the discount rate, future salary increases, mortality rates and future pension increases. A defined benefit obligation is highly sensitive to changes in these assumptions. All assumptions are reviewed by management at each reporting date.
| · | Note 34 – Share based payments |
Cosan S.A. measures employees’ share based compensation cost by reference to the fair value of the shares at the grant date. The estimation of fair value for share-based payment
17
Cosan Limited
Notes to the consolidated financial statements
(Amounts in thousands of Brazilian Reais – R$, unless otherwise stated)
transactions requires determining the most appropriate valuation model, which is dependent on the terms and conditions of the plan. This estimate also requires determining the most appropriate inputs to the valuation model including the assumption of the expected life of the stock option, volatility and dividend yield. The assumptions and models used for estimating fair value for share-based payment transactions are disclosed in Note 34.
| · | Note 21 – Provisions for legal proceedings |
Provisions for legal proceedings are recognized when: the group has a present legal or constructive obligation as a result of past events; it is probable that an outflow of resources will be required to settle the obligation; and the amount has been reliably estimated. Provisions for legal proceedings resulting from business combinations are estimated at fair value.
| 3 | Significant accounting policies |
The accounting policies set out below have been applied consistently by the Company to all periods presented.
3.1 Basis of consolidation
The consolidated financial statements include the accounts of Cosan and its subsidiaries. Cosan’s subsidiaries are listed below:
| Ownership percentage | ||||||||
| December 31, 2014 | December 31, 2013 | |||||||
| Directly owned subsidiaries | ||||||||
_Cosan S.A. | 62.51 | 62.30 | ||||||
Cosan Logística S.A.(i) | 62.51 | - | ||||||
| Interest of Cosan S.A. in its subsidiaries | ||||||||
Administração de Participações Aguassanta Ltda.(ii) | - | 65.00 | ||||||
| Águas da Ponte Alta S.A. | 65.00 | 65.00 | ||||||
| Bioinvestments Negócios e Participações S.A. | 65.00 | 65.00 | ||||||
| Comma Oil Chemicals | 100.00 | 100.00 | ||||||
| Companhia de Gás de São Paulo – COMGÁS | 60.69 | 60.05 | ||||||
| Cosan Biomassa S.A. | 100.00 | 100.00 | ||||||
| Cosan Cayman II Limited | 100.00 | 100.00 | ||||||
| Cosan Global Limited | 100.00 | 100.00 | ||||||
| Cosan Investimentos e Participações S.A. | 100.00 | 100.00 | ||||||
Cosan Logística S.A.(i) | - | 100.00 | ||||||
| Cosan Lubes Investments Limited | 100.00 | 100.00 | ||||||
| Cosan Lubrificantes e Especialidades S.A. | 100.00 | 100.00 | ||||||
| Cosan Luxembourg S.A. | 100.00 | 100.00 | ||||||
| Cosan Overseas Limited | 100.00 | 100.00 | ||||||
| Cosan Paraguay S.A. | 100.00 | 100.00 | ||||||
| Cosan US, Inc. | 100.00 | 100.00 | ||||||
Logispot Armazéns Gerais S.A.(i) | - | 38.25 | ||||||
| Nova Agrícola Ponte Alta S.A. | 29.50 | 29.50 | ||||||
| Nova Amaralina S.A. Propriedades Agrícolas | 29.50 | 29.50 | ||||||
| Nova Santa Barbara Agrícola S.A. | 29.50 | 29.50 | ||||||
| Pasadena Empreendimentos e Participações S.A. | 100.00 | 100.00 | ||||||
| Proud Participações S.A. | 65.00 | 65.00 | ||||||
| Radar II Propriedades Agrícolas S.A. | 65.00 | 65.00 | ||||||
| Radar Propriedades Agrícolas S.A. | 29.50 | 29.50 | ||||||
Rumo Logística Operadora Multimodal S.A.(i) | - | 75.00 | ||||||
| Terras da Ponte Alta S.A. | 29.50 | 29.50 | ||||||
| Vale da Ponte Alta S.A. | 65.00 | 65.00 | ||||||
| Interest of Cosan | ||||||||
| Logística S.A. in its subsidiaries | ||||||||
Logispot Armazéns Gerais S.A.(i) | 38.25 | - | ||||||
Rumo Logística Operadora Multimodal S.A.(i) | 75.00 | - | ||||||
18
Cosan Limited
Notes to the consolidated financial statements
(Amounts in thousands of Brazilian Reais – R$, unless otherwise stated)
| (i) | Logispot Armazéns Gerais S.A. and Rumo Logística Operadora Multimodal S.A. are directly owned subsidiaries of Cosan Logística S.A., which become a directly owned subsidiary of Cosan Limited in 2014, as described in Note 1; |
| (ii) | Incorporated in March 2014. |
| a) | Business combinations – IFRS 3 (R) |
Business combinations are accounted for using the acquisition method – i.e. when control is transferred to the Company. Control is the power to govern the financial and operating policies of an entity so as to obtain benefits from its activities. In assessing control, the Company takes into consideration potential voting rights that are currently exercisable.
The consideration transferred for the acquisition of a subsidiary is the fair values of the assets transferred, the liabilities incurred to the former owners of the acquiree and the equity interests issued by the Company. Identifiable assets acquired and liabilities and contingent liabilities assumed in a business combination are measured initially at their fair values at the acquisition date. The consideration transferred does not include amounts related to the settlement of pre-existing relationships. Such amounts are generally recognized in profit or loss. The consideration transferred includes the fair value of any asset or liability resulting from a contingent consideration arrangement. Any contingent consideration to be transferred by the Company is recognized at fair value at the acquisition date. Subsequent changes to the fair value of the contingent consideration that is deemed to be an asset or liability is recognized in accordance with IAS 39 either in profit or loss or in other comprehensive income. Contingent consideration that is classified as equity is not re-measured, and its subsequent settlement is accounted for within equity.
If the business combination is achieved in stages, the acquisition date carrying value of the acquirer’s previously held equity interest in the acquiree is re-measured to fair value at the acquisition date; any gains or losses arising from such re-measurement are recognized in profit or loss.
19
Cosan Limited
Notes to the consolidated financial statements
(Amounts in thousands of Brazilian Reais – R$, unless otherwise stated)
Goodwill is initially measured as the excess of the aggregate of the consideration transferred and the fair value of non-controlling interest over the net identifiable assets acquired and liabilities assumed. If this consideration is lower than the fair value of the net assets of the subsidiary acquired, the difference is recognized in profit or loss as a bargain purchase gain.
Transactions costs, other than those associated with the issue of debt or equity securities, that the Company incurs in connection with a business combination are expensed as incurred.
| b) | Non-controlling interests |
For each business combination, the Company elects to measure any non-controlling interests in the acquiree either:
| · | at fair value; or |
| · | at their proportionate share of the acquiree’s identifiable net assets, which are generally at fair value. |
Transactions with non-controlling interests that do not result in loss of control are accounted for as equity transactions – that is, as transactions with the owners in their capacity as owners.
| c) | Subsidiaries |
Subsidiaries are all entities (including structured entities) over which the Company has control. The Company controls an entity when is exposed to, or has rights to, variable returns from its involvement with the entity and has the ability to affect those returns through its power over the entity.
Subsidiaries are fully consolidated from the date of acquisition of control, and continue to be consolidated until the date that control ceases to exist. They are deconsolidated from the date that control ceases.
The financial statements of subsidiaries are prepared for the same reporting period as that of the parent company, using consistent accounting policies.
| d) | Investments in associates (equity method investees) |
Associates are those entities in which the Company has significant influence, but not control or joint control, over the financial and operating policies. Significant influence is presumed to exist when the Company holds between 20% and 50% of the voting power of another entity.
Investments in associates are accounted for under the equity method and are recognized initially at cost. The cost of the investment includes transaction costs.
The financial statements include the Company’s share of the profit or loss and other comprehensive income of equity method investees, after adjustments to align the accounting policies with those of the Company.
20
Cosan Limited
Notes to the consolidated financial statements
(Amounts in thousands of Brazilian Reais – R$, unless otherwise stated)
When the Company’s share of losses exceeds its interest in an equity method investee, the carrying amount of the investment, including any long-term interests that form part thereof, is reduced to zero, and the recognition of further losses is discontinued except to the extent that the Company has an obligation or has made payments on behalf of the investee.
| e) | Investments in joint ventures (equity method investees) |
The Company has interests in joint ventures, in which contractual arrangement establishes joint control over the voting and economic activities of the entity. The contractual arrangements require unanimous agreement for financial and operating decisions among the ventures. The Company recognizes its interest in the joint ventures using the equity method (Note 13).
| f) | Transactions eliminated on consolidation |
Intra-group balances and transactions, and any unrealized income and expenses arising from intra-group transactions, are eliminated in preparing the consolidated financial statements.
Unrealized gains arising from transactions with equity accounted investees are eliminated against the investment to the extent of the Company’s interest in the investee. Unrealized losses are similarly eliminated, but only to the extent that there is no evidence of impairment.
3.2 Foreign currency
| a) | Foreign currency transactions |
Transactions in foreign currencies are translated to the respective functional currencies of the each subsidiary using the exchange rates at the dates of the transactions. Monetary assets and liabilities denominated in foreign currencies at the reporting date are translated to the functional currency using the exchange rate at the reporting date.
Translation differences on non-monetary assets and liabilities held at fair value through profit or loss are recognized in profit or loss as part of the fair value gain or loss. Non-monetary items that are measured based on historical cost in a foreign currency are translated using the exchange rate at the date of the transaction.
Foreign currency translation effects are generally recognized in profit or loss. However, foreign currency translation effects arising from the translation of the following items are recognized in other comprehensive income:
| · | available-for-sale equity investments (except an impairment is recognized in which case foreign currency differences that have been recognized in other comprehensive income are reclassified to profit or loss); or |
| · | qualifying cash flow hedges to the extent the hedge is effective. |
| b) | Foreign operations |
The assets and liabilities derived from foreign operations, including goodwill and fair value adjustments arising on acquisition, are translated to Brazilian Reais using the exchange rates
21
Cosan Limited
Notes to the consolidated financial statements
(Amounts in thousands of Brazilian Reais – R$, unless otherwise stated)
at the reporting date. Income and expenses of foreign operations are translated to Brazilian Reais using the exchange rates at the dates of the transactions.
Foreign currency differences are recognized in other comprehensive income, and presented in the foreign currency translation reserve (translation reserve) in equity. However, if the foreign operation is a non-wholly owned subsidiary, then the relevant proportion of the translation difference is allocated to non-controlling interests. When a foreign operation is disposed of such that control, significant influence or joint control is lost, the cumulative amount in the translation reserve related to that foreign operation is reclassified to profit or loss as part of the gain or loss on disposal. When the Company disposes of only part of its interest in a subsidiary that includes a foreign operation while retaining control, the relevant proportion of the cumulative amount is reattributed to non-controlling interests.
| c) | Translation of subsidiaries and associates’ financial statements |
These consolidated financial statements have been translated to the Brazilian Real using the following criteria:
| · | assets and liabilities have been translated using the exchange rate at the balance sheet date; |
| · | statement of profit or loss, comprehensive income and statement of cash flows have been translated using the monthly average exchange rate; and |
| · | shareholders' equity has been translated using the historical exchange rate. |
Translation effects have been recognized in shareholders' equity in "Cumulative translation adjustment".
The consolidated financial statements of each subsidiary included in these consolidated financial statements and equity method investments are prepared based on their respective functional currencies. For subsidiaries whose functional currency is a currency other than the Brazilian Real, asset and liability accounts are translated into the Company’s reporting currency using exchange rates in effect at the date of the statement of financial position, and income and expense items are translated using monthly average exchange rates and shareholders’ equity has been translated using the historical exchange rate. The resulting translation adjustments are reported in a separate component of shareholders’ equity, as cumulative translation adjustment.
The exchange rate of the Brazilian Real (R$) to the U.S. Dollar (US$) was R$ 2.6562 at December 31, 2014, R$ 2.3426 at December 31, 2013 and R$ 2.0138 at March 31, 2013.
3.3 Financial instruments
| a) | Non-derivative financial assets |
The Company initially recognizes loans and receivables on the date that they are originated. All other financial assets (including assets designated as at fair value through profit or loss) are recognized initially on the trade date, which is the date that the Company becomes a party to the contractual provisions of the instrument.
22
Cosan Limited
Notes to the consolidated financial statements
(Amounts in thousands of Brazilian Reais – R$, unless otherwise stated)
The Company derecognizes a financial asset when the contractual rights to the cash flows from the asset expire, or it transfers the rights to receive the contractual cash flows in a transaction in which substantially all the risks and rewards of ownership of the financial asset are transferred. Any interest in such transferred financial assets that is created or retained by the Company is recognized as a separate asset or liability.
Financial assets and liabilities are offset and the net amount presented in the statement of financial position when, and only when, the Company has a legal right to offset the amounts and intends either to settle them on a net basis or to realize the asset and settle the liability simultaneously.
The Company classifies non-derivative financial assets into the following categories: financial assets at fair value through profit or loss, held-to-maturity financial assets, loans and receivables and available-for-sale financial assets.
| I. | Financial assets at fair value through profit or loss |
A financial asset is classified at fair value through profit or loss if it is classified as held-for trading or is designated as such on initial recognition. Financial assets are designated at fair value through profit or loss if the Company manages such investments and makes purchase and sale decisions based on their fair value in accordance with the Company’s documented risk management or investment strategy. Attributable transaction costs are recognized in profit or loss as incurred. Financial assets at fair value through profit or loss are measured at fair value and changes therein, which takes into account any dividend income, are recognized in profit or loss.
Financial assets classified as held-for-trading comprise short-term sovereign debt securities actively managed by the Company’s treasury department to address short-term liquidity needs.
Financial assets designated at fair value through profit or loss comprise equity securities that otherwise would have been classified as available-for-sale.
| II. | Held-to-maturity financial assets |
Non-derivative financial assets with fixed or determinable payments and fixed maturities are classified as held-to maturity when the Company has the intention and ability to hold them to maturity. Interest, indexation charges/credits, foreign exchange gain/losses, less impairment losses, if any, are recognized in income when incurred, as financial income/expense.
Held-to-maturity financial assets comprise debentures. Subsequent to initial recognition, held-to-maturity financial assets are measured at amortized cost.
23
Cosan Limited
Notes to the consolidated financial statements
(Amounts in thousands of Brazilian Reais – R$, unless otherwise stated)
| III. | Loans and receivables |
Loans and receivables are financial assets with fixed or determinable payments that are not quoted in an active market. Such assets are recognized initially at fair value plus any directly attributable transaction costs. Subsequent to initial recognition, loans and receivables are measured at amortized cost using the effective interest method, less any impairment losses.
Loans and receivables comprise cash and cash equivalents, and trade and other receivables.
| IV. | Available-for-sale financial assets |
Available-for-sale financial assets are non-derivative financial assets that are designated as available for-sale or are not classified in any of the above categories of financial assets. Available-for-sale financial assets are recognized initially at fair value plus any directly attributable transaction costs.
Subsequent to initial recognition, the financial assets are measured at fair value and changes therein, other than impairment losses and foreign currency gain/losses on available-for-sale debt instruments, are recognized in other comprehensive income and presented in the fair value reserve in equity. When an investment is derecognized, the gain or loss accumulated in equity is reclassified to profit or loss.
Available-for-sale financial assets comprise equity securities and debt securities.
| b) | Cash and cash equivalents |
Cash and cash equivalents comprise cash balances, call deposits and highly liquid short-term investments with maturities of three months or less from the acquisition date that are subject to an insignificant risk of changes in their fair value, and are used by the Company in the management of its short-term commitments.
| c) | Non-derivative financial liabilities |
The Company initially recognizes debt securities issued and subordinated liabilities on the date that they are originated. All other financial liabilities are recognized initially on the trade date, which is the date that the Company becomes a party to the contractual provisions of the instrument.
The Company derecognizes a financial liability when its contractual obligations are discharged, cancelled or expire.
The Company classifies non-derivative financial liabilities as other financial liabilities. Such financial liabilities are initially recognized at fair value less any directly attributable transaction costs. Subsequent to initial recognition, these financial liabilities are measured at amortized cost using the effective interest method.
Other financial liabilities comprise loans and borrowings, debt securities issued (including certain preference shares), bank overdrafts, and trade and other payables.
Bank overdrafts, which are repayable on demand, form an integral part of the Company’s cash management and, when outstanding, are included as a component of cash and cash equivalents.
24
Cosan Limited
Notes to the consolidated financial statements
(Amounts in thousands of Brazilian Reais – R$, unless otherwise stated)
Interest paid is disclosed as financing activities in the statements of cash flows.
| d) | Derivative financial instruments, including hedge accounting |
The Company holds derivative financial instruments to hedge its foreign currency and interest rate risk exposures. Embedded derivatives are separated from the host contract and accounted for separately if:
| · | The economic characteristics and risks of the host contract and the embedded derivative are not closely related; |
| · | A separate instrument with the same terms as the embedded derivative would meet the definition of a derivative; and |
| · | The combined instrument is not measured at fair value through profit or loss. |
On initial designation of the derivative as a hedging instrument, the Company formally documents the relationship between the hedging instrument and hedged item, including the risk management objectives and strategy in undertaking the hedge transaction and the hedged risk, together with the methods that will be used to assess the effectiveness of the hedging relationship. The Company makes an assessment, both at the inception of the hedge relationship as well as on an ongoing basis, of whether the hedging instruments are expected to be highly effective in offsetting the changes in the fair value or cash flows of the respective hedged items attributable to the hedged risk, and whether the actual results of each hedge are within a range of 80% – 125%. For a cash flow hedge of a forecast transaction, the transaction should be highly probable to occur and should present an exposure to variations in cash flows that ultimately could affect reported profit or loss.
Derivatives are initially recognized at fair value; any attributable transaction costs are recognized in profit or loss as incurred. Subsequent to initial recognition, derivatives are measured at fair value, and changes therein are accounted for as described below:
| I. | Cash flow hedges |
When a derivative is designated as the hedging instrument in a hedge of the variability in cash flows attributable to a particular risk associated with a recognized asset or liability or a highly probable forecast transaction that could affect profit or loss, the effective portion of changes in the fair value of the derivative is recognized in other comprehensive income and presented in the hedging reserve in equity. Any ineffective portion of changes in the fair value of the derivative is recognized immediately in profit or loss.
When the hedged item is a non-financial asset, the amount accumulated in equity is retained in other comprehensive income and reclassified to profit or loss in the same period or periods during which the non-financial item affects profit or loss. If the hedging instrument no longer meets the criteria for hedge accounting, expires or is sold, terminated or exercised, or the designation is revoked, then hedge accounting
25
Cosan Limited
Notes to the consolidated financial statements
(Amounts in thousands of Brazilian Reais – R$, unless otherwise stated)
is discontinued prospectively. If the forecast transaction is no longer expected to occur, then the balance in equity is reclassified to profit or loss.
| II. | Fair value hedge |
Changes in fair value of derivatives, that are designated and qualify as fair value hedge, are recorded in the statement of profit or loss, with any changes in fair value of the hedged asset or liability that are attributable to the hedged risk. The Company applies hedge accounting for fair value hedges to protect itself against the risk of changes in interest rates and foreign exchange rates on loans. The gain or loss related to the effective portion of interest rate swaps to protect against fixed rate borrowings is recognized in the statement of profit and loss as "Financial expenses". The gain or loss related to the ineffective portion is recognized in the statement of profit or loss as "Other gains (losses), net". Changes in fair value of fixed rate borrowings hedged attributable to interest rate risk are recognized in the statement of profit or loss as "Financial expenses".
If the hedge no longer meets the criteria for hedge accounting, the adjustment to the carrying amount of a hedged item for which the method of effective interest rate is used, is amortized to income over the period to maturity.
| III. | Embedded derivatives |
Changes in the fair value of separated embedded derivatives are recognized immediately in profit or loss.
| IV. | Other derivative financial instruments |
When a derivative financial instrument is not designated in a hedge relationship and does not qualify for hedge accounting, all changes in its fair value are recognized immediately in profit or loss.
3.4 Inventory
Inventory is recorded at the lower of average cost of acquisition or production and net realizable value.
Net realizable value is the estimated selling price in the ordinary course of business, less applicable variable selling expenses.
Provisions for slow-moving or obsolete inventory are recorded when deemed necessary by management. The cost of finished goods and work in progress comprises raw materials, direct labor, other direct costs and related production overheads (based on normal operating capacity). It excludes borrowing costs.
3.5 Non-current assets held for sale and discontinued operations
Assets are classified as held for sale when their carrying amount is to be recovered principally through a sale transaction and a sale is considered highly probable. They are measured at the lower of their carrying value or fair value less costs to sell. Any loss in the value of a group of assets
26
Cosan Limited
Notes to the consolidated financial statements
(Amounts in thousands of Brazilian Reais – R$, unless otherwise stated)
classified as held for sale is initially allocated to goodwill and then to remaining assets and liabilities on a pro rata basis, except that no loss is allocated to inventories, financial assets, deferred tax assets, pension plan assets and investment property. Losses recognized upon classification as held for sale and subsequent gains and losses are recognized in profit or loss. Gains are not recognized in excess of any cumulative impairment loss previously recognized.
3.6 Investment property
Agricultural land is stated at fair value, with changes in fair value recognized in profit or loss.
Sale of farms are not recognized in profit or loss until (i) the sale is concluded, (ii) the Company determines that sale receipt is probable; (iii) the revenue can be reliably measured, and (iv) the Company has transferred the ownership risks to the buyer, without any continuing involvement. The gain from sale of farms is reported in the statement of profit or loss in “Other income (expense), net” for the difference between the consideration received and the carrying amount of the farm sold.
The fair value of agricultural land was determined based on the method of direct comparison of data from the market, using transactions involving comparable properties (property type, location, and quality of the property) observed in the market (Level 2). The methodology used for determining the fair value considers direct comparisons of market information, such as market research, homogenization of values, prices, recent sales, distances, facilities, access to land, topography and soil, land use (culture), rainfall level, among others according to the norms issued by the Brazilian standards institute, ABNT - Associação Brasileira de Normas Técnicas. The portfolio is valued annually by independent experts and reviewed periodically by internal professionals technically qualified to perform such appraisals.
3.7 Property, plant and equipment
| a) | Recognition and measurement |
Items of property, plant and equipment are measured at cost less accumulated depreciation and any accumulated impairment losses.
Cost includes expenditures that are directly attributable to the acquisition of the asset. The cost of constructed assets includes:
| · | the cost of materials and direct labor; |
| · | any other costs directly attributable to bringing the assets to a working condition for their intended use; |
| · | an estimate of the costs of dismantling and removing the items and restoring the site on which they are located, when the Company has an obligation to remove the asset or restore the site; and |
| · | capitalized borrowing costs. |
Cost also includes transfers from equity of any gain or loss on qualifying cash flow hedges of foreign currency purchases of property, plant and equipment. Purchased software that is integral to the functionality of the related equipment is capitalized as part of that equipment.
27
Cosan Limited
Notes to the consolidated financial statements
(Amounts in thousands of Brazilian Reais – R$, unless otherwise stated)
When components of an item of property, plant and equipment have different useful lives, they are accounted for as separate items (major components) of property, plant and equipment.
Any gain or loss on disposal of an item of property, plant and equipment, calculated as the difference between the net proceeds from disposal and the carrying amount of the item, is recognized in profit or loss.
| b) | Reclassification to investment property |
When the use of a property changes from held to use to investment property, the property is remeasured at fair value and reclassified as investment property. Any gain or loss arising on this remeasurement is recognized in equity.
| c) | Subsequent costs |
Subsequent expenditure is capitalized only when it is probable that the future economic benefits associated with the expenditure will flow to the Company. Ongoing repairs and maintenance are expensed as incurred.
| d) | Depreciation |
Items of property, plant and equipment are depreciated from the date they are available for use or, in respect of constructed assets, from the date that the asset is completed and ready for use.
Depreciation is calculated on the carrying value of property, plant and equipment less their estimated residual values using the straight-line basis over their estimated useful lives. Depreciation is generally recognized in profit or loss, unless it is capitalized as part of the cost of another asset. Assets recognized under finance leases are depreciated over the shorter of the lease term and their useful lives unless it is reasonably certain that the Company will obtain ownership by the end of the lease term. Land is not depreciated.
Annual depreciation rates are shown below:
| Buildings and Improvements | 4% |
| Machinery, Equipment and Facilities | 3% to 10% |
| Airplanes, Vessels and Vehicles | 10% to 20% |
| Railcars | 2.90% |
| Locomotives | 3.30% |
| Furniture and Fixtures | 10% |
| Computer Equipment | 20% |
Costs of normal periodic maintenance are recorded as expenses when incurred when the components will not improve the production capacity or introduce improvements to the equipment.
Depreciation methods, useful lives and residual values are revised at each reporting date and adjusted if appropriate.
28
Cosan Limited
Notes to the consolidated financial statements
(Amounts in thousands of Brazilian Reais – R$, unless otherwise stated)
3.8 Intangible assets and goodwill
| a) | Goodwill |
Goodwill is measured at cost less accumulated impairment losses. With respect to equity method investees, the carrying amount of goodwill is included in the carrying amount of the investment, and any impairment loss is allocated to the carrying amount of the equity method investee as a whole.
| b) | Other intangible assets |
Other intangible assets that are acquired by the Company and have a finite life are measured at cost less accumulated amortization and any accumulated impairment losses.
| c) | Subsequent expenditure |
Subsequent expenditures are capitalized only when it increases the future economic benefits embodied in the specific asset to which it relates. All other expenditures are recognized in profit or loss as incurred.
| d) | Amortization |
Except for goodwill, intangible assets are amortized on a straight-line basis over their estimated useful lives, from the date that they are available for use or acquired.
Amortization methods, useful lives and residual values are reviewed at each reporting date and adjusted if appropriate.
| e) | Contracts with customers |
Costs incurred on COMGÁS’s development of gas systems for new clients (including pipelines, valves, and general equipment) are recognized as intangible assets and amortized over the contract period.
| f) | Intangible assets related to the gas concession agreement |
COMGÁS entered into a public concession agreement for the distribution of gas granted by the Conceding Authority. At the end of the concession the Conceding Authority will hold a significant portion of the infrastructure. It also controls what services must be rendered and regulates the prices charged. The concession agreement grants COMGÁS the right to charge customers for the supply of gas during the term of the concession agreement. COMGÁS recognizes this right as an intangible asset.
The intangible asset comprises: (i) the concession right recognized upon the business combination of COMGÁS, which is being amortized over the concession period on a straight line basis; and (ii) the acquired or constructed assets underlying the concession necessary for the distribution of gas, which is being depreciated to match the period over which the future economic benefits of the asset are expected to accrue to the Company, or
29
Cosan Limited
Notes to the consolidated financial statements
(Amounts in thousands of Brazilian Reais – R$, unless otherwise stated)
the final term of the concession, whatever occurs first. This period reflects the economic useful lives of each of the underlying assets that comprise the concession. This economic useful life is also used by the regulator, The Natural Gas Agency of the State of São Paulo, to determine the basis for measuring the tariff for rendering the services under the concession.
The concession agreement was signed on May 31, 1999 with an initial term of 30 years. Subject to review by the Conceding Authority, COMGÁS has the option to apply for a 20-year extension for gas distribution services. Contractual conditions necessary for the extension are under control of COMGÁS, as long as it is in compliance with all regulatory commitments. When the concession is terminated, the assets related to the rendering of gas distribution services will be returned to the Conceding Authority, and the Company will be entitled to receive an indemnification to be determined based on assessments and evaluations performed at that time, which may consider the book value of the concession assets.
The concession contract determines that the tariff charged by COMGÁS be reviewed annually, in May, with the aim to realign the tariff charged to consumers to the cost of the gas and adjust for inflation.
3.9 Impairment
| a) | Non-derivative financial assets |
A financial asset not classified as at fair value through profit or loss, including an interest in an equity-accounted investee, is assessed at each reporting date to determine whether there is objective evidence that it is impaired. A financial asset is impaired if there is objective evidence of impairment as a result of one or more events that occurred after the initial recognition of the asset, and that loss event(s) had an impact on the estimated future cash flows of that asset that can be estimated reliably.
Objective evidence that financial assets are impaired includes default or delinquency by a debtor, restructuring of an amount due to the Company on terms that the Company would not consider otherwise, indications that a debtor or issuer will enter bankruptcy, adverse changes in the payment status of borrowers or issuers, economic conditions that correlate with defaults or the disappearance of an active market for a security. In addition, for an investment in an equity security, a significant or prolonged decline in its fair value below its cost is objective evidence of impairment.
| I. | Financial assets measured at amortized cost |
The Company considers evidence of impairment for financial assets measured at amortized cost (loans and receivables and held-to-maturity financial assets) at both a specific asset and collective level. All individually significant assets are assessed for impairment. Those found not to be individually impaired are then collectively assessed for any impairment that has been incurred but not yet identified. Assets that are not individually significant are collectively assessed for impairment by grouping together assets with similar risk characteristics.
In assessing impairment collectively, the Company uses historical trends of the probability of default, the timing of recoveries and the amount of loss incurred,
30
Cosan Limited
Notes to the consolidated financial statements
(Amounts in thousands of Brazilian Reais – R$, unless otherwise stated)
adjusted for management’s judgment as to whether current economic and credit conditions are such that the actual losses are likely to be higher or lower than suggested by historical trends.
An impairment loss in respect of a financial asset measured at amortized cost is calculated as the difference between its carrying amount and the present value of the estimated future cash flows discounted at the asset’s original effective interest rate. Losses are recognized in profit or loss and reflected in an allowance account against loans and receivables or held-to-maturity investment securities. Interest on the impaired asset continues to be recognized. If, in a subsequent period, the impairment loss decreases and the decrease can be related objectively to an event occurring after the impairment was recognized (such as an improvement in the debtor’s credit rating), the reversal of the previously recognized impairment loss is recognized in the statement of profit or loss.
| II. | Available-for-sale financial assets |
Impairment losses on available-for-sale financial assets are recognized by reclassifying the accumulated losses recorded in equity to profit or loss. The cumulative loss that is reclassified from equity to profit or loss is the difference between the acquisition cost, net of any principal repayment and amortization, and the current fair value, less any impairment loss recognized previously in profit or loss. Changes in the cumulative impairment losses attributable to the application of the effective interest method are reflected as a component of interest income. If, in a subsequent periods, the fair value of an impaired available-for-sale financial asset increases and the increase can be related objectively to an event occurring after the impairment loss was recognized, then the impairment loss is reversed in profit or loss. However, any subsequent recovery in the fair value of an impaired available-for-sale financial asset is recognized in other comprehensive income.
An impairment loss with respect to an equity method investee is measured by comparing the recoverable amount of the investment with its carrying amount. An impairment loss is recognized in profit or loss. An impairment loss is reversed if there has been a favorable change in the estimates used to determine the recoverable amount.
| b) | Non-financial assets |
The carrying amounts of the Company’s non-financial assets, except investment property, inventories and deferred tax assets, are reviewed at each reporting date to determine whether there is any indication of impairment. If any such indication exists, then the asset’s recoverable amount is estimated. Goodwill is tested annually for impairment. An impairment loss is recognized if the carrying amount of an asset or cash-generating unit (“CGU”) exceeds its recoverable amount.
The recoverable amount of an asset or CGU is the greater of its value in use and its fair value less costs to sell. In assessing value in use, the estimated future cash flows are discounted to their present value using a pre-tax discount rate that reflects current market assessments of the time value of money and the risks specific to the asset or CGU. For impairment testing, assets are grouped together into the smallest group of assets that
31
Cosan Limited
Notes to the consolidated financial statements
(Amounts in thousands of Brazilian Reais – R$, unless otherwise stated)
generates cash inflows from continuing use that are largely independent of the cash inflows of other assets or CGUs. Subject to an operating segment ceiling test, CGUs to which goodwill has been allocated are aggregated so that the level at which impairment testing is performed reflects the lowest level at which goodwill is monitored for internal reporting purposes. Goodwill acquired in a business combination is allocated to Companies of CGUs that are expected to benefit from the synergies of the combination.
Impairment losses are recognized in profit or loss. Impairment losses recognized for CGUs are allocated first to reduce the carrying amount of any goodwill allocated to the CGU (group of CGUs), and then to reduce the carrying amounts of the other assets in the CGU (group of CGUs) on a pro rata basis.
An impairment loss with respect to goodwill is not reversed. For other assets, an impairment loss is reversed only to the extent that the asset’s carrying amount does not exceed the carrying amount that would have been determined, net of depreciation or amortization, if no impairment loss had been recognized.
3.10 Provisions
A provision is recognized if, as a result of a past event, the Company has a present legal or constructive obligation that can be estimated reliably, and it is probable that an outflow of economic benefits will be required to settle the obligation. Provisions are determined by discounting the expected future cash flows at a pre-tax rate that reflects current market assessments of the time value of money and the risks specific to the liability. The unwinding of the discount is recognized as finance cost.
As of December 31, 2014 and 2013, the Company´s liabilities included R$ 186,649 and R$227,976, respectively, in relation to a contingent consideration arrangement arising from the 2008 Esso business combination (Note 10). This contingent consideration is measured at fair value with changes in fair value recognized in profit or loss. In the year ended December 31, 2014 the Company paid R$ 60,200 under this earn-out arrangement (R$ 49,938 in the year ended March 31, 2013).
The consideration is contingent on meeting certain gross revenue and sales volume targets for ExxonMobil products for a 10-year period from 2008.
3.11 Employee benefits
| a) | Short-term employee benefits |
Short-term employee benefit obligations are measured on an undiscounted basis and are expensed when the related service is provided. A liability is recognized for the amount expected to be paid under short-term cash bonus or profit-sharing plans if the Company has a present legal or constructive obligation to pay these amounts as a result of past services provided by the employee, and the obligation can be estimated reliably.
| b) | Share-based payment transactions |
The grant-date fair value of share-based payment awards granted to employees is recognized as an employee compensation expense, with a corresponding increase in equity, over the period that the employees become unconditionally entitled to the awards. The amount
32
Cosan Limited
Notes to the consolidated financial statements
(Amounts in thousands of Brazilian Reais – R$, unless otherwise stated)
recognized as an expense is adjusted to reflect the number of awards for which the related service and non-market performance conditions are expected to be met, such that the amount ultimately recognized as an expense is based on the number of awards that meet the related service and non-market performance conditions at the vesting date. For share-based payment awards with non-vesting conditions, the grant-date fair value of the share-based payment is measured to reflect such conditions and there is no true-up for differences between expected and actual outcomes.
The fair value of the amount payable to employees with respect to share appreciation rights, which are settled in cash, is recognized as an expense with a corresponding increase in liabilities, over the period that the employees become unconditionally entitled to the cash payment. The liability is remeasured at each reporting date and at settlement date based on the fair value of the share appreciation rights. Any changes in the liability are recognized as employee benefit expenses in profit or loss.
| c) | Defined contribution plans |
A defined contribution plan is a post-employment benefit plan under which an entity pays fixed contributions into a separate entity and has no legal or constructive obligation to pay further amounts. Obligations for contributions to defined contribution plans are recognized as an employee benefit expense in profit or loss in the periods during which related services are rendered by employees. Prepaid contributions are recognized as an asset to the extent that a cash refund or a reduction in future payments is available. Contributions to a defined contribution plan that are due more than 12 months after the end of the period in which the employees render the service are discounted to their present value.
| d) | Defined benefit plans |
The Company, through its indirect subsidiaries Cosan Lubrificantes Especialidades S.A. (“CLE”) and COMGÁS is the sponsor of defined benefit pension plans for some of its employees. The cost of providing benefits under the defined benefit plan is determined annually by independent actuaries using the projected unit credit method.
A defined benefit plan is a post-employment benefit plans other than a defined contribution plan. The Company’s net obligation with respect to defined benefit plans is calculated separately for each plan by estimating the amount of future benefit that employees have earned in return for their service in the current and prior periods. That benefit is discounted to determine its present value. Any unrecognized past service costs and the fair value of any plan assets are deducted. The discount rate is the yield at the reporting date of the financial statements for the high quality government bonds, and maturity dates approximating the terms of the Company’s obligations and that are denominated in the currency in which the benefits are expected to be paid.
The Company recognizes all actuarial gains and losses arising from defined benefit plans immediately in other comprehensive income and all expenses related to defined benefit plans in employee benefit expense in profit or loss.
The Company recognizes gains and losses on the curtailment or settlement of a defined benefit plan when the curtailment or settlement occurs. A curtailment occurs when the Company: (a) is demonstrably committed to make a significant reduction in the number of
33
Cosan Limited
Notes to the consolidated financial statements
(Amounts in thousands of Brazilian Reais – R$, unless otherwise stated)
employees covered by a plan; or (b) amend the terms of a defined benefit plan so that a significant element of future service by current employees will no longer qualify for benefits or will qualify only for reduced benefits. The gain or loss on curtailment or settlement comprises any resulting change in the fair value of plan assets, any change in the present value of the defined benefit obligation, any related actuarial gains and losses and past service cost that had not previously been recognized.
| e) | Other long-term employee benefit |
The Company’s net obligation in respect of long-term employee benefits other than pension plans is the amount of future benefit that employees have earned in return for their service in the current and prior periods. That benefit is discounted to determine its present value, and the fair value of any related assets is deducted. The discount rate is the yield at the reporting date of the financial statements for the high credit quality bonds, and maturity dates approximating the terms of the Company’s obligations and that are denominated in the currency in which the benefits are expected to be paid. The calculation is performed using the projected unit credit method. Any actuarial gains and losses are recognized in profit or loss in the period in which they arise.
3.12 Revenue
| a) | Sales of goods |
Revenue from the sale of goods, in the ordinary course of business, is measured at the fair value of the consideration received or receivable, net of returns, trade discounts and volume rebates. Revenue is recognized when significant risks and rewards of ownership have been transferred to the customer, recovery of the consideration is probable, the associated costs and possible return of goods can be estimated reliably, there is no continuing management involvement with the goods, and the amount of revenue can be measured reliably. If it is probable that discounts will be granted and the amount can be measured reliably, then the discount is recognized as a reduction of revenue as the sales are recognized.
| b) | Services rendered |
Revenues from services are recognized when the amount of revenue can be measured reliably, when it is probable that the economic benefits associated with the transaction will flow to the Company, when the stage of completion of the transaction at the end of the reporting period can be measured reliably, as well as when its amount and related costs can be measured reliably. Service prices are established based on service orders or contracts. Services for which payment is made in advance are recorded as deferred revenue in other liabilities and recognized in revenue when the services are rendered.
COMGÁS revenue recognizes revenue as follows:
| I. | Billed revenue |
Revenue from gas distribution services is recognized when its amount can be reliably measured, and is recognized in profit or loss when the volumes are delivered to customers.
34
Cosan Limited
Notes to the consolidated financial statements
(Amounts in thousands of Brazilian Reais – R$, unless otherwise stated)
| II. | Unbilled revenue |
Unbilled gas refers to the portion of gas supplied for which metering and billing to customers have not yet occurred. This amount is estimated based on the period between measurement and the last day of the month.
The actual volume billed may be different from estimates. The Company believes that, based on experience, the unbilled estimated amount will not significantly differ from actual amounts.
| III. | Concession construction revenue |
The construction of the infrastructure necessary for gas distribution is considered a construction service rendered to the Conceding Authority, and the related income is recognized in profit or loss at fair value.
Construction costs are recognized by reference to the stage of completion of the construction activity at the end of the reporting period, and are included in cost of sales.
3.13 Leases
| a) | Leased assets |
Assets held by the Company under leases which transfer to the Company substantially all of the risks and rewards of ownership are classified as finance leases. On initial recognition, the leased asset is measured at an amount equal to the lower of its fair value and the present value of the minimum lease payments. Subsequent to initial recognition, the asset is accounted for in accordance with the accounting policy applicable to that asset.
Assets leased under operating leases are not recognized in the Company’s statement of financial position.
| b) | Leased payments |
Payments made under operating leases are recognized in profit or loss on a straight-line basis over the term of the lease. Lease incentives received are recognized as an integral part of the total lease expense, over the term of the lease.
Minimum lease payments made under finance leases are apportioned between the finance expense and the reduction of the outstanding liability. The finance expense is allocated to each period during the lease term so as to produce a constant periodic rate of interest on the remaining balance of the liability.
3.14 Finance income and finance expense
Finance income comprises interest income on funds invested (including available-for-sale financial assets), dividend income, gains on the disposal of available-for-sale financial assets, fair value gains on financial assets at fair value through profit or loss, gains on the remeasurement to fair value of any pre-existing interest in an acquiree in a business combination, gains on hedging instruments that
35
Cosan Limited
Notes to the consolidated financial statements
(Amounts in thousands of Brazilian Reais – R$, unless otherwise stated)
are recognized in profit or loss and reclassifications of net gains previously recognized in other comprehensive income. Interest income is recognized as it accrues in profit or loss, using the effective interest method. Dividend income is recognized in profit or loss on the date that the Company’s right to receive payment is established, which in the case of quoted securities is normally the ex-dividend date.
Finance expense comprise interest expense on borrowings, unwinding of the discount on provisions and deferred consideration, losses on disposal of available-for-sale financial assets, dividends on preference shares classified as liabilities, fair value losses on financial assets at fair value through profit or loss and contingent consideration, impairment losses recognized on financial assets (other than trade receivables), losses on hedging instruments that are recognized in profit or loss and reclassifications of net losses previously recognized in other comprehensive income.
Borrowing costs that are not directly attributable to the acquisition, construction or production of a qualifying asset are recognized in profit or loss using the effective interest method.
Foreign currency gains and losses on financial assets and financial liabilities are reported on a net basis as either finance income or finance cost depending on whether the net foreign currency fluctuations result in a gain or loss position.
3.15 Tax
Income taxes are comprised of income tax and social contribution at a combined rate of 34%. Tax expense comprises current and deferred tax. Current tax and deferred tax is recognized in profit or loss except to the extent that it relates to a business combination, or items recognized directly in equity or in other comprehensive income.
Certain subsidiaries measure income tax and social contribution due under the Brazilian presumed profits regime. The presumed profit came up from a percentage of 32% of operating revenues. Under the aforementioned regime the applicable tax rate is for income tax is 15% over the presumed profit, plus an additional 10% when operating revenues exceed of R$ 240, and 9% over the presumed profit for social contribution.
| a) | Current tax |
Current tax is the expected tax payable or receivable on the taxable income or loss for the year, using tax rates enacted or substantively enacted at the reporting date, and any adjustment to tax payable in respect of previous years. Current tax payable also includes any tax liability arising from the declaration of dividends.
| b) | Deferred tax |
Deferred tax is recognized in respect of temporary differences between the carrying amounts of assets and liabilities for financial reporting purposes and the amounts used for taxation purposes and tax loss. Deferred tax is not recognized for:
36
Cosan Limited
Notes to the consolidated financial statements
(Amounts in thousands of Brazilian Reais – R$, unless otherwise stated)
| · | temporary differences on the initial recognition of assets or liabilities in a transaction that is not a business combination and that affects neither accounting nor taxable profit or loss; |
| · | temporary differences related to investments in subsidiaries, associates and joint ventures to the extent that the Company is able to control the timing of the reversal of the temporary differences and it is probable that they will not reverse in the foreseeable future; and |
| · | taxable temporary differences arising on the initial recognition of goodwill. |
The measurement of deferred tax reflects the manner in which the Company expects, at the end of the reporting period, to recover or settle the carrying amount of its assets and liabilities. For investment property that is measured at fair value, the presumption that the carrying amount of the investment property will be recovered through sale has not been rebutted.
Deferred tax is measured at the tax rates that are expected to be applied to temporary differences when they reverse, using tax rates enacted or substantively enacted at the reporting date.
Deferred tax assets and liabilities are offset if there is a legally enforceable right to offset current tax liabilities and assets, and they relate to taxes levied by the same tax authority on the same taxable entity, or on different tax entities, but they intend to settle current tax liabilities and assets on a net basis or their tax assets and liabilities will be realized simultaneously.
A deferred tax asset is recognized for loss carryforwards, tax credits and deductible temporary differences to the extent that it is probable that future taxable income will be generated in the future. Deferred tax assets are reviewed at each reporting date and written off to the extent that it is no longer probable that the related tax benefit will be realized.
| c) | Sales taxes |
Net revenue is recognized net of discounts and sales taxes.
| d) | Tax exposures |
In determining the amount of current and deferred tax, the Company takes into account the impact of uncertain tax positions and whether additional taxes and interest may be due. This assessment relies on estimates and assumptions and may involve a series of judgments about future events. New information may become available that causes the Company to change its judgment regarding the adequacy of existing tax liabilities; such changes to tax liabilities will impact tax expense in the period that such a determination is made.
| 4 | Changes in accounting policies |
4 .1 New standards and interpretations not yet adopted
A number of new standards and amendments to standards and interpretations are effective for annual periods beginning after January 1, 2015, and have not been applied in preparing these consolidated financial statements. None of these is expected to have a significant effect on the consolidated financial statements of the Company, except the following:
37
Cosan Limited
Notes to the consolidated financial statements
(Amounts in thousands of Brazilian Reais – R$, unless otherwise stated)
| I. | IFRS 9, ‘Financial instruments’, addresses the classification, measurement and recognition of financial assets and financial liabilities. IFRS 9 was issued in November 2009 and October 2010. IFRS 9 requires financial assets to be classified into two measurement categories: those measured as at fair value and those measured at amortized cost. The determination is made at initial recognition. For financial liabilities, the main change is that, in cases where the fair value option is taken for financial liabilities, the part of a fair value change due to an entity’s own credit risk is recorded in other comprehensive income rather than the statement of profit or loss, unless this creates an accounting mismatch. The Company has yet to assess IFRS 9’s full impact. The Company will also consider the impact of the remaining phases of IFRS 9 when completed by the Board. |
IFRS 9 is effective for annual reporting periods beginning on or after January 1, 2018, with early adoption permitted.
| II. | IFRS 15, ‘Revenue from contracts with customers’ deals with revenue recognition and establishes principles for reporting useful information to users of financial statements about the nature, amount, timing and uncertainty of revenue and cash flows arising from an entity’s contracts with customers. Revenue is recognized when a customer obtains control of a good or service and thus has the ability to direct the use and obtain the benefits from the good or service. The standard replaces IAS 18 ‘Revenue’ and IAS 11 ‘Construction contracts’ and related interpretations. The standard is effective for annual periods beginning on or after January 1, 2017 and earlier application is permitted. The Company is currently assessing the potential impacts of adopting IFRS 15. |
| III. | IAS 41 - Agriculture - This standard currently requires that biological assets related to agricultural activity are measured at fair value less costs to sell. IASB has determined that “bearer plants” should be accounted for as property, plant and equipment (IAS 16), i.e., at cost less depreciation or impairment provision. The standard is effective for annual reporting beginning on or after January 1, 2016 with early adoption permitted. The Company is assessing the potential impacts of adopting IAS 41. |
| IV. | IFRIC 21, ‘Levies’, sets out the accounting for an obligation to pay a levy that is not income tax. The interpretation addresses what the obligating event is that gives rise to pay a levy and when should a liability be recognized. The Company is not currently subject to significant levies therefore it does not expect that the application of the new standard will have a material impact on the Company’s consolidated financial statements. |
There are no other Standards or Interpretations that are not yet effective that would be expected to have a material impact on the Company.
4.2 Correction of an error
During 2014, the Company identified an immaterial mathematical error in the calculation of diluted earnings per share impacting the nine-months period ended December 31, 2013 and the year ended March 31, 2013. The error consisted of a mathematical inaccurate calculation on the monetary effect of dilution on the profit attributable to shareholders of the parent.
38
Cosan Limited
Notes to the consolidated financial statements
(Amounts in thousands of Brazilian Reais – R$, unless otherwise stated)
The diluted earnings per share from continuing operations for the nine-month period ended December 31, 2013 and the year ended March 31, 2013 were originally presented, in error, as R$ 0.33 and R$ 1.06, respectivelly. These amounts are being revised on the face of statement of profit or loss and other comprehensive and in the Note 24 as R$0.40 and R$ 1.21, respectively.
| 5 | Operating segments |
Segment information
The following segment information is used by Cosan's senior management (the “Chief Operating Decision Maker”) to assess the performance of the operating segments and to make decisions with regards to the allocation of resources. This information is prepared on a basis consistent with the accounting policies used in the preparation of the financial statements. Cosan evaluates the performance of its operating segments based on the measure of Earnings Before Interest Tax, Depreciation and Amortization (“EBITDA”). A reconciliation of EBITDA to profit (loss) is presented below.
Operating segments
| I. | Raízen Energia: production and marketing of a variety of products derived from sugar cane, including raw sugar (VHP), anhydrous and hydrated ethanol, and activities related to energy cogeneration from sugarcane bagasse. In addition, this segment holds interests in companies engaged in research and development on new technology; |
| II. | Raízen Combustíveis: distribution and marketing of fuels, mainly through a franchised network of service stations under the brand Shell and Esso throughout Brazil; |
| III. | COMGÁS: distribution of piped natural gas to part of the State of São Paulo (approximately 180 municipalities, including the region called Greater São Paulo) to customers in the industrial, residential, commercial, automotive, thermo generation and cogeneration sectors; |
| IV. | Cosan Log: logistics services for transport, storage and port loading of commodities, mainly for sugar products; |
| V. | Radar: management, buying, selling and leasing of agricultural land; |
| VI. | Lubricants: production and distribution of lubricants under the Mobil brand in Brazil, Bolivia, Uruguay and Paraguay, as well as European and Asian market with a Comma trademark; Upon adoption of IFRS 11, whereby the Company no longer proportionally consolidates the results of Raízen Energia and Raízen Combustíveis, the Lubricants segment met the quantitative thresholds to be separately reportable, and the comparative segment information has been adjusted retroactively; and |
| VII. | Other business: other investments, in addition to the corporate activities of the Company. |
Although Raízen Energia and Raízen Combustíveis are equity accounted joint-ventures and are no longer proportionally consolidated since adoption of IFRS 11, senior management continues to review segment information. A reconciliation of these segments is presented in the column “Deconsolidation IFRS 11”.
The following statement of financial position and profit or loss selected information by segment was prepared on the same basis as the accounting practices used in the preparation of consolidated information:
39
Cosan Limited
Notes to the consolidated financial statements
(Amounts in thousands of Brazilian Reais – R$, unless otherwise stated)
| Twelve months ended December 31, 2014 | ||||||||||||||||||||||||||||||||||||||||||||||||||||
| Raízen Energia | Raízen Combustíveis | COMGÁS | Radar | Lubricants | Other business | Deconsolidated effects IFRS 11 | Segment elimination | Cosan Energia | Cosan Log | Cosan Limited | Segment elimination | Total consolidated | ||||||||||||||||||||||||||||||||||||||||
| Statement of profit or loss | ||||||||||||||||||||||||||||||||||||||||||||||||||||
| Net sales | 9,263,930 | 55,733,927 | 6,387,103 | 157,562 | 1,602,198 | - | (64,997,857 | ) | - | 8,146,863 | 915,441 | - | - | 9,062,304 | ||||||||||||||||||||||||||||||||||||||
| Domestic market | 4,064,437 | 55,733,927 | 6,387,103 | 157,562 | 1,306,218 | - | (59,798,364 | ) | - | 7,850,883 | 769,583 | - | - | 8,620,466 | ||||||||||||||||||||||||||||||||||||||
| External market | 5,199,493 | - | - | - | 295,980 | - | (5,199,493 | ) | - | 295,980 | 145,858 | - | - | 441,838 | ||||||||||||||||||||||||||||||||||||||
| Gross profit | 1,528,509 | 2,799,705 | 1,892,194 | 96,918 | 354,392 | - | (4,328,214 | ) | - | 2,343,504 | 305,080 | - | - | 2,648,584 | ||||||||||||||||||||||||||||||||||||||
| Selling expenses | (578,989 | ) | (1,150,516 | ) | (636,316 | ) | - | (245,227 | ) | - | 1,729,505 | - | (881,543 | ) | - | - | - | (881,543 | ) | |||||||||||||||||||||||||||||||||
| General and administrative expenses | (498,756 | ) | (387,259 | ) | (308,413 | ) | (36,525 | ) | (70,684 | ) | (145,840 | ) | 886,015 | - | (561,462 | ) | (87,832 | ) | (19,319 | ) | - | (668,613 | ) | |||||||||||||||||||||||||||||
| Other income (expense), net | 58,609 | 338,143 | (19,494 | ) | 131,593 | 1,032 | (123,626 | ) | (396,752 | ) | - | (10,495 | ) | 7,844 | - | (18,589 | ) | (21,240 | ) | |||||||||||||||||||||||||||||||||
| Financial results | (418,317 | ) | (125,210 | ) | (193,026 | ) | 6,269 | 21,555 | (780,687 | ) | 543,527 | - | (945,889 | ) | (33,652 | ) | (3,307 | ) | - | (982,848 | ) | |||||||||||||||||||||||||||||||
| Financial expense | (588,307 | ) | (142,839 | ) | (300,573 | ) | (1,104 | ) | 22,831 | (707,718 | ) | 731,146 | 12,711 | (973,853 | ) | (66,114 | ) | (20,835 | ) | - | (1,060,802 | ) | ||||||||||||||||||||||||||||||
Financial income | 385,895 | 104,218 | 106,554 | 7,428 | 1,639 | 81,280 | (490,113 | ) | (12,711 | ) | 184,190 | 31,150 | 1,772 | - | 217,112 | |||||||||||||||||||||||||||||||||||||
| Foreign exchange losses, net | (357,928 | ) | (71,825 | ) | (139,931 | ) | (55 | ) | (1,183 | ) | (177,815 | ) | 429,753 | - | (318,984 | ) | 1,312 | 17,151 | - | (300,521 | ) | |||||||||||||||||||||||||||||||
Derivatives | 142,023 | (14,764 | ) | 140,924 | - | (1,732 | ) | 23,566 | (127,259 | ) | - | 162,758 | - | (1,395 | ) | - | 161,363 | |||||||||||||||||||||||||||||||||||
| Equity in earnings of associates | (38,310 | ) | 14,902 | - | - | (7,341 | ) | 429,506 | 23,408 | (418,625 | ) | 3,540 | - | 193,627 | (193,627 | ) | 3,540 | |||||||||||||||||||||||||||||||||||
| Equity in earnings of joint ventures | - | - | - | - | - | 588,428 | - | - | 588,428 | - | - | - | 588,428 | |||||||||||||||||||||||||||||||||||||||
| Income tax (expense) benefit | 103,810 | (410,560 | ) | (203,810 | ) | (17,629 | ) | (18,850 | ) | 254,803 | 306,750 | - | 14,514 | (58,343 | ) | - | - | (43,829 | ) | |||||||||||||||||||||||||||||||||
| Profit (loss) for the year | 156,556 | 1,079,205 | 531,135 | 180,626 | 34,877 | 222,584 | (1,235,761 | ) | (418,625 | ) | 550,597 | 133,097 | 171,001 | (212,216 | ) | 642,479 | ||||||||||||||||||||||||||||||||||||
| Other selected data | ||||||||||||||||||||||||||||||||||||||||||||||||||||
| Depreciation and amortization | 1,966,866 | 538,222 | 506,697 | 970 | 71,268 | 2,923 | (2,505,088 | ) | - | 581,858 | 97,244 | - | - | 679,102 | ||||||||||||||||||||||||||||||||||||||
| EBITDA | 2,437,929 | 2,153,197 | 1,434,668 | 192,956 | 103,441 | 751,389 | (4,591,126 | ) | (418,625 | ) | 2,063,829 | 322,334 | 174,308 | (212,216 | ) | 2,348,255 | ||||||||||||||||||||||||||||||||||||
| Additions to PP&E, intangible | ||||||||||||||||||||||||||||||||||||||||||||||||||||
| and biological assets (cash) | 1,963,642 | 60,425 | 661,311 | 1,146 | 52,178 | 75,194 | (2,024,067 | ) | - | 789,830 | 273,584 | - | - | 1,063,413 | ||||||||||||||||||||||||||||||||||||||
| Reconciliation of EBITDA | ||||||||||||||||||||||||||||||||||||||||||||||||||||
| Profit (loss) for the year | 156,556 | 1,079,205 | 531,135 | 180,626 | 34,878 | 222,583 | (1,235,761 | ) | (418,625 | ) | 550,597 | 133,095 | 171,001 | (212,216 | ) | 642,477 | ||||||||||||||||||||||||||||||||||||
| Income tax and social contribution | (103,810 | ) | 410,560 | 203,810 | 17,629 | 18,850 | (254,803 | ) | (306,750 | ) | - | (14,514 | ) | 58,343 | - | - | 43,829 | |||||||||||||||||||||||||||||||||||
| Financial result, net | 418,317 | 125,210 | 193,026 | (6,269 | ) | (21,555 | ) | 780,687 | (543,527 | ) | - | 945,889 | 33,652 | 3,307 | - | 982,848 | ||||||||||||||||||||||||||||||||||||
| Depreciation and amortization | 1,966,866 | 538,222 | 506,697 | 970 | 71,268 | 2,922 | (2,505,088 | ) | - | 581,857 | 97,244 | - | - | 679,101 | ||||||||||||||||||||||||||||||||||||||
| EBITDA | 2,437,929 | 2,153,197 | 1,434,668 | 192,956 | 103,441 | 751,389 | (4,591,126 | ) | (418,625 | ) | 2,063,829 | 322,334 | 174,308 | (212,216 | ) | 2,348,255 | ||||||||||||||||||||||||||||||||||||
40
Cosan Limited
Notes to the consolidated financial statements
(Amounts in thousands of Brazilian Reais – R$, unless otherwise stated)
| Nine months ended December 31, 2013 | ||||||||||||||||||||||||||||||||||||||||||||||||||||
| Raízen Energia | Raízen Combustíveis | COMGÁS | Radar | Lubricants | Other business | Deconsolidated effects IFRS 11 | Segment elimination | Cosan Energia | Cosan Log | Cosan Limited | Segment elimination | Total consolidated | ||||||||||||||||||||||||||||||||||||||||
| Statement of profit or loss | ||||||||||||||||||||||||||||||||||||||||||||||||||||
| Net sales | 6,850,389 | 37,580,570 | 4,888,895 | 54,732 | 1,185,199 | 38 | (44,430,959 | ) | - | 6,128,864 | 749,350 | - | - | 6,878,214 | ||||||||||||||||||||||||||||||||||||||
| Domestic market | 2,964,443 | 37,580,570 | 4,888,895 | 54,732 | 947,274 | 38 | (40,545,013 | ) | - | 5,890,939 | 676,924 | - | - | 6,567,863 | ||||||||||||||||||||||||||||||||||||||
| External market | 3,885,946 | �� | - | - | - | 237,925 | - | (3,885,946 | ) | - | 237,925 | 72,426 | - | - | 310,351 | |||||||||||||||||||||||||||||||||||||
| Gross profit | 1,260,349 | 1,916,015 | 1,364,700 | 48,674 | 284,668 | 38 | (3,176,364 | ) | - | 1,698,080 | 301,905 | - | - | 1,999,985 | ||||||||||||||||||||||||||||||||||||||
| Selling expenses | (474,116 | ) | (808,095 | ) | (422,416 | ) | - | (181,549 | ) | - | 1,282,211 | - | (603,965 | ) | - | - | - | (603,965 | ) | |||||||||||||||||||||||||||||||||
| General and administrative expenses | (411,600 | ) | (285,904 | ) | (239,262 | ) | (18,369 | ) | (52,552 | ) | (96,288 | ) | 697,504 | - | (406,471 | ) | (57,588 | ) | (2,874 | ) | - | (466,933 | ) | |||||||||||||||||||||||||||||
| Other income (expense), net | (35,209 | ) | 292,211 | (1,599 | ) | 131,191 | (5,488 | ) | (26,485 | ) | (257,002 | ) | - | 97,619 | (14,364 | ) | (6,983 | ) | - | 76,272 | ||||||||||||||||||||||||||||||||
| Financial results | (646,268 | ) | (99,201 | ) | (140,981 | ) | 3,096 | (9,072 | ) | (567,039 | ) | 745,469 | - | (713,996 | ) | 13,689 | (13,405 | ) | - | (713,712 | ) | |||||||||||||||||||||||||||||||
| Financial expense | (346,004 | ) | (63,418 | ) | (163,090 | ) | (668 | ) | (51,689 | ) | (559,434 | ) | 409,422 | 9,008 | (765,873 | ) | (27,975 | ) | (10,758 | ) | - | (804,606 | ) | |||||||||||||||||||||||||||||
Financial income | 186,230 | 69,070 | 44,659 | 3,812 | 23,409 | 75,477 | (255,300 | ) | (9,008 | ) | 138,349 | 41,292 | 263 | - | 179,904 | |||||||||||||||||||||||||||||||||||||
| Foreign exchange losses, net | (370,860 | ) | (181,419 | ) | (162,449 | ) | (48 | ) | 17,351 | (178,975 | ) | 552,279 | - | (324,121 | ) | 372 | (746 | ) | - | (324,495 | ) | |||||||||||||||||||||||||||||||
Derivatives | (115,634 | ) | 76,566 | 139,899 | - | 1,857 | 95,893 | 39,068 | - | 237,649 | - | (2,164 | ) | - | 235,485 | |||||||||||||||||||||||||||||||||||||
| Equity in earnings of associates | (24,075 | ) | 4,826 | - | 29 | (7,812 | ) | 447,769 | 19,249 | (434,489 | ) | 5,497 | - | 145,882 | (145,882 | ) | 5,497 | |||||||||||||||||||||||||||||||||||
| Equity in earnings of joint ventures | - | - | - | - | - | 242,036 | - | - | 242,036 | - | - | - | 242,036 | |||||||||||||||||||||||||||||||||||||||
| Income tax (expense) benefit | 122,199 | (298,084 | ) | (152,740 | ) | (10,230 | ) | (27,176 | ) | 234,119 | 175,885 | - | 43,973 | (83,167 | ) | - | - | (39,194 | ) | |||||||||||||||||||||||||||||||||
| Profit (loss) for the year | (208,720 | ) | 721,768 | 407,702 | 154,391 | 1,019 | 234,150 | (513,048 | ) | (434,489 | ) | 362,773 | 160,475 | 122,620 | (145,882 | ) | 499,986 | |||||||||||||||||||||||||||||||||||
| Other selected data | ||||||||||||||||||||||||||||||||||||||||||||||||||||
| Depreciation and amortization | 1,386,600 | 385,728 | 322,170 | 727 | 55,452 | 1,840 | (1,772,328 | ) | - | 380,189 | 58,955 | - | - | 439,144 | ||||||||||||||||||||||||||||||||||||||
| EBITDA | 1,701,949 | 1,504,781 | 1,023,593 | 162,252 | 92,718 | 568,912 | (3,206,730 | ) | (434,489 | ) | 1,412,986 | 288,907 | 136,025 | (145,882 | ) | 1,692,036 | ||||||||||||||||||||||||||||||||||||
| Additions to PP&E, intangible | ||||||||||||||||||||||||||||||||||||||||||||||||||||
| and biological assets (cash) | 1,513,389 | 681,241 | 677,695 | 60 | 81,353 | 18,965 | (2,194,630 | ) | - | 778,073 | 198,047 | - | - | 976,120 | ||||||||||||||||||||||||||||||||||||||
| Reconciliation of EBITDA | ||||||||||||||||||||||||||||||||||||||||||||||||||||
| Profit (loss) for the period | (208,720 | ) | 721,768 | 407,702 | 154,391 | 1,019 | 234,150 | (513,048 | ) | (434,489 | ) | 362,773 | 160,475 | 122,620 | (145,882 | ) | 499,986 | |||||||||||||||||||||||||||||||||||
| Income tax and social contribution | (122,199 | ) | 298,084 | 152,740 | 10,230 | 27,176 | (234,119 | ) | (175,885 | ) | - | (43,973 | ) | 83,167 | - | - | 39,194 | |||||||||||||||||||||||||||||||||||
| Financial result, net | 646,268 | 99,201 | 140,981 | (3,096 | ) | 9,072 | 567,039 | (745,469 | ) | - | 713,996 | (13,689 | ) | 13,405 | - | 713,712 | ||||||||||||||||||||||||||||||||||||
| Depreciation and amortization | 1,386,600 | 385,728 | 322,170 | 727 | 55,451 | 1,842 | (1,772,328 | ) | - | 380,190 | 58,954 | - | - | 439,144 | ||||||||||||||||||||||||||||||||||||||
| EBITDA | 1,701,949 | 1,504,781 | 1,023,593 | 162,252 | 92,718 | 568,912 | (3,206,730 | ) | (434,489 | ) | 1,412,986 | 288,907 | 136,025 | (145,882 | ) | 1,692,036 | ||||||||||||||||||||||||||||||||||||
41
Cosan Limited
Notes to the consolidated financial statements
(Amounts in thousands of Brazilian Reais – R$, unless otherwise stated)
| Twelve months ended March 31, 2013 | ||||||||||||||||||||||||||||||||||||||||||||||||||||||||
| Raízen Energia | Raízen Combustíveis | COMGÁS | Radar | Lubricants | Other business | Deconsolidated effects IFRS 11 | Segment elimination | Cosan Energia | Cosan Log | Cosan Limited | Segment elimination | Total consolidated | Discontinued operation | |||||||||||||||||||||||||||||||||||||||||||
| Statement of profit or loss | ||||||||||||||||||||||||||||||||||||||||||||||||||||||||
| Net sales | 8,468,238 | 43,532,232 | 2,398,989 | 51,853 | 1,417,474 | 5,117 | (52,000,470 | ) | - | 3,873,433 | 712,776 | - | - | 4,586,209 | 410,677 | |||||||||||||||||||||||||||||||||||||||||
| Domestic market | 3,454,440 | 43,532,232 | 2,398,989 | 51,853 | 1,237,348 | 5,117 | (46,986,672 | ) | - | 3,693,307 | 631,908 | - | - | 4,325,215 | 410,677 | |||||||||||||||||||||||||||||||||||||||||
| External market | 5,013,798 | - | - | - | 180,126 | - | (5,013,798 | ) | - | 180,126 | 80,868 | - | - | 260,994 | - | |||||||||||||||||||||||||||||||||||||||||
| Gross profit | 1,586,321 | 2,333,213 | 660,676 | 50,111 | 366,780 | 5,116 | (3,919,534 | ) | - | 1,082,683 | 292,217 | - | - | 1,374,900 | 56,487 | |||||||||||||||||||||||||||||||||||||||||
| Selling expenses | (638,837 | ) | (1,026,923 | ) | (259,762 | ) | - | (199,671 | ) | - | 1,665,760 | - | (459,433 | ) | - | - | - | (459,433 | ) | (50,285 | ) | |||||||||||||||||||||||||||||||||||
| General and administrative expenses | (490,246 | ) | (361,616 | ) | (127,678 | ) | (14,899 | ) | (72,514 | ) | (127,440 | ) | 851,862 | - | (342,531 | ) | (58,088 | ) | (18,914 | ) | - | (419,533 | ) | (8,217 | ) | |||||||||||||||||||||||||||||||
| Other income (expense), net | 49,837 | 219,520 | (2,221 | ) | 144,344 | (18,570 | ) | 57,678 | (269,357 | ) | - | 181,231 | (7,492 | ) | - | - | 173,739 | 172,586 | ||||||||||||||||||||||||||||||||||||||
| Financial results | (334,399 | ) | (58,632 | ) | (63,701 | ) | 3,058 | 114,654 | (465,057 | ) | 393,031 | - | (411,046 | ) | 189 | (12,256 | ) | - | (423,113 | ) | 10,166 | |||||||||||||||||||||||||||||||||||
| Financial expense | (198,174 | ) | (96,058 | ) | (92,178 | ) | (1,421 | ) | (39,976 | ) | (398,734 | ) | 294,232 | - | (532,309 | ) | (35,567 | ) | (10,129 | ) | - | (578,005 | ) | - | ||||||||||||||||||||||||||||||||
Financial income | 185,572 | 133,362 | 16,894 | 4,484 | 43,332 | 63,153 | (318,934 | ) | - | 127,863 | 35,658 | 142 | - | 163,663 | 10,166 | |||||||||||||||||||||||||||||||||||||||||
| Foreign exchange losses, net | (266,135 | ) | (93,841 | ) | (297 | ) | (5 | ) | 105,712 | (186,493 | ) | 359,976 | - | (81,083 | ) | 98 | (2,269 | ) | - | (83,254 | ) | - | ||||||||||||||||||||||||||||||||||
Derivatives | (55,662 | ) | (2,095 | ) | 11,880 | - | 5,586 | 57,017 | 57,757 | - | 74,483 | - | - | - | 74,483 | - | ||||||||||||||||||||||||||||||||||||||||
| Equity in earnings of associates | (23,107 | ) | - | - | - | (111 | ) | 427,732 | 23,107 | (245,769 | ) | 181,852 | - | - | (111,438 | ) | 70,414 | - | ||||||||||||||||||||||||||||||||||||||
| Equity in earnings of joint ventures | - | - | - | - | - | 483,355 | - | - | 483,355 | - | 120,557 | - | 603,912 | - | ||||||||||||||||||||||||||||||||||||||||||
| Income tax (expense) benefit | 176,742 | (314,838 | ) | (47,439 | ) | (13,180 | ) | (50,735 | ) | 61,424 | 138,096 | - | (49,930 | ) | (76,423 | ) | - | - | (126,353 | ) | (41,819 | ) | ||||||||||||||||||||||||||||||||||
| Profit (loss) for the year | 326,311 | 790,724 | 159,875 | 169,434 | 139,833 | 442,808 | (1,117,035 | ) | (245,769 | ) | 666,181 | 150,403 | 89,387 | (111,438 | ) | 794,533 | 138,918 | |||||||||||||||||||||||||||||||||||||||
| Other selected data | ||||||||||||||||||||||||||||||||||||||||||||||||||||||||
| Depreciation and amortization | 1,924,301 | 494,301 | 200,451 | 877 | 61,759 | 1,656 | (2,418,602 | ) | - | 264,743 | 70,043 | - | - | 334,786 | 1,185 | |||||||||||||||||||||||||||||||||||||||||
| EBITDA | 2,408,269 | 1,658,495 | 471,466 | 180,433 | 137,673 | 848,097 | (4,066,764 | ) | (245,769 | ) | 1,391,900 | 296,680 | 101,643 | (111,438 | ) | 1,678,785 | 171,756 | |||||||||||||||||||||||||||||||||||||||
| Additions to PP&E, intangible | ||||||||||||||||||||||||||||||||||||||||||||||||||||||||
| and biological assets (cash) | 2,404,514 | 677,245 | 294,359 | 760 | 72,891 | 2,461 | (3,081,759 | ) | - | 370,471 | 266,661 | - | - | 637,132 | - | |||||||||||||||||||||||||||||||||||||||||
| Reconciliation of EBITDA | ||||||||||||||||||||||||||||||||||||||||||||||||||||||||
| Profit (loss) for the year | 326,311 | 790,724 | 159,875 | 169,434 | 139,833 | 442,808 | (1,117,035 | ) | (245,769 | ) | 666,181 | 150,403 | 89,387 | (111,438 | ) | 794,533 | 138,918 | |||||||||||||||||||||||||||||||||||||||
| Income tax and social contribution | (176,742 | ) | 314,838 | 47,439 | 13,180 | 50,735 | (61,424 | ) | (138,096 | ) | - | 49,930 | 76,423 | - | - | 126,353 | 41,819 | |||||||||||||||||||||||||||||||||||||||
| Financial result, net | 334,399 | 58,632 | 63,701 | (3,058 | ) | (114,654 | ) | 465,057 | (393,031 | ) | - | 411,046 | (189 | ) | 12,256 | - | 423,113 | (10,166 | ) | |||||||||||||||||||||||||||||||||||||
| Depreciation and amortization | 1,924,301 | 494,301 | 200,451 | 877 | 61,759 | 1,656 | (2,418,602 | ) | - | 264,743 | 70,043 | - | - | 334,786 | 1,185 | |||||||||||||||||||||||||||||||||||||||||
| EBITDA | 2,408,269 | 1,658,495 | 471,466 | 180,433 | 137,673 | 848,097 | (4,066,764 | ) | (245,769 | ) | 1,391,900 | 296,680 | 101,643 | (111,438 | ) | 1,678,785 | 171,756 | |||||||||||||||||||||||||||||||||||||||
42
Cosan Limited
Notes to the consolidated financial statements
(Amounts in thousands of Brazilian Reais – R$, unless otherwise stated)
| December 31, 2014 | ||||||||||||||||||||||||||||||||||||||||||||||||||||
| Raízen Energia | Raízen Combustíveis | COMGÁS | Radar | Lubricants | Other business | Deconsolidated effects IFRS 11 | Segment elimination | Cosan Energia | Cosan Log | Cosan Limited | Segment elimination | Total consolidated | ||||||||||||||||||||||||||||||||||||||||
| Statement of financial position | ||||||||||||||||||||||||||||||||||||||||||||||||||||
| Cash and cash equivalents | 2,643,950 | 173,470 | 973,708 | 6,011 | 39,810 | 520,663 | (2,817,420 | ) | - | 1,540,192 | 86,487 | 22,661 | - | 1,649,340 | ||||||||||||||||||||||||||||||||||||||
| Investment securities | - | - | - | 149,735 | - | - | - | - | 149,735 | - | - | - | 149,735 | |||||||||||||||||||||||||||||||||||||||
| Trade receivables | 620,300 | 1,920,778 | 605,483 | 22,214 | 194,486 | 241 | (2,541,078 | ) | - | 822,424 | 42,685 | - | - | 865,109 | ||||||||||||||||||||||||||||||||||||||
| Inventories | 2,315,907 | 1,128,771 | 125,406 | - | 222,486 | 11 | (3,444,678 | ) | - | 347,903 | 5,817 | - | - | 353,720 | ||||||||||||||||||||||||||||||||||||||
| Other current assets | 2,680,822 | 521,630 | 137,360 | 31,052 | 31,831 | 367,641 | (3,202,452 | ) | (19,750 | ) | 548,134 | 24,500 | 19,658 | (45,089 | ) | 547,203 | ||||||||||||||||||||||||||||||||||||
| Other non-current assets | 2,075,546 | 2,365,613 | 591,135 | 15,538 | (190,806 | ) | 2,331,354 | (4,441,159 | ) | (6,610 | ) | 2,740,611 | 480,989 | 10,220 | - | 3,231,820 | ||||||||||||||||||||||||||||||||||||
| Investment in associates | 209,205 | 256,729 | - | - | 16,032 | 5,783,699 | (465,934 | ) | (5,669,053 | ) | 130,678 | - | 6,132,772 | (6,132,773 | ) | 130,677 | ||||||||||||||||||||||||||||||||||||
| Investment in joint ventures | - | - | - | - | - | 8,404,503 | - | - | 8,404,503 | - | - | - | 8,404,503 | |||||||||||||||||||||||||||||||||||||||
| Biological assets | 1,828,304 | - | - | - | - | - | (1,828,304 | ) | - | - | - | - | - | - | ||||||||||||||||||||||||||||||||||||||
| Investment property | - | - | - | 2,641,978 | - | - | - | - | 2,641,978 | - | - | - | 2,641,978 | |||||||||||||||||||||||||||||||||||||||
| Property, plant and equipment | 9,848,969 | 2,464,316 | - | 11,288 | 221,466 | 118,681 | (12,313,285 | ) | - | 351,435 | 1,084,455 | - | - | 1,435,890 | ||||||||||||||||||||||||||||||||||||||
| Intangible assets and goodwill | 3,288,709 | 4,267,514 | 8,595,251 | 173 | 824,277 | 6,419 | (7,556,223 | ) | - | 9,426,120 | 860,253 | - | - | 10,286,373 | ||||||||||||||||||||||||||||||||||||||
| Loans and borrowings | (10,377,585 | ) | (1,557,782 | ) | (3,133,347 | ) | - | (261,166 | ) | (4,003,089 | ) | 11,935,367 | - | (7,397,602 | ) | (784,709 | ) | (320,329 | ) | - | (8,502,640 | ) | ||||||||||||||||||||||||||||||
| Trade payables | (636,619 | ) | (529,990 | ) | (848,770 | ) | (790 | ) | (118,784 | ) | (2,826 | ) | 1,166,609 | - | (971,170 | ) | (141,289 | ) | - | - | (1,112,459 | ) | ||||||||||||||||||||||||||||||
| Employee benefits payable | (252,219 | ) | (66,799 | ) | (58,955 | ) | (5,336 | ) | (15,437 | ) | (21,387 | ) | 319,018 | - | (101,115 | ) | (19,302 | ) | - | - | (120,416 | ) | ||||||||||||||||||||||||||||||
| Other current liabilities | (1,103,934 | ) | (2,074,917 | ) | (122,981 | ) | (20,783 | ) | (100,853 | ) | (398,334 | ) | 3,178,851 | 26,361 | (616,590 | ) | (89,787 | ) | (12,712 | ) | 37,374 | (681,715 | ) | |||||||||||||||||||||||||||||
| Other non-current liabilities | (2,719,593 | ) | (2,273,554 | ) | (992,028 | ) | (93,552 | ) | (193,082 | ) | (4,289,299 | ) | 4,993,147 | - | (5,567,961 | ) | (221,851 | ) | (7,721 | ) | 7,722 | (5,789,811 | ) | |||||||||||||||||||||||||||||
| Total assets (net of | ||||||||||||||||||||||||||||||||||||||||||||||||||||
| liabilities) allocated by segment | 10,421,762 | 6,595,779 | 5,872,262 | 2,757,528 | 670,260 | 8,818,278 | (17,017,541 | ) | (5,669,052 | ) | 12,449,275 | 1,328,248 | 5,844,549 | (6,132,766 | ) | 13,489,307 | ||||||||||||||||||||||||||||||||||||
| Total assets | 25,511,712 | 13,098,821 | 11,028,343 | 2,877,989 | 1,359,582 | 17,533,212 | (38,610,533 | ) | (5,695,413 | ) | 27,103,713 | 2,585,186 | 6,185,311 | (6,177,862 | ) | 29,696,348 | ||||||||||||||||||||||||||||||||||||
43
Cosan Limited
Notes to the consolidated financial statements
(Amounts in thousands of Brazilian Reais – R$, unless otherwise stated)
| December 31, 2013 | ||||||||||||||||||||||||||||||||||||||||||||||||||||
| Raízen Energia | Raízen Combustíveis | COMGÁS | Radar | Lubricants | Other business | Deconsolidated effects IFRS 11 | Segment elimination | Cosan Energia | Cosan Log | Cosan Limited | Segment elimination | Total consolidated | ||||||||||||||||||||||||||||||||||||||||
| Statement of financial position | ||||||||||||||||||||||||||||||||||||||||||||||||||||
| Cash and cash equivalents | 1,058,483 | 328,992 | 535,957 | 13,408 | 57,892 | 369,543 | (1,387,475 | ) | - | 976,800 | 497,753 | 35,012 | - | 1,509,565 | ||||||||||||||||||||||||||||||||||||||
| Investment securities | - | - | - | 87,978 | - | - | - | - | 87,978 | - | - | - | 87,978 | |||||||||||||||||||||||||||||||||||||||
| Trade receivables | 416,746 | 1,435,095 | 582,889 | 28,052 | 200,795 | 241 | (1,851,841 | ) | - | 811,977 | 32,506 | - | - | 844,483 | ||||||||||||||||||||||||||||||||||||||
| Inventories | 2,026,925 | 1,057,049 | 121,253 | - | 185,490 | - | (3,083,974 | ) | - | 306,743 | 5,237 | - | - | 311,980 | ||||||||||||||||||||||||||||||||||||||
| Other current assets | 1,279,553 | 484,475 | 248,803 | 323,474 | 45,227 | 332,012 | (1,764,028 | ) | (144,261 | ) | 805,255 | 22,389 | 52,091 | (69,740 | ) | 809,995 | ||||||||||||||||||||||||||||||||||||
| Other non-current assets | 1,534,557 | 1,403,117 | 332,918 | 4,884 | (93,658 | ) | 2,755,375 | (2,937,674 | ) | (415,785 | ) | 2,583,734 | 234,965 | - | - | 2,818,699 | ||||||||||||||||||||||||||||||||||||
| Investment in associates | 408,591 | 254,826 | - | - | 15,364 | 6,101,361 | (663,417 | ) | (6,013,409 | ) | 103,316 | - | 6,081,878 | (6,081,878 | ) | 103,316 | ||||||||||||||||||||||||||||||||||||
| Investment in joint ventures | - | - | - | - | - | 8,498,259 | - | - | 8,498,259 | - | - | - | 8,498,259 | |||||||||||||||||||||||||||||||||||||||
| Biological assets | 1,867,765 | - | - | - | - | - | (1,867,765 | ) | - | - | - | - | - | - | ||||||||||||||||||||||||||||||||||||||
| Investment property | - | - | - | 2,281,509 | - | - | - | - | 2,281,509 | - | - | - | 2,281,509 | |||||||||||||||||||||||||||||||||||||||
| Property, plant and equipment | 9,504,874 | 2,494,486 | - | 11,195 | 197,137 | 50,430 | (11,999,360 | ) | - | 258,762 | 1,013,148 | - | - | 1,271,910 | ||||||||||||||||||||||||||||||||||||||
| Intangible assets and goodwill | 3,100,227 | 4,038,314 | 8,450,541 | 89 | 867,826 | 3,949 | (7,138,541 | ) | - | 9,322,405 | 755,635 | - | - | 10,078,040 | ||||||||||||||||||||||||||||||||||||||
| Loans and borrowings | (7,732,778 | ) | (862,521 | ) | (2,841,387 | ) | - | (209,579 | ) | (5,073,219 | ) | 8,595,299 | - | (8,124,185 | ) | (705,974 | ) | (262,797 | ) | - | (9,092,956 | ) | ||||||||||||||||||||||||||||||
| Trade payables | (633,505 | ) | (551,176 | ) | (706,397 | ) | (1,216 | ) | (70,102 | ) | (1,562 | ) | 1,184,681 | (282 | ) | (779,559 | ) | (82,870 | ) | - | - | (862,429 | ) | |||||||||||||||||||||||||||||
| Employee benefits payable | (249,919 | ) | (60,091 | ) | (59,417 | ) | (4,247 | ) | (13,039 | ) | (14,071 | ) | 310,010 | - | (90,774 | ) | (12,522 | ) | - | - | (103,296 | ) | ||||||||||||||||||||||||||||||
| Other current liabilities | (495,240 | ) | (525,188 | ) | (301,089 | ) | (31,020 | ) | (107,826 | ) | (260,413 | ) | 1,020,428 | 143,979 | (556,369 | ) | (127,289 | ) | (20,188 | ) | 69,740 | (634,106 | ) | |||||||||||||||||||||||||||||
| Other non-current liabilities | (1,693,036 | ) | (2,715,727 | ) | (863,768 | ) | (85,951 | ) | (327,564 | ) | (3,543,908 | ) | 4,408,763 | 416,347 | (4,404,844 | ) | (198,620 | ) | - | 280 | (4,603,184 | ) | ||||||||||||||||||||||||||||||
| Total assets (net of | ||||||||||||||||||||||||||||||||||||||||||||||||||||
| liabilities) allocated by segment | 10,393,243 | 6,781,651 | 5,500,303 | 2,628,155 | 747,963 | 9,217,997 | (17,174,894 | ) | (6,013,411 | ) | 12,081,007 | 1,434,358 | 5,885,996 | (6,081,598 | ) | 13,319,763 | ||||||||||||||||||||||||||||||||||||
| Total assets | 21,197,721 | 11,496,354 | 10,272,361 | 2,750,589 | 1,476,073 | 18,111,170 | (32,694,075 | ) | (6,573,455 | ) | 26,036,738 | 2,561,633 | 6,168,981 | (6,151,618 | ) | 28,615,734 | ||||||||||||||||||||||||||||||||||||
44
Cosan Limited
Notes to the consolidated financial statements
(Amounts in thousands of Brazilian Reais – R$, unless otherwise stated)
Net sales by segment:
| Twelve months ended December 31, 2014 | Nine months ended December 31, 2013 | Twelve months ended March 31, 2013 | ||||||||||
| Raízen Energia | ||||||||||||
| Ethanol | 4,376,826 | 3,143,254 | 3,299,938 | |||||||||
| Sugar | 4,059,580 | 3,127,616 | 4,353,994 | |||||||||
| Cogeneration | 618,583 | 376,579 | 569,709 | |||||||||
| Other | 208,941 | 202,940 | 244,597 | |||||||||
| 9,263,930 | 6,850,389 | 8,468,238 | ||||||||||
| Raízen Combustíveis | ||||||||||||
| Fuels | 55,733,927 | 37,553,167 | 43,516,040 | |||||||||
| Other | - | 27,403 | 16,192 | |||||||||
| 55,733,927 | 37,580,570 | 43,532,232 | ||||||||||
| COMGÁS | ||||||||||||
| Industrial | 4,122,077 | 3,065,600 | 1,535,941 | |||||||||
| Residential | 632,997 | 522,642 | 203,254 | |||||||||
| Thermo generation | 407,736 | 212,103 | 148,652 | |||||||||
| Cogeneration | 246,841 | 187,457 | 112,705 | |||||||||
| Automotive | 199,820 | 151,195 | 77,486 | |||||||||
| Commercial | 255,051 | 186,932 | 84,517 | |||||||||
| Construction revenue | 481,314 | 536,482 | 230,038 | |||||||||
| Other | 41,267 | 26,484 | 6,396 | |||||||||
| 6,387,103 | 4,888,895 | 2,398,989 | ||||||||||
| Radar | ||||||||||||
| Property sales | 85,308 | 5,694 | 4,721 | |||||||||
| Land lease | 60,944 | 49,038 | 47,132 | |||||||||
| Other | 11,310 | - | - | |||||||||
| 157,562 | 54,732 | 51,853 | ||||||||||
| Lubricants | ||||||||||||
| Lubricants | 1,325,472 | 1,040,150 | 1,245,571 | |||||||||
| Basic oil | 225,701 | 137,309 | 162,021 | |||||||||
| Other | 51,025 | 7,740 | 9,882 | |||||||||
| 1,602,198 | 1,185,199 | 1,417,474 | ||||||||||
| Other businesses | - | 38 | 5,117 | |||||||||
| IFRS 11 - Deconsolidated of | ||||||||||||
| adjustments/eliminations joint | ||||||||||||
| ventures and eliminations | (64,997,857 | ) | (44,430,959 | ) | (52,000,470 | ) | ||||||
| Cosan Energia | 8,146,863 | 6,128,864 | 3,873,433 | |||||||||
| Cosan Log | ||||||||||||
| Logistics | 671,600 | 597,476 | 549,420 | |||||||||
| Port handling | 220,543 | 138,236 | 150,028 | |||||||||
| Other | 23,298 | 13,638 | 13,328 | |||||||||
| 915,441 | 749,350 | 712,776 | ||||||||||
| Total | 9,062,304 | 6,878,214 | 4,586,209 | |||||||||
45
Cosan Limited
Notes to the consolidated financial statements
(Amounts in thousands of Brazilian Reais – R$, unless otherwise stated)
Net sales by region
Net sales of Cosan Log and Lubricants by geographic area are as follow:
| Twelve months ended December 31, 2014 | Nine months ended December 31, 2013 | Twelve months ended March 31, 2013 | ||||||||||
| Brazil | 83.23 | % | 84.31 | % | 86.90 | % | ||||||
| Europe | 12.13 | % | 2.27 | % | 1.73 | % | ||||||
| South America (excepting Brazil) | 2.93 | % | 12.44 | % | 10.81 | % | ||||||
| North America | 0.70 | % | 0.09 | % | - | |||||||
| Middle East and Asia | 0.95 | % | 0.79 | % | 0.53 | % | ||||||
| Other | 0.07 | % | 0.10 | % | 0.03 | % | ||||||
| Total | 100.00 | % | 100.00 | % | 100.00 | % | ||||||
COMGÁS and Radar’s net sales are only to the domestic market (Brazil).
Concentration of customers
| (i) | COMGÁS |
No customers or specific group represented 10% or more of net sales for the periods presented.
| (ii) | Cosan Log |
In 2014, 27% of the segment’s net sales was generated from sales to Raízen Energia (35% for nine months ended December 31, 2013; 40% for year ended March 31, 2013).
| (iii) | Radar |
In 2014, 15% of the segment’s net sales was generated from sales to Raízen Energia (22% through nine months ended December 31, 2013; 26% for year ended March 31, 2013).
| (iv) | Lubricants |
No customers or specific group represented 10% or more of sales for the year ended December 31, 2014, for nine months ended December 31, 2013 and for year ended March 31, 2013.
46
Cosan Limited
Notes to the consolidated financial statements
(Amounts in thousands of Brazilian Reais – R$, unless otherwise stated)
| 6 | Cash and cash equivalents |
| December 31, 2014 | December 31, 2013 | |||||||
| Brazilian Reais | ||||||||
| Cash and bank deposits | 57,703 | 92,064 | ||||||
| Short-term investments | 1,496,620 | 1,356,239 | ||||||
| 1,554,323 | 1,448,302 | |||||||
| U.S. Dollars and Pound Sterling | ||||||||
| Cash and bank deposits | 95,017 | 30,802 | ||||||
| Short-term investments | - | 30,460 | ||||||
| 95,017 | 61,262 | |||||||
| 1,649,340 | 1,509,565 | |||||||
| Short-term investments are composed as presented below: | ||||||||
| December 31, 2014 | December 31, 2013 | |||||||
| Exclusive funds | ||||||||
Repurchase agreements(I) | 423,535 | 661,665 | ||||||
Bank certificate of deposits - CDB(II) | 87,646 | 175,895 | ||||||
| 511,181 | 837,560 | |||||||
| Bank investments | ||||||||
Bank certificate of deposits - CDB(II) | 222,570 | 147,782 | ||||||
Repurchase agreements(I) | 762,869 | 370,897 | ||||||
| Other financial investments | - | 30,460 | ||||||
| 985,439 | 549,139 | |||||||
| 1,496,620 | 1,386,699 | |||||||
| (I) | These refer to purchases of assets, mainly government securities, with the commitment to repurchase at a rate previously established by the parties, generally with a one-day term. |
| (II) | These refer mainly to Bank Deposit Certificates - CDBs, issued by Brazilian financial institutions with original maturities of 90 days or less or for which there are no penalties or other restrictions for early redemption. |
47
Cosan Limited
Notes to the consolidated financial statements
(Amounts in thousands of Brazilian Reais – R$, unless otherwise stated)
| 7 | Trade receivables |
| December 31, 2014 | December 31, 2013 | |||||||
| Domestic - Brazilian Reais | 1,369,013 | 1,087,118 | ||||||
| Export - Foreign currency | 25,323 | 24,453 | ||||||
| Allowance for doubtful accounts | (48,235 | ) | (28,628 | ) | ||||
| 1,346,101 | 1,082,943 | |||||||
| Current | 865,109 | 844,483 | ||||||
Non-current(i) | 480,992 | 238,460 | ||||||
| (i) | As of December 31, 2014, Rumo had an accounts receivable due from ALL of R$446,693 (R$225,401 at December 31, 2013) reflecting contractual revenue recognized in accordance with IAS 18 - Revenue. Additional amounts totaling R$183,144, including penalties and interest, were not recognized because not all criteria for revenue recognition had been fulfilled. |
| The ageing of trade receivables is as follows: | ||||||||
| December 31, 2014 | December 31, 2013 | |||||||
| Not overdue | 780,010 | 776,342 | ||||||
| Overdue: | ||||||||
| From 1 to 30 days | 119,520 | 78,110 | ||||||
| From 31 to 60 days | 29,863 | 38,546 | ||||||
| From 61 to 90 days | 33,897 | 58,044 | ||||||
| More than 90 days | 382,811 | 131,901 | ||||||
| 1,346,101 | 1,082,943 | |||||||
| Changes in the allowance for doubtful accounts is as follows: | ||||||||
| At April 1, 2013 | (21,411 | ) | ||||||
| Provision | (24,891 | ) | ||||||
| Reversal | 960 | |||||||
| Write-offs | 16,714 | |||||||
| At December 31, 2013 | (28,628 | ) | ||||||
| Provision | (22,277 | ) | ||||||
| Reversal | 2,670 | |||||||
| At December 31, 2014 | (48,235 | ) | ||||||
48
Cosan Limited
Notes to the consolidated financial statements
(Amounts in thousands of Brazilian Reais – R$, unless otherwise stated)
| 8 | Inventories |
| December 31, 2014 | December 31, 2013 | |||||||
| Finished goods | 223,706 | 185,620 | ||||||
| Work in process | 86,895 | 82,361 | ||||||
| Spare parts and other | 47,887 | 44,331 | ||||||
| Provision for slow moving inventory | ||||||||
| and obsolescence | (4,768 | ) | (332 | ) | ||||
| 353,720 | 311,980 | |||||||
| Changes in the provision for slow moving inventory and obsolescence: | ||||||||
| At April 1, 2013 | (255 | ) | ||||||
| Provision | (77 | ) | ||||||
| At December 31, 2013 | (332 | ) | ||||||
| Provision | (4,436 | ) | ||||||
| At December 31, 2014 | (4,768 | ) | ||||||
| 9 | Taxes recoverable |
| December 31, 2014 | December 31, 2013 | |||||||
| ICMS - State VAT | 91,121 | 97,648 | ||||||
| COFINS - Revenue tax | 12,604 | 25,779 | ||||||
| PIS - Revenue tax | 8,387 | 7,838 | ||||||
| IPI - Excise tax | 965 | - | ||||||
| Other | (16,960 | ) | (27,466 | ) | ||||
| 96,117 | 103,799 | |||||||
| Current | 78,818 | 85,433 | ||||||
| Non-current | 17,299 | 18,366 | ||||||
| 10 | Other financial assets |
| December 31, 2014 | December 31, 2013 | |||||||
Exxon Mobil financial assets(i) | 332,405 | 309,378 | ||||||
| Receivable from sale of | ||||||||
discontinued operations(ii) | 107,775 | 160,783 | ||||||
| 440,180 | 470,161 | |||||||
| Current | 69,683 | 63,054 | ||||||
| Non-current | 370,497 | 407,107 | ||||||
49
Cosan Limited
Notes to the consolidated financial statements
(Amounts in thousands of Brazilian Reais – R$, unless otherwise stated)
| (i) | On June 28, 2011, CLE, the successor entity of Esso Brasileira de Petróleo Ltda. ("Essobrás"), joined the Brazilian Government's tax amnesty and refinancing program (“REFIS”) upon request of its prior owner, ExxonMobil Brasil Holdings B.V. ("ExxonMobil"), to settle certain tax contingencies that existed prior to the acquisition of Essobrás by the Company. ExxonMobil is legally responsible for tax contingencies that existed prior to the acquisition by the Company; therefore, this financial asset represents the amounts that the Company will be reimbursed from ExxonMobil. |
| (ii) | On October 24, 2012, the Company signed an Amendment to the Association Agreement and Other Covenants, dated May 28, 2012, with Camil Alimentos SA (“Camil”) whereby it agreed to the sale of all of the shares issued by its subsidiary, Docelar Alimentos e Bebidas S.A., to Camil, for R$293,770. As at December 31, 2014, R$107,774 is receivable, to be paid in two remaining installments, on October 31, 2015 and October 24, 2016. The fair value of the receivable is similar to the carrying amount as the receivable is inflation indexed. |
| 11 | Related parties |
| a) | Receivables from and payables to related parties: |
| December 31, 2014 | December 31, 2013 | |||||||
| Current assets | ||||||||
| Commercial operations | ||||||||
Raízen Energia S.A.(ii) | 23,229 | 27,681 | ||||||
Raízen Combustíveis S.A.(ii) | 2,576 | 4,048 | ||||||
| Aguassanta Participações S.A. | 6,340 | 6,368 | ||||||
| Other | 556 | - | ||||||
| 32,701 | 38,097 | |||||||
| Corporate operation / Agreements | ||||||||
Raízen Energia S.A.(ii) | 3,388 | 1,468 | ||||||
| 3,388 | 1,468 | |||||||
| Financial operations | ||||||||
Raízen Combustíveis S.A.(ii) | 1,319 | - | ||||||
Rezende Barbosa Group(iii) | 949 | 7,223 | ||||||
| 2,268 | 7,223 | |||||||
| 38,357 | 46,788 | |||||||
50
Cosan Limited
Notes to the consolidated financial statements
(Amounts in thousands of Brazilian Reais – R$, unless otherwise stated)
| Non-current assets | ||||||||
| Receivables under the | ||||||||
| framework agreement | ||||||||
�� Raízen Energia S.A.(ii) | 104,984 | 305,183 | ||||||
Raízen Combustíveis S.A.(ii) | 15,126 | 90,756 | ||||||
| 120,110 | 395,939 | |||||||
| Financial operations | ||||||||
Rezende Barbosa Group (iii) | 84,996 | 107,002 | ||||||
| Novvi Limited Liability Company | 7,417 | - | ||||||
| Other | 4 | - | ||||||
| 92,417 | 107,002 | |||||||
| Corporate restructuring | ||||||||
| CTC - Centro de Tecnologia Canavieira | - | 1,540 | ||||||
| - | 1,540 | |||||||
| 212,527 | 504,481 | |||||||
| Total | 250,884 | 551,269 |
| Current liabilities | ||||||||
| Commercial operations | ||||||||
Shell Brazil Holding B.V.(i) | 3,820 | 5,986 | ||||||
Raízen Energia S.A.(ii) | 25,926 | 18,491 | ||||||
Raízen Combustíveis S.A.(ii) | 1,283 | 1,709 | ||||||
| Other | 96 | 34 | ||||||
| 31,125 | 26,220 | |||||||
| Corporate operations / Agreements | ||||||||
Raízen Combustíveis S.A.(ii) | 11,402 | 8,800 | ||||||
Raízen Energia S.A.(ii) | 94,892 | 70,443 | ||||||
| 106,294 | 79,243 | |||||||
| Financial operations | ||||||||
| Other | 22 | - | ||||||
| 22 | - | |||||||
| 137,441 | 105,463 | |||||||
51
Cosan Limited
Notes to the consolidated financial statements
(Amounts in thousands of Brazilian Reais – R$, unless otherwise stated)
| b) | Related party transactions: |
| Twelve months ended December 31, 2014 | Nine months ended December 31, 2013 | Twelve months ended March 31, 2013 | ||||||||||
| Sales of goods and services | ||||||||||||
Raízen Energia S.A.(ii) | 303,395 | 279,185 | 299,676 | |||||||||
| Other | 2,796 | 203 | 2 | |||||||||
| 306,191 | 279,388 | 299,678 | ||||||||||
| Purchase of goods / Inputs | ||||||||||||
Raízen Energia S.A.(ii) | (109 | ) | (13 | ) | (63,605 | ) | ||||||
Raízen Combustíveis S.A.(ii) | (741 | ) | (1,035 | ) | (546 | ) | ||||||
| (850 | ) | (1,048 | ) | (64,151 | ) | |||||||
| Land lease | ||||||||||||
Raízen Energia S.A.(ii) | 54,045 | 43,995 | 52,558 | |||||||||
| 54,045 | 43,995 | 52,558 | ||||||||||
| Shared income (expense) | ||||||||||||
| Aguassanta Participações S.A. | 440 | 295 | 700 | |||||||||
Raízen Energia S.A.(ii) | (33,555 | ) | (7,950 | ) | (14,683 | ) | ||||||
| (33,115 | ) | (7,655 | ) | (13,983 | ) | |||||||
| Financial result | ||||||||||||
Raízen Energia S.A.(ii) | 2,613 | 1,781 | 363 | |||||||||
Rezende Barbosa Group(iii) | 421 | 804 | 1,684 | |||||||||
| Impulso Participações | - | - | (976 | ) | ||||||||
| Aldwich Temple Venture Capital Ltd. | (263 | ) | (153 | ) | (88 | ) | ||||||
| Other | 269 | 113 | (21 | ) | ||||||||
| 3,040 | 2,545 | 962 | ||||||||||
| Total | 329,311 | 317,225 | 275,064 | |||||||||
Commercial operations of Cosan with its subsidiaries, associates and joint ventures are carried out at prices and conditions similar to those practiced in the market. For the periods presented, no loss for doubtful accounts was recorded.
| (i) | Shell |
Relate to payables to Shell by COMGÁS in relation to a Commercial Services Agreement (CSA) – under which Shell agrees to provide commercial and business service staff for administrative support to conduct COMGÁS’s business.
| (ii) | Raízen Energia and Raízen Combustíveis |
Non-current assets receivable from Raízen Energia and Raízen Combustíveis are, primarily, tax credits which will be reimbursed to the Company when realized. Current liabilities represent payables in relation to expenses paid by Raízen Energia and Raízen Combustíveis to Cosan S.A.
52
Cosan Limited
Notes to the consolidated financial statements
(Amounts in thousands of Brazilian Reais – R$, unless otherwise stated)
| (iii) | Rezende Barbosa Group |
The Company has receivables with Rezende Barbosa for the repayment of loans taken prior to the acquisition of the subsidiaries. These receivables are secured by Cosan S.A. shares.
| c) | Officers’ and directors’ compensation |
Key management includes directors (executive and non-executive) and members of the board. The compensation paid or payable to key management for their services is shown below:
| Twelve months ended December 31, 2014 | Nine months ended December 31, 2013 | Twelve months ended March 31, 2013 | ||||||||||
| Regular compensation | 37,193 | 19,299 | 31,922 | |||||||||
| Stock option expense (Note 34) | 12,924 | 6,595 | 13,295 | |||||||||
| Bonuses and other variable compensation | 29,258 | 13,092 | 61,377 | |||||||||
| 79,375 | 38,986 | 106,594 | ||||||||||
53
Cosan Limited
Notes to the consolidated financial statements
(Amounts in thousands of Brazilian Reais – R$, unless otherwise stated)
| 12 | Investments in associates |
| a) | Information on associates of the Company and the Company´s ownership: |
Tellus Brasil Participações S.A.(i) | Novvi Limited Liability Company | Janus Brasil Participações S.A.(i) | Vertical UK LLP | Other | Total | |||||||||||||||||||
| Shares issued by the associate | 65,957,282 | 200,002 | 1,364,827 | - | - | |||||||||||||||||||
| Shares held by Cosan | 33,638,214 | 100,001 | 689,685 | - | - | |||||||||||||||||||
| Cosan ownership interest | 51.00 | % | 50.00 | % | 51.00 | % | 50.00 | % | - | |||||||||||||||
| At March 31, 2013 | 39,828 | - | - | 9,641 | 1,087 | 50,556 | ||||||||||||||||||
| Equity in earnings (losses) of associates | 14,825 | (7,812 | ) | - | - | (1,516 | ) | 5,497 | ||||||||||||||||
| Other comprehensive income | 18 | 998 | - | 1,330 | - | 2,346 | ||||||||||||||||||
| Dividends | (839 | ) | - | - | (2,845 | ) | - | (3,684 | ) | |||||||||||||||
| Capital increase | 24,989 | 22,178 | - | - | - | 47,167 | ||||||||||||||||||
| Other | - | - | - | - | 1,434 | 1,434 | ||||||||||||||||||
| At December 31, 2013 | 78,821 | 15,364 | - | 8,126 | 1,005 | 103,316 | ||||||||||||||||||
| Equity in earnings (losses) of associates | 9,657 | (7,501 | ) | - | 1,079 | 305 | 3,540 | |||||||||||||||||
| Other comprehensive income (losses) | 204 | 2,019 | - | (2,693 | ) | - | (470 | ) | ||||||||||||||||
| Dividends | (3,118 | ) | - | - | - | - | (3,118 | ) | ||||||||||||||||
| Capital increase | 7,294 | 4,640 | 13,063 | - | 1,500 | 26,497 | ||||||||||||||||||
| Other | 1,559 | - | - | - | (647 | ) | 912 | |||||||||||||||||
| At December 31, 2014 | 94,417 | 14,522 | 13,063 | 6,512 | 2,163 | 130,677 | ||||||||||||||||||
54
Cosan Limited
Notes to the consolidated financial statements
(Amounts in thousands of Brazilian Reais – R$, unless otherwise stated)
| Financial information of associates: | ||||||||||||||||||||
| Twelve months ended December 31, 2014 | ||||||||||||||||||||
| Assets | Liabilities | Equity | Profit (loss) for the period | Total comprehensive income | ||||||||||||||||
Tellus Brasil Participações Ltda.(i) | 1,865,488 | 12,421 | 1,853,067 | 192,553 | 4,334 | |||||||||||||||
Janus Brasil Participações S.A.(i) | 254,749 | 103 | 254,646 | (1,483 | ) | - | ||||||||||||||
| Novvi Limited Liability Company | 21,800 | 18,147 | 3,653 | (14,847 | ) | 4,038 | ||||||||||||||
| Nine months ended December 31, 2013 | ||||||||||||||||||||
| Assets | Liabilities | Equity | Profit (loss) for the period | Total comprehensive income | ||||||||||||||||
Tellus Brasil Participações Ltda.(i) | 1,664,607 | 119,130 | 1,545,477 | 290,686 | 2,263 | |||||||||||||||
| Twelve months ended March 31, 2013 | ||||||||||||||||||||
| Assets | Liabilities | Equity | Profit (loss) for the period | Total comprehensive losses | ||||||||||||||||
Tellus Brasil Participações Ltda.(i) | 800,479 | 22,459 | 778,020 | 124,079 | (789 | ) | ||||||||||||||
| (i) The Company is entitled to 5.1% of the economic benefits of the associate as established in the shareholders agreement. | ||||||||||||||||||||
55
Cosan Limited
Notes to the consolidated financial statements
(Amounts in thousands of Brazilian Reais – R$, unless otherwise stated)
| b) | Information on the non controlling interest in subsidiaries of the Company: |
| Cosan S.A. Indústria e Comércio S.A. | Companhia de Gás de São Paulo - "COMGÁS" | Cosan Logística S.A. | Rumo Logística Operadora Multimodal S.A. | Logispot Armazéns Gerais S.A. | Radar Propriedades Agrícolas S.A. | Radar II Propriedades Agrícolas S.A. | Elimination of participation Radar II in Radar | Other | Total | |||||||||||||||||||||||||||||||
| Shares issued by investee | 407,214,353 | 121,870,985 | 405,856,814 | 956,917 | 2,040,816 | 21,148,989 | 830,690,258 | - | - | |||||||||||||||||||||||||||||||
| Shares held by non-controlling shareholders | 252,444,538 | 47,909,318 | 152,153,491 | 239,229 | 1,000,000 | 17,147,822 | 290,710,861 | - | - | |||||||||||||||||||||||||||||||
| Non-controlling interest | 37.49 | % | 39.31 | % | 37.49 | % | 25.00 | % | 49.00 | % | 81.08 | % | 35.00 | % | - | - | ||||||||||||||||||||||||
| At March 31, 2013 | 3,664,146 | 1,852,661 | - | 309,012 | 37,902 | 1,528,729 | 305,708 | (489,457 | ) | - | 7,208,701 | |||||||||||||||||||||||||||||
| Equity in earnings (losses) | 88,270 | 162,793 | - | 40,273 | (618 | ) | 74,151 | 27,217 | (14,718 | ) | - | 377,368 | ||||||||||||||||||||||||||||
| Other comprehensive income (losses) | (2,457 | ) | 9,817 | - | - | - | 7,345 | 516 | (1,473 | ) | - | 13,748 | ||||||||||||||||||||||||||||
| Dividends | (76,916 | ) | (64,357 | ) | - | - | - | (2,432 | ) | (5,249 | ) | 368 | - | (148,586 | ) | |||||||||||||||||||||||||
| Other | (18,065 | ) | 324 | - | - | (65 | ) | - | - | 65 | - | (17,741 | ) | |||||||||||||||||||||||||||
| At December 31, 2013 | 3,654,978 | 1,961,238 | - | 349,285 | 37,219 | 1,607,793 | 328,192 | (505,215 | ) | - | 7,433,490 | |||||||||||||||||||||||||||||
| Equity in earnings (losses) | 105,153 | 210,196 | 9,368 | 28,784 | 152 | 100,253 | 17,567 | - | - | 471,473 | ||||||||||||||||||||||||||||||
| Other comprehensive income (losses) | (17,690 | ) | 967 | - | - | - | 4,998 | 349 | (234 | ) | - | (11,610 | ) | |||||||||||||||||||||||||||
| Dividends | (91,618 | ) | (65,715 | ) | (9,288 | ) | (54,379 | ) | - | (32,432 | ) | (8,365 | ) | 6,504 | - | (255,293 | ) | |||||||||||||||||||||||
| Other | 2,229 | 4,892 | (186 | ) | (54 | ) | (305 | ) | - | - | 113 | - | 6,689 | |||||||||||||||||||||||||||
| At December 31, 2014 | 3,653,052 | 2,111,578 | (106 | ) | 323,636 | 37,066 | 1,680,612 | 337,743 | (498,832 | ) | - | 7,644,749 | ||||||||||||||||||||||||||||
56
Cosan Limited
Notes to the consolidated financial statements
(Amounts in thousands of Brazilian Reais – R$, unless otherwise stated)
| Summarized balance sheet |
| Subsidiaries | ||||||||||||||||||||||||||||||||||||||||
| Companhia de Gás de São Paulo - "COMGÁS" | Rumo Logística Operadora Multimodal S.A. | Logispot Armazéns Gerais S.A. | Radar Propriedades Agrícolas S.A. | Radar II Propriedades Agrícolas S.A. | ||||||||||||||||||||||||||||||||||||
| December 31, 2014 | December 31, 2013 | December 31, 2014 | December 31, 2013 | December 31, 2014 | December 31, 2013 | December 31, 2014 | December 31, 2013 | December 31, 2014 | December 31, 2013 | |||||||||||||||||||||||||||||||
| Current | ||||||||||||||||||||||||||||||||||||||||
| Assets | 1,841,957 | 1,488,902 | 145,211 | 555,661 | 14,739 | 3,972 | 66,766 | 223,574 | 803 | 489 | ||||||||||||||||||||||||||||||
| Liabilities | (1,497,373 | ) | (1,403,287 | ) | (368,401 | ) | (363,037 | ) | (6,179 | ) | (6,714 | ) | (16,744 | ) | (22,458 | ) | (202 | ) | - | |||||||||||||||||||||
| Net current assets (liabilities) | 344,584 | 85,615 | (223,190 | ) | 192,624 | 8,560 | (2,742 | ) | 50,022 | 201,116 | 601 | 489 | ||||||||||||||||||||||||||||
| Non-current | ||||||||||||||||||||||||||||||||||||||||
| Assets | 9,186,386 | 8,783,460 | 2,337,758 | 1,921,733 | 47,850 | 40,270 | 2,135,540 | 1,855,301 | �� | 964,391 | 259,104 | |||||||||||||||||||||||||||||
| Liabilities | (3,658,708 | ) | (3,368,771 | ) | (820,026 | ) | (755,476 | ) | (32,358 | ) | (14,601 | ) | (44,899 | ) | (37,655 | ) | - | - | ||||||||||||||||||||||
| Net non-current assets | 5,527,678 | 5,414,689 | 1,517,732 | 1,166,257 | 15,492 | 25,669 | 2,090,641 | 1,817,646 | 964,391 | 259,104 | ||||||||||||||||||||||||||||||
| Equity | 5,872,262 | 5,500,304 | 1,294,542 | 1,358,881 | 24,052 | 22,927 | 2,140,663 | 2,018,762 | 964,992 | 259,593 | ||||||||||||||||||||||||||||||
57
Cosan Limited
Notes to the consolidated financial statements
(Amounts in thousands of Brazilian Reais – R$, unless otherwise stated)
Summarized statement of profit or loss and other comprehensive income
| Companhia de Gás de São Paulo - "COMGÁS" | Rumo Logística Operadora Multimodal S.A. | Logispot Armazéns Gerais S.A. | ||||||||||||||||||||||||||||||||||
Twelve months ended December 31, 2014 | Nine months ended December 31, 2013 | Twelve months ended March 31, 2013 | Twelve months ended December 31, 2014 | Nine months ended December 31, 2013 | Twelve months ended March 31, 2013 | Twelve months ended December 31, 2014 | Nine months ended December 31, 2013 | Twelve months ended March 31, 2013 | ||||||||||||||||||||||||||||
| Net sales | 6,387,104 | 4,888,897 | 2,398,989 | 905,449 | 742,962 | 706,020 | 21,354 | 12,122 | 22,743 | |||||||||||||||||||||||||||
| Profit before taxes | 734,945 | 560,443 | 207,314 | 172,678 | 243,201 | 223,261 | 2,168 | 2,664 | 6,316 | |||||||||||||||||||||||||||
| Income tax expenses | (203,810 | ) | (152,740 | ) | (47,439 | ) | (58,151 | ) | (82,110 | ) | (74,677 | ) | (757 | ) | (894 | ) | (2,035 | ) | ||||||||||||||||||
| Profit for the period | 531,135 | 407,703 | 159,875 | 114,527 | 161,091 | 148,584 | 1,411 | 1,770 | 4,281 | |||||||||||||||||||||||||||
| Other comprehensive income | 6,266 | 24,574 | (84,017 | ) | - | - | - | - | - | - | ||||||||||||||||||||||||||
| Total comprehensive income | 537,401 | 432,277 | 75,858 | 114,527 | 161,091 | 148,584 | 1,411 | 1,770 | 4,281 | |||||||||||||||||||||||||||
| Comprehensive income attributable | ||||||||||||||||||||||||||||||||||||
| to non-controlling interests | 211,253 | 172,695 | 30,305 | 28,632 | 40,273 | 37,146 | 691 | 868 | 2,098 | |||||||||||||||||||||||||||
| Dividends paid | 65,715 | - | 79,299 | - | - | - | - | - | - | |||||||||||||||||||||||||||
58
Cosan Limited
Notes to the consolidated financial statements
(Amounts in thousands of Brazilian Reais – R$, unless otherwise stated)
| Radar Propriedades Agrícolas S.A. | Radar II Propriedades Agrícolas S.A. | |||||||||||||||||||||||
| Twelve months ended December 31, 2014 | Nine months ended December 31, 2013 | Twelve months ended March 31, 2013 | Twelve months ended December 31, 2014 | Nine months ended December 31, 2013 | Twelve months ended March 31, 2013 | |||||||||||||||||||
| Net sales | 43,883 | 14,433 | 19,828 | - | - | - | ||||||||||||||||||
| Profit before taxes | 164,365 | 94,783 | 190,256 | 50,217 | 15,240 | 42,371 | ||||||||||||||||||
| Income tax expenses | (8,605 | ) | (3,320 | ) | (47,291 | ) | (20 | ) | - | (2 | ) | |||||||||||||
| Profit for the period | 155,760 | 91,463 | 142,965 | 50,197 | 15,240 | 42,369 | ||||||||||||||||||
| Other comprehensive income | 22,157 | 16,017 | - | 3,603 | 2,604 | - | ||||||||||||||||||
| Total comprehensive income | 177,917 | 107,480 | 142,965 | 53,800 | 17,844 | 42,369 | ||||||||||||||||||
| Comprehensive income attributable | ||||||||||||||||||||||||
| to non-controlling interests | 144,255 | 87,145 | 115,916 | 18,830 | 6,245 | 14,829 | ||||||||||||||||||
| Dividends paid | 25,928 | 1,945 | 72,061 | 8,365 | 5,250 | - | ||||||||||||||||||
59
Cosan Limited
Notes to the consolidated financial statements
(Amounts in thousands of Brazilian Reais – R$, unless otherwise stated)
Summarized statements of cash flows(I) | ||||||||||||||||||||||||||||||||||||
| Subsidiaries | ||||||||||||||||||||||||||||||||||||
Companhia de Gás de São Paulo - "COMGÁS" | Rumo Logística Operadora Multimodal S.A. | Radar Propriedades Agrícolas S.A. | ||||||||||||||||||||||||||||||||||
| Twelve months ended December 31, 2014 | Nine months ended December 31, 2013 | Twelve months ended March 31, 2013 | Twelve months ended December 31, 2014 | Nine months ended December 31, 2013 | Twelve months ended March 31, 2013 | Twelve months ended December 31, 2014 | Nine months ended December 31, 2013 | Twelve months ended March 31, 2013 | ||||||||||||||||||||||||||||
| Cash generated from operations | 1,596,064 | 1,081,121 | 453,974 | 105,840 | 229,711 | 341,054 | 68,173 | 29,256 | 80,411 | |||||||||||||||||||||||||||
| Income taxes paid | (111,970 | ) | (121,308 | ) | (174,038 | ) | (34,789 | ) | (2,064 | ) | (38,010 | ) | (10,219 | ) | (4.032 | ) | (10.049 | ) | ||||||||||||||||||
| Net cash generated by | ||||||||||||||||||||||||||||||||||||
| operating activities | 1,484,094 | 959,813 | 279,936 | 71,051 | 227,647 | 303,044 | 57,954 | 25,224 | 70,362 | |||||||||||||||||||||||||||
| Net cash used in investing activities | (661,546 | ) | (610,418 | ) | (294,359 | ) | (262,876 | ) | (187,606 | ) | (265,591 | ) | (21,181 | ) | (24,070 | ) | (33,281 | ) | ||||||||||||||||||
| Net cash provided by | ||||||||||||||||||||||||||||||||||||
| (used in) financing activities | (384,798 | ) | (140,942 | ) | (84,949 | ) | (230,292 | ) | (37,633 | ) | 43,284 | (40,000 | ) | (3,000 | ) | (88,883 | ) | |||||||||||||||||||
| Increase (decrease) in | ||||||||||||||||||||||||||||||||||||
| cash and cash equivalents | 437,750 | 208,453 | (99,372 | ) | (422,117 | ) | 2,408 | 80,737 | (3,227 | ) | (1,846 | ) | (51,802 | ) | ||||||||||||||||||||||
| Cash and cash equivalents at | ||||||||||||||||||||||||||||||||||||
| beginning of period | 535,957 | 327,504 | 426,876 | 496,943 | 494,535 | 413,798 | 9,189 | 10,703 | 62,505 | |||||||||||||||||||||||||||
| Cash and cash | ||||||||||||||||||||||||||||||||||||
| equivalents at end of period | 973,707 | 535,957 | 327,504 | 74,826 | 496,943 | 494,535 | 5,962 | 8,857 | 10,703 | |||||||||||||||||||||||||||
| (I) Information presented for subsidiaries with significant non-controlling interest. | ||||||||||||||||||||||||||||||||||||
60
Cosan Limited
Notes to the consolidated financial statements
(Amounts in thousands of Brazilian Reais – R$, unless otherwise stated)
| 13 | Investment in joint ventures |
In June 2011, the Company entered into an agreement to jointly control two companies:
| (i) | Raízen Combustíveis which owns a network of, approximately, 5,356 fuel service stations throughout Brazil, 62 distribution terminals and 55 airports terminals for supplying aviation fuel; |
| (ii) | Raízen Energia, which produces and sell sugar, ethanol and renders electric energy cogeneration services, the latter mainly from sugar cane bagasse. Raízen Energia is responsible for the production of, approximately, 2 billion liters of ethanol per year to supply the domestic and foreign market, 4 million tons of sugar and 940 MW of installed capacity of electricity. Raízen Energia cultivates harvests and processes sugar cane - the main raw material used in the production of sugar and ethanol. |
Cosan has joint control over Raízen Combustíveis and Raízen Energia by virtue of its 50% share in the equity of both companies and the requirement for unanimous consent by all shareholders over decisions related to the significant activities. The investments have been classified as joint ventures under IFRS 11 and therefore the equity method of accounting is used for all periods presented in these consolidated financial statements.
Changes to investments in joint ventures were as follows:
| Raízen Combustíveis S.A. | Raízen Energia S.A.(I) | Raízen Energia Participações S.A.(I) | Total | |||||||||||||
| Shares issued by investee | 3,303,168,484 | 5,902,595,634 | 5,902,595,634 | |||||||||||||
| Shares held by Cosan | 1,651,584,242 | 2,951,297,817 | 2,951,297,817 | |||||||||||||
| Cosan ownership interest | 50.00 | % | 50.00 | % | 50.00 | % | ||||||||||
| At March 31, 2013 | 3,278,866 | 5,303,875 | - | 8,582,741 | ||||||||||||
| Equity in earnings | ||||||||||||||||
| (losses) of joint ventures | 352,515 | (110,479 | ) | - | 242,036 | |||||||||||
| Other comprehensive income (losses) | (162 | ) | (3,156 | ) | - | (3,318 | ) | |||||||||
| Dividends | (300,449 | ) | (20,000 | ) | - | (320,449 | ) | |||||||||
| Other | (4,288 | ) | 1,537 | - | (2,751 | ) | ||||||||||
| At December 31, 2013 | 3,326,482 | 5,171,777 | - | 8,498,259 | ||||||||||||
| Equity in earnings of joint ventures | 503,176 | 85,252 | - | 588,428 | ||||||||||||
| Other comprehensive income (losses) | (210 | ) | (44,322 | ) | - | (44,532 | ) | |||||||||
| Dividends | (610,982 | ) | (26,912 | ) | - | (637,894 | ) | |||||||||
| Other | - | 242 | - | 242 | ||||||||||||
| At December 31, 2014 | 3,218,466 | 5,186,037 | - | 8,404,503 | ||||||||||||
| (I) | Raízen Energia was a direct subsidiary of Raízen Energia Participações S.A. ("REPSA") until November 30, 2012, at which time REPSA was merged into the company. |
61
Cosan Limited
Notes to the consolidated financial statements
(Amounts in thousands of Brazilian Reais – R$, unless otherwise stated)
The statement of financial position and statement of profit or loss of the joint ventures are disclosed in Note 5, Segments.
The cash flows and comprehensive income of the joint ventures are presented below:
| Raízen Energia S.A. | Raízen Combustíveis S.A. | |||||||||||||||||||||||
| Twelve months ended December 31, 2014 | Nine months ended December 31, 2013 | Twelve months ended March 31, 2013 | Twelve months ended December 31, 2014 | Nine months ended December 31, 2013 | Twelve months ended March 31, 2013 | |||||||||||||||||||
| Cash flow | ||||||||||||||||||||||||
| Operating activities | 3,200,792 | 490,313 | 2,659,558 | 682,720 | 559,917 | 1,456,774 | ||||||||||||||||||
| Investing activities | (2,458,231 | ) | (1,456,505 | ) | (2,530,904 | ) | 981 | 349,623 | (478,335 | ) | ||||||||||||||
| Financing activities | 842,905 | 265,174 | 430,364 | (839,223 | ) | (719,261 | ) | (875,103 | ) | |||||||||||||||
| (Decrease) increase in cash | ||||||||||||||||||||||||
| and cash equivalents | 1,585,466 | (701,018 | ) | 559,018 | (155,522 | ) | 190,279 | 103,336 | ||||||||||||||||
| Other comprehensive | ||||||||||||||||||||||||
| income (losses) | 30,239 | (214,998 | ) | 293,170 | 1,078,945 | 721,444 | 790,724 | |||||||||||||||||
Pursuant to the terms of the Raízen Joint Venture - Framework Agreement, Cosan is responsible for certain legal proceedings that existed prior to the formation of Raízen, net of judicial deposits as of April 1, 2011, as well as tax installments under the REFIS (tax amnesty and refinancing program), recorded in "Other taxes payable". Additionally, Cosan has access to a credit line (stand-by facility) granted to Raízen in the amount of US$500 million, which was unused at December 31, 2014.
62
Cosan Limited
Notes to the consolidated financial statements
(Amounts in thousands of Brazilian Reais – R$, unless otherwise stated)
| 14 | Assets held for sale and investment property |
| Investment property | Assets held for sale | Total | ||||||||||
| At March 31, 2013 | 2,473,438 | 85,426 | 2,558,864 | |||||||||
| Additions | 2,909 | - | 2,909 | |||||||||
| Change in fair value | 125,322 | (3,779 | ) | 121,543 | ||||||||
Transfers (i) | (314,104 | ) | 314,104 | - | ||||||||
| Disposals | (6,056 | ) | (81,647 | ) | (87,703 | ) | ||||||
| At December 31, 2013 | 2,281,509 | 314,104 | 2,595,613 | |||||||||
| Change in fair value | 112,579 | 19,118 | 131,697 | |||||||||
Transfers(i) | 247,890 | (247,890 | ) | - | ||||||||
| Disposals | - | (60,243 | ) | (60,243 | ) | |||||||
| At December 31, 2014 | 2,641,978 | 25,089 | 2,667,067 | |||||||||
| (i) | Land withdrawn from sale and reclassified back to investment properties as objectives not met in commercial negotiations. |
Investment properties include agricultural land located in the Southeast, Midwest and Northeast regions of Brazil, which are leased to third parties and to joint ventures. The lease agreements for the cultivation of sugar cane have an average term of 18 and 10 years for grain.
63
Cosan Limited
Notes to the consolidated financial statements
(Amounts in thousands of Brazilian Reais – R$, unless otherwise stated)
| 15 | Property, plant and equipment |
| Land, buildings and improvements | Machinery, equipment and facilities | Railcars and locomotives | Construction in progress | Other | Total | |||||||||||||||||||
| Cost | ||||||||||||||||||||||||
| At March 31, 2013 | 435,832 | 318,480 | 433,158 | 206,534 | 31,872 | 1,425,876 | ||||||||||||||||||
| Additions | 97 | 6,155 | - | 246,251 | 28 | 252,531 | ||||||||||||||||||
| Disposals | (52 | ) | (1,236 | ) | - | - | (376 | ) | (1,664 | ) | ||||||||||||||
Transfers(i) | 11,363 | 35,863 | 2,906 | (168,523 | ) | 3,576 | (114,815 | ) | ||||||||||||||||
| At December 31, 2013 | 447,240 | 359,262 | 436,064 | 284,262 | 35,100 | 1,561,928 | ||||||||||||||||||
| Depreciation | ||||||||||||||||||||||||
| At March 31, 2013 | (71,079 | ) | (134,068 | ) | (31,361 | ) | - | (11,071 | ) | (247,579 | ) | |||||||||||||
| Additions | (9,341 | ) | (20,151 | ) | (10,223 | ) | - | (2,937 | ) | (42,652 | ) | |||||||||||||
| Disposals | 1 | 156 | - | - | 51 | 208 | ||||||||||||||||||
Transfers(i) | - | 67 | - | - | (62 | ) | 5 | |||||||||||||||||
| At December 31, 2013 | (80,419 | ) | (153,996 | ) | (41,584 | ) | - | (14,019 | ) | (290,018 | ) | |||||||||||||
| At March 31, 2013 | 364,753 | 184,412 | 401,797 | 206,534 | 20,801 | 1,178,297 | ||||||||||||||||||
| At December 31, 2013 | 366,821 | 205,266 | 394,480 | 284,262 | 21,081 | 1,271,910 | ||||||||||||||||||
64
Cosan Limited
Notes to the consolidated financial statements
(Amounts in thousands of Brazilian Reais – R$, unless otherwise stated)
| Land, buildings and improvements | Machinery, equipment and facilities | Railcars and locomotives | Construction in progress | Other | Total | |||||||||||||||||||
| Cost | ||||||||||||||||||||||||
| At December 31, 2013 | 447,241 | 359,263 | 436,065 | 283,937 | 35,417 | 1,561,923 | ||||||||||||||||||
| Additions | 114 | 5,830 | - | 382,737 | - | 388,681 | ||||||||||||||||||
| Disposals | (1,726 | ) | (17,262 | ) | - | 2 | (2,076 | ) | (21,062 | ) | ||||||||||||||
Transfers(i) | 69,228 | 102,258 | 83,928 | (411,359 | ) | 4,261 | (151,684 | ) | ||||||||||||||||
| At December 31, 2014 | 514,857 | 450,089 | 519,993 | 255,317 | 37,602 | 1,777,858 | ||||||||||||||||||
| Depreciation | ||||||||||||||||||||||||
| At December 31, 2013 | (80,418 | ) | (153,994 | ) | (41,584 | ) | - | (14,017 | ) | (290,013 | ) | |||||||||||||
| Additions | (15,807 | ) | (36,810 | ) | (14,104 | ) | - | (4,710 | ) | (71,431 | ) | |||||||||||||
| Disposals | 1,388 | 16,147 | - | - | 1,948 | 19,483 | ||||||||||||||||||
Transfers(i) | (8,778 | ) | 8,753 | - | - | 18 | (7 | ) | ||||||||||||||||
| At December 31, 2014 | (103,615 | ) | (165,904 | ) | (55,688 | ) | - | (16,761 | ) | (341,968 | ) | |||||||||||||
| At December 31, 2013 | 366,823 | 205,269 | 394,481 | 283,937 | 21,400 | 1,271,910 | ||||||||||||||||||
| At December 31, 2014 | 411,242 | 284,185 | 464,305 | 255,317 | 20,841 | 1,435,890 | ||||||||||||||||||
| (i) The balance of transfers relates to amounts reclassified to intangible assets. | ||||||||||||||||||||||||
Capitalization of borrowing costs
Capitalized borrowing costs in the year ended December 31, 2014 amounted to R$ 5,779 (nine months ended December 31, 2013 R$ 6,019; year ended March 31, 2013 R$ 6,593). The weighted average interest rate used to capitalize borrowing costs, that are directly attributable to the acquisition or construction of assets that take a substantial period of time to get ready, was 5.16% p.a. ended December 31, 2014 (5.96% p.a. for the nine months ended December 31, 2013; 5.60% p.a. year ended March 31, 2013).
65
Cosan Limited
Notes to the consolidated financial statements
(Amounts in thousands of Brazilian Reais – R$, unless otherwise stated)
| 16 | Intangible assets |
| Goodwill | Gas distribution concession - COMGÁS | Improvements to public concessions and operating licenses | Trademarks | Customer relationships | Other | Total | ||||||||||||||||||||||
| Cost | ||||||||||||||||||||||||||||
| At March 31, 2013 | 705,816 | 7,742,140 | 618,878 | 252,474 | 597,193 | 143,535 | 10,060,036 | |||||||||||||||||||||
| Additions | - | 557,220 | - | - | 125,408 | 40,960 | 723,588 | |||||||||||||||||||||
| Disposals | (1,860 | ) | (26,940 | ) | - | - | (3,415 | ) | (50 | ) | (32,265 | ) | ||||||||||||||||
Transfers(i) | - | - | 132,677 | - | - | 16,380 | 149,057 | |||||||||||||||||||||
| Business combination | - | 34,862 | - | - | - | - | 34,862 | |||||||||||||||||||||
| At December 31, 2013 | 703,956 | 8,307,282 | 751,555 | 252,474 | 719,186 | 200,825 | 10,935,278 | |||||||||||||||||||||
| Depreciation | ||||||||||||||||||||||||||||
| At March 31, 2013 | - | (127,048 | ) | (42,633 | ) | (97,012 | ) | (151,121 | ) | (27,324 | ) | (445,138 | ) | |||||||||||||||
| Additions | - | (197,233 | ) | (25,244 | ) | (17,120 | ) | (123,275 | ) | (34,101 | ) | (396,973 | ) | |||||||||||||||
| Disposals | - | 17,844 | - | - | 1,276 | - | 19,120 | |||||||||||||||||||||
Transfers(i) | - | - | (34,242 | ) | - | - | (5 | ) | (34,247 | ) | ||||||||||||||||||
| At December 31, 2013 | - | (306,437 | ) | (102,119 | ) | (114,132 | ) | (273,120 | ) | (61,430 | ) | (857,238 | ) | |||||||||||||||
| At March 31, 2013 | 705,816 | 7,615,092 | 576,245 | 155,462 | 446,072 | 116,211 | 9,614,898 | |||||||||||||||||||||
| At December 31, 2013 | 703,956 | 8,000,845 | 649,436 | 138,342 | 446,066 | 139,395 | 10,078,040 | |||||||||||||||||||||
66
Cosan Limited
Notes to the consolidated financial statements
(Amounts in thousands of Brazilian Reais – R$, unless otherwise stated)
| Goodwill | Gas distribution concession - COMGÁS | Improvements to public concessions and operating licenses | Trademarks | Customer relationships | Other | Total | ||||||||||||||||||||||
| Cost | ||||||||||||||||||||||||||||
| At December 31, 2013 | 703,956 | 9,528,471 | 751,555 | 252,474 | 1,121,425 | 357,103 | 12,714,984 | |||||||||||||||||||||
| Additions | - | 502,941 | - | - | 149,236 | 22,554 | 674,731 | |||||||||||||||||||||
| Disposals | - | (19,774 | ) | - | - | (6,773 | ) | (1 | ) | (26,548 | ) | |||||||||||||||||
Transfers(i) | - | (675 | ) | 146,965 | - | 675 | 4,719 | 151,684 | ||||||||||||||||||||
| At December 31, 2014 | 703,956 | 10,010,963 | 898,520 | 252,474 | 1,264,563 | 384,375 | 13,514,851 | |||||||||||||||||||||
| Depreciation | ||||||||||||||||||||||||||||
| At December 31, 2013 | - | (1,527,626 | ) | (102,119 | ) | (114,132 | ) | (675,359 | ) | (217,708 | ) | (2,636,944 | ) | |||||||||||||||
| Additions | - | (343,956 | ) | (40,714 | ) | (22,830 | ) | (155,582 | ) | (45,684 | ) | (608,766 | ) | |||||||||||||||
| Disposals | - | 13,898 | - | - | 3,420 | (97 | ) | 17,221 | ||||||||||||||||||||
Transfers(i) | - | - | - | - | - | 11 | 11 | |||||||||||||||||||||
| At December 31, 2014 | - | (1,857,684 | ) | (142,833 | ) | (136,962 | ) | (827,521 | ) | (263,478 | ) | (3,228,478 | ) | |||||||||||||||
| At December 31, 2013 | 703,956 | 8,000,845 | 649,436 | 138,342 | 446,066 | 139,395 | 10,078,040 | |||||||||||||||||||||
| At December 31, 2014 | 703,956 | 8,153,279 | 755,687 | 115,512 | 437,042 | 120,897 | 10,286,373 | |||||||||||||||||||||
| (i) The balance of transfers relates to amounts reclassified to intangible assets. | ||||||||||||||||||||||||||||
67
Cosan Limited
Notes to the consolidated financial statements
(Amounts in thousands of Brazilian Reais – R$, unless otherwise stated)
Capitalization of borrowing costs
Capitalized borrowing costs in the year ended December 31, 2014, amounted to R$ 20,891 (nine months ended December 31, 2013 R$ 25,973; year ended March 31, 2013 R$ 7,279). The weighted average interest rate used to capitalize borrowing costs, that are directly attributable to the acquisition or construction of assets that take a substantial period of time to get ready, was 10.93% p.a. ended December 31, 2014 (8.40% p.a. for the nine months ended December 31, 2013; 8.32% p.a. year ended March 31, 2013).
Intangible assets (excluding goodwill) | Annual rate of amortization - % | December 31, 2014 | December 31, 2013 | |||||||||
Gas distribution concession - COMGÁS(i) | Concession term | 8,153,279 | 8,000,845 | |||||||||
Improvements to public rail concessions(ii) | Concession term | 505,237 | 387,245 | |||||||||
Operating license for port terminal(iii) | 4.00 | 250,450 | 262,190 | |||||||||
| 755,687 | 649,435 | |||||||||||
| Trademarks | ||||||||||||
| Mobil | 10.00 | 91,308 | 114,138 | |||||||||
| Comma | - | 24,204 | 24,204 | |||||||||
| 115,512 | 138,342 | |||||||||||
| Relationship with customers | ||||||||||||
| COMGÁS | 20.00 | 375,119 | 375,184 | |||||||||
| Lubricants | 6.00 | 61,923 | 70,883 | |||||||||
| 437,042 | 446,067 | |||||||||||
| Other | ||||||||||||
| Software licenses | 20.00 | 83,889 | 91,695 | |||||||||
| Other | - | 37,008 | 47,700 | |||||||||
| 120,897 | 139,395 | |||||||||||
| 9,582,417 | 9,374,084 | |||||||||||
| (i) | Refers to the intangible asset for the public gas distribution service concession, which represents the right to charge users for the supply of gas, comprised of: (i) the concession rights recognized in the business combination and (ii) concession assets (Note 3). The amortization term is 39 years (the remaining concession period, plus extension); |
| (ii) | Refers to improvements made to the Federal Government rail network in relation to the transportation services provided by Rumo (Note 3); and |
| (iii) | Port operating license and customer relationships of Rumo, from the business combinations. |
Impairment testing of cash-generating units containing goodwill
The Company tests the recoverable amounts of goodwill arising from business combination transactions annually. Property, plant and equipment and definite life intangible assets, that are subject to depreciation and amortization are tested for impairment whenever events or changes in circumstances indicate that the carrying amounts may not be recoverable.
68
Cosan Limited
Notes to the consolidated financial statements
(Amounts in thousands of Brazilian Reais – R$, unless otherwise stated)
During the year ended December 31, 2014, no impairment indicator was identified that would trigger the performance of an impairment test.
The combined carrying amounts of goodwill allocated to cash generating units are as follows:
| December 31, 2014 | December 31, 2013 | |||||||
| Cash-generating unit - Lubricants | 603,462 | 603,462 | ||||||
| Fair value less costs to spin-off - Rumo | 100,451 | 100,451 | ||||||
| Cash-generating unit - Other Businesses | 43 | 43 | ||||||
| Total goodwill | 703,956 | 703,956 | ||||||
The recoverable amount is determined by reference to the value in use, using the discounted cash flows model, based on management’s estimated budget information which takes into consideration assumptions related to each business, using market available information as well as previous performance, and the fair value less costs to sell. Discounted cash flows are estimated for a period of 5 to 10 years and in perpetuity assuming a real growth rate of zero. Management considers it is appropriate to estimate cash flows for a period longer than five years as this reflects the estimated period of use of the asset groups and businesses involved.
The main assumptions and estimates involved are the following: (i) Rumo: the recoverable amount was determined by the fair value method, using as a basis the price that would be received to sell an asset or that would be paid by transferring a liability in an orderly transaction between market participants at the measurement date, (ii) Lubricants: expected growth in operations based on expected segmented GDP and other macroeconomic factors, as well as expected sales price of commodities.
Future cash flows are discounted using discount rates between 5.6% and 11.8% (weighted average cost of capital) that reflect specific risks relating to the significant assets in each cash-generating unit.
The impairment test performed as of December 31, 2014 did not result in the need to recognize impairment losses on the carrying value of intangible assets or goodwill. The determination of the recoverability of assets depends on certain key assumptions, as described above, which are influenced by current market, technological and economic conditions. These tests are not indicative of future impairment losses and/or whether they would be material.
69
Cosan Limited
Notes to the consolidated financial statements
(Amounts in thousands of Brazilian Reais – R$, unless otherwise stated)
| 17 | Loans and borrowings |
| Interest | ||||||||||||||||||||
Description(i) | Index(ii) | Annual interest(iii) | December 31, 2014 | December 31, 2013 | Matures | |||||||||||||||
| Senior Notes Due 2023 | US$ | 5.00 | % | 1,352,796 | 1,086,716 | Mar-2023 | ||||||||||||||
| Perpetual Notes | US$ | 8.25 | % | 1,344,760 | 1,186,221 | - | ||||||||||||||
| Senior Notes Due 2018 | Fixed | 9.50 | % | 874,494 | 873,589 | Mar-2018 | ||||||||||||||
| BNDES | TJ462 | 7.80 | % | 834,565 | 525,636 | Oct-2020 | ||||||||||||||
| EIB | US$ + LIBOR | 2.07 | % | 691,463 | 633,223 | Sep-2021 | ||||||||||||||
| Resolution 4131 | US$ + LIBOR | 2.72 | % | 466,494 | 413,477 | Feb-2018 | ||||||||||||||
| FINAME | URTJLP | 6.93 | % | 457,570 | 428,916 | May-2022 | ||||||||||||||
| Non-convertible debentures | Fixed rate + IPCA | 11.98 | % | 447,386 | 417,231 | Sep-2020 | ||||||||||||||
| FINAME | Fixed | 4.04 | % | 307,230 | 277,298 | Nov-2022 | ||||||||||||||
| BNDES | TJLP | 7.75 | % | 288,209 | 526,716 | Oct-2018 | ||||||||||||||
| BNDES | Selic | 14.17 | % | 274,000 | 159,894 | Oct-2020 | ||||||||||||||
| Resolution 4131 | US$ + LIBOR | 1.59 | % | 266,006 | - | Nov-2015 | ||||||||||||||
| Foreign loans | LIBOR Sterling | 3.88 | % | 224,047 | 209,340 | Dec-2019 | ||||||||||||||
| FINEP | Fixed | 5.00 | % | 165,032 | 89,104 | Nov-2020 | ||||||||||||||
| Working capital | US$ + LIBOR | 4.18 | % | 133,185 | 262,796 | Sep-2016 | ||||||||||||||
| Non-convertible debentures | CDI | 11.81 | % | 131,229 | 164,144 | Sep-2019 | ||||||||||||||
| Working capital | CDI + 1.20% | 12.91 | % | 101,515 | - | Oct-2017 | ||||||||||||||
| Working capital | CDI + 1.43% | 13.17 | % | 85,628 | - | Sep-2016 | ||||||||||||||
| Resolution 4131 | US$ | 1.18 | % | 29,338 | - | Aug-2015 | ||||||||||||||
| Finem | URTJLP | 6.66 | % | 13,231 | - | Jan-2022 | ||||||||||||||
| Finem | IPCA | 14.60 | % | 3,483 | - | Nov-2021 | ||||||||||||||
| Finem | Fixed | 3.50 | % | 3,420 | - | Jan-2024 | ||||||||||||||
| Credit notes | 110.00% CDI | - | - | 393,646 | - | |||||||||||||||
| Leasing | 100.00% | - | - | 1,068 | - | |||||||||||||||
| Non-convertible debentures | 123.00% CDI | - | - | 1,443,941 | - | |||||||||||||||
| Other | - | 7,559 | - | - | ||||||||||||||||
| 8,502,640 | 9,092,956 | |||||||||||||||||||
| Current | 1,056,353 | 1,050,862 | ||||||||||||||||||
| Non-current | 7,446,287 | 8,042,094 | ||||||||||||||||||
| (i) | Loans and borrowings are guaranteed by promissory notes and endorsements of the Company and controlling shareholders, besides other guarantees, such as: (i) credit rights originated from the expansion contracts of the logistic segment and gas distribution (BNDES), (ii) underlying assets (property, plant and equipment and intangible assets) being financed (FINAME) in an amount of R$1,738,661 (R$970,974 in 2013); |
| (ii) | TJLP and URTJLP are long-term interest rates on BNDES (Brazilian National Economic and Social Development Bank) loans. Selic is the benchmark interest rate set by the Brazilian Central Bank. CDI is a benchmark interbank lending rate in Brazil. IPCA is a benchmark consumer price index; |
| (iii) | As at December 31, 2014, unless otherwise indicated. |
70
Cosan Limited
Notes to the consolidated financial statements
(Amounts in thousands of Brazilian Reais – R$, unless otherwise stated)
Non-current borrowings are scheduled to fall due as follows:
| December 31, 2014 | December 31, 2013 | |||||||
| 13 to 24 months | 751,980 | 595,917 | ||||||
| 25 to 36 months | 944,817 | 666,297 | ||||||
| 37 to 48 months | 1,874,414 | 650,006 | ||||||
| 49 to 60 months | 672,319 | 1,626,221 | ||||||
| 61 to 72 months | 435,042 | 1,101,334 | ||||||
| 73 to 84 months | 79,978 | 1,071,570 | ||||||
| 85 to 96 months | 4,535 | 65,043 | ||||||
| Thereafter | 2,683,202 | 2,265,706 | ||||||
| 7,446,287 | 8,042,094 | |||||||
Senior Notes Due in 2018
On March 19, 2013, the Company issued Senior Notes in the international capital market under “Regulation S” and “Rule 144A” in the amount of R$ 850,000, bearing annual interest of 9.5%, payable semiannually in September and March of each year.
Senior Notes Due in 2023
On March 14, 2013, the Company issued Senior Notes in the international capital market under “Regulation S” and “Rule 144A” in the amount of US$ 500,000 thousand, bearing annual interest of 5%, payable semiannually in September and March of each year. Cross-currency interest rate swaps have been entered into to mitigate the Company’s exposure to interest rate and foreign exchange risks.
BNDES
Refers to the financing of expansion of the logistics segment and gas distribution.
Perpetual Notes
On November 5, 2010 and July 13, 2011 Cosan Overseas Limited issued US$ 500,000 thousand of perpetual notes in the international capital market under “Regulation S”, bearing annual interest of 8.25%, payable quarterly. Cross-currency interest rate swaps have been entered into to mitigate the Company’s exposure to interest rate and foreign exchange risks.
Bank debt – Working capital
On October 4, 2011, the Company entered into a bank loan agreement for US$ 100,000 thousand due in 2016, bearing annual interest of LIBOR + 4.58%. Proceeds were used to purchase the Company's own shares.
On September 3, 2013, the Company entered into a loan agreement for US$35,000 thousand due in 2016, bearing annual interest of LIBOR + 2.55%, LIBOR + 2.35% and LIBOR + 2.15%, for the first, second and third years, respectively.
71
Cosan Limited
Notes to the consolidated financial statements
(Amounts in thousands of Brazilian Reais – R$, unless otherwise stated)
On October 28, 2014, the Company entered into a loan agreement for US$ 40,000 thousand (then equivalent to R$ 99,500) due in 2017, bearing annual interest of CDI + 1.20%. Proceeds were used to refinance part of the 2011 debt.
FINAME
Refers to FINAME funding (Federal Government Machinery and Equipment Financing Program), through various financial institutions, intended to be used for investments in property, plant and equipment and intangible assets. Interest is payable monthly and the principal is secured by liens on the financed assets.
Foreign currency loans
On December 22, 2014, Cosan Lubes Investment renegotiated its loan maturing in December 2019; including the grace period for the principal amount of two and a half years. The original loan was disbursed on June 29, 2012, for a principal amount of £ 54,000 thousand and was obtained in order to acquire control of Comma Oil and Chemicals Limited in July 2012.
EIB – European Investment Bank
Refers to loans denominated in U.S. Dollars, bearing interest at LIBOR and maturing in 2021. Cross-currency interest rate swaps have been entered into to mitigate the Company’s exposure to interest rate and foreign exchange risks. The funds were used to expand and support the natural gas distribution network.
Non-convertible debentures
On August 5, 2008, COMGÁS concluded the placement of a simple non-convertible debentures, indivisible at a par value of R$ 100,000. On August 2012, 2013 and 2014 the Company repaid accumulated total of 100% of the principal.
On September 15, 2013, COMGÁS concluded the placement of a three tranche non-convertible debentures, indivisible at par value totaling R$ 540,000. The final maturity is September, 2020.
In June 2014 Cosan pre-paid 100% of the principal of the debentures issued in 2012 in the total amount of R$ 1,400,000.
FINEP
In November 2012, Cosan Biomassa S.A. obtained a bank loan of R$ 89,694, maturing in January 2021. The same agreement provides for three more draw down installments, totaling R$ 254,890, bearing interest of 5% per year. These funds will be used for the development, production and marketing plan of new industrial technologies for the processing of biomass derived from sugar cane or other sources.
Promissory Notes
On March 1, 2013, COMGÁS concluded the issuance of 400 Promissory Notes at a par value of R$ 1,000, totaling R$ 400,000 with a maturity period of 270 days.
The amortization of the principal and interest occurred upon maturity.
72
Cosan Limited
Notes to the consolidated financial statements
(Amounts in thousands of Brazilian Reais – R$, unless otherwise stated)
Covenants
The Company and its subsidiaries are subject to certain restrictive financial covenants set forth in existing loans and financing agreements in relation to certain financial and non-financial indicators. Covenants are required to be calculated on an annual basis, at the end of each fiscal year.
As at December 31, 2014, Cosan, its subsidiaries and joint ventures were in compliance with all debt covenants.
The carrying amounts and fair value of loans and borrowings are as follows:
| Carrying amount | Fair value(i) | |||||||||||||||
| December 31, 2014 | December 31, 2013 | December 31, 2014 | December 31, 2013 | |||||||||||||
| Senior / Perpetual Notes | 3,572,050 | 3,174,894 | 3,356,788 | 2,977,658 | ||||||||||||
| Financing | 4,930,590 | 5,918,062 | 4,930,590 | 5,918,062 | ||||||||||||
| Total | 8,502,640 | 9,092,956 | 8,287,378 | 8,895,720 | ||||||||||||
| (i) Senior / Perpetual Notes and Financing were measured at fair value using Level “1” and “Level 2” inputs, respectively (Note 32). | ||||||||||||||||
| The carrying amounts of loans and borrowings are denominated in the following currencies: | ||||||||||||||||
| December 31, 2014 | December 31, 2013 | |||||||||||||||
| US Dollar | 4,284,042 | 3,605,532 | ||||||||||||||
| Brazilian Real | 3,994,551 | 5,278,084 | ||||||||||||||
| Pound Sterling | 224,047 | 209,340 | ||||||||||||||
| Total | 8,502,640 | 9,092,956 | ||||||||||||||
| 18 | Trade payables |
| December 31, 2014 | December 31, 2013 | |||||||
| Natural gas suppliers | 749,021 | 590,168 | ||||||
| Materials and service suppliers | 363,438 | 272,261 | ||||||
| 1,112,459 | 862,429 | |||||||
73
Cosan Limited
Notes to the consolidated financial statements
(Amounts in thousands of Brazilian Reais – R$, unless otherwise stated)
| 19 | Other taxes payable |
| December 31, 2014 | December 31, 2013 | |||||||
| Tax Amnesty and | ||||||||
Refinancing Program - REFIS(I) | 524,703 | 1,075,019 | ||||||
| ICMS – State VAT | 67,777 | 77,466 | ||||||
| COFINS- Revenue tax | 18,702 | 30,470 | ||||||
| PIS - Revenue tax | 2,511 | 5,170 | ||||||
| INSS - Social security | 2,739 | 2,842 | ||||||
| Other | 25,874 | 18,856 | ||||||
| 642,306 | 1,209,823 | |||||||
| Current | 307,741 | 199,056 | ||||||
| Non-current | 334,565 | 1,010,767 | ||||||
| (I) | Tax amnesty and refinancing program (REFIS) for the settlement of amounts due for qualifying Brazilian federal taxes. |
Provisional Measure 651 was enacted through Law 13.043 on November 14, 2014 providing an option to join a Tax Amnesty and Refinancing Program (REFIS) to settle specified tax obligations by paying at least 30% in cash, utilizing tax loss carryforwards and reducing amounts owed for penalties and late payment interest accruals. Law 11.941/09 provided for similar benefits. The REFIS permitted the Company to settle tax obligations of R$ 578,182 (including unrecorded provisions related to possible tax loss contingencies of R$ 9,330) through cash payments of R$ 145,015, reduction of R$ 28,440 recognized as gain on REFIS liability and the offset of R$ 404,728 of tax loss carryforwards (being R$ 173,559 from the Company, including R$ 3,684 of unrecognized tax loss carryforwards, and R$ 231,168 from its joint ventures). The gain on REFIS liability was recorded in the statement of profit or loss in "Other expenses, net" (Note 29). The balance of tax obligations at December 31, 2014 of R$ 524,703 is subject to interest and indexation based on the SELIC index. The tax obligation and settlement process is still subject to final ratification by the tax authorities.
74
Cosan Limited
Notes to the consolidated financial statements
(Amounts in thousands of Brazilian Reais – R$, unless otherwise stated)
| 20 | Income tax and social contribution |
| a) | Reconciliation of income and social contribution tax expenses |
| Twelve months ended December 31, 2014 | Nine months ended December 31, 2014 | Twelve months ended March 31, 2013 | ||||||||||
| Profit before taxes | 686,308 | 539,180 | 920,886 | |||||||||
| Income tax and social contribution at | ||||||||||||
| nominal rate (34%) | (233,345 | ) | (183,321 | ) | (313,101 | ) | ||||||
| Adjustments to reconcile nominal to effective tax rate | ||||||||||||
| Equity method investments | ||||||||||||
| (non taxable income) | 201,269 | 84,161 | 229,270 | |||||||||
| Differences in tax rates on entities under | ||||||||||||
| Brazilian presumed profits tax regime | 51,398 | 38,922 | 40,841 | |||||||||
| Judicial demand related to income tax | 13,839 | - | - | |||||||||
| REFIS discounts granted | 9,972 | - | - | |||||||||
| Non taxable foreign exchange | ||||||||||||
| gains of foreign subsidiaries | 2,956 | 1,371 | 43,516 | |||||||||
| Differences in tax rates on | ||||||||||||
| earnings / losses of overseas companies | 2,465 | (14,788 | ) | (9,141 | ) | |||||||
| Stock options | (4,400 | ) | (2,242 | ) | (4,521 | ) | ||||||
| Off-book tax loss carryforwards | ||||||||||||
| now recorded (write-offs), net | (8,195 | ) | 67,367 | (60,994 | ) | |||||||
| Interest on capital (net received) | (13,380 | ) | (15,292 | ) | (19,531 | ) | ||||||
| Non-deductible expenses | ||||||||||||
| (donations, gifts, etc.) | (19,232 | ) | (3,859 | ) | (3,944 | ) | ||||||
| Write off of tax loss | ||||||||||||
carryforwards - Partial spin-off (i) | (35,469 | ) | - | - | ||||||||
| Other | (11,707 | ) | (11,513 | ) | (28,748 | ) | ||||||
| Income tax and social contribution | ||||||||||||
| expense (current and deferred) | (43,829 | ) | (39,194 | ) | (126,353 | ) | ||||||
| Effective rate - % | 6.39 | 7.27 | 13.72 | |||||||||
(i) “Partial Spin-off” of Cosan S.A. and merger of the spun-off portion into Cosan Log (Note 1).
75
Cosan Limited
Notes to the consolidated financial statements
(Amounts in thousands of Brazilian Reais – R$, unless otherwise stated)
| b) | Deferred income tax assets and liabilities |
| December 31, 2014 | December 31, 2013 | |||||||||||||||||||
| Basis | Income taxes (25%) | Social contribution (9%) | Total income taxes (34%) | Total income taxes (34%) | ||||||||||||||||
| Tax loss carryforwards | ||||||||||||||||||||
| Income tax loss carryforwards | 1,276,670 | 319,168 | - | 319,168 | 282,656 | |||||||||||||||
| Social contribution tax loss carryforwards | 1,295,308 | - | 116,578 | 116,578 | 102,410 | |||||||||||||||
| Temporary differences | ||||||||||||||||||||
| Foreign currency gain / losses | 892,613 | 223,153 | 80,335 | 303,488 | 11,603 | |||||||||||||||
| Tax deductible goodwill | 876,771 | 219,193 | 78,909 | 298,102 | 514,893 | |||||||||||||||
| Provision for judicial demands | 540,337 | 135,084 | 48,630 | 183,714 | 173,477 | |||||||||||||||
| Allowance for doubtful accounts | 157,015 | 39,254 | 14,131 | 53,385 | 54,258 | |||||||||||||||
| Profit sharing | 33,367 | 8,342 | 3,003 | 11,345 | 67,057 | |||||||||||||||
| Derivatives instruments unrealized (gains) losses | (371,622 | ) | (92,905 | ) | (33,446 | ) | (126,351 | ) | 107,489 | |||||||||||
| Unrealized gain on sale of investments | (55,211 | ) | (13,803 | ) | (4,969 | ) | (18,772 | ) | (30,894 | ) | ||||||||||
| Other temporary differences | (98,207 | ) | (24,552 | ) | (8,839 | ) | (33,391 | ) | (17,390 | ) | ||||||||||
| Property, plant and equipment | (122,557 | ) | (30,639 | ) | (11,030 | ) | (41,669 | ) | (28,017 | ) | ||||||||||
| Gain on formation of joint ventures | (3,338,342 | ) | (834,585 | ) | (300,451 | ) | (1,135,036 | ) | (1,135,042 | ) | ||||||||||
| Unrealized gains on investment properties | (2,428,595 | ) | (48,572 | ) | (26,229 | ) | (74,801 | ) | (70,309 | ) | ||||||||||
| Assets held for sale | (25,090 | ) | (502 | ) | (271 | ) | (773 | ) | (9,636 | ) | ||||||||||
| Concession contract | 44,284 | 11,071 | 3,986 | 15,057 | 11,579 | |||||||||||||||
| Regulatory asset | 242,654 | 60,664 | 21,839 | 82,503 | 118,228 | |||||||||||||||
| Gains or losses on actuarial liabilities | 257,630 | 64,407 | 23,187 | 87,594 | 41,593 | |||||||||||||||
| Business combination - Property, plant and equipment | (107,629 | ) | (26,907 | ) | (9,687 | ) | (36,594 | ) | (38,098 | ) | ||||||||||
| Business combination - Intangible assets | (4,090,448 | ) | (1,022,612 | ) | (368,140 | ) | (1,390,752 | ) | (1,441,910 | ) | ||||||||||
| Business combination - Other fair value adjustments | (72,097 | ) | (18,024 | ) | (6,489 | ) | (24,513 | ) | (17,706 | ) | ||||||||||
| Other | (333,507 | ) | (83,376 | ) | (30,016 | ) | (113,392 | ) | (162,675 | ) | ||||||||||
| Total net liability | (1,116,141 | ) | (408,969 | ) | (1,525,110 | ) | (1,466,434 | ) | ||||||||||||
| Deferred income tax - Assets | 214,164 | 232,188 | ||||||||||||||||||
| Deferred income tax - Liabilities | (1,739,274 | ) | (1,698,622 | ) | ||||||||||||||||
| Total net deferred taxes | (1,525,110 | ) | (1,466,434 | ) | ||||||||||||||||
76
Cosan Limited
Notes to the consolidated financial statements
(Amounts in thousands of Brazilian Reais – R$, unless otherwise stated)
| c) | Recoverability of deferred tax assets |
In assessing the recoverability of deferred tax assets, management estimates future taxable income and the timing of reversal of the temporary differences.
Deferred income tax assets are recognized only to the extent that it is probable that future taxable profit will be available against which the temporary differences can be utilized. Under Brazilian tax law, tax loss carryforwards do not expire, however, their use is limited to 30% of annual taxable income.
At December 31, 2014, the Company expects to realize deferred taxes on loss carry forwards on income tax and social contribution as follows:
| December 31, 2014 | ||||
| No later than 1 year | 6,646 | |||
| Later than 1 year and no later than 5 years | 64,427 | |||
| Later than 5 years | 364,673 | |||
| Total | 435,746 | |||
| d) | Changes in deferred income taxes, net: |
| At March 31, 2013 – Net deferred tax liability | (1,545,908 | ) | ||
| Recorded through income | 90,782 | |||
| Recorded through other comprehensive income | (15,795 | ) | ||
| Securities | (4,668 | ) | ||
| Tax benefit of goodwill amortization | 11,003 | |||
| Other | (1,848 | ) | ||
| At December 31, 2013 – Net deferred tax liability | (1,466,434 | ) | ||
| Recorded through income | 112,673 | |||
| Recorded through other comprehensive income | (19,073 | ) | ||
| Acquisition cost of the preferred shares in subsidiaries | 18,450 | |||
| Use of tax loss carryforward - REFIS | (173,559 | ) | ||
| Other | 2,833 | |||
| At December 31, 2014 - Net deferred tax liability | (1,525,110 | ) |
77
Cosan Limited
Notes to the consolidated financial statements
(Amounts in thousands of Brazilian Reais – R$, unless otherwise stated)
| 21 | Provision for legal proceedings |
| Provision for legal proceedings | Judicial deposits | |||||||||||||||
| December 31, 2014 | December 31, 2013 | December 31, 2014 | December 31, 2013 | |||||||||||||
| Tax | 343,038 | 410,890 | 319,444 | 294,991 | ||||||||||||
| Civil | 139,268 | 146,011 | 48,445 | 33,659 | ||||||||||||
| Labor | 175,473 | 165,557 | 50,496 | 32,904 | ||||||||||||
| 657,779 | 722,458 | 418,385 | 361,554 | |||||||||||||
Changes in provision for legal proceedings:
| Tax | Civil | Labor | Total | |||||||||||||
| At December 31, 2013 | 410,890 | 146,011 | 165,557 | 722,458 | ||||||||||||
| Accruals | 11,962 | 12,882 | 86,241 | 111,085 | ||||||||||||
| Write-off / Reversals | (89,581 | ) | (9,303 | ) | (49,147 | ) | (148,032 | ) | ||||||||
| Settlement | (1,070 | ) | (17,164 | ) | (31,902 | ) | (50,135 | ) | ||||||||
| Indexation and interest charges | 10,837 | 6,842 | 4,724 | 22,403 | ||||||||||||
| At December 31, 2014 | 343,038 | 139,268 | 175,473 | 657,779 | ||||||||||||
Judicial claims deemed to be probable losses, fully accrued
| a) | Tax claims |
| December 31, 2014 | December 31, 2013 | |||||||
FINSOCIAL offsetting(i) | 241,739 | 230,775 | ||||||
INSS - Social security(ii) | 47,449 | 46,291 | ||||||
State VAT - ICMS credits(iii) | 24,231 | 20,114 | ||||||
IPC - 1989(iv) | - | 74,879 | ||||||
| Other | 29,619 | 38,831 | ||||||
| 343,038 | 410,890 | |||||||
| (i) | During the period from October 2003 to November 2006 Cosan Combustíveis e Lubrificantes S.A. “Cosan CL” offset the FINSOCIAL tax against several other federal taxes, based on a final court decision in September 2003 following a decision that challenged the constitutionality of the FINSOCIAL. No judicial deposits were made. |
| (ii) | Mainly related to social security contributions, which are being challenged on the grounds of constitutionality. Judicial deposits have been made for the corresponding amounts. |
| (iii) | A considerable portion of the amount accrued as ICMS was paid in cash under the provisions of Decree Nº 58,811 issued on December 27, 2012, which established the State of São Paulo Special Installment Program of ICMS (a.k.a. PEP-ICMS). The amounts that have been |
78
Cosan Limited
Notes to the consolidated financial statements
(Amounts in thousands of Brazilian Reais – R$, unless otherwise stated)
| provisioned refer to tax assessments by the tax authorities related to several types of ICMS credits. Amongst them: (a) assessment notice related to ICMS payments for the purchase of raw materials which are considered for “use and consumption”, therefore, not eligible for compensation; (b) assessment, as sole obligor, for withholding of ICMS on tolling agreement from an agricultural partnership with Central Paulista Ltda. Açúcar e Álcool. |
| (iv) | In 1993, CLE filed a lawsuit to challenge the balance sheet inflation accounting index (“IPC”) established by the Federal Government in 1989, considering that this index did not reflect the actual rate of inflation. The use of this index led the Company to overpay income and social contribution taxes. CLE obtained a favorable preliminary court ruling that allowed it to recalculate its financial position, using indices that better reflected the actual inflation over the period. In doing so the Company adjusted the amounts of income and social contribution taxes payable and offset the overpayments in subsequent years until 1997. Despite the favorable court rulings, the tax authorities issued a notice of infringement to the Company challenging all of the taxes that were offset. As the contingency is now considered to be a remote loss, the provision of R$ 75,144 was reversed, being the amounts of R$ 13,839 recorded under income tax expense and R$ 61,305 recorded under interest expenses. |
| b) | Civil and environmental |
The Company and its subsidiaries are party to a number of civil and legal claims related to (i) indemnification for material and moral damages, (ii) public civil claims related to burning of sugarcane stubble, and (iii) environmental matters.
The Company and its subsidiaries are also party to a number of labor claims filed by former employees and service providers challenging, among other things, unpaid overtime, night shift premiums and risk premiums, employment guarantees, and the reimbursement of withholdings from payroll such as social contributions and trade union charges.
Judicial claims deemed as possible losses, and therefore not accrued
| a) | Tax claims |
| December 31, 2014 | December 31, 2013 | |||||||
ICMS - State VAT(i) | 1,572,934 | 1,291,685 | ||||||
Federal income taxes(ii) | 751,495 | 726,815 | ||||||
PIS and COFINS - Revenue taxes(iii) | 680,065 | 506,813 | ||||||
IRRF - Withholding tax(iv) | 656,087 | 637,130 | ||||||
INSS - Social security and other(v) | 530,223 | 508,053 | ||||||
IPI - Excise tax credit - NT(vi) | 441,707 | 430,981 | ||||||
IPI offsetting - IN 67/98(vii) | 118,865 | 115,004 | ||||||
| Other | 648,850 | 637,619 | ||||||
| 5,400,226 | 4,854,100 | |||||||
79
Cosan Limited
Notes to the consolidated financial statements
(Amounts in thousands of Brazilian Reais – R$, unless otherwise stated)
| (i) | ICMS |
State VAT: Refers mainly to (i) tax assessments filed against the Company for unpaid ICMS and non-compliance with accessory obligations, in connection with the tolling services partnership with Central Paulista Açúcar e Álcool Ltda. in specified periods in 2006 and in 2007; (ii) ICMS levied on the remittances for the export of crystallized sugar, which the Company understands are tax exempted. However, the tax authorities, classify crystallized sugar as a semi-finished product, therefore subject to ICMS; (iii) penalties related to the withholding of ICMS taxes on the sale of ethanol to customers residing in other states; (iv) ICMS withholding rate differences on the sale of ethanol to companies located in other states, which subsequently had their tax registrations revoked; and (v) disallowance of ICMS tax credits on the sale of diesel fuel to customers engaged in the agro industrial business. The State Tax Administration understands that because the diesel fuel sold is for agricultural use, which is not Company’s core business, ICMS cannot be offset and (vi) ICMS payments on inventory differences arising from erroneous calculations by the State Tax Administration.
| (ii) | Income taxes – Assessment notice |
| a) | In December 2011, the Company received an assessment notice claiming unpaid income and social contribution taxes for the period from 2006 to 2009, for an amount of R$ 446,444 (September 2013). Such claim is based on the following: (i) tax benefits that arose from the deduction of goodwill amortization, (ii) the offsetting of tax carry forwards and (iii) taxes on revaluation differences of the property, plant and equipment. The Company filed its defense in January 2012 and has classified any potential loss as possible, consistent with the opinion of its legal advisors. The Company quantified such possible loss in the amount of R$ 221,780. |
| b) | In June 2013, the Company received an assessment notice claiming unpaid income and social contribution taxes for the period from 2009 to 2011 of R$ 401,904, corresponding to the deduction of goodwill amortization. The Company challenged this assessment and has classified any potential loss as possible, consistent with the position of its legal advisors. The Company has quantified the possible loss in the amount of R$ 291,724 and a remote loss in the amount of R$ 110,180 in relation to the payment of fines. |
| (iii) | PIS and COFINS |
Refers mainly to the reversal of PIS and COFINS credits, provided by Laws 10.637/2002 and 10.833/2003, respectively. Those reversals arise from a differing interpretation of the laws by the tax authorities in relation to raw materials. These discussions are still at the administrative level. There are also questions regarding the constitutionality of broadening the base of the PIS / COFINS conveyed by Law 9.718/98. The Supreme Court has already ruled on this issue, judging it unconstitutional.
| (iv) | IRRF |
In June 2013, the Company received an assessment notice issued for the payment of income tax withheld at source ("IRRF") in the amount of R$ 788,177. The withholding tax relates to an alleged capital gain arising from the acquisition of assets of companies located abroad. The Company presented its defense in July 2013 and, together with its legal advisors, rated the probability of loss as possible.
| (v) | INSS – Social security |
The legal proceeding related to INSS payment with possible unfavorable outcome involve the following:
80
Cosan Limited
Notes to the consolidated financial statements
(Amounts in thousands of Brazilian Reais – R$, unless otherwise stated)
(a) the legality and constitutionality questioning Normative Instruction MPS/SRP Nº 03/2005, which restricted the constitutional immunity over social contributions on export revenues through direct sales, consistent with the manner exports made via trading companies are now taxed; (b) assessment of SENAR (Rural apprenticeship scheme) social contribution on direct and indirect exports, in which the tax authorities disregard the right to constitutional immunity; (c) assessment of social security contribution on internal market resale of merchandises or to third parties, which are not included in the calculation of the social security contributions tax basis - these should only apply to gross revenue from production and not to acquired merchandise.
| (vi) | IPI |
Federal exercise VAT: SRF Normative Instruction no 67/98 approved the procedures adopted by industrial establishments which performed remittances without registration and payment of IPI, in relation to transfers of sugarcane carried out between July 6, 1995 and November 16, 1997 and of refined sugar between January 14, 1992 and November 16, 1997.
| (vii) | Offsetting against IPI credits – IN 67/98 |
SRF Normative Instruction no. 67/98 allowed for the refunding of IPI tax payments for sales of refined sugar from January 14, 1992 through November 16, 1997. Consequently the Company applied for the offsetting of amounts paid during the periods against other tax liabilities. However, the tax authorities denied its application for both the reimbursement and offsetting of these amounts. The Company has challenged this ruling in an administrative proceeding.
| b) | Civil and labor |
The main civil and labor claims for which unfavorable outcomes are deemed possible are as follow:
| December 31, 2014 | December 31, 2013 | |||||||
| Civil | 1,118,151 | 832,311 | ||||||
| Labor | 391,992 | 502,697 | ||||||
| 1,510,143 | 1,335,008 | |||||||
Receivables from legal proceedings
The Company recognized a gain of R$ 69,951 in December 2013 and R$ 318,358 in 2007, corresponding to a lawsuit filed against the Federal Government, claiming indemnification for the pricing of products, at the time when the industry was subject to government price control. Final judgment was passed in favor of the Company.
A gain was recognized in profit or loss of the corresponding year, with a corresponding receivable in “Other non-current assets”.
At December 31, 2014, the asset recorded for the indemnity lawsuit and corresponding provision for legal fees totaled R$460,103 and R$56,581 (R$496,009 and R$59,921 as at December 31, 2013), recorded in "other assets" and "other liabilities" respectively. Management is confident that the receipt of these amounts is virtually certain, as the Federal Government cannot appeal against the judgment. The fair value of the asset is equivalent to the carrying amount.
81
Cosan Limited
Notes to the consolidated financial statements
(Amounts in thousands of Brazilian Reais – R$, unless otherwise stated)
| 22 | Preferred shareholders payable in subsidiaries |
On June 27, 2014, Cosan S.A. transferred to a newly-incorporated wholly-owned subsidiary, Cosan Investimentos e Participações S.A., its shares in Raízen Energia S.A. and Raízen Combustíveis S.A. in addition to a debenture Cosan S.A. had issued and placed with Banco Bradesco S.A.. The net assets transferred at that date totaled R$ 1,979,519.
Concurrently, also on June 27, 2014, Cosan S.A. executed an Investment Agreement with Fundo de Investimentos em Participações Multisetorial Plus II (“FIP Multisetorial”) and with Razac Fundo de Investimentos em Participações (“FIP Razac”). FIP Multisetorial and FIP Razac are funds owned by Banco Bradesco BBI S.A and Citibank Distribuidora de Títulos e Valores Mobiliários S.A., respectively. Pursuant to this agreement, FIP Multisetorial and FIP Razac subscribed and paid-in R$2,000,000 of non-voting preferred shares issued by Cosan Investimentos e Participações S.A.. These preferred shares will be remunerated based on a formula designed to provide a return over 15 years equivalent to the CDI rate. In the event the accumulated remuneration falls short of the minimum amount prescribed in the formula, as at April 30, 2021, the preferred shareholders will have a put against Cosan S.A. for an amount equivalent to the value of the initial investment plus interest based on the CDI less any CDI-indexed dividends paid.
The investment in the net assets of in the joint ventures, Raízen Energia S.A. and Raízen Combustíveis S.A., continue to be accounted for on the equity method without affecting the Company’s 50% interest in the results of each venture. The transaction underlying the Investment Agreement has been classified as a noncurrent financial liability in Cosan´s and Cosan S.A.´s balance sheet and the statement of profit or loss reflects the CDI equivalent dividends classified as financial expenses.
82
Cosan Limited
Notes to the consolidated financial statements
(Amounts in thousands of Brazilian Reais – R$, unless otherwise stated)
| 23 | Stockholders’ Equity |
| a) | Share capital |
As of December 31, 2014 Cosan Limited’s share capital is composed of the following:
| Shareholders - Common shares | Class A and / or BDRs | % | Class B1 shares | % | ||||||||||||
| Queluz Holding Limited | 5,906,611 | 3.39 | 66,321,766 | 68.85 | ||||||||||||
| Usina Costa Pinto S.A. Açúcar e Álcool | - | - | 30,010,278 | 31.15 | ||||||||||||
| Gávea Funds | 21,167,463 | 12.14 | - | - | ||||||||||||
| Blackrock Inc. | 8,559,101 | 4.91 | - | - | ||||||||||||
| MSOR Participações S.A. | 1,811,250 | 1.04 | - | - | ||||||||||||
| Usina Bom Jesus S.A. | 255,000 | 0.15 | - | - | ||||||||||||
| FIA Rio das Pedras | 16,000 | 0.01 | - | - | ||||||||||||
| Other | 130,643,414 | 74.93 | - | - | ||||||||||||
| Total shares outstanding | 168,358,839 | 96.56 | - | - | ||||||||||||
| Treasury shares | 5,996,502 | 3.44 | - | - | ||||||||||||
| Total | 174,355,341 | 100.00 | 96,332,044 | 100.00 | ||||||||||||
There have been no changes to the number of shares in issue during the periods presented.
Class B1 shares entitle the holder to 10 votes per share whereas Class A and BDRs’ shares are entitled to one vote per share.
| b) | Treasury shares |
The Company holds 5,996,502 Class A treasury shares as of December 31, 2014 and 2013 with a market value of US$7.75 per share at December 31, 2014 (US$13.72 per share at December 31, 2013).
83
Cosan Limited
Notes to the consolidated financial statements
(Amounts in thousands of Brazilian Reais – R$, unless otherwise stated)
| c) | Other comprehensive income |
| March 31, | Comprehensive | March 31, | Comprehensive | December 31, | Comprehensive | December 31, | ||||||||||||||||||||||
| 2012 | income | 2013 | income | 2013 | income | 2014 | ||||||||||||||||||||||
| Foreign currency translation differences | (182,730 | ) | 2,583 | (180,147 | ) | (42,891 | ) | (223,038 | ) | (75,406 | ) | (298,444 | ) | |||||||||||||||
| Gain (loss) on cash | ||||||||||||||||||||||||||||
| flow hedge in joint ventures and subsidiary | 14,115 | 35,695 | 49,810 | (6,426 | ) | 43,384 | (53,956 | ) | (10,572 | ) | ||||||||||||||||||
| Revaluation of investment properties reclassified | ||||||||||||||||||||||||||||
| from property, plant and equipment | - | 190,735 | 190,735 | - | 190,735 | - | 190,735 | |||||||||||||||||||||
| Defined benefit plan actuarial losses | 22,570 | (34,487 | ) | (11,917 | ) | 28,009 | 16,092 | 31,012 | 47,104 | |||||||||||||||||||
| Changes in value of available for | ||||||||||||||||||||||||||||
| sale securities, net | (23,689 | ) | 7,132 | (16,557 | ) | 9,077 | (7,480 | ) | 5,932 | (1,548 | ) | |||||||||||||||||
| Total | (169,734 | ) | 201,658 | 31,924 | (12,231 | ) | 19,693 | (92,418 | ) | (72,725 | ) | |||||||||||||||||
| Attributable to: | ||||||||||||||||||||||||||||
| Owners of the parent | (176,500 | ) | 117,592 | (58,908 | ) | (25,979 | ) | (84,887 | ) | (80,727 | ) | (165,614 | ) | |||||||||||||||
| Non-controlling interests | 6,766 | 84,066 | 90,832 | 13,748 | 104,580 | (11,691 | ) | 92,889 | ||||||||||||||||||||
84
Cosan Limited
Notes to the consolidated financial statements
(Amounts in thousands of Brazilian Reais – R$, unless otherwise stated)
| 24 | Earnings per share |
The calculation of basic earnings per share has been made by dividing the profit attributable to shareholders of the parent by the weighted-average number of ordinary shares outstanding during the year excluding ordinary shares purchased by the company and held as treasury shares (Note 23.a).
The calculation of diluted earnings per share has been made by dividing the profit attributable to shareholders of the parent, adjusted to assume conversion of all dilutive potential ordinary shares at subsidiaries by the weighted-average number of shares outstanding during the year excluding ordinary shares purchased by the company and held as treasury shares (Note 23.a). The Company’s subsidiaries have two categories of potential dilutive effects: share options and put options. For the share options, a calculation is done to determine the effect of the dilution in the profit attributable to shareholders of the parent due the exercise of the share options at subsidiaries. For the put option, is assumed to have been converted into ordinary shares, and the profit attributable to shareholders of the parent is adjusted.
The average market value of the subsidiaries' shares for the purpose of calculating the dilutive effect of shares options was based on quoted market prices for the period during which the options were outstanding.
The following table sets forth the calculation of earnings per share for the year ended December 31, 2014, nine months ended December 31, 2013 and year ended March 31, 2013 (in thousands of Brazilian Reais, except per share amounts):
| Twelve months ended December 31, 2014 | Nine months ended December 31, 2013 | Twelve months ended March 31, 2013 | ||||||||||
| Numerator | ||||||||||||
| Profit from continuing operations | ||||||||||||
| Basic | 171,006 | 122,618 | 337,521 | |||||||||
| Dilutive effect of subsidiary's | ||||||||||||
| stock option plan | (1,212 | ) | (918 | ) | (1,904 | ) | ||||||
| Dilutive effect of put option | (15,601 | ) | (15,601 | ) | (15,601 | ) | ||||||
| Diluted | 154,192 | 106,099 | 320,016 | |||||||||
| Profit from discontinued operations | ||||||||||||
| Basic | - | - | 86,549 | |||||||||
| Dilutive effect of subsidiary's | ||||||||||||
| stock option plan | - | - | (421 | ) | ||||||||
| Diluted | - | - | 86,128 | |||||||||
| Denominator | ||||||||||||
| Weighted average number | ||||||||||||
| of shares outstanding | 264,690,883 | 264,690,883 | 264,842,445 | |||||||||
| Basic earnings per share | ||||||||||||
| Continuing operations | R$ | 0.65 | R$ | 0.46 | R$ | 1.27 | ||||||
| Discontinued operations | - | - | R$ | 0.33 | ||||||||
| R$ | 0.65 | R$ | 0.46 | R$ | 1.60 | |||||||
| Diluted earnings per share | ||||||||||||
| Continuing operations (as revised – Note 4.2) | R$ | 0.58 | R$ | 0.40 | R$ | 1.21 | ||||||
| Discontinued operations | - | - | R$ | 0.33 | ||||||||
| R$ | 0.58 | R$ | 0.40 | R$ | 1.54 | |||||||
85
Cosan Limited
Notes to the consolidated financial statements
(Amounts in thousands of Brazilian Reais – R$, unless otherwise stated)
| 25 | Commitments |
| a) | Commitments for the acquisition of assets and regulatory targets |
COMGÁS has contractual commitments for the acquisition of intangible assets of R$ 13,257 at December 31, 2014 (R$ 23,687 at December 31, 2013) for the support and administration of the gas distribution network, as well as administrative and technology costs.
| b) | Lease agreements |
Lessor
Radar leases agricultural land to third parties for the production of sugar cane and grains.
The minimum lease receivables of these operating leases are calculated based on data from the TRS, and other commodity prices, and harvested volume per hectare as defined in contract. Revenues related to these contracts at December 31, 2014 are as follows:
| 2015 | 66,008 | |||
| 2016 | 65,771 | |||
| 2017 | 65,480 | |||
| 2018 | 53,277 | |||
| 2019 | 53,277 | |||
| 303,813 |
Lessee
At December 31, 2014, future minimum lease payments on non-cancellable operating leases entered by Rumo are as follows:
| 2014 | 2013 | |||||||
| No later than 1 year | 56,608 | 52,173 | ||||||
| Later than 1 year and no later than 5 years | 268,077 | 263,642 | ||||||
| 324,685 | 315,815 | |||||||
COMGÁS rents properties through 15 lease contracts. Rental expense amounted to R$ 4,639 for the year ended December 31, 2014 (R$ 5,741 for the nine months ended December 31, 2013 and R$ 1,510 for the year ended March 31, 2013).
The lease terms are for a period of one to six years, and the majority of lease agreements are renewable at the end of the lease period at market rates.
86
Cosan Limited
Notes to the consolidated financial statements
(Amounts in thousands of Brazilian Reais – R$, unless otherwise stated)
Future minimum lease payments under non-cancelable operating leases are as follows:
| 2014 | 2013 | |||||||
| No later than 1 year | 4,080 | 4,799 | ||||||
| Later than 1 year and no later than 5 years | 6,233 | 9,413 | ||||||
| 10,313 | 14,212 | |||||||
| c) | Purchase |
Rumo has contractual commitments totaling R$22,000 for the improvement of the railway network to expand the logistics segment through 2015.
| d) | Gas purchase |
COMGÁS has take-or-pay purchase contracts, effective through December 2019, with gas suppliers which establish minimum daily purchases of gas volumes. Were the Company to consume a volume of gas below its contractual obligation, the Company would be required to pay for the shortfall between consumption and the required minimum contractual volumes; however, it could recover this credit (through consumption) over the remaining contract period. Amounts paid but not consumed by COMGÁS were recognized as “Other assets” in the statement of financial position (2014: R$ 163,686; 2013: R$ 133,823).
| e) | Regulatory assets (liabilities) |
| December 31, 2014 | December 31, 2013 | |||||||
| Cost of gas to be recovered/(transferred) | 243,713 | 345,349 | ||||||
| Credits of taxes to be recovered/(transferred) | (1,120 | ) | 2,517 | |||||
| Adjustment to present value of taxes | 61 | (137 | ) | |||||
| 242,654 | 347,729 | |||||||
| Opening balance | 347,729 | 380,894 | ||||||
| Closing balance | 242,654 | 347,729 | ||||||
| Expense not recognized in the statement of | ||||||||
| profit and loss before income tax and social contribution | (105,075 | ) | (33,165 | ) | ||||
| Regulatory assets (liabilities) | (124,495 | ) | (59,173 | ) | ||||
| Adjustment | 26,359 | 34,376 | ||||||
| Other | (6,939 | ) | (8,368 | ) | ||||
| (105,075 | ) | (33,165 | ) | |||||
87
Cosan Limited
Notes to the consolidated financial statements
(Amounts in thousands of Brazilian Reais – R$, unless otherwise stated)
The tariffs for the supply of gas to the different customer segments are authorized by the concession authority. In accordance with the terms of the Concession Agreement, the differences between the cost component of gas included in the tariffs charged to the customers and the actual cost of gas incurred are determined on a monthly basis and charged or credited to a regulation account (regulatory account).
Periodically, charges or credits in the tariffs are determined by the regulator with the objective of amortizing the amounts accumulated in this account.
The balance of this account is considered as an asset or as a liability, pursuant to the regulator's set of accounts and for income tax purposes. However, this account is not recognized under IFRS, because the respective balance is not considered as an asset or as a liability, as its realization or liquidation depends on further purchases by the Company's consumers. Therefore, the balances presented above are not recorded in these financial statements.
| 26 | Gross Sales |
| Twelve months ended December 31, 2014 | Nine months ended December 31, 2013 | Twelve months ended March 31, 2013 | ||||||||||
| Gross revenue from sales of products | 9,702,960 | 7,133,290 | 4,686,403 | |||||||||
| Gross revenue from sales of services | 1,000,065 | 845,100 | 809,667 | |||||||||
| Construction revenue | 481,314 | 536,482 | 230,038 | |||||||||
| Indirect taxes and deductions | (2,122,035 | ) | (1,636,658 | ) | (1,139,899 | ) | ||||||
| Net revenue | 9,062,304 | 6,878,214 | 4,586,209 | |||||||||
| 27 | Expenses by nature |
The expenses are presented in the statement of profit and loss by function. The reconciliation of income by nature/purpose for the year ended December 31, 2014, nine months ended December 31, 2013, and year ended March 31, 2013 are as follows:
| Twelve months ended December 31, 2014 | Nine months ended December 31, 2013 | Twelve months ended March 31, 2013 | ||||||||||
| Raw materials and consumables used | (4,767,550 | ) | (3,533,382 | ) | (2,725,069 | ) | ||||||
| Employee benefit expense | (1,334,341 | ) | (1,021,922 | ) | (430,930 | ) | ||||||
| Transportation expenses | (887,608 | ) | (666,461 | ) | (260,376 | ) | ||||||
Depreciation and amortization(I) | (662,196 | ) | (424,580 | ) | (317,270 | ) | ||||||
| Selling expenses | (60,906 | ) | (76,067 | ) | (169,423 | ) | ||||||
| Other | (251,275 | ) | (226,714 | ) | (187,207 | ) | ||||||
| (7,963,876 | ) | (5,949,127 | ) | (4,090,275 | ) | |||||||
88
Cosan Limited
Notes to the consolidated financial statements
(Amounts in thousands of Brazilian Reais – R$, unless otherwise stated)
| Classified as: | ||||||||||||
| Twelve months ended December 31, 2014 | Nine months ended December 31, 2013 | Twelve months ended March 31, 2013 | ||||||||||
| Cost of sales | (6,413,720 | ) | (4,878,229 | ) | (3,211,309 | ) | ||||||
| Selling | (881,543 | ) | (603,965 | ) | (459,433 | ) | ||||||
General and administrative(1I) | (668,613 | ) | (466,933 | ) | (419,533 | ) | ||||||
| (7,963,876 | ) | (5,949,127 | ) | (4,090,275 | ) | |||||||
| (I) | Excludes R$16,913 presented as a deduction of net revenue (December 31, 2013 R$14,564 and March 31, 2013 R$17,516); |
| (II) | Research and development expenses for the year ended December 31, 2014 was R$4,969 (December 31, 2013 R$ 2,180). |
| 28 | Financial results |
| Twelve months ended December 31, 2014 | Nine months ended December 31, 2013 | Twelve months ended March 31, 2013 | ||||||||||
| Financial expense | ||||||||||||
| Interest expense | (994,685 | ) | (769,852 | ) | (568,903 | ) | ||||||
| Indexation expenses | (66,117 | ) | (34,754 | ) | (9,102 | ) | ||||||
| (1,060,802 | ) | (804,606 | ) | (578,005 | ) | |||||||
| Financial income | ||||||||||||
| Interest income | 54,316 | 70,094 | 72,491 | |||||||||
| Indexation income | 23,089 | 10,648 | 7,845 | |||||||||
| Income from short term investments | 139,707 | 99,162 | 83,327 | |||||||||
| 217,112 | 179,904 | 163,663 | ||||||||||
Foreign exchange effects, net(I) | ||||||||||||
| Foreign exchange losses, net | (300,521 | ) | (324,495 | ) | (83,254 | ) | ||||||
| (300,521 | ) | (324,495 | ) | (83,254 | ) | |||||||
| Derivative income (losses) | ||||||||||||
| Commodities - derivatives | 1,353 | - | - | |||||||||
| Foreign exchange and interest rate derivatives | 160,009 | 235,485 | 9,253 | |||||||||
| Warrants in associates | - | - | 65,230 | |||||||||
| 161,363 | 235,485 | 74,483 | ||||||||||
| (982,848 | ) | (713,712 | ) | (423,113 | ) | |||||||
| (I) Includes gains (and losses) on foreign exchange rates relating to assets and liabilities denominated in foreign currency. | ||||||||||||
89
Cosan Limited
Notes to the consolidated financial statements
(Amounts in thousands of Brazilian Reais – R$, unless otherwise stated)
| 29 | Other income (expenses), net |
| Twelve months ended December 31, 2014 | Nine months ended December 31, 2013 | Twelve months ended March 31, 2013 | ||||||||||
| Changes in the fair value of | ||||||||||||
| investment properties | 131,697 | 121,543 | 138,776 | |||||||||
| Gain on port operations | 9,628 | 5,687 | - | |||||||||
| Rental income | 399 | 519 | 347 | |||||||||
| (Loss) gain on disposal of | ||||||||||||
| non-current assets | (10,836 | ) | (7,788 | ) | 97,370 | |||||||
| Provisions for legal proceedings | (51,347 | ) | (94,571 | ) | (65,426 | ) | ||||||
| Gain on settlement of REFIS liability | 28,440 | - | - | |||||||||
Cost related to internal organization and prospective acquisitions (i) | (134,614 | ) | - | - | ||||||||
| Other | 5,393 | 50,882 | 2,672 | |||||||||
| (21,240 | ) | 76,272 | 173,739 | |||||||||
| (i) Relates to costs incurred by the Company with lawyers, consultants, business advisors and other related services for certain reorganizations and prospective acquisitions. | ||||||||||||
| 30 | Discontinued operations |
The Company signed an agreement with Camil to sell all the shares issued by a former subsidiary (Note 10 (b)).
Pursuant to IFRS 5 - Non-current assets available for sale and discontinued operations, the results of this subsidiary are presented as "Discontinued Operations" in the statement of profit or loss.
| 31 | Financial instruments |
Financial risk management
Overview
The Company is exposed to the following risks related to the use of financial instruments:
| · | Foreign exchange risk; |
| · | Interest rate risk; |
| · | Credit risk; and |
| · | Liquidity risk. |
This note presents information about the exposure of the Company and its subsidiaries to the above risks, as well as the objectives of the Company's risk management policies, these policy and processes for the assessment and management of risks.
90
Cosan Limited
Notes to the consolidated financial statements
(Amounts in thousands of Brazilian Reais – R$, unless otherwise stated)
Risk management structure
The risks inherent to each type of business market are managed and monitored by the Company and, where applicable, risk committees are convened to discuss and determine the hedging strategy of the Company in accordance with its policies and guidelines.
COMGÁS maintains a Treasury policy, approved by the Board, which is revised periodically and determines the standardization and the purpose of the financial operations of the Company. In addition, this policy determines the methodology to evaluate the counterparty’s credit risk (foreign exchange transactions, derivatives, financial investments and guarantees) and stipulate what are the financial instruments that are allowed to be used.
The risk management associated with financial transactions is performed through the application of the Treasury policy and strategies defined by the administrators of the Company. These rules provide the guidelines for the management of risks, their measurement, how to mitigate risks, forecast cash flows and also establishes exposure limits. As such, all financial operations contracted should be the best alternatives, financially and economically, and should not be entered into with speculative purposes, therefore, a financial exposure should exist to justify all financial operations.
The usage of financial instruments in order to protect against these areas of volatility is determined through an analysis of the risk exposure that management intends to cover.
As at December 31, 2014 and 2013, the fair values relating to transactions involving derivative financial instruments to protect the Company’s risk exposure were using observable inputs such as quoted prices in active markets, or discounted cash flows based on market curves, and are presented below:
| Notional | Fair value | |||||||||||||||||||
| December 31, 2014 | December 31, 2013 | December 31, 2014 | December 31, 2013 | P&L | ||||||||||||||||
| COMGÁS derivatives | ||||||||||||||||||||
| Exchange rate derivatives | ||||||||||||||||||||
| Swap agreements | 828,443 | 828,443 | 330,098 | 209,532 | 330,099 | |||||||||||||||
| 828,443 | 828,443 | 330,098 | 209,532 | 330,099 | ||||||||||||||||
| Other subsidiaries derivatives | ||||||||||||||||||||
| Exchange rate derivatives | ||||||||||||||||||||
| Forward agreements | 178,127 | 232,218 | 21,250 | 25,713 | 21,250 | |||||||||||||||
| Options | - | - | (8,842 | ) | - | (8,842 | ) | |||||||||||||
| 178,127 | 232,218 | 12,408 | 25,713 | 12,408 | ||||||||||||||||
| Interest rate and exchange rate risk | ||||||||||||||||||||
| Swap agreements (interest rate) | 221,560 | 181,617 | (40,329 | ) | (13,573 | ) | (40,329 | ) | ||||||||||||
| Cross currency interest rate swaps | 1,659,904 | 1,662,806 | 254,966 | (39,079 | ) | 254,966 | ||||||||||||||
| 1,881,464 | 1,844,423 | 214,637 | (52,652 | ) | 214,637 | |||||||||||||||
| Total financial instruments | 557,144 | 182,593 | 557,144 | |||||||||||||||||
| Assets | 890,578 | 513,934 | ||||||||||||||||||
| Liabilities | (333,435 | ) | (331,341 | ) | ||||||||||||||||
91
Cosan Limited
Notes to the consolidated financial statements
(Amounts in thousands of Brazilian Reais – R$, unless otherwise stated)
Foreign exchange risk
The table below presents the derivatives used to mitigate exchange rates risks:
| Derivatives | Purchased / Sold | Market | Agreement | Maturity date | Notional (US$) | Notional (R$ thousand) | Fair Value (R$ thousand) | ||||||||||||
| Derivatives designated as hedge accounting: | |||||||||||||||||||
| Contracted by other subsidiaries | |||||||||||||||||||
| Swap | N/A | OTC | Swap | Mar-23 | 175,000 | 347,690 | 2,458 | ||||||||||||
| Swap | N/A | OTC | Swap | Mar-23 | 50,000 | 106,595 | 29,220 | ||||||||||||
| Swap | N/A | OTC | Swap | Mar-23 | 50,000 | 106,595 | 29,609 | ||||||||||||
| Swap | N/A | OTC | Swap | Mar-23 | 368,500 | 732,136 | (23,964 | ) | |||||||||||
| Swap | N/A | OTC | Swap | Mar-23 | 25,000 | 55,390 | (8,853 | ) | |||||||||||
| Swap | N/A | OTC | Swap | Mar-23 | 25,000 | 55,390 | 16,383 | ||||||||||||
| Swap | N/A | OTC | Swap | Mar-23 | 25,000 | 55,390 | (10,628 | ) | |||||||||||
| Swap | N/A | OTC | Swap | Mar-23 | 25,000 | 55,390 | 18,076 | ||||||||||||
| Swap | N/A | OTC | Swap | Mar-23 | 25,000 | 55,390 | 17,935 | ||||||||||||
| Swap | N/A | OTC | Swap | Mar-23 | 25,000 | 55,390 | (10,691 | ) | |||||||||||
| Swap | N/A | OTC | Swap | Mar-23 | 25,000 | 55,390 | 17,512 | ||||||||||||
| Swap | N/A | OTC | Swap | Mar-23 | 25,000 | 55,390 | (10,155 | ) | |||||||||||
| Swap | N/A | OTC | Swap | Mar-23 | 50,000 | 110,780 | 17,012 | ||||||||||||
| Swap | N/A | OTC | Swap | Mar-23 | 25,000 | 55,390 | 8,498 | ||||||||||||
| Swap | N/A | OTC | Swap | Mar-23 | 25,000 | 55,390 | 8,599 | ||||||||||||
| Swap | N/A | OTC | Swap | Mar-23 | 75,000 | 167,775 | 228 | ||||||||||||
| Swap | N/A | OTC | Swap | Mar-23 | 50,000 | 106,595 | 20,823 | ||||||||||||
| Swap | N/A | �� | OTC | Swap | Mar-23 | 50,000 | 110,780 | 15,916 | |||||||||||
| Swap | N/A | OTC | Swap | Mar-23 | 25,000 | 55,390 | 8,145 | ||||||||||||
| Swap | N/A | OTC | Swap | Mar-23 | 10,000 | 21,319 | 3,810 | ||||||||||||
| Swap | N/A | OTC | Swap | Mar-23 | 65,000 | 144,014 | 22,335 | ||||||||||||
| Swap | N/A | OTC | Swap | Mar-23 | (368,500 | ) | (732,136 | ) | 23,964 | ||||||||||
| Swap | N/A | OTC | Swap | Mar-23 | (175,000 | ) | (347,690 | ) | (2,459 | ) | |||||||||
| Swap | Amortization Gain/Loss D1 | - | - | 1,832 | |||||||||||||||
| At December 31, 2014 | 675,000 | 1,483,743 | 195,605 | ||||||||||||||||
| At December 31, 2013 | 675,000 | 1,483,743 | (45,025 | ) | |||||||||||||||
92
Cosan Limited
Notes to the consolidated financial statements
(Amounts in thousands of Brazilian Reais – R$, unless otherwise stated)
| Forward | Purchased | OTC | Deliverable forward | Jan-15 | 467 | 1,208 | (32 | ) | |||||||||||
| Forward | Purchased | OTC | Deliverable forward | Jan-15 | 316 | 816 | (22 | ) | |||||||||||
| Forward | Purchased | OTC | Deliverable forward | Jan-15 | 4,158 | 10,756 | (287 | ) | |||||||||||
| Forward | Purchased | OTC | Deliverable forward | Jan-15 | 419 | 1,084 | (29 | ) | |||||||||||
| Forward | Purchased | OTC | Deliverable forward | Jan-15 | 894 | 2,312 | (62 | ) | |||||||||||
| Forward | Purchased | OTC | Deliverable forward | Jan-15 | 206 | 533 | (14 | ) | |||||||||||
| Forward | Purchased | OTC | Deliverable forward | Jan-15 | 512 | 1,323 | (35 | ) | |||||||||||
| Forward | Purchased | OTC | Deliverable forward | Jan-15 | 3,616 | 9,354 | (250 | ) | |||||||||||
| Forward | Purchased | OTC | Deliverable forward | Jan-15 | 830 | 2,147 | (57 | ) | |||||||||||
| Forward | Purchased | OTC | Deliverable forward | Jan-15 | 1,901 | 5,087 | 37 | ||||||||||||
| Forward | Purchased | OTC | Deliverable forward | Jan-15 | 259 | 693 | 5 | ||||||||||||
| Forward | Purchased | OTC | Deliverable forward | Jan-15 | 89 | 237 | 2 | ||||||||||||
| Forward | Purchased | OTC | Deliverable forward | Jan-15 | 864 | 2,312 | 17 | ||||||||||||
| Forward | Purchased | OTC | Deliverable forward | Jan-15 | 355 | 949 | 7 | ||||||||||||
| At December 31, 2014 | 14,886 | 38,811 | (720 | ) | |||||||||||||||
| At December 31, 2013 | - | - | - | ||||||||||||||||
| Total at December 31, 2014 | 689,886 | 1,522,554 | 194,885 | ||||||||||||||||
| Total at December 31, 2013 | 675,000 | 1,483,743 | (45,025 | ) | |||||||||||||||
| Derivatives not designated as hedge: | |||||||||||||||||||
| Contracted by COMGÁS | |||||||||||||||||||
| Swap | N/A | OTC/CETIP | Cross Cur Swap | Jul-17 | 75,000 | 153,900 | 37,650 | ||||||||||||
| Swap | N/A | OTC/CETIP | Cross Cur Swap | Feb-18 | 50,000 | 99,385 | 29,309 | ||||||||||||
| Swap | N/A | OTC/CETIP | Cross Cur Swap | Aug-18 | 50,000 | 115,000 | 13,994 | ||||||||||||
| Swap | N/A | OTC/CETIP | Cross Cur Swap | Jun-20 | 10,000 | 18,361 | 8,059 | ||||||||||||
| Swap | N/A | OTC/CETIP | Cross Cur Swap | Jun-20 | 10,000 | 18,361 | 8,454 | ||||||||||||
| Swap | N/A | OTC/CETIP | Cross Cur Swap | Jun-20 | 10,000 | 18,361 | 8,231 | ||||||||||||
| Swap | N/A | OTC/CETIP | Cross Cur Swap | Jun-20 | 14,381 | 26,406 | 11,830 | ||||||||||||
| Swap | N/A | OTC/CETIP | Cross Cur Swap | Jun-20 | 40,000 | 73,444 | 32,750 | ||||||||||||
| Swap | N/A | OTC/CETIP | Cross Cur Swap | Sep-20 | 39,922 | 69,580 | 34,067 | ||||||||||||
| Swap | N/A | OTC/CETIP | Cross Cur Swap | May-21 | 51,400 | 83,145 | 52,610 | ||||||||||||
| Swap | N/A | OTC/CETIP | Cross Cur Swap | May-21 | 20,000 | 32,352 | 20,646 | ||||||||||||
| Swap | N/A | OTC/CETIP | Cross Cur Swap | Sep-21 | 30,000 | 49,761 | 29,886 | ||||||||||||
| Swap | N/A | OTC/CETIP | Cross Cur Swap | Sep-21 | 42,435 | 70,387 | 42,612 | ||||||||||||
| At December 31, 2014 | 443,138 | 828,443 | 330,098 | ||||||||||||||||
| At December 31, 2013 | 443,138 | 828,443 | 209,532 | ||||||||||||||||
93
Cosan Limited
Notes to the consolidated financial statements
(Amounts in thousands of Brazilian Reais – R$, unless otherwise stated)
| Financial instruments contracted by other subsidiaries | |||||||||||||||||||
| Forward | Purchased | OTC | NDF | Feb-15 | 6,188 | 14,497 | 1,996 | ||||||||||||
| Forward | Purchased | OTC | NDF | Feb-15 | 4,197 | 8,813 | 2,363 | ||||||||||||
| Forward | Purchased | OTC | NDF | Feb-15 | 1,529 | 3,915 | 186 | ||||||||||||
| Forward | Purchased | OTC | NDF | Feb-15 | 1,618 | 3,929 | 408 | ||||||||||||
| Forward | Purchased | OTC | NDF | Feb-15 | 1,817 | 4,338 | 529 | ||||||||||||
| Forward | Purchased | OTC | NDF | Feb-15 | 1,586 | 3,890 | 360 | ||||||||||||
| Forward | Purchased | OTC | NDF | Feb-15 | 1,520 | 3,604 | 468 | ||||||||||||
| Forward | Purchased | OTC | NDF | Feb-15 | 1,761 | 4,229 | 489 | ||||||||||||
| Forward | Purchased | OTC | NDF | Feb-15 | 1,654 | 3,863 | 567 | ||||||||||||
| Forward | Purchased | OTC | NDF | Feb-15 | 1,652 | 4,133 | 297 | ||||||||||||
| Forward | Purchased | OTC | NDF | Feb-15 | 1,631 | 4,317 | 60 | ||||||||||||
| Forward | Purchased | OTC | NDF | Feb-15 | 1,419 | 3,875 | (67 | ) | |||||||||||
| Forward | Purchased | OTC | NDF | Feb-15 | 1,395 | 3,668 | 77 | ||||||||||||
| Forward | Purchased | OTC | NDF | May-15 | 6,188 | 14,726 | 2,130 | ||||||||||||
| Forward | Purchased | OTC | NDF | May-15 | 4,197 | 8,942 | 2,449 | ||||||||||||
| Forward | Purchased | OTC | NDF | Aug-15 | 6,188 | 15,003 | 2,220 | ||||||||||||
| Forward | Purchased | OTC | NDF | Aug-15 | 4,197 | 9,089 | 2,516 | ||||||||||||
| Forward | Purchased | OTC | NDF | Nov-15 | 6,188 | 15,254 | 2,334 | ||||||||||||
| Forward | Purchased | OTC | NDF | Nov-15 | 4,197 | 9,231 | 2,588 | ||||||||||||
| At December 31, 2014 | 59,122 | 139,316 | 21,970 | ||||||||||||||||
| At December 31, 2013 | 102,974 | 232,218 | 25,713 | ||||||||||||||||
| Swap | N/A | OTC | Swap | Aug-15 | 11,000 | 24,846 | 2,761 | ||||||||||||
| Swap | N/A | OTC | Swap | Nov-15 | 100,000 | 253,500 | 6,059 | ||||||||||||
| Swap | N/A | OTC | Swap | Sep-16 | 50,000 | 119,375 | 10,212 | ||||||||||||
| Swap | N/A | OTC | Swap | Mar-18 | 359,272 | 712,796 | 254,714 | ||||||||||||
| Swap | N/A | OTC | Swap | Mar-18 | (359,272 | ) | (712,796 | ) | (254,714 | ) | |||||||||
| At December 31, 2014 | 161,000 | 397,721 | 19,032 | ||||||||||||||||
| At December 31, 2013 | 156,972 | 360,680 | (7,627 | ) | |||||||||||||||
94
Cosan Limited
Notes to the consolidated financial statements
(Amounts in thousands of Brazilian Reais – R$, unless otherwise stated)
| Option | Purchased | OTC | CALL | Mar-15 | 50,000 | 142,500 | 1,397 | ||||||||||||
| Option | Sold | OTC | PUT | Mar-15 | 50,000 | 133,075 | (2,577 | ) | |||||||||||
| Option | Purchased | OTC | CALL | Mar-15 | 50,000 | 142,500 | 1,397 | ||||||||||||
| Option | Sold | OTC | PUT | Mar-15 | 50,000 | 132,400 | (2,281 | ) | |||||||||||
| Option | Purchased | OTC | CALL | Mar-15 | 50,000 | 142,500 | 1,397 | ||||||||||||
| Option | Sold | OTC | PUT | Mar-15 | 50,000 | 131,540 | (1,934 | ) | |||||||||||
| Option | Purchased | OTC | CALL | Mar-15 | 50,000 | 142,500 | 1,397 | ||||||||||||
| Option | Sold | OTC | PUT | Mar-15 | 50,000 | 131,660 | (1,975 | ) | |||||||||||
| Option | Purchased | OTC | CALL | Mar-15 | 50,000 | 142,500 | 1,397 | ||||||||||||
| Option | Sold | OTC | PUT | Mar-15 | 50,000 | 135,100 | (3,598 | ) | |||||||||||
| Option | Purchased | OTC | CALL | Mar-15 | 50,000 | 142,500 | 1,397 | ||||||||||||
| Option | Sold | OTC | PUT | Mar-15 | 50,000 | 135,125 | (3,610 | ) | |||||||||||
| Option | Purchased | OTC | CALL | Mar-15 | 50,000 | 142,500 | 1,397 | ||||||||||||
| Option | Sold | OTC | PUT | Mar-15 | 50,000 | 132,025 | (2,123 | ) | |||||||||||
| Option | Purchased | OTC | CALL | Mar-15 | 50,000 | 142,500 | 1,397 | ||||||||||||
| Option | Sold | OTC | PUT | Mar-15 | 50,000 | 131,500 | (1,920 | ) | |||||||||||
| At December 31, 2014 | 800,000 | 2,202,425 | (8,842 | ) | |||||||||||||||
| At December 31, 2013 | - | - | - | ||||||||||||||||
| Total at December 31, 2014 | 1,463,260 | 3,567,905 | 362,259 | ||||||||||||||||
| Total at December 31, 2013 | 703,084 | 1,421,341 | 227,618 | ||||||||||||||||
As at December 31, 2014 and 2013, the Company and its subsidiaries had the following net exposure to the exchange rate variations on assets and liabilities denominated in U.S. Dollars and Pounds Sterling:
| December 31, 2014 | December 31, 2013 | |||||||
| Cash and cash equivalents | 95,017 | 61,262 | ||||||
| Trade receivables | 25,323 | 24,453 | ||||||
| Loans and borrowings | (4,508,089 | ) | (3,791,773 | ) | ||||
| Foreign exchange exposure, net | (4,387,749 | ) | (3,706,058 | ) | ||||
Interest rate risk
The Company and its subsidiaries monitor the fluctuations in variable interest rates in connection with its borrowings, especially those that accrue interest using LIBOR, and uses derivative instruments in order to minimize variable interest rate fluctuation risks.
Credit risk
COMGÁS has no concentration of credit risk due to its broad customer base.
Credit risk is managed through specific rules regarding client acceptance, including credit ratings and limits for customer exposure, including the requirement for a letter of credit from a major bank and obtaining actual warranties when given credit, when applicable. Management believes that credit risk is adequately managed through its policy of allowances for doubtful accounts.
95
Cosan Limited
Notes to the consolidated financial statements
(Amounts in thousands of Brazilian Reais – R$, unless otherwise stated)
The Company and its subsidiaries may acquire exchange rate and interest rate derivative instruments in the BM&FBovespa, OTC, registered CETIP or the international markets, with several banks, within the limits established in the Treasury Policy for each bank.
The credit risk on cash and cash equivalents, bank deposits in national and foreign financial institutions are determined using the rating instruments accepted by the market as follows:
| Investment securities (Unaudited) | ||||
| AAA | 997,915 | |||
| AA | 501,124 | |||
| At December 31, 2014 | 1,499,039 | |||
Liquidity risk
Liquidity risk is the risk that the Company and its subsidiaries will not be able to meet its obligations associated with its financial liabilities that are settled with cash payments or other financial assets. The Company and its subsidiaries manage liquidity risk by ensuring, as much as possible, the availability of sufficient liquidity to meet its obligations due, under normal and stress situations, without causing unacceptable losses or risking the Company’s and its subsidiaries reputation.
The Company’s non-derivative financial liabilities classified by due date (contracted undiscounted cash flows basis) are as follows.
| December 31, 2014 | December 31, 2013 | |||||||||||||||||||||||
| Up to 1 year | 1 -2 years | 3 – 5 years | More than 5 years | Total | Total | |||||||||||||||||||
| Loans and borrowings | (1,253,138 | ) | (1,113,343 | ) | (6,476,717 | ) | (6,145,643 | ) | (14,988,841 | ) | (10,996,388 | ) | ||||||||||||
| Trade payables | (1,034,282 | ) | - | - | - | (1,034,282 | ) | (862,429 | ) | |||||||||||||||
| REFIS payable | (190,139 | ) | (1,124 | ) | (688 | ) | (332,753 | ) | (524,704 | ) | (1,010,767 | ) | ||||||||||||
| Total | (2,477,559 | ) | (1,114,467 | ) | (6,477,405 | ) | (6,478,396 | ) | (16,547,827 | ) | (12,869,584 | ) | ||||||||||||
Hedge accounting – Fair Value
To mitigate risks to the Company from potential fluctuations in foreign exchange rates and interest rates, the Company entered into certain derivative contracts that were designated for hedge accounting (fair value hedge) as of July 1, 2013, for the "2023 Senior Notes". The hedge consists of swapping the cash flows (cross currency interest rate swaps) with a foreign currency risk (USD) for Reais and a fixed interest rate for a fixed percentage of the CDI (local market). The table below shows the fair value and gain recognized in the statement of profit or loss:
96
Cosan Limited
Notes to the consolidated financial statements
(Amounts in thousands of Brazilian Reais – R$, unless otherwise stated)
| December 31, 2014 | December 31, 2013 | |||||||
| Fair value of the Senior Notes 2023 | 1,222,589 | 1,067,134 | ||||||
| Gain (loss) recognized in financial results | (265,196 | ) | 50,648 | |||||
Hedge accounting - Cash flow
On September 1, 2014, CLE made a formal designation of derivative financial instruments to hedge exposure to exchange rate payments of imports of raw materials (base oil) subjected to hedge accounting, by documenting: (i) the relationship of the hedge, (ii) the purpose and strategy of risk management in the subsidiary taking the hedge, (iii) identification of the financial instrument, (iv) the object or covered transaction, (v) the nature of the risk being covered, (vi) a description of the coverage, (vii) the demonstration of the correlation between the hedge and the hedged, and (viii) the retrospective and prospective effectiveness of the hedge.
The Company recorded gains and losses considered to be effective for the purposes of hedge accounting in a specific account in equity until the hedged item is paid, at which time this gain or loss of each instrument will be recorded in the same line that gave rise to the hedged item. At December 31, 2014 impacts recorded in equity are as follows:
| Market | Risk | December 31, 2014 | ||||
| Rate lock and exchange | ||||||
| variation of other financial instruments | Future Dollar | Exchange | 972 | |||
| (-) Deferred taxes | (330 | ) | ||||
| Equity effect | 642 | |||||
| Below are the changes in the balances of other comprehensive income during the year: | ||||||
| December 31, 2014 | ||||||
| Derivatives | ||||||
| Gain from the year: | ||||||
| Exchange rate hedging and other financial instruments | 1,192 | |||||
| Reclassification to inventories / cost of sales | (220 | ) | ||||
| Gain on cash flow hedge (before deferred taxes) | 972 | |||||
| Gain on cash flow hedge, net of deferred taxes | 642 | |||||
Sensitivity analysis
The following is the sensitivity analysis of the effects of changes in the relevant risk factors to which the Company is exposed to as of December 31, 2014:
97
Cosan Limited
Notes to the consolidated financial statements
(Amounts in thousands of Brazilian Reais – R$, unless otherwise stated)
| i. | Assumptions for sensitivity analysis |
The following tables present the change in the fair value of derivative financial instruments and loans and financings in one probable and two stressed scenarios, which could result in significant gains or losses to the Company. The Company adopted three scenarios for the impairment of the fair value of the financial instruments.
| ii. | Sensitivity analysis |
| (a) | Sensitivity analysis on changes in foreign exchange rates |
The probable scenario was defined based on the US Dollar market rates as at December 31, 2014, which determines the fair values of the derivatives at that date. Stressed scenarios (positive and negative effects, before tax effects) were defined based on changes of a 25% and 50% to the US Dollar exchange rates used in the probable scenario.
Impacts on P&L(i) | ||||||
| Risk factor | Probable scenario | Variation scenario (25%) - Increase | Variation scenario (50%) - Increase | Variation scenario (25%) - Decrease | Variation scenario (50%) - Decrease | |
| COMGÁS Derivatives | ||||||
| Exchange rate and interest risks | ||||||
| Exchange rate derivatives | ||||||
| Swap contracts | Decrease in exchange | |||||
| rate R$/US$ and | ||||||
| increase in CDI curve | 330,098 | 82,524 | 165,049 | (82,524) | (165,049) | |
| Other subsidiaries derivatives | ||||||
| Exchange rate risks | ||||||
| Exchange rate derivatives | ||||||
| Term agreements | ||||||
| Purchasing agreements | Decrease in exchange | |||||
| rate R$/US$ | 21,970 | 60,733 | 99,496 | (16,794) | (55,557) | |
| Option agreements | ||||||
| Purchasing agreements | Decrease in exchange | |||||
| rate R$/US$ | 11,176 | 76,206 | 141,236 | (53,854) | (118,884) | |
| Selling agreements | Decrease in exchange | |||||
| rate R$/US$ | (20,018) | 82,200 | 184,418 | (122,237) | (224,455) | |
| Exchange rate and interest risks | ||||||
| Swap contracts | Decrease in exchange | |||||
| rate R$/US$ and | ||||||
| increase in CDI curve | 212,807 | 346,970 | 579,783 | (109,870) | (349,813) | |
| Total impact | 556,033 | 648,633 | 1,169,982 | (385,279) | (913,758) | |
| (i) COMGÁS - Exposure to fluctuations absorbed by the asset (liability), which are passed on to customers through periodic tariff revisions. | ||||||
98
Cosan Limited
Notes to the consolidated financial statements
(Amounts in thousands of Brazilian Reais – R$, unless otherwise stated)
Based on the financial instruments denominated in US Dollars at December 31, 2014 the Company performed a sensitivity analysis by increasing and decreasing the exchange rate for R$/US$ by 25% and 50%. The probable scenario considers the estimated exchange rates at the due date of the transactions for the companies with functional currency Real (positive and negative, before tax effects), as follows:
| Exchange rate sensitivity analysis (R$/US$) | ||||||||||||||||||||||||
| December 31, 2014 | Scenario | |||||||||||||||||||||||
| Probable | 25 | % | 50 | % | -25 | % | -50 | % | ||||||||||||||||
| At December 31, 2014 | 2.6562 | 2.6562 | 3.3203 | 3.9843 | 1.9922 | 1.3281 | ||||||||||||||||||
Consider the above scenarios profit or loss would be impacted as follows:
| December 31, 2014 | ||||||||||||||||||||
| Exchange rate exposure | Balance | 25 | % | 50 | % | -25 | % | -50 | % | |||||||||||
| Loans and borrowings | (4,508,084 | ) | (1,127,021 | ) | (2,254,042 | ) | 1,014,999 | 2,029,998 | ||||||||||||
| Cash and cash equivalents | 95,017 | 23,754 | 47,509 | (23,754 | ) | (47,509 | ) | |||||||||||||
| Trade receivables | 25,323 | 6,331 | 12,662 | (6,331 | ) | (12,662 | ) | |||||||||||||
| Effect on profit or loss | (1,096,936 | ) | (2,193,872 | ) | 984,914 | 1,969,828 | ||||||||||||||
| (b) | Sensitivity analysis on changes in interest rates |
A sensitivity analysis on the interest rates on loans and borrowings and in compensation for the CDI investments with pre-tax increases and decreases of 25% and 50% is presented below:
| December 31, 2014 | ||||||||||||||||||||||||
| Exposure interest rate | Balance | Scenario(I) | 25 | % | 50 | % | -25 | % | -50 | % | ||||||||||||||
| Short term investments | 1,499,039 | 177,104 | 221,439 | 265,796 | 132,792 | 88,504 | ||||||||||||||||||
| Investment securities | 149,735 | 17,690 | 22,119 | 26,550 | 13,264 | 8,840 | ||||||||||||||||||
| Loans and borrowings | (4,935,384 | ) | (439,830 | ) | (549,788 | ) | (659,745 | ) | (329,873 | ) | (219,915 | ) | ||||||||||||
| Effect on profit or loss | (306,230 | ) | (367,399 | ) | (183,816 | ) | (122,571 | ) | ||||||||||||||||
(I) The CDI and TJLP indexes considered of 11.57% and 5.50%, respectively, were obtained from information available in the market. | ||||||||||||||||||||||||
The categories of financial instruments are presented below:
99
Cosan Limited
Notes to the consolidated financial statements
(Amounts in thousands of Brazilian Reais – R$, unless otherwise stated)
| Financial assets at | ||||||||||||
| fair value trough | Loans and | |||||||||||
| Assets | profit or loss | receivables | Total | |||||||||
| Cash and cash equivalents | - | 1,649,340 | 1,649,340 | |||||||||
| Trade receivables | - | 1,346,101 | 1,346,101 | |||||||||
| Derivative financial instruments | 890,578 | - | 890,578 | |||||||||
| Securities | - | 149,735 | 149,735 | |||||||||
| Dividends receivable | - | 36,130 | 36,130 | |||||||||
| Judicial deposits | - | 418,385 | 418,385 | |||||||||
| Other financial assets | - | 440,180 | 440,180 | |||||||||
| 890,578 | 4,039,871 | 4,930,449 | ||||||||||
| Financial liabilities | Other | |||||||||||
| at fair value trough | financial | |||||||||||
| Liabilities | profit or loss | liabilities | Total | |||||||||
| Loans and borrowings | - | (8,502,640 | ) | (8,502,640 | ) | |||||||
| Derivative financial instruments | (333,434 | ) | - | (333,434 | ) | |||||||
| Trade payables | - | (1,112,459 | ) | (1,112,459 | ) | |||||||
| Preferred shareholders | ||||||||||||
| payable in subsidiaries | (1,926,888 | ) | - | (1,926,888 | ) | |||||||
| Dividends payable | - | (59,217 | ) | (59,217 | ) | |||||||
| (2,260,322 | ) | (9,674,316 | ) | (11,934,638 | ) | |||||||
Capital management
The Company's policy is to maintain a robust capital base to promote the confidence of investors, creditors and the market, and to ensure the future development of the business. Management monitors that the return on capital is adequate for each of its businesses, which the Company defines as the result of operating activities divided by total net equity.
| 32 | Fair value hierarchy |
The fair value of financial assets and liabilities is determined by reference to price at which they could be exchanged in a current transaction between parties willing to negotiate, and not in a forced sale or liquidation. The following methods and assumptions were used to estimate the fair value.
| · | The fair value of cash and cash equivalents, accounts receivable, accounts payable and other short-term obligations approximate their respective carrying values due largely to the short-term maturities of these instruments. |
| · | The fair value of marketable securities and bonds is based on price quotations at the balance sheet date. The fair value of non-negotiable instruments, bank loans and other debt, obligations under finance leases, as well as other non-current financial liabilities, are estimated using discounted future cash flow at the rates currently available for similar instruments. |
100
Cosan Limited
Notes to the consolidated financial statements
(Amounts in thousands of Brazilian Reais – R$, unless otherwise stated)
| · | The fair value of the Senior Notes due in 2018 and 2023 listed on the Luxembourg stock exchange (Note 17) is based on their quoted market price at December 31, 2014 of 88.74% (86.99% at December, 31 2013) and 99.38% (87.75% at December, 31 2013), respectively, of the face value of the Notes as at December 31, 2014. |
| · | The fair value of the perpetual bonds listed on the Luxembourg stock exchange (Note 17) is based on its quoted market price as December 31, 2014 of 101.00% (99.75% at December, 31 2013) of the face value of the bonds as at December 31, 2014. |
| · | The fair value market of other loans and financing approximate the amounts recorded in the financial statements, as they are subject to variable interest rates (Note 17). |
| · | The fair value of available for sale financial assets, is obtained through quoted market prices in active markets, when available. |
The Company and its subsidiaries enter into derivative financial instruments with various counterparties, primarily financial institutions with investment grade credit ratings. Derivatives financial instruments mainly relate to interest rate swaps, foreign exchange contracts and term contracts for commodities futures. Fair value of such derivative financial instruments is determined using valuation techniques and observable market data. The valuation techniques usually applied include the pricing models for fixed-term contracts and swaps, with a present value calculation. The models consider various inputs, including the credit risk the of counterparties, the spots and forward currency exchange rate, interest rate curves and forward rate curves of the underlying commodities.
Fair value hierarchy
The Company uses the following hierarchy to determine and disclose the fair values of financial instruments based on the valuation methodology used. Note 14 provides disclosures on investment property that is measured ate fair value and Note 30 for disclosure of assets held for sale that are measured at fair value:
| · | Level 1: quoted prices in an active market for identical assets and liabilities; |
The fair value of the assets and liabilities traded in active markets is based on quoted market prices at the balance sheet date. A market is regarded as active if quoted prices are readily and regularly available from an exchange, dealer, broker, industry group, pricing service, or regulatory agency, and those prices represent actual and regularly occurring market transactions on an arm's length basis
| · | Level 2: other techniques for which all of the data having a significant effect on the fair value recorded are observable, directly or indirectly; |
The fair value of assets and liabilities that are not quoted in an active market (for example, over-the-counter derivatives) is determined by using valuation techniques. These valuation techniques maximize the use of observable market data where it is available and rely as little as possible on entity specific estimates. If all significant inputs required to fair value an instrument are observable, the instrument is included in Level 2. If one or more of the significant inputs is not based on observable market data, the asset or liability is included in Level 3.
Specific valuation techniques used to value financial instruments include:
101
Cosan Limited
Notes to the consolidated financial statements
(Amounts in thousands of Brazilian Reais – R$, unless otherwise stated)
| I. | Quoted market prices or dealer quotes for similar instruments; |
| II. | The fair value of interest rate swaps is calculated as the present value of the estimated future cash flows based on observable yield curves; |
| III. | Other techniques, such as discounted cash flow analysis, are used to determine fair value for the remaining financial instruments. |
| · | Level 3: inputs for the instrument that are not based on observable market data (that is, unobservable inputs). As of December 31, 2014 and 2013 there are no financial instruments classified as Level 3. |
Below if the fair value of the Company’s financial instruments classified as level 1 and 2:
| Assets and liabilities | ||||||||||||
| measured at fair value | Level 1 | Level 2 | Total | |||||||||
| At December 31, 2014 | ||||||||||||
| Derivative financial assets | - | 890,578 | 890,578 | |||||||||
| Derivative financial liabilities | - | 333,434 | 333,434 | |||||||||
| Contingent consideration - Earn out | - | 186,649 | 186,649 | |||||||||
| Pension plan assets | 313,955 | 49,061 | 363,016 | |||||||||
| Securities | - | 149,735 | 149,735 | |||||||||
| Assets held for sale | - | 25,089 | 25,089 | |||||||||
| Preferred shareholders | ||||||||||||
| payable in subsidiaries | - | 1,926,888 | 1,926,888 | |||||||||
| Investment properties | - | 2,641,978 | 2,641,978 | |||||||||
| Total | 313,955 | 6,203,412 | 6,517,367 | |||||||||
| At December 31, 2013 | ||||||||||||
| Derivative financial assets | - | 513,934 | 513,934 | |||||||||
| Derivative financial liabilities | - | 331,341 | 331,341 | |||||||||
| Contingent consideration - Earn out | - | 227,976 | �� | 227,976 | ||||||||
| Securities | - | 87,978 | 87,978 | |||||||||
| Pension plan assets | 270,804 | 31,948 | 302,752 | |||||||||
| Assets held for sale | - | 314,104 | 314,104 | |||||||||
| Investment properties | - | 2,281,509 | 2,281,509 | |||||||||
| Total | 270,804 | 3,788,790 | 4,059,594 | |||||||||
102
Cosan Limited
Notes to the consolidated financial statements
(Amounts in thousands of Brazilian Reais – R$, unless otherwise stated)
| 33 | Pension and post-employment benefit plans |
| December 31, 2014 | December 31, 2013 | |||||||
| Futura | 23,048 | 71,065 | ||||||
| Futura II | 240 | 828 | ||||||
| COMGÁS | 278,562 | 267,242 | ||||||
| Total | 301,850 | 339,135 | ||||||
| a) | Pension plans |
Defined benefit
Cosan Lubrificantes e Especialidades S.A. has a non-contributory defined benefit pension plan (Futura, formerly Previd Exxon) for certain employees upon retirement. This plan was amended to close it to new entrants and approved by the relevant authorities on May 5, 2011. No new employees are eligible to participate on the plan, contributions ceased, and participants are guaranteed a benefit proportionate to their accumulated entitlement as at March 31, 2011. During the year ended December 31, 2014, the amount of contributions totaled R$8,757. During the year ended December 31, 2014, an actuarial loss was of R$31,285was recognized in other comprehensive income.
Defined contribution
Since June 1, 2011, the Company and its subsidiaries have sponsored a defined contribution plan for all employees (Futura II). The Company does not have a legal or constructive obligation to pay further contributions if the fund does not have sufficient assets to pay all of the benefits owed. During the year ended December 31, 2014 the amount of contributions totaled R$ 467 (R$ 745 on December 31, 2013). During the year ended December 31, 2014, an actuarial loss of R$ 7 (R$ 144 on December 31, 2013), was recognized in other comprehensive income.
COMGÁS offers a supplementary retirement plan, through a defined contribution Free Benefit Generating Plan (“PGBL”). During the year ended December 31, 2014, employers’ contributions to the plan totaled R$14,672 (R$ 14,969 for December 31, 2013). For the year ended December 31, 2014, an actuarial gain of R$ 4,450 was recognized in other comprehensive income.
| b) | Actuarial pension obligation |
Futura
The pension obligation related to Futura is recorded in non-current liabilities as at December 31, 2014 for an amount of R$ 23,048 (R$ 71,065 on December 31, 2013).
Details of the present value of the defined benefit obligation and the fair value of plan assets are as follows:
103
Cosan Limited
Notes to the consolidated financial statements
(Amounts in thousands of Brazilian Reais – R$, unless otherwise stated)
| December 31, 2014 | December 31, 2013 | |||||||||||
| Present value of actuarial obligation | ||||||||||||
| at beginning of period | (352,207 | ) | (402,850 | ) | ||||||||
| Interest expense | (41,459 | ) | (29,684 | ) | ||||||||
| Benefits payment | 25,064 | 18,784 | ||||||||||
| Actuarial gain on obligation | ||||||||||||
| at beginning of the period | 11,223 | 61,543 | ||||||||||
| Present value of actuarial obligation | ||||||||||||
| at the end of the period | (357,379 | ) | (352,207 | ) | ||||||||
| Fair value of plan assets at | ||||||||||||
| beginning of the period | 281,142 | 324,445 | ||||||||||
| Return on plan assets | 33,317 | 23,997 | ||||||||||
| Contributions received by the fund | 8,757 | 6,501 | ||||||||||
| Benefit payments | (25,064 | ) | (18,784 | ) | ||||||||
| Gain (loss) in fair value of plan assets | 36,179 | (55,017 | ) | |||||||||
| Fair value of plan assets end of the period | 334,331 | 281,142 | ||||||||||
| Present value of pension obligation | ||||||||||||
| in excess of fair value of plan assets | (23,048 | ) | (71,065 | ) | ||||||||
| Total expense recognized in profit or loss is as follow: | ||||||||||||
| Twelve months ended December 31, 2014 | Nine months ended December 31, 2013 | Twelve months ended March 31, 2013 | ||||||||||
| Interest expense | (41,459 | ) | (29,684 | ) | (34,208 | ) | ||||||
| Expected return on plan assets | 33,317 | 23,997 | 36,281 | |||||||||
| Early plan settlement | - | - | 778 | |||||||||
| (8,142 | ) | (5,687 | ) | 2,851 | ||||||||
| Total amount recognized as accumulated other comprehensive income: | ||||||||||||
| Twelve months ended December 31, 2014 | Nine months ended December 31, 2013 | Twelve months ended March 31, 2013 | ||||||||||
| Accumulated at the | ||||||||||||
| beginning of the period | 5,061 | (35,557 | ) | (1,389 | ) | |||||||
| Unrecognized gains (losses) | 11,223 | 61,543 | (51,770 | ) | ||||||||
| Deferred income tax | (3,816 | ) | (20,925 | ) | 17,602 | |||||||
| Accumulated at the | ||||||||||||
| end of the period | 12,468 | 5,061 | (35,557 | ) | ||||||||
104
Cosan Limited
Notes to the consolidated financial statements
(Amounts in thousands of Brazilian Reais – R$, unless otherwise stated)
Plan assets are comprised of the following:
| December 31, 2014 | December 31, 2013 | |||||||||||||||
| Amount | % | Amount | % | |||||||||||||
| Fixed income bonds | 269,170 | 80.51 | 201,129 | 71.54 | ||||||||||||
| Variable-income securities | 65,161 | 19.49 | 80,013 | 28.46 | ||||||||||||
| Total | ||||||||||||||||
| 334,331 | 100.00 | 281,142 | 100.00 | |||||||||||||
Plan assets are comprised of financial assets with quoted prices in active markets and therefore are classified as Level 1 in the valuation hierarchy of fair value. The overall expected rate of return on plan assets is determined based on prevailing market expectations on that date, applicable to the period over which the obligation is to be settled. These expectations are reflected in the following main assumptions.
The fair value of the financial instrument issued by the Company’s subsidiaries and held as plan’s assets are follows:
| December 31, 2014 | December 31, 2013 | |||||||||||||||
| Number of shares | Fair value | Number of shares | Fair value | |||||||||||||
| Cosan S.A. ON NM (CSAN3) | 708,660 | 20,443 | 708,660 | 28,046 | ||||||||||||
| Cosan Log ON NM (RLOG3) | 708,660 | 2,027 | - | - | ||||||||||||
| Total | 22,470 | 28,046 | ||||||||||||||
The main assumptions used to determine the benefit obligations of the Company are as follows:
| Defined benefit plan | December 31, 2014 | December 31, 2013 | ||
| Actuarial valuation method | Projected unit credit | Projected unit credit | ||
| Mortality table | AT-2000 segregated by sex, | AT- 2000 segregated by sex, | ||
| decreased by 10% | decreased by 10% | |||
| Discount rate for | ||||
| actuarial liability | Interest: 11.92% per year | Interest: 12.16% per year | ||
| Expected rate of | ||||
| return on plan assets | Interest: 11.92% per year | Interest: 12.16% per year | ||
| Salary growth rate | Not applicable | Not applicable | ||
| Increase rate of | ||||
| estimated benefits | Inflation: 5.2% per year | Inflation: 5.4% per year |
The Company expects to make contributions for an amount of R$7,882 in relation to its defined benefit plan and variable contribution plan in 2015.
105
Cosan Limited
Notes to the consolidated financial statements
(Amounts in thousands of Brazilian Reais – R$, unless otherwise stated)
COMGÁS
The obligations for post-employment benefits plans, which include medical and early retirement incentives, disability and sickness allowance.
COMGÁS maintains with Bradesco Vida e Previdência S.A., a variable-contribution complementary open pension plan denominated Free Benefit Generating Plan (PGBL), approved by the Superintendence of Private Insurances (SUSEP). This is a fixed-income plan, the objective of which is to provide pension benefits in the form of lifetime monthly pensions.
The actuarial assumptions are as follow:
| Actuarial assumptions | December 31, 2014 | December 31, 2013 | ||
| Discount rate | 12.78% | 12.36% | ||
| Inflation rate | 6.00% | 5.50% | ||
| Expected rate of return on plan assets | 12.78% | 12.36% | ||
| Future salary increases | 9.18% | 8.66% | ||
| Increase in pension plans | 6.00% | 5.50% | ||
| Mortality (ageing factor) | 3.00% | 3.00% | ||
| Mortality (by gender) | AT 2000 M&F | AT 2000 M&F | ||
| Disabled Associates Mortality | IAPB 1957 | IAPB 1957 | ||
| Disability entry (modified) | UP-84 | UP-84 | ||
| Turnover | 30% / (Length of service +1) | 30% / (Length of service +1) |
The Benefit plan was assessed by management in conjunction with its actuarial experts at December 31, 2014, to determine whether the contribution rates are sufficient maintain reserves necessary to meet current and future payments.
The compositions of the balance of the actuarial liabilities are as follows:
| December 31, 2014 | December 31, 2013 | |||||||
| Present value of actuarial obligations | 284,770 | 274,433 | ||||||
| Fair value of the plan assets | (6,208 | ) | (7,191 | ) | ||||
| Net actuarial pension obligation | 278,562 | 267,242 | ||||||
Change in actuarial obligations are shown below:
106
Cosan Limited
Notes to the consolidated financial statements
(Amounts in thousands of Brazilian Reais – R$, unless otherwise stated)
| December 31, 2014 | December 31, 2013 | |||||||
| Actuarial liabilities at | ||||||||
| beginning of the period | 267,242 | 291,041 | ||||||
| Expenses | 32,735 | 27,700 | ||||||
| Employer contributions | (14,672 | ) | (14,969 | ) | ||||
| Actuarial losses recognized in | ||||||||
| the other comprehensive income | (6,743 | ) | (36,530 | ) | ||||
| Actuarial liabilities at | ||||||||
| end of the period | 278,562 | 267,242 | ||||||
| c) | Sensitivity analysis |
Reasonably possible changes at the reporting date to one of the relevant actuarial assumptions, holding other assumptions constant, would have affected the defined benefit obligation by the amounts shown below.
Present value of actuarial obligations effect:
| Discount rate | ||||||||||||||||
| Increase | Decrease | |||||||||||||||
| 1 | % | 0,5 | % | -1 | % | -0.5 | % | |||||||||
| Futura | (32,781 | ) | - | 39,413 | - | |||||||||||
| Futura II | (18 | ) | - | 20 | - | |||||||||||
| COMGÁS | - | (15,307 | ) | - | 16,836 | |||||||||||
| 34 | Share-based payment |
At the annual and extraordinary general shareholders’ meeting held on July 29, 2011, the guidelines for the outlining and structuring of the stock option compensation plan for Cosan S.A.’s executives and employees were approved, authorizing the issue of up to 5% of shares of Cosan S.A.’s total capital. This stock option plan was created to attract and retain executives and key employees, offering them the opportunity to become Cosan S.A.’s shareholders.
On August 18, 2011, Cosan S.A.’s board of directors approved the total number of stock option awards of 12,000,000 shares to be issued or treasury shares held by Cosan S.A., corresponding to 2.41% of the share capital at that time. On the same date the eligible executives were informed about the terms and conditions of the stock-option plan.
As of August 18, 2011, 10,525,000 awards were granted in the three tranches described below:
| · | Tranche A - The options can be exercised after a vesting period of one year, considering a maximum percentage of 20% per annum of the total stock options granted by Cosan S.A. for an exercise period of 5 years. Exercise period ends on August 19, 2016. |
107
Cosan Limited
Notes to the consolidated financial statements
(Amounts in thousands of Brazilian Reais – R$, unless otherwise stated)
| · | Tranche B - The options can be exercised after a vesting period of one year, considering a maximum percentage of 10% per annum of the total stock options granted by Cosan S.A. within an exercise period of 10 years. Exercise period ends in August 19, 2021. |
| · | Tranche C - The options can be exercised after a vesting period of one year, considering a maximum percentage of 20% per annum of the total stock options granted by Cosan S.A. for an exercise period of 5 years. Exercise period ends on December 11, 2017 |
According to the average market value of the shares over a 30 day period ending at issuance, the exercise price was defined to be R$22.80 per share, without any discount.
At April 24, 2013 and April 25, 2014, 970,000 and 960,000 options, respectively, secured from the fifth year, were granted to eligible executives based on the below:
| · | The fair value of options granted was estimated at the date of exercise using the binomial model simulation, considering the terms and conditions upon which the options were granted; |
| · | The options may be exercised with the issuance of new shares or treasury shares that the company may have. |
The fair value of share based payments was estimated adopting the binomial model with the following assumptions:
| Options granted | ||||||||||||||||||||
| August 18, 2011 | August 18, 2011 | December 12, 2012 | April 24, 2013 | April 25, 2014 | ||||||||||||||||
| Tranche A | Tranche B | Tranche C | ||||||||||||||||||
| Exercise price - R$ | 22.80 | 22.80 | 39.60 | 45.22 | 37.01 | |||||||||||||||
| Expected life (in years) | 1 to 5 | 1 to 10 | 1 to 5 | 5 | 5 | |||||||||||||||
| Interest rate | 11.49 | % | 11.49 | % | 8.78 | % | 9.10 | % | 12.43 | % | ||||||||||
| Expected volatility | 31.44 | % | 30.32 | % | 31.44 | % | 27.33 | % | 29.85 | % | ||||||||||
| Fair value at grant date | ||||||||||||||||||||
| (weighted-average) - R$ | 6.80 | 8.15 | 11.10 | 17.95 | 15.67 | |||||||||||||||
Expected exercise - The expected timeframe for the exercise of the options was determined by considering the premise that executives exercise their options after the grace period.
Expected volatility – The Company opted to use the historic volatility of their shares adjusted by volatility of competitors’ shares that operate in similar lines of business.
Expected dividends – The dividends expected were calculated on the basis of the current market value on the grant’s date, adjusted by the average rate of return of capital to shareholders during the forecast period, and compared with to the book value shares.
Risk free interest rate – the company considered the prime rate as the risk free interest rate traded at BM&FBovespa on the grant date and for the equivalent term of the option maturity.
On October 1, 2014 at the Extraordinary General Meeting (“EGM”), the Cosan S.A. shareholder’s approved the partial spin-off of Cosan S.A. and merger of the spun-off portion into Cosan Log, composed of Cosan’s
108
Cosan Limited
Notes to the consolidated financial statements
(Amounts in thousands of Brazilian Reais – R$, unless otherwise stated)
logistics operations. The EGM also approved the Cosan Log’ Stock Option Plan in similar terms to the existing Cosan S.A. Plan, allowing their beneficiaries upon exercise to receive one Cosan S.A. share and one Cosan Log share. The exercise prices of the plans of Cosan S.A. and Cosan Log were adjusted so that the beneficiaries of the stock option plan of the two companies had their options set at the same exchange ratio for all shareholders’ (one share of Cosan S.A. and one share Cosan Log).
At December 31, 2014, R$ 12,924 (R$ 6,595 on December 31, 2013) had been recognized as an expense related to the stock option plan. The weighted average remaining contractual term for the options at December 31, 2013 was two years. The expenses to be recognized in future years total R$ 27,455 at December 31, 2014.
The changes in the plan during the period was:
| Weighted- | ||||||||
| Number of | average | |||||||
| options | exercise price - R$ | |||||||
| At March 31, 2013 | 9,102,000 | 23.99 | ||||||
| Granted | 925,000 | 45.54 | ||||||
| Share options exercised | (682,000 | ) | (23.95 | ) | ||||
| At December 31, 2013 | 9,345,000 | 26.09 | ||||||
| Granted | 1,705,000 | 40.62 | ||||||
| Share options exercised | (1,818,000 | ) | (25.21 | ) | ||||
| Cancellation or settlements | (320,000 | ) | - | |||||
| At December 31, 2014 | 8,912,000 | 30.09 | ||||||
| 35 | Subsequent events |
Antitrust approval of the merger with ALL:
On February 11, 2015, the merger of ALL by the Company’s subsidiary Rumo was approved by CADE (antitrust authority) pursuant to Article 61 of Law No. 12,529/2011, upon the conclusion of an Merger Control Agreement (“ACC”) subject to conditions precedent to restrict certain competition conflicts as determined by the General Superintendent of the CADE.
These restrictions will remain in force for a period of seven years and are aimed at ensuring fair treatment for all rail freight users, mainly through governance rules and increased pricing transparency, provide control services and limiting the use of rail transport by related parties.
The Company and its subsidiaries intend to proceed with the necessary steps to effect the merger, pursuant to the Merger Protocol.
* * *
109
SIGNATURES
Pursuant to the requirements of the Securities Exchange Act of 1934, the registrant has duly caused this report to be signed on its behalf by the undersigned, thereunto duly authorized.
| COSAN LIMITED | ||||||
| Date: | March 19, 2015 | By: | /s/ Marcelo Eduardo Martins | |||
| Name: | Marcelo Eduardo Martins | |||||
| Title: | Chief Financial Officer and Investor Relations Officer | |||||