UNITED STATES
SECURITIES AND EXCHANGE COMMISSION
Washington, D.C. 20549
FORM20-F
| ☐ | REGISTRATION STATEMENT PURSUANT TO SECTION 12(b) OR (g) OF THE SECURITIES EXCHANGE ACT OF 1934 |
OR
| ☒ | ANNUAL REPORT PURSUANT TO SECTION 13 OR 15(d) OF THE SECURITIES EXCHANGE ACT OF 1934 For the fiscal year ended December 31, 2018 |
OR
| ☐ | TRANSITION REPORT PURSUANT TO SECTION 13 OR 15(d) OF THE SECURITIES EXCHANGE ACT OF 1934 |
OR
| ☐ | SHELL COMPANY REPORT PURSUANT TO SECTION 13 OR 15(d) OF THE SECURITIES EXCHANGE ACT OF 1934 |
Commission file number:1-33659
COSAN LIMITED
(Exact name of Registrant as specified in its charter)
N/A
(Translation of Registrant’s name into English)
Bermuda
(Jurisdiction of incorporation or organization)
Av. Faria Lima, 4,100 – 16th floor
São Paulo – SP,04543-011, Brazil
(55)(11) 3897-9797
(Address of principal executive offices)
Marcelo Eduardo Martins
(55)(11) 3897-9797
ri@cosan.com
Av. Faria Lima, 4,100 – 16th floor
São Paulo – SP,04543-011, Brazil
(Name, Telephone,E-Mail and/or Facsimile number and Address of Company Contact Person)
Securities registered or to be registered pursuant to Section 12(b) of the Act:
| | |
Title of each class | | Name of each exchange on which registered |
| Class A Common Shares | | New York Stock Exchange |
Securities registered or to be registered pursuant to Section 12(g) of the Act:
None
Securities for which there is a reporting obligation pursuant to Section 15(d) of the Act:
None
Indicate the number of outstanding shares of each of the issuer’s classes of capital or common stock as of the close of the period covered by the annual report.
The number of outstanding shares as of December 31, 2018 was:
| | |
Title of Class | | Number of Shares Outstanding |
Class A Common Shares, par value $.01 per share | | 148,343,668 |
Class B – series 1 – Common Shares, par value $.01 per share | | 96,332,044 |
Indicate by check mark if the registrant is a well-known seasoned issuer, as defined in Rule 405 of the Securities Act.
Yes ☒ No ☐
If this report is an annual or transition report, indicate by check mark if the registrant is not required to file reports pursuant to Section 13 or 15(d) of the Securities Exchange Act of 1934.
Yes ☐ No ☒
Note – Checking the box above will not relieve any registrant required to file reports pursuant to Section 13 or 15(d) of the Securities Exchange Act of 1934 from their obligations under those Sections.
Indicate by check mark whether the registrant (1) has filed all reports required to be filed by Section 13 or 15(d) of the Securities Exchange Act of 1934 during the preceding 12 months (or for such shorter period that the registrant was required to file such reports), and (2) has been subject to such filing requirements for the past 90 days.
Yes ☒ No ☐
Indicate by check mark whether the registrant has submitted electronically every Interactive Data File required to be submitted pursuant to Rule 405 of RegulationS-T (§232.405 of this chapter) during the preceding 12 months (or for such shorter period that the registrant was required to submit such files).
Yes ☒ No ☐
Indicate by check mark whether the registrant is a large accelerated filer, an accelerated filer, anon-accelerated filer, or an emerging growth company. See definition of “large accelerated filer,” “accelerated filer,” and “emerging growth company” in Rule12b-2 of the Exchange Act. (Check one):
Large Accelerated Filer ☒ AcceleratedFiler ☐ Non-accelerated Filer ☐ Emerging growth company ☐
If an emerging growth company that prepares its financial statements in accordance with U.S. GAAP, indicate by check mark if the registrant has elected not to use the extended transition period for complying with any new or revised financial accounting standards† provided pursuant to Section 13(a) of the Exchange Act. ☐
† The term “new or revised financial accounting standard” refers to any update issued by the Financial Accounting Standards Board to its Accounting Standards Codification after April 5, 2012.
Indicate by check mark which basis of accounting the registrant has used to prepare the financial statements included in this filing:
| ☒ | International Financial Reporting Standards as issued by the International Accounting Standards Board |
If “Other” has been checked in response to the previous question, indicate by check mark which financial statement item the registrant has elected to follow.
☐ Item 17 ☐ Item 18
If this is an annual report, indicate by check mark whether the registrant is a shell company (as defined in Rule12b-2 of the Exchange Act).
Yes ☐ No ☒
TABLE OF CONTENTS
i
ii
Presentation of Financial and Other Information
We present our consolidated financial statements in accordance with International Financial Reporting Standards, or “IFRS,” as issued by the International Accounting Standards Board, or “IASB,” for Securities and Exchange Commission, or “SEC,” filings.
The consolidated financial statements are presented in Brazilianreais. However, the functional currency of Cosan Limited is the U.S. dollar. The Brazilian real is the currency of the primary economic environment in which Cosan S.A., or “Cosan” or “Cosan S.A.,” Cosan Logística S.A., or “Cosan Logística,” and their respective subsidiaries and jointly-controlled entities, located in Brazil, operate and generate and expend cash. The functional currency for the subsidiaries located outside Brazil is the U.S. dollar, British pound or the Euro. Cosan Limited, Cosan S.A., Cosan Logística and its subsidiaries are collectively referred to as the “Company.”
We have presented our consolidated financial statements for the years ended December 31, 2018, 2017 and 2016, in accordance with IFRS as issued by the IASB. Our consolidated financial statements as of December 31, 2018, 2017 and 2016 and for the years then ended have been audited by KPMG Auditores Independentes, or “KPMG.” KPMG is an independent registered public accounting firm, whose report is included herein.
On June 1, 2011, we and Shell Brazil Holdings B.V., or “Shell,” formed two joint ventures, or the “Joint Venture,” for a combined 50/50 investment, under the names Raízen Combustíveis S.A., or “Raízen Combustíveis” and Raízen Energia e Participações S.A. (currently Raízen Energia S.A.), or “Raízen Energia,” collectively referred to as “Raízen.” Our management evaluates the results of Raízen Energia and Raízen Combustíveis on the same basis as they are evaluated by the management of Raízen, which is on a 100% basis. Accordingly, unless the context requires otherwise, operational information pertaining to Raízen Energia and Raízen Combustíveis included in this annual report refers to 100% of the operations of these businesses. Upon the application of IFRS11- Joint Arrangements, or “IFRS 11,” the Company retrospectively changed the accounting for its investments in Raízen Combustíveis and Raízen Energia, classifying them as investments in joint ventures. As disclosed in “Item 5. Operating and Financial Review and Prospects,” following the adoption of IFRS 11, starting in April 2013 Cosan S.A. no longer proportionally consolidates Raízen Energia and Raízen Combustíveis in its consolidated statement of financial position, statement of profit or loss and comprehensive income and statement of cash flows, and the results of these investments have been presented using the equity method of accounting in accordance with IAS 28R—“Investments in Associates and Joint Ventures.” For further details, see note 9 to our financial statements.
On April 1, 2015, Cosan S.A., through its then subsidiary Rumo Logística Operadora Multimodal S.A. or “Rumo Logística,” acquired 100% of the common shares of ALL – América Latina Logística S.A., or “ALL.” Accordingly, we began consolidating ALL’s results within our own results of operations as from that date.
On September 30, 2016, Cosan S.A. entered into a Share Purchase Agreement with Mansilla Participações Ltda. (a vehicle of TIAA Teachers Insurance and Annuity Association of America), another shareholder in Radar Propriedades Agrícolas S.A. and Radar II Propriedades Agrícolas S.A., or “Radar and Radar II,” through which Cosan S.A. sold part of its shares in Radar and Radar II for an amount of R$1,053.8 million. The consideration was received on November 4, 2016. As a result of this transaction, Cosan S.A. reduced its equity interest in Radar and Radar II from 37.7% to 3.0%. Cosan S.A. retains significant influence over Radar and Radar II through a shareholders’ agreement as described in “Item 7. Major Shareholders and Related Party Transactions.” The criteria used to measure the remaining stake of the investment was the equity method, in accordance with IAS 28, although it is not consolidated due to the limitation on Cosan S.A.’s decision-making power set forth the shareholders’ agreement. The comparative consolidated statement of profit or loss and statements of cash flows have been restated to show the discontinued operation separately from continuing operations.
On October 8, 2016, ALL – América Latina Logística S.A. changed its corporate name to Rumo S.A. or “Rumo.” Subsequently, on December 31, 2016, Rumo Logística was merged into its wholly-owned subsidiary Rumo, as a result of which Rumo S.A. is the successor entity to Rumo Logística.
In 2016, amendments to IAS 16 and IAS 41 changed the accounting requirements for biological assets that fall within the definition of “bearer plants.” These amendments substantially impact Raízen Energia, and the following line items: “Investments in Joint Ventures” in our statement of financial position and “Equity in Earnings of Joint Ventures” in our statement statements of profit or loss.
iii
Furthermore, during 2016, Cosan S.A. identified an immaterial error related to the recognition of tax installment liabilities, related to federal taxes other than income tax, referring to 2011. Cosan S.A. has determined that it was appropriate to revise its financial statements for the years ended December 31, 2016, 2015 and 2014. The revisions to correct the error in the applicable fiscal years are reflected in the financial information herein and will be reflected in future filings containing such information.
On December 12, 2017, we exercised a put option with Shell relating to shares in Companhia de Gás de São Paulo – COMGÁS, or “Comgás,” and bought a total of 21,805,645 shares, which represents 16.77% of Comgás’s share capital for R$1,042 million. As part of the payment, we delivered to Shell 17,187,937 common shares issued by Cosan S.A., representing 4.21% of its capital stock, and also made a cash payment of R$208.7 million. Additionally, we recognized accounts payable referring to the second installment to be settled within one year after the closing of the transaction in the amount of R$208.7 million (plus interest accruing at rate of 3% per year). As a result, Shell ceased to be a shareholder in Comgás.
On December 22, 2017, Cosan S.A. entered into a definitive agreement with Jus Capital Gestão de Recursos Ltda. and Farallon Latin America Investimentos Ltda., for the purchase and sale of credit rights arising from severance claims filed against the Brazilian federal government, which was required to pay compensation for material damages resulting from the fixing of sugar and alcohol prices below their cost of production, in a total amount of R$1,340 million. In addition to the acquisition price, Cosan S.A. will be entitled to receive certain additional payments which are contingent upon the purchaser’s actual receipts from the receivables.
On March 19, 2018, CLE entered into an agreement with ExxonMobil pursuant to which CLE has received exclusive production, import, distribution and marketing rights in Brazil, Bolivia, Paraguay and Uruguay for lubricants and certain other related products under the Mobil brand until November 30, 2038. This agreement came into force on December 1, 2018.
On April 24, 2018, Raízen Combustíveis and its subsidiary Raízen Argentina Holdings S.A.U. entered into a contract for the acquisition of Shell’s downstream business in Argentina. Pursuant to the above-mentioned agreement, Raízen Argentina Holdings S.A.U. acquired 100% of the outstanding share capital of Shell Compañía Argentina de Petróleo S.A and Energina Compañía Argentina de Petróleo S.A., or “Shell Argentina,” for an amount of U.S.$916 million. The acquisition process was completed on October 1, 2018.
On December 21, 2018, Cosan Lubes Investments Limited, or “CLI,” and CVC Fund VII, or “CVC,” entered into an investment agreement pursuant to which CVC will subscribe for shares in Moove’s capital in a total amount of R$562 million (which is equivalent to approximately 30% of Moove’s capital). Following the satisfaction of the applicable conditions provided in the investment agreement, the transaction closed on March 29, 2019. As a result and pursuant to the terms of the investment agreement, Moove received R$434 million at the closing of the transaction and may receive up to approximately R$128 million until 2021, if certain targets set forth in the investment agreement are met.
Forward-Looking Statements
This annual report contains estimates and forward-looking statements, mainly under “Item 3. Key Information—D. Risk Factors,” “Item 4. Information on the Company—B. Business Overview” and “Item 5. Operating and Financial Review and Prospects.” Some of the matters discussed concerning our business and financial performance include estimates and forward-looking statements.
Our estimates and forward-looking statements are mainly based on our current expectations and estimates on projections of future events and trends, which affect or may affect our businesses and results of operations. Although we believe that these estimates and forward-looking statements are based upon reasonable assumptions, they are subject to several risks and uncertainties and are made in light of information currently available to us. Our estimates and forward-looking statements may be influenced by the following factors, among others:
| | • | | general economic, political, demographic and business conditions in Brazil and in the world and the cyclicality affecting our selling prices; |
| | • | | the effects of global financial and economic crises in Brazil; |
iv
| | • | | our ability to implement our expansion strategy in other regions of Brazil and international markets through organic growth, acquisitions or Joint Ventures; |
| | • | | our ability to successfully compete in all segments and geographical markets where we currently conduct business or may conduct businesses in the future; |
| | • | | competitive developments in the segments in which we operate; |
| | • | | our ability to implement our capital expenditure plan, including our ability to arrange financing when required and on reasonable terms; |
| | • | | government intervention resulting in changes in the economy, taxes and tariffs affecting the markets in which we operate; |
| | • | | price of natural gas, ethanol and other fuels, as well as sugar; |
| | • | | equipment failure and service interruptions; |
| | • | | our ability to compete and conduct our businesses in the future; |
| | • | | adverse weather conditions; |
| | • | | changes in customer demand; |
| | • | | changes in our businesses; |
| | • | | our ability to work together successfully with our partners to operate our partnerships (such as the Joint Venture); |
| | • | | technological advances in the natural gas sector, including developments of natural gas for use in other applications, and advances in the development of alternatives to natural gas; |
| | • | | technological advances in the ethanol sector and advances in the development of alternatives to ethanol; |
| | • | | changes in global energy usage; |
| | • | | government intervention and trade barriers, resulting in changes in the economy, taxes, rates, prices or regulatory environment including in relation to our regulated businesses such as Comgás and Rumo; |
| | • | | inflation, depreciation, appreciation and depreciation of thereal; |
| | • | | other factors that may affect our financial condition, liquidity and results of our operations; and |
| | • | | other risk factors discussed under “Item 3. Key Information–D. Risk Factors.” |
The words “believe,” “may,” “will,” “estimate,” “continue,” “anticipate,” “intend,” “expect” and similar words are intended to identify estimates and forward-looking statements. Estimates and forward-looking statements speak only as of the date they were made, and we undertake no obligation to update or to review any estimate and/or forward-looking statement because of new information, future events or other factors. Estimates and forward-looking statements involve risks and uncertainties and are not guarantees of future performance. Our future results may differ materially from those expressed in these estimates and forward-looking statements. In light of the risks and uncertainties described above, the estimates and forward-looking statements discussed in this annual report might not occur and our future results and our performance may differ materially from those expressed in these forward-looking statements due to but not limited to, the factors mentioned above. Because of these uncertainties, you should not make any investment decision based on these estimates and forward-looking statements.
v
Market Data
We obtained market and competitive position data, including market forecasts, used throughout this annual report from market research, publicly available information and industry publications, as well as internal surveys. We include data from reports prepared by LMC International Ltd., the Central Bank of Brazil (Banco Central do Brasil), or the “Brazilian Central Bank,” the Sugarcane Agroindustry Association of the state of São Paulo (União da Agroindústria Canavieira de São Paulo), or “UNICA,” the Brazilian Ministry of Agriculture, Livestock, and Supply (Ministério da Agricultura, Pecuária e Abastecimento), or “MAPA,” the Brazilian Institute of Geography and Statistics (Instituto Brasileiro de Geografia e Estatística), or “IBGE,” the Brazilian Ministry of Development, Industry and Foreign Trade (Ministério do Desenvolvimento e do Comércio Exterior), or “MDIC,” the Food and Agriculture Organization of the United Nations, or “FAO,” the National Traffic Agency (Departamento Nacional de Trânsito—DENATRAN), the Brazilian Association of Vehicle Manufactures (Associação Nacional dos Fabricantes de Veículos Automotores—ANFAVEA), Datagro Publicações Ltda., F.O. Licht, Czarnikow, Apoio e Vendas Procana Comunicações Ltda., the São Paulo Stock, Commodities and Futures Exchange (B3 S.A. – Brasil, Bolsa, Balcão), or “B3,” the International Sugar Organization, the Brazilian National Economic and Social Development Bank (Banco Nacional de Desenvolvimento Econômico e Social), or “BNDES,” the New York Board of Trade, or “NYBOT,” the New York Stock Exchange, or “NYSE,” the Brazilian Agricultural Research Corporation (Empresa Brasileira de Pesquisa Agropecuária), or “Embrapa,” the Brazilian Secretariat for Foreign Trade (Secretaria de Comércio Exterior), or “Secex,” the National Supply Company (Companhia Nacional de Abastecimento), or “Conab,” the London Stock Exchange, the National Agency of Petroleum, Natural Gas and Biofuels (ANP—Agência Nacional do Petróleo, Gás Natural e Biocombustíveis), or “ANP,” the Brazilian antitrust authority (Superintendência-Geral do Conselho Administrativo de Defesa Econômica), or “CADE,” the National Union of Distributors of Fuels and Lubricants (Associação Nacional das Distribuidoras de Combustíveis, Lubrificantes, Logística e Conveniência), or “Plural,” the Sanitation and Energy Regulatory Agency for the state of São Paulo (Agência Reguladora de Energia de São Paulo), or “ARSESP,” the Brazilian Gas Distributors Association (Associação Brasileira das Empresas Distribuidoras de Gás), or “ABEGÁS,” the Agriculture School of the University of São Paulo (Escola Superior de Agricultura Luiz de Queiroz), or “ESALQ,” the National Waterway Transportation Agency (Agência Nacional de Transportes Aquaviários), or “ANTAQ,” and the National Electric Energy Agency (Agência Nacional de Energia Elétrica), or “ANEEL.” We believe that all market data in this annual report is reliable, accurate and complete.
Terms Used in This Annual Report
In this annual report, we present information in gallons, liters and cubic meters (m³). In addition, we also present information in tons. In this annual report, references to “ton” or “tonne” refer to the metric tonne, which is equal to 1,000 kilograms.
All references in this annual report to “TSR” are to total sugar recovered, which represents the total amount of sugar content in a given quantity of sugarcane.
All references in this annual report to “RTK” mean revenue ton kilometer.
All references in this annual report to “U.S. dollars,” “dollars” or “U.S.$” are to U.S. dollars. All references to the “real,” “reais” or “R$” are to the Brazilianreal, the official currency of Brazil.
Rounding
We have rounding adjustments to reach some of the figures included in this annual report. Accordingly, numerical figures shown as totals in some tables may not be an arithmetic aggregation of the figures that preceded them.
vi
PART I
| Item 1. | Identity of Directors, Senior Management and Advisers |
Not applicable.
| Item 2. | Offer Statistics and Expected Timetable |
Not applicable.
| A. | Selected Financial Data |
The following tables present selected historical financial and operating data for the Company derived from our audited consolidated financial statements. You should read the following information in conjunction with our audited consolidated financial statements and related notes, and the information under “Item 5. Operating and Financial Review and Prospects” in this annual report.
The financial data at and for the fiscal years ended December 31, 2018, 2017, 2016, 2015 and 2014 have been derived from our audited consolidated financial statements prepared in accordance with IFRS as issued by the IASB, unless otherwise stated.
Business Segments and Presentation of Segment Financial Data
We present the following reportable segments:
(1) Raízen Energia: production and marketing of a variety of products derived from sugar cane, including raw sugar (Very High Polarization, or “VHP”), anhydrous and hydrated ethanol, and activities related to energy cogeneration from sugarcane bagasse. In addition, this segment holds interests in companies engaged in research and development on new technology;
(2) Raízen Combustíveis: distribution and marketing of fuels, mainly through a franchised network of service stations under the “Shell” brand throughout Brazil, petroleum refining, the operation of fuel resellers, the manufacture and sale of automotive and industrial lubricants, and the production and sale of liquefied petroleum gas throughout Argentina;
(3) Comgás: distribution of piped natural gas in part of the state of São Paulo to customers in the industrial, residential, commercial, automotive and cogeneration sectors;
(4) Cosan Logística: logistics services for rail transportation, storage and port loading of commodities, mainly for grains and sugar, leasing of locomotives, wagons and another railway equipment;
(5) Moove, consisting of Cosan Lubrificantes e Especialidades S.A., or “CLE,” Stanbridge Group Limited, or “Stanbridge,” Moove Lubricants Limited, or “Moove Lubricants,” (previously known as Comma Oil Chemicals Limited), TTA—SAS Techniques et Technologie Appliquées, or “TTA,” LubrigrupoII, S.A., or “LubrigrupoII,” Cosan Lubrificantes S.R.L, or “Cosan S.R.L” and Commercial Lubricants, LLC (d/b/a Metrolube), or “Metrolube”: production and distribution of lubricants under the Mobil brand in Brazil, Argentina, Bolivia, Uruguay, Paraguay, the United States of America and Europe, as well as in the European and Asian markets under the Comma trademark; and
1
Reconciliation
(6) Cosan Corporate: an online payment services platform and other investments, in addition to the corporate activities of the Company. The Cosan corporate segment includes the financing subsidiaries for the Cosan group.
Following the adoption of IFRS 11, as of April 1, 2013 Cosan S.A. no longer proportionally consolidates Raízen Energia and Raízen Combustíveis in its consolidated statement of financial position, consolidated statement of profit or loss and comprehensive income and consolidated cash flows, and the results from these businesses are accounted for under the line item “Interest in earnings of joint ventures” in our consolidated statement of profit or loss and other comprehensive income.
| | | | | | | | | | | | | | | | | | | | |
| | | As of and for the fiscal year ended December 31, | |
| | | 2018 | | | 2017 | | | 2016 | | | 2015 | | | 2014 | |
| | | (in millions of reais, except where otherwise indicated) | |
Consolidated Profit or Loss Data: | | | | | | | | | | | | | | | | | | | | |
Net sales | | | 16,843.9 | | | | 13,582.5 | | | | 12,518.1 | | | | 12,355.5 | | | | 8,904.7 | |
Cost of sales | | | (12,119.9 | ) | | | (9,232.2 | ) | | | (8,317.5 | ) | | | (8,645.7 | ) | | | (6,353.1 | ) |
| | | | | | | | | | | | | | | | | | | | |
Gross profit | | | 4,724.0 | | | | 4,350.3 | | | | 4,200.6 | | | | 3,709.8 | | | | 2,551.6 | |
| | | | | | | | | | | | | | | | | | | | |
Selling expenses | | | (1,023.5 | ) | | | (1,068.7 | ) | | | (1,037.5 | ) | | | (900.7 | ) | | | (881.5 | ) |
General and administrative expenses | | | (981.8 | ) | | | (935.3 | ) | | | (1,000.7 | ) | | | (911.7 | ) | | | (632.1 | ) |
Other income (expense), net | | | 738.1 | | | | 877.6 | | | | (116.3 | ) | | | 252.3 | | | | (152.8 | ) |
Total operations expenses | | | (1,267.1 | ) | | | (1,126.4 | ) | | | (2,154.5 | ) | | | (1,560.1 | ) | | | (1,666.5 | ) |
| | | | | | | | | | | | | | | | | | | | |
Income before equity in earnings of investees and finance results | | | 3,456.9 | | | | 3,223.9 | | | | 2,046.1 | | | | 2,149.7 | | | | 885.1 | |
Interest in earnings of investees | | | 997.8 | | | | 1,002.3 | | | | 1,565.7 | | | | 703.1 | | | | 580.0 | |
Finance results | | | (1,610.9 | ) | | | (2,751.5 | ) | | | (3,055.8 | ) | | | (2,184.5 | ) | | | (996.8 | ) |
| | | | | | | | | | | | | | | | | | | | |
Profit before taxes | | | 2,843.8 | | | | 1,474.7 | | | | 556.0 | | | | 668.3 | | | | 468.3 | |
Income tax (expense) benefit: | | | | | | | | | | | | | | | | | | | | |
Current | | | (464.9 | ) | | | (134.5 | ) | | | (228.6 | ) | | | (167.7 | ) | | | (143.3 | ) |
Deferred | | | (295.6 | ) | | | (293.9 | ) | | | 166.9 | | | | 198.1 | | | | 119.7 | |
| | | | | | | | | | | | | | | | | | | | |
| | | (760.5 | ) | | | (428.4 | ) | | | (61.7 | ) | | | 30.4 | | | | (23.6 | ) |
Profit from continuing operations | | | 2,083.3 | | | | 1,046.3 | | | | 494.2 | | | | 698.7 | | | | 444.7 | |
(Loss) profit from discontinued operation, net of tax | | | — | | | | — | | | | (35.3 | ) | | | 100.9 | | | | 180.6 | |
| | | | | | | | | | | | | | | | | | | | |
Profit for the period | | | 2,083.3 | | | | 1,046.3 | | | | 458.9 | | | | 799.6 | | | | 625.3 | |
Net income for the period attributable tonon-controlling interests | | | (1,107.7 | ) | | | (495.3 | ) | | | (181.2 | ) | | | (394.0 | ) | | | (465.1 | ) |
| | | | | | | | | | | | | | | | | | | | |
Net income for the period attributable to owners of the parent (including discontinued operations) | | | 975.5 | | | | 551.0 | | | | 277.8 | | | | 405.6 | | | | 160.2 | |
| | | | | | | | | | | | | | | | | | | | |
Consolidated Statement of Financial Position Data: | | | | | | | | | | | | | | | | | | | | |
Cash and cash equivalents | | | 3,621.8 | | | | 4,555.2 | | | | 4,499.6 | | | | 3,505.8 | | | | 1,649.3 | |
Marketable securities | | | 4,202.8 | | | | 3,853.3 | | | | 1,291.6 | | | | 605.5 | | | | 149.7 | |
Inventories | | | 716.3 | | | | 663.1 | | | | 630.8 | | | | 656.9 | | | | 353.7 | |
Property, plant and equipment | | | 12,417.8 | | | | 11,681.6 | | | | 10,726.4 | | | | 9,805.9 | | | | 1,435.9 | |
Intangible assets and goodwill | | | 17,190.4 | | | | 16,973.6 | | | | 17,109.4 | | | | 17,309.7 | | | | 10,286.4 | |
Total assets | | | 56,360.7 | | | | 55,624.5 | | | | 50,469.9 | | | | 52,249.2 | | | | 29,696.3 | |
Current liabilities | | | 6,240.8 | | | | 9,022.3 | | | | 6,629.1 | | | | 6,922.6 | | | | 2,970.9 | |
Non-current liabilities | | | | | | | | | | | | | | | | | | | | |
Loans, borrowings and debentures | | | 22,574.3 | | | | 21,688.9 | | | | 18,338.5 | | | | 18,829.2 | | | | 8,502.6 | |
Preferred shareholders payable in subsidiaries | | | 1,097.5 | | | | 1,442.7 | | | | 1,769.6 | | | | 2,042.9 | | | | 1,926.9 | |
Provision for legal proceedings | | | 1,363.2 | | | | 1,348.2 | | | | 1,268.6 | | | | 1,193.9 | | | | 657.8 | |
Equity attributable to owners of the parent | | | 6,614.4 | | | | 6,038.8 | | | | 6,272.5 | | | | 5,913.7 | | | | 5,795.4 | |
Equity attributable tonon-controlling interests | | | 11,355.0 | | | | 11,020.7 | | | | 9,737.3 | | | | 10,275.5 | | | | 7,615.0 | |
| | | | | | | | | | | | | | | | | | | | |
Total shareholders’ equity | | | 17,969.4 | | | | 17,059.5 | | | | 16,009.8 | | | | 16,189.2 | | | | 13,410.4 | |
| | | | | | | | | | | | | | | | | | | | |
2
| | | | | | | | | | | | | | | | | | | | |
| | | As of and for the fiscal year ended December 31, | |
| | | 2018 | | | 2017 | | | 2016 | | | 2015 | | | 2014 | |
| | | (in millions of reais, except where otherwise indicated) | |
Consolidated Other Financial Data: | | | | | | | | | | | | | | | | | | | | |
Depreciation and amortization | | | 2,061.3 | | | | 1,938.4 | | | | 1,735.3 | | | | 1,178.1 | | | | 678.1 | |
Net debt(1) | | | 13,324.1 | | | | 13,675.9 | | | | 13,861.8 | | | | 15,073.0 | | | | 8,073.3 | |
Working capital(2) | | | 5,718.8 | | | | 4,011.6 | | | | 2,139.9 | | | | (87.4 | ) | | | 594.2 | |
Cash flow provided by (used in): | | | | | | | | | | | | | | | | | | | | |
Operating activities | | | 5,377.9 | | | | 4,088.1 | | | | 3,635.4 | | | | 3,350.6 | | | | 1,117.2 | |
Investing activities | | | (1,498.8 | ) | | | (3,577.4 | ) | | | (727.0 | ) | | | (1,003.1 | ) | | | (308.5 | ) |
Financing activities | | | (5,106.4 | ) | | | (565.7 | ) | | | (1,819.3 | ) | | | (542.6 | ) | | | (658.6 | ) |
Basic earnings per share from continuing operations | | | R$4.00 | | | | R$2.10 | | | | R$1.23 | | | | R$ 1.44 | | | | R$ 0.46 | |
Diluted earnings per share from continuing operations | | | R$3.83 | | | | R$2.05 | | | | R$1.16 | | | | R$ 1.38 | | | | R$ 0.40 | |
Basic earnings/(loss) per share from discontinued operations | | | — | | | | — | | | | (R$0.18 | ) | | | R$ 0.09 | | | | R$ 0.15 | |
Diluted earnings/(loss) per share from discontinued operations | | | — | | | | — | | | | (R$0.18 | ) | | | R$ 0.09 | | | | R$ 0.15 | |
Number of shares outstanding | | | 270,687,385 | | | | 270,687,385 | | | | 270,687,385 | | | | 270,687,385 | | | | 270,687,385 | |
Declared dividends (millions of reais) | | | 425.5 | | | | 792.1 | | | | 975.4 | | | | 531.5 | | | | 445.5 | |
Declared dividends (millions of U.S. dollars) | | | U.S.$ 109.8 | | | | U.S.$ 239.5 | | | | U.S.$ 299.3 | | | | U.S.$ 136.1 | | | | U.S.$ 167.7 | |
Declared dividends per share (reais) | | | R$1.7390 | | | | R$3.2572 | | | | R$3.6851 | | | | R$2.0080 | | | | R$1.6832 | |
Declared dividends per share (U.S. dollars) | | | U.S.$ 0.4488 | | | | U.S.$0.9846 | | | | U.S.$1.1307 | | | | U.S.$ 0.5142 | | | | U.S.$0.6337 | |
Other Operating Data: | | | | | | | | | | | | | | | | | | | | |
Crushed sugarcane (in million tons) | | | 60.1 | | | | 60.7 | | | | 62.2 | | | | 59.9 | | | | 57.1 | |
Sugar production (in million tons) | | | 3.7 | | | | 4.3 | | | | 4.4 | | | | 4.1 | | | | 4.1 | |
Ethanol production (in billion liters) | | | 2.6 | | | | 2.2 | | | | 2.1 | | | | 2.1 | | | | 2.1 | |
Volume of fuel sold (in million liters)(3) | | | 27,521.2 | | | | 25,560.2 | | | | 24,831.5 | | | | 25,076 | | | | 25,027.8 | |
Volume loaded (Cosan Logística)
(in million tons) | | | 10.8 | | | | 13.1 | | | | 13.1 | | | | 11.7 | | | | 11.1 | |
Transported volume (Cosan Logística)
(in million RTK) | | | 56,351.5 | | | | 49,690.5 | | | | 40,270.4 | | | | 44,908.8 | | | | — | |
Natural gas (Comgás) (in million m³) | | | 4,543.3 | | | | 4,292.9 | | | | 4,323.0 | | | | 5,210.9 | | | | 5,458.7 | |
Volume of lubricants and base oil sold
(in million liters) | | | 345.9 | | | | 347.8 | | | | 328.9 | | | | 316.9 | | | | 319.8 | |
| (1) | Net debt consists of current andnon-current debt (including preferred shareholders payable in subsidiaries), net of cash and cash equivalents, marketable securities and derivatives on debt recorded in our consolidated financial statements as othernon-current assets. Net debt is anon-GAAP measure. |
| (2) | Working capital consists of total current assets less total current liabilities. |
| (3) | Starting from 2015 the reported volumes are based on a methodology developed by Sindicom (Sindicato Nacional das Empresas Distribuidoras de Combustíveis e de Lubrificantes), an association of fuel distributors, which excludes volumes sold to other distributors. |
3
The information in the table below presents a reconciliation of Net debt, anon-GAAP financial measure, the most directly comparable IFRS financial measure. Our calculation of these Net debt may differ from the calculation of similarly titled measures used by other companies. Our management believes that disclosure of Net Debt is useful to potential investors as it helps to give them a clearer understanding of our financial liquidity. Net Debt is also used to calculate certain leverage ratios. However, Net Debt is not a measure under IFRS and should not be considered as a substitute for measures of indebtedness determined in accordance with IFRS.
| | | | | | | | | | | | | | | | | | | | |
| | | As of and for the fiscal year ended December 31, | |
| | | 2018 | | | 2017 | | | 2016 | | | 2015 | | | 2014 | |
| | | (in millions ofreais, except where otherwise indicated) | |
Current loans, borrowings and debentures | | | 2,115.3 | | | | 3,903.4 | | | | 2,404.0 | | | | 2,775.5 | | | | 1,056.4 | |
Non-current loans, borrowings and debentures | | | 20,459.0 | | | | 17,785.5 | | | | 15,934.7 | | | | 16,053.7 | | | | 7,446.2 | |
Preferred shareholders payable in subsidiaries | | | 1,097.5 | | | | 1,442.7 | | | | 1,769.6 | | | | 2,042.9 | | | | 1,926.9 | |
Total | | | 23,671.8 | | | | 23,131.6 | | | | 20,108.3 | | | | 20,872.1 | | | | 10,429.5 | |
Cash and cash equivalents | | | (3,621.8 | ) | | | (4,555.2 | ) | | | (4,499.6 | ) | | | (3,505.8 | ) | | | (1,649.3 | ) |
Marketable securities | | | (4,202.8 | ) | | | (3,853.3 | ) | | | (1,291.6 | ) | | | (605.5 | ) | | | (149.7 | ) |
Total | | | (7,824.6 | ) | | | (8,408.5 | ) | | | (5,791.2 | ) | | | (4,111.3 | ) | | | (1,799.0 | ) |
Derivatives on debt | | | (2,523.1 | ) | | | (1,047.2 | ) | | | (455.3 | ) | | | (1,687.8 | ) | | | (557.2 | ) |
| | | | | | | | | | | | | | | | | | | | |
Net debt(1) | | | 13,324.1 | | | | 13,675.9 | | | | 13,861.8 | | | | 15,073.0 | | | | 8,073.3 | |
| | | | | | | | | | | | | | | | | | | | |
| (1) | The Company’s covenants consider preferred shareholders payable in subsidiaries in the calculation of net debt. |
Exchange Rates
The Brazilian foreign exchange system allows the purchase and sale of foreign currency and the international transfer ofreais by any person or legal entity, regardless of the amount, subject to certain regulatory procedures.
Since 1999, the Brazilian Central Bank has allowed thereal/U.S. dollar exchange rate to float freely, which resulted in increasing exchange rate volatility. Until early 2003, thereal declined against the U.S. dollar. Between 2004 and 2008, thereal strengthened against the U.S. dollar, except in the most severe periods of the global economic crisis. Given the recent turmoil in international markets and the current Brazilian macroeconomic outlook, thereal depreciated against the U.S. dollar frommid-2011 to early 2016. Beginning in early 2016 through the end of 2016, thereal appreciated against the U.S. dollar, primarily as a result of Brazil’s changing political conditions. In 2017 and 2018, thereal depreciated 1.5% and 17.1% against the U.S. dollar, respectively. In 2019, to April 26, 2019, thereal depreciated 1.96% against the U.S. dollar. In the past, the Brazilian Central Bank has intervened occasionally to control high volatility in the foreign exchange rates. We cannot predict whether the Brazilian Central Bank or the Brazilian government will continue to permit thereal to float freely or will intervene in the exchange rate market through the return of a currency band system or otherwise. In the future, thereal may fluctuate substantially against the U.S. dollar.
Furthermore, Brazilian law provides that, whenever there is a serious imbalance in Brazil’s balance of payments or there are compelling reasons to foresee a serious imbalance, temporary restrictions may be imposed on remittances of foreign capital abroad. Any such restrictions on remittances of foreign capital abroad may limit our ability to receive dividends from our subsidiaries Cosan S.A. and Cosan Logística S.A. We cannot assure you that such measures will not be taken by the Brazilian government in the future. Exchange rate fluctuation will affect the U.S. dollar value of any distributions we receive from our subsidiaries Cosan S.A. and Cosan Logística S.A., which will be made inreais. See “—D. Risk Factors—Risks Related to Brazil.”
The following tables set forth the selling rate, expressed inreais per U.S. dollar (R$/U.S.$), for the periods indicated:
| | | | | | | | | | | | | | | | |
Year | | Period-end | | | Average(1) | | | Low | | | High | |
2014 | | | 2.656 | | | | 2.354 | | | | 2.197 | | | | 2.740 | |
2015 | | | 3.905 | | | | 3.330 | | | | 2.575 | | | | 4.195 | |
2016 | | | 3.259 | | | | 3.512 | | | | 3.119 | | | | 4.156 | |
2017 | | | 3.308 | | | | 3.193 | | | | 3.051 | | | | 3.381 | |
2018 | | | 3.875 | | | | 3.653 | | | | 3.139 | | | | 4.188 | |
4
| | | | | | | | | | | | | | | | |
Month | | Period-end | | | Average(2) | | | Low | | | High | |
October 2018 | | | 3.718 | | | | 3.756 | | | | 3.637 | | | | 4.027 | |
November 2018 | | | 3.863 | | | | 3.775 | | | | 3.697 | | | | 3.893 | |
December 2018 | | | 3.875 | | | | 3.884 | | | | 3.829 | | | | 3.933 | |
January 2019 | | | 3.652 | | | | 3.747 | | | | 3.652 | | | | 3.860 | |
February 2019 | | | 3.739 | | | | 3.720 | | | | 3.669 | | | | 3.776 | |
March 2019 | | | 3.897 | | | | 3.844 | | | | 3.776 | | | | 3.968 | |
April 2019 (through April 26, 2019) | | | 3.935 | | | | 3.892 | | | | 3.835 | | | | 3.973 | |
Source: Brazilian Central Bank.
| (1) | Represents the average of the exchange rates on the closing of each day during the year. |
| (2) | Represents the average of the exchange rates on the closing of each day during the month. |
| B. | Capitalization and Indebtedness |
Not applicable.
| C. | Reasons for the Offer and Use of Proceeds |
Not applicable.
This section is intended to be a summary of more detailed discussion contained elsewhere in this annual report. Our business, financial condition or results of operations could be materially and adversely affected by any of the risks and uncertainties described below. As a result, the market price of our shares could decline, and you could lose all or part of your investment. Additional risks not presently known to us, or that we currently deem immaterial, may also impair our financial condition and business operations.
Risks Related to Our Businesses, the Operations of Our Joint Venture, and Industries in Which We Operate
We may not be successful in reducing operating costs and increasing operating efficiencies.
As part of our strategy, we continue to seek to reduce operating costs and increase operating efficiencies to improve our future financial performance. We may not be able to achieve the cost savings that we expect to achieve as a result of several factors, including increases in the price of our raw materials and other cost inputs. Given the highly competitive markets in which we operate, with prices often being defined based on global supply and demand, it is highly likely that we will not pass on material cost increases, which would materially and adversely affect our financial performance.
The expansion of our business through acquisitions and strategic alliances creates risks that may reduce the benefits we anticipate from these transactions.
We have grown substantially through acquisitions. We may continue to expand by acquiring or investing, directly or indirectly, from time to time, in businesses considered suitable by our management that are consistent with our values and that are expected to generate positive returns. We may also enter into strategic alliances to increase our competitiveness. However, our management is unable to predict whether or when any prospective acquisitions or strategic alliances will occur, or the likelihood of any particular transaction being completed on favorable terms and conditions. Our ability to continue to expand our business through acquisitions or alliances depends on many factors, including our ability to identify acquisitions or access capital markets on acceptable terms. Even if we are able to identify acquisition targets and obtain the necessary financing to make these acquisitions, we could financially overextend ourselves.
Acquisitions, especially involving sizeable enterprises, may present financial, managerial and operational challenges, including diversion of management attention from existing business and difficulties in integrating operations and personnel. Any failure by us to integrate new businesses or manage any new alliances successfully could adversely affect our business and financial performance. Some of our major competitors may be pursuing growth through acquisitions and alliances, which may reduce the likelihood that we will be successful in completing acquisitions and alliances. In addition, any major acquisition we consider may be subject to antitrust and other regulatory approvals. We may not be successful in obtaining required approvals on a timely basis or at all.
5
Acquisitions also pose the risk that we may be exposed to successor liability relating to prior actions involving an acquired company, or contingent liabilities incurred before the acquisition. Due diligence conducted in connection with an acquisition, and any contractual guarantees or indemnities that we receive from sellers of acquired companies, may not be sufficient to protect us from, or compensate us for, actual liabilities. A material liability associated with an acquisition, such as labor or environmental liability, could adversely affect our reputation and financial performance and reduce the benefits of the acquisition.
We may engage in hedging transactions, which involve risks that can harm our financial performance.
We are exposed to market risks arising from the conduct of our business activities—in particular, market risks arising from changes in commodity prices, exchange rates or interest rates. In an attempt to minimize the effects of the volatility of sugar prices and exchange rates on our cash flows and results of operations, we engage in hedging transactions involving commodities and exchange rate futures, options, forwards and swaps. We also engage in interest rate-related hedging transactions from time to time. Hedging transactions expose us to the risk of financial loss in situations where the counterparty to the hedging contract defaults on its contract or there is a change in the expected differential between the underlying price in the hedging agreement and the actual price of commodities or exchange rate. We may incur significant hedging-related losses in the future. We hedge against market price fluctuations by fixing the prices of our sugar export volumes and exchange rates. Since we record derivatives at fair value, to the extent that the market prices of our products exceed the fixed price under our hedging policy, our results will be lower than they would have been if we had not engaged in such transactions as a result of the relatednon-cash derivative expenses. As a result, our financial performance would be adversely affected during periods in which commodities prices increase. Alternatively, we may choose not to engage in hedging transactions in the future, which could have a material adverse effect on our financial performance during periods in which commodities prices decrease.
The costs of complying with current and future legislation related to environmental protection, health and safety, and the contingencies arising from environmental damage and affected third parties may have a material adverse effect on our business, results of operations as well as on our financial condition.
The judicial and administrative penalties, including criminal sanctions, imposed on those who fail to comply with environmental laws are applied irrespective of whether there exists any obligation on such persons to repair any damage caused to the environment. Furthermore, the obligation to repair environmental damage caused may be imposed upon all parties deemed to be involved in such damage, whether directly or indirectly and regardless of such parties’ actual culpability. As a result, when we hire third parties to perform work for us, such as the disposal of waste or vegetation suppression, we are not exempt from liability for any environmental damage caused by these independent contractors. In addition, we can be held liable for any and all consequences arising from the exposure of people to harmful substances or other environmental damage. The costs of complying with current and future legislation related to environmental protection, health and safety, and the contingencies arising from environmental damage and from the imposition of fines and other penalties by environmental agencies and regulators as well as compensation sought by affected third parties may have a material adverse effect on our business, results of operations as well as on our financial condition.
We may be required to expend significant financial resources in order to remedy or contain environmental damage or failures to comply with certain environmental and social obligations. In addition, any such damage ornon-compliance may result in interruptions to our operations pursuant to orders from governmental authorities or restrictions on obtaining financing from government-owned institutions. Any of these developments could have a significant financial impact on us. In addition, the enactment of new regulations may require us to expend significant resources in order to comply with our environmental obligations.
The extensive environmental regulation to which we are subject may also lead to delays in the implementation of new projects given the considerable administrative procedures, and time, that are required to obtain environmental licenses from governmental bodies.
Technological advances could affect demand for our products or require substantial capital expenditures for us to remain competitive.
The development and implementation of new technologies may result in a significant reduction in the costs of sugar and ethanol production. We cannot predict when new technologies may become available, the rate of acceptance of new technologies by our competitors or the costs associated with such new technologies. Advances in the development of alternatives to sugar and ethanol also could significantly reduce demand or eliminate the need for sugar and ethanol as a fuel oxygenate. Any advances in technology which require significant capital expenditures to remain competitive or which otherwise reduce demand for sugar and ethanol will have a material adverse effect on our business and financial performance.
6
We may be unable to implement our growth strategy successfully.
Our future growth and financial performance will depend, in part, on the successful implementation of our business strategy, including: (1) our ability to attract new clients or increase volume from existing clients in specific markets and locations, (2) our capacity to finance investments (through indebtedness or otherwise), (3) our ability to increase our operational capacity and expand our current capacity to supply to new markets, (4) our ability to maintain and renew our existing concessions, (5) our ability to reduce our operating costs and increase operating efficiency, (6) our ability to lead with regards to new technologies and market demands and (7) our ability to integrate our businesses. We cannot assure you that we will be able to achieve these objectives and/or strategies successfully or at all. Our failure to achieve any of these objectives and/or strategies as a result of competitive difficulties, cost increases or restrictions on our ability to invest, among others, may limit our ability to implement our growth strategy successfully. We may need to incur additional indebtedness in order to finance new investments to implement our growth strategy. Unfavorable economic conditions in Brazil and in the global credit markets, such as high interest rates on new loans, reduced liquidity or reduced interest of financial institutions in granting loans, may limit our access to new credit. Furthermore, failure to achieve our expected growth may have a material adverse effect on our business, financial conditions, results of operations and our ability to repay our debt obligations.
We may face conflicts of interest in transactions with related parties.
We engage in business and financial transactions with our controlling shareholder and other shareholders that may create conflicts of interest between our Company and these shareholders. Commercial and financial transactions between our affiliates and us, even if entered into on anarm’s-length basis, create the potential for, or could result in, conflicts of interests.
Lack of service providers for our expansion projects could adversely affect our business.
We are engaged in a number of expansion projects within our concession area that will require a significant number of service providers, which may not be available. Consequently, if we are unable to contract the necessary services due to service industry shortages or a lack of providers with the technical ability to provide the services we require, this could have an adverse effect on our expansion projects or lead to delays in the execution of our expansion projects as new service providers go through an approval process and develop the technical qualification to commence operations. Any delay or failure to commence or continue our expansion projects within our projected timeframe or budget could have a material adverse effect on our business, financial condition and results of operations.
We depend on our information technology systems, and any failure of these systems could adversely affect our business.
We depend on information technology systems for significant elements of our operations, including the storage of data and retrieval of critical business information. Our information technology systems are vulnerable to damage from a variety of sources, including network failures, malicious human acts, and natural disasters. Moreover, despite network security andback-up measures, some of our servers are potentially vulnerable to physical or electronicbreak-ins, computer viruses, and similar disruptive problems. Failures or significant disruptions to our information technology systems or those used by our third-party service providers could prevent us from conducting our general business operations. Any disruption or loss of information technology systems on which critical aspects of our operations depend could have an adverse effect on our business, results of operations, and financial condition.
Further, we store highly confidential information on our information technology systems, including information related to our products. If our servers or the servers of the third party on which our data is stored are attacked by a physical or electronicbreak-in, computer virus or other malicious human action, our confidential information could be stolen or destroyed. Any security breach involving the misappropriation, loss or other unauthorized disclosure or use of confidential information of our suppliers, customers, or others, whether by us or a third party, could have an adverse impact on our business, financial condition and results of operations.
In addition, the ability of our payment services(e-wallet) subsidiary, Payly Soluções de Pagamentos S.A., or “Payly,” to process online payments and provide high quality customer experience depends on the effective uninterrupted operation of internal and third party information technology systems in an integrated manner. Payly also holds certain highly confidential personal and financial data relating to its customers in its information technology systems. Any failures in the information technology systems on which Payly depends or any breaches resulting in the unauthorized disclosure of the personal or financial data of Payly’s customers may adversely affect Payly’s business, financial condition, results of operation and reputation.
7
We could be the target of attempted cyber threats in the future and they could adversely affect our business.
We may be subject to potential fraud and theft by cyber criminals, who are becoming increasingly sophisticated, seeking to obtain unauthorized access to or exploit weaknesses that may exist in our systems. We continuously monitor and develop our information technology networks and infrastructure. We also conduct yearly tests to prevent, detect, address and mitigate the risk of unauthorized access, misuse, computer viruses and other events that could have a security impact on us. Although these measures are taken to ensure that we are protected, to the extent possible, against cyber risks and security breaches, they may not be effective in protecting us against cyber-attacks and other related breaches of our information technology systems. The techniques used to obtain unauthorized, improper or illegal access to our systems, our data or our customers’ data, to disable or degrade service, or to sabotage systems are constantly evolving, may be difficult to detect quickly, and often are not recognized until used against a target. Unauthorized parties may attempt to gain access to our systems or facilities through various means, including, among others, hacking into our systems or those of our customers, partners or vendors, or attempting to fraudulently induce our employees, customers, partners, vendors or other users of our systems to disclose user names, passwords, financial information or other sensitive information, which may in turn be used to access our information technology systems. Certain third-party efforts to access our information technology systems may be supported by significant financial and technological resources, making them even more sophisticated and difficult to detect. Any disruption or loss of information technology systems, on which critical aspects of our operations depend, could have an adverse effect on our business, results of operations and financial condition.
Further, we store highly confidential information on our information technology systems, including information related to our products and customers’ personal data, including financial information. If our servers or the servers of the third parties on which our data is stored are the subject of a physical or electronicbreak-in, computer virus or other cyber risks, our confidential information could be stolen or destroyed. Any security breach involving the misappropriation, loss or other unauthorized disclosure or use of confidential information of our suppliers, customers, or others, whether by us or a third party, could (1) subject us to civil and criminal penalties, (2) have a negative impact on our reputation or (3) expose us to liability to our suppliers, customers, other third parties or government authorities.
We cannot assure you that our information technology systems will not suffer attacks in the future or that we will be able to safeguard the confidential information which we hold adequately. Any failure by us to adequately protect our information technology systems and the confidential data which we hold could have a material adverse effect on our business, financial condition and results of operations.
We are subject to the application of data protection laws. Compliance with such data protection laws could require changes to certain of our business practices, thereby increasing our costs, and noncompliance with the terms of such laws could adversely affect our business. In addition, we may be subject to penalties if we fail to comply with data protection rules.
We operate in a complex regulatory and legal environment that exposes us to compliance and litigation risks that could materially affect our business, financial condition and results of operations. These laws may change, sometimes significantly, as a result of political, economic or social events.
The European Union has adopted a comprehensive overhaul of its data protection regime from the current national legislative approach to a single European Economic Area Privacy Regulation, the General Data Protection Regulation, or the “GDPR,” which came into effect in 2018, and some aspects of our operations or business are subject to the GDPR’s privacy and personal data protection provisions. The EU data protection regime extends the scope of the EU data protection law to all foreign companies processing data of EU residents and imposes heightened requirements on controllers that engage in activities that are within scope of this regulation. It imposes a strict data protection compliance regime with severe penalties of up to the greater of 4% of worldwide turnover or €20 million and, in the case of a data breach, the organization may be required to notify potentially affected individuals.
In addition, on August 14, 2018, the President of Brazil approved Law No. 13,709/2018, a comprehensive data protection law establishing general principles and obligations that apply across multiple economic sectors and contractual relationships (Lei Geral de Proteção de Dados), or the “LGPD.” The LGPD establishes detailed rules for the collection, use, processing and storage of personal data and will affect all economic sectors, including the relationship between customers and suppliers of goods and services, employees and employers and other relationships in which personal data is collected, whether in a digital or physical environment. The obligations established by LGPD will become effective within 18 months from the date of publication of the LGPD, by which date all legal entities will be required to adapt their data processing activities to these new rules. The data protection regime imposes more stringent data protection standards on Brazilian residents. Any breaches of the LGPD may subject us to penalties of up to R$50 million and a requirement to notify parties whose data has been affected.
8
We are currently evaluating the GDPR, the LGPD, their requirements and their potential effect on our business.Implementation of the GDPR and the LGPD could require changes to certain of our business practices, thereby increasing our costs, and noncompliance with their terms could adversely affect our business. Moreover, additional data protection laws may be enacted in Brazil or in other jurisdictions in which we operate. Any such additional laws may require us to make additional changes to our business practices and may expose us to additional penalties fornon-compliance.
Any of these developments could have a material adverse effect on our business, financial condition and results of operations.
Our performance depends on favorable labor relations with our employees and our compliance with labor laws. Any deterioration of those relations or increase in labor costs could adversely affect our business.
All of our employees are represented by labor unions. Our relationships with these organizations are governed by labor agreements or collective bargaining agreements which we negotiate with labor unions. Upon the expiry of such agreements, we are required to renegotiate new agreements with the applicable labor union. As part of these renegotiations, new terms and conditions may be established. In certain cases, these agreements may not be renewed, which could lead to strikes and/or stoppages in our activities and have an adverse impact on our business, financial condition and results of operations. Furthermore, since the enactment of Law No. 13,467/2017, labor agreements and collective bargaining agreements prevail over certain provisions of labor legislation, as stated in items I to XV, of Article611-A, of the Consolidation of Brazilian Labor Laws (Consolidação das Leis do Trabalho), such as, working time arrangements and the manner in which these are recorded, work breaks, and certain employer-specific internal rules, among others. As a result, employers may expand or reduce certain labor rights, provided this is done pursuant to the terms of labor agreements negotiated with unions and/or individual agreements negotiated with the respective employees.
We operate in industries in which the supply, demand and the market price for our products are cyclical and are affected by general economic conditions in Brazil and globally.
The ethanol and sugar industries, globally and in Brazil, have historically been cyclical and sensitive to domestic and international changes in supply and demand. Our sugar production depends on the volume and sucrose content of the sugarcane that we cultivate or is provided to us by farmers located near our plants. Crop yields and sucrose content of the sugarcane mainly depend on weather conditions, such as rainfall and temperature, which may vary and may be influenced by global climate change.
Weather conditions have caused volatility in the ethanol and sugar sectors and, consequently, in our operational results by causing crop failures or reduced harvests. Floods, droughts and frosts, which can be influenced by global climate change, may affect the supply and prices of the agricultural commodities we sell and use in our business. Future climate conditions may reduce the quantity of sugar and sugarcane that we can obtain in a given crop or the sucrose content of the sugarcane. In addition, our production of sugar and ethanol is contingent on our ability to incur capital expenditures to renew sugarcane crops.
Historically, the international sugar market has experienced periods of limited supply, causing sugar prices and industry profit margins to increase, followed by an expansion in the industry that results in oversupply, causing declines in sugar prices and industry profit margins. In addition, fluctuations in prices for ethanol or sugar may occur, for various other reasons, including factors beyond our control, such as:
| | • | | reduced demand for motor vehicles powered by internal combustion engines; |
| | • | | fluctuations in gasoline prices; |
| | • | | variances in the production capacities of our competitors; and |
| | • | | the availability of substitute goods for the ethanol and sugar products we produce. |
The prices we are able to obtain for sugar depend, in large part, on prevailing market conditions. These market conditions, both in Brazil and internationally, are beyond our control. The wholesale price of sugar has a significant impact on our profits. Like other agricultural commodities, sugar is subject to price fluctuations resulting from weather, natural disasters, harvest levels, agricultural investments, government policies and programs for the agricultural sector, domestic and foreign trade policies, shifts in supply and demand, increasing purchasing power, global production of similar or competing products, and other factors beyond our control. In addition, a significant portion of the total worldwide sugar production is traded on exchanges and thus is subject to speculation, which could affect the price of sugar and our results of operations.
9
The price of sugar, in particular, is also affected by producers’ compliance with sugar export requirements and the resulting effects on domestic supply. As a consequence, sugar prices have been subject to high historical volatility. Competition from alternative sweeteners, including saccharine and high fructose corn syrup, known as “HFCS,” changes in Brazilian or international agricultural or trade policies or developments relating to international trade, including those under the World Trade Organization, are factors that can directly or indirectly result in lower domestic or global sugar prices. Any prolonged or significant decrease in sugar prices could have a material adverse effect on our business and financial performance.
Ethanol is marketed as a fuel additive to reduce vehicle emissions from gasoline, as an enhancer to improve the octane rating of gasoline with which it is blended or as a substitute fuel for gasoline. As a result, ethanol prices are influenced by the supply of and demand for gasoline, and our business and financial performance may be materially adversely affected by fluctuations in the demand for and/or price of gasoline. The increase in the production and sale of flex fuel vehicles (hybrid vehicles, that run with ethanol or gasoline or both combined in any proportion) has resulted, in part, from lower taxation, since 2002, of such vehicles compared to gasoline only cars. This favorable tax treatment may be eliminated and the production of flex fuel vehicles may decrease, which could adversely affect demand for ethanol.
If we are unable to maintain sales at generally prevailing market prices for sugar and ethanol in Brazil and internationally, or if we are unable to export sufficient quantities of ethanol and sugar to assure an appropriate domestic market balance, our ethanol and sugar business as well as our cash flow may be adversely affected.
Ethanol prices are directly influenced by sugar and gasoline prices, so that a decline in those prices will adversely affect both our ethanol and sugar businesses.
The price of ethanol generally is closely associated with the price of sugar and is increasingly becoming correlated to gasoline prices in local market. A vast majority of ethanol in Brazil is produced at sugarcane mills that produce both ethanol and sugar. Because sugarcane millers are able to alter their product mix in response to the relative prices of ethanol and sugar, this results in the prices of both products being directly correlated, and the correlation between them may increase over time. In addition, sugar prices in Brazil are determined by prices in the world market, so that there is a correlation between Brazilian ethanol prices and world sugar prices.
Because flex fuel vehicles allow consumers to choose between gasoline and ethanol at the pump rather than at the showroom, ethanol prices are now becoming increasingly correlated to gasoline prices and, consequently, oil prices. We believe that the correlation among the three products will increase over time. Accordingly, a decline in sugar prices will have an adverse effect on the financial performance of our ethanol and sugar businesses, and a decline in oil prices may have an adverse effect on that of our ethanol business, including on its cash flows.
We may not successfully implement our plans to sell energy from our cogeneration projects, and the Brazilian government’s regulation of the energy sector may adversely affect our business and financial performance.
Our current total installed energy cogeneration capacity is used to generate energy for our own industrial operations and to sell surplus energy to the Brazilian energy grid. The Brazilian government regulates the energy sector extensively. We may not be able to satisfy all the requirements necessary to enter into new contracts or to otherwise comply with Brazilian energy regulation. Changes to the current energy regulation or federal authorization programs, and the creation for more stringent criteria for qualification in future public energy auctions, in addition to lower prices, may adversely affect our results of operations from our cogeneration business.
Any failure in the implementation of these plans may have a material adverse effect on our business, financial condition and results of operations.
10
A reduction in market demand for ethanol or a change in governmental policies requiring ethanol be added to gasoline may have a material adverse effect on our business.
We produce and sell three different types of ethanol: hydrous ethanol, anhydrous ethanol for fuel and industrial ethanol. The primary type of ethanol consumed in Brazil is hydrous ethanol, which is used as an alternative to gasoline for flex fuel vehicles (as opposed to anhydrous ethanol which is used as an additive to gasoline).
Governmental authorities of several countries, including Brazil and the United States, currently require the use of anhydrous ethanol as an additive to gasoline. Since 1997, the Brazilian Sugar and Alcohol Inter-ministerial Council (Conselho Interministerial do Açúcar e Álcool), or “CIMA,” has set the percentage of anhydrous ethanol that must be used as an additive to gasoline. According to CIMA Resolution No. 1 dated March 4, 2015, the current anhydrous ethanol percentage for regular gasoline is 27% and for additive/premium gasoline is 25%. Approximatelyone-half of all fuel ethanol in Brazil is used to fuel automobiles that run on a blend of anhydrous ethanol and gasoline; the remainder is used in either flex fuel vehicles or vehicles powered by hydrous ethanol alone. Other countries have similar governmental policies requiring various blends of anhydrous ethanol and gasoline. In addition, flex fuel vehicles in Brazil are currently taxed at lower levels than gasoline-only vehicles, which has contributed to the increase in the production and sale of flex fuel vehicles. Any reduction in the percentage of ethanol required to be added to gasoline or increase in the levels at which flex fuel vehicles are taxed in Brazil, as well as growth in the demand for natural gas and other fuels as an alternative to ethanol, lower gasoline prices or an increase in gasoline consumption (versus ethanol), may cause demand for ethanol to decline and affect our business. In addition, ethanol prices are influenced by the supply and demand for gasoline; therefore, a reduction in oil prices resulting in a decrease in gasoline prices and an increase in gasoline consumption (versus ethanol), may have a material adverse effect on our business, results of operations and financial condition.
Government policies and regulations could have a material adverse effect on our operations and profitability.
Government policies in Brazil and elsewhere, in each case whether at the federal, state or local level, may adversely affect the supply, and demand for, and prices of, our products or restrict our ability to do business in our existing and target markets, which could adversely affect our financial performance.
Agricultural production and trade flows are significantly affected by Brazilian federal, state and municipal, as well as foreign, government policies and regulations. Governmental policies affecting the agricultural industry, such as taxes, tariffs, duties, subsidies and import and export restrictions on agricultural commodities and commodity products, may influence industry profitability, the planting of certain crops versus others, the uses of agricultural resources, the location and size of crop production, the trading levels for unprocessed versus processed commodities, and the volume and types of imports and exports.
Our gas distribution operations are currently concentrated in the state of São Paulo. Any changes affecting governmental policies and regulations regarding natural gas in the state of São Paulo (at the federal, state or municipal level) may have a material adverse effect on our business and financial performance.
In addition, petroleum and petroleum products have historically been subject to price controls in Brazil. Currently there is no legislation or regulation in force giving the Brazilian government the power to set prices for petroleum, petroleum products, ethanol or vehicular natural gas. However, given that Petrobras, the only supplier ofoil-based fuels in Brazil, is a government-controlled company, prices of petroleum and petroleum products are subject to government influence, resulting in potential inconsistencies between international prices and internal oil derivative prices that affect our business and our financial results.
As a payment institution (instituição de pagamento) and payment scheme settlor (instituidor de arranjo de pagamento) in Brazil, Payly is subject to Brazilian laws and regulations relating to electronic payments in Brazil, comprised of Brazilian Federal Law No. 12,865/13 and related rules and regulations. Any failure by Payly to comply with such legislation could result in disciplinary or punitive action by the relevant regulators. Furthermore, we cannot assure you that Payly will be able to obtain and maintain all required operating licenses. Any of these developments could have a material adverse effect on Payly’s business, financial condition and results of operations.
11
Raízen Energia, Raízen Combustíveis and Moove are subject to the application of regulatory penalties in the event ofnon-compliance with the terms and conditions of their respective authorizations, including the possible revocation of such authorizations.
Raízen Energia performs generation activities in accordance with the regulation applicable to the energy sector and with the terms and conditions of authorizations granted by the Brazilian government through ANEEL. The duration of such authorizations varies from 20 to 35 years.
ANEEL may apply regulatory penalties to Raízen Energia in the event ofnon-compliance with the authorizations or with the regulations applicable to the energy sector. Such penalties may include, depending on the seriousness of the infraction, warnings, fines (in some cases up to 2% of our revenues for the last 12 months), restrictions on Raízen Energia’s operations, temporary suspension from participating in public bidding procedures to obtain new permissions, authorizations and concessions, prohibition from contracting with ANEEL, and revocation of its authorizations.
In addition, Raízen Combustíveis conducts its fuel distribution activities and Moove manufactures and distributes lubricants and base oil in accordance with the rules and regulations applicable to the oil and gas sector in Brazil as well as with the terms of the licenses and permits granted to them by the Brazilian government acting through the ANP. Failure to comply with the applicable rules and regulations or with the terms of the relevant licenses and permits may result in fines and other penalties (including confiscation or destruction of products, cancellation of product registrations, bans on certain facilities, and revocation of existing licenses and permits, among others). The applicable fines vary between R$5 thousand and R$5 million, depending on the gravity of the infraction.
Furthermore, the electricity trading operations of WX Energy Comercializadora de Energia Ltda., or “WX Energy,” which Bioenergia Barra Ltda., a wholly-owned subsidiary of Raízen Energia, acquired on July 5, 2018, are highly regulated and supervised by the Brazilian government, including through ANEEL as well as other regulatory authorities. Such regulatory authorities have discretionary authority to implement and change policies, interpretation and rules applicable to different aspects of WX Energy’s business, especially its operations, maintenance, safety, compensation and inspection. Any significant regulatory measure implemented by the competent authorities may impose a significant burden on WX Energy’s activities.
Raízen Energia, Raízen Combustíveis, Moove and WX Energy cannot assure that they will not be penalized by ANEEL, ANP or other regulatory authorities, as applicable, nor can they assure you that they will comply with all terms and conditions of their authorizations and with the regulation applicable to their respective businesses, which may have a material adverse effect on our business, results of operations and financial condition.
We face significant competition, which may have a material adverse effect on our market share and profitability.
The ethanol and sugar industries are highly competitive. Internationally, we compete with global ethanol and sugar producers in the United States, India, Thailand, Australia, among other countries and producers such as Poet, Inc., Archer-Daniels-Midland Company, Cargill, Inc. and A.E. Staley Manufacturing Company (a subsidiary of Tate & Lyle, PLC). Some of our competitors are divisions of larger enterprises and have greater financial resources than us. In Brazil, we compete with numerous small tomedium-size producers. Despite increased consolidation, the Brazilian ethanol and sugar industries remain highly fragmented. Our major competitors in Brazil are Biosev (the second largest ethanol and sugar producer in Brazil), Tereos—Guarani (the third-largest ethanol and sugar producer in Brazil), Bunge, Santa Terezinha, São Martinho, Carlos Lyra, Tercio Wanderley, Zilor, Oscar Figueiredo, Da Pedra, and Irmãos Biagi and other ethanol and sugar producers in Brazil that market their ethanol and sugar products through the Cooperative of Sugarcane, Sugar and Ethanol Producers of the state of São Paulo (Cooperativa de Produtores deCana-de-açúcar, Açúcar e Álcool do Estado de São Paulo), or “Copersucar.” Copersucar consists of producers in the states of São Paulo, Minas Gerais and Paraná. We are not a member of Copersucar.
12
We also face strong competition from international producers, particularly in highly regulated and protected markets, such as the United States and the European Union. With regards to sugar exports, we face intense competition from producers all around the world, including India, Thailand, and the European Union, among others. There are global producers of sugar whose costs are lower than those of Brazilian producers, including us, and whose production capacity and prices could lead to a decrease in prices on the global sugar market. Furthermore, we face very strong competition internationally with regards to ethanol, especially from the United States. Ethanol production in the United States is based on corn-derived ethanol and is undertaken on a greater scale than Brazilian ethanol production. Accordingly, a reduction in corn prices may lead to material reductions in the price of ethanol produced in the United States and result in increased competition in the Brazilian market.
Historically, imports of sugar have not provided substantial competition for us in Brazil due to, among other factors, the production and logistical cost-competitiveness of sugar produced in Brazil. If the Brazilian government were to create incentives for sugar imports, we could face increased competition in the Brazilian market by foreign producers. Many factors influence our competitive position, including the availability, quality and cost of fertilizer, energy, water, chemical products and labor. Some of our international competitors might have greater financial and marketing resources, larger customer bases and broader product ranges than we do. If we are unable to remain competitive with these producers in the future, our market share may be adversely affected.
The fuel distribution and lubricant market in Brazil is highly competitive. For example, we compete with domestic fuel distributors who purchase substantially all of their fuel from Petrobras and from suppliers based outside of Brazil. There are very few domestic competitors, such as us, who import lubricants into Brazil. In addition, we compete with producers and marketers in other industries that supply alternative forms of energy and fuel to satisfy the requirements of our industrial, commercial and retail consumers. Certain of our competitors, such as Petrobras, have larger fuel distribution networks and vertically integrated oil refineries, and may be able to realize lowerper-barrel costs or higher margins per barrel of throughput. Our principal competitors in the fuel distribution and the lubricant market are larger and have substantially greater resources than we do. Because of their integrated operations and larger capitalization, these companies may be more flexible in responding to volatile industry or market conditions, such as shortages of crude oil and other feedstock or intense price fluctuations. The actions of our competitors could lead to lower prices or reduced margins for the products we sell, which could have a material and adverse effect on our business, results of operations and our financial performance.
Certain measures currently being taken by participants in the fuel distribution market, including the expansion of their distribution networks, as well as the arrival of new participants, may result in an increase in fuel supply and a consequent decrease in fuel prices, which may have an adverse effect on our business, financial condition and results of operations.
In addition, the market for payment processing services, in which Payly operates, is highly competitive. Other providers of payment processing services in the acquirer market have also established a sizable market share in the small andmid-sized merchant processing and servicing sector.
The intense competition in the Brazilian market and the actions of our competitors could lead to lower prices or reduced margins for the products we sell, as well as reductions in our sales volumes, which could have a material and adverse effect on our business, results of operations and our financial performance.
Government laws and regulations governing the burning of sugarcane, including requirements in respect of the Legal Reserve, could have a material adverse impact on our business or financial performance.
The state of São Paulo and some local governments have established laws and regulations that limit our ability to burn sugarcane or that reduce and/or entirely prohibit the burning of sugarcane. The costs to comply with existing or new laws or regulations are likely to increase the cost of production, and, as a result, our ability to operate our own mills and harvest our sugarcane crops may be materially adversely affected.
In addition to restrictions that limit sugarcane burning and other environmental restrictions, we are required to preserve a percentage of our rural properties (sugarcane fields and other facilities), in order to contribute to a biodiversity preservation and ecologic rehabilitation fund known as the “Legal Reserve.” For rural areas located in the state of São Paulo, 20% of the property must be preserved to comply with the Brazilian Forest Code obligations.
13
Any failure to comply with these laws and regulations may subject us to legal and administrative actions. These actions can result in administrative or criminal penalties, including, but not limited to, suspension, shutdowns, a requirement to pay fines, which may range from R$50 to R$50 million and can be doubled or tripled in case of recidivism, an obligation to make capital and other expenditures or an obligation to materially change or cease some operations. In addition, we may be subject to civil liabilities, which include the obligation to redress any damages caused to the environment and/or public health. The demonstration of the cause-effect relationship between the damage caused and action or omission is sufficient to trigger the obligation to redress environmental damage.
Adverse weather conditions may reduce the volume and sucrose content of sugarcane that we can cultivate and purchase in a given harvest as well as demands for natural gas.
Our sugar production depends on the volume and sucrose content of the sugarcane that we cultivate or that is supplied to us by growers located in the vicinity of our mills. Crop yields and sucrose content depend primarily on weather conditions such as rainfall and temperature, which vary and may be influenced by global climate change. Weather conditions have historically caused volatility in the ethanol and sugar industries and, consequently, in our results of operations, by causing crop failures or reduced harvests. Flood, drought or frost, which may be influenced by global climate change, may have a material adverse effect on the supply and pricing of the agricultural commodities that we sell and use in our business. Future weather patterns may reduce the amount of sugar or sugarcane that we can recover in a given harvest or its sucrose content.
During the third and fourth quarter of 2014, a severe drought affected southeast Brazil, Comgás’ concession area, during which time residents were encouraged to save water. As a relevant portion of Comgás’ revenues is derived from the residential segment, and a significant portion of natural gas used by residential consumers is used for heating water, Comgás experienced a decrease in its net revenues derived from the residential segment. Therefore, our and Comgás’ business may be materially affected by unusual climate patterns.
Our business is subject to seasonal trends.
Raízen Energia’s business is subject to seasonality according to the sugarcane growth cycle in the Central-South region of Brazil. The annual sugarcane harvesting period in the Central-South region of Brazil begins in April or May and ends in November or December. This creates fluctuations in Raízen Energia’s inventory and in its ability to generate energy, both of which usually peak in December, to cover sales between crop harvests (primarily from January to March), and a degree of seasonality in our gross profit, with ethanol and sugar sales significantly lower in the quarter ended on December 31. Rural producers of sugar and ethanol with whom Raízen Energia maintains a commercial relationship may experience a similar degree of seasonality, which may impact the supply of ethanol and/or other products necessary for Raízen Energia’s activities. Seasonality and any reduction in the volumes of sugar recovered could have a material adverse effect our business, results of operations and financial condition.
Raízen Energia and WX Energy are also subject to seasonality with respect to demand for the energy which they generate and sell, respectively. Specifically, demand for energy is subject to various factors which vary from season to season according to the type of customer, geographical location, consumption type (e.g., residential, commercial or industrial), among other factors, and demand for energy and trading activities may be affected by variations in such factors.
Furthermore, Rumo is subject to the seasonality that influences the sugarcane and grain harvest. During the peak months of the harvests, there is higher demand for transport and logistics operations. Rumo is also subject to the risk that sugarcane mills may change their production mix in favor of ethanol if the relative prices of the two products swing that way. This could reduce the demand for sugar logistics and transport.
Seasonality could have a material adverse effect on our business, results of operations and financial condition.
14
We may be adversely affected by a shortage of sugarcane or by high sugarcane costs.
Sugarcane is the principal raw material used by Raízen Energia (a company which we jointly control with Shell) for the production of ethanol and sugar. As of December 31, 2018, sugarcane purchased from suppliers accounted for 52% of our total crushed sugarcane. Historically, approximately 91% of the sugarcane purchased by us has been under medium- and long-term contracts with sugarcane growers, 5% on a spot basis and the remaining 4% from sugarcane growers with whom we have long-term relationships but no contractual arrangements. We generally enter into medium- and long-term supply contracts for periods varying from three andone-half to seven years. As of December 31, 2018, we also leased approximately 611,000 hectares to produce our own sugarcane in contracts with an average term of 11 years.
Our supply of sugarcane in Brazil may be significantly reduced as a result of the termination of supply contracts or lease agreements, which may result in a shortage of sugarcane supply and an increase in the price of sugarcane. If there is a shortage of sugarcane or any supply contracts or lease agreements are terminated, Raízen Energia may experience a material reduction in the sugarcane available for processing or an increase in sugarcane prices, which may have a material adverse effect on our business, results of operation and financial condition.
In Brazil, the price of sugarcane may increase as a result of changes in the criteria established by Association of Producers of Sugarcane, Sugar and Ethanol of the State of São Paulo (Conselho dos Produtores deCana-de-açúcar, Açúcar e Álcool do Estado de São Paulo), or “Consecana,” which is composed of sugarcane producers and sugar mill operators. The price of sugarcane is set in supply agreements, lease agreements and partnership agreements and is partially fixed and partially variable, as provided for in the criteria set forth by Consecana. As a result, any changes to the criteria established by Consecana may lead to an increase in the cost of sugarcane, which may have a material adverse effect on our business, financial condition and results of operations.
In addition, in certain cases, as a result of the price-setting formulas in the contracts which we have entered into with our customers, we may not be able to pass on the full amount of these cost increases to our customers. This may have a material adverse effect on our business, financial condition and results of operations.
We are subject to developments affecting the Brazilian agribusiness sector as a whole.
We cannot assure you that in the future, the Brazilian agribusiness sector (i) will maintain the rate of growth and development which it has experienced in recent years and (ii) will not suffer losses due to unfavorable climatic conditions, reduction of the prices of the agricultural commodities in the national and international markets, changes in credit policies for domestic producers, both by government agencies and private entities, that may affect our income, as well as other economic and political crises that may affect the agricultural industry in general. Any deterioration in the overall condition of the Brazilian agribusiness sector may have a material adverse effect on us.
Raízen may be subject to expropriation of real estate intended for rural production.
The real estate used by Raízen, or by third parties with whom Raízen maintains a partnership or lease relationship, for the cultivation of sugarcane may be unilaterally expropriated by the Brazilian government for purposes of public and social interest, and we cannot assure you that the payment of the indemnification that they may have to pay to Raízen will be fair. Pursuant to Brazilian law, the Brazilian government may expropriate the real estate of rural producers where the sugarcane is planted by necessity or public utility or social interest, partially or totally. In the event of expropriation, we cannot assure you that the price paid by the Brazilian government will be fair, equivalent to the market value, or that it will effectively and adequately compensate Raízen for the amounts invested. Accordingly, the eventual expropriation of any real estate used by Raízen, or by third parties with whom Raízen maintains partnership or lease relationships, may adversely and significantly affect Raízen’s financial situation and results, and may also impact Raízen’s activities.
Social movements may affect the use of Raízen’s agricultural properties or cause damage to them.
Social movements are active in Brazil and advocate land reform and property redistribution by the Brazilian government. Invasion and occupation of agricultural land by large numbers of people is a common practice among the members of such movements, and in certain regions, including those in which Raízen owns or leases property, remedies such as police protection or eviction procedures might be inadequate ornon-existent. As a result, we cannot assure you that our agricultural properties will not be subject to invasion or occupation by any of such social movements. Any invasion or occupation may materially impair the use of our lands and have a material adverse effect on Raízen’s business, financial condition, and results of operations.
15
The use of alternatives to sugar and ethanol and technological advances may reduce demand for our sugar products in Brazil and other countries or require us to make substantial investments in order to remain competitive.
The development of alternative products to sugarcane and ethanol may reduce the demand for our products or materially reduce the demand for ethanol to be used as fuel. The use of alternative sweeteners has adversely affected the overall demand for sugar in Brazil and abroad. A substantial reduction in the demand for sugar and ethanol or increased consumption of alternative sweeteners may reduce the demand for sugar and ethanol we produce in Brazil and could have a material adverse effect on our business, results of operations and financial condition.
Any other alternative products or technological advances which reduce demand for our products may have a material adverse effect on our results of operations and financial condition.
Raízen Energia’s sugar and ethanol products are sold to a small number of customers who may be able to exercise significant bargaining power concerning pricing and other sale terms.
A substantial portion of Raízen Energia’s sugar and ethanol is sold to a small number of customers that acquire large portions of our production and thus may be able to exercise significant bargaining power concerning pricing and other sale terms. In addition, intense competition in the ethanol and sugar industries further increases the bargaining power of customers, which may have a material adverse effect on Raízen Energia’s sales volumes.
Raízen Energia’s export sales are subject to a broad range of risks associated with international operations.
In the fiscal year ended December 31, 2018, Raízen Energia’s net sales from exports represented 25% of Raízen Energia’s total net sales, while in the year ended December 31, 2017, the net sales from exports represented 47% of Raízen Energia’s total net sales. Furthermore, in the fiscal year ended December 31, 2018, Raízen Energia’s net sales from sugar exports were R$2,452 million, representing 12% of its total net sales for the period. In the year ended December 31, 2017, Raízen Energia’s net sales from sugar exports were R$4,082 million, representing 31% of Raízen Energia’s total net sales for the period. Further, in the fiscal year ended December 31, 2018, Raízen Energia’s net sales from exports of ethanol were R$2,315 million, representing 12% of Raízen Energia’s total net sales for that period and in the year ended December 31, 2017, Raízen Energia’s net sales from ethanol exports were R$2,076 million, representing 16% of Raízen Energia’s total net sales for that period.
Our exports of ethanol are subject to factors beyond our control which may affect the competitiveness of Brazilian ethanol in other markets, such as import regulations, tax legislation, incentives for local production and the establishment of distribution systems for hydrous ethanol in countries outside of Brazil. Our future financial performance will depend, to a significant extent, on economic, political and social conditions in our main export markets.
Most ethanol and/or sugar producing countries, including the United States and member countries of the European Union, protect local producers from foreign competition by establishing government policies and regulations that affect ethanol and sugar production, including quotas, import and export restrictions, subsidies, tariffs and duties. As a result of these policies, domestic ethanol and sugar prices vary greatly in individual countries. We have limited or no access to these large markets as a result of trade barriers. If these protectionist policies continue, we may not be able to expand our export activities at the rate we currently expect, or at all, which could have a material adverse effect on our business, results of operations and financial condition. Also, if new trade barriers are established in our key export markets, we may face difficulties in reallocating our products to other markets on favorable terms, and our business and financial performance may be adversely affected.
Failure to comply with, obtain or renew the licenses and permits required for our business may have a material adverse effect on us.
We are required to obtain specific licenses with respect to our terminals from the applicable environmental authorities, which are applied in particular to the emission, ejection and emanation of products andby-products resulting from distribution activities. We are also required to obtain specific licenses and permits from governmental authorities for rural producers in order to carry out certain of our operations. The laws and regulations which govern these licenses may occasionally require us to purchase and install costly pollution-control equipment or to make operational changes to limit our impact on the environment and/or the health of our employees. Any failure to comply with the terms of such laws, regulations and licenses and permits may result in significant financial penalties, criminal sanctions, revocation of operating licenses and permits and/or the prohibition of certain of our activities.
In addition, we are currently in the process of obtaining or renewing, as the case may be, certain licenses and permits (including real estate and environmental permits) required for the continuity of our activities. Our business, financial condition and results of operations may be materially and adversely affected if we are unable to obtain or renew all licenses and permits required for our business and operations.
16
Raízen Energia may be adversely affected if the outsourcing the mechanized sugarcane cutting becomes prohibited.
Raízen Energia is a defendant in a public civil action in which the Labor Public Prosecutor’s Office (Ministério Público de Trabalho) is seeking the prohibition of the outsourcing of planting, loading and transportation of sugarcane. Raízen Energia has appealed to the Superior Labor Court (Tribunal Superior do Trabalho) in order to overturn an unfavorable first instance decision. This appeal is currently awaiting judgment. If the Superior Labor Court rejects the appeal, Raízen Energia may be required to undertake these activities itself on a permanent basis (including hiring employees and acquiring appropriate machinery), which may have a material adverse effect on Raízen Energia.
The Brazilian Supreme Court has recently ruled that outsourcing is generally permitted. While we expect this ruling to have a positive effect on Raízen Energia’s ongoing proceedings, we cannot guarantee that Raízen Energia will be successful.
Any mismatches between the cash outflows for the payment of litigation costs of Raízen and the time of receipt of the related reimbursement by the Joint Venture’s shareholders may lead to pressures on Raízen Energia and Raízen Combustíveis’ cash flows.
Pursuant to the framework agreement which was entered into during the formation of the Joint Venture, Raízen Energia has agreed that it will reimburse Cosan S.A. and Shell or will be reimbursed by them, as applicable, for any amounts received or paid in connection with legal proceedings, provided that the triggering events for such payments or receipts occurred before the formation of the Joint Venture on June 1, 2011 and provided that any such sums have actually been paid or received.
The framework agreement also provides that Cosan S.A. is required to indemnify Raízen for any expense related to litigation (tax, labor, civil and other) that has been caused by events prior to the formation of the Joint Venture.
Any mismatches between the cash outflows from Raízen for the payment of litigation costs and the time of receipt of the related reimbursement by Cosan S.A. or Shell, as applicable, or any failure by Cosan S.A. or Shell to reimburse Raízen, may lead to pressures on Raízen’s cash flows.
Brazilian courts, in some circumstances, have understood that a controlling shareholder, a successor entity of another corporation, an assignee company of another company’s assets and other companies subject to common control to the assignor or predecessor company shall all be liable, jointly and severally, for, among other obligations, labor, social security, civil, tax or environmental obligations of the assignor, assignee or predecessor. Therefore, we may be liable for obligations of their controlling shareholders for which we have not constituted and do not intend to constitute any provisions, which may adversely affect our business, results of operations and financial condition.
Raízen is subject to risks arising from legal proceedings based on claims related to alleged breaches of the intellectual property rights of third parties.
Raízen is subject to risks arising from legal proceedings based on claims related to alleged breaches of the intellectual property rights of third parties. Raízen may alter the way in which it produces, in whole or in part, products which third parties allege infringe their intellectual property rights and/or pay significant indemnification amounts, royalties or licensing fees in connection with the use of third parties’ patents or copyrighted materials. The filing of a lawsuit or the review of a product that is in violation of third parties’ intellectual property rights may adversely affect Raízen’s reputation and the demand for our products. In addition, new lawsuits require the attention of Raízen’s management, as well as additional costs for our defense and, in certain cases, the establishment of provisions that could affect our results.
Contamination of our products and other related risks could adversely affect our reputation, leading to judicial and administrative proceedings and/or resulting in the closure of our production facilities.
Certain of our products may have adverse effects on our consumers (including certain components, raw materials and supplies used to produce our products), including as a result of product contamination or following errors in the production or distribution chain.
Contamination of any of our products may result in a need for recalls or the beginning of legal and administrative proceedings against us, which may adversely affect our reputation, our business, the operation of our production facilities, our financial condition and our operating results. Any damage to our reputation could have a material adverse effect on us.
17
The modification, suspension, cancellation ornon-renewal of certain tax benefits which we have been granted could have a material adverse effect on us.
We benefit from certain tax incentives, benefit programs and special regimes, such as:
| | • | | State of Goiás: (a) Tax benefit “Protege” that accrues at the tax rate of 2% levied on transactions with gas. This benefit permits an increase in the income of the Social Fund of the state of Goiás. The taxpayer is able to credit the respective amount through its accounting to permit the offset with further debts of ICMS (Imposto sobre Operações relativas à Circulação de Mercadorias e Prestação de Serviços de Transporte Interestadual e Intermunicipal e de Comunicação, a tax on sales and services which applies to goods, and transportation and communication) considering the rate as a reduction in the taxable basis of the gas acquired in the state of Goiás; (b) tax benefit “Protege II,” which permits a reduction in the taxable basis of 5% on all the basic transactions linked to ICMS in the state of Goiás (unlike the 2% reduction which is only applied to gas, the 5% rate applies to all other supplies) and (c) tax incentive “Produzir” that grants a reduction of ICMS payable of 63%. |
| | • | | State of Mato Grosso do Sul: (a) ICMS – Presumed Tax Credit: The state of Mato Grosso do Sul implemented a reduction of 15.93% of the taxable basis of ICMS on ethanol transactions within the state; (b) Tax incentive that grants 67% of the outstanding balance of ICMS on sugar transactions to be deducted from the outstanding balance of the tax; and (c) other ICMS presumed tax credits granted on sugar and ethanol transactions. |
| | • | | The states of Maranhão and Minas Gerais granted a reduction of calculation basis of ICMS on sales. |
| | • | | State of São Paulo: (a) Suspension of ICMS levied on the importation of fixed assets and deferral on the acquisition of fixed assets; and (b) suspension of ICMS on gas transport. |
| | • | | Federal tax incentive: Suspension of PIS and COFINS (respectively, the profit participation contribution and the social security financing contribution, both of which are social contributions due on certain revenues net of some expenses) levied on the importation of goods and of IPI on the sales and importation of inputs and raw materials. |
We cannot assure you that these tax benefits will be maintained or renewed or that we will be able to obtain new tax benefits. If we lose our existing tax benefits due to our noncompliance with future requirements or if the current tax programs and agreements from which we benefit are modified, suspended, cancelled or not renewed, we could be materially and adversely affected. Moreover, the state tax benefits relating to ICMS from which we benefit may be declared unconstitutional by the Brazilian Supreme Court if they have been granted without the approval of all the States and the Federal District through the Brazilian National Council of Fiscal Policy (Conselho Nacional de Política Fazendária — CONFAZ). The Brazilian Supreme Court may grant retroactive or prospective effect to the declaration of unconstitutionality. The foregoing could result in a material adverse effect on us.
The shareholders’ and certain other definitive agreements with respect to the Joint Venture and certain other of our subsidiaries are subject to various put and call options and termination provisions.
Shell and Cosan S.A. have entered into certain definitive agreements with respect to the Joint Venture. Specifically, these agreements set forth the rights and obligations of each shareholder in respect of Cosan S.A.’s and Shell’s interest in the Joint Venture and establish certain options whereby Cosan S.A. or Shell may acquire the other shareholder’s interest in the Joint Venture, certainlock-up provisions, rules governing the intra-group transfers regarding to the economic group of Cosan S.A. and Shell, and remedies for fundamental breaches of the documentation governing the incorporation and operation of the Joint Venture. If triggered, these provisions may cause the Joint Venture, or our participation in it, to terminate prior to the scheduled expiration date of the agreements in June 2031.
In November 2016, Cosan S.A. and Shell executed amendments to certain agreements between them to remove the fixed-date call options over Raízen Energia and Raízen Combustíveis shares exercisable in 2021 and 2026 and replace them with certain call and put options exercisable by Shell or Cosan S.A. in certain circumstances, including, among others: (i) fundamental breaches of the obligations provided for in the agreements governing the Joint Venture; (ii) breach of anticorruption laws, (iii) insolvency or bankruptcy of a party, (iv) change of control, and (v) in the event of the death or disability of Cosan S.A.’s current Chairman, Mr. Rubens Ometto Silveira Mello. Moreover, Shell and Cosan S.A. agreed to renew the existinglock-up period for five years from the date of the execution of the amendment, following which the parties may sell their shares in each of Raízen Energia and Raízen Combustíveis subject to compliance with certain preemption rights in each other’s favor.
18
On February 23, 2017, TPG VI Fundo de Investimento em Participações, or “TPG VI,” a shareholder of Rumo exercised its right to exchange 11,479,987 shares issued by Rumo for shares issued by Cosan S.A. pursuant to the shareholders’ agreement entered into in 2010 between Cosan Logística, TPG VI, GIF, Cosan S.A. and the Company. Cosan S.A. and GIF agreed to settle financially the stock replacement obligation through of payment of R$275.8 million and the shares received were valued at fair value in the amount of R$97.9 million and recorded as capital reserve.
Cosan S.A. and Shell were parties to a Comgás shareholders’ agreement dated December 19, 2012. The shareholders agreement established the terms and conditions that regulated the relationship between the parties as shareholders of Comgás. On December 12, 2017, Shell exercised a put option with us relating to shares in Comgás and, as a result, we bought a total of 21,805,645 shares in Comgás, which represents 16.77% of Comgás’s share capital, for R$1,042 million. As a result, Shell ceased to be a shareholder of Comgás and the Comgás shareholders’ agreement was terminated.
If any of these or other similar provisions are triggered under the shareholders’ agreements or any of the other related agreements, our partnerships, or certain rights we hold in connection therewith, could terminate prior to the scheduled expiration, which could adversely affect our results of operations.
Raw material and supply service costs are subject to wide fluctuations that could have a material adverse effect on our results of operations.
Raw materials used in our business and the cost of services we contract for the distribution of natural gas are subject to wide fluctuations depending on market conditions. These prices are influenced by several factors over which we have little or no control, including, but not limited to international and national economic conditions, regulations, government policies, tariff adjustments and global effects of supply and demand. We cannot ensure that our tariff adjustment will be conducted in a timely manner or be sufficient to reflect and/or offset increases in inflation, operation costs and expenses, amortization of investments and taxes. As a result, we might not be able to pass on the increase in our cost structure to our customers, which could decrease our profit margin and result in a material adverse effect on our business, financial condition and results of operations.
We may not successfully acquire or develop additional production capacity through greenfield projects or expansion of existing facilities.
We may explore growth opportunities in the future through the acquisition or development of greenfield projects or through the expansion of our existing facilities. We may be unable to complete these projects on a timely basis or at all, and may not realize the related benefits we anticipate. The factors which may prevent us from doing so include, among other things: (1) our failure to obtain environmental and other licenses; (2) our inability to obtain supplies of appropriate equipment or raw materials; (3) increases in costs and/or decreases in revenue; (4) lack of qualified workforce; (5) lack of service providers; and (6) our inability to obtain any required financing on satisfactory terms, or at all.
Our greenfield projects and/or expansion of existing facilities require a significant number of service providers. Any inability on our part to enter into contracts with duly qualified service providers who are able to provide the technical services that we require may prevent us from completing our greenfield projects and/or expansions of existing facilities on a timely basis or at all. In addition, the integration of greenfield projects or expansion of our existing facilities may result in unforeseen operating difficulties and may require significant financial and managerial resources that would otherwise be used for our current operations. Planned or future greenfield projects or expansions of existing facilities may not enhance our financial performance. Any failure in the implementation of growth projects and/or expansion of existing facilities may have a material adverse effect on our business, financial condition and results of operations.
Fire and other disasters could affect our agricultural and manufacturing properties and our facilities and distribution networks, which would have a material adverse effect on our production and distribution volumes and, consequently, results of operations.
Our operations are subject to risks affecting our agricultural properties and facilities and distribution networks, including fire potentially destroying some or all of our crop and facilities. In addition, our operations are subject to hazards associated with the manufacture of flammable products and transportation of raw materials and flammable products. Our insurance coverage may not be sufficient to provide full protection against these types of casualties.
19
Crop disease and pestilence may strike our crops which may result in destruction of a significant portion of our harvest.
Crop disease and pestilence can occur from time to time and have a devastating effect on our crops, potentially rendering useless or unusable all or a substantial portion of affected harvests. Even when only a portion of the crop is damaged, our business, results of operations and financial condition could be adversely affected because we may have incurred a substantial portion of the production cost for the related harvest. The cost of treatment of crop disease tends to be high. Any serious incidents of crop disease or pestilence, and related costs, may adversely affect our production levels and, as a result, our net sales and overall financial performance.
Anticompetitive practices in the fuel distribution market may distort market prices.
In the last few years, anticompetitive practices have been one of the main problems affecting fuel distributors in Brazil. Generally these practices have involved a combination of tax evasion and fuel adulteration, such as the dilution of gasoline by mixing solvents or adding anhydrous ethanol in an amount greater than that permitted by applicable law (the overall taxation of anhydrous ethanol is lower than hydrated ethanol and gasoline).
Taxes constitute a significant portion of the cost of fuels sold in Brazil. For this reason, tax evasion by some fuel distributors has been prevalent, which allows them to lower the prices they charge. These practices have enabled certain distributors to supply large quantities of fuel products at prices lower than those offered by the major distributors, including us, which has resulted in a considerable increase in the sales volumes of the distributors who have adopted these practices. The final prices for fuels are calculated based on the taxes levied on their purchase and sale, among other factors. If such practices become more prevalent, it could lead to lower prices or reduced margins for the products we sell, which could have a material adverse effect on our business, results of operations or financial condition.
In Brazil, Petrobras is the main supplier of base oils, the primary distributor of fuel and the dominant company in the natural gas sector. In the event of an interruption of supply of fuels from Petrobras, significant disruption to Raízen Combustíveis, Comgás and Moove operations sales may occur.
Petrobras is the principal supplier of fuel in Brazil and the distribution policies it sets forth directly affect the Brazilian energy matrix. With the recent discoveries in thepre-salt oil fields, and the beginning of production in the Santos basin, which is located close to our concession area, we face uncertainties regarding the production of alternative fuel. Petrobras is also the subject of “Lava Jato” investigations by the Brazilian Federal Police, the Brazilian Federal Prosecutor’s Office, the CVM and the SEC in connection with corruption allegations, which could cause disruption in Petrobras’ activities. Significant disruption to our fuels, lubricant and natural gas sales may occur in the event of an interruption of supply from Petrobras. Any interruption would immediately affect our ability to provide fuel, lubricant and natural gas products to our customers. If we are not able to obtain an adequate supply of fuel, base oil and natural gas products from Petrobras under acceptable terms, we may seek to meet our demands through purchases on the international market. The cost of fuel and base oil products on the international market may be more expensive than the price we obtain through Petrobras.
In addition, we may be adversely affected if Petrobras significantly modifies its business plan or reduces its activities related to the distribution of fuel in Brazil. In particular, the most recently published divestment plan of Petrobras suggests that Petrobras is scaling back its positions in logistics, which may result in disruption of logistics services and result in changes to distribution policies which may adversely affect the competitiveness of fuel distributors.
Disruption of Raízen Energia’s transportation and logistics services or insufficient investment in public infrastructure could adversely affect our operating results.
One of the principal disadvantages of the Brazilian agriculture sector is that key growing regions lie far from major ports. As a result, efficient access to transportation infrastructure and ports is critical to the growth of Brazilian agriculture as a whole and of our operations in particular. As part of its business strategy, Raízen Energia is investing in areas where existing transportation infrastructure is underdeveloped.
A substantial portion of Brazilian agricultural production is currently transported by truck, a means of transportation significantly more expensive than the rail transportation available to U.S. and other international producers. Raízen Energia’s dependence on truck transport may affect our position as alow-cost producer, such that its ability to compete in world markets may be impaired. Furthermore, Raízen Energia’s supply chain is dependent on road transport and may be adversely affected by weather conditions which require a decrease or stoppage in road transport. Any such impediments to road traffic along the routes typically used within Raízen Energia’s supply chain could require it and its suppliers to use alternative routes, which may result in delays and have a material adverse effect on Raízen Energia’s business, financial condition and results of operations.
20
In addition, Brazilian ports are operating at close to full capacity. Given that a significant part of Raízen Energia’s sales are exported to countries other than Brazil (both with regards to sugar and ethanol), we may be adversely affected by the lack of port capacity or an increase in the costs of such port capacity as a result of limitations in supply.
Raízen Energia currently outsources the transportation and logistics services necessary to operate its business. Any disruption in these services, or any obligation to take over these services from existing service providers as a result of judicial orders banning the outsourcing of these services, could result in supply problems at Raízen Energia’s processing plants and impair its ability to deliver processed products to our customers in a timely manner. In addition, a natural disaster or other catastrophic event could result in disruption in regional transportation infrastructure systems affecting Raízen Energia’s third-party transportation providers.
Even though road and rail improvement projects have been considered for some areas of Brazil, and in some cases implemented, substantial investments are required for road and rail improvement projects, which may not be completed on a timely basis, if at all. Any delay or failure in developing infrastructure systems could hurt the demand for our products, impede our delivery of products or impose additional costs on Raízen Energia.
The production of lubricants and the storage and transportation of fuel products and lubricant products are inherently hazardous.
The complex manufacturing operations we perform at our lubricants oil blending plant involve a variety of safety and other operating risks, including the handling, production, storage and transportation of toxic materials. These risks could result in personal injury and death, severe damage to or destruction of property and equipment and environmental damage. A material accident at one of our plants, service stations or storage facilities could force us to suspend our operations and result in significant remediation costs and lost revenue. In addition, insurance proceeds, if available, may not be received on a timely basis and may be insufficient to cover all losses, including lost profit. Equipment breakdowns, natural disasters, and delays in obtaining supplies or required replacement parts or equipment could also have a material adverse effect on our manufacturing operations and consequently our results of operations. Disruption of transportation and logistics services or insufficient investment in public infrastructure could have a material adverse effect on our operating results.
We may be adversely affected by unfavorable outcomes in pending legal proceedings.
We are involved in a significant number of tax, civil (including regulatory and environmental) and labor proceedings. As of December 31, 2018, we had recorded a provision totaling R$1,363.2 million for proceedings in which we deem the risk of loss as probable (equivalent to R$878.8 million net of judicial deposits or restricted bank accounts). We cannot predict whether we will prevail in these or other proceedings, or whether we will have to pay significant amounts, including penalties and interest, as payment for our liabilities, which would materially and adversely impact our business and financial performance.
In addition, unfavorable decisions in criminal proceedings involving members of our management may have a material adverse effect on us. Certain members of our management have been named as defendants in criminal proceedings (1) in their capacity as officers of the predecessor entity of Raízen Energia for alleged artificial price fixing of fuel and the formation of a cartel with the purpose of establishing control over the regional market, (2) in their capacity as officers of Raízen Energia and Cosan S.A. for alleged tax evasion carried out by these entities, and (3) in their capacity as officers of the predecessor entities of Raízen for the crimes of disobedience and pollution in connection with the alleged burning of sugarcane contrary to a judicial decision. In the event of a finalnon-appealable conviction, one or more of these officers may be barred from holding executive positions within our Company, and depending on the development of the proceedings, our reputation in the opinion of our clients, suppliers and investors may be materially adversely affected.
Two of Rumo’s subsidiaries, Rumo Malha Oeste S.A., or “Malha Oeste,” and Rumo Malha Sul S.A., or “Malha Sul,” are party to preliminary proceedings being conducted by ANTT in relation to certain alleged failures by Malha Oeste and Malha Sul to comply with their contractual obligations pursuant to certain concession agreements. Specifically, the ANTT is alleging that Malha Oeste and Malha Sul have failed to comply with certain deadlines for the presentation of documents and financial information in relation to their respective concessions. If the preliminary proceedings are decided against Malha Oeste and Malha Sul, we expect that Malha Oeste and Malha Sul will be given the opportunity to remedy the alleged breaches and/or to pursue the proceedings in court before any of the concession agreements in question is terminated. We estimate that the risk of loss in these proceedings is possible.
21
One of Rumo’s subsidiaries, Rumo Malha Paulista S.A., or “Malha Paulista,” is party to a labor class action (ação civil pública) stemming from allegations by the Labor Prosecutor’s Office that certain persons working for MS Teixeira were working in degrading conditions analogous to indentured servitude. MS Teixeira was a subcontractor to Malha Paulista’s contractor for certain services, Prumo Engenharia. Malha Paulista has been ordered by the courts to undertake (and/or refrain from undertaking) various actions with respect to the working environment and to pay an indemnity for collective moral damages, as well as fines of R$100 thousand per breach or per worker in the event of future labor breaches. As of the date of this annual report, neither we nor Rumo have made provisions with respect to these proceedings as the external counsel advising Rumo on these proceedings has assessed the risk of loss as possible. An adverse outcome in this lawsuit could result in losses of approximately R$28.8 million to Rumo, and adversely affect Rumo’s reputation. However eventual future loss on this lawsuit cannot lead the inclusion of Malha Paulista on the list of Brazilian Ministry of Labor, containing the employers that practices supposed labor irregularities. If Malha Paulista’s appeal is rejected by the superior courts or if the Labor Prosecutor’s Office’s allegation of degrading working conditions analogous to indentured servitude is confirmed, the final outcome of the action may have a material adverse effect on Rumo’s business, financial condition and results of operations—including as a result of the acceleration of certain financial agreements to which Rumo is a party—and Rumo may suffer damage to its reputation. Any such developments could have a material adverse effect on us.
The Brazilian Ministry of Labor has imposed a fine and served an infraction notice on Malha Paulista in connection with the abovementioned allegations that certain employees of MS Teixeira were working in degrading conditions analogous to indentured servitude. Malha Paulista has challenged the infraction notice in an administrative proceeding with the Brazilian Ministry of Labor, pending a final decision. Prumo Engenharia has admitted responsibility for the degrading conditions in which certain employees were working, including acknowledging its status as their employer and paying all applicable employment termination fees. This process was recognized and duly recorded by Brazilian Ministry of Labor. In spite of this, Malha Paulista has been included in a list of employers that employ workers in a condition analogous to indenture servitude by the Brazilian Ministry of Labor. On April 13, 2018, as part of annulment action currently being heard, the 83rd Labor Court of São Paulo granted an injunction, requiring that Malha Paulista be removed from the list until a final and unappealable judicial verdict is issued. The Regional Labor Appeals Court of São Paulo upheld the injunction following an appeal. The annulment proceeding is currently in the discovery phase. The facts under discussion in the annulment proceeding are similar to those at issue in the abovementioned labor class action. However, in the labor class action, the Labor Prosecutor’s Office is seeking the payment of damages and compliance with certain labor obligations by Malha Paulista, while in the annulment proceeding Malha Paulista is seeking the annulment of the Brazilian Ministry of Labor’s infraction notice. We estimate that the risk of loss in these proceedings is possible. If the annulment proceeding is decided against Malha Paulista, this may have a material adverse effect on Rumo’s business, financial condition and results of operations and Rumo may suffer damage to its reputation. Any such developments could have a material adverse effect on us.
Moreover, Malha Paulista has contracted COS Emergencial Intermediação e Agendamento Ltda., or “COS Emergencial,” to perform property security services from 2006 until 2012. However, COS Emergencial’s managers were accused by the Federal Public Prosecutor’s Office of employing workers in degrading working conditions analogous to indentured servitude between the years of 2005 and 2010. According to testimony, the defendants had not complied with certain requirements to provide adequate working conditions, had left their employees for long periods without food, water, sanitation, communication and basic equipment, and had submitted them to long continuous periods of work. The lower court convicted the defendants and the Federal Public Prosecutor’s Office filed an appeal seeking to increase the defendants’ sentence. Even though there is no allegation that Malha Paulista committed any crime, one of the defendants stated in his defense that Malha Paulista was responsible for overseeing its contracted companies, and should therefore have identified the abovementioned working condition irregularities and sanctioned COS Emergencial or rescinded its agreement with COS Emergencial. We estimate that the risk of loss in these proceedings is possible.
We cannot predict whether we will prevail in these or other proceedings, or whether we will have to pay significant amounts, including penalties and interest, as payment for our liabilities, which would materially and adversely impact our business, results of operations and financial condition. If we are the subject of an unfavorable outcome in any of these legal proceedings, the amount of such unfavorable decisions will have a material adverse effect on our financial position and operating results.
Transporting gas involves numerous risks that may result in accidents and other operating risks and costs that could adversely affect our results of operations, cash flows and financial condition.
Our activities involve a variety of inherent hazards and operating risks, such as leaks, accidents and mechanical problems, which could cause substantial financial losses. In addition, these risks could result in loss of human life, significant damage to property, environmental pollution and impairment of our operations, which in turn could lead to substantial losses. In accordance with customary industry practice, we maintain insurance against some, but not all, of these risks and losses. The location of pipelines near populated areas, including residential areas, commercial business centers and industrial sites, could increase the level of damages resulting from these risks. The occurrence of any of these events if not fully covered by insurance could adversely affect our results of operations, cash flows and financial condition.
22
The volatility and uncertainties in international oil and gas prices as well as a significant depreciation of the real relative to the U.S. dollar may affect the operating costs and competitive positions of our businesses, which could adversely affect our results of operations, cash flows and financial condition.
Natural gas and oil prices historically have been volatile and may continue to be volatile in the future. Prices for natural gas and oil are subject to a variety of factors that are beyond our control. These factors include, but are not limited to, the level of consumer demand for, and the supply of, natural gas, processing, gathering and transportation availability, statutory gas supply purchase obligations, price and availability of alternative fuel sources, weather conditions, natural disasters and political conditions or hostilities in natural gas producing regions.
In addition, the amounts we pay under our natural gas supply agreements are composed of two components: (1) one that is indexed to a basket of combustible oils in the international market that is adjusted quarterly and (2) one that is adjusted annually based on the inflation rate. We have no control over either of these components. Furthermore, natural gas supply agreements often take the form of a “take or pay” agreement, pursuant to which we might be required to pay the difference in amounts between actual consumption and the contract amount. Variations and uncertainties in the price and demand of oil and gas are beyond our control and may adversely affect our results of operations.
Renewal of our natural gas concession agreement is not guaranteed, the terms we will receive if such renewal is granted could adversely affect our results of operations, cash flows and financial condition and our growth strategy would be materially adversely affected if we cannot obtain new concessions on similar terms or if our existing concession is terminated.
We, through our affiliate Comgás, carry out our natural gas distribution activities pursuant to a concession agreement entered into with the government of the state of São Paulo and regulated by ARSESP for a30-year term with aone-time possibility of renewal for an additional 20 years at the discretion of the government of the state of São Paulo, subject to certain conditions, including approval by ARSESP. The Brazilian Constitution (Article 175) requires that all concessions relating to public services be awarded through a public bidding process.
Due to the discretionary power of the government of the state of São Paulo in granting the renewal of our concession agreement, we cannot assure you that our concession agreement will be renewed, or that it will be renewed on the same terms. Moreover, pursuant to the terms of our concession agreement, the government of the state of São Paulo may terminate our concession agreement upon the occurrence of certain conditions. If our concession agreement is not renewed, or is renewed with less favorable terms, or is terminated, our business, financial condition and results of operations will be materially adversely affected.
Our business is subject to regulation, control and supervision of ARSESP, which could affect our financial performance. ARSESP establishes the maximum values of our rates and regulates and supervises our business. Pursuant to our concession agreement, every five years – or whenever ARSESP deems the economic and financial balance of the concession agreement to be adversely affected due to the variation of costs incurred by Comgás – our rates are reviewed by ARSESP, which directly affects our margins and our results, either positively or negatively. Such margins are adjusted annually by theIGP-M minus the efficiency factor determined for each tariff cycle by ARSESP. As a result, the implementation of our growth strategy and the normal course of our business may be adversely affected by government actions.
We cannot guarantee that changes arising from the tariff review process will be supportive of our strategy in our subsidiary Comgás.
The principal rights and obligations of the holders of concessions are included in the concession agreement, and in the regulations established by ARSESP. Among the items provided in the concession agreement is the tariff review, which should occur in five-year cycles and serves to reestablish the economic and financial balance of the concession, setting the average margin for the cycle and the rates that will apply for each segment. The tariff review process, which should have been concluded in May 2014, is still in process. We cannot assure you that in the future tariffs will be set at a level that would permit us to continue to operate profitably.
In addition, in its regulatory capacity, ARSESP may impose penalties on us if we fail to comply with any provision of the concession agreement. Depending on the severity of noncompliance, applicable penalties include, among others:
| | • | | bans on the construction of new facilities and equipment; |
| | • | | forfeiture of the concession; and |
| | • | | impediments from participating in public bidding processes and from being awarded new concessions. |
23
We cannot guarantee that we will not be penalized by ARSESP for breaching our natural gas concession agreement or that the concession will not be revoked in the future. The compensation to which we would be entitled in the event of possible revocation of the concessions may not be sufficient to recover the full value of certain assets. Therefore, the imposition of fines or penalties on us or the revocation of the concessions may have a material adverse effect on our financial condition and results of operations.
We depend on third parties to provide our customers and us with facilities and services that are integral to our business.
We have entered into agreements with third-party contractors to provide facilities and services required for our operations, including storage facilities and transportation services for our ethanol and sugar operations. The loss or expiration of our agreements with third-party contractors or our inability to renew these agreements or to negotiate new agreements with other suppliers at comparable rates could harm our business and financial performance. Our reliance on third parties to provide essential services on our behalf also gives us less control over the costs, efficiency, timeliness and quality of those services. Contractors’ negligence could compromise the safety of the transportation of ethanol from our production facilities to our export facilities and expose us to the risk of liability for environmental damage caused by such third parties. We expect to be dependent on such agreements for the foreseeable future, and if we enter any new market segments, we will need to have similar agreements in place.
Brazilian labor authorities previously prohibited the outsourcing of activities considered to be part of an entity’s core business. Noncompliance with this prohibition could result in fines and a requirement that the outsourcing be terminated. However, the Brazilian Supreme Court has recently ruled that outsourcing is generally permitted. Moreover, recently enacted labor legislation has explicitly allowed the outsourcing of activities considered to be part of an entity’s core business provided that certain conditions are complied with. While we expect that these legal developments will make it easier to outsource activities to third-party contractors, we still face the risk that (i) we may be held indirectly liable when third-party contractors fail to comply with their labor obligations, and (ii) we are held jointly and severally liable with our third-party contractors where they fail to comply with their labor obligations if it is proved that there was a direct relationship between us and the outsourced employees, or in cases of fraud. Any such developments could have a material adverse effect on us.
Our international operations expose us to political and economic risks in other countries.
We derive 2.2% of our revenues from exports. In particular, Moove derives approximately 3.2% of its revenues from exports, as it distributes and sells Mobil brand products manufactured in Brazil and sold in Bolivia, Paraguay and Uruguay, and, in July 2012, we acquired Comma, which produces and distributes lubricants throughout Europe and Asia. In 2017 we also acquired Stanbridge group, which distributes lubricant and fuels in the United Kingdom. In addition, Moove has started a new distribution operation under the Mobil brand, in Spain, France, Portugal, the United States and Argentina, aligned with its strategy to leverage the ExxonMobil partnership and expand abroad.
Our international activities expose us to risks not faced by companies that operate solely in Brazil. Risks associated with our international operations include: (1) foreign exchange controls; (2) changes in the political or economic conditions in a specific country or region, especially in emerging markets; (3) potentially negative consequences resulting from changes to regulatory requirements; (4) difficulties and costs associated with our observance of different laws, treaties and complex international regulations; (5) tax rates that may exceed those applicable in Brazil and other countries or gains that may be subject to withholding regimes and an increase in repatriation taxes; (6) imposition of trade barriers; and (7) limitations on the repatriation of undistributed profits. The realization of any of these risks may have a material adverse effect on our business, results of operations or financial condition.
We may not be able to maintain or renew certain agreements with third parties which are important to our business.
Our business, financial condition and results of operations may be materially and adversely affected if we are unable to maintain or renew certain agreements (including, without limitation, supply agreements, service contracts, licensing agreements, distribution agreements, joint ventures, partnerships and others) with third parties which are important to our business and operations.
24
On November 1, 2017, we acquired Stanbridge, which distributes lubricants and fuels in some regions of the United Kingdom. The company has an exclusive supply service contract with the company operating Heathrow Airport to supply fuel, fuel management services and certain other products and services to Heathrow Airport. This contract is expected to terminate in 2019. While negotiations have begun to renew this agreement, we cannot assure you that such negotiations will be successful. Failure to renew such agreement could materially and adversely affect our results of operations.
We, through our subsidiary Moove, are the manufacturer and exclusive distributor of lubricants in Brazil based on formulas that have been provided under the terms of the Principal Lubricants Agreement that we have entered into with ExxonMobil. On March 19, 2018, we entered into an agreement with ExxonMobil Lubricants Trading Company which grants our subsidiary Moove the exclusive production, import, distribution and marketing rights in Brazil, Bolivia, Paraguay and Uruguay of lubricants and certain other related products under the Mobil brand until November 30, 2038. This agreement came into force on December 1, 2018. The termination or failure to renew these agreements, or the failure by ExxonMobil to adequately maintain and protect its intellectual property rights, could materially and adversely affect our results of operations or could require significant unplanned investments by us if we are forced to develop or acquire alternative technology. In the future, it may be necessary or desirable to obtain other third-party technology licenses relating to one or more of our products or relating to current or future technologies to enhance our product offerings. However, we may not be able to obtain licensing rights to the needed technology or components on commercially reasonable terms or at all.
We incur substantial costs to comply with environmental regulations and may be exposed to liabilities in the event we fail to comply with these regulations or as a result of our handling of hazardous materials.
We are subject to various Brazilian federal, state and municipal environmental protection and health and safety laws and regulations governing, among other matters:
| | • | | the issuance and renewal of valid environmental licenses and authorizations; |
| | • | | the generation, storage, handling, use and transportation of hazardous materials; |
| | • | | the protection of cultural and historic sites; |
| | • | | the emission and discharge of hazardous materials into the ground, air or water; and |
| | • | | the health and safety of our employees. |
We are also required to obtain environmental and health permits and/or authorizations (such as installation and operation permits as well as permits for the removal of vegetation) from governmental authorities for certain aspects of our operations. Failure to obtain environmental and/or health permits or comply with the conditions under which such permits are issued could subject us to criminal, administrative and/or civil liabilities. These laws, regulations and permits often require us to purchase and install expensive pollution control equipment or to make operational changes to limit actual or potential impacts on the environment and/or health of our employees. In addition, Brazilian environmental laws establish restrictions to obtain financing from public entities in case of breach of certain environmental protection obligations. Any violations of these laws and regulations or permit conditions can result in substantial fines, criminal sanctions, revocations of operating permits and/or shutdowns of our facilities.
Due to the possibility of changes to environmental and/or health regulations and other unanticipated developments, the amount and timing of future environmental and health expenditures may vary substantially from those currently anticipated. Under Brazilian environmental laws, we could be held strictly liable for all of the costs relating to any contamination at our or our predecessors’ current and former facilities and at third-party waste disposal sites used by us or any of our predecessors. We could also be held responsible for any and all consequences arising out of human exposure to hazardous substances, such as pesticides, herbicides, soil or groundwater contamination or other kinds of environmental damage.
We are party to a number of administrative and judicial proceedings for alleged failures to comply with environmental and health laws, which may result in fines, shutdowns or other adverse effects on our operations. Actions that give rise to administrative proceedings may also lead to civil or criminal claims against us. We have not recorded any relevant provisions or reserves for these proceedings as we do not currently believe that they will result in liabilities material to our business or financial performance. Our costs of complying with current and future environmental and health and safety laws, and our liabilities arising from past or future releases of, or exposure to, hazardous substances could adversely affect our business or financial performance.
25
Our business would be materially adversely affected if operations at our transportation and distribution facilities experienced significant interruptions. Our business would also be materially adversely affected if the operations of our customers and suppliers experienced significant interruptions.
The distribution of natural gas is by its nature subject to inherent risks, including interruptions or disturbances in the natural gas distribution system which may be caused by accidents or force majeure events. Our operations are dependent upon the uninterrupted operation of our terminal and storage facilities and various means of transportation and distribution facilities. We are also dependent upon the uninterrupted operation of certain facilities owned or operated by our suppliers and customers. Operations at our facilities and at the facilities owned or operated by our suppliers and customers could be partially or completely shut down, temporarily or permanently, as the result of any number of circumstances that are not within our control, such as:
| | • | | catastrophic events, including hurricanes and floods; |
| | • | | environmental matters (including environmental licensing processes or environmental incidents, contamination, wildlife preservation obligations and others); |
| | • | | labor difficulties (including work stoppages, strikes and other events); and |
| | • | | disruptions in the supply of our products to our facilities or means of transportation. |
Any significant interruption at these facilities or inability to transport products to or from these facilities or to or from our customers for any reason could subject us to liability in judicial, administrative or other proceedings, even for disruptions caused by events outside of our control. If we are held liable for such events, results of operations and cash flow would be materially adversely affected.
For example, between May 21 and May 31, 2018, Brazil suffered an extensive nationwide trucking strike. With trucks stopped and blocking highways, supplies of fuel, food and medical supplies ceased being delivered to distribution points. The stoppage began to subside on May 27, 2018, after representatives of the trucking industry and the Brazilian government reached an agreement. We estimate that the nationwide trucking strike impacted our results (principally those of Raízen Combustíveis) by approximately R$220 million during the fiscal year ended December 31, 2018.
Rumo depends on a few major customers for a significant portion of its revenue.
The majority of the cargo Rumo transports is for the agricultural commodities industry. Rumo’s major clients are export companies participating in this market, such as Amaggi, ADM, Bunge, Cargill, Louis Dreyfus and Raízen. In the fiscal year ended December 31, 2018, Bunge accounted for 13.9% of Rumo’s total net revenue from services, while Rumo’s six major clients accounted for 48% of Rumo’s total net revenue from services. In the fiscal year ended December 31, 2017, Bunge accounted for 15% of Rumo’s total net revenue from services, while Rumo’s six major clients accounted for 52.5% of Rumo’s total net revenue from services in the same period. Bunge is the principal customer of Rumo’s Northern Operations (as defined below) and Southern Operations (as defined below) and is active in agricultural commodities, especially corn, soy and derivatives thereof, loading cargo in transshipment terminals destined for ports which Rumo operates.
Rumo’s major clients in the rail sector are export companies such as Amaggi, ADM, Bunge, Cargill, Louis Dreyfus and Raízen. In the fiscal year ended December 31, 2018, Bunge accounted for 15.6% of Rumo’s net revenue from services in the rail sector, while Rumo’s six major clients in the rail sector jointly accounted for 53.9% of Rumo’s net revenue from services in that sector. In 2017, Bunge accounted for 14.5% of Rumo’s net revenue from services in the rail sector, while Rumo’s six major clients in the rail sector accounted for 46.4% of Rumo’s net revenue from services in that sector.
Rumo’s largest clients in the port elevation sector include Engelhart, Czarnikow, Cofco, Wilmar, Raízen and Sucden. In the fiscal year ended December 31, 2018, Engelhart accounted for 17.8% of our net revenue from services in the port elevation sector, while Rumo’s six largest clients in the port elevation sector collectively accounted for 70% of Rumo’s net revenue from services in that sector. In the fiscal year ended December 31, 2017, Raízen accounted for 17.9% of Rumo’s net revenue from services in the port elevation sector, while Rumo’s six largest clients in the port elevation sector accounted collectively for 52.3% of Rumo’s net revenue from services in that sector.
We cannot guarantee that Rumo will obtain similar revenue from its major clients in the future. Any change by Rumo’s major clients in their demand for transportation services, including logistics services, may have a material adverse effect on Rumo’s business, financial condition and results of operations. Moreover, Rumo’s revenue predominantly derives from transportation agreements between Rumo and its clients. We cannot guarantee that these transportation agreements will be renewed once they have expired, which may adversely affect Rumo’s business, financial condition and results of operations.
26
Rumo’s significant debt could adversely affect its financial health and prevent it from fulfilling its debt obligations, which would have a material adverse effect on us, our financial condition and our results of operations.
Rumo has a significant amount of debt. As of December 31, 2018, Rumo’s gross debt was R$10,594.4 million, of which R$924.9 million was short-term debt.
Rumo’s debt level and the composition of its debt could have important consequences to its business. For example, it could: (1) require Rumo to reserve a substantial part of its operational cash flows to pay principal and interest on Rumo’s debt, which will reduce the availability of its cash flow to fund working capital, capital expenditures, acquisitions and investments; (2) limit its flexibility in planning for, or reacting to, changes in our business and the industry in which we operate; (3) limit its ability to borrow additional funds, obtain bank guarantees or collateral insurance and generally increase its borrowing costs; and (4) place Rumo at a competitive disadvantage compared to our competitors that have less debt.
Any of the aforementioned developments could have a material adverse effect on us, our financial condition and results of operations.
Significant deterioration in Rumo’s short-term liquidity could materially affect our business, result of operations and financial condition.
If Rumo fails to improve its short-term liquidity, we may face difficulties in fulfilling its obligations relating to financing agreements, and agreements with suppliers and/or subcontractors, among others. For example, as of December 31, 2018, Rumo’s material contractual financial obligations maturing in less than one year totaled R$2,927.1 million (amortization only), while such obligations with maturities between one to two years totaled R$2,118.6 million (based on contracted undiscounted cash flow). Rumo’s failure to comply with these obligations and/or other undertakings may have a material adverse effect on our business, results of operations and financial condition.
The sector in which Rumo operates has limited working capital, if not negative. If Rumo’s cash flow is impaired, Rumo may not be able to maintain its short-term liquidity and may face difficulties in meeting its obligations pursuant to its financing agreements, and contracts with suppliers and/or subcontractors, among others. Any failure by Rumo to comply with these and/or other obligations may, in turn, materially impact Rumo’s business, results and financial condition.
Rumo’s concessions to operate port terminals are subject to expiration, limitation on renewal and early termination by the granting authority.
Rumo leases 118,434.38 square meters of property located in the port of Santos (state of São Paulo), which has two docking cradles for loading sugar and solid agricultural bulk (corn and soy). This property is leased pursuant to lease agreementPRES-05/96, which matures on March 6, 2036. Pursuant to Article 19 of Decree No. 8,033/2013, recently amended by Decree No. 9,048/2017, lease agreements may be extended for up to the limit of 70 years. Pursuant to the lease agreement, Rumo has an obligation to make investments totaling an estimated R$308 million, of which we have already invested 85% as of April 29, 2019.
Rumo also holds equity interests in: (1) Terminal XXXIX and the adjacent areas for moving agricultural products and bulk as well as other goods capable of being transported in those port installations, through a port lease agreement due to expire in 2050; (2) facilities, equipment and track for rail transport of goods and import/export through the right bank of the port of Santos, by means of a lease agreement with Portofer Transporte Ferroviário Ltda. due to expire in 2025; (3) Terminal de Granéis do Guarujá (TGG) located on the left bank of the port of Santos, for the transport of solid and liquid bulk, through an area used by Rumo Malha Norte S.A., or “Malha Norte” via a leasing agreement due to expire in 2022; and (4) Terminal Marítimo do Guarujá (TERMAG), located on the left bank of the port of Santos, mainly for the transport of solid and liquid bulk, through an area used by Malha Norte via a lease agreement due to expire in 2022.
There are ongoing legal proceedings regarding whether the lease agreements (as amended) relating to Terminal XXXIX, Terminal de Granéis do Guarujá and Terminal Marítimo do Guarujá should be subject to the public procurement regime. These proceedings are currently under appeal in the Brazilian superior courts (Superior Tribunal de Justiça andSupremo Tribunal Federal). With regards to the Portofer lease agreement, there is a public civil action filed by the Brazilian Federal Prosecutors’ Office, to challenge the legal validity of the agreement.
27
If Rumo fails to comply with the applicable regulatory rules or contractual obligations relating to Terminals 16 and 19 its lease may be terminated early pursuant to the Concessions Law (Law No. 8,987/1995), which applies to port leases. Below is a list of the termination events applicable to the port lease agreements:
| | • | | expiration of the lease agreement (currently in 2036, which can be legally extended up to 2066 through new investments); |
| | • | | encampação, which is the possibility of expropriation of the port concessions by the granting authority during the contractual term. Such expropriation must be for public interest, performed pursuant to applicable authorizing law and accompanied by the payment of an indemnity for investments not yet depreciated, if applicable; |
| | • | | a statement of forfeiture, which occurs, at the granting authority’s sole discretion, in case of total or partialnon-performance of the lease, without prejudice to the application of other contractual penalties. The forfeiture may be declared under the following circumstances: (1) the service is not being provided adequately (i.e., there has been a breach of the minimum transport requirements); (2) failure to undertake the investments stipulated in the agreement; (3) breach of contractual obligations; (4) transfer of the agreement without prior consent from the granting authority; (5) obstruction of audits carried out by the granting authority; (6) changes to the contractual objective; (7) failure to maintain or conserve the leased facilities; (8) default in financial obligations set out in the agreement; or (9) loss by us of the economic, technical and operating conditions required for the adequate provision of services set out in the agreement. The forfeiture must be preceded by the verification of the default in an administrative proceeding in connection with which we have a right of defense; |
| | • | | termination by the lessee in the event of breach of contractual provisions or rules established by the granting authority by means of judicial action for this specific purpose; |
| | • | | bankruptcy or extinction of the lessee. |
The lease agreements and applicable legislation confer several rights of the granting authority pursuant to the specific rules and regulations for the industry. Accordingly, there are contractual provisions that allow, among other things, amendments to the agreement, assignment and/or transfer of the lease agreement (the latter subject to prior consent from the granting authority), provided, however, that all amendments to the agreement must abide by the rules and proceedings set out in the specific law or regulation.
Termination of Rumo’s port lease agreements may adversely impact Rumo’s transportation costs and the turnaround time for the export of Rumo’s products, as well as Rumo’s revenues from service agreements related to Rumo’s port facilities.
In addition, port assets deemed essential to the continuity of port operations will revert to the granting authority upon expiration of the concession. The reversion following expiration is subject to indemnification for investments in assets not yet amortized or depreciated which were undertaken to guarantee service continuity. Upon termination of the concession, it is possible that the investments made in those assets will have not been entirely amortized or depreciated. In this case, Rumo and the granting authority will negotiate the amount of any indemnification for such investments, to the extent such investments have been previously approved by the granting authority. As the final decision on this amount will be made solely by the granting authority, Rumo’s financial condition may be negatively impacted if indemnification eventually approved is not sufficient to compensate us for the investments made.
Any of the aforementioned developments could have a material adverse effect on us, our financial condition and results of operations.
We are unable to estimate the impact of new regulations applicable to port operations in Brazil.
Until December 6, 2012, port operations in Brazil were governed by Federal Law No. 8,630/1993, or the Ports Modernization Law, which provided the legal framework applicable to the development and operation of ports and port facilities in Brazil. To improve the applicable legislation, the Brazilian government enacted Law No. 12,815/2013, or the “New Ports Law,” which has been regulated by Decree No. 8,033/2013, amended by Decree No. 9,084/2017. Such law revoked the Ports Modernization Law and established a new legal framework for port operations in Brazil. As a result, public ports are governed by the New Ports Law and by specific complementary regulations enacted at the federal level, particularly by theAgência Nacional de Transportes Aquaviários and by theSecretaria Nacional de Portos, or “SNP.” (SNP has been integrated within the structure of the Federal Government’s Transportation, Ports and Civil Aviation Ministry by Federal Law No. 13,341/2016).
28
Pursuant to the New Ports Law, there is no longer a distinction between third-party and own cargo handled at private port terminals, i.e., the activities carried out in private terminals will be identical to those performed at public terminals with respect to the rendering of services. As a result, public ports are expected to face higher competition from the potential increase in development of operations in private ports. Accordingly, new port lease grants may be carried out by the Brazilian federal government, which may affectinter-and intra-port competition. Finally, Rumo may not be able to meet the minimum cargo volumes provided for in Rumo’s port lease agreements, which may subject it to fines and, upon repeated violations, to the early termination of the relevant grants.
Although the New Ports Law does not retroactively adjust the terms of any concession agreement currently in effect, it is possible that the supplemental regulations provide for such retroactive adjustment (including by means of unilateral requirements from the granting authority). New regulations applicable to port operations in Brazil that modify the terms of Rumo’s grant documents may materially and adversely affect our results of operations.
The loss of Brazilian railway concessions may have a material adverse effect on our business.
Brazilian railway concessions are subject to early termination in certain circumstances, including the Brazilian authorities reassuming control of the service pursuant to applicable law or by the termination of the relevant concession for breach of any underlying contractual agreements, in particular the inadequate provision of rail transportation services provided for in the concession agreements. Pursuant to Federal Law No. 8,987/1995, concession agreements may be terminated as a consequence of: (1) expiration of the contractual term; (2) expropriation of the port concessions in the public interest (i.e.,encampação); (3) forfeiture (caducidade); (4) termination; (5) annulment; (6) bankruptcy; or (7) expiration of the concession-holding entity.
Encampação is the seizure of the service by the granting authority during the concession term to the benefit of public interest, by means of a specific authorizing law and after payment of an indemnity. The granting authority may declare the forfeiture of the agreement in the cases in which the concessionaire recurrently defaults on its obligations, or annulment in the cases that the bidding documents for the concession or the concession agreement are tainted by unlawful provisions, or declare penalties, due to total or partialnon-performance of the agreement. The granting authority may forfeit the concession when, among other events: (1) the service is being rendered in an inadequate or insufficient manner, according to the norms, criteria, indicators and parameters defining the quality of the service; (2) the concessionaire breaches contractual, regulatory or legal provisions concerning the concession; (3) the concessionaire interrupts the service other than for acts of god or force majeure events; (4) the concessionaire no longer possesses the economic, technical or operational conditions required to adequately render the services under the concession; and (5) the concessionaire does not comply with the penalties imposed for breaches within the established deadlines.
Upon termination of a concession, the leased or operated assets revert to the granting authority, and the amount of compensation received may not be sufficient to cover the losses incurred by us as a result of such early termination. In addition, certain creditors may have priority with regards to such compensation.
In addition, pursuant to the terms of Rumo’s concession agreements, the granting authority may intervene in the concession to ensure that the relevant services are being provided as well as to ensure compliance with the applicable contractual clauses and legal and regulatory norms.
An early termination of Rumo’s concession agreement, as well as the imposition upon Rumo of penalties associated with such termination and interventions in our management may have a material impact on Rumo’s operating results and affect our payment capacity and ability to meet our financial obligations.
29
Rumo may not obtain early renewals of the Malha Paulista, Malha Sul and Malha Oeste concession agreements, currently under review by the Brazilian Transportation Authority (Agência Nacional de Transporte Terrestre), or “ANTT,” which may have a material adverse effect on Rumo’s investment plan and growth strategy.
The concession agreements for Malha Paulista, Malha Sul and Malha Oeste are currently due to expire in 2028, 2026 and 2027, respectively. In September 2015, Rumo filed formal requests with the ANTT for early renewals of such agreements. Malha Paulista’s formal extension request was approved by ANTT and is currently under audit by the Federal Court of Audit, under the terms of Law 13,488/2017.
Following the applications for extensions referred to above, Law No. 13,448/2017 was enacted following the conversion into law of Provisional Measure No. 752/2016 which defines the general rules governing extensions of concessions, including early renewals, as well as rebidding of partnership contracts of the federal public administration pursuant to the provisions of Law No. 13,334/2016 in the road, rail and airport sectors. Pursuant to the terms of the new law, the granting authority will perform rebidding if there is a breach of contract or if the concession holders are no longer capable of fulfilling the contractual and financial obligations originally undertaken. In the case of early renewals, rail concession holders must demonstrate provision of adequate services, including compliance with production and safety targets or of safety targets set forth in the applicable contracts, pursuant to the provisions of article 6, paragraph 2 of Law No. 13,448/2017. In addition, contract amendments must contain a timeline for required investments and include measures to discourage potential noncompliance or delay in complying with obligations (such as the annual rebalancing discount and the additional grant payment).
We cannot guarantee that Rumo’s requests for renewals will be successful or that they will occur within the timeframe which we anticipate. In addition, any early renewal may be subject to certain conditions precedent or the applicable concessions may be renewed on terms less favorable than those currently in place. Rumo may also face significant competition from third parties if the granting authority decides to subject our maturing concessions to a rebidding process.
Rumo may incur additional liabilities if it obtains an early renewal of the Malha Paulista concession agreement, currently under review by the ANTT.
Malha Paulista’s concession agreement is due to expire in 2028. In September 2015, Rumo filed a formal request with the ANTT for early renewal of such concession agreement. The extension request was duly approved by ANTT and is currently under audit by the Federal Court of Audit, under the terms of Law 13,488/2017 If, following the analysis by the Federal Court of Audit, the ANTT and Rumo execute an amendment to Malha Paulista’s concession agreement, it is estimated that, in addition to the investment commitments provided for in our business plan, Malha Paulista may incur additional liabilities currently estimated by the ANTT to be in an amount of approximately R$1 billion. Once the value of these liabilities has been confirmed, Rumo may, pursuant to (i) applicable legislation and (ii) clause 6.2 of the draft of the amendment to the Malha Paulista’s concession agreement (the public consultation procedure for which has already been completed by the ANTT), enter into an agreement with the ANTT whereby instead of indemnifying the ANTT for such liabilities, we would be required to invest a substantial amount in our rail networks (both within Malha Paulista and in other parts of our logistics business).
Rumo’s Brazilian rail tariffs are subject to a maximum rate established by the Brazilian government.
Under Rumo’s rail network concession agreements, tariffs for our rail freight services are subject to a maximum rate. Maximum tariff rates that Rumo is allowed to charge are adjusted for inflation according to variations in theIGP-DI index (or a substitute index) in accordance with applicable Brazilian law or concession agreements. Currently, tariff adjustments are performed on an annual basis, at different months of the year, depending on the terms of each concession agreement. Additionally, the tariffs Rumo charges for rail freight services on our rail network can be revised upwards or downwards if there is a justified, permanent market and/or costs change that may alter the rail network concession agreements’ economic and financial balance, or as determined by the Brazilian government every five years. The mechanisms for restoring the financial balance are defined in Brazilian law or in the agreements and must be requested by thenon-breaching party along with adequate economic evidence. Rumo’s tariffs are currently below the maximum tariff levels allowable under Rumo’s concession agreements. In 2012, the ANTT implemented a review of reference rates that altered the original methodology for defining such rates. The use of revised rate charts could affect Rumo’s capacity to generate revenues, as such review revised most rates downwards and established a cap for Malha Norte, which originally was not subject to a cap. Before Cosan S.A., through its then subsidiary Rumo Logística, acquired 100% of the common shares of ALL on April 1, 2015, ALL obtained an injunction suspending the application of such revised rate charts by the ANTT and, therefore, is not subject to them. However, we cannot assure you that in the future tariffs will be set at a level that would permit Rumo to continue to operate profitably.
30
Rumo may become subject to additional stringent environmental requirements.
In September 2016, the environmental agency of the state of São Paulo (Companhia de Tecnologia de Saneamento Ambiental or “CETESB”) enacted a regulation (Board Decision No. 210/2016/I/C) requiring private ports in the state of São Paulo to comply with more stringent requirements with respect to environmental permits. As a result, Rumo received notifications requiring it to present a regularization plan to CETESB, setting forth how Rumo proposes to comply with these more stringent requirements. This regularization plan was submitted to CETESB on June 12, 2017 and Rumo expects that it will form the basis of an agreement between it and CETESB. However, there can be no assurance that such an agreement will be reached.
Rumo is unable to estimate the amounts it may have to spend in order to fully implement the regularization plan to be presented to CETESB. If these amounts are significant, Rumo’s business, operating results and financial condition could be materially and adversely affected.
We are subject to extensive environmental regulation.
Our business activities in Brazil are subject to extensive laws and regulations concerning environmental protection, which impose on us various environmental obligations, such as environmental licensing requirements, standards for the release of effluents, management of solid waste, protection of certain areas (including Legal Reserve, indigenous areas,quilombolas community areas, conservation units, archeological sites and permanent preservation areas), and the need for special authorizations for the use of water, among others.
The failure to comply with such laws and regulations (including failure to obtain or maintain the relevant environmental permits) may subject the violator to administrative fines, mandatory interruption of activities and criminal sanctions, in addition to the obligation to cure and pay environmental and third-party damage compensation, without any caps. In addition, Brazilian environmental law adopts a joint and several and strict liability system for environmental damages, which makes the polluter liable regardless of fault or intentional misconduct and would make us jointly and severally liable for the obligations of our producers oroff-takers. If we become subject to environmental liabilities, any costs we may incur to rectify possible environmental damage would lead to a reduction in the financial resources which would otherwise remain at our disposal for current or future strategic investment, thus causing an adverse impact on us.
As environmental laws and their enforcement become increasingly stringent, our expenses for complying with environmental requirements are likely to increase in the future. Furthermore, the possible implementation of new regulations, changes in existing regulations or the adoption of other measures could cause the amount and frequency of our expenditures on environmental preservation to vary significantly compared to present estimates or historical costs. Any unplanned future expenses could force us to reduce or forego strategic investments and as a result could materially and adversely affect us.
The occurrence of environmental damage may lead to the need to make significant financial resources available for both containment and repair of these damages. The occurrence of such events may also lead to a disruption in production due to intervention by government agencies. In either case, financial and/or image impacts may be significant. In addition, the creation of new regulations may lead to the need for greater expenses with environmental preservation. Furthermore, extensive environmental regulation can also lead to delays in the implementation of new projects as bureaucratic procedures for obtaining environmental licenses from various government agencies may take considerable time.
The realization of any of these risks may have a material adverse effect on our business, results of operations or financial condition.
We cannot predict the outcome of an investigation into the conduct of former employees of ALL prior to its acquisition by Rumo.
During the course of 2016, Rumo became aware of certain press reports alleging that improper payments to government officials were made by former employees of ALL (prior to being acquired by Rumo) in connection with an investment byFundo de Investimento do Fundo de Garantia do Tempo de Serviço, or“FI-FGTS,” in Rumo’s indirect subsidiary Brado Logística and in ALL. As a result of these allegations, Rumo has engaged external legal counsel and consultants to conduct an internal investigation. The report of the investigation was submitted to the Federal Prosecutor’s Office (without being made available to the Company, in accordance with the terms of the engagement). At this time, we can neither predict the outcome of the internal investigation, the consequences of any findings or any measures that may be taken by local authorities, any of which may have a material adverse effect on Rumo.
31
Rumo may not have access to new financing on favorable conditions to meet its capital needs and fulfill its financial obligations.
Rumo relies on obtaining financing and refinancing of existing loans, particularly from BNDES, in order to operate its business, implement its strategy and grow its business. Rumo needs bank guarantees to obtain credit facilities from both BNDES and banks, and typically needs insurance guarantees in order to participate in court proceedings to which it is a party. Recent disruptions in the global credit markets and their effect on the global and Brazilian economies could affect Rumo’s ability to raise capital and materially and adversely affect Rumo’s business.
Substantial volatility in the global capital markets, unavailability of financing in the global capital markets at reasonable rates and credit market disruptions have had a significant negative impact on financial markets, as well as on the global and domestic economies. In particular, the cost of financing in the global debt markets has increased substantially, greatly restricting the availability of funds in such markets. Further, volatility in the markets has led to increased costs for obtaining financing in the credit markets, as many creditors have raised interest rates, adopted more rigorous loan policies, reduced volume and, in some cases, ceased offering financing to borrowers on reasonable terms.
If Rumo is unable to obtain new financing or to refinance existing loans when necessary, or obtain or renew insurance guarantees on reasonable terms or at all, Rumo may not be able to comply with its financial obligations or explore business opportunities. This would have a material adverse effect on Rumo’s business, financial condition and results of operations.
Rumo may not be successful in reducing operating costs and increasing operating efficiencies.
Rumo may not be able to achieve expected cost savings, which rely on several factors such as rail track prices, railroad ties, fuel, iron, engineering and other resources required for our operations. Given the competitive markets in which Rumo operates, it is likely that it will not be able to pass increases in costs of materials onto the price of our services (including as a result of limits applying to our tariffs), which would materially and adversely affect its financial performance.
Rumo may not have sufficient funds to invest in technology, which may adversely affect Rumo’s ability to increase its rail transportation capacity and reduce accidents.
The development and implementation of new technologies may result in a significant reduction in the cost of logistics services and a reduction in accidents. We cannot predict when new technologies may become available, the rate of acceptance of new technologies by competitors or the costs associated with such new technologies. Rumo may not have enough funds to keep up with advances in technology, which could reduce demand for the logistics services Rumo provides and affect Rumo’s capacity to reduce accidents in its activities.
The exercise of an option granted under the shareholders’ agreement of one of Rumo’s subsidiaries, Brado Logística, may have a material adverse effect on Rumo’s financial condition or result in a dilution of Rumo’s shareholders’ equity interest.
Fundo de Investimento do Fundo de Garantia do Tempo de Serviço, or“FI-FGTS,” Logística Brasil — Fundo de Investimento em Participações, or “FIP – BRZ,” Deminvest Empreendimentos e Participações S.A, or “Deminvest,” Markinvest Gestão de Participações Ltda., or “Markinvest” and Brado Holding S.A., or “Brado Holding,” are parties to a shareholders’ agreement governing the investment in Brado Logística, Rumo’s subsidiary active in the intermodal container logistics sector, or the “Brado Shareholders’ Agreement.” Markinvest, FIP – BRZ and Deminvest are jointly referred to as the “Original Shareholders.” Brado Holding,FI-FGTS and the Original Shareholders are jointly referred to as the “Brado Shareholders.”
The Brado Shareholders’ Agreement provides that, to the extent the initial public offering of Brado LP has not occurred prior to March 31, 2014, the Brado Shareholders are entitled to swap the totality of their shares in Brado Logística for, at the discretion of the Brado Shareholders (1) shares as provided for in the Brado Shareholders’ Agreement, or (2) an amount corresponding to the market value of such shares. The exchange ratio would be based on fair market value. If the Brado Shareholders do not reach consensus on the appraisal thereof, the fair market value would be based on independent appraisals carried out as provided for in the Brado Shareholders’ Agreement.
The option described above became exercisable on April 1, 2014 and was exercised on each of April 20 and 23, 2015. There is an ongoing confidential arbitration proceeding against Rumo relating to the appraisal reports prepared by financial institutions appointed pursuant to the shareholders’ agreement of Brado Logística and the type of consideration (money or shares) due as a result of the exercise of the option.
32
In addition, the exercise of the option byFI-FGTS may occur between the fifth and the seventh anniversary of the date of signing of the Brado Shareholders’ Agreement (which was August 5, 2013).FI-FGTS will lose the right to exercise its option if the aforementioned initial public offering is undertaken (even if such initial public offering is undertaken after the aforementioned dates).
The exercise of the option may result in: (1) disbursement of material amounts by Rumo, which may adversely affect Rumo’s results of operations and financial condition; or (2) the issuance of new shares by Rumo in a quantity which may dilute the equity interests held by Rumo’s shareholders.
Downturns in certain cyclical market sectors in which Rumo’s customers operate could have a material adverse effect on Rumo’s business.
The transportation and logistics industries are highly cyclical, generally tracking the cycles of the world economy. Accordingly, the transportation industry is affected by macroeconomic conditions and by various factors within each particular industry that may influence operating results. Some of Rumo’s customers do business in highly cyclical markets, including the oil and gas and agricultural sectors.
Soybean harvests generally occur between January and May, corn harvests (mainly for export) generally occur between April and July and sugar harvests generally occur between March and November. For this reason, Rumo typically transports larger volumes of goods in the second and third quarters of each year and lower volumes in the “off season” (i.e., the first and fourth quarters of each year).
Any downturn in these industries may have a material adverse effect on Rumo’s business, results of operations and financial condition. In addition, some of the products Rumo transports have shown a historical pattern of price cyclicality, which has typically been influenced by the general economic environment, industry capacity and demand. We cannot assure you that prices and demand for these products will not decline in the future, adversely affecting those industries and, in turn, Rumo’s business, results of operations and financial condition.
Rumo operates in a competitive industry, and if it is unable to adequately address factors that may adversely affect its revenue and costs, Rumo’s business could suffer.
An increase in competition may reduce our revenues and result in smaller profit margins or the loss of market share. Our business, financial condition and results of operations may be adversely affected if we are not able to adequately compete in the market.
Competition in the transportation services industry is intense and includes:
| | • | | competition with other transportation modes, such as road freight; |
| | • | | competition with alternative export options for agricultural products through other ports (particularly in the northern region of Brazil) to the detriment of the ports of Santos (state of São Paulo), Paranaguá (state of Paraná) and São Francisco do Sul (state of Santa Catarina); |
| | • | | dependence on operating quality and port and terminal capacity; |
| | • | | the limitations established by the maximum tariffs established by the ANTT; |
| | • | | a reduction in road tariffs, particularly during times of declining growth rates in the economy or low demand from agricultural producers, which may limit Rumo’s ability to maintain or increase rates, operating margins or growth of its business; and |
| | • | | establishment of cooperative relationships by Rumo’s competitors to increase their ability to address shipper needs. |
Rumo’s main competitors are companies in the truck transportation business, which has historically been the main cargo transportation mode in Brazil. According to the CNT, trucks transported 60% of Brazil’s production in 2018, while only 15% of that production was transported by rail. Although Rumo is expanding our intermodal services via truck transportation, any new measures by the Brazilian government that lower costs for road transportation, such as cheaper toll fares or permanent suspension of the toll-road concession program, may limit Rumo’s growth prospects.
New measures by the Brazilian government that benefit or reduce costs for road transportation, such as cheaper toll fares or permanent suspension of the toll-road concession program, may limit our growth prospects.
33
Increased competition may lead to decreases in Rumo’s revenues, smaller profit margins or loss of market share. If Rumo is unable to address any of these adequately, it may adversely impact Rumo’s business, financial condition and results of operations.
Rumo operates in a regulated environment, and measures taken by public authorities may impact Rumo’s activities.
The rail services which Rumo provides are regulated and supervised by the Brazilian government and in particular by the Brazilian Ministry of Infrastructure as well as the ANTT. The ANTT regulates various aspects of the business of companies active in the Brazilian rail sector, including with regards to requirements for investments, expenses, determination of revenue and the setting of tariffs in order to guarantee regularity, continuity, efficiency, safety and affordability. These activities are intensely regulated through laws, decrees, provisional measures, ordinances, resolutions and other regulatory and legislative actions. Changes to legislation or regulation relating to the rail sector may adversely affect Rumo’s business, financial results and operating results.
In addition, Rumo’s railroad concession agreements have been originally entered into with the Brazilian Ministry of Transportation (currently known as the Brazilian Ministry of Infrastructure) (acting as granting authority when the grants took place), later substituted by the ANTT after the enactment of Federal Law No. 10,233/2001. Rumo’s operations take place in a highly regulated environment because concessions agreements are administrative contracts. Such contracts are therefore subject to public law, which gives the granting authority the right to: (1) amend the contracts unilaterally when in the public interest (while respecting the rights under the contract); (2) rescind the contracts unilaterally in the instances provided for in Law No. 8,666/1993; (3) supervise the execution of the contracts; and (4) impose sanctions in the case of partial or completenon-compliance with the adjustment (among other instances).
Therefore, notwithstanding the concessionaire’s right to maintain the financial balance of the concession agreement, actions taken by the public administration in general may affect the services rendered by Rumo. For example, if (1) new obligations are imposed; (2) additional investments not originally provided for in the concession agreements are required as a result of unilateral measures provided for in the statute or through the creation of new regulations by the ANTT; and (3) the scope of the concession agreements is reduced or certain actions taken by us are rejected or not given effect (such as anticipated concession renewals, extensions of grants in force or extensions under conditions not favorable to us), Rumo’s economic and financial condition and operating results may be adversely affected.
We cannot predict which actions the Brazilian government will take in the future and how such actions will affect Rumo’s operating results. If Rumo is required to conduct its business in a manner substantially different from that contemplated in Rumo’s business plan, Rumo’s financial and operating results may be adversely affected.
We are exposed to the possibility of losses related to natural disasters, catastrophes, accidents, fire and other events not in our control, which may have a material adverse effect on our financial performance.
Our operations are subject to certain risks that affect our properties, facilities, permanent passageways, rail banks and inventory, including, among others, fire, which may destroy machinery, equipment and facilities, as well as client cargo being transported. Fires, explosions, fuel leaks and other flammable products as well as other environmental events, cargo loss or damage, railroad, cargo loading and unloading terminal, accidents, business interruptions due to political events as well as labor claims, demonstrations by social and/or environmental groups or associations, strikes (of our own employees or of those linked to entities with which we have a relationship, such as port operators), adverse weather conditions and natural disasters, such as floods, may result in the loss of revenues, assumption of liabilities or cost increases. Moreover, our operations may be periodically affected by crop shortfalls, landslides and other natural disasters.
Our transportation and handling of cargo exposes us to risks of catastrophes, mechanical and electrical failures, collisions and loss of assets. A portion of our freight activities involves petroleum products and other flammable materials, and the presence of such products may aggravate the effects of any catastrophe.
Because our insurance does not cover all potential risks and losses we may incur, the occurrence of a natural disaster of large proportions, catastrophes, mechanical failures, loss of assets or any other of the events referred to above, and any resulting damage to our business, may have a material adverse effect on our business, operating results and financial condition, including as a result of civil, administrative and/or criminal sanctions relating to environmental liability (including civil, administrative and/or criminal sanctions of such nature imposed on our management).
34
We are exposed to credit and other counterparty risks of our customers in the ordinary course of our business.
We have various credit terms with various types of customers, including fuel distributors, wholesalers, retailers, trading companies and consumers of the energy which we generate or trade. Our customers have varying degrees of creditworthiness and are subject to different rules and regulations. We are therefore exposed to the risk of nonpayment or other default under our contracts and other arrangements with them.
As part of our relationship with our customers, we set different credit conditions for each customer based on their perceived creditworthiness. Economic conditions may also affect our customers’ ability to meet their obligations to us. In addition, we are also exposed to other types of counterparty risk, including reputational risk, as well as risks relating to money laundering, embargos, breaches of labor regulations and other related matters.
In the event that a significant number of material customers default on their payment obligations to us, our financial condition, results of operations or cash flows, could be materially and adversely affected. Any of these risks could have an adverse effect on our business, financial condition and results of operations.
Our inability to post judicial collateral or provide guarantees in pending legal or administrative proceedings could have a material adverse effect on our business, financial condition and results of operations.
We may not have sufficient funds to post collateral or provide guarantees in judicial or administrative proceedings involving substantial amounts. Even if we do not post such collateral or provide guarantees, we will be liable for paying any amounts due pursuant to any unfavorable outcomes in legal proceedings. We cannot assure you that, if we cannot make such payments, our assets, including financial assets, will not be attached, or that we will be able to obtain tax good standing certificates, all of which may have a material adverse effect on our business, financial condition and results of operations.
We are subject to anti-corruption, anti-bribery, anti-money laundering and other international trade laws and regulations.
We are subject to anti-corruption, anti-bribery, anti-money laundering and other international trade laws and regulations. We are required to comply with the laws and regulations of Brazil and various jurisdictions where we conduct operations. In particular, we are subject to the Brazilian Anti-corruption Law nº 12.846, to the U.S. Foreign Corrupt Practices Act of 1977, or the “FCPA,” to the United Kingdom Bribery Act of 2010, as well as economic sanction programs, including those administered by the United Nations, the European Union and the United States, including the U.S. Treasury Department’s Office of Foreign Assets Control, or “OFAC.” The FCPA prohibits providing anything of value to foreign officials for the purposes of obtaining or retaining business or securing any improper business advantage. As part of our business, we may deal with entities and employees which are considered foreign officials for purposes of the FCPA. In addition, economic sanctions programs restrict our dealings with certain sanctioned countries, individuals and entities. Although we have internal policies and procedures designed to ensure compliance with applicable anti-fraud, anti-bribery and anti-corruption laws and sanctions regulations, potential violations of anti-corruption laws have been identified on occasion as part of our compliance and internal control processes. When such issues arise, we attempt to act promptly to learn relevant facts, conduct appropriate due diligence, and take any appropriate remedial action to address the risk. Given the size of our operations and the complexity of the production chain, there can be no assurance that our internal policies and procedures will be sufficient to prevent or detect all inappropriate practices, fraud or violations of law by our employees, directors, officers, partners, agents and service providers or that such persons will not take actions in violation of our policies and procedures (or otherwise in violation of the relevant anti-corruption laws and sanctions regulations) for which we or they may be ultimately held responsible. Violations of anti-bribery and anti-corruption laws and sanctions regulations could have a material adverse effect on our business, reputation, results of operations and financial condition. In addition, we may be subject to one or more enforcement actions, investigations and proceedings by authorities for alleged infringements of these laws. These proceedings may result in penalties, fines, sanctions or other forms of liability and could have a material adverse effect on our reputation, business, financial condition and results of operations.
Funding, especially on terms acceptable to us, may not be available to meet our financial obligations and future capital needs.
We rely on obtaining financing and refinancing of existing loans in order to operate our business, implement our strategy and grow our business. We need bank guarantees to obtain credit facilities and we typically need insurance guarantees in order to participate in court proceedings to which we are a party.
If we are unable to obtain new financing or to refinance existing loans when necessary, or obtain or renew insurance guarantees on reasonable terms or at all, we may not be able to comply with our financial obligations or explore business opportunities, and responding to competitive pressures may become challenging. This would have a material adverse effect on our business, financial condition and results of operations.
35
We operate in industry sectors that require significant financial resources that will require access to the capital markets and bank financing in significant volumes to meet our investment objectives.
We obtain funds for our activities through loans from financial institutions, domestic and foreign lenders, and through access to the capital markets. Our ability to obtain funding to finance our growth or operate our business depends on several factors, including our level of indebtedness and market conditions. Global market and economic conditions have been, and continue to be, disruptive and volatile. The debt capital markets have been impacted by significant write-offs in the financial services sector and there-pricing of credit risk, sovereign defaults, political and economic developments in and affecting Brazil such as the “Lava Jato” scandal, among other things. These events have negatively affected general economic conditions. During that period, the cost of raising money in the debt capital markets has increased substantially while the availability of funds from those markets for Brazilian companies has diminished significantly. Also, as a result of concerns about the stability of financial markets generally and the solvency of counterparties specifically, the cost of obtaining money from the credit markets has increased as many lenders and institutional investors have increased interest rates, enacted tighter lending standards and reduced and, in some cases, ceased to provide funding to borrowers on commercially reasonable terms or at all. Our failure to obtain the necessary resources on reasonable terms may adversely affect our investment strategy. If we decide to increase our debt levels, we may be subject to risks, including our inability to pay outstanding debt, which may adversely affect our financial condition.
In addition, in connection with any new indebtedness we incur, we may be required to meet certain covenants in our financing arrangements, such as maintaining financial ratios, and may be subject to restrictions on our ability to incur new debt or make new investments. A breach of these covenants may result in a mandatory prepayment or acceleration of the maturity of our outstanding debt. In the event of a prepayment or acceleration, our assets and cash flow might not be sufficient to pay the full amount due, which would have a material adverse effect on our financial condition.
Our debt level could adversely affect our financial health and prevent us from fulfilling our debt obligations, which would reduce our ability to raise capital to finance our investments and operations and would adversely impact our ability to recover from economic changes.
Our debt level and the composition of our debt could, among other things: (1) require us to reserve a substantial part of our operational cash flows to pay principal and interest on our debt, which will reduce the availability of our cash flow to fund working capital, capital expenditures, acquisitions and investments; (2) limit our flexibility in planning for, or reacting to, changes in our business and the industries in which we operate; (3) limit our ability to borrow additional funds, obtain bank guarantees or collateral insurance and generally increase our borrowing costs; and (4) place us at a competitive disadvantage compared to our competitors that have less debt.
Any of the aforementioned developments could have a material adverse effect on us, our financial condition and our results of operations.
We may be unable to comply with restrictive covenants under our financing agreements.
We are subject to certain restrictive covenants based on certain financial andnon-financial indicators which are set forth in the majority of the indebtedness and finance agreements to which we are a party. The majority of such covenants relate to requirements to comply with certainpre-determined levels of leverage.
Any failure by us to comply with the restrictive covenants in our credit agreements as a result of adverse conditions in our business environment may trigger the acceleration of part of our indebtedness, limit our access to new credit facilities as well as adversely affect our business and results of operations.
We may not effectively manage risks associated with the replacement of benchmark indices.
Interest rate, equity, foreign exchange rate and other types of indices which are deemed to be “benchmarks” are the subject of increased regulatory scrutiny. In 2017, the United Kingdom’s Financial Conduct Authority, or the FCA, announced that it will no longer persuade or compel banks to submit rates for the calculation of the London interbank offered rate (“LIBOR”) benchmark after 2021. This announcement indicates that the continuation of LIBOR on the current basis cannot and will not be guaranteed after 2021, and it appears likely that LIBOR will be discontinued or modified by 2021. This and other reforms may cause benchmarks to reform differently than in the past, or to disappear entirely, or have other consequences which cannot be fully anticipated which introduces a number of risks for us including legal risks arising from potential changes required to documentation for new and existing transactions and financial risks arising from any changes in the valuation of financial instruments linked to benchmark rates, pricing risks arising from how changes to benchmark indices could impact pricing mechanisms on some instruments. Accordingly, it is not currently possible to determine whether, or to what extent, any such changes would affect us. However, the implementation of alternative benchmark rates may have a material adverse effect on our business, results of operations, financial condition and prospects.
36
We may raise additional capital in the future for strategic partnerships or by issuing securities, which may result in a potential dilution of your equity interest.
We are constantly analyzing alternatives and considering the possibility of entering into strategic partnerships, disposing of assets, raising additional capital through a public or private issuance of shares and/or securities convertible into or exchangeable for shares. Any strategic partnership, issuance or placement of shares and/or securities convertible into or exchangeable for shares may affect the market price of our shares and could result in dilution of your equity interest.
Our insurance coverage may be inadequate to cover all losses and/or liabilities that may be incurred in our operations.
Our operations are subject to a number of hazards and risks. We maintain insurance at levels that are customary in our industry to protect against these liabilities; however, our insurance may not be adequate to cover all losses or liabilities that might be incurred in our operations.
For example, we do not maintain coverage for business interruptions of any nature for our Brazilian operations, including business interruptions caused by labor disruptions. If, for instance, our workers were to strike, the resulting work stoppages could have a material and adverse effect on us. Similarly, we do not insure most of our assets against war or sabotage. Therefore, an attack or an operational incident causing an interruption of our business could have a material and adverse effect on our financial condition or results of operations.
Moreover, we will be subject to the risk that we may not be able to maintain or obtain insurance of the type and amount desired at reasonable rates. If we were to incur a significant liability for which we were not fully insured, it could have a materially adverse effect on our business, financial condition and results of operations.
Any failure relating to our strategic partnerships may result in additional financial or performance obligations by us, which would reduce our profitability.
We may enter into strategic partnerships, joint ventures, combinations, alliances and collaborations, including, among other things, partnerships with our customers. The success of these and other partnerships depends, in part, on the satisfactory performance of our and our partners’ obligations.
If we or our partners do not satisfactorily perform such obligations, our strategic partnerships may fail to perform as expected or to deliver the agreed services. Should this occur, we may be required to make additional investments and provide additional services to guarantee the adequate performance and delivery of the agreed services, or terminate such partnerships prior to their stated maturity. The performance by us of additional obligations with respect to our strategic partnerships may result in the reduction of our profits and material losses to us.
Likewise, the failure of our strategic partners to fulfill their obligations under our partnership agreements may have a material adverse effect on such partnerships. In addition, the failure to reach an agreement as to certain matters may result in deadlock pursuant to certain of the shareholders’ and other agreements governing our strategic partnerships.
Strategic partnerships are essential to the continuity of our operations and our growth. If we fail to maintain our existing partnerships or identify new partnerships, our business, financial condition and results of operations may be materially and adversely affected.
We are highly dependent on our chairman and other members of our management to develop and implement our strategy and to oversee our operations.
We are dependent upon our chairman and controlling shareholder, other members of senior management and certain members of our board of directors, especially with respect to business planning, strategy and operations. If any of these key members of our management leaves our Company, our business and financial performance may be negatively affected. Our business is particularly dependent on our chairman, who is also our controlling shareholder. We currently do not carry any key man insurance.
37
We are indirectly controlled by a single individual who has the power to control us.
Our controlling shareholder and chairman has the power to indirectly control us, including the power to:
| | • | | elect a majority of our directors and appoint our executive officers, set our management policies and exercise overall control over our Company and subsidiaries; |
| | • | | agree to sell or otherwise transfer his controlling stake in our Company; and |
| | • | | determine the outcome of substantially all actions requiring shareholder approval, including transactions with related parties, corporate reorganizations, acquisitions and dispositions of assets, and dividends. |
Currently, because of our share capital structure, our controlling shareholder is able to control substantially all matters submitted to our shareholders for a vote or approval even if the controlling shareholder comes to own less than 50% of our issued and outstanding share capital. The concentrated control will limit your ability to influence corporate matters and, consequently, we may take actions that our shareholders do not view as beneficial. Moreover, our controlling shareholder may make decisions that are contrary to the interests of our other shareholders, and diverge from those minority shareholders. These may include actions to conduct acquisitions, divest assets, engage in new business partnerships and engage in new financings or similar operations. As a result, the market price of our shares could be adversely affected.
We operate in industry sectors that require significant financial resources that will require access to the capital markets and bank financing in significant volumes to meet our investment objectives.
We obtain funds for our activities through loans from financial institutions, domestic and foreign lenders, and through access to the capital markets. Our ability to obtain funding to finance our growth or operate our business depends on several factors, including our level of indebtedness and market conditions. Global market and economic conditions have been, and continue to be, disruptive and volatile. The debt capital markets have been impacted by significant write-offs in the financial services sector and there-pricing of credit risk, sovereign defaults, political and economic developments in and affecting Brazil such as the “Lava Jato” scandal, among other things. These events have negatively affected general economic conditions. In particular, the cost of raising money in the debt capital markets has increased substantially while the availability of funds from those markets for Brazilian companies has diminished significantly. Also, as a result of concerns about the stability of financial markets generally and the solvency of counterparties specifically, the cost of obtaining money from the credit markets has increased as many lenders and institutional investors have increased interest rates, enacted tighter lending standards and reduced and, in some cases, ceased to provide funding to borrowers on commercially reasonable terms or at all. Our failure to obtain the necessary resources on reasonable terms may adversely affect our investment strategy. If we decide to increase our debt levels, we may be subject to risks, including our inability to pay outstanding debt, which may adversely affect our financial condition.
In addition, in connection with any new indebtedness we incur, we may be required to meet certain covenants in our financing arrangements, such as maintaining financial ratios, and may be subject to restrictions on our ability to incur new debt or make new investments. A breach of these covenants may result in a mandatory prepayment or acceleration of the maturity of our outstanding debt. In the event of a prepayment or acceleration, our assets and cash flow might not be sufficient to pay the full amount due, which would have a material adverse effect on our financial condition.
Volatility in the price of the products we sell may have a material adverse effect on us.
Our results of operations may be significantly affected by volatility in the prices of the products we sell. The prices of these products are subject to significant fluctuation as a result of domestic and international demand, production volumes and global stock levels. Price volatility may have a significant impact on our results of operations, particularly if our revenues fall below our production costs.
The prices at which we are able to sell our products depend on market conditions, both in Brazil and internationally, which are outside of our control. The prices at which we are able to sell our products have a significant impact on our results of operations. As is the case with other commodities, the prices of the products we sell are subject to significant fluctuation as a result of natural disasters, harvest levels, agricultural investments, governmental policies (in particular with regards to the agricultural sector), trade policies, changes in supply and demand patterns, increases or decreases in purchasing power, the production of similar or competing products and other factors beyond our control. A significant portion of our products are also traded on commodities exchanges and their prices may therefore be affected by speculation on financial markets.
38
In addition, the price of sugar is also affected by the obligation to comply with certain requirements relating to exports and the consequent effects on supply within Brazil. As a result, the price of sugar has historically been subject to greater volatility than the prices of other products. Sugar prices may decrease as a result of, directly or indirectly, competition from alternative sweeteners, include saccharine and high-fructose corn syrup, changes in agricultural policies or international or Brazilian trade policies (including those mandated by the World Trade Organization).
Any significant or prolonged decrease in the price of sugar and/or ethanol may have adverse effects on our business, financial condition and results of operations.
Risks related to developments in international trade may negatively affect our business.
Sugarcane derivatives such as sugar and ethanol are key commodities as sugar is consumed as food in several countries and ethanol accounts for a significant portion of the energy consumption of Brazil and certain other countries. As is the case with other commodities, the prices of sugarcane derivatives in international markets may fluctuate as a result of the imposition of tariff andnon-tariff barriers, such as embargos, sanitary restrictions, quotas, taxes, international trade disputes and other matters. Any fluctuation in the price of sugarcane derivatives as a result of developments in international trade may affect our ability to produce, sell and/or export our products and consequently have a material adverse effect on our business, financial condition and results of operations.
Raízen Combustíveis may not be able to successfully integrate the operations of Shell Argentina and faces other risks associated with the acquisition.
Raízen Combustíveis may not be able to successfully integrate Shell Argentina into its business, or successfully implement appropriate operational, financial or administrative systems and controls to achieve the benefits that we expect to result from the acquisition of Shell Argentina. The risks faced by Raízen Combustíveis include but are not limited to: (1) failure of Shell Argentina to achieve expected results; (2) inability to retain key personnel of Shell Argentina; (3) failure to successfully migrate Shell Argentina’s current customer and supplier relationships to the business as acquired by us; and (4) possible inability to achieve expected synergies or economies of scale. In addition, the business of Shell Argentina could cause interruption of, or loss of momentum in, the activities of the existing business of Raízen Combustíveis. The diversion of our management’s attention and any delays or difficulties encountered in connection with the integration of Shell Argentina could adversely affect the business, results of operations or prospects of Raízen Combustíveis.
The acquisition of Shell Argentina also exposes Raízen Combustíveis to the risk that it will inheritpre-existing business, labor, environmental or other issues which may result in temporary shutdowns, labor disputes, obligations to compensate third parties for environmental damage or repair environmental damage or which may otherwise have an adverse effect on Raízen Combustíveis if not managed properly.
In addition, the acquisition of Shell Argentina may expose Raízen Combustíveis to successor liability relating to certain prior actions of Shell Argentina and its management or certain contingent liabilities incurred prior to its involvement. It will also expose Raízen Combustíveis to certain liabilities associated with ongoing operations (including, without limitation, environmental liabilities), especially to the extent that Raízen Combustíveis is unable to adequately and safely manage such acquired operations. Also, undisclosed liabilities from the acquisition of Shell Argentina may harm the financial condition and operating results of Raízen Combustíveis.
Risks Related to Our Common Shares
We are a Bermuda company, and it may be difficult for you to enforce judgments against us or our directors and executive officers.
We are a Bermuda exempted company, so that the rights of holders of our shares will be governed by Bermuda law and ourbye-laws. The rights of shareholders under Bermuda law may differ from the rights of shareholders of companies incorporated in other jurisdictions. All of our directors and some of the experts referred to in this annual report are not citizens or residents of the United States, and most of our assets are located outside the United States. As a result, it may be difficult for investors to effect service of process on those persons in the United States or to enforce judgments obtained in U.S. courts against us or those persons based on the civil liability provisions of the U.S. federal or state securities laws. We have been advised by our Bermuda counsel, ASW Law Limited, that uncertainty exists as to whether courts in Bermuda will enforce judgments obtained in other jurisdictions, including the United States, against us or our directors or officers under the securities laws of those jurisdictions or entertain actions in Bermuda against us or our directors or officers under the securities laws of other jurisdictions. The United States and Bermuda do not currently have a treaty providing for the reciprocal recognition and enforcement of judgments in civil and commercial matters. Therefore, a final judgment for the payment of money rendered by any federal or state court in the United States based on civil liability, whether or not based solely on U.S. federal or state securities laws, may not necessarily be enforceable in Bermuda.
39
Bermuda law differs from the laws in effect in the United States and Brazil and may afford less protection to shareholders.
Our shareholders may have more difficulty protecting their interests than shareholders of a company incorporated in the United States or Brazil. As a Bermuda company, we are governed by the Companies Act 1981. The Companies Act 1981 differs in material respects from laws generally applicable to U.S. or Brazilian corporations and their shareholders, including the provisions relating to interested directors, amalgamations, takeovers, shareholder lawsuits and indemnification of directors.
Under Bermuda law, directors and officers of a company generally owe fiduciary duties to the company and not to individual shareholders. Class actions and derivative actions are generally not available to shareholders under Bermuda law. The Bermuda courts may, however, in certain circumstances permit a shareholder to commence an action in the name of a company to remedy a wrong to the company where the act complained of is alleged to be beyond the corporate power of the company or illegal, or would result in the violation of the company’s memorandum of association orbye-laws. Consideration would be given by a Bermuda court to acts that are alleged to constitute a fraud against the minority shareholders or, for example, where an act requires the approval of a greater percentage of the company’s shareholders than that which actually approved it. The Companies Act 1981 imposes a duty on directors and officers to act honestly and in good faith with a view to the best interests of the company and to exercise the care and skill that a reasonably prudent person would exercise in comparable circumstances. Directors of a Bermuda company have a duty to avoid conflicts of interest. However, if a director discloses a direct or indirect interest in any contract or arrangement with us as required by Bermuda law, ourbye-laws provide that such director is entitled to be counted for quorum purposes, but may not vote in respect of any such contract or arrangement in which he or she is interested. In addition, the rights of our shareholders and the fiduciary responsibilities of our directors under the Companies Act 1981 are not as clearly established as under statutes or judicial precedent in jurisdictions in the United States, particularly in the State of Delaware.
Provisions in ourbye-laws may discourage takeovers, which could affect the return on the investment of our shareholders.
Ourbye-laws contain provisions that could make it more difficult for a third party to acquire us without the consent of our board of directors. These provisions provide, among other things, for:
| | • | | a classified board of directors with staggered three-year terms; |
| | • | | restrictions on the time period in which directors may be nominated; |
| | • | | the affirmative vote of a majority of our directors in office and the resolution of the shareholders passed by a majority of votes cast at a general meeting or, if not approved by a majority of the directors in office, the resolution of the shareholders at a general meeting passed by 66 and 2/3% of all votes attaching to all shares then in issue for amalgamation and other business combination transactions; and |
| | • | | thetag-along rights described under “Item 10. Additional Information—B. Memorandum andBy-laws—Tag-along Rights.” |
Thesebye-law’s provisions could deter a third party from seeking to acquire us, even if the third party’s offer may be considered beneficial by many shareholders.
As a holding company, we may face limitations on our ability to receive distributions from our subsidiaries.
We conduct all of our operations through subsidiaries and are dependent upon dividends or other intercompany transfers of funds from our subsidiaries to meet our obligations. For example, Brazilian law permits the Brazilian government to impose temporary restrictions on conversions of Brazilian currency into foreign currencies and on remittances to foreign investors of proceeds from their investments in Brazil, whenever there is a serious imbalance in Brazil’s balance of payments or there are reasons to expect a pending serious imbalance. The Brazilian government last imposed remittance restrictions for approximately six months in 1989 and early 1990. The Brazilian government may take similar measures in the future. Any imposition of restrictions on conversions and remittances could hinder or prevent us from converting into U.S. dollars or other foreign currencies and remitting abroad dividends, distributions or the proceeds from any sale in Brazil of common shares of our Brazilian subsidiaries. We currently conduct all of our operations through our principal Brazilian subsidiaries, Cosan S.A. and Cosan Logística. As a result, any imposition of exchange controls restrictions could reduce the market prices of the class A common shares.
40
Ourbye-laws restrict shareholders from bringing legal action against our directors and officers and also provide our directors and officers with indemnification from their actions and omissions, although such indemnification for liabilities under the Securities Act is unenforceable in the United States.
Ourbye-laws contain a broad waiver by our shareholders of any claim or right of action, both individually and on our behalf, against any of our officers or directors. The waiver applies to any action taken by an officer or director, or the failure of an officer or director to take any action, in the performance of his or her duties, except with respect to any matter involving any fraud or dishonesty on the part of the officer or director. This waiver limits the right of shareholders to assert claims against our officers and directors unless the act or failure to act involves fraud or dishonesty. Ourbye-laws also indemnify our directors and officers in respect of their actions and omissions, except in respect of their fraud or dishonesty. The indemnification provided in ourbye-laws is not exclusive of other indemnification rights to which a director or officer may be entitled, provided these rights do not extend to his or her fraud or dishonesty. Insofar as indemnification for liabilities arising under the Securities Act may be permitted to directors, officers or persons controlling us pursuant to the foregoing provisions, we understand that, in the opinion of the staff of the SEC, such indemnification is against public policy as expressed in the Securities Act and is, therefore, unenforceable in the United States.
The sale or issuance of a significant number of our common shares may adversely affect the market value of our class A common shares.
The sale of a significant number of our common shares, or the perception that such a sale could occur, may adversely affect the market price of our class A common shares. We have an authorized share capital of 1,000,000,000 class A common shares and 188,886,360 class B common shares, of which 134,115,534 class A common shares are issued and outstanding and 96,332,044 class B series 1 common shares are issued and outstanding as of the date of this annual report. Ourbye-laws establish that our board of directors is authorized to issue any of our authorized, but unissued share capital. Our shareholders at a shareholders general meeting may authorize the increase of our authorized share capital. As a result, we will be able to issue a substantial number of new shares after thelock-up period, which, if we decided to do so, could dilute the participation of our shareholders in our share capital.
Actual dividends paid on our shares may not be consistent with the dividend policy adopted by our board of directors.
Our board of directors has a dividend policy that provides, subject to Bermuda law, for the payment of dividends to shareholders equal to approximately 25% of our annual consolidated net income (as calculated in accordance with IFRS as issued by IASB). Our board of directors may, in its discretion and for any reason, amend or repeal this dividend policy. Our board of directors may decrease the level of dividends provided for in this dividend policy or entirely discontinue the payment of dividends. Future dividends with respect to our common shares, if any, will depend on, among other things, our results of operations, cash requirements, financial condition, distribution of dividends made by our subsidiaries, contractual restrictions, business opportunities, provisions of applicable law and other factors that our board of directors may deem relevant.
To the extent we pay dividends to our shareholders, we will have less capital available to meet our future liquidity needs.
Our business strategy contemplates substantial growth over the next several years, and we expect that such growth will require considerable liquidity. To the extent that we pay dividends in accordance with our dividend policy, the amounts distributed to our shareholders will not be available to us to fund future growth and meet our other liquidity needs.
We may require additional funds in the future, which may not be available or which may result in dilution of the interests of shareholders in our company.
We may need to issue debt or equity securities in order to obtain additional public or private financing. The securities that we issue may have rights, preferences and privileges senior to those of our shares. If we decide to raise additional capital through an offering of common shares, the participation of our shareholders in our share capital may be diluted. Moreover, additional funding that may be required in the future may not be available under favorable terms.
The price of our class A common shares is subject to volatility.
The market price of our class A common shares could be subject to significant fluctuations due to various factors, including actual or anticipated fluctuations in our financial performance, losses of key personnel, economic downturns, political events in Brazil or other jurisdictions in which we operate, developments affecting the ethanol and sugar industries, changes in financial estimates by securities analysts, the introduction of new products or technologies by us or our competitors, or our failure to meet expectations of analysts or investors.
41
Risks Related to Brazil
Historically, the Brazilian government has influenced and continues to influence the economy in the country, which may negatively affect our business and financial performance.
Political and economic conditions directly affect our business and can result in a material adverse effect on our operations and financial condition. Macroeconomic policies imposed by the government can have significant impacts on Brazilian companies, including Cosan S.A., Rumo and Comgás and their respective subsidiaries, as well as market conditions and securities prices in Brazil.
The Brazilian economy has been characterized by frequent and occasionally extensive intervention by the Brazilian government and unstable economic cycles. The Brazilian government has often changed monetary, taxation, credit, tariff and other policies to influence the course of Brazil’s economy. The Brazilian government’s actions to control inflation have at times involved setting wage and price controls, blocking access to bank accounts, imposing exchange controls and limiting imports into Brazil.
In recent years, there has been significant political turmoil in connection with the impeachment of Dilma Rousseff, the former president (who was removed from office in August 2016), and ongoing investigations of her successor, Michel Temer (who left office in January 2019), as part of the ongoing “Lava Jato” investigations. Presidential elections were held in Brazil in October 2018. The resolution of the political and economic crisis in Brazil still depends on the outcome of the “Lava Jato” investigation and approval of reforms that are expected to be promoted by the new president, Jair Bolsonaro. We cannot predict which policies Jair Bolsonaro, who assumed office on January 1, 2019, may adopt or change during his mandate or the effect that any such policies might have on our business and on the Brazilian economy. Any such new policies or changes to current policies may have a material adverse effect on us. The political uncertainty resulting from the presidential elections and the transition to a new government may have an adverse effect on our business, results of operations and financial condition.
Our business, financial performance and prospects, as well as the market prices of our shares, may be adversely affected by, among others, the following factors:
| | • | | exchange rate movements; |
| | • | | exchange rate control policies; |
| | • | | interest rate fluctuations; |
| | • | | liquidity available in the domestic capital, credit and financial markets; |
| | • | | expansion or contraction of the Brazilian economy, as measured by rates of growth in GDP; |
| | • | | oil and gas sector regulations, including price policies; |
| | • | | ports, customs and tax authorities’ strikes; |
| | • | | changes in transportation market regulations; |
| | • | | energy and water shortages and rationing; |
| | • | | price increases of oil and other inputs; |
| | • | | social and political instability; |
| | • | | other economic, political, diplomatic and social developments in or affecting Brazil. |
42
Instability resulting from any changes made by the Brazilian government to policies or regulations that may affect these or other factors in the future may contribute to economic uncertainty in Brazil and intensify the volatility of Brazilian securities markets and securities issued abroad by Brazilian companies. The President of Brazil has the power to define the policies and actions of the Brazilian government in relation to the Brazilian economy and thereby affect the operations and financial performance of Brazilian companies. The Brazilian government may be subject to internal pressure to indent the current macroeconomic policies in order to achieve higher rates of economic growth. We cannot predict what policies will be adopted by the Brazilian government. Moreover, in the past, the Brazilian economy has been affected by the country’s political events, which have also affected the confidence of investors and the public in general, thereby adversely affecting the performance of the Brazilian economy. Furthermore, any indecisiveness by the Brazilian government in implementing changes to certain policies or regulations may contribute to economic uncertainty in Brazil and heightened volatility for the Brazilian securities markets and securities issued abroad by Brazilian companies.
These factors, as well as uncertainty as to whether the Brazilian government will apply changes to its policy or regulations that may affect any of the above-mentioned factors or other factors in the future, can lead to economic uncertainty and increase the volatility of the capital markets and the securities issued by Brazilian companies. Changes in such policies and regulations may have a negative impact on our operating results and financial position and the price of the shares.
The levels of economic activity, reflected in Brazilian GDP, can influence our distributed volumes. The growth rates in natural gas consumption may occur primarily by substituting other resources, notably fuel oil, gasoline and to a lesser extent other products derived from oil, depending on the prices of each kind of fuel.
We, our subsidiaries and jointly-controlled entities generally invoice our sales inreais, but a substantial portion of our, our subsidiaries’ and jointly-controlled entities’ net sales is from export sales that are billed in U.S. dollars. At the same time, the majority of our, our subsidiaries’ and jointly-controlled entities’ costs are denominated inreais. As a result, our operating margins are negatively affected when there is an appreciation of thereal to the U.S. dollar. Additionally, we have indebtedness with fixed and floating rates, and we are thus exposed to the risk of fluctuations in interest rates. If there is an increase in interest rates, our financial results may be affected.
Political instability in Brazil may adversely affect Brazil’s economy and investment levels, and have a material adverse effect on us.
Brazil’s political environment has historically influenced, and continues to influence, the performance of the country’s economy. Political crises have affected and continue to affect the confidence of investors and the general public and have historically resulted in economic deceleration and heightened volatility in the securities issued by Brazilian companies.
The recent economic instability in Brazil has contributed to a decline in market confidence in the Brazilian economy as well as to a deteriorating political environment. Despite the ongoing recovery of the Brazilian economy, weak macroeconomic conditions in Brazil are expected to continue throughout early 2019. In addition, various ongoing investigations into allegations of money laundering and corruption being conducted by the Office of the Brazilian Federal Prosecutor, including the largest such investigation known as “Lava Jato,” have negatively impacted the Brazilian economy and political environment.
In August 2016, the Brazilian Senate approved the removal of then-President Dilma Rousseff from office, after completion of the legal and administrative impeachment proceedings, on the grounds of violation of budgetary laws. Michel Temer, who had been serving as acting president since her removal in May, assumed full power for the remaining portion of the presidential term, which ended in 2018.
In addition, the Dilma/Temer campaign was prosecuted for abuse of political and economic power and illegal campaign financing in the 2014 presidential campaign. On June 9, 2017, the Brazilian Superior Electoral Court cleared Mr. Temer of wrongdoing regarding the 2014 presidential campaign. However, Mr. Temer’s approval ratings remained historically low and he faced scrutiny over other matters, including allegations of bribery and other corrupt acts, which has contributed to the uncertain political and economic environment in Brazil.
After a tumultuous presidential campaign, Congressman Jair Bolsonaro defeated Fernando Haddad in the second round of the presidential elections, held on October 28, 2018, and became president of Brazil on January 1, 2019. It is not clear if, and for how long, the political divisions in Brazil that emerged before the election, will continue under the Bolsonaro presidency. It is also not clear what effects, if any, such political division will have on the ability of President Bolsonaro to govern Brazil and implement reforms. Any continuation of such division could result in an impasse in Brazil’s Congress, political unrest and massive protests and/or strikes that could adversely affect our operations.
43
Furthermore, Brazil’s federal budget has been in deficit since 2014. Similarly, the governments of Brazil’s constituent states are also facing fiscal concerns due to their high debt burdens, declining revenues and inflexible expenditures. While the Brazilian Congress has approved a ceiling on government spending that will limit primary public expenditure growth to the prior year’s inflation for a period of at least 10 years, local and foreign investors believe that fiscal reforms, and in particular a reform of Brazil’s pension system, will be critical for Brazil to comply with the spending limit. As of the date of this annual report, a reform of Brazil’s pension system is still under discussion by the government and Brazilian Congress. Diminished confidence in the Brazilian government’s budgetary condition and fiscal stance could result in downgrades of Brazil’s sovereign debt by credit rating agencies, negatively impact Brazil’s economy, lead to further depreciation of thereal and an increase in inflation and interest rates, thus adversely affecting our business, results of operations and financial condition.
Uncertainty about the Brazilian government’s implementation of changes in policies or regulations that affect such implementation may contribute to economic instability in Brazil and increase the volatility of securities issued abroad by Brazilian companies, including our securities.
The ongoing economic and political crisis in Brazil may have a material adverse effect on our business, operations and financial condition.
The recent economic instability in Brazil caused by the rise of inflation, a slowdown in GDP growth and uncertainty as to whether the Brazilian government will enact the necessary economic reforms to improve Brazil’s deteriorating fiscal accounts and economy have led to a decline in market confidence in the Brazilian economy and a government crisis.
Moreover, the Brazilian government may be subject to internal pressure to change its current macroeconomic policies in order to achieve higher rates of economic growth. We cannot predict what policies will be adopted by the Brazilian government. As has happened in the past, the Brazilian economy has been affected by the country’s political events, which have also affected the confidence of investors and the public in general, thereby adversely affecting the performance of the Brazilian economy. Furthermore, any indecisiveness by the Brazilian government in implementing changes to certain policies or regulations may contribute to economic uncertainty in Brazil and heightened volatility for the Brazilian securities markets and securities issued abroad by Brazilian companies.
We are not able to fully estimate the impact of global and Brazilian political and macroeconomic developments on our business. In addition, due to the current political instability, there exists substantial uncertainty regarding future economic policies and we cannot predict what policies will be adopted by the Brazilian government and whether these policies will negatively affect the economy or our business or financial performance. Recent economic and political instability has led to a negative perception of the Brazilian economy and higher volatility in the Brazilian securities markets, which also may adversely affect us and our securities. Any continued economic instability and political uncertainty may have a material adverse effect on our business.
Inflation and government measures to curb inflation may adversely affect the Brazilian economy, the Brazilian securities market, our business and operations and the market prices of our shares.
Brazil has experienced extremely high rates of inflation in the past and has therefore implemented monetary policies that have resulted in one of the highest interest rates in the world. According to theIGP-M, a general price inflation index, the inflation rates in Brazil were, 3.7% in 2014, 10.5% in 2015, 7.2% in 2016, a decrease of 0.5% in 2017 and 7.5% in 2018. In addition, according to the National Extended Consumer Price Index (Índice Nacional de Preços ao Consumidor Amplo), published by the IBGE, the Brazilian price inflation rates were 6.2% in 2014, 11.3% in 2015, 6.6% in 2016, 3% in 2017 and 4.3% in 2018. Despite the Brazilian Central Bank’s repeated increases of interest rates during the period from 2013 to 2015, the IPCA has continued to increase, reaching 10.7% in 2015 (the highest level recorded since 2003), and 3.8% in 2018.
The Brazilian government’s measures to control inflation have often included maintaining a tight monetary policy with high interest rates, thereby restricting availability of credit and reducing economic growth. Inflation, actions to combat inflation and public speculation about possible additional actions have also contributed materially to economic uncertainty in Brazil and to heightened volatility in the Brazilian securities markets. The Brazilian government’s measures to fight inflation, principally through the Brazilian Central Bank, have had and may in the future have significant effects on the Brazilian economy and our business.
44
Brazil may experience high levels of inflation in future periods. Periods of higher inflation may slow the rate of growth of the Brazilian economy, which could lead to reduced demand for our products in Brazil and decreased net sales. Inflation is also likely to increase some of our costs and expenses, which we may not be able to pass on to our customers and, as a result, may reduce our profit margins and net income. In addition, high inflation generally leads to higher domestic interest rates, and, as a result, the costs of servicing any floating-ratereal-denominated debt may increase, resulting in lower net income. Inflation and its effect on domestic interest rates can, in addition, lead to reduced liquidity in the domestic capital and lending markets, which could affect our ability to refinance our indebtedness in those markets. Future Brazilian governmental actions, including interest rate decreases, intervention in the foreign exchange market and actions to adjust or fix the value of thereal, may trigger increases in inflation and adversely affect the performance of the Brazilian economy as a whole. Any of the aforementioned developments may adversely affect the Brazilian economy as a whole, as well as on our financial conditions, operations and profits. Any decline in our net sales or net income and any deterioration in our financial performance would also likely lead to a decline in the market price of our shares.
High interest rates may adversely affect our operations and financial condition.
The Brazilian government’s measures to control inflation have frequently included maintaining a restrictive monetary policy with high interest rates, thereby limiting the availability of credit and reducing economic growth. As a consequence, official interest rates in Brazil at the end of 2018, 2017 and 2016 were 6.25%, 7% and 13.75% per year, respectively, as established by the monetary policy committee of the Brazilian Central Bank (COPOM). Brazilian interest rates have remained high and any increase of such interest rates may negatively affect our profits and results of operations, thereby increasing the costs of financing our operations.
High interest rates may impact our cost of obtaining loans and also the cost of indebtedness, resulting in an increase in our financial expenses. This increase may adversely affect our ability to pay our financial obligations, as it reduces our cash availability. Mismatches between contracted indexes for assets versus liabilities and/or high volatilities in interest rates may result in financial losses for us.
As of December 31, 2018, our consolidated gross debt was either fixed or linked to interest rates based on the CDI (Interbank Deposit Certificate) rate, the TJLP (Long-Term Interest Rate), the IPCA and the SELIC rate. We enter into certain financial instruments to mitigate our exposure to interest rate fluctuations.
Significant volatility in the value of thereal in relation to the U.S. dollar could harm our ability to meet our U.S. dollar-denominated liabilities.
Due to inflationary pressures and adjustments to economic policy, the Brazilian currency has historically experienced volatility against the U.S. dollar and other foreign currencies. In the past, the Brazilian government has implemented various economic plans and exchange rate policies, including sudden devaluations and periodic mini-devaluations, during which the frequency of adjustments has ranged from daily to monthly, fluctuation band exchange rate systems, exchange controls and dual exchange rate markets.
There have been significant fluctuations in the exchange rate between the Brazilian currency and the U.S. dollar and other currencies. For example, the Brazilianreal depreciated 19.7% and 53.2% against the U.S. dollar in 2001 and 2002, respectively and appreciated 18.0%, 8.0%, 12.3%, 8.5% and 17.0% against the U.S. dollar in 2003, 2004, 2005, 2006 and 2007, respectively. In 2008, thereal depreciated again approximately 31.9% against the U.S. dollar. In 2009, the real appreciated 25.3% against the U.S. dollar, while in December 31, 2010 therealto U.S. dollar exchange rate was R$1.6662, according to the Brazilian Central Bank. In 2011, thereal depreciated by 13.6% against the U.S. dollar, from R$1.6510 in the beginning of the period to R$1.8758 by the end of the period, and in 2012 thereal went from R$1.8683 in the beginning of the year to R$2.0435 by the end of the period, amounting to a 9.4% depreciation against the U.S. dollar. In 2013, thereal went from R$2.0415 in the beginning of the year to R$2.3426 by the end of the period. In 2014, thereal went from R$2.3975 in the beginning of the year to R$2.6562 by the end of the period, corresponding to a 10.8% depreciation against the U.S. dollar.
However, during 2015, due to the poor economic conditions in Brazil, including as a result of political instability, thereal has devalued at a rate that is much higher than in previous years. On September 24, 2015, thereal fell to the lowest level since the introduction of the currency, at R$4.1949 per U.S.$1.00. In 2015, thereal depreciated 45%, reaching R$3.9048 per U.S.$1.00 on December 31, 2015. Conversely, in 2016, thereal went from R$4.0387 per U.S.$1.00 at the beginning of the year to R$3.2591 per U.S.$1.00 on December 31, 2016, corresponding to a 19.3% appreciation against the U.S. dollar. In 2017, thereal went from R$3.2729 per U.S.$1.00 at the beginning of the year to R$3.3080 per U.S.$1.00 on December 31, 2017, corresponding to a 1% depreciation against the U.S. dollar. In 2018, thereal went from R$3.2470 per U.S.$1.00 at the beginning of the year to R$3.8748 per U.S.$1.00 on December 31, 2018, corresponding to a 16% depreciation against the U.S. dollar. There can be no assurance that thereal will not depreciate or appreciate further against the U.S. dollar.
45
Because our subsidiaries and jointly-controlled entities generally invoices its sales in reais, devaluation of thereal against foreign currencies may generate losses from our foreign currency-denominated liabilities as well as an increase in our funding costs with a negative impact on our ability to finance our operations through access to the international capital markets and on the market value of the shares. A strengthening of therealin relation to the U.S. dollar generally has the opposite effect. Further devaluations of the Brazilian currency may occur and impact our business in the future. These foreign exchange and monetary gains or losses can be substantial, which can significantly impact our earnings from one period to the next. In addition, depreciation of thereal relative to the U.S. dollar could (1) result in additional inflationary pressures in Brazil by generally increasing the price of imported products and services and requiring recessionary government policies to curb demand and (2) weaken investor confidence in Brazil and reduce the market price of the shares. On the other hand, further appreciation of therealagainst the U.S. dollar may lead to a deterioration of the country’s current account and the balance of payments and may dampen export-driven growth.
In addition, we are active in the credit market, obtaining funds denominated in national and foreign currencies to finance our investments and working capital. Our foreign currency exposure related to indebtedness as of December 31, 2018 was R$14,149.9 million compared to R$10,376.4 million at December 31, 2017. We manage a portion of our exchange rate risk through foreign currency derivative instruments, but our foregoing currency debt obligations are not completely hedged. As a result, the possible depreciation of thereal against the U.S. dollar could increase the cost of our obligations in foreign currency, and therefore significantly affect our liquidity and our cash flows in the short term. The depreciation of thereal may limit our access to international capital markets and may favor state intervention in the economy, including the imposition of potentially recessionary policies.
Infrastructure and workforce deficiency in Brazil may impact economic growth and have a material adverse effect on us.
Our performance depends on the overall health and growth of the Brazilian economy. Brazilian GDP growth has fluctuated over the past few years, with growth of 2.7% in 2013 decreasing to 0.1% in 2014 and then to a contraction of 3.8% in 2015, a contraction of 3.6% in 2016, an increase of 1% in 2017 and an increase of 1.3% in 2018. Growth is limited by inadequate infrastructure, including potential energy shortages and deficient transportation, logistics and telecommunication sectors, the lack of a qualified labor force and the lack of private and public investments in these areas, which limit productivity as well as efficiency. Any of these factors could lead to labor market volatility and generally impact income, purchasing power and consumption levels, which could limit growth or result in contraction and ultimately have a material adverse effect on our business.
Furthermore, deficiencies in the road, rail or waterway network of the areas in which we operate, such as unpaved or maintenance-free roads lack of railroads, especially in regions farthest from the ports, result in high logistics costs and, consequently, reduce the profitability of our sugarcane operations. Likewise, failure or malpractice in transportation handling, whether on trains, trucks or vessels, may lead to loss of production, waste of quantities or damage to sugarcane. Constant climate change, such as excessive rainfall, has led to a worsening of the road’s conservation status, which may lead to an increase in over-production losses. The aforementioned infrastructure deficiencies may make it more difficult for us to conduct our business in the areas in which we operate and thereby adversely affect us.
Developments and the perception of risk in other countries may adversely affect the Brazilian economy and market price of Brazilian issuers’ securities.
The market value of securities of Brazilian issuers is affected by economic and market conditions in other countries, including the United States, European countries, as well as in other Latin American and emerging market countries. Although economic conditions in Europe and the United States may differ significantly from economic conditions in Brazil, investors’ reactions to developments in these other countries may have an adverse effect on the market value of securities of Brazilian issuers. Additionally, crises in other emerging market countries may diminish investor interest in securities of Brazilian issuers, including our securities, as well as adversely affect the availability of credit to Brazilian companies in the foreign market, with the significant outflow of resources from the country and decrease in the amount of foreign currency invested in the country. In addition, negative events in the Brazilian financial and capital markets, any news or evidence of corruption in publicly traded companies and other issuers of securities, and the lack of rigorous application of investor protection rules or lack of transparency of information or eventual crisis situations in the Brazilian economy and in other economies may influence the Brazilian capital markets and negatively impact the securities issued in Brazil. This could adversely affect the market price of our securities, restrict our access to capital markets and compromise our ability to finance our operations in the future on favorable terms, or at all.
In recent years, there was an increase in volatility in all Brazilian markets due to, among other factors, uncertainties about how monetary policy adjustments in the United States would affect the international financial markets, the increasing risk aversion to emerging market countries and the uncertainties regarding Brazilian macroeconomic and political conditions. These uncertainties adversely affected us and the market value of our securities.
46
In addition, we continue to be exposed to disruptions and volatility in the global financial markets because of their effects on the financial and economic environment, particularly in Brazil, such as a slowdown in the economy, an increase in the unemployment rate, a decrease in the purchasing power of consumers and the lack of credit availability.
Disruption or volatility in the global financial markets could further increase negative effects on the financial and economic environment in Brazil, which could have a material adverse effect on our business, results of operations and financial condition.
Events in other countries may have a negative impact on the Brazilian economy.
Global economic conditions may affect the Brazilian economy as well as the demand for our products (including ethanol). For example, a global recession may lead to a reduction in global demand for our products, either through lower consumption or via measures to protect local production. In both cases the consequence would be to reduce prices for our products in the foreign market, affecting our financial performance. In addition, as a portion of our net operating revenues is generated from export activities and normally billed in U.S. dollars and, at the same time, most of our costs are denominated inreais, our operating margins may be adversely affected when thereal appreciates against the U.S. dollar. In addition, we have indebtedness atpre-and post-fixed rates and, therefore, we are exposed to the risk of interest rate variations. If there is an increase in interest rates, our financial results may be affected.
On January 20, 2017, Donald Trump became the President of the United States. Certain of Donald Trump’s economic and trade policies, in particular the ongoing trade disputes with China, have generated volatility in the global capital markets. Such volatility and uncertainty, as well as changes in administrative and governmental policies of the administration may have a material adverse effect on global economic conditions and the stability of global financial markets. Asset valuations, currency exchange rates and credit ratings may be especially subject to increased market volatility. We have no control over and cannot predict the effects arising from the new United States administration or its policies. Any disruption to global economic conditions and the stability of global financial markets could have a material adverse effect on us and the market value of our securities.
On June 23, 2016, the United Kingdom electorate voted in a general referendum in favor of the United Kingdom’s exit from the European Union(so-called “Brexit”). On March 29, 2017, the United Kingdom gave formal notice under Article 50 of the Treaty on European Union of its intention to leave the European Union. Although the United Kingdom was due to leave the European Union on March 29, 2019, on March 14, 2019, the United Kingdom Parliament voted to seek an agreement with the European Union for an extension to its withdrawal request pursuant to Article 50 of the Treaty on European Union. The Article 50 negotiating period was extended until April 12, 2019 and, on April 11, 2019, it was extended again until October 31, 2019. The ongoing process of negotiations between the United Kingdom and the European Union will determine the future terms of the United Kingdom’s relationship with the European Union, including access to European Union markets, either during a transitional period or more permanently. Brexit could lead to potentially divergent laws and regulations as the United Kingdom determines which European Union laws to replace or replicate. As a result, Brexit could impair our ability to transact business in the United Kingdom and in countries in the European Union. In particular, Brexit may have an adverse impact on the ability of our lubricants business, Moove, to conduct business within the European Union given that Moove has operations in both the United Kingdom and the European Union and that both Comma and Stanbridge (subsidiaries of Moove) are headquartered in the United Kingdom. If the United Kingdom were to significantly alter its regulations affecting the lubricants industry, we could face significant new costs. It may also be time-consuming and expensive for us to alter our internal operations in order to comply with new regulations. Furthermore, uncertainty regarding the terms of Brexit, and its eventual effects once implemented, could adversely affect global economic or market conditions and investor confidence. Brexit has already and could continue to adversely affect European and/or worldwide economic and market conditions and could continue to contribute to instability in the global financial markets. The long-term effects of Brexit will depend in part on any agreements the United Kingdom makes to retain access to markets in the European Union following the United Kingdom’s withdrawal from the European Union. Any of the effects of Brexit could adversely affect our business and/or the market value of our securities.
A reduction in the volume of foreign investments in Brazil may have a negative impact on us.
Any reduction in the volume of foreign investments in Brazil may have an impact on the balance of payments, which may force the Brazilian government to have a greater need to raise funds, both in the domestic and in the international markets, at higher interest rates. Likewise, any significant increase in Brazilian inflation rates and the current slowdowns of the European and American economies may have a negative impact on the Brazilian economy and affect interest rate levels, raising expenses on loans already obtained and costs of new funding from resources by Brazilian companies, including us.
47
Future governmental policy and regulations may adversely affect our operations and profitability.
Our activities may be materially affected by policies and regulations from Brazilian and foreign federal, state and municipal government. Governmental policies affecting economic activity such as tariffs, taxes, subsidies and restrictions on the import and export of agricultural goods and commodities, which represent a substantial part of the cargo we transport, may influence the profitability of the industry as well as the volume and type of imports and exports.
Future Brazilian and foreign governmental policies may adversely affect the supply, demand and prices of our products and services or otherwise restrict our capacity to operate in our current or prospective markets, potentially affecting our financial performance.
Changes in taxes and other assessments may adversely affect us.
The legislatures and tax authorities in the tax jurisdictions in which we operate regularly enact reforms to the tax and other assessment regimes to which we and our customers are subject. Such reforms include changes in tax rates and, occasionally, enactment of temporary taxes, the proceeds of which are earmarked for designated governmental purposes. In addition, the interpretation of tax laws by courts and taxation authorities is constantly evolving. In Brazil, the tax system is highly complex and the interpretation of the tax laws and regulations is commonly controversial. The effects of these changes and any other changes that result from enactment of additional tax reforms or changes to the manner in which current tax laws are applied cannot be quantified and there can be no assurance that any such reforms or changes would not have an adverse effect upon our business.
The Brazilian government regularly implements changes to tax regimes that may increase the tax burden on us, our subsidiaries and jointly-controlled entities and their respective customers. These changes include modifications in the rate of assessments and the enactment of new or temporary taxes, the proceeds of which are earmarked for designated governmental purposes. Future changes in tax policy laws may adversely affect our financial and operating results.
Ongoing investigations relating to corruption and diversion of public funds that are being conducted by the Brazilian federal police as well as other Brazilian andnon-Brazilian regulators and law enforcement officials may adversely affect the growth of the Brazilian economy and could have a material adverse effect on us.
Certain Brazilian companies active in the oil and gas, energy, construction and infrastructure sectors are facing investigations by the CVM, the SEC, the U.S. Department of Justice, the Brazilian Federal Police and the Brazilian Federal Prosecutor’s Office, the Comptroller General of Brazil and other relevant governmental authorities, in connection with corruption allegations (the so called “Lava Jato” investigations). The Brazilian federal police is also investigating allegations of improper payments made by Brazilian companies to officials of the Board of Tax Appeals (Conselho Administrativo de Recursos Fiscais), or “CARF,” a tax appeals tribunal (theso-called “Operação Zelotes”). It is alleged that the purpose of such improper payments was to induce those officials to reduce or waive certaintax-related penalties imposed by the Brazilian federal revenue authority, which were under appeal in the CARF. Such investigations involve several companies and individuals, including representatives of various companies, politicians and third parties. Certain of these individuals are being investigated by the Brazilian Federal Police and others were formally charged and are facing criminal proceedings and/or have already been convicted by the Brazilian Federal Courts.
Depending on the duration and outcome of such investigations, the companies involved may face a reduction in their revenues, downgrades from rating agencies or funding restrictions, among other negative effects. Given the significance of the companies cited in these investigations in the Brazilian economy, the investigations and their fallout have had an adverse effect on Brazil’s economic growth prospects in the near, short to medium term. Furthermore, the negative effects on such companies and others may also impact the level of investments in infrastructure in Brazil, which may lead to lower economic growth or contraction in the near to medium term (according to data from the IBGE, the Brazilian economy’s gross domestic product, or “GDP,” contracted by 3.5% in 2015 and 3.5% in 2016 but increased by 1.0% in 2017 and 1.3% in 2018).
As a result of the allegations under the “Lava Jato” investigations and the economic downturn, Brazil was downgraded tonon-investment grade status by Standard & Poor’s, or “S&P,” in September 2015, by Fitch Ratings, or “Fitch,” in December 2015, by Moody’s Investors Service in February 2016 and downgraded again by Fitch in May 2016. In addition, Brazil was further downgraded by S&P toBB- with a stable outlook in January 2018 as a result of the failure of the current Brazilian government to approve certain pension reforms. Brazil’s sovereign rating is currently rated by the three major risk rating agencies as follows:BB- by S&P and Fitch Ratings and Ba2 by Moody’s. Various major Brazilian companies were also downgraded. Such downgrades have further worsened the conditions of the Brazilian economy and the condition of Brazilian companies, especially those relying on foreign investments.
48
In addition, such investigations have extended to persons in high positions in the executive and legislative branches of the Brazilian government, which has caused considerable political instability. It is difficult to predict the effects of such political instability. Persistently poor macroeconomic conditions in Brazil resulting from, among other things, the “Lava Jato” investigations, their consequences and political instability could have a material adverse effect on us.
If we do not successfully comply with laws and regulations designed to prevent governmental corruption in countries in which we sell our products, we could become subject to fines, penalties or other regulatory sanctions and our sales and profitability could suffer.
Our anti-corruption policies and procedures designed to prevent governmental corruption violations may not prevent our management, employees or third parties acting on our behalf in the countries in which we operate from taking actions that violate applicable laws and regulations on improper payments to government officials for the purpose of obtaining or keeping business or business advantages. Laws prohibiting such behaviors include (but are not limited to) laws relating to the OECD’s 1997 Convention on Combating Bribery of Foreign Public Officials in International Business Transactions, such as the U.S. Foreign Corrupt Practices Act, and Brazilian Law No. 12,846/13, or the Anticorruption Act, which has been in effect since January 29, 2014. Any breach thereof may have a material adverse effect on our business, including the acceleration of loans and financing.
The Anticorruption Act imposes strict liability on companies for acts of corruption, fraud or manipulation of public tenders and government contracts; and interference with investigations or inspections by governmental authorities. Companies found liable under the Anticorruption Act face fines of up to 20% of their gross revenue in the immediately preceding year or, if such annual gross revenue cannot be estimated, such fines may range from R$6 thousand to R$60 million. Among other sanctions, the Anticorruption Act also provides for the seizure of assets or benefits obtained illegally, the suspension or partial prohibition of operations, the dissolution of the entity and/or the prohibition to receive incentives, subsidies, donations or financing from the government or from government-controlled entities for up to five years. In assessing penalties under the Anticorruption Act, Brazilian authorities may consider the adoption of an effective compliance program. Other relevant laws applicable to corruption-related violations, such as Law No. 8.492/92, or the Administrative Improbity Law, also provide for penalties that include the prohibition to enter into government contracts for up to ten years.
Consequently, if we, our management, employees or third parties acting on our behalf in the countries in which we sell our products become involved in any anti-corruption or criminal investigations or proceedings in connection to our business in Brazil or in any other jurisdiction, our business could be materially adversely affected.
| Item 4. | Information on the Company |
| A. | History and Development of the Company |
General
We are a limited liability exempted company incorporated under the laws of Bermuda on April 30, 2007 for an indefinite term. Cosan Limited is registered with the Registrar of Companies in Bermuda under registration number EC 39981. Our legal name is Cosan Limited and our commercial name is Cosan. Our registered office is located at Crawford House, 50 Cedar Avenue, Hamilton HM11, Bermuda. Our principal executive office is located at Av. Faria Lima, 4,100 – 16th floor, São Paulo – SP,04543-011, Brazil and our general telephone and fax numbers are 55 11 3897-9797 and 55 11 3897-9799, respectively. Our website is http://ir.cosanlimited.com/enu. The information contained on our website, any website mentioned in this annual report or any website directly or indirectly linked to these websites, is not part of, and is not incorporated by reference in, this annual report and you should not rely on such information.
See also Exhibit 8.1 to this annual report, which contains a list of our subsidiaries.
History
Our history dates back to 1936 when the Costa Pinto mill was established by the Ometto family in the city of Piracicaba in the state of São Paulo. As of themid-1980s, we began to expand our operations through the acquisition of various milling facilities in the state of São Paulo.
In 2011, Cosan S.A. and Shell established our Joint Venture, Raízen, to produce sugar and ethanol and to distribute fuel. See “—C. Organizational Structure,” for further information on the Joint Venture.
49
On February 24, 2014, Cosan S.A., through its subsidiary Rumo submitted to ALL a binding proposal for the merger of ALL by Rumo. The proposal entailed the merger of all the shares issued by ALL into Rumo, with the existing shareholders of Rumo and ALL receiving 36.5% and 63.5%, respectively, of the capital stock of the combined company. The merger was subject to certain conditions precedent, notably the following: (1) Rumo had to become registered as a Brazilian publicly held company and simultaneously join the “Novo Mercado” segment of B3; (2) regulatory approvals from CADE and the ANTT being obtained; and (3) all corporate and third-party approvals required by applicable laws and theby-laws of the companies being obtained.
At an extraordinary general meeting held on October 1, 2014, Cosan S.A.’s shareholders approved aspin-off of the logistics business of Cosan S.A. and the merger of thespun-off portion into Cosan Logística (the “PartialSpin-off”). The PartialSpin-off sought to segregate Cosan S.A.’s logistics activities, focused on Rumo, in order to allow each of our business segments to be more sector-focused, and to establish a suitable capital structures for each business segment. It also seeks to provide the market with greater transparency on each business segment’s performance, which will give shareholders and investors an improved ability to analyze each individual business’ performance. Cosan Limited controls both Cosan S.A. and Cosan Logística, with a 62.51% and 62.51% interest in each of them, respectively. At September 30, 2014 the portionspun-off to Cosan Logística had a book value of R$1,059.5 million. Due to the PartialSpin-off, all of the shares issued by Cosan Logística previously held by Cosan S.A. were canceled and subsequently 405,856,814 new Cosan Logística shares were issued to the shareholders of Cosan S.A. (including Cosan Limited) at an exchange ratio of 1:1. Cosan S.A.’s shares were tradedex-rights to receive Cosan Logística’s shares as from October 6, 2014. Cosan Logística’s shares are currently traded on the B3 under the ticker “RLOG3,” with trading having started on October 6, 2014. As a result, shareholders had been provided with the same political and economic privileges in Cosan Logística as those conferred on them by the shares of the company they previously held. Furthermore, the PartialSpin-off did not result in any change in the characteristics of Cosan S.A.’s shares or the advantages conferred by them. Due to the PartialSpin-off and consequent transfer of thespun-off portion to Cosan Logística, the share capital of Cosan S.A. was reduced by R$1,059,591, corresponding to the book value of thespun-off portion, without any cancellation of Cosan S.A.’s shares. As such, Cosan S.A.’s share capital reduced from the current R$4,691,822 to R$3,632,231, and it remains divided into 407,214,353 registered common, nominative and without par value shares.
On April 1, 2015, following the completion of the applicable conditions precedent, the merger between Rumo and ALL was effected with an adjusted exchange ratio (adjusted by the dividends distributed per each company during the period) that gave Rumo’s shareholders 34.3% and ALL’s shareholders 65.7% of the capital stock of the combined company. As a result, ALL’s shares (B3 ticker: ALLL3) were delisted from B3 as of March 31, 2015. As of April 1, 2015, Rumo’s public shares listed on the B3 (under the ticker “RAIL3”) fully reflected the effects of the merger.
On April 13, 2016, Rumo completed a capital increase in an amount of R$2.6 billion through a public offering of its common shares to investors in Brazil and abroad. Rumo used the net proceeds from the offering to strengthen its working capital and make investments.
In June 2016, Cosan Luxembourg S.A., or “Cosan Luxembourg,” a subsidiary of Cosan S.A., commenced a cash tender offer, or the tender offer, for any and all of (i) the R$850.0 million 9.50% Senior Notes due 2018, or the “2018 Notes,” and (ii) the U.S.$500.0 million 5.00% Senior Notes due 2023, or the “2023 Notes.”
In conjunction with the tender offer, Cosan Luxembourg also solicited consents of the holders of the 2018 Notes and the 2023 Notes to eliminate substantially all of the restrictive covenants and certain events of defaults and related provisions contained in the applicable indenture governing such series of notes. As of July 1, 2016, the expiration date for the consent solicitation, (i) R$686,538,000 in aggregate principal amount of the 2018 Notes, or approximately 80.8% of the outstanding 2018 Notes, and (ii) U.S.$378,687,000 in aggregate principal amount of the 2023 Notes, or approximately 75.7% of the outstanding 2023 Notes, had been validly tendered pursuant to the tender offer. The requisite consents were obtained and a supplemental indenture eliminating the restrictive covenants and certain events of default was executed.
Concurrently with the tender offer, on June 9, 2016, Cosan Luxembourg sold an aggregate principal amount of U.S.$500 million in 7.000% senior notes due 2027. An additional U.S.$150 million in aggregate principal amount of 7.000% senior notes due 2027 were issued on July 18, 2016. The senior notes due 2027 are unconditionally and irrevocably guaranteed by Cosan S.A. The net proceeds from the offering of the senior notes due 2027 were used to pay the tender price of any 2018 Notes and/or 2023 Notes that were tendered in connection with the tender offer. Any remaining funds were used for general corporate purposes.
50
On September 30, 2016, Cosan S.A. entered into a Share Purchase Agreement with Mansilla Participações Ltda. (a vehicle of TIAA Teachers Insurance and Annuity Association of America), another shareholder in Radar Propriedades Agrícolas S.A. and Radar II Propriedades Agrícolas S.A., or “Radar and Radar II,” through which Cosan S.A. sold part of its shares in Radar and Radar II for an amount of R$1,053.8 million. The consideration was received on November 4, 2016. As a result of this transaction, Cosan S.A. reduced its equity interest in Radar and Radar II from 37.7% to 3%. Cosan S.A. retains significant influence over Radar and Radar II through a shareholders’ agreement as described in “Item 7. Major Shareholders and Related Party Transactions.” The criteria used to measure the remaining stake of the investment was the equity method, in accordance with IAS 28, although it is not consolidated due to the inhibition of Cosan S.A.’s decision-making power defined on the shareholders agreement. The comparative consolidated statement of profit or loss and statements of cash flows have been restated to show the discontinued operation separately from continuing operations.
On October 8, 2016, ALL – América Latina Logística S.A. changed its corporate name to Rumo S.A. Subsequently, on December 31, 2016, Rumo Logística was merged into its wholly-owned subsidiary Rumo S.A., as a result of which Rumo S.A. is the successor entity to Rumo Logística.
In November 2016, Cosan S.A. and Shell executed amendments to certain agreements between them to remove the fixed date call options over Raízen Energia and Raízen Combustíveis shares exercisable in 2021 and 2026, and replace them with certain call and put options exercisable by Shell or Cosan S.A. upon the occurrence of certain events including, among others: (i) fundamental breaches of the obligations provided for in the agreements governing the Joint Venture; (ii) breach of anticorruption laws, (iii) insolvency or bankruptcy of a party, (iv) change of control, and (v) in the event of the death or disability of Cosan S.A.’s current Chairman, Mr. Rubens Ometto Silveira Mello. Moreover, Cosan S.A. and Shell agreed to renew the existinglock-up period for five years from the date of the execution of the amendment, following which the parties may sell their shares in each of Raízen Energia and Raízen Combustíveis subject to compliance with certain preemption rights in each other’s favor.
On January 20, 2017, Raízen completed an offering of 5.300% senior notes due 2027 in an aggregate principal amount of U.S.$500 million. The net proceeds from this offering were used by Raízen to repay certain existing indebtedness with the remaining funds being used for general corporate purposes.
On February 9, 2017, Cosan Logística’s subsidiary, Rumo, completed an offering of 7.375% senior notes due 2024 in an aggregate principal amount of U.S.$750 million. The proceeds of this offering were used to repay certain short-term indebtedness and the remainder (if any) for general corporate purposes.
On June 16, 2017, we acquired two sugarcane crushing plants. The acquisition was approved by the CADE, the Brazilian antitrust authority on August 8, 2017 and the transaction closed on September 8, 2017. The two mills included are located in the cities of Bocaina and Brotas, in the state of São Paulo, a region where Raízen already operates, and have a combined annual crushing capacity of approximately 5.5 million tons of sugarcane.
On September 20, 2017, we completed an offering of 5.950% senior notes due 2024 in an aggregate principal amount of U.S.$500 million. The proceeds of this offering were used to for general corporate purposes, including but not limited to, the repayment of our outstanding indebtedness and investments in our logistics business.
On October 10, 2017, Rumo completed a capital increase in an amount of R$2.6 billion through a public offering of its common shares to investors in Brazil and abroad. Rumo used the net proceeds from the offering to improve its leverage, reduce its net indebtedness and increase its cash reserves.
On October 16, 2017, Shell Gas B.V., Integral Investments B.V. and Shell Brazil Holding B.V. exercised their put option on the shares issued by Comgás against Cosan Limited. The option was exercised in compliance with the option agreement between Shell and Cosan Limited executed on November 5, 2012 and amended on October 16, 2017. The exercise was concluded on December 12, 2017, when Shell transferred its 16.77% of Comgás share capital to Cosan Limited and received from Cosan Limited 17,187,937 shares issued by Cosan S.A. (4.21% share capital) and two installments in cash. As part of the process of simplifying its corporate structure, the Company offered Cosan S.A. the possibility of acquiring the Comgás shares, at the same price and conditions. The transaction was concluded on December 12, 2017. Cosan S.A. now holds 79.9% of Comgás shares and Cosan Limited now holds 58.21% of Cosan S.A. shares.
51
On November 1, 2017, we acquired Stanbridge, which distributes lubricants and fuels in some regions of the United Kingdom.
On December 22, 2017, Cosan S.A. entered into a definitive agreement with Jus Capital Gestão de Recursos Ltda. and Farallon Latin America Investimentos Ltda., for the purchase and sale of credit rights arising from severance claims filed against the Brazilian federal government, which was required to pay compensation for material damages resulting from the fixing of sugar and alcohol prices below their cost of production, in a total amount of R$1,340 million. In addition to the acquisition price, Cosan S.A. will be entitled to receive certain additional payments which are contingent upon the purchaser’s actual receipts from the receivables.
On December 22, 2017, we acquired 22,025,248 of our Class A common shares pursuant to a tender offer at a purchase price of U.S.$9.65 per share, for a total cost of approximately U.S.$212.5 million, excluding fees and other related expenses. These shares represented 13.04% of the issued and outstanding Class A common stock of Cosan Limited as of December 21, 2017. The shares accepted for purchase included 1,299,859 additional shares that Cosan Limited elected to purchase pursuant to its right to purchase up to an additional 2% of its outstanding Class A common shares. After giving effect to the purchase, we had 146,867,137 outstanding Class A common shares remaining.
On January 18, 2018, Cosan Logística’s subsidiary, Rumo, completed an offering of 5.875% senior notes due 2025 in an aggregate principal amount of U.S.$500 million. The proceeds of this offering were used for general corporate purposes, including but not limited to the repayment of outstanding indebtedness and investments in our logistics business.
On March 19, 2018, we entered into an agreement with ExxonMobil Lubricants Trading Company which grants our subsidiary Moove the exclusive production, import, distribution and marketing rights in Brazil, Bolivia, Paraguay and Uruguay of lubricants and certain other related products under the Mobil brand until November 30, 2038. This agreement came into force on December 1, 2018.
On April 19, 2018, we submitted to the B3 a proposal relating to the discontinuation of our Brazilian Depositary Receipts, or “BDRs,” program pursuant to the procedure set forth in the B3’s Issuer Guide (Manual do Emissor). On October 10, 2018, we completed the deregistration with the CVM and the delisting of our BDRs from the B3. The discontinuation of our BDR program was intended to reduce our regulatory costs and concentrate liquidity of the Company’s stock on the NYSE.
On April 24, 2018, Raízen Combustíveis and its subsidiary Raízen Argentina Holdings S.A.U. entered into an agreement for the acquisition of Shell Argentina from Shell Overseas Investments B.V. and B.V. Dordtsche Petroleum Maatschappij for an amount of U.S.$916 million. Shell Argentina operates a petroleum refinery and distributes fuel through a network of 645 petrol stations in Argentina (of which 10% are owned by Raízen Combustíveis). It is expected that Shell Argentina will enter into several agreements with Shell entities, on market terms, including a supply agreement for the import of hydrocarbons and a license to use certain Shell brands in Argentina. The acquisition was completed on October 1, 2018.
On May 31, 2018, Cosan S.A., through its subsidiary CLI, acquired control of TTA Holding, or “TTA,” and Lubrigrupo II — Comércio e Distribuição de Lubrificantes, S.A., or “LubrigrupoII,” R$44.2 million and R$11.3 million, respectively, generating an additional goodwill in the lubricants segment of R$23.6 million and R$6.8 million, respectively. The total consideration paid for these acquisitions, net of cash received, amounted to R$33.0 million and R$10.0 million, respectively.
On December 20, 2018, Cosan S.A., through its subsidiary CLI, acquired control of Metrolube, for an initial consideration of R$112.8 million, generating an additional goodwill in the Moove segment of R$67.5 million. The total consideration, net of cash received, amounted to R$112.8 million.
On December 21, 2018, CLI and CVC entered into an investment agreement pursuant to which CVC will subscribe for shares in Moove’s capital in a total amount of R$562 million (which is equivalent to approximately 30% of Moove’s capital). Considering all conditions precedent provided in the investment agreement were satisfied, the transaction was concluded on March 29, 2019. As a result and pursuant to the terms of the investment agreement, Moove received R$434 million at the closing of the transaction and may receive up to approximately R$128 million until 2021.
On January 3, 2019, we acquired 14,228,134 of our Class A common shares pursuant to a tender offer at a purchase price of U.S.$8.88 per share, for a total cost of approximately U.S.$126.3 million, excluding fees and other related expenses. These shares represented 9.6% of the issued and outstanding Class A common stock of Cosan Limited as of December 31, 2018. The shares accepted for purchase included 2,966,873 additional shares that Cosan Limited elected to purchase pursuant to its right to purchase up to an additional 2% of its outstanding Class A common shares. After giving effect to the purchase, we had 134,115,534 outstanding Class A common shares remaining.
52
On March 8, 2019, Cosan S.A. announced the conclusion of the tender offer held on the same date for acquisition of class A preferred shares issued by Comgás. A total of 19,496,165 preferred shares of Comgás were acquired by Cosan S.A. in the tender offer at a price of R$82.00 per preferred share, representing approximately 14.77% of Comgás’s capital stock. As a result, we increased our interest in Comgás from 80.12% prior to the tender offer to 94.88% following the conclusion of the tender offer.
On March 28, 2019, Rumo announced that it has won the tender (International Bidding No. 02/2018) organized by ANTT to operate the railway network located between the cities of Porto Nacional, in the state of Tocantins and Estrela d’Oeste, in the state of São Paulo. Rumo’s bid was of R$2,719.0 million. The final granting of the concession to Rumo is subject to the completion of the remaining stages of the tender detailed in the tender notice, including an analysis of Rumo’s licensing documents. Rumo will be required to pay (i) 5% of the value of its bid within 45 days of the publication of the ANTT’s final decision, and (ii) the remainder in 120 quarterly instalments calculated pursuant to the terms of the concession agreement to be entered into in connection with the concession.
On April 24, 2019, we announced the cancellation of 32,239,807 Class A common shares held in treasury, representing 11.91% of Cosan Limited’s capital stock. After giving effect to the cancellation, we had 142,115,534 total Class A common shares remaining.
Capital Expenditures
For a description of our principal capital expenditures over the fiscal years ending December 31, 2018, 2017 and 2016, see “Item 5. Operating and Financial Review and Prospects—B. Liquidity and Capital Resources—Capital Expenditures.” For more information concerning our principal capital expenditures currently in progress, see “—D. Property, Plant and Equipment—Capital Expenditures.”
We are one of the largest companies in Brazil, as ranked by the Exame magazine’s annual Melhores e Maiores publication, with businesses in strategic sectors to Brazil’s development, such as energy and logistics. The following companies are part of the organization: Cosan S.A. and its subsidiaries, Comgás and Moove, Raízen (which is under joint control) and Cosan Logística with its subsidiary Rumo.
Through Raízen, a joint venture between Cosan S.A. and Shell created in June of 2011, the company produces more than 2.2 billion liters of ethanol per year to supply both domestic and international markets and 4.3 million tons of sugar, with 981 MW of installed capacity—making it the largest sugar exporter and one of the world’s largest power generators of electricity from sugarcane bagasse. The company plants, harvests and processes sugarcane, the main raw material used in the production of sugar and ethanol. Raízen also distributes fuel to over 6,524 service stations throughout Brazil under the Shell brand, with approximately 989 convenience stores, 67 distribution terminals and presence in 68 airports supplying jet fuel. On April 24, 2018, Raízen Combustíveis and its subsidiary Raízen Argentina Holdings S.A.U. entered into an agreement for the acquisition of Shell Argentina from Shell Overseas Investments B.V. and B.V. Dordtsche Petroleum Maatschappij for the amount of U.S.$916 million. Shell Argentina operates a petroleum refinery and distributes fuel through a network of 645 petrol stations in Argentina (of which 10% are owned by Raízen Combustíveis).
Acquired in 2012, Comgás is Brazil’s largest natural gas distributor. It has a network of over 16,747 kilometers, bringing natural gas to 1.9 million residential, commercial and industrial consumers in 177 cities. Its concession area accounts for approximately 26% of Brazil’s GDP, covering approximately 88 municipalities in the São Paulo, Campinas and Santos metropolitan areas and the Paraíba Valley.
Through Moove, we produce and distribute automotive and industrial lubricants. Under the Mobil brand, Cosan S.A. operates in Brazil and in nine other countries: Argentina, Bolivia, Uruguay and Paraguay (South America), United States of America, Spain, France, Portugal and the United Kingdom, aligned with its strategy to leverage the ExxonMobil partnership and expand abroad. Under the Comma brand, Moove also operates in the United Kingdom, selling its products to over 40 other countries in Europe and Asia.
53
In the logistics sector, Rumo is a leader in the transport of sugar for exportation and is creating an integrated transport platform that will significantly increase the efficiency of Brazilian exports. Cosan S.A. hasspun-off its logistics segment, including Rumo, into a listed company called Cosan Logística. In addition, Rumo has merged with ALL, which has made it one of the most important transportation and port operator for grains and other commodities in Brazil. For further details, see “—A. History and Development of the Company.”
Cosan Limited (NYSE ticker: “CZZ”) has been listed since 2007 on the NYSE. Cosan S.A. (B3 ticker: “CSAN3”) has been listed since 2005 and Cosan Logística (B3 ticker: “RLOG3”) has been listed since 2014, both on the B3 segment with the highest standards of corporate governance, the “Novo Mercado.” Comgás (B3 ticker: “CGAS3” and “CGAS5”) has been listed since 1997 on the B3. Rumo (B3 ticker: “RAIL3”) has been listed since 2015 on the B3, with the highest standards of corporate governance, the “Novo Mercado.”
Raízen Combustíveis
Overview
Through Raízen Combustíveis, our downstream Joint Venture Company, we are engaged in sourcing, storing, blending and distributing gasoline, ethanol, diesel, fuel oil and aviation fuel through our network of 6,524 Shell-branded retail service stations, 67 distribution terminals and 68 airport terminals supplying aviation fuel. Following the formation of the Joint Venture on June 1, 2011, we are currently among the three largest Brazilian fuel distributors, with approximately 32% market share in Brazil in terms of volume of fuel sold in the fiscal year ended December 31, 2018, according to Plural.
The following are the three main lines of activity in which Raízen Combustíveis is engaged:
| | • | | Retail: Raízen Combustíveis operates in the retail segment of the fuels distribution market through a network of Shell-branded retail service gas stations which on December 31, 2018 totaled 6,524 stations throughout Brazil. Raízen Combustíveis is a “Shell” brand licensed company, which is recognized as a symbol of quality and technology. The main products that Raízen Combustíveis sells at gas stations are ShellV-Power (ethanol and gasoline with additives) and Shell Evolux. |
| | • | | Business to Business (B2B): Raízen Combustíveis operates in the B2B segment with more than 3,000 customers such as cargo and passenger transport companies and companies in the agricultural and mining industries, among others. Our B2B strategy is focused on customer loyalty through premium technology products (ShellV-Power and Shell Evolux portfolios), digital payment methods and carrier fleet control tools. |
| | • | | Aviation: Raízen Combustíveis operates in the aviation sector through its 68 supply bases in Brazilian airports, providing services to commercial and business aviation companies. Raízen Combustíveis invests in the improvement of customer services and marketing strategies to differentiate its product offering in the business aviation market. The product marketed by this segment is Shell Aerojet. |
| | • | | Raízen Argentina: Raízen acquired the downstream assets of Shell in Argentina, including a petroleum refinery and a network of 645 petrol stations in Argentina (of which 10% are owned by Raízen Combustíveis). |
| | | | | | | | | | | | |
Raízen Combustíveis Highlights | | As of and For the Fiscal Year Ended | |
| | | December 31,
2018 | | | December 31,
2017 | | | December 31,
2016 | |
Service stations | | | 6,524 | | | | 6,272 | | | | 6,027 | |
Fuel sold (billion liters) | | | 27.5 | | | | 25.6 | | | | 24.8 | |
Ethanol sales (R$ million) | | | 7,535.7 | | | | 4,926.2 | | | | 5,246.6 | |
Gasoline sales (R$ million) | | | 32,565.8 | | | | 31,878.8 | | | | 29,162.1 | |
Diesel sales (R$ million) | | | 38,062.8 | | | | 31,786.9 | | | | 29,812.9 | |
Jet fuel sales (R$ million) | | | 5,867.5 | | | | 3,709.6 | | | | 3,414.2 | |
Other products (R$ million) | | | 1,172.3 | | | | 487.6 | | | | 507.2 | |
| | | | | | | | | | | | |
Net sales (R$ million)(1) | | | 85,204.1 | | | | 72,789.1 | | | | 68,143.0 | |
| | | | | | | | | | | | |
| (1) | Raízen Combustíveis is accounted for under the equity method, and therefore, net sales are not consolidated in the Company’s statement of profit or loss and other comprehensive income. See “—E. Supplemental Information About Joint Venture.” |
54
Currently, Raízen Combustíveis and its competitors purchase all or nearly alloil-derivative fuels from Petrobras under a formal supply contract that establishes the volume and the terms for supply. The contract is renewed periodically and the volume contracted for is based on the volume purchased in the previous year. There have been no significant interruptions in the supply of fuels from Petrobras to the distributors.
Ethanol is sourced from various third-party suppliers and from Raízen Energia as well. The prices of ethanol supplied are generally determined by the ESALQ index. The prices ofoil-derivative fuels supplied to us by Petrobras generally vary according to international oil prices.
All of our fuel distribution operations are in the domestic Brazilian and Argentinian markets. Our operations are not subject to significant seasonality; however, the price of hydrous ethanol at the pump is typically more volatile than the prices of gasoline or diesel, as a result of the seasonality of the sugarcane harvest and the limited storage facilities for ethanol in Brazil. This in turn impacts the proportion of our revenue mix that is derived from either gasoline or ethanol throughout the year, as consumers who own flex fuel vehicles switch between the two fuels according to the relative price of each.
As hydrous ethanol is less energy intense than gasoline, consumers will usually switch to ethanol if the price is significantly lower than gasoline. When hydrous ethanol is retailed at 70% of the price of gasoline, the two fuels are considered to be at price parity with each other. At a level below 70%, the demand for ethanol will significantly increase at the expense of gasoline.
Raízen Combustíveis supplies aviation fuel at 68 airports across Brazil, including at the major hubs of Congonhas and Guarulhos airports in São Paulo, and Brasília airport in the Federal District, to Brazilian and foreign airlines.
In addition, as of December 31, 2018, we had 989 convenience stores (compared to 950, 961 and 944 as of December 31, 2017, 2016 and 2015, respectively) throughout Brazil.
Regulation
The National Agency of Petroleum, Natural Gas and Biofuels, or “ANP,” is a federal agency responsible for the control, supervision and implementation of the government’s oil, gas and biofuel regulations. The ANP regulates all aspects of the production, distribution and sale of oil, natural gas, and biofuels products in Brazil. With respect to regulation relating to gasoline and biofuels, the ANP determines the product quality standards and minimum storage capacities required to be maintained by distributors and is also responsible for establishing the limits ofoil-based fuel volume purchased by distributors based on their storage capacity.
55
Fuel distributors are subject to Brazilian federal, state and municipal laws and regulations relating to environmental protection, safety and occupational health and safety, licensing by fire departments, environment and transport authorities. The National Environmental Council (Conselho Nacional do Meio Ambiente), or “CONAMA,” is the main government body responsible for issuing environmental standards and regulations at the federal level. Environmental state agencies and municipal departments are also responsible for establishing and supervising complementary laws and regulations within their areas of operation.
Fuel distributors must obtain authorizations and/or licenses from federal, state and/or municipal environmental agencies and fire departments to implement and operate their facilities. They are required to develop programs to control air, soil and water pollution, including management of hazardous waste.
Raízen Energia (Sugar, Ethanol and Cogeneration)
Overview
Raízen Energia is our upstream Joint Venture company. Raízen Energia’s core business is the production and sale of a variety of products derived from sugarcane, including VHP sugar, anhydrous and hydrous ethanol, as well as activities related to energy cogeneration from sugarcane bagasse and ethanol trading. Raízen Energia operates 26 sugar, ethanol and energy cogeneration mills, with a current crushing capacity of 73 million tons of sugarcane per year.
| | | | | | | | | | | | |
Raízen Energia Highlights | | As of and for Fiscal Year Ended | |
| | | December 31,
2018 | | | December 31,
2017 | | | December 31,
2016 | |
Crushed sugarcane (million tons) | | | 60.1 | | | | 60.7 | | | | 62.2 | |
Sugar volume sold (thousand tons) | | | 3,493.5 | | | | 4,559.9 | | | | 4,694.6 | |
Ethanol volume sold (million liters) | | | 4,685.6 | | | | 3,841.1 | | | | 3,614.3 | |
Energy sold (MWh) | | | 11,186.5 | | | | 3,520.7 | | | | 2,871.9 | |
Net sugar sales (R$ million) | | | 3,670.8 | | | | 5,377.4 | | | | 5,794.8 | |
Domestic market | | | 1,218.4 | | | | 1,295.5 | | | | 1,437.4 | |
External market | | | 2,452.4 | | | | 4,081.8 | | | | 4,357.4 | |
Net ethanol sales (R$ million) | | | 8,569.4 | | | | 6,550.7 | | | | 6,480.4 | |
Domestic market | | | 6,254.9 | | | | 4,474.9 | | | | 3,810.4 | |
External market | | | 2,314.5 | | | | 2,075.8 | | | | 2,670.0 | |
Net energy cogeneration sales (R$ million) | | | 2,836.7 | | | | 884.3 | | | | 520.5 | |
Other products and services (R$ million) | | | 4,721.7 | | | | 340.3 | | | | 338.1 | |
Net sales (R$ million)(1) | | | 19,798.6 | | | | 13,152.7 | | | | 13,133.8 | |
| (1) | Raízen Energia is accounted for under the equity method; therefore, net sales are not consolidated in the Company’s statement of profit or loss and other comprehensive income. See “—E. Supplemental Information About Joint Venture.” |
Our production is based on sugarcane, the most competitive and viable feedstock for sugar and ethanol because of its low production cost and high energy efficiency ratio relative to other energy sources, such as corn and sugar beet. Sugarcane is our principal raw material. It is a tropical grass that grows best in locations with stable warm temperatures and high humidity, although cold and dry winters are an important factor for the sucrose concentration of sugarcane. The climatic conditions of the central-south region of Brazil are ideal for growing sugarcane.
Raízen Energia’s sugarcane production is sourced from leased lands, as well as from third-party suppliers. The following table compares the amount of sugarcane grown on leased land with the amount purchased from third parties during the periods set out below.
| | | | | | | | | | | | | | | | | | | | | | | | |
| | | As of and for Fiscal Year
Ended December 31 | |
| | | 2018 | | | % | | | 2017 | | | % | | | 2016 | | | % | |
| | | (millions of tons, except percentages) | |
Own sugarcane harvested from leased land | | | 28.9 | | | | 48.0 | | | | 29.1 | | | | 47.9 | | | | 31.3 | | | | 50.4 | |
Sugarcane purchased from third parties | | | 31.2 | | | | 52.0 | | | | 31.6 | | | | 52.1 | | | | 30.9 | | | | 49.6 | |
| | | | | | | | | | | | | | | | | | | | | | | | |
Total | | | 60.1 | | | | 100 | | | | 60.7 | | | | 100 | | | | 62.2 | | | | 100 | |
| | | | | | | | | | | | | | | | | | | | | | | | |
56
In accordance with the land lease contracts, we pay the lessors a certain fixed number of tons of sugarcane per hectare as consideration for the use of the land, and a certain fixed productivity per ton of sugarcane in terms of TSR. The overall volume of TSR is obtained by multiplying the number of hectares leased by the committed tons of sugarcane per hectare by the TSR per ton of sugarcane. The price that we pay for each kilogram of TSR is set by Consecana. The price that we pay to third-party sugarcane growers is based on the total amount of sugar content in the sugarcane, measured by the amount of sugar recovered and on the prices of ethanol and sugar sold by each mill.
Our mills have the capacity to crush 73 million tons of sugarcane per year and in the fiscal year ended December 31, 2018, we crushed 60.1 million tons of sugarcane, or 12% of Brazil’s central-south region total sugarcane production (which was 497.5 million tons as of December 31, 2018, according to UNICA). For further information on our sugarcane mills see “—D. Property, Plant and Equipment.” The mills that are equipped to produce both sugar and ethanol can typically adjust their proportion of output from anywhere between 57% sugar and 43% ethanol to 47% sugar and 53% ethanol. We track the current and future prices of each product relative to the other, as well as forecasts of global output volumes of each product, to decide on the production mix to be set across our mills in order to maximize our sales revenue. All of our mills are energy self-sufficient from burning sugarcane bagasse at very high temperatures in boilers, to heating water that is transformed into steam. Thirteen of our mills generate surplus electrical energy that we sell to the Brazilian energy grid.
We produce and sell a wide variety of standard sugars, including VHP sugar, crystal sugar and organic sugar, and refined sugars, including granulated refined white sugar, amorphous refined sugar, refined sucrose liquid sugar and refined inverted liquid sugar.
Standard sugars. VHP sugar, a raw sugar with approximately 99% sucrose content, is similar to the type of sugar traded in major commodities exchanges, including through the standard NY11 contract. The main difference between VHP sugar and the sugar that is typically traded in the major commodities exchanges is the sugar content of VHP sugar and the price premium that VHP sugar commands in comparison to most sugar traded in the commodities exchanges. We export VHP sugar in bulk, to be refined at its final destination. We also sell a small amount of VHP sugar to the Brazilian market. Crystal sugar is anon-refined sugar produced directly from sugarcane juice and sold to industrial companies in Brazil to be used as an ingredient for food products. We also sell a small amount of crystal sugar to the Brazilian retail market and to export markets. Organic sugar is a kind of raw sugar produced from organic sugarcane and is not submitted to any chemical treatments during its manufacturing process. We sell organic sugar in the international and Brazilian markets.
Refined sugars. We refine VHP sugar and crystal sugar into both granulated and amorphous(non-crystallized) sugar. We sell refined sugar in the Brazilian and export retail and industrial markets. Refined sugar is used as an ingredient in processed food products such as milk and chocolate powders, bakery products, powder refreshments, and pharmaceutical syrups.
Liquid sugars. We refine crystal sugar to produce sucrose liquid sugar and inverted liquid sugar, which has a higher percentage of glucose and fructose than sucrose liquid sugar. We sell both types of sugar for industrial use, mainly for the production of soft drinks.
We sell sugar to a wide range of customers in Brazil and in the international markets. Our customers in Brazil include Docelar, which was previously held by Cosan S.A. and sold to Camil on October 24, 2012, and food manufacturers, for which we primarily sell refined and liquid sugar. We primarily sell raw sugar in the international markets through international commodities trading firms and Brazilian trading companies. In the fiscal year ended December 31, 2018 we exported 65.6%, by volume, of the sugar we sold. Rumo handles most of the transportation by rail and logistics of our sugar exports to their sugar loading terminal at the port of Santos in the state of São Paulo.
57
Prices for raw sugar are established in accordance with the NY11 futures contracts. Prices for refined sugar are established in accordance with the London# 5 futures contract, traded on the LIFFE. Prices for sugar we sell in Brazil are set in accordance with Brazilian market prices, using an index calculated by the ESALQ.
We produce and sell three different types of ethanol: hydrous ethanol and anhydrous ethanol for fuel and industrial ethanol. The primary type of ethanol consumed in Brazil is hydrous ethanol, which is used as an alternative to gasoline for flex fuel vehicles (as opposed to anhydrous ethanol which is used as an additive to gasoline). As a result, hydrous ethanol represented 64.7% of our ethanol production in the fiscal year ended December 31, 2018 and 58.8% of our ethanol production in the fiscal year ended December 31, 2017. Our sales are mainly to fuel distributors in Brazil, of which the three largest are Petrobras Distribuidora S.A. (BR Distribuidora), Raízen Combustíveis S.A. (Shell) and Cia. Brasileira de Petróleo Ipiranga (Ipiranga). We also sell industrial alcohol, which is used in the chemical and pharmaceutical sectors. In the fiscal year ended December 31, 2018, we exported 24.7%, by volume, of the ethanol we sold. Our main export customers are trading companies which distribute our products mainly to the United States, Japan and Europe. Our exports are conducted through TEAS, an ethanol loading terminal at the port of Santos in the state of São Paulo.
Ethanol Production Process
We produce ethanol through a chemical process called yeasting, which is a process of fermenting the sugars contained in both sugarcane juice and molasses. Initially, we process the sugarcane used in ethanol production the same way that we process sugarcane for sugar production. The molasses resulting from this process is mixed with clear juice and then with yeast in tanks, and theby-product resulting from the yeasting process, called “yeasted wine,” has an ethanol content of approximately 7% to 9%. After the yeasting process, which takes approximately ten hours, the yeasted wine is centrifuged, so that we can separate the yeast from the liquid. We use the separated yeast in the ethanol production process. We then boil the yeasted wine at different temperatures, which causes the ethanol to separate from other liquids. Hydrous ethanol is produced after different distillation stages. In order to produce anhydrous ethanol, hydrous ethanol undergoes a dehydration process. The liquid remaining after these processes is called vinasse, aby-product we use as fertilizer in our sugarcane fields. After the distillation and dehydration processes, we produce hydrous, anhydrous, neutral and industrial ethanol, and store the ethanol in large tanks.
The ethanol production flow can be summarized as follows:
| | • | | Preparation of the juice. The fermentation is fed with a juice composed of approximately 20% sugar, which is prepared with juice (from the treatment), molasses (from sugar production) and water. This juice must be cooled to approximately 30°C. |
| | • | | Fermentation. The fermentation of the juice is the result of the action of yeast, which first inverts the sucrose to glucose and fructose (monosaccharide), and then converts the monosaccharide into ethanol and carbon dioxide. This reaction occurs in a fermenter, which is fed with juice and yeast. |
| | • | | Centrifuging. After the fermentation, the resulting product is carried to centrifuges that separate the yeast from the beer, a solution of approximately 9%v/v (oGL) of ethanol. |
| | • | | Treatment of the yeast. The yeast that comes from the centrifuges is treated with sulfuric acid and returned to the fermenter tank to be utilized again. |
| | • | | Distillation. The beer is distilled in a sequence of distillation columns, which separate the water from the ethanol. This process occurs basically due to the differences of ethanol’s and water’s ebullition temperatures. In order to produce hydrous ethanol, two columns are used to achieve the concentration of 94%v/v (oGL) ethanol. From the first column, a slop called vinasse is obtained, which is used as a fertilizer in the sugarcane fields. |
| | • | | Dehydration. In order to produce anhydrous ethanol, two more columns are used to achieve the concentration of 99%v/v (oGL) ethanol. In the first column, the excess of water is separated with the aid of cycle-hexane. |
58
Ethanol Production Capacity and Output
Our current annual ethanol production capacity is approximately 2.6 billion liters. We were the largest producer of ethanol in Brazil in the fiscal year ended December 31, 2018, producing approximately 2.6 billion liters of ethanol, representing 10% of the total ethanol production in Brazil’s central-south region, according to UNICA. We are one of the largest exporters of ethanol in the world, having sold abroad R$2.3 billion including trading in the foreign markets, having exported 1.2 billion liters in the fiscal year ended December 31, 2018 and 1.2 billion liters in the fiscal year ended December 31, 2017.
Cogeneration
Raízen Energia currently has an installed energy capacity of 981 MW per year from our 26 mills, of which 13 mills sold their excess energy to the Brazilian energy grid. We view our cogeneration business as strategic since it generally allows for a stable cash flow stream across commodity cycles, helping to reduce the volatility of our cash flows and operations.
| | | | | | | | | | | | |
Energy Cogeneration Highlights | | As of and for Fiscal Year Ended | |
| | | December 31,
2018 | | | December 31,
2017 | | | December 31,
2016 | |
Energy sold (MWh) | | | 11,186.5 | | | | 3,520.7 | | | | 2,871.9 | |
Net sales (R$ million)(1) | | | 2,836.7 | | | | 884.3 | | | | 520.5 | |
| (1) | Raízen Energia is accounted for under the equity method, therefore, net sales are not consolidated in the Company’s statement of profit or loss and other comprehensive income. See “—E. Supplemental Information About Joint Venture.” |
Alternative sources of electricity, such as cogeneration from sugarcane bagasse, have become increasingly important within the Brazilian hydro-dependent energy matrix, particularly because the harvest period for sugarcane coincides with generally drier periods for hydraulic energy, when the overall energy supply is, therefore, more constricted. We are self-sufficient for our energy needs. In the fiscal years ended December 31, 2018, 2017 and 2016, we sold 11,186.5 MWh, 3,520.7 MWh and 2,871.9 MWh, respectively, of energy to third parties. Our main customers, besides the energy sold to the Brazilian grid, are utility companies. In the fiscal year ended December 31, 2018, approximately 80% of our excess cogeneration volume was sold through long-term contracts.
Seasonality
Raízen Energia is subject to the seasonality of the annual sugarcane harvesting period in the Central-South region of Brazil, which begins in April or May and ends in November or December. This creates fluctuations in our inventory, usually peaking in December to cover sales between crop harvests (i.e., January through March), and a degree of seasonality in gross profit. See also “Item 5. Operating and Financial Review and Prospects—Principal Factors Affecting Our Results of Operations—Seasonality.”
Regulation
Raízen Energia is subject to several Brazilian federal, state and municipal environmental protection and health and safety laws and regulations governing, among other things, the generation, storage, handling, use, transportation and discharge of hazardous materials into the ground, air and water as well as regulation concerning electricity generation. Below is a summary of the principal rules and regulations to which Raízen Energia is subject.
Permits. Certain environmental laws require us to obtain from governmental authorities permits, licenses and authorizations to install and operate our mills, to burn sugarcane and to perform other activities.
59
We are subject to the regulations of the pollution control and remediation agencies of several Brazilian states, such as:
| | • | | Environmental Company of the state of São Paulo (Companhia Ambiental do Estado de São Paulo—CETESB); |
| | • | | Environmental Agency of the State of Goiás (Secretaria de Meio Ambiente, Recursos Hídricos, Infraestrutura, Cidades e Assuntos Metropolitanos—SECIMA); and |
| | • | | Environmental Institute of the state of Mato Grosso do Sul (Instituto de Meio Ambiente do Mato Grosso do Sul—IMASUL). |
Environmental Licensing of Raízen. We operate mills, transport facilities and numerous warehouses. CONAMA is the government agency responsible for issuing rules and resolutions on environmental licensing at a national level. Environmental licensing is required for the development of new facilities and for alterations in existing operations. Environmental licenses must be periodically renewed.
Sugarcane Burning. The state of São Paulo and certain municipal governments have established laws and regulations that limit or eliminate the burning of sugarcane entirely. We have voluntarily signed the Agro-Environmental Sugarcane Protocol, which establishes accelerated deadlines for the reduction of sugarcane burning.
Brazilian Forestry Code. We are subject to the Brazilian Forest Code, which prohibits land use in certain permanently protected areas, and obligates us to maintain and register a forest reserve in each of our rural landholdings covering from 20% to 80% of the total area of such land, known as “Legal Reserve.”
Environmental Liabilities. We are involved in certain administrative and judicial proceedings for alleged failure to comply with environmental laws and regulations (especially relating to environmental damages caused by sugarcane burning and contaminated areas). The Brazilian Federal Constitution provides for three different types of environmental liabilities: (1) civil, (2) administrative and (3) criminal.Non-compliance with environmental law is subject to administrative, civil and/or criminal sanctions, regardless of the civil impacts such as the obligation to repair, compensate or indemnify any damages caused to the environment or third parties. Public attorneys’ offices, foundations, state agencies, state-owned companies and environmental protection associations are all authorized by law to file public civil actions seeking compensation for environmental damages.
Electricity Regulation. The Brazilian power industry is regulated by ANEEL, a federal regulatory agency, in accordance with the general guidelines set forth by the Ministry of Mines and Energy. In order to perform power generation activities, the power agent must obtain authorizations granted by ANEEL or execute concession and permission agreements with the Brazilian government through ANEEL. The activities related to generation and commercialization of electricity performed by Raízen Energia are subject to ANEEL’s supervision. Pursuant to Law No. 9,427 dated December 26, 1996 and ANEEL’s Resolution No. 63/2004, within the scope of its powers of inspection of electrical energy plants and services, ANEEL may impose penalties (including warnings, fines, temporary suspension of the right to participate in bidding procedures for new concessions, licenses or authorizations and forfeiture) on power industry participants based on the nature of its relation with the agency (concessionaires or agents who hold permission or authorization) and the materiality of the infraction. In case of fines, the limit of 2.0% of the revenue of the concessionaire in the12-month period preceding any assessment notice must be respected or, for independent producers or self-producers (authorized agents), 2.0% of the estimated amount of energy produced in the same period. In addition, pursuant to ANEEL’s Resolution No. 63/2004 some infractions may result in fines related to the failure of the agent in requesting ANEEL’s prior approval to certain conduct, including the following:
| | • | | entering into certain related party transactions, pursuant to ANEEL’s Resolution No. 699/2016; |
| | • | | sale or assignment of the assets related to services rendered as well as the imposition of any encumbrance (including any security, bond, guarantee, pledge and mortgage) on them or any other assets related to the concession or permission, or the revenues of the electricity services; |
| | • | | changes in corporate control of the holder of the authorization, permission or concession, as per terms of ANEEL’s Resolution No. 484/2012; and |
| | • | | as applicable, submit to ANEEL projects of electric works and plants and their modifications, as well as proceed with its execution in disagreement with the project approved and with the established scheduled. |
60
Comgás (Natural Gas Distribution)
Overview
Comgás is Brazil’s largest distributor of piped natural gas, with a network reaching over 16,747 kilometers and delivering natural gas to more than one million residential, commercial and industrial consumers in over 177 cities. The Comgás concession area covers approximately 26% (according to the IBGE) of Brazil’s GDP, including approximately 88 municipalities in the metropolitan areas of São Paulo, Campinas and Santos as well as the Paraíba Valley.
We are the largest natural gas distributor in Brazil, with approximately 30% market share in Brazil in terms of volume sold in 2018, according to ABEGAS. We believe the prospects for future availability of natural gas in Brazil are positive based on expected exploration of carbon deposits discovered in thepre-salt layer offshore of Brazil’s coast. Comgás’ supply of natural gas is currently sourced primarily from Petrobras, with contracts in Bolivia and Brazil having been entered into. Our natural gas supply agreement with Petrobras that is sourced out of Bolivia was recently renewed until 2021. See “Item 3. Key Information––D. Risk Factors—Risks Related to Our Businesses, the Operations of Our Joint Venture, and Industries in Which We Operate—Our business would be materially adversely affected if operations at our transportation and distribution facilities experienced significant interruptions. Our business would also be materially adversely affected if the operations of our customers and suppliers experienced significant interruptions.”
| | | | | | | | | | | | |
Comgás Highlights | | As of and for
Fiscal Year Ended | |
| | | December 31,
2018 | | | December 31,
2017 | | | December 31,
2016 | |
Natural gas sold (million cbm) | | | 4,543.3 | | | | 4,292.9 | | | | 4,323.0 | |
Net sales (R$ million) | | | 6,840.0 | | | | 5,537.9 | | | | 5,657.2 | |
Regulation
The National Agency of Petroleum, Natural Gas and Biofuels, or the “ANP,” is responsible for the control, supervision and implementation of the government’s oil, gas and biofuel policies. The ANP regulates all aspects of the production, distribution and sale of oil products in Brazil, including product quality standards and minimum storage capacities required to be maintained by distributors and is also responsible for establishing the limits ofoil-based fuel volume purchased by distributors based on their storage capacity.
In addition to the regulation by ANP, Comgás’ activities are also supervised and regulated by ARSESP, with which it maintains continuous dialogue through its directorate for Regulatory and Institutional Affairs, in order to enhance or formulate industry policies. In light of the approach shown by regulators in recent years, Comgás does not believe that there will be any sudden changes that may affect its business.
Moove
Moove is responsible for the manufacturing and distribution of passenger vehicle lubricants, commercial vehicle lubricants, industrial lubricants and special application products such as greases, cutting oils and car care products under the Mobil and Comma brands in Brazil, Argentina, Bolivia, Uruguay, Paraguay, Spain, France, Portugal, the United States of America, the United Kingdom and Asia.
| | | | | | | | | | | | |
Moove Highlights: | | As of and for
Fiscal Year Ended | |
| | | December 31,
2018 | | | December 31,
2017 | | | December 31,
2016 | |
Volume of lubricants sold (thousand liters) | | | 345.9 | | | | 347.8 | | | | 328.9 | |
Net sales (R$ million) | | | 3,449.9 | | | | 2,129.5 | | | | 1,883.7 | |
We have a wholly-owned lubricants oil blending plant, located in Rio de Janeiro, with an annual production capacity of 2.5 million barrels of lubricants per year, and a pier facility that allows us to import base stocks. We produce over 600 different lubricants, and purchase more than 400 raw materials, including basic oils and additives.
We sell our lubricant products, mainly through distributors and direct sales to industrial customers, as well as to wholesale customer accounts and car and motorcycle dealerships.
61
We have exclusive distribution rights for Mobil brand products in Bolivia, Paraguay and Uruguay following the purchase of ExxonMobil’s lubricant distribution business in these three countries in 2011.
In July 2012, we acquired Comma Oil and Chemicals Limited (currently known as Moove Lubricants), which reinforced our strategy to enter into the European lubricants and specialties markets. As a result, we acquired finished lubricants and the manufacture and sale of chemicals to third parties, all of Comma’s assets at the Gravesend site in Kent, England, United Kingdom, as well as ownership of Comma’s trademarks and brand names. In addition, agreements will be in place to allow Comma to continue to distribute select Mobil-brand lubricants into specific sales channels in the United Kingdom and to continue to manufacture and distribute a range of seasonal and ancillary automotive products to ExxonMobil.
We have exclusive distribution rights for Mobil brand products in Bolivia, Paraguay and Uruguay following the purchase of ExxonMobil’s lubricant distribution business in these three countries in 2011. Since December 2016, Moove has had the exclusive distribution rights for Mobil brand products in Spain and, more recently, in the United Kingdom, Argentina, France, Portugal and the United States of America.
Our lubricants business is not subject to significant seasonality. However a significant proportion of our raw material purchases are invoiced in U.S. dollars and we hedge part of our shipments of base oils against variations in exchange rates.
Regulation
Moove is subject to substantially the same regulation by the same regulatory bodies to which our fuel distribution business, Raízen Combustíveis, is subject. See “—Raízen Combustíveis.”
Cosan Logística
Overview
Our logistics operations are operated through Cosan Logística, which holds our interest in Rumo see “—A. History and Development of the Company.” Rumo offers an integrated logistics solution to agricultural commodity producers located in the central-south region of Brazil by transporting produce from the mills and depots by truck or rail to be loaded and stored in our port facility at the port of Santos in the state of São Paulo. Rumo also offers warehousing services.
Following Rumo’s merger with ALL which was completed on April 1, 2015, Rumo has expanded its offering of logistics services, including, among other things, by providing port handling services. Furthermore, Rumo acquired control of ALL’s former concessions which include the main railroads between the sugar and grain producing areas of the central-south region of Brazil and the ports of Santos, Paranaguá, São Francisco and Rio Grande. As a result, Rumo now operates in the states of Mato Grosso and São Paulo as well as the southern region of Brazil where four of the most active ports in the country are located and through which most of Brazil’s grain production is exported. Moreover, Rumo started operating twelve main inland terminals, either directly or through partners. For further information, see “—A. History and Development of the Company.”
The following table sets for the certain financial and other information of Rumo for the periods indicated:
| | | | | | | | | | | | |
Logistics Highlights: | | As of and for
Fiscal Year Ended | |
| | | December 31,
2018 | | | December 31,
2017 | | | December 31,
2016 | |
Transported volume (million RTK) | | | 56,351.5 | | | | 49,690.5 | | | | 40,270.4 | |
Port elevation volume (thousand tons) | | | 10,771.5 | | | | 13,133.0 | | | | 13,113.7 | |
North operations (R$ million) | | | 4,913.4 | | | | 4,439.7 | | | | 3,651.5 | |
South operations (R$ million) | | | 1,412.3 | | | | 1,283.1 | | | | 1,097.7 | |
Container operations (R$ million) | | | 259.2 | | | | 223.5 | | | | 265.4 | |
Net sales (R$ million) | | | 6,584.9 | | | | 5,946.3 | | | | 5,014.6 | |
62
Currently, Rumo owns and operates a large asset base, including a rail network consisting of four concessions that extend over approximately 12,000 kilometers of railway lines, more than 1,180 locomotives, over 30,200 rail cars, as well as distribution centers and warehousing facilities. Rumo provides efficient and complete logistics services to its clients through its operation of 12 transshipment terminals, either directly or through partnerships, which have a static storage capacity of approximately 900,000 tons, and where we store grains, sugar and other commodities. At its most important terminal, the logistics complex of Rondonópolis (in the state of Mato Grosso), Rumo has the capability to load over one million tons of grains per month. Moreover, Rumo controls two port terminals in Santos in the state of São Paulo, and holds equity interests in four other port terminals, three of which are in the port of Santos in the state of São Paulo and one in the state of Paraná, with a static storage capacity of approximately 1.3 million tons and a total loading capacity of approximately 29 million tons per year. The real estate Rumo leases in connection with its concessions contains areas available for construction and development of warehouses and logistics terminals, which makes it possible for Rumo to expand its operations and improve our logistics and other services. For example, the Grain Terminal of Guarujá (TGG) in the port terminal in Santos, in which Rumo currently has a 10% equity interest, is a significant port project that has been constructed and has the capacity to handle approximately 8 million tons of grain per year.
Operational Segments
Rumo organizes its operations into three segments that correspond to the main markets in which it operates: (1) the north operations segment, or “Northern Operations,” comprising the Malha Norte and Malha Paulista rail concessions, Rumo’s transshipment terminals located in the states of Mato Grosso and São Paulo, and Rumo’s port operation in Santos, (2) Rumo’s south operations business segment, or “Southern Operations,” comprising Malha Oeste and Malha Sul, as well as Rumo’s transshipment terminals in the state of Paraná, and (3) Rumo’s container operations business segment, or “Container Operations,” which comprise the operations of Brado Logística and other container operations.
The table below shows Rumo’s net sales by segment as well as a percentage of total net sales for the periods indicated:
| | | | | | | | | | | | | | | | | | | | | | | | |
| | | As of and for
Fiscal Year Ended | |
| | | December 31,
2018 | | | December 31,
2017 | | | December 31,
2016 | |
| | | (in R$ millions, except percentages) | |
Northern Operations | | | 4,913.4 | | | | 74.62 | % | | | 4,439.7 | | | | 74.66 | % | | | 3,651.5 | | | | 72.8 | % |
Southern Operations | | | 1,412.3 | | | | 21.45 | % | | | 1,283.1 | | | | 21.58 | % | | | 1,097.7 | | | | 21.9 | % |
Container Operations | | | 259.2 | | | | 3.94 | % | | | 223.5 | | | | 3.76 | % | | | 265.4 | | | | 5.3 | % |
| | | | | | | | | | | | | | | | | | | | | | | | |
Net sales | | | 6,584.9 | | | | 100 | % | | | 5,946.3 | | | | 100 | % | | | 5,014.6 | | | | 100 | % |
Major Customers
The majority of the cargo Rumo transports is for the agricultural commodities industry. Rumo’s major clients are export companies participating in this market, such as Amaggi, ADM, Bunge, Cargill, Louis Dreyfus and Raízen. In the fiscal year ended December 31, 2018, Bunge accounted for 13.9% of Rumo’s total net revenue from services, while Rumo’s six major clients accounted for 48% of Rumo’s total net revenue from services. In the fiscal year ended December 31, 2017, Bunge accounted for 15.0% of Rumo’s total net revenue from services, while Rumo’s six major clients accounted for 52.5% of Rumo’s total net revenue from services in the same period. Bunge is the principal customer of Rumo’s Northern Operations and Southern Operations and is active in agricultural commodities, especially corn, soy and derivatives thereof, loading cargo in transshipment terminals destined for ports which Rumo operates.
Rumo’s major clients in the rail sector are export companies such as Amaggi, ADM, Bunge, Cargill, Louis Dreyfus and Raízen. In the fiscal year ended December 31, 2018, Bunge accounted for 15.6% of Rumo’s net revenue from services in the rail sector, while Rumo’s six major clients in the rail sector jointly accounted for 53.9% of Rumo’s net revenue from services in that sector. In 2017, Bunge accounted for 14.5% of Rumo’s net revenue from services in the rail sector, while Rumo’s six major clients in the rail sector accounted for 46.4% of Rumo’s net revenue from services in that sector.
Rumo’s largest clients in the port elevation sector include Engelhart, Czarnikow, Cofco, Wilmar, Raízen and Sucden. In the fiscal year ended December 31, 2018, Engelhart accounted for 17.8% of our net revenue from services in the port elevation sector, while Rumo’s six largest clients in the port elevation sector collectively accounted for 70% of Rumo’s net revenue from services in that sector. In the fiscal year ended December 31, 2017, Raízen accounted for 17.9% of Rumo’s net revenue from services in the port elevation sector, while Rumo’s six largest clients in the port elevation sector accounted collectively for 52.3% of Rumo’s net revenue from services in that sector.
63
Seasonality
Rumo is subject to the seasonality that influences the sugarcane and grain harvest. During the peak months of the harvests, there is higher demand for transport and logistics operations. Rumo is also subject to the risk that sugarcane mills may change their production mix in favor of ethanol if the relative prices of the two products swing that way. This could reduce the demand for sugar logistics and transport. See also “Item 5. Operating and Financial Review and Prospects—Principal Factors Affecting Our Results of Operations—Seasonality.”
Regulation
Port Regulation
The Brazilian constitution provides that the federal government, directly or by delegation to third parties, shall exploit port activities in Brazil. In 2001, the National Waterway Transportation Agency (Agência Nacional de Transportes Aquaviários), or “ANTAQ,” was created in order to regulate the Brazilian port industry and to enter into the relevant concession and adhesion agreements regarding the provision of port services.
Until December 6, 2012, port operations in Brazil were governed by Federal Law No. 8,630, dated February 25, 1993, or the “Ports Modernization Law,” which provided the legal framework applicable to the exploitation of the publicly-owned port terminals and facilities in Brazil. In view of the need to improve the applicable legislation, the Brazilian government implemented Law 12,815 dated June 5, 2013, or the “New Ports Law,” which has been further amended by Decree No. 8,033/2013, as amended by Decree No. 9,084/2017. The New Ports Law revoked the Ports Modernization Law and established a new legal framework for port operations in Brazil.
Before the enactment of the Ports Modernization Law, most of the port terminals were exploited by the government. The Ports Modernization Law was enacted to enable the participation of private investors in the Brazilian port industry by the creation of different port terminal exploitation models: public and private.
The Ports Modernization Law assured to any private party the right to construct, reform, expand, improve, lease and operate a public port terminal located within the “organized port area,” which are designated areas where ports must serve the public interest and the need for port service, subject to an authorization from the relevant authority. The development of port activities in an organized port area should be preceded by a competitive bidding process and the execution of a concession agreement with the federal government.
In the case of Rumo, the Docks Company of the state of São Paulo (Companhia Docas do Estado de São Paulo), or “CODESP,” granted us the right to exploit public terminals at the port of Santos. The respective concessions agreements are dated as from 1996 and 2001. Accordingly, such agreements are governed by the Ports Modernization Law.
Rumo was qualified as a port operator under the Port Modernization Law and is currently subject primarily to the regulation of CODESP, which acts under the regulation of ANTAQ.
Public ports are governed by Law 12,815 dated June 5, 2013 and regulations that are still to be published by the Government in order to complement the provisions of Law 12,815 dated June 5, 2013. Law 12,815 dated June 5, 2013 does not provide for the need of adjustments of the terms of any concession agreements in force, requiring adjustments to be made only if both parties intend to extend the agreement. As a result, until new regulation provides otherwise, the concession agreements entered into by and between CODESP and us shall not be amended in order to adjust its terms to Law 12,815 dated June 5, 2013.
Rail Transportation Regulation
Following Rumo’s merger with ALL, we are subject to the regulation of the ANTT, which is responsible for monitoring road and rail transport operations and the federal concessions of road and rail infrastructure in Brazil. Previously, we were indirectly subject to such regulation due to the agreements we had in place with ALL.
Rail transportation activities in Brazil are subject to a wide variety of laws and regulations, such as: Law 8,987 dated February 13, 1995 (the “Concession Law”); ANTT Resolution 3,694 dated July 14, 2011 (which approves Regulations for Users of Rail Freight Services); ANTT Resolution 3,695 dated July 14, 2011 (which approves the Regulations of “Right of Passage” and “Mutual Traffic” operations); ANTT Resolution 3,696 dated July 14, 2011 (which approves the regulations for agreeing to production targets per stretch of railway and safety targets for concessionaires).
64
The Concession Law requires that the granting authority and concession holder enter into a concession agreement regulating the terms of such exploration and setting forth the terms applicable to the performance of the services (including with regards to the applicable penalties).
Waterborne Transportation Regulation
In Brazil, there are two main regulatory regimes affecting waterborne transportation: (i) the concession regime, which regulates the exploitation of publicly-owned port terminals and the leasing of publicly-owned terminals and (ii) the authorization regime, relating to new private port terminals and facilities. The main legislation applicable to this sector is: Law 12,815 dated June 5, 2013 (Ports Law) and Decree 8,033 of June 27, 2013.
Environmental Regulation
We are subject to various Brazilian federal, state and municipal environmental laws and regulations, among other matters, regarding to: (1) the issuance and renewal of valid environmental permits and authorizations; (2) the generation, storage, handling, use and transportation of hazardous materials; (3) the wildlife and natural resources preservation; (4) the protection of cultural and historic sites; (5) the emission and discharge of hazardous materials into the ground, air or water; and (5) the health and safety of our employees.
We are also required to obtain environmental permits and/or authorizations (such as installation and operation permits as well as permits for vegetation suppression and the storage, use and transportation of hazardous products) from governmental authorities for certain aspects of our operations. Failure to obtain environmental permits or comply with the conditions under which such permits are issued could subject us to criminal, administrative and/or civil liabilities. These laws, regulations and permits often require us to purchase and install pollution control equipment or to make operational changes to mitigate actual or potential impacts on the environment and/or health of our employees. In addition, Brazilian environmental laws restrict our ability to obtain financing from public entities in the event of a breach of certain environmental protection obligations. Any violations of these laws and regulations or permit conditions can result in substantial fines, criminal sanctions, revocation of operating permits and/or shutdowns of our facilities.
Under Brazilian environmental laws, we could be held strictly liable for all of the costs relating to any contamination at our or our predecessors’ current and former facilities and at third-party waste disposal sites used by us or any of our predecessors (propter rem liability). We could also be held responsible for any and all consequences arising out of human exposure to hazardous substances, such as pesticides, herbicides, soil or groundwater contamination.
We are party to a number of administrative and judicial proceedings for alleged failure to comply with environmental laws, which may result in fines, suspension of activities or other adverse effects on our operations. Infractions that give rise to administrative proceedings may also lead to civil or criminal claims against us.
Rail Concessions
We conduct our rail activities through the following concession agreements: (1) the concession agreement entered into on December 30, 1998 involving Malha Paulista, expiring in 2028 (which may be extended for a further 30 years); (2) the concession agreement entered into on May 19, 1989 involving Malha Norte, expiring in 2079; (3) the concession agreement entered into on July 7, 1996 involving Malha Oeste, expiring in 2026; and (4) the concession agreement entered into on February 27, 1997 involving Malha Sul, expiring in 2027 (which may be extended for a further 30 years).
In September 2015, we filed formal requests for the renewal of the Malha Sul and Malha Paulista concession agreements with the ANTT. Such requests are currently under review by the ANTT. The request relating to the Malha Paulista concession was duly approved by the ANTT and is currently under review by the Brazilian Federal Court of Auditors pursuant to Law No. 13,488/2017. Our expectation is that this review will be completed during the course of 2019. The analysis of the Malha Sul renewal request should resume following the conclusion of the ANTT’s analysis of the renewal request relating to Malha Paulista.
65
The granting authority may unilaterally rescind all of our rail concession agreements prior to their expiration in the following circumstances:
| | • | | encampação, which is the takeover of the provision of the services by the granting authority by means of specific legal order and prior payment of indemnity; |
| | • | | forfeiture, which means the complete or partialnon-performance of the concession agreement or failure to comply with the financial terms of the concession agreement and the lease agreement (when there is one force); |
| | • | | bankruptcy or dissolution of the concession holder; or |
| | • | | cancellation of the bidding process. |
The enforcement of any of the unilateral termination provisions of the concession agreement must be preceded by the relevant administrative proceeding with ANTT and may result in indemnity to us for assets that revert to the granting authority. As of the date of annual report, there is no fact enabling the application of any of the unilateral termination events of the concessions.
See also “Item 3. Key Information—D. Risk Factors—Risks Related to Our Businesses, the Operations of Our Joint Venture, and Industries in Which We Operate––The loss of Brazilian railway concessions may have a material adverse effect on our business.” and “Item 3. Key Information––D. Risk Factors—Risks Related to Our Businesses, the Operations of Our Joint Venture, and Industries in Which We Operate–– Rumo may not obtain early renewals of Rumo Malha Paulista S.A., or “Malha Paulista,” and Rumo Malha Sul S.A., or “Malha Sul,” concession agreements, currently under review by the ANTT, which may have a material adverse effect on Rumo’s investment plan and growth strategy.”
Port Lease Agreements
We lease 118,434.38 square meters of property located in the port of Santos (state of São Paulo), which has two docking cradles for loading sugar and solid agricultural bulk (corn and soy). We lease this property pursuant to lease agreementPRES-05/96, which matures on March 6, 2036. Pursuant to Article 57 of the Ports Modernization Law and Article 19 of Decree No. 8,033/2013. This lease can be legally extended up to 2066 through new investments. Pursuant to the lease agreement, we have an obligation to make investments totaling an estimated R$308 million, which we estimate to complete by February 2019.
We also hold equity interests in: (1) Terminal XXXIX and the adjacent areas for moving agricultural products and bulk as well as other goods capable of being transported in those port installations, through a port lease agreement due to expire in 2050; (2) facilities, equipment and track for rail transport of goods and import/export through the right and left banks of the port of Santos, by means of a lease agreement with Portofer Transporte Ferroviário Ltda. due to expire in 2025; (3) Terminal de Granéis do Guarujá (TGG) located on the left bank of the port of Santos, for the transport of solid and liquid bulk, through an area used by Malha Norte via a leasing agreement due to expire in 2022; and (4) Terminal Marítimo do Guarujá (TMG), located on the left bank of the port of Santos, mainly for the transport of solid and liquid bulk, through an area used by Malha Norte via a lease agreement due to expire in 2022.
There are ongoing legal proceedings regarding whether the lease agreements relating to Terminal XXXIX, Terminal de Granéis do Guarujá and Terminal Marítimo do Guarujá should be subject to the public procurement regime. These proceedings are currently under appeal in the Brazilian superior courts (Superior Tribunal de Justiça and Supremo Tribunal Federal). With regards to the Portofer lease agreement, there is an ongoing investigation by the Brazilian Federal Prosecutors’ Office, of anon-criminal nature, to assess the legal validity of the agreement.
If we fail to comply with the applicable regulatory rules or contractual obligations, our lease may be terminated early pursuant to the Concessions Law (Law No. 8,987/1995), which applies to port leases.
66
Competition
Fuel Distribution
In the fuel distribution business, we are subject to competition, both from companies in the industries in which we operate and from companies in other industries that produce similar products. Our competitors include service stations of large integrated oil companies, independent gasoline service stations, convenience stores, fast food stores, and other similar retail outlets, some of which are well-recognized national or regional retail systems. The Brazilian fuel distribution industry has consolidated significantly in recent years, with the three major distributors increasing their combined market share from 65.2% in 2000 to approximately 69.1% in 2018, according to ANP and considering all products.
According to Plural, formerly known as Sindicom, as of January 1, 2018, thetop-three distributors in Brazil are: Petrobras, operating through the BR Distribuidora brand, Raízen, through the Shell brand and Ultrapar S.A., through the Ipiranga brand. The main competitive factors affecting the retail marketing operations include site location, product price, selection and quality, site appearance and cleanliness, hours of operation, store safety, customer loyalty and brand recognition.
Sugar, Ethanol and Cogeneration
The sugar industry in Brazil has experienced increased consolidation through merger and acquisition activity during the past decades. Most of this activity has involved companies and facilities located in the central-south region of Brazil, one of the most productive sugar producing regions in the world.
We also face competition from international sugar producers. According to UNICA, as of December, 2018, we are the largest sugar producer in Brazil and the largest sugar exporters in the world with 4.3 million tons of sugar produced in the 2017/18 harvest, compared to Tereos (5.3 million tons of sugar produced in the 2017/2018 harvest) and Südzucker AG of Germany (with 5.9 million tons of sugar produced in the 2017/2018 harvest). These producers, however, are the beneficiaries of considerable governmental subsidies in their principal sales markets.
We also face competition from international ethanol producers that use other ethanol sources, such as corn, for the generation of fuel ethanol.
Natural Gas
Comgás’ concession area covers approximately 26% of Brazil’s GDP, including approximately 88 municipalities in the metropolitan areas of São Paulo, Campinas and Santos as well as the Paraíba Valley. Comgás distributes natural gas for residential, commercial and industrial customers, and also supplies gas for use as fuel for vehicles and electricity generation. For the residential and commercial customers, Comgás holds exclusivity rights within its area of concession. For industrial customers, Comgás has exclusive distribution rights until 2029. Comgás faces competition from electricity concessionaires, oil and ethanol producers in its activities.
Logistics
Companies active in the Brazilian railroad transport market generally provide logistics services in their respective regions, with regions being allocated to various companies based on the public concessions granted by the ANTT. The necessity of obtaining a concession from the ANTT represents a barrier to the entry of new competitors into the market given that each concession area is granted to a single operator. As there are currently no parallel rail tracks in the Brazilian railway network, the competition in the market in which we operate primarily derives from truck transportation, which can compete for the same freight as rail operators. Clients generally select a mode of transportation based on the best terms and conditions offered to them in the market.
The main factors on which transport companies compete are the freight rates charged, efficiency and volume. Given our offering of advantageous prices coupled with our significant transport capacity and greater efficiency, we believe we have significant opportunities to increase our current market share within the areas in which we operate and that we are in a better strategic position than our competitors to seize the growth opportunities in these industries.
Historically, railroad freight prices have varied in conjunction with road freight prices. Freight prices in the road transportation market have increased significantly in the past years, as illustrated below. We expect this increase to also benefit railroad operators such as us, given the correlation between road and rail freight prices.
67
Patents, Licenses, Contracts and Processes
In Brazil, ownership of trademarks can be acquired only through a validly approved registration with the National Institute of Intellectual Property (Instituto Nacional de Propriedade Industrial, or “INPI”), the agency responsible for registering trademarks, patents and designs in Brazil. After registration, the owner has exclusive rights of use of the trademark throughout Brazil for aten-year period that can be successively renewed for equal periods.
As of the date of this annual report, we own 324 trademarks in Brazil, 81 of which are owned by Cosan S.A., 20 of which are owned by Cosan Logística, with the remaining 223 owned by other companies of the Cosan group. All material trademarks for our business are registered or have been submitted to INPI by us or our affiliates.
Research and Development
Our main research and development activities for the fiscal years ended December 31, 2018, 2017 and 2016 concentrated in the following key areas:
| | • | | We engage CanaVialis S.A., or “CanaVialis,” to provide us with access to its sugarcane genetic improvement program specifically tailored to Raízen Energia’s mills. CanaVialis, which is a subsidiary of Monsanto, is a privately owned firm focused on the genetic improvement of sugarcane. We benefit from their support services and use of their bio factory, which allows us to decrease the amount of time required for seedling production and grants us access to new, improved sugarcane varieties through their genetic improvement program. CanaVialis also conducts field trials and region-specific genetic selection programs to develop sugarcane varieties for our greenfield projects for the construction of new sugarcane mills. |
| | • | | Raízen also invests in innovation in the ethanol manufacturing process. Raízen has an interest in Shell’s commercialization rights of Iogen Energy, which conducts research into advanced fuels, including ethanol extracted from the cellulose of sugarcane and other plants. |
| | • | | We conduct research and development into renewable base oils through Novvi S.A., a Joint Venture between Cosan S.A. and Amyris formed in 2011. Novvi was established for the worldwide development, production and commercialization of renewable base oils made from Biofene, Amyris’ renewable farnesene. |
| | • | | We originally established Payly in November 2018 to operate a digital payment scheme to consumers and B2B partners. Payly provides payment processing services to consumers through a digital wallet, and delivers a payment arrangement solution to enterprises. This provides Payly with deep insights into the needs of merchants and end consumers, thereby becoming a comprehensive platform and entry point for payment, lifestyle and innovative financial services. Payly charges a fee based on a certain percentage of the payment amount processed and also generates value through the accounts balance investment. |
Our total research and development expenditure amounted to R$2.8 million in the fiscal year ended December 31, 2018, R$2.9 million in the fiscal year ended December 31, 2017 and R$3.7 million in the fiscal year ended December 31, 2016, respectively.
| C. | Organizational Structure |
We are an integrated energy and infrastructure company and, when considered together with the Joint Venture, a Brazilian market leader in fuel distribution, sugar and ethanol production, natural gas distribution and logistics. Our main operations include: (1) the distribution of fuels in the Brazilian market through Raízen Combustíveis, our downstream Joint Venture company; (2) the production and sale of sugar and ethanol and the cogeneration of electricity from sugarcane bagasse through Raízen Energia, our upstream Joint Venture company; (3) the distribution of piped natural gas in part of the state of São Paulo through our subsidiary Comgás, which has been consolidated since November 2012; (4) logistics services including transportation, port loading and storage of sugar, through our indirectly owned subsidiary Rumo; (5) the production and distribution of lubricants under the Mobil licensed trademark in Brazil, Bolivia, Uruguay and Paraguay, in addition to the European and Asian markets under the Comma brand; and (6) an online payment services platform and certain other investments, or “Cosan Corporate.”
At October 1, 2014, the PartialSpin-off of the “Rumo” segment of Cosan S.A. to “Cosan Logística S.A.” was approved by Cosan S.A.’s shareholders, becoming fully effective on October 6, 2014. This PartialSpin-off does not affect the consolidated financial statements of Cosan Limited.
68
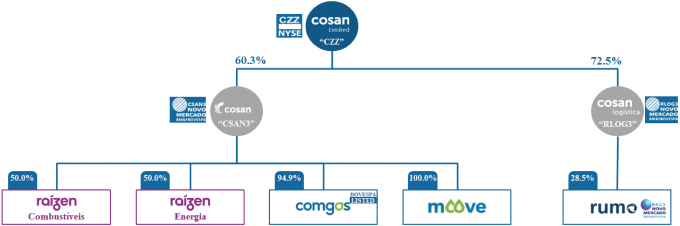
A list of the Company’s subsidiaries is included in note 8.1 of our audited consolidated financial statements for the fiscal years ended December 31, 2018, 2017 and 2016 attached hereto. See also Exhibit 8.1 to this annual report, which contains a list of our subsidiaries.
Until the adoption of IFRS 11, these investments were accounted for using the proportional consolidation method. Upon the adoption of IFRS 11 in the transition period ended December 31, 2013, these investments are accounted for under the equity method. The Joint Venture consists of three separate legal entities:
| | • | | Raízen Combustíveis S.A.: a downstream company, which conducts the supply, distribution and sale of fuels in Brazil. In 2017, the resulting company had a network of 6,524 fuel stations throughout Brazil. Cosan S.A. and its subsidiaries and Shell and its affiliates likewise each own 50% common equity interest in this entity. In this entity, however, Cosan S.A. and its subsidiaries own 50% minus one of the voting shares, whereas Shell and its affiliates own 50% plus one of the voting shares. Cosan S.A. and its subsidiaries and Shell and its affiliates also hold preferred shares bearing preferential dividend rights in certain circumstances if certain contingent targets are met. |
| | • | | Raízen Energia S.A.: a sugar and ethanol company, which, among other things, conducts the production of sugar and ethanol, as well as all cogeneration activities. Cosan S.A. and its subsidiaries and Shell and its affiliates each own 50% common equity interest in this entity. In addition, Cosan S.A. and its subsidiaries own 50% plus one share of the voting shares (and preferred shares bearing preferential dividend rights in certain circumstances), whereas Shell and its affiliates own 50% minus one of this entity’s voting shares. |
| | • | | Raízen S.A.: previously, Raízen S.A. was a management company, which is the Joint Venture’s face to the market and facilitates the building of a unified corporate culture. Cosan S.A. and its subsidiaries and Shell and its affiliates each used to own 50% of the equity and voting interests in this company. On November 18, 2016, both Cosan S.A. and Shell sold 100% of their respective shares in the share capital of Raízen S.A. to Raízen Combustíveis, as a result of which Raízen Combustíveis is currently the sole shareholder of Raízen S.A. |
| D. | Property, Plant and Equipment |
For more information related to property, plant and equipment see note 10.1 of our audited consolidated financial statements for the fiscal years ended December 31, 2018, 2017 and 2016 attached hereto. See also “—Capital Expenditures” for a description of our ongoing expansions and renovations of our property, plant and equipment.
We present a summary below of our material tangible fixed assets, including investment properties and intangible assets (concessions), by segment:
Raízen Combustíveis
Raízen Combustíveis distributes fuels through 67 distribution terminals to 6,524 service stations throughout Brazil under the Shell brand and also has 68 airport terminals supplying aviation fuel. For the next year, new investments are expected to be made in port terminals, increasing trading capacity and, consequently, expanding our operations.
In 2018, Raízen Combustíveis acquired Shell’s downstream operations in Argentina. The assets acquired consist of a refinery, located in the Buenos Aires metropolitan region, with a refining capacity of 108 thousand barrels per day, which distributes fuels and lubricants through 645 strategically-located service stations under the Shell brand, of which 10% are owned by Raízen Combustíveis.
69
Raízen Energia
Raízen Energia operates 26 mills with a crushing capacity of 73 million tons and 981 MW of annual generation capacity. All of these facilities are located in the central and southeastern regions of Brazil, which is one of the world’s most productive sugarcane regions, primarily because of its favorable soil, topography and climate, nearby research and development organizations and logistics infrastructure.
Comgás
Comgás is Brazil’s largest natural gas distributor with a pipeline network of over 16,747 kilometers, supplying natural gas to 1.9 million residential, commercial and industrial consumers in over 177 cities. Its concession area accounts for approximately 26% of Brazil’s GDP, covering approximately 88 municipalities in the metropolitan areas of São Paulo, Campinas, Santos and the Paraíba Valley.
Moove
Moove has a production plant located on the Ilha do Governador, Rio de Janeiro, with a production capacity of 2.5 million barrels of lubricants per year, storage capacity for base oils and lubricants (620,000 barrels) and a pier facility for docking ships of up to 20,000 tons. Moove also has another production plant located in Kent, England, United Kingdom, with a production capacity of 440,000 barrels per year and storage capacity of 31,000 barrels.
Cosan Logística
Rumo concluded the ALL Acquisition on April 1, 2015 and is Brazil’s largest railroad-based logistics operator in terms of total volume transported, providing rail transport logistics, port handling and warehousing services. We operate in the states of Mato Grosso and São Paulo as well as the southern region of Brazil. According to MDIC and IBGE data as of 2018, our rail network extends over an area that accounts for approximately 80% of Brazil’s GDP, where four of the most active ports in the country are located and through which most of Brazil’s grain production is exported.
Rumo owns and operates a large asset base, including a rail network consisting of four concessions that extend over approximately 12,000 kilometers of railway lines, over 1,180 locomotives, over 30,200 rail cars, as well as distribution centers and warehousing facilities. Rumo provides efficient and complete logistics services to its clients through its operation of 12 transshipment terminals, either directly or through partnerships, which have a static storage capacity of approximately 900,000 tons, and where it stores grains, sugar and other commodities. At its most important terminal, the logistics complex of Rondonópolis (in the state of Mato Grosso), Rumo has the capability to load over 1 million tons of grains per month. Moreover, it controls two port terminals in Santos in the state of São Paulo, and holds equity interests in four other port terminals, three of which are in the port of Santos and one in the state of Paraná, with a static storage capacity of approximately 1.3 million tons and a total loading capacity of approximately 29 million tons per year. The real estate it leases in connection with its concessions contains areas available for construction and development of warehouses and logistics terminals, which makes it possible for Rumo to expand its operations and improve its logistics and other services.
The transportation of agricultural commodities, primarily for export, represented approximately 82%, 83% and 82% of Rumo’s transported volume in the fiscal years ended December 31, 2018, 2017 and 2016, respectively. The transportation of industrial products represented approximately 18%, 17% and 18% of Rumo’s transported volume in the same periods, respectively. In addition, in the fiscal years ended December 31, 2018, 2017 and 2016, approximately 73%, 60.1% and 70%, respectively, of Rumo’s transported volume derived from the transportation of grains.
Rumo also provides intermodal transportation logistics services, which is the movement of freight via container using two or more modes of transportation (generally rail and truck). We believe that these methods of transportation reduce the costs of cargo handling, because containers are typically consolidated from trucks onto trains or ships that can carry mass loads, allowing for fuel efficiency.
70
Capital Expenditures
Our capital expenditure program is currently focused on the following areas (each of these primarily within Brazil):
Raízen Energia
Raízen Energia invests in biological asset and intercrop maintenance as well certain operational and other projects expenditures, as set forth below. The funds used by Raízen Energia for making capital expenditures are generated from its working capital and existing or new indebtedness.
Biological Asset and Intercrop Maintenance
Raízen Energia invests in maintaining and renewing sugarcane fields at approximately 70% of its total capital expenditures per year. Raízen Energia also invests every year in intercrop maintenance (i.e., primarily in plant and agricultural machine repairs during the times in which no operations are ongoing). The biological asset and intercrop maintenance capital expenditures totaled approximately R$1,828 million in the fiscal year ended December 31, 2018.
Operational and Other Projects Expenditures
Raízen Energia has several other investments that include health, safety and environmental initiatives, sustaining, ethanol and sugar logistics, harvest and planting mechanization, expansion through brownfield projects among other projects. An important part of these investments aims to increase the productivity and efficiency of its operations. The operational and other projects capital expenditures totaled approximately R$748 million in the fiscal year ended December 31, 2018.
Raízen Combustíveis
Raízen Combustíveis invests in maintaining and expanding infrastructure, including, among others, its service stations network expansion. The capital expenditure of Raízen Combustíveis in the fiscal year ended December 31, 2018 amounted to R$994 million, of which 86% was invested in Brazil (R$857 million) mainly in its service station network, and the remaining 14% was invested in Argentina (R$137 million). The funds used by Raízen Combustíveis for making capital expenditures are generated from its working capital and existing or new indebtedness.
We are required by Resolution No. 1,283/2006, an environmental regulation issued by the Argentinian Energy Secretariat (Secretaría de Energía de Argentina), to perform certain mandatory capital expenditures related to product quality (PQU) at the Buenos Aires refinery. Pursuant to the applicable rules, we are required to complete this investment by 2022.
Comgás
Comgás has been investing in its network expansion and during the fiscal year ended December 31 2018, it invested R$530 million, of which approximately 60% was associated with expansion programs, approximately 28% was related to network support investments, and approximately 12% was related to administrative and software investments. The funds used by Comgás for making capital expenditures are generated from its working capital and existing or new indebtedness.
Cosan Logística
Rumo’s strategy is focused on investments in the renovation of assets, in particular its locomotives and railcar fleet, through the purchase of new rolling stock to replace assets in poor condition of use. The purpose of Rumo’s investment in rail tracks is to reduce its operating costs and maximize its transported volume. As result of Rumo’s ongoing efforts, Rumo is increasing capacity while reducing transit time along some of our major routes. During the fiscal year ended December 31, 2018, Rumo’s total investments in property, plant and equipment and intangible assets amounted to R$2,020 million in the aforementioned initiatives, including overhauling 393 km of tracks and, purchasing 163 railcars and 19 new locomotives. Approximately 61% of the capital expenditure mentioned above was invested in nonrecurring expansion projects and 39% in recurring projects.
The funds used by Rumo for making capital expenditures are generated from Rumo’s operating results and from financings and credit extended by private banks, as well as by publicly-owned banks such as BNDES. Since the beginning of Rumo’s rail operations, BNDES has been an important partner in the development of Rumo’s infrastructure, providing support through long-term credit lines in line with Rumo’s investment plan published in April 2015.
71
Moove
During the fiscal year ended December 31, 2018, Moove’s capital expenditure totaled R$47.8 million, of which 47% (R$22.6 million) was invested in Moove’s Brazilian operations and the remainder in European operations. Approximately half of the capital expenditure in Brazil was invested in renewing and increasing tank capacity. The other half was mostly invested in recurring projects. In Europe, approximately 70% was invested in recurring projects, while the remainder was invested in expansion projects. The funds used by Moove for making capital expenditures are generated from its working capital and existing or new indebtedness.
| E. | Supplemental Information About Joint Venture |
Upon the application of IFRS 11, the Company retrospectively changed the accounting for its investments in Raízen Combustíveis and Raízen Energia, classifying them as jointly-controlled entities (Joint Ventures) under the new standard. Although, Raízen Combustíveis and Raízen Energia are not consolidated in our financial statements (since March 31, 2013) we have included below a summary of business performance derived from note 4 (Segment information) to our audited financial statements for the periods indicated.
The discussion in this section is based on a comparison of the audited fiscal year ended December 31, 2018 with the audited fiscal year ended December 31, 2017, and on a comparison of the audited fiscal year ended December 31, 2017 with the audited fiscal year ended December 31, 2016.
Results of Operations for the Joint Venture for the Fiscal Year Ended December 31, 2018 Compared to the Fiscal Year Ended December 31, 2017
Net Sales
| | | | | | | | | | | | |
| | | For the Fiscal
Year Ended
December 31, 2018 | | | For the Fiscal
Year Ended
December 31, 2017 | | | %
Variation | |
| | | (in millions ofreais, except percentages) | |
Raízen Energia(1) | | | 19,798.6 | | | | 13,152.8 | | | | 50.53 | % |
Ethanol | | | 8,569.4 | | | | 6,550.7 | | | | 30.82 | % |
Sugar | | | 3,670.8 | | | | 5,377.4 | | | | (31.74 | )% |
Cogeneration | | | 2,836.7 | | | | 884.3 | | | | 220.78 | % |
Other | | | 4,721.7 | | | | 340.4 | | | | N/A | |
Raízen Combustíveis(1) | | | 85,204.1 | | | | 72,789.1 | | | | 17.06 | % |
Fuel | | | 84,031.8 | | | | 72,789.1 | | | | 15.45 | % |
Other | | | 1,172.3 | | | | — | | | | — | |
| (1) | Includes 100% of these entities’ net sales. The Company holds a 50% equity interest in each of these entities, which upon the application of IFRS 11 are recorded in the “Equity income of jointly-controlled entity” line item in the consolidated statements of profit or loss and comprehensive income for the fiscal years ended December 31, 2018 and 2017. |
The change in the various components consists of the following:
Raízen Energia
Raízen Energia’s sales in the fiscal year ended December 31, 2018 amounted to R$19,798.6 million, an increase when compared to net revenues of R$13,152.8 million for the fiscal year ended December 31, 2017. This was primarily due to a 38% increase in volumes sold arising from the acquisition of WX Energia, as a result of which there was an increase of 221% in cogeneration sales and energy trading in the fiscal year ended December 31, 2018 as compared to the fiscal year ended December 31, 2017. This increase was offset by a 32% decrease in sugar sales, mainly due to 20% lower average prices and 23.4% lower sales volume.
Raízen Combustíveis
Raízen Combustíveis’ net sales increased from R$72,789.1 million in the fiscal year ended December 31, 2017 to R$85,204.1 million in the fiscal year ended December 31, 2018, or 17%. This increase reflects an increase in volume sold as a result of the improvements in Brazil’s macroeconomic environment during the course of 2018.
72
Cost of Sales
| | | | | | | | | | | | |
| | | For the Fiscal
Year Ended
December 31, 2018 | | | For the Fiscal Year
Ended
December 31, 2017 | | | %
Variation | |
| | | (in millions ofreais, except percentages) | |
Raízen Energia(1) | | | (18,136.4 | ) | | | (10,907.7 | ) | | | 66.27 | % |
Raízen Combustíveis(1) | | | (81,298.4 | ) | | | (68,875.3 | ) | | | 18.04 | % |
| | | | | | | | | | | | |
Cost of Sales | | | (99,434.8 | ) | | | (79,783.0 | ) | | | 24.63 | % |
| | | | | | | | | | | | |
| (1) | Includes 100% of these entities’ cost of sales. The Company holds a 50% equity interest in each of these entities, which upon the application of IFRS 11 are recorded in the “Equity income of jointly-controlled entity” line item in the consolidated statements of profit or loss and comprehensive income for the fiscal years ended December 31, 2018 and 2017. |
Raízen Energia
The cost of sales in the fiscal year ended December 31, 2018 increased 66.27%, or R$7,228.7 million, as compared to the fiscal year ended December 31, 2017, due mainly to (i) higher diesel costs, which affected agricultural operations; (ii) lower sugarcane field productivity; and (iii) cost inflation.
Raízen Combustíveis
The cost of sales in the fiscal year ended December 31, 2018 increased 18.04%, or R$12,423.1 million, as compared to the fiscal year ended December 31, 2017. This increase is due to higher sales volume (1.7%) and increases in gasoline and diesel prices (of 5.97% and 3.75%, respectively), pursuant to the pricing policy implemented by Petrobras in October 2016.
Selling Expenses
| | | | | | | | | | | | |
| | | For the Fiscal
Year Ended
December 31, 2018 | | | For the Fiscal Year
Ended
December 31, 2017 | | | %
Variation | |
| | | (in millions ofreais, except percentages) | |
Raízen Energia(1) | | | (768.8 | ) | | | (803.2 | ) | | | (4.28 | )% |
Raízen Combustíveis(1) | | | (1,506.7 | ) | | | (1,345.8 | ) | | | 11.96 | % |
| | | | | | | | | | | | |
Selling expenses | | | (2,275.5 | ) | | | (2,149.0 | ) | | | 5.89 | % |
| | | | | | | | | | | | |
| (1) | Includes 100% of these entities’ selling expenses. The Company holds a 50% equity interest in each of these entities, which upon the application of IFRS 11 are recorded in the “Equity income of jointly-controlled entity” line item in the consolidated statements of profit or loss and comprehensive income for the fiscal years ended December 31, 2018 and 2017. |
Raízen Energia
Raízen Energia’s selling expenses decreased R$34.4 million, or 4.28%, in the fiscal year ended December 31, 2018 as compared to the fiscal year ended December 31, 2017, due primarily to a R$33.6 million decrease in expenses with logistics. The lower logistics expenses can be principally attributed to the higher efficiency of the loading and unloading process in the fiscal year ended December 31, 2018 as compared to the fiscal year ended December 31, 2017 as a result of initiatives implemented to improve this process.
Raízen Combustíveis
Raízen Combustíveis’ selling expenses increased to R$1,506.7 million, or 11.96%, in the fiscal year ended December 31, 2018, from R$1,345.8 million in the fiscal year ended December 31, 2017, due primarily to a R$117 million increase in expenses with logistics attributed to the consolidations of Raízen’s operations in Argentina in the fourth quarter of 2018.
73
General and Administrative Expenses
| | | | | | | | | | | | |
| | | For the Fiscal
Year Ended
December 31, 2018 | | | For the Fiscal Year
Ended
December 31, 2017 | | | %
Variation | |
| | | (in millions ofreais, except percentages) | |
Raízen Energia(1) | | | (664.7 | ) | | | (618.1 | ) | | | 7.54 | % |
Raízen Combustíveis(1) | | | (526.2 | ) | | | (455.7 | ) | | | 15.47 | % |
| | | | | | | | | | | | |
General and administrative expenses | | | (1,190.9 | ) | | | (1,073.8 | ) | | | 10.91 | % |
| | | | | | | | | | | | |
| (1) | Includes 100% of these entities’ general and administrative expenses. The Company holds a 50% equity interest in each of these entities, which upon the application of IFRS 11 are recorded in the “Equity income of jointly-controlled entity” line item in the consolidated statements of profit or loss and comprehensive income for the fiscal years ended December 31, 2018 and 2017. |
Raízen Energia
General and administrative expenses totaled R$664.7 million in the fiscal year ended December 31, 2018, an increase of 7.54% compared to the fiscal year ended December 31, 2017, primarily due to a 8% increase in personnel expenses due to salary inflation.
Raízen Combustíveis
General and administrative expenses totaled R$526.2 million in the fiscal year ended December 31, 2018, an increase of 15.47%, or R$70.5 million, compared to the fiscal year ended December 31, 2017, primarily due to the impact of inflation on general expenses.
Results of Operations for the Joint Venture for the Fiscal Year Ended December 31, 2017 Compared to the Fiscal Year Ended December 31, 2016
Net Sales
| | | | | | | | | | | | |
| | | For the
Fiscal Year
Ended
December 31,
2017 | | | For the
Fiscal Year
Ended
December 31,
2016 | | | %
Variation | |
| | | (in millions ofreais, except percentages) | |
Raízen Energia(1) | | | 13,152.8 | | | | 13,133.8 | | | | 0.14 | % |
Ethanol | | | 6,550.7 | | | | 6,480.4 | | | | 1.08 | % |
Sugar | | | 5,377.4 | | | | 5,794.8 | | | | (7.20 | )% |
Cogeneration | | | 884.3 | | | | 520.5 | | | | 69.89 | % |
Other | | | 340.4 | | | | 338.1 | | | | 0.68 | % |
Raízen Combustíveis(1) | | | 72,789.1 | | | | 68,143.0 | | | | 6.82 | % |
Fuel | | | 72,789.1 | | | | 68,143.0 | | | | 6.82 | % |
| (1) | Includes 100% of these entities’ net sales. The Company holds a 50% equity interest in each of these entities, which upon the application of IFRS 11 are recorded in the “Equity income of jointly-controlled entity” line item in the consolidated statements of profit or loss and comprehensive income for the fiscal years ended December 31, 2017 and 2016. |
The change in the various components consists of the following:
Raízen Energia
Raízen Energia’s sales in the fiscal year ended December 31, 2017 amounted to R$13,152.8 million, in line with net revenues of R$13,133.8 million the fiscal year ended December 31, 2016. Higher average electric energy prices on top of higher volumes sold generated an increase of 69.9% in cogeneration sales, reflecting better market prices in the period. This effect was partially offset by a 7.2% decrease in sugar sales, mainly due to lower international prices.
74
Raízen Combustíveis
Raízen Combustíveis’ net sales in the fiscal year ended December 31, 2017 increased from R$68,143.0 million to R$72,789.1 million, or 6.8%, as compared to the fiscal year ended December 31, 2017. This growth reflects higher volume sold, mainly gasoline and diesel, and higher prices of (i) gasoline (5%) and diesel (1%) adjusted by Petrobras; and (ii) ethanol (ESALQ base). This increase in prices and in volume sold is a result of the improvements in Brazil’s macroeconomic environment during the course of 2017.
Cost of Sales
| | | | | | | | | | | | |
| | | For the
Fiscal Year
Ended
December 31,
2017 | | | For the Fiscal
Year Ended
December 31,
2016 | | | %
Variation | |
| | | (in millions ofreais, except percentages) | |
Raízen Energia(1) | | | (10,907.7 | ) | | | (9,967.5 | ) | | | 9.43 | % |
Raízen Combustíveis(1) | | | (68,875.3 | ) | | | (64,445.9 | ) | | | 6.87 | % |
| | | | | | | | | | | | |
Cost of Sales | | | (79,783.0 | ) | | | (74,413.4 | ) | | | 7.22 | % |
| (1) | Includes 100% of these entities’ cost of sales. The Company holds a 50% equity interest in each of these entities, which upon the application of IFRS 11 are recorded in the “Equity income of jointly-controlled entity” line item in the consolidated statements of profit or loss and comprehensive income for the fiscal years ended December 31, 2017 and 2016. |
Raízen Energia
The cost of sales in the fiscal year ended December 31, 2017 increased 9.4%, or R$10,907.7 million, as compared to the fiscal year ended December 31, 2016, due mainly to higher resale and trading costs (26%) reflecting greater volumes in the sales mix, which has higher unitary cost.
Raízen Combustíveis
The cost of sales in the fiscal year ended December 31, 2017 increased 6.9%, or R$4,429.4 million, as compared to the fiscal year ended December 31, 2016. This increase is due to higher sales volume (2.9%) and increases in gasoline and diesel prices, according to the pricing policy implemented by Petrobras in October 2016 and higher logistics costs as a result of our supply strategy.
Selling Expenses
| | | | | | | | | | | | |
| | | For the
Fiscal Year
Ended
December 31,
2017 | | | For the Fiscal
Year Ended
December 31,
2016 | | | %
Variation | |
| | | (in millions ofreais, except percentages) | |
Raízen Energia(1) | | | (803.2 | ) | | | (732.7 | ) | | | 9.62 | % |
Raízen Combustíveis(1) | | | (1,345.8 | ) | | | (1,303.3 | ) | | | 3.26 | % |
| | | | | | | | | | | | |
Selling expenses | | | (2,149.0 | ) | | | (2,036.0 | ) | | | 5.55 | % |
| | | | | | | | | | | | |
| (1) | Includes 100% of these entities’ selling expenses. The Company holds a 50% equity interest in each of these entities, which upon the application of IFRS 11 are recorded in the “Equity income of jointly-controlled entity” line item in the consolidated statements of profit or loss and comprehensive income for the fiscal years ended December 31, 2017 and 2016. |
Raízen Energia
Raízen Energia’s selling expenses increased R$70.5 million, or 9.6%, in the fiscal year ended December 31, 2017 as compared to the fiscal year ended December 31, 2016, due primarily to 7.2% higher expenses with freight. These higher freight expenses can be principally attributed to the higher volume of sales, driven primarily by ethanol resale and trading volumes, which increased by 40.2%.
75
Raízen Combustíveis
Raízen Combustíveis’ selling expenses increased to R$1,345.8 million, or 3.3%, in the fiscal year ended December 31, 2017, from R$1,303.3 million in the fiscal year ended December 31, 2016, due primarily to an increase of 19% in freight and logistics expenses, which partly offset by lower tax expenses when compared to 2016.
General and Administrative Expenses
| | | | | | | | | | | | |
| | | For the Fiscal
Year Ended
December 31, 2017 | | | For the Fiscal Year
Ended
December 31, 2016 | | | %
Variation | |
| | | (in millions ofreais, except percentages) | |
Raízen Energia(1) | | | (618.1 | ) | | | (567.4 | ) | | | 8.94 | % |
Raízen Combustíveis(1) | | | (455.7 | ) | | | (447.8 | ) | | | 1.76 | % |
| | | | | | | | | | | | |
General and administrative expenses | | | (1,073.8 | ) | | | (1,015.2 | ) | | | 5.77 | % |
| | | | | | | | | | | | |
| (1) | Includes 100% of these entities’ general and administrative expenses. The Company holds a 50% equity interest in each of these entities, which upon the application of IFRS 11 are recorded in the “Equity income of jointly-controlled entity” line item in the consolidated statements of profit or loss and comprehensive income for the fiscal years ended December 31, 2017 and 2016. |
Raízen Energia
General and administrative expenses totaled R$618.1 million in the fiscal year ended December 31, 2017, an increase of 8.9% compared to the fiscal year ended December 31, 2016, primarily due to an increase in depreciation expenses which was attributable in the most part to a 27% increase in depreciation expenses recorded in connection with property, plant and equipment.
Raízen Combustíveis
General and administrative expenses totaled R$455.7 million in the fiscal year ended December 31, 2017, an increase of 1.8%, or R$8 million, compared to the fiscal year ended December 31, 2016, primarily due to the impact of inflation on general expenses.
Legal and Administrative Proceedings of the Joint Venture
Overview
In the ordinary course of business, Raízen and its subsidiaries are parties to numerous judicial and administrative proceedings of a tax, civil, regulatory, environmental, criminal and labor nature, including proceedings with probable, possible and remote risks of loss.
Pursuant to the framework agreement which was entered into during the formation of the Raízen joint venture, Raízen has agreed that it will reimburse its shareholders, i.e., Cosan S.A. and Shell, or will be reimbursed by them, as applicable, for any amounts received or paid in connection with legal proceedings, provided that the triggering events for such payments or receipts occurred before the formation of the Raízen joint venture on April 1, 2011 and provided that any such sums have actually been paid or received.
As of December 31, 2018, Raízen and its subsidiaries were party to proceedings with a probable risk of loss involving an aggregate amount of R$1,366 million for which provisions have been made. Raízen and its subsidiaries were also party to proceedings for which our risk of loss was deemed possible which involved an aggregate amount of R$14,280 million and for which no provision has been made.
Raízen and its subsidiaries constitute provisions for tax, civil, environmental and labor contingencies in which our risk of loss is considered probable in accordance with IFRS. Determination of the likelihood of loss includes determination of available evidence, hierarchy of laws, jurisprudence available, more recent court decisions and relevance thereof in the legal system, as well as an evaluation by internal and external attorneys. Such provisions are reviewed and adjusted to take into account changes in circumstances, such as statute of limitations applicable, tax inspection conclusions or additional exposures identified based on new matters or court decisions.
76
Certain Material Legal Proceedings of the Joint Venture
Below is a description of Raízen and its subsidiaries’ principal proceedings:
| | • | |
|
| | • | |
|
| | • | |
|
| | • | |
|
The alleged underlying facts in relation to each of the above occurred before the formation of the Raízen joint venture on April 1, 2011. Accordingly, these amounts are subject to reimbursement by shareholders in the event of an adverse decision.
| | • | | Goodwill contributed in Raízen Combustíveis.CLE has received three assessment notices from the Brazilian federal tax authorities seeking to collect corporate income tax and social contributions (specifically, IRPJ and CSLL) arising in connection with the amortization of goodwill on certain investments in the 2011, 2012, 2013 and 2014 calculation periods. The first tax assessment notice related to 2011 and 2012 and was in a total amount of R$200.7 million, the second related to 2013 and was in a total amount of R$121.7 million, and the third tax assessment notice (received in March 2019) relates to 2014 and is in an amount of R$41.5 million. The risk of loss is estimated as possible with regards to each of these. The relevant proceedings are currently awaiting judgment in the administrative court. This goodwill is the responsibility of CLE and was contributed to Raízen Combustíveis. |
| | • | | Goodwill Raízen Tarumã. Raízen Tarumã received (i) a tax assessment notice related to goodwill amortization deductions from 2009 to 2012, in a possible amount of R$58.8 million; and (ii) a tax assessment notice related to goodwill amortization deductions from 2013 to 2014, in a possible amount of R$42.8 million as of December 31, 2018. Raízen is awaiting judgment of the administrative court. The alleged underlying facts occurred before the formation of the Raízen joint venture on April 1, 2011. Accordingly, these amounts are subject to reimbursement by shareholders in the event of an adverse decision. |
| | • | | Social Security Contributions. In June 2010, Raízen Energia filed an ordinary action challenging the obligation to accrue the social security contributions tax based on gross revenue. Currently, the case records are in the Court of Appeals awaiting judgment of the appeal filed by the Brazilian federal government against a favorable first level decision. The risk of loss is classified as probable and as of December 31, 2018, Raízen had recorded provisions in connection with this proceeding in the aggregate amount of R$327.5 million and had judicially deposited the same amount (the two together therefore cancel each other out). The alleged underlying facts occurred both before and after the formation of the Raízen joint venture on April 1, 2011 and, therefore, these amounts are subject to reimbursement by Raízen’s shareholders for a portion of any loss in the event of an adverse decision. |
77
| | • | | Industrialized Products Tax. The Brazilian federal government filed a tax enforcement action pursuant to Normative Instruction No. 67/98 with regards to the industrialized products tax allegedly due as a result of the removal of certain types of sugar from Raízen Energia’s facilities from 1995 to 1997 and from 1992 to 1997. As of December 31, 2018, the aggregate amount under discussion was R$367.5 million. After Raízen Energia filed a motion to stay the tax enforcement action, the first level judge rendered a favorable decision and the Brazilian federal government filed an appeal. The risk of loss is classified as possible. The alleged underlying facts occurred before the formation of the Raízen joint venture on April 1, 2011 and, therefore, these amounts are subject to reimbursement by Raízen’s shareholders. In addition, Raízen is also a party to certain claims regarding the industrial products tax allegedly due on sugar products of certain polarity levels (sugar products with a polarity level of at least 99.5º are not subject to the industrialized products tax). |
| | • | | Industrialized Products Tax. In August 1998, Raízen Energia filed an offset request with the Brazilian federal tax authorities in order to offset debts already included in an installment payment plan against credits relating to undue payments made by Raízen Energia in relation to certain of its products, as allowed by Normative Instruction No. 67/98. The right to the credit was partially granted by the second administrative trial court. However, the calculation of the amount of credit is still pending in the first administrative trial court. As of December 31, 2018, the amount involved in this proceeding is R$113.4 million. The risk of loss is classified as possible. The alleged underlying facts occurred before the formation of the Raízen joint venture on April 1, 2011 and, therefore, these amounts are subject to reimbursement by our shareholders in the event of an adverse decision. No provision has been made for this proceeding in our consolidated financial statements. |
| | • | | MP 470. The Brazilian federal tax authorities have partially rejected Raízen Energia’s requests for payment of its federal tax debts, pursuant to provisional measure No. 470 on the grounds that the tax loss which Raízen Energia is proposing to use is not sufficient to settle the debts in question. The chance of loss is considered as possible. The amount involved in this proceeding is R$185.2 million. |
| | • | | PIS and COFINS Credits. The Brazilian federal tax authorities issued tax assessment notices against Raízen Energia related to the allegedly undue use of credits of PIS and COFINS. The notices refer to the credits taken from the costs and expenses with goods and services deemed by the company as inputs for its activities. In relation to the allegedly undue use of PIS and COFINS credits by Raízen Energia before the formation of the Raízen joint venture on April 1, 2011 (and, therefore, subject to reimbursement by our shareholders in case of an adverse decision), Raízen Energia received tax assessment notices which are currently pending a decision of the second administrative trial court and other assessments pending a decision of the lower administrative trial court. As of December 31, 2018, the aggregate amount involved in such proceedings was R$608.5 million. In relation to the allegedly undue use of credits of PIS and COFINS by Raízen Energia and/or Raízen Combustíveis after the formation of the Raízen joint venture on April 1, 2011 (and, therefore, these amounts are subject to reimbursement by Raízen’s shareholders in the event of an adverse decision), Raízen Energia has received tax assessment notices and these tax assessments are currently pending decision of the first administrative trial court. As of December 31, 2018, the aggregate amount involved in these proceedings is R$766 million. The risk of loss is classified as possible in each case. |
| | • | | ICMS – Diesel Oil. The tax authority of the state of São Paulo issued tax assessment notices against Raízen Energia in order to charge ICMS. According to the tax authority, Raízen Energia did not reverse the credit appropriated on the acquisition of diesel oil as feedstock production, due to the output of oil diesel of the establishment in marketing operations. In addition, Raízen Energia allegedly failed to issue tax invoices and also issued tax invoices with mistaken ICMS amounts. In relation to the facts alleged to have occurred before the formation of the Raízen joint venture on April 1, 2011 (Raízen’s shareholders are therefore required to reimburse Raízen for a portion of any loss in case of an adverse decision), Raízen Energia has received tax assessment notices, and with respect to the second instance administrative court issued a decision partially favorable to the company. Raízen Energia is awaiting a decision of the special appeals court. As of December 31, 2018, the amount involved in this proceeding was R$324.5 million. In relation to the facts which allegedly occurred after the formation of the Raízen joint venture on April 1, 2011 (therefore, these amounts are subject to reimbursement by Raízen’s shareholders in the event of an adverse decision), Raízen Energia has received tax assessment notices, which are currently pending decision of the first and second administrative court. As of December 31, 2018, the amount involved in this proceeding was R$501 million. The risk of loss is classified as possible in each case. |
78
| | • | | ICMS. The tax authorities of the state of São Paulo issued a tax assessment notice against Raízen Energia in order to collect ICMS debts and impose penalties relating to (i) the alleged acquisition and sale of goods without proper registration of these transactions in the applicable tax books in the years of 2009 and 2010, and (ii) the allegednon-registration in the proper entry book of invoices issued as a result of the symbolic return of goods deposited in warehouses. A first instance decision providing that item (i) described above should be partially cancelled was issued. Raízen Energia and the tax authorities filed appeals to the State Council of Tax Payers (Tribunal de Impostos e Taxas), or “TIT.” In October 2016, a court decision was issued confirming the first decision and also reducing the penalties in connection with item (ii) by 90%. The tax authorities filed a special appeal against this decision. In November 2017, the Special Chamber of the State Council of Tax Payers ruled partially in favor of Raízen Energia by (i) rejecting the tax authorities’ special appeal against the reduction of the penalty and granting the abovementioned 90% in penalties; and (ii) accepting the tax authorities’ special appeal with respect to the annulment of the previous court decision regarding the allegednon-registration in the proper entry book of invoices, in respect to which the Special Chamber of the State Council of Tax Payers ruled that another second instance decision should be issued. In December 2017, Raízen Energia filed a rectifying appeal against this decision. In September 2018, the rectifying appeal filed by Raízen Energia was rejected by the president of the court. Currently, a new second instance judgment of the appeals is pending. The total amount involved is R$479.7 million. The risk of loss is classified as remote for R$473.9 million and as possible for the remaining R$5.7 million. The alleged underlying facts occurred before the formation of the Raízen joint venture on April 1, 2011. Accordingly, these amounts are subject to reimbursement by shareholders in the event of an adverse decision. No provision has been recorded for this proceeding in our financial statements. |
| | • | | PIS and COFINS Offsets (Raízen Combustíveis). The Brazilian federal tax authorities filed a tax assessment to charge PIS and COFINS for the years of 2006 to 2009 in connection with unauthorized offset of tax debts made by Raízen Combustíveis. Raízen Combustíveis obtained a partially favorable decision from the first tier administrative court, and the tax authorities filed an appeal to the second tier administrative court. The amount under dispute as of December 31, 2018 was R$580.7 million. The risk of loss is classified as possible. The alleged underlying facts occurred before the formation of the Raízen joint venture on April 1, 2011 and, therefore, these amounts are subject to reimbursement by Raízen’s shareholders in the event of an adverse decision. |
| | • | | PIS and COFINS (Raízen Combustíveis). The Brazilian federal tax authorities filed a judicial tax enforcement proceeding in order to charge PIS and COFINS debts originating from refund and offsetting claims made by Raízen Combustíveis. The amount under dispute as of December 31, 2018 was R$485.3 million and Raízen Combustíveis presented a surety bond in order to continue to litigate. The risk of loss is classified as possible. The alleged underlying facts occurred before the formation of the Raízen joint venture on April 1, 2011 and, therefore, these amounts are subject to reimbursement by Raízen’s shareholders in the event of an adverse decision. |
| | • | | Labor Civil Public Action No. 0000642-29.5-01.003.Raízen Paraguaçú Ltda. (formerly known as Raízen Tarumã Ltda.), among other defendants, is a party to a civil public action filed by the Labor Prosecutor’s Office of the city of Rio de Janeiro in the state of Rio de Janeiro relating primarily to the following matters: (1) exposure of employees to conditions that are allegedly degrading, (2) alleged irregularities in the outsourcing practices of the companies and (3) alleged noncompliance with health and safety rules and regulations relating to working hours. The Labor Court ruled the case groundless at first instance. The Public Prosecutor’s Office of Rio de Janeiro appealed against the decision to the Regional Labor Appeals Court. The risk of loss is classified as possible. Should the proceedings be decided against Raízen, this may result in Raízen being barred from outsourcing certain core activities, an obligation to comply with certain health and safety rules as well as rules applicable to employees’ working hours, the imposition of pecuniary fines in case of noncompliance and indemnification for the violation of employees’ rights (excluding collective moral damages) in an amount of R$11.7 million. The alleged underlying facts occurred before the formation of the Raízen joint venture on April 1, 2011 and, therefore, these amounts are subject to reimbursement by Raízen’s shareholders for a portion of any loss in the event of an adverse decision. |
Criminal Investigations Involving Raízen Combustíveis
On July 31, 2018, the Civil Police of the state of Paraná launched Operation Controlled Margin to investigate the alleged involvement of Raízen Combustíveis in a scheme to control the final price of fuel sold in services stations located in such region. On the same date, search and seizure warrants were executed and three of Raízen’s employees were temporarily arrested.
In parallel, also on July 31, 2018, in connection with theso-called Operation Dubai, the Public Prosecutor’s Office of the Federal District filed a complaint against, among other parties, Raízen Combustíveis and one employee of Raízen Combustíveis in relation to certain alleged anticompetitive practices. In said complaint, the Public Prosecutor’s Office of the Federal District requested that certain assets and funds of Raízen Combustíveis in an amount of approximately R$120 million be frozen. This freezing of assets was not put in place as a result of certain guarantees being provided to the court.
Raízen Combustíveis is currently contesting both sets of proceedings.
79
| Item 4A. | Unresolved Staff Comments |
None.
| Item 5. | Operating and Financial Review and Prospects |
The following discussion of our financial condition and results of operations should be read in conjunction with our audited consolidated financial statements for the fiscal years ended December 31, 2018, 2017 and 2016, as well as with the information presented under the sections entitled “Presentation of Financial and Other Information” and “Item 3. Key Information—A. Selected Financial Data.”
The following discussion contains forward-looking statements that involve risks and uncertainties. Our actual results may differ materially from those discussed in the forward-looking statements as a result of various factors, including those set forth in “Forward-Looking Statements” and “Item 3. Key Information—D. Risk Factors.”
The following discussion and analysis of our financial condition and results of operations presents the following:
| | • | | a brief overview of our company and the principal factors that influence our results of operations, financial condition and liquidity; |
| | • | | a review of our financial presentation and accounting policies, including our critical accounting policies; |
| | • | | a discussion of the principal factors that influence our results of operations; |
| | • | | a discussion of developments that may materially affect our results of operations, financial condition and liquidity; |
| | • | | a discussion of our results of operations for the fiscal year ended December 31, 2018 compared with the fiscal year ended December 31, 2017, and for the fiscal year ended December 31, 2017 compared with the fiscal year ended December 31, 2016. |
| | • | | a discussion of our liquidity and capital resources, including our working capital at December 31, 2018, our cash flows for the year ended December 31, 2018, our cash flows for the year ended December 31, 2017, the year ended December 31, 2016, and our material short-term and long-term indebtedness at December 31, 2018; and |
| | • | | a discussion of our contractual commitments. |
Financial Presentation and Accounting Policies
Presentation of Financial Statements
The discussion in this section is based on our audited consolidated financial statements for the fiscal years ended December 31, 2018, 2017 and 2016.
We use IFRS as issued by the IASB for financial reporting purposes. Our audited consolidated financial statements include the financial statements of Cosan Limited and its subsidiaries. Investments in entities in which the Company does not have control but either jointly controls or has significant influence over, are accounted for using the equity method. The results of operations of Raízen Energia and Raízen Combustíveis, our Joint Ventures, are accounted for using the equity method, under IFRS 11, which was adopted by the Company in the nine-month period ended December 31, 2013, and applied retrospectively.
The discussion in this section is also based on a comparison of the fiscal year ended December 31, 2018 with the fiscal year ended December 31, 2017, and a comparison of the fiscal year ended December 31, 2017 with the fiscal year ended December 31, 2016.
80
Business Segments and Presentation of Segment Financial Data
The Company presents the following reportable segments:
(1) Raízen Energia: production and marketing of a variety of products derived from sugar cane, including raw sugar (VHP), anhydrous and hydrated ethanol, and activities related to energy cogeneration from sugarcane bagasse. In addition, this segment holds interests in companies engaged in research and development on new technology;
(2) Raízen Combustíveis: distribution and marketing of fuels, mainly through a franchised network of service stations under the “Shell” brand throughout Brazil, petroleum refining, the operation of fuel resellers, the manufacture and sale of automotive and industrial lubricants, and the production and sale of liquefied petroleum gas throughout Argentina;
(3) Comgás: distribution of piped natural gas in part of the state of São Paulo to customers in the industrial, residential, commercial, automotive and cogeneration sectors;
(4) Cosan Logística: logistics services for rail transportation, storage and port loading of commodities, mainly for grains and sugar, leasing of locomotives, wagons and another railway equipment;
(5) Moove, consisting of CLE, Stanbridge, Moove Lubricants, TTA, LubrigrupoII, Cosan S.R.L and Metrolube: production and distribution of lubricants under the Mobil brand in Brazil, Argentina, Bolivia, Uruguay, Paraguay, the United States of America and Europe, as well as in the European and Asian markets under the Comma trademark; and
Reconciliation
(6) Cosan Corporate: an online payment services platform and other investments, in addition to the corporate activities of the Company. The Cosan corporate segment includes the financing subsidiaries for the Cosan group.
Following the adoption of IFRS 11, as of April 1, 2013 Cosan S.A. no longer proportionally consolidates Raízen Energia and Raízen Combustíveis in its consolidated statement of financial position, consolidated statement of profit or loss and comprehensive income and consolidated cash flows, and the results from these businesses are accounted for under the line item “Equity in income of jointly-controlled entity” in our consolidated statement of profit or loss and other comprehensive income.
81
Critical Accounting Policies and Estimates
The preparation of the Company’s consolidated financial statements requires management to make judgments, estimates and assumptions that affect the application of accounting policies and the reported amounts of assets, liabilities, revenue and expenses at the end of the reporting period. Actual results may differ from these estimates. Such estimates and underlying assumptions are reviewed on an ongoing basis and changes are recognized in the period in which the estimates are revised and in any future periods affected.
Summary information about critical judgments, assumptions and estimation uncertainties in applying accounting policies that have the most significant effect on the amounts recognized in the financial statements is included as follows (see note 3.2 of our consolidated financial statements for further information):
Trade payables.The calculation of cost of gas in the closing of the legal disputes with Petrobras.
Recognized fair value measurements. When the fair value of financial assets and liabilities recorded in the consolidated financial statements cannot be derived from active markets, their fair value is determined using valuation techniques including the discounted cash flow model. The inputs to these models are taken from observable markets where possible, but where this is not feasible, a degree of judgment is required in determining fair values. Judgment is required in the determination of inputs such as liquidity risk, credit risk and volatility. Changes in assumptions on these factors could affect the reported fair value of financial instruments.
Investment in joint ventures. The Company has a 50% interest in a joint agreement. The joint venture agreements require unanimous consent from all parties for all relevant activities.
The two partners have direct rights to the assets of the partnership and are jointly and severally liable for the liabilities incurred by the partnership. This entity is therefore classified as a joint venture and the Company recognizes its interest in the joint venture using the equity method.
Property, plant and equipment and intangible assets and goodwill.The calculation of depreciation and amortization of intangible assets and property, plant and equipment is based on estimated useful lives. In addition, the determination of the fair value of intangible assets and property, plant and equipment acquired in a business combination or arising from the formation of a Joint Venture is a significant estimate.
The Company performs annually a review of impairment indicators for intangible assets and property, plant and equipment. Also, an impairment test is undertaken for goodwill. Impairment exists when the carrying value of an asset or cash generating unit exceeds its recoverable amount, which is the higher of its fair value less costs to sell and its value in use.
Commitments. The Company has entered into commercial property leases in relation to its investment property portfolio. The Company has determined, based on an evaluation of the terms and conditions of the arrangements, such as the lease term not constituting a substantial portion of the economic life of the commercial property and the present value of the minimum lease payments not amounting to substantially all of the fair value of the commercial property, that it retains all the significant risks and rewards of ownership of these properties and accounts for the contracts as operating leases.
Income tax.A deferred tax asset is recognized for loss carry forwards to the extent that it is probable that future taxable income will be generated to use such losses. Significant judgment is required to determine the amount of deferred tax assets that can be recognized, based upon the timing and the level of future taxable income together with tax planning strategies.
Provisions for legal proceedings. Provisions for legal proceedings resulting from business combinations are estimated at fair value.
Post-employment benefits.The cost of defined benefit pension plans and other post-employment benefits and the present value of the pension obligation is determined using actuarial valuations. An actuarial valuation involves the use of various assumptions which may differ from actual results in the future. These include the determination of the discount rate, future salary increases, mortality rates and future pension increases. A defined benefit obligation is highly sensitive to changes in these assumptions. All assumptions are reviewed by management at each reporting date.
82
Share-based payment. Cosan S.A. measures employees’ share-based compensation cost by reference to the fair value of the shares at the grant date. The estimation of fair value for share-based payment transactions requires determining the most appropriate valuation model, which is dependent on the terms and conditions of the plan. This estimate also requires determining the most appropriate inputs to the valuation model including the assumption of the expected life of the stock option, volatility and dividend yield.
Recently Issued Accounting Standards
New IFRS accounting standards have been published and/or reviewed and were adopted for the current fiscal year, as described below. Except as described below, there are no other standards and interpretations issued but not yet adopted that may, in management’s opinion, have a significant impact on the results or equity disclosed by the Company.
IFRS 9 Financial Instruments: Classification and Measurement
The Company has applied IFRS 9 since January 1, 2018 except as described below:
| | • | | the Company has adopted the exception of notre-presenting comparative information from previous periods relating to classification and measurement requirements (including impairment). Differences in the balances of financial assets and liabilities arising from the adoption of IFRS 9 were recorded in retained earnings and reserves on January 1, 2018. Thus, the information presented for 2017 generally does not reflect the requirements of IFRS 9, but the requirements of IAS 39; |
| | • | | certain determinations were made based on the facts and circumstances existing at the date of initial application, including: (i) determination of the business model in which a financial asset is held; and (ii) the designation and revocation of prior designations of certain financial assets and liabilities as measured at fair value through profit or loss; and |
| | • | | all hedge relationship designations in accordance with IAS 39 existing as of December 31, 2017 meet the hedging criteria in accordance with IFRS 9 as of January 1, 2018 and are therefore designated as continuing hedge relationships. |
The total impact on the Company’s financial position as at January 1, 2018 is as follows:
| | | | |
| | | (in thousands of reais) | |
Assets |
Trades receivables | | | (10,932 | ) |
Investments in joint ventures | | | (1,340 | ) |
Deferred tax | | | 3,584 | |
Equity | | | | |
Retained earnings | | | 8,688 | |
| | a. | Classification and measurement |
The Company initially measures a financial asset at its fair value and, in the case of a financial asset not at fair value, through profit or loss, plus transaction costs, except those measured at amortized cost for financial assets that are kept within a business model with the objective of obtaining contractual cash flows that meet the “SPPI criterion.”
Under IFRS 9, debt financial instruments are subsequently measured at fair value through profit or loss, or “FVPL,” amortized cost, or fair value through other comprehensive income, or “FVOCI.”
The classification is based on two criteria: the Company’s business model for managing the assets and whether the instruments’ contractual cash flows represent ‘solely payments of principal and interest’ on the principal amount outstanding, or the “SPPI criterion.”
The evaluation of the Company’s business models was carried out from the date of initial application on January 1, 2018 and retrospectively applied to financial assets that were not derecognized before January 1, 2018. The assessment of whether cash flows contractual debt instruments are solely composed of principal and interest was made based on the facts and circumstances as in the initial recognition of the assets. This category includes trade accounts receivable, cash and cash equivalents, restricted cash, receivables from related parties, other financial assets and dividends and interest on shareholders’ equity receivable. No new measurement of financial assets was carried out.
83
The adoption of IFRS 9 has fundamentally changed the Company’s accounting for impairment losses for financial assets by replacing IAS 39’s incurred loss approach with a forward-looking expected credit loss (ECL) approach.
The Company recognizes a provision for expected credit loss for its trade receivable. The simplified standard approach is applied and the expected credit losses for the entire life of the asset are calculated. The Company has established a provisioning method that is based on the historical experience of credit loss of each business segment, adjusted for specific prospective factors for the debtors and for the economic environment.
The joint ventures Raízen Energia and Raízen Combustíveis have adopted an expected loss method considering the grouping of customers with similar default characteristics, by sales channel and internal rating. The impact of the adoption of this standard was a loss of R$2.7 million (R$1.35 million in the interest in earnings of joint ventures of Cosan S.A.).
The Company applied the changes of hedge accounting prospectively. At the date of initial application, all of the Company’s existing hedging relationships were eligible to be treated as continuing hedging relationships. Consistent with previous periods, the Company continued to designate the change in the fair value of the entire forward contract in the Company’s cash flow hedge relationships and, as such, the adoption of the hedge accounting requirements of IFRS 9 had no significant impact on the Company’s consolidated financial statements.
According to IAS 39, all gains and losses arising from the Company’s cash flow hedge relationships were eligible to be subsequently reclassified to income. Therefore, after the adoption of IFRS 9, the net cash flow hedge gain or loss was presented under “Other comprehensive income not being reclassified to income.” This amendment applies only prospectively from the date of initial application of IFRS 9 and has no impact on the presentation of comparative figures.
| | d. | Amendments to IFRS 9: Prepayment Features with Negative Compensation |
Under IFRS 9, a debt instrument can be measured at amortized cost or at fair value through other comprehensive income, provided that the contractual cash flows are “solely payments of principal and interest on the principal amount outstanding” (the SPPI criterion) and the instrument is held within the appropriate business model for that classification. The amendments to IFRS 9 clarify that a financial asset passes the SPPI criterion regardless of the event or circumstance that causes the early termination of the contract and irrespective of which party pays or receives reasonable compensation for the early termination of the contract.
The amendments should be applied retrospectively and are effective from January 1, 2019. These amendments have no impact on the consolidated financial statements of the Company.
IFRS 15 Revenue from contracts with customers
The assets deriving from infrastructure concessions during the construction period at Comgás and contracts with clients at CLE, which were previously accounted as “intangible assets,” are now booked as “contract asset” and presented in the statement of financial position in the “Othernon-current assets.”
The Company has adopted the retrospective method with cumulative transitional effect. In summary, the following adjustments were made to the amounts recognized in the balance sheet at the date of initial application:
| | | | | | | | | | | | | | | | |
| | | As of January 1, 2018 | |
| | | IAS 18 | | | IFRIC 12 | | | Reclassification | | | IFRS 15 | |
| | | (in thousands ofreais) | |
Othernon-current assets (contract asset) | | | — | | | | — | | | | 188,498 | | | | 188,498 | |
Intangible assets | | | 8,346 | | | | 180,152 | | | | (188,498 | ) | | | — | |
Additionally, the subsidiary CLE pays a commission fee to the customer in order to obtain a new contract. In most cases, these payments are associated with a volume acquired by the customer and are treated as cost of sales. On December 31, 2018, the incremental costs of obtaining a contract and costs to fulfil a contract was R$73.6 million.
In 2017, such commission fees were recognized as selling expenses when incurred in the amount of R$82.9 million.
84
IFRS 16 Leases
These standards are effective for annual periods beginning after January 1, 2019 and change the recognition, measurement, presentation and disclosure of leases. It requires lessees to record all leases on the balance sheet with exemptions available for low value and short-term leases. During 2018, the Company concluded preparations for the new requirements in IFRS 16, except for technical discussions regarding the incremental discount rate and agricultural partnership contracts in joint ventures.
The Company leases various properties, equipment and cars. Rental contracts are typically made for fixed periods but may have extension options as described in below. Lease terms are negotiated on an individual basis and contain a wide range of different terms and conditions. The lease agreements do not impose any covenants, but leased assets may not be used as security for borrowing purposes.
Leases are recognized as aright-of-use asset and a corresponding liability at the date at which the leased asset is available for use by the Company. Each lease payment is allocated between the liability and finance cost. The finance cost is charged to profit or loss over the lease period so as to produce a constant periodic rate of interest on the remaining balance of the liability for each period. Theright-of-use asset is depreciated over the shorter of the asset’s useful life and the lease term on a straight-line basis.
Assets and liabilities arising from a lease are initially measured on a present value basis. Lease liabilities include the net present value of the following lease payments:
| | i. | fixed payments (includingin-substance fixed payments), less any lease incentives receivable; |
| | ii. | variable lease payment that are based on an index or a rate; |
| | iii. | amounts expected to be payable by the lessee under residual value guarantees; |
| | iv. | the exercise price of a purchase option if the lessee is reasonably certain to exercise that option; and |
| | v. | payments of penalties for terminating the lease, if the lease term reflects the lessee exercising that option. |
The lease payments are discounted using the interest rate implicit in the lease, if that rate can be determined, or the Company’s incremental borrowing rate.
Right-of-use assets are measured at cost comprising the following:
| | i. | the amount of the initial measurement of lease liability; |
| | ii. | any lease payments made at or before the commencement date less any lease incentives received; |
| | iii. | any initial direct costs; and |
Payments associated with short-term leases and leases oflow-value assets are recognized on a straight-line basis as an expense in profit or loss. Short-term leases are leases with a lease term of 12 months or fewer.Low-value assets compriseIT-equipment and small items of office furniture.
Extension and termination options are included in a number of property and equipment leases across the Company. These terms are used to maximize operational flexibility in terms of managing contracts. The majority of extension and termination options held are exercisable only by the Company and not by the respective lessor.
To optimize lease costs during the contract period, the Company sometimes provides residual value guarantees in relation to equipment leases.
85
Impact on the statement of financial position (increase/(decrease)) as of January 1, 2019:
| | | | | | | | | | | | |
| | | Range | |
| | | (in thousands of reais) | |
Assets | | | | | | | | | | | | |
Right-of-use assets | | | 1,100,000 | | | | to | | | | 1,200,000 | |
Deferred income tax | | | 40,000 | | | | to | | | | 50,000 | |
| | | 1,140,000 | | | | | | 1,250,000 | |
Liabilities | | | | | | | | | | | | |
Leases | | | 1,600,000 | | | | to | | | | 1,700,000 | |
Equity | | | (460,000 | ) | | | | | | | (450,000 | ) |
The Company has applied IFRS 16 using the modified retrospective approach and therefore the comparative information has not been restated and continues to be reported under IAS 17 and IFRIC 4. The details of accounting policies are disclosed separately for each period.
The subsidiaries Raízen Energia and Raízen Combustíveis recognized the lease liability and the right to use asset at the date of the initial application for leases previously classified as operating leases, retrospectively, with cumulative effect. These joint ventures used as a practical expedient the use of a single discount rate on the lease portfolio with similar characteristics. The initial measurement of lease liabilities andrights-of-use assets is estimated between R$4,000,000 and R$5,000,000. There are still technical discussions that may have a significant impact on the initial effects of these jointly controlled companies, such as whether the agricultural partnership contracts are within the scope of the standard.
IFRIC Interpretation 23 Uncertainty over Income Tax Treatment
The interpretation is effective for annual periods beginning after January 1, 2019 and addresses the accounting for income taxes when tax treatments involve uncertainty that affects the application of IAS 12 and does not apply to taxes or levies outside the scope of IAS 12, nor does it specifically include requirements relating to interest and penalties associated with uncertain tax treatments.
The Company is subject to examination by the tax authorities, with the five fiscal years open in general. The Company has audits in progress at various stages of completion, one of which may be completed within the next 12 months. However, at that time, the Company had no uncertainties regarding the treatment of income tax.
Principal Factors Affecting Our Results of Operations
In addition to the factors that are described in “Item 4. Information on the Company—B. Business Overview,” our results of operations have been influenced and will continue to be influenced by the following key factors:
Brazilian Economic Environment
The Brazilian economic environment has historically been characterized by significant variations in economic growth, inflation and currency exchange rates. Our results of operations and financial condition are influenced by these factors and the effect that these factors have on employment rates, the availability of credit and average wages in Brazil. The following table sets forth Brazilian inflation rates, interest rates, and exchange rates for the periods indicated:
| | | | | | | | | | | | |
| | | For the Fiscal Year Ended December 31, | |
| | | 2018 | | | 2017 | | | 2016 | |
GDP growth | | | 1.1 | % | | | 1.0 | % | | | (3.6 | )% |
Inflation(IGP-M) | | | 7.5 | % | | | (0.5 | )% | | | 7.2 | % |
Inflation (IPCA)(1) | | | 3.8 | % | | | 3.0 | % | | | 6.3 | % |
Interbank rate – CDI (average)(2) | | | 6.4 | % | | | 7.0 | % | | | 14.0 | % |
Long-term interest rates (average)(3) | | | 7.0 | % | | | 7.0 | % | | | 7.5 | % |
Exchange rate at the end of the period per U.S.$1.00 | | | R$3.87 | | | R$ | 3.31 | | | R$ | 3.26 | |
Average exchange rate per U.S.$1.00 | | | R$3.65 | | | R$ | 3.19 | | | R$ | 3.51 | |
Appreciation (depreciation) of the real against the U.S. dollar (4) | | | (17.1 | )% | | | (1.5 | )% | | | 16.5 | % |
Sources: IBGE, Brazilian Central Bank, CETIP S.A. — Mercados Organizados and FGV.
| (1) | IPCA is a consumer price index calculated by IBGE. |
| (2) | CDI refers to the average overnight interbank loan rates in Brazil. |
| (3) | The Brazilianlong-term interest rate (taxa de juros de longo prazo), or “TJLP,” is the rate applicable tolong-term loans by BNDES. |
| (4) | Comparing the PTAX exchange rate (the rate calculated by the Brazilian Central Bank) at the end of the period’s last day with the day immediately prior to the first day of the period discussed, PTAX is the exchange rate calculated at the end of each day by the Brazilian Central Bank. It is the average rate of all business conducted in U.S. dollars on the determined date in the interbank exchange market. |
86
General economic stability in Brazil following the onset of the global financial crisis in 2009 allowed the Brazilian Central Bank to continue its policy of reducing interest rates. Due to inflation and other general macroeconomics concerns, the Brazilian Central Bank began increasing interest rates, with the SELIC, a benchmark interest rate, reaching 10.00% at the end of December 31, 2013, 11.75% at the end of December 31, 2014 and 14.25% at the end of December 31, 2015. The Brazilian Central Bank has been reducing interest rates since then, with the SELIC reaching 13.75% as of December 31, 2016, 7.00% as of December 31, 2017 and 6.5% as of December 31, 2018.
The recent economic instability in Brazil has contributed to a decline in market confidence in the Brazilian economy as well as to a deteriorating political environment. Despite the ongoing recovery of the Brazilian economy, weak macroeconomic conditions in Brazil are expected to continue throughout early 2019. In addition, various ongoing investigations into allegations of money laundering and corruption being conducted by the Office of the Brazilian Federal Prosecutor, including the largest such investigation known as “Lava Jato,” have negatively impacted the Brazilian economy and political environment.
In recent years, there has been significant political turmoil in connection with the impeachment of the former president (who was removed from office in August 2016) and ongoing investigations of her successor (who left office in January 2019) as part of the ongoing “Lava Jato” investigations. Presidential elections were held in Brazil in October 2018. We cannot predict which policies the new President of Brazil, who assumed office on January 1, 2019, may adopt or change during his mandate or the effect that any such policies might have on our business and on the Brazilian economy. Any such new policies or changes to current policies may have a material adverse effect on us. The political uncertainty resulting from the presidential elections and the transition to a new government may have an adverse effect on our business, results of operations and financial condition.
Furthermore, Brazil’s federal budget has been in deficit since 2014. Similarly, the governments of Brazil’s constituent states are also facing fiscal concerns due to their high debt burdens, declining revenues and inflexible expenditures. While the Brazilian Congress has approved a ceiling on government spending that will limit primary public expenditure growth to the prior year’s inflation for a period of at least 10 years, local and foreign investors believe that fiscal reforms, and in particular a reform of Brazil’s pension system, will be critical for Brazil to comply with the spending limit. As of the date of this annual report, a reform of Brazil’s pension system is still under discussion by the government and Brazilian Congress. Diminished confidence in the Brazilian government’s budgetary condition and fiscal stance could result in downgrades of Brazil’s sovereign debt by credit rating agencies, negatively impact Brazil’s economy, lead to further depreciation of thereal and an increase in inflation and interest rates, thus adversely affecting our business, results of operations and financial condition.
Any deterioration in Brazil’s rate of economic growth, changes in interest rates, the unemployment rate or price levels generally may limit the availability of credit, income and purchasing power of our customers, thereby adversely affecting demand for our products.
Acquisitions, Partnerships and Corporate Restructurings
Our strategy is to be a leading Brazilian group in the energy and infrastructure businesses. For this reason, since May 2004, we have expanded our operations primarily through acquisitions, partnerships and corporate restructurings. We have also diversified into other operations to become a vertically integrated energy and infrastructure company. As a result, our net sales and gross profit have increased significantly.
Sugar
The profitability of our sugar products is mainly affected by fluctuations in the international price of raw sugar and in thereal/dollar exchange rate. International raw sugar prices are determined based on the New York Board of Trade Futures Contract No. 11, or “NY11.” Refined sugar trades at a premium to raw sugar, known as the “white premium,” and its price is determined based on the London International Financial Futures and Options Exchange Contract No. 5, or “LIFFE No. 5.” Prices are affected by the perceived and actual supply and demand for sugar and its substitute products. The supply of sugar is affected by weather conditions, governmental trade policies and regulations and the amount of sugarcane and sugar beet planted by farmers, including substitution by farmers of other agricultural commodities for sugarcane or sugar beet. Demand is affected by growth in worldwide consumption of sugar and the prices of substitute sugar products. From time to time, imbalances may occur between overall sugarcane and sugar beet processing capacity, sugarcane and sugar beet supply and the demand for sugar products. Prices of sugar products are also affected by these imbalances, which, in turn, impact our decisions regarding whether and when to purchase, store or process sugarcane and whether to produce sugar or more ethanol.
87
The table below sets forth the prices for raw sugar NY11 for the periods indicated:
| | | | | | | | | | | | |
| | | Sugar NY11 | |
| | | For the Fiscal Year Ended | |
| | | December 31,
2018 | | | December 31,
2017 | | | December 31,
2016 | |
| | | (U.S.$/lb) | |
Initial quote | | | 0.1533 | | | | 0.2051 | | | | 0.1467 | |
Closing quote | | | 0.1203 | | | | 0.1516 | | | | 0.1925 | |
Daily average quote | | | 0.1224 | | | | 0.1578 | | | | 0.1811 | |
High quote | | | 0.1533 | | | | 0.2118 | | | | 0.2291 | |
Low quote | | | 0.0900 | | | | 0.1255 | | | | 0.1335 | |
Source: NYBOT; prices from the 1st Generic Future. Bloomberg.
Ethanol
Our ethanol products are affected by domestic Brazilian and international prices of ethanol, competition, governmental policies and regulations and market demand for ethanol as an alternative or additive to gasoline. The price for ethanol we sell in Brazil is set in accordance with market prices, using indices published by the Agriculture School of the University of São Paulo (Escola Superior de Agricultura Luiz de Queiroz—ESALQ) and B3 as a reference. Prices for ethanol we export are set based on international market prices, including the New York Board of Trade’s recently launched ethanol futures contract. Prices for the industrial alcohol and bottled alcohol products we sell are also set based on market prices and have been historically higher than market prices for ethanol.
The table below sets forth the prices for hydrous ethanol in the Brazilian market for the periods indicated:
| | | | | | | | | | | | |
| | | Hydrous Ethanol Esalq | |
| | | For the Fiscal Year Ended | |
| | | December 31,
2018 | | | December 31,
2017 | | | December 31,
2016 | |
| | | (U.S.$/thousand liters) | |
Initial quote | | | 560.60 | | | | 573.70 | | | | 442.30 | |
Closing quote | | | 427.90 | | | | 535.20 | | | | 562.00 | |
Daily average quote | | | 460.22 | | | | 477.80 | | | | 483.40 | |
Monthly average quote | | | 460.89 | | | | 478.61 | | | | 483.00 | |
High quote | | | 581.80 | | | | 578.60 | | | | 604.50 | |
Low quote | | | 356.90 | | | | 384.80 | | | | 379.10 | |
Source: ESALQ.
The table below sets forth the prices for anhydrous ethanol in the Brazilian market for the periods indicated:
| | | | | | | | | | | | |
| | | Anhydrous Ethanol Esalq | |
| | | For Fiscal Year Ended | |
| | | December 31,
2018 | | | December 31,
2017 | | | December 31,
2016 | |
| | | (U.S.$/thousand liters) | |
Initial quote | | | 595.00 | | | | 642.20 | | | | 500.40 | |
Closing quote | | | 469.40 | | | | 584.20 | | | | 618.10 | |
Daily average quote | | | 502.04 | | | | 526.40 | | | | 536.30 | |
High quote | | | 612.60 | | | | 642.20 | | | | 665.70 | |
Low quote | | | 390.10 | | | | 430.80 | | | | 434.60 | |
Source: ESALQ.
88
The following table sets forth our average selling prices (in R$ per thousand liters) for ethanol in the export market for the periods indicated:
| | | | | | | | | | | | |
| | | Ethanol | |
| | | For Fiscal Year Ended | |
| | | December 31,
2018 | | | December 31,
2017 | | | December 31,
2016 | |
| | | (R$/thousand liters) | |
Average Unitary Price | | | 2,011 | | | | 1,704.00 | | | | 1,818 | |
Source: Cosan/Raízen.
Demand for Fuels
Demand for gasoline, ethanol and diesel is susceptible to volatility related to the level of economic activity in Brazil and may also fluctuate depending on the performance of specific industries in the Brazilian market. We expect that a decrease in economic activity would adversely affect demand for fuels.
Currency Fluctuations
A significant proportion of the sales of sugar of Raízen Energia, a significant proportion of natural gas purchase of Comgás, and a significant proportion of the base oil purchases of CLE are conducted in U.S. dollars. Therefore, a depreciation of thereal against the U.S. dollar would have the effect of increasing our sales in Raízen Energia, and increasing our costs of sales in Comgás and Moove. An appreciation of therealagainst the U.S. dollar would have the opposite effect.
A significant proportion of our debt is denominated in U.S. dollars. A depreciation of thereal against the U.S. dollar would increase our debt burden and our related financial expenses. However, we have receivables and other financial assets denominated in U.S. dollars, which would partially offset the impact that a depreciation of thereal would have on our financial position. An appreciation of thereal against the U.S. dollar would have the opposite effect.
See also “—Hedging Transactions and Exposures.”
Seasonality
Our business is subject to a degree of seasonality as described below. See also “Item 3. Key Information—D. Risk Factors—Risks Related to Our Businesses, the Operations of Our Joint Venture, and Industries in Which We Operate—Our business is subject to seasonal trends based on the sugarcane growing cycle in the Central-South region of Brazil.”
Raízen
Raízen’s sugar production depends on the volume and sucrose content of the sugarcane that it cultivates or that is supplied to it by growers located in the vicinity of Raízen’s mills. Crop yields and sucrose content depend primarily on weather conditions such as rainfall and temperature, which vary and may be influenced by global climate change. Weather conditions have historically caused volatility in the ethanol and sugar industries and, consequently, in our results of operations by causing crop failures or reduced harvests. Flood or drought, which may be influenced by global climate change, can adversely affect the supply and pricing of the agricultural commodities that we sell and use in our business. During the third and fourth quarter of 2014, a severe drought affected the areas in which Raízen operates.
Future weather patterns may reduce the amount of sugar or sugarcane that Raízen can recover in a given harvest or its sucrose content. In addition, the business of Raízen Energia in particular is subject to seasonal trends based on the sugarcane growing and harvesting cycle in the Central-South region of Brazil. The annual sugarcane harvesting period in the Central-South region of Brazil usually begins in April or May and ends in November or December. This creates fluctuations in our inventory, usually peaking in December to cover sales between crop harvests (i.e., December through April), and a degree of seasonality in our gross profit, with ethanol and sugar sales significantly lower in the quarter ended on December 31.
89
Cosan Logística
Rumo is subject to the seasonality that influences the sugarcane and grain harvest. During the peak months of the harvests, there is higher demand for transport and logistics operations.
Inflation
Inflation rates in Brazil were 6.4% in 2014, 10.7% in 2015, 6.3% in 2016, 3% in 2017 and 3.8% in 2018, as measured by the Extended National Consumer Price Index (Índice Nacional de Preços ao Consumidor Amplo), or “IPCA,” published by the Brazilian Institute for Geography and Statistics (Instituto Brasileiro de Geografia eEstatística), or “IBGE.” The inflation rate reached a level of 3.8% for the twelve-month period ending December 31, 2018.
Inflation affects our financial performance by increasing certain of our operating expenses denominated inreais (and not linked to the U.S. dollar). These operating expenses include labor costs, leases, and selling and general administrative expenses. However, inflation did not have a material impact on our business for the periods presented.
See also “Item 3. Key Information—D. Risk Factors—Risks Related to Brazil—Inflation and government measures to curb inflation may adversely affect the Brazilian economy, the Brazilian securities market, our business and operations and the market prices of our shares.”
Cost Structure
Our cost structure for Raízen Energia may be divided into costs that are linked to the prices of our products and costs that are not linked to the prices of our products. Two of our principal cost components, raw materials and land leases, are linked to the prices of our products. Accordingly, we adjust the prices of our products to follow fluctuations in the cost of our raw materials and leased land, substantially minimizing the impact of this cost volatility on our results of operations. In addition, another relevant portion of our costs is represented by agricultural and industrial inputs, some of which are imported and which are also subject to price fluctuations primarily as a result of exchange rate variations. As 5% of our net sales are derived from exports, a portion of fluctuations in the costs of these inputs is offset by similar fluctuations in our Brazilian and international prices, minimizing the impact of this cost volatility on our results of operations.
Our cost structure for Comgás is affected by fixed and variable costs. Costs related to our property, plant and equipment incur fixed depreciation charges which increase in line with our capital expenditure. Costs relating to the natural gas resource, costs relating to transportation and other gas services are affected by volumes sold.
Our cost structure for Lubricants is affected by the cost of imported base oil and additives for lubricants blending.
Our cost structure for Cosan Logística is affected by fixed and variable costs. Costs related to our property, plant and equipment incur fixed depreciation charges, which increase in line with our capital expenditure. Costs relating to the transportation of sugar and other commodities are partially dependent on sales volumes.
Other Factors
Other factors that will impact the results of our operations include:
| | • | | hedging transactions (as discussed under “—Hedging Transactions and Exposures”); |
| | • | | trade barriers in U.S., European and other markets that currently limit access to their domestic sugar industry through quotas, subsidies and restrictions on imports; |
| | • | | the evolving use of ethanol derivatives as an alternative to oil derivatives and as a cleaner burning fuel, derived from renewable sources; |
| | • | | the use of ethanol as a cleaner burning fuel, derived from renewable sources; |
| | • | | changes in international prices of oil (denominated in U.S. dollars) and related changes in the domestic prices of oil (denominated inreais); |
| | • | | the growth rate of the global economy and its resulting corresponding growth in worldwide sugar consumption; and |
| | • | | the tax policies adopted by the Brazilian government and the governments of the Brazilian states in which we operate (including tax incentives from which we benefit), and our resulting tax obligation. |
90
Hedging Transactions and Exposures
Our management has overall responsibility for the establishment and oversight of our risk management framework. Our board of directors has established the risk management committee, which is responsible for developing and monitoring our risk management policies. The committee reports regularly to our board of directors on its activities.
Our risk management policies are established to identify and analyze the risks that we face, to set appropriate risk limits and controls and to monitor risks and adherence to limits. Risk management policies and systems are reviewed regularly to reflect changes in market conditions and our activities. Our management, through its training, standards and procedures, aims to maintain a disciplined and constructive control environment in which all employees understand their roles and obligations.
Our hedging strategy primarily seeks to protect our cash flows from risks arising from exchange rates fluctuations. Accordingly, certain of our derivative financial instruments have been designated for hedge accounting, namely: (1) at Cosan S.A., the Senior Notes due 2023 and the associated derivative financial instruments; (2) at Comgás, the third and fifth issuances of debentures due in 2020 and 2023, respectively, and the associated derivative financial instruments; and (3) at Rumo, the Senior Notes due 2024 and the associated derivative financial instruments.
In addition, our joint venture Raízen Energia hedges part of the future price risk of its sugar production, estimated to be exported and exchange rate derivative transactions, using future contracts, options and swaps. Its hedging strategy seeks to protect it from cash flow risks caused by commodities price and exchange rates fluctuations and as most of the derivative instruments have been designated for hedge accounting, Raízen Energia has not experienced material gains or losses in its financial results.
See “Item 11. Quantitative and Qualitative Disclosures About Market Risk” and note 5.9 of our consolidated financial statements for the fiscal year ended December 31, 2018 attached hereto for further information.
The following discussion of our results of operations is based on the financial information derived from our audited consolidated financial statements prepared in accordance with IFRS as issued by the IASB, unless otherwise stated. In the following discussion, references to increases or decreases in any year are made by comparison with the corresponding prior year, as applicable, except as the context otherwise indicates. The discussion in this section is based on a comparison of the audited fiscal year ended December 31, 2018 with the audited fiscal year ended December 31, 2017, and a comparison of the audited fiscal year ended December 31, 2017 with the audited fiscal year ended December 31, 2016.
Results of Operations for the Fiscal Year Ended December 31, 2018 Compared to the Fiscal Year Ended December 31, 2017
Consolidated Results
The following table sets forth our consolidated statement of profit or loss for the fiscal years ended December 31, 2018 and 2017:
| | | | | | | | | | | | |
| | | For the Fiscal Year
Ended December 31, | | | %
Variation | |
| | | 2018 | | | 2017 | |
| | | (in millions of reais, except percentages) | |
Consolidated statement of profit or loss | | | | | | | | | | | | |
Net sales | | | 16,843.9 | | | | 13,582.5 | | | | 24.01 | % |
Cost of sales | | | (12,119.9 | ) | | | (9,232.2 | ) | | | 31.28 | % |
Gross profit | | | 4,724.0 | | | | 4,350.3 | | | | 8.59 | % |
Selling expenses | | | (1,023.5 | ) | | | (1,068.7 | ) | | | (4.23 | )% |
General and administrative expenses | | | (981.8 | ) | | | (935.3 | ) | | | 4.97 | % |
Other income (expense), net | | | 738.2 | | | | 877.6 | | | | (15.88 | )% |
Operating expense | | | (1,267.1 | ) | | | (1,126.4 | ) | | | 12.49 | % |
Income before equity in earnings of investees and financial results | | | 3,456.9 | | | | 3,223.9 | | | | 7.23 | % |
Equity in earnings of associates | | | 51.5 | | | | 17.2 | | | | 199.42 | % |
Equity in earnings of joint ventures | | | 946.3 | | | | 985.1 | | | | (3.94 | )% |
Financial results | | | (1,610.9 | ) | | | (2,751.5 | ) | | | (41.45 | )% |
Profit before taxes | | | 2,843.8 | | | | 1,474.7 | | | | 92.84 | % |
Income tax expense – current | | | (464.9 | ) | | | (134.5 | ) | | | 245.65 | % |
Income tax benefit – deferred | | | (295.6 | ) | | | (293.8 | ) | | | 0.61 | % |
Total income taxes | | | (760.5 | ) | | | (428.3 | ) | | | 77.56 | % |
Profit from continuing operations | | | 2,083.3 | | | | 1,046.4 | | | | 99.09 | % |
(Loss) profit from discontinued operation, net of tax | | | — | | | | — | | | | — | |
Profit for the year | | | 2,083.3 | | | | 1,046.4 | | | | 99.09 | % |
Net income attributable tonon-controlling interests | | | (1,107.7 | ) | | | (495.3 | ) | | | 123.64 | % |
Net income attributable to owners of the parent | | | 975.6 | | | | 551.1 | | | | 77.03 | % |
91
Net Sales
We report net sales after deducting federal and state taxes assessed on gross sales (ICMS, PIS, COFINS), IPI (a federal value-added tax assessed on our gross sales in the Brazilian market at rates that vary by product) and INSS (federal social contribution taxes assessed on our gross sales in the Brazilian market of our agribusiness entities at a rate of 2.85%). Deductions from gross sales in the Brazilian domestic market, which are subject to these taxes, are significantly higher than our deductions from gross sales in export markets.
The table below presents a breakdown of our net sales for the fiscal years ended December 31, 2018 and 2017:
| | | | | | | | | | | | |
| | | For the Fiscal Year
Ended December 31, | | | %
Variation | |
| | | 2018 | | | 2017 | |
| | | (in millions of reais, except percentages) | |
Cosan Logística | | | 6,584.9 | | | | 5,946.3 | | | | 10.74 | % |
Northern Operations | | | 4,913.4 | | | | 4,439.7 | | | | 10.67 | % |
Southern Operations | | | 1,412.3 | | | | 1,283.1 | | | | 10.07 | % |
Container Operations | | | 259.2 | | | | 223.5 | | | | 15.97 | % |
| | | | | | | | | | | | |
Comgás | | | 6,840.0 | | | | 5,537.9 | | | | 23.51 | % |
Industrial | | | 4,411.7 | | | | 3,494.4 | | | | 26.25 | % |
Residential | | | 986.1 | | | | 849.7 | | | | 16.05 | % |
Construction revenue | | | 415.8 | | | | 351.2 | | | | 18.39 | % |
Commercial | | | 387.1 | | | | 320.0 | | | | 20.97 | % |
Cogeneration | | | 315.9 | | | | 229.7 | | | | 37.53 | % |
Automotive | | | 262.8 | | | | 224.2 | | | | 17.22 | % |
Other | | | 60.6 | | | | 68.7 | | | | (11.79 | )% |
| | | | | | | | | | | | |
Moove | | | 3,449.9 | | | | 2,129.5 | | | | 62.01 | % |
Lubricants | | | 3,096.7 | | | | 1,876.9 | | | | 64.99 | % |
Basic Oil | | | 317.9 | | | | 220.5 | | | | 44.17 | % |
Other | | | 35.3 | | | | 32.1 | | | | 9.97 | % |
| | | | | | | | | | | | |
Reconciliation | | | | | | | | | | | | |
Cosan Corporate | | | 9.2 | | | | 3.4 | | | | 170.59 | % |
| | | | | | | | | | | | |
Segment elimination | | | (40.1 | ) | | | (34.6 | ) | | | 15.90 | % |
Net sales | | | 16,843.9 | | | | 13,582.5 | | | | 24.01 | % |
The change in the various components consists of the following:
Cosan Logística
Net sales increased from R$5,946 million in the fiscal year ended December 31, 2017 to R$6,584.9 million in the fiscal year ended December 31, 2018, mainly due to an increase in volume transported of 13.4% compared to the fiscal year ended December 31, 2017. This increase in volume transported was due to an increase in capacity as a result of our capital expenditure plan, which offset the effects of the truckers’ strike which took place in Brazil in May 2018. Other factors which contributed to the increase in Rumo’s overall sales in the fiscal year ended December 31, 2018 include: (i) greater volumes of agricultural and industrial products (fertilizer in particular) being transported by the Northern Operation, and the fact that volumes transported in November and December 2018 were higher than expected as a result of the prospect of there being an early harvest soybean in 2019 (as a consequence of which producers were required to move their corn inventory earlier than expected in order to make space to store the incoming soybeans, which meant that corn which would otherwise have been transported in January 2019 was transported in December 2018); and (ii) an increase in the volume transported to the Port of Santos in the state of São Paulo of 10% in the fiscal year ended December 31, 2018 as compared to the fiscal year ended December 31, 2017 (while maintaining our market share of 53%), which resulted in a 12% increase in freight revenues in our operations at Port of Santos when taking into account price adjustments as a result of theIGP-M and diesel price.
92
Comgás
Comgás’ revenues in the fiscal year ended December 31, 2018 amounted to R$6,840 million, representing the results of its activities of natural gas trading and distribution in the concession region of the state of São Paulo. This represented an increase of 23.51% as compared to the fiscal year ended December 31, 2017. This increase was primarily due to: (i) a 5% increase in the volume of gas sold to the industrial sector in the fiscal year ended December 31, 2018 as compared to the fiscal year ended December 31, 2017 as a result of certain commercial negotiations and the gradual recovery of industrial activity in Brazil, (ii) an increase in volume sold in our residential segment of 7% as compared to the fiscal year ended December 31, 2017 as a result of the addition of 113,000 new customers, (iii) an increase of 9% in the volume of gas sold to the commercial sector in the fiscal year ended December 31, 2018 as compared to the fiscal year ended December 31, 2017 as a result of the addition of new customers and the gradual recovery of economic activity in Brazil, (iv) a 14% increase in the cost of natural gas, and (v) a decrease of 5% in the gross revenue deductions due tonon-recurring tax credits effects resulting from the exclusion of ICMS from the PIS and COFINS calculation basis.
Moove
The net revenue of the lubricants business was R$3,449.9 million in the fiscal year ended December 31, 2018, an increase of 62% compared to the fiscal year ended December 31, 2017, primarily due to the expansion of Moove’s international operations, which resulted in an increase of 2%, or 20 million liters, in volume sold in the fiscal year ended December 31, 2018 as compared to the fiscal year ended December 31, 2017, certain operational synergies, and a better mix of products sold.
Cost of Sales
| | | | | | | | | | | | |
| | | For the Fiscal Year
Ended December 31, | | | %
Variation | |
| | | 2018 | | | 2017 | |
| | | (in millions of reais, except percentages) | |
Cosan Logística | | | (4,465.6 | ) | | | (4,221.0 | ) | | | 5.79 | % |
Comgás | | | (4,901.7 | ) | | | (3,492.4 | ) | | | 40.35 | % |
Moove | | | (2,781.1 | ) | | | (1,545.7 | ) | | | 79.92 | % |
| | | | | | | | | | | | |
Reconciliation | | | | | | | | | | | | |
Cosan Corporate | | | (11.6 | ) | | | (7.9 | ) | | | 46.84 | % |
Segment elimination | | | 40.1 | | | | 34.8 | | | | 15.23 | % |
| | | | | | | | | | | | |
Cost of sales | | | (12,119.9 | ) | | | (9,232.2 | ) | | | 31.28 | % |
| | | | | | | | | | | | |
The total cost of sales and services increased by 31% to R$12,119.9 million during the fiscal year ended December 31, 2018, from R$9,232.2 million during the fiscal year ended December 31, 2017 due to the factors described below.
Cosan Logística
The cost of Cosan Logística’s services provided in the fiscal year ended December 31, 2018 increased 6%, to R$4,465.6 million, as compared to R$4,221.0 million the fiscal year ended December 31, 2017. This increase was primarily due to: (i) a 13.4% increase in volume transported and an increase in efficiency, (ii) the fact that in the fiscal year ended December 31, 2018, variable costs increased at a slower pace than volume, mainly due to a continued decrease in fuel consumption (Liters/GTK decreased by 7.1% in the fiscal year ended December 31, 2018 as compared to the fiscal year ended December 31, 2017), and (iii) stable fixed costs in the fiscal year ended December 31, 2018 as compared to the fiscal year ended December 31, 2017.
Comgás
Comgás’ costs of sales and services, which corresponds to the cost of gas, transportation and construction activity on the gas distribution infrastructure under concession, totaled R$4,901.7 million in the fiscal year ended December 31, 2018, a 40% increase as compared to the fiscal year ended December 31, 2017. This increase reflects a 65% increase in the unitary cost of gas and a 6% increase in volume distributed in the fiscal year ended December 31, 2018 as compared to the fiscal year ended December 31, 2017. The increase in the unitary cost of gas was primarily due to the increase in the base references for the price of gas in our supply agreements, namely a decrease of 20% in the price of crude oil and a depreciation of 17.1% of thereal against the U.S. dollar during the fiscal year ended December 31, 2018.
93
Moove
The cost of lubricants sales totaled R$2,781.1 million in the fiscal year ended December 31, 2018, an increase of 80% as compared to the fiscal year ended December 31, 2017, mainly due to (i) higher import costs of base oil, due to higher international prices of crude oil; (ii) depreciation of thereal against the U.S. dollar; and (iii) an increase in costs from international operations, as a result of the expansion of our operations in the United Kingdom as well as the beginning of lubricant distribution operations in Argentina, France, Portugal and the United States in the fiscal year ended December 31, 2018.
Selling Expenses
Selling expenses are primarily related to transportation costs, including freight and shipping costs for lubricant sold in Brazil and exported, as well as storage and loading expenses of ethanol and sugar for export at our and third parties’ port facilities. Moove’s lubricant marketing expenses, as well as storage expenses, are also included as selling expenses.
| | | | | | | | | | | | |
| | | For the Fiscal Year
Ended December 31, | | | %
Variation | |
| | | 2018 | | | 2017 | |
| | | (in millions of reais, except percentages) | |
Cosan Logística | | | (12.9 | ) | | | (28.8 | ) | | | (55.21 | )% |
Comgás | | | (613.0 | ) | | | (652.9 | ) | | | (6.11 | )% |
Moove | | | (393.3 | ) | | | (386.7 | ) | | | 1.71 | % |
Reconciliation | | | | | | | | | | | | |
Cosan Corporate | | | (4.3 | ) | | | (0.3 | ) | | | — | |
| | | | | | | | | | | | |
Selling expenses | | | (1,023.5 | ) | | | (1,068.7 | ) | | | (4.23 | )% |
| | | | | | | | | | | | |
Selling expenses decreased by 4% to R$1,023.5 million during the fiscal year ended December 31, 2018 from R$1,068.7 million during the fiscal year ended December 31, 2017, due to the factors described below.
Cosan Logística
Cosan Logística’s selling expenses decreased by 55% to R$12.9 million in the fiscal year ended December 31, 2018 from R$28.8 million in the fiscal year ended December 31, 2017. This decrease was primarily due to awrite-off recorded in the fiscal year ended December 31, 2017 of a contractual penalty owed to us by a specific client which went insolvent. There was no suchwrite-off in the fiscal year ended December 31, 2018.
Comgás
Selling expenses decreased by 6% to R$613 million during the fiscal year ended December 31, 2018, from R$652.9 million during the fiscal year ended December 31, 2017, primarily as a result of lower amortization costs due to divestiment in customer relationship and lower third-party services expenses, partially offset by the effects of inflation (at a rate of 3.75% per year as measured by the IPCA).
Moove
Selling expenses increased 2%, to R$393.3 million in the fiscal year ended December 31, 2018, as compared to R$386.7 million in the fiscal year ended December 31, 2017. This increase was mainly due to an increase in personnel expenses as a result of the expansion of Moove’s international operations.
General and Administrative Expenses
| | | | | | | | | | | | |
| | | For the Fiscal
Year Ended
December 31, | | | %
Variation | |
| | | 2018 | | | 2017 | |
| | | (in millions of reais, except percentages) | |
Cosan Logística | | | (301.7 | ) | | | (285.4 | ) | | | 5.71 | % |
Comgás | | | (367.7 | ) | | | (345.0 | ) | | | 6.58 | % |
Moove | | | (132.3 | ) | | | (94.0 | ) | | | 40.74 | % |
Reconciliation | | | | | | | | | | | | |
Cosan Corporate | | | (180.1 | ) | | | (210.9 | ) | | | (14.60 | )% |
| | | | | | | | | | | | |
General and administrative expenses | | | (981.8 | ) | | | (935.3 | ) | | | 4.97 | % |
| | | | | | | | | | | | |
94
General and administrative expenses consist of salaries and benefits paid to employees, taxes, expenses related to third-party services, rentals and other expenses. Our total general and administrative expenses increased by 5% to R$981.8 million during the fiscal year ended December 31, 2018, an increase from R$935.3 million during the fiscal year ended December 31, 2017, due to the factors described below.
Cosan Logística
General and administrative expenses totaled R$301.7 million in the fiscal year ended December 31, 2018, an increase of 6% compared to the fiscal year ended December 31, 2017, primarily as a result of an increase of 15% in personnel expenses due to an increase in salary expenses as a result of inflation and social security charges from September 2018 onwards, higher consulting expenses in connection with mergers and acquisitions and certain other specific projects, and productivity issues in our administrative department.
Comgás
General and administrative expenses totaled R$367.7 million in the fiscal year ended December 31, 2018, compared with R$345 million in the fiscal year ended December 31, 2017, primarily due to an increase of 7% in personnel expenses due to an increase in variable compensation payments following improvements in certain operational indicators based on which variable compensation is paid.
Moove
General and administrative expenses totaled R$132.3 million in the fiscal year ended December 31, 2018, an increase of 41% when compared to the fiscal year ended December 31, 2017, primarily due to an 65% increase in employee benefit expenses as a result of the expansion of international operations;
Cosan Corporate
General and administrative expenses totaled R$180.1 million in the fiscal year ended December 31, 2018, a decrease of 15% when compared to the fiscal year ended December 31, 2017, primarily due to the Company’s efforts to control and reduce costs incurred in connection with third-party services and wages and benefits. The decrease in costs with wages and benefits was due to a reduction in the number of employees in the fiscal year ended December 31, 2018 as compared to the fiscal year ended December 31, 2017. These partially offset the impact of inflation on general expenses.
Other income (expense), net
Other income, net decreased from R$877.6 million in the fiscal year ended December 31, 2017 to R$738.2 million in the fiscal year ended December 31, 2018. This decrease was mainly due to gains related to the assignment of credit rights in the amount of R$1,034 million deriving from certain indemnity lawsuits filed against the federal government which had an impact in the fiscal year ended December 31, 2017 but not in the fiscal year ended December 31, 2018. In addition, in the fiscal year ended December 31, 2018, we recognized certain credits deriving from PIS and COFINS contributions in the amount of R$199 million as other income. Furthermore, Comgás and Petrobras entered into a settlement in respect to a judicial dispute related to the price charged in theFirme Nacionaland TCQ gas supply contracts, as a result of which we recognized an indemnification in the net positive amount of R$726 million as other income in the fiscal year ended December 31, 2018. For further information, see notes 5.7 and 6 to our financial statements.
Interest in earnings of associates
Equity in earnings of associates includes our 3% interest in Radar II, 2.51% interest in Radar, 51% interest in Tellus Brasil, 51% interest in Novvi Limited, 51% interest in Janus Brasil, 50% interest in Vertical and other investments. Equity in earnings of associates increased to R$51.5 million in the fiscal year ended December 31, 2018 from R$17.2 million in the fiscal year ended December 31, 2017, mainly due to better business performance.
Equity in earnings of joint ventures
Equity in earnings of joint ventures includes our 50% interests in Raízen Energia and Raízen Combustíveis. Equity income decreased to R$946.3 million in the fiscal year ended December 31, 2018 from R$985.1 million in the fiscal year ended December 31, 2017. This was a result of the factors detailed above for Raízen Energia and Raízen Combustíveis. In accordance with IFRS 11, these factors are not consolidated into our financial statements but accounted for in equity.
95
Finance results, net
Finance results, net in the fiscal year ended December 31, 2018 totaled a net financial expense of R$1,610.9 million compared with a net financial expense of R$2,751.5 million in the fiscal year ended December 31, 2017, a decrease of R$1,140 million, or 41%. This was mainly due to the cost of debt pegged to the average CDI rate, which decreased from 6.89% per annum as of December 31, 2017 to 6.40% per annum as of December 31, 2018.
For a better understanding of our finance results, the following table details our cost of debt:
| | | | | | | | | | | | |
| | | For the Fiscal Year
Ended December 31, | | | %
Variation | |
| | | 2018 | | | 2017 | |
| | | (in millions of reais, except percentages) | |
Cost of gross debt | | | | | | | | | | | | |
Interest on debt | | | (1,605.2 | ) | | | (1,787.3 | ) | | | (10.19 | )% |
Monetary and exchange rate variation | | | (1,491.1 | ) | | | (198.9 | ) | | | 649.67 | % |
Derivatives | | | 1,532.3 | | | | (34.7 | ) | | | (4,515.85 | ) |
Amortization of borrowing costs | | | (54.3 | ) | | | (38.9 | ) | | | 39.59 | % |
Guarantees and warranties on debt | | | (109.0 | ) | | | (157.5 | ) | | | (30.79 | )% |
| | | | | | | | | | | | |
| | | (1,727.3 | ) | | | (2,217.3 | ) | | | (22.10 | )% |
Income from financial investments | | | 438.1 | | | | 578.6 | | | | (24.28 | )% |
| | | | | | | | | | | | |
Cost of debt, net | | | (1,289.2 | ) | | | (1,638.7 | ) | | | (21.33 | )% |
| | | | | | | | | | | | |
Other charges and monetary variations | | | | | | | | | | | | |
Interest on other receivables | | | 460.9 | | | | 120.0 | | | | 284.08 | % |
Monetary variation on leases and concessions agreements | | | (186.3 | ) | | | (244.2 | ) | | | (23.71 | )% |
Monetary variation on leases | | | (105.1 | ) | | | (131.2 | ) | | | (19.89 | )% |
Bank charges | | | (94.8 | ) | | | (355.2 | ) | | | (73.31 | )% |
Advances on real state credits | | | (5.1 | ) | | | (20.2 | ) | | | (74.75 | )% |
Interest on contingencies and contracts | | | (102.5 | ) | | | (52.7 | ) | | | 94.50 | % |
Interest on other liabilities | | | (212.8 | ) | | | (409.7 | ) | | | (48.06 | )% |
Interest on shareholders’ equity | | | (13.0 | ) | | | (16.9 | ) | | | (23.08 | )% |
Exchange variation | | | (63.1 | ) | | | (2.7 | ) | | | 2,237.04 | % |
| | | | | | | | | | | | |
| | | (321.8 | ) | | | (1,112.8 | ) | | | (71.08 | )% |
| | | | | | | | | | | | |
Finance results, net | | | (1,610.9 | ) | | | (2,751.5 | ) | | | (41.45 | )% |
| | | | | | | | | | | | |
| | | | | | | | | | | | |
Reconciliation | | | | | | | | | | | | |
Finance expense | | | (2,849.2 | ) | | | (3,704.5 | ) | | | (23.09 | )% |
Finance income | | | 1,032.7 | | | | 870.7 | | | | 18.61 | % |
Foreign exchange losses, net | | | (1,555.2 | ) | | | (199.8 | ) | | | 678.38 | % |
Derivatives | | | 1,760.8 | | | | 282.1 | | | | 524.18 | % |
| | | | | | | | | | | | |
| | | (1,610.9 | ) | | | (2,751.5 | ) | | | (41.45 | )% |
| | | | | | | | | | | | |
Cost of gross debt.The total cost of gross debt (which includes interest expenses, exchange variation and derivative gain or loss) decreased by R$1,727.3 million, or 22%. This decrease was primarily due to gains on certain derivative contracts, which were partially offset by the adverse effects from the unhedged portion of our perpetual bond as a result of the depreciation of thereal against the US dollar.
Interest income.Interest income amounted to R$438.1 million in the fiscal year ended December 31, 2018, a decrease of 24% as compared to interest income of R$578.6 million in the fiscal year ended December 31, 2017. This decrease was primarily due to the decrease of the average CDI rate from 6.89% as of December 31, 2017 to 6.40% as of December 31, 2018.
96
Other charges and monetary variations.Other charges and monetary variations decreased 71% to R$321.8 million. Banking expenses, fees and other expenses decreased by R$260 million. This decrease is primarily due to the conclusion of certain legal disputes involving Comgás and Petrobras (see note 5.7 to our audited consolidated financial statements for additional information), and the recognition of certain credits deriving from PIS and COFINS contributions in a total amount of R$93 million (see note 6 to our audited consolidated financial statements for additional information).
Income tax (expense) benefit
Income tax expenses amounted to R$760.5 million for the fiscal year ended December 31, 2018, compared to R$428.4 million in the fiscal year ended December 31, 2017. This increase was a consequence of the higher profit in the fiscal year ended December 31, 2018 as compared to the fiscal year ended December 31, 2017. This increase is primarily due to theone-off gains resulting from the conclusion of certain legal disputes involving Comgás (see note 6 to our audited consolidated financial statements for additional information).
In the fiscal year ended December 31, 2018, the effective tax rate was 26.74%, which was lower than the nominal corporate tax rate of 34%, mainly due to interest in earnings of investees of R$339 million and tax incentives of R$12.4 million, which were partially offset by differences in tax rates on losses of overseas companies of R$48 million, interest on shareholders’ equity of R$19.8 million,non-deductible expenses of R$14.4 million and unrecognized tax losses of R$144 million.
Net income attributable to owners of the Parent
As a result of the foregoing, net income attributable to our owners was R$975.5 million in the fiscal year ended December 31, 2018, compared to R$551 million in the fiscal year ended December 31, 2017. This represented an increase of 77% after deducting net income attributable tonon-controlling interests of R$1,107,732 million and R$495.3 million in the fiscal year ended December 31, 2018 and the fiscal year ended December 31, 2017, respectively.
Results of Operations for the Fiscal Year Ended December 31, 2017 Compared to the Fiscal Year Ended December 31, 2016
Consolidated Results
The following table sets forth our consolidated statement of profit or loss for the fiscal years ended December 31, 2017 and 2016:
| | | | | | | | | | | | |
| | | For the Fiscal Year
Ended December 31, | | | %
Variation | |
| | | 2017 | | | 2016 | |
| | | (in millions of reais, except percentages) | |
Consolidated statement of profit or loss | | | | | | | | | | | | |
Net sales | | | 13,582.5 | | | | 12,518.1 | | | | 8.50 | % |
Cost of sales | | | (9,232.2 | ) | | | (8,317.5 | ) | | | 11.00 | % |
Gross profit | | | 4,350.3 | | | | 4,200.6 | | | | 3.56 | % |
Selling expenses | | | (1,068.7 | ) | | | (1,037.5 | ) | | | 3.01 | % |
General and administrative expenses | | | (935.3 | ) | | | (1,000.7 | ) | | | (6.54 | )% |
Other income (expense), net | | | 877.6 | | | | (116.3 | ) | | | (854.60 | )% |
Operating expense | | | (1,126.4 | ) | | | (2,154.5 | ) | | | (47.72 | )% |
Income before equity in earnings of investees and finance results | | | 3,223.9 | | | | 2,046.1 | | | | 57.56 | % |
Equity in earnings of associates | | | 17.2 | | | | (4.4 | ) | | | (490.91 | )% |
Equity in earnings of joint ventures | | | 985.1 | | | | 1,570.1 | | | | (37.26 | )% |
Finance results | | | (2,751.5 | ) | | | (3,055.8 | ) | | | (9.96 | )% |
Profit before taxes | | | 1,474.7 | | | | 556.0 | | | | 165.23 | % |
Income tax expense – current | | | (134.5 | ) | | | (228.6 | ) | | | (41.16 | )% |
Income tax benefit – deferred | | | (293.8 | ) | | | 166.9 | | | | (276.03 | )% |
Total income taxes | | | (428.3 | ) | | | (61.7 | ) | | | 594.17 | % |
Profit from continuing operations | | | 1,046.4 | | | | 494.3 | | | | 111.69 | % |
(Loss) profit from discontinued operation, net of tax | | | — | | | | (35.3 | ) | | | (100.00 | )% |
Profit for the year | | | 1,046.4 | | | | 459.0 | | | | 127.97 | % |
Net income attributable tonon-controlling interests | | | (495.3 | ) | | | (181.2 | ) | | | 173.34 | % |
Net income attributable to owners of the parent | | | 551.1 | | | | 277.8 | | | | 98.38 | % |
97
Net Sales
We report net sales after deducting Brazilian federal and state taxes assessed on gross sales (ICMS, PIS, COFINS), IPI (a federal value-added tax assessed on our gross sales in the Brazilian market at rates that vary by product) and INSS (federal social contribution taxes assessed on our gross sales in the Brazilian market of our agribusiness entities at a rate of 2.85%). Deductions from gross sales in the Brazilian domestic market, which are subject to these taxes, are significantly higher than our deductions from gross sales in export markets.
The table below presents a breakdown of our net sales for the fiscal years ended December 31, 2017 and 2016:
| | | | | | | | | | | | |
| | | For the Fiscal Year
Ended December 31, | | | %
Variation | |
| | | 2017 | | | 2016 | |
| | | (in millions of reais, except percentages) | |
Cosan Logística | | | 5,946.3 | | | | 5,014.6 | | | | 18.58 | % |
Northern Operations | | | 4,439.7 | | | | 3,651.5 | | | | 21.59 | % |
Southern Operations | | | 1,283.1 | | | | 1,097.7 | | | | 16.89 | % |
Container Operations | | | 223.5 | | | | 265.4 | | | | (15.79 | )% |
| | | | | | | | | | | | |
Comgás | | | 5,537.9 | | | | 5,657.1 | | | | (2.11 | )% |
Industrial | | | 3,494.4 | | | | 3,640.9 | | | | (4.02 | )% |
Residential | | | 849.7 | | | | 793.3 | | | | 7.11 | % |
Thermo generation | | | — | | | | 116.4 | | | | (100.00 | )% |
Construction revenue | | | 351.2 | | | | 339.0 | | | | 3.60 | % |
Commercial | | | 320.0 | | | | 238.4 | | | | 34.23 | % |
Cogeneration | | | 229.7 | | | | 216.0 | | | | 6.34 | % |
Automotive | | | 224.2 | | | | 206.0 | | | | 8.83 | % |
Other | | | 68.7 | | | | 107.1 | | | | (35.91 | )% |
| | | | | | | | | | | | |
Moove | | | 2,129.5 | | | | 1,883.7 | | | | 13.05 | % |
Lubricants | | | 1,876.9 | | | | 1,642.9 | | | | 14.24 | % |
Basic Oil | | | 220.5 | | | | 219.1 | | | | 0.64 | % |
Other | | | 32.1 | | | | 21.7 | | | | 47.93 | % |
| | | | | | | | | | | | |
Reconciliation | | | | | | | | | | | | |
Cosan Corporate | | | 3.4 | | | | 0.9 | | | | 277.78 | % |
| | | | | | | | | | | | |
Segment elimination | | | (34.6 | ) | | | (38.2 | ) | | | (9.42 | )% |
Net sales | | | 13,582.5 | | | | 12,518.1 | | | | 8.50 | % |
The change in the various components consists of the following:
Cosan Logística
Sales increased from R$5,014.6 million in the fiscal year ended December 31, 2016 to R$5,946.3 million in the fiscal year ended December 31, 2017, mainly due to an increase in volume transported of 23% compared to the fiscal year ended December 31, 2016. Net sales from Northern Operations totaled R$4,439.7 million in the fiscal year ended December 31, 2017, compared with R$3,651.5 million in the fiscal year ended December 31, 2016, primarily due to an increase in corn volume transported to meet the higher demand from a record grain crop that shipped at the year’s end. In addition, capacity gains also allowed for higher soybean meal volumes. The Southern Operations generated net revenue of R$1,283.1 million from services, an increase of 16.89% compared to the fiscal year ended December 31, 2016, due to higher pulp transportation levels and an increase in grain transportation. The decrease of 15.79% in Container Operations compared to the fiscal year ended December 31, 2016 reflected the Company’s strategy of diversifying cargo and rationalizingnon-profitable routes, especially in the Rio Grande do Sul and Mercosur corridors, in addition to lower demand for refrigerated-product transportation.
98
Comgás
Comgás’ revenues in the fiscal year ended December 31, 2017 amounted to R$5,537.9 million, representing the results of its activities of natural gas trading and distribution in the concession region of the state of São Paulo. This represented a decrease of 2.11% as compared to the fiscal year ended December 31, 2016, due to decreases in the average sales price authorized by ARSESP in May and September 2016, combined with a 0.7% decrease in volume distributed, which were partially offset by tariff increases in May 2017.
Moove
Our lubricants businesses comprise our lubricants and specialties business and certain other operations. The net revenue of the lubricants business was R$2,129.5 million in the fiscal year ended December 31, 2017, an increase of 13.05% compared to the fiscal year ended December 31, 2016, due to a 6% increase in the sales volume and a better mix of products sold.
Cost of Sales
| | | | | | | | | | | | |
| | | For the Fiscal Year
Ended
December 31, | | | %
Variation | |
| | | 2017 | | | 2016 | |
| | | (in millions ofreais, except
percentages) | |
Cosan Logística | | | (4,221.0 | ) | | | (3,769.1 | ) | | | 11.99 | % |
Comgás | | | (3,492.4 | ) | | | (3,174.1 | ) | | | 10.03 | % |
Moove | | | (1,545.7 | ) | | | (1,398.8 | ) | | | 10.50 | % |
| | | | | | | | | | | | |
Reconciliation | | | | | | | | | | | | |
Cosan Corporate | | | (7.9 | ) | | | (13.7 | ) | | | (42.34 | )% |
| | | | | | | | | | | | |
Segment elimination | | | 34.8 | | | | 38.2 | | | | (8.90 | )% |
| | | | | | | | | | | | |
Cost of sales | | | (9,232.2 | ) | | | (8,317.5 | ) | | | 11.00 | % |
Our total cost of sales and services increased by 11% to R$9,232.2 million during the fiscal year ended December 31, 2017, from R$8,317.5 million during the fiscal year ended December 31, 2016 due to the factors described below.
Cosan Logística
The cost of Cosan Logística’s services provided in the fiscal year ended December 31, 2017 increased 11.99%, to R$4,221 million, as compared to R$3,769.1 million the fiscal year ended December 31, 2016. This increase was primarily due to a 23% increase in volume transported. There was also a 10% increase in the average price of diesel, the effect of which were partially offset by the greater efficiency of certain new locomotives, which resulted in an overall 12% decrease in fuel consumption. Additionally, we undertook a review of the useful lives of certain property, plant and equipment. Similarly, higher grain volumes in the North Operation contributed to higher logistic costs. Fixed costs remained in line with the previous years, reflecting the strategy of operational leverage and cost dilution, according to the Company’s business plan. The recognition of tax credits contributed to a decrease in other operating expenses, while costs associated with depreciation and amortization increased due to the capitalization of investments made in 2016.
Comgás
Comgás’ costs of sales and services, which corresponds to the cost of gas, transportation and construction activity on the gas distribution infrastructure under concession, totaled R$3,492.4 million in the fiscal year ended December 31, 2017. This represented an increase of 10.03% as compared to the fiscal year ended December 31, 2016, mainly due to an increase of 16% in the unitary cost of natural gas. The increase in the unitary cost of gas was mainly due to the change in the price of oil, which is the reference for gas supply agreements.
99
Moove
The cost of lubricants sales totaled R$1,545.7 million in the fiscal year ended December 31, 2017, an increase of 10.50% as compared to the fiscal year ended December 31, 2016, mainly due to a 5.8% increase in lubricant sales volume.
Selling Expenses
Selling expenses are primarily related to transportation costs, including freight costs and shipping costs for lubricant sold in Brazil and exported, as well as storage and loading expenses of ethanol and sugar for export at our and third parties’ port facilities. Moove’s lubricant marketing expenses, as well as storage expenses, are also included as selling expenses.
| | | | | | | | | | | | |
| | | For the Fiscal Year
Ended December 31, | | | %
Variation | |
| | | 2017 | | | 2016 | |
| | | (in millions of reais, except percentages) | |
Cosan Logística | | | (28.8 | ) | | | (4.6 | ) | | | 526.09 | % |
Comgás | | | (652.9 | ) | | | (670.6 | ) | | | (2.64 | )% |
Moove | | | (386.7 | ) | | | (362.0 | ) | | | 6.82 | % |
| | | | | | | | | | | | |
Reconciliation | | | | | | | | | | | | |
Cosan Corporate | | | (0.3 | ) | | | (0.3 | ) | | | — | |
| | | | | | | | | | | | |
Selling expenses | | | (1,068.7 | ) | | | (1,037.5 | ) | | | 3.01 | % |
Selling expenses increased by 3.01% to R$1,068.7 million during the fiscal year ended December 31, 2017 from R$1,037.5 million during the fiscal year ended December 31, 2016, due to the factors described below.
Cosan Logística
Cosan Logística’s selling expenses increased to R$24.2 million in the fiscal year ended December 31, 2017, as compared to the fiscal year ended December 31, 2016, reflecting an increase of 144% in personnel expenses as a result of hiring additional employees.
Comgás
Selling expenses decreased by 2.64% to R$652.9 million during the fiscal year ended December 31, 2017, from R$670.6 million during the fiscal year ended December 31, 2016, primarily as a result of certain cost-cutting measures undertaken with regards to personnel as well as lower depreciation, the effects of which were partially offset by the effects of inflation (at a rate of 3% per year as measured by the IPCA) on our selling expenses.
Moove
Selling expenses increased 6.82%, to R$386.7 million, in the fiscal year ended December 31, 2017, as compared to R$362.0 million in the fiscal year ended December 31, 2016. This was mainly due to a 5.8% increase in the sales volumes of lubricants resulting in a 14.1% increase in commissions’ expenses.
General and Administrative Expenses
| | | | | | | | | | | | |
| | | For the Fiscal Year
Ended December 31, | | | %
Variation | |
| | | 2017 | | | 2016 | |
| | | (in millions of reais, except percentages) | |
Cosan Logística | | | (285.4 | ) | | | (343.0 | ) | | | (16.79 | )% |
Comgás | | | (345.0 | ) | | | (332.3 | ) | | | 3.82 | % |
Moove | | | (94.0 | ) | | | (72.6 | ) | | | 29.48 | % |
Reconciliation | | | | | | | | | | | | |
Cosan Corporate | | | (210.9 | ) | | | (252.8 | ) | | | (16.57 | )% |
| | | | | | | | | | | | |
General and administrative expenses | | | (935.3 | ) | | | (1,000.7 | ) | | | (6.54 | )% |
| | | | | | | | | | | | |
100
General and administrative expenses consist of salaries and benefits paid to employees, taxes, expenses related to third-party services, rentals and other expenses. Our total general and administrative expenses decreased by 6.54% to R$935.3 million during the fiscal year ended December 31, 2017, down from R$1,000.7 million during the fiscal year ended December 31, 2016, due to the factors described below.
Cosan Logística
General and administrative expenses totaled R$285.4 million in the fiscal year ended December 31, 2017, a decrease of 16.79% compared to the fiscal year ended December 31, 2016, primarily as a result of a decrease in insurance-related expenses and a 10.6% decrease in personnel expenses.
Comgás
General and administrative expenses totaled R$345 million in the fiscal year ended December 31, 2017, compared with R$332.3 million in the fiscal year ended December 31, 2016. The increase is mainly explained by increase of 8% in expenses relating to services provided by third parties and a 154% increase in maintenance expenses.
Moove
General and administrative expenses totaled R$94 million in the fiscal year ended December 31, 2017, an increase of 29.48% when compared to the fiscal year ended December 31, 2016, primarily due to a 48% increase in employee benefit expenses, reflecting an increase in variable compensation as a result of improvements in certain operational indicators, as well as a 137.2% increase in third-party service expenses.
Cosan Corporate
General and administrative expenses totaled R$210.9 million in the fiscal year ended December 31, 2017, a decrease of 16.57% when compared to the fiscal year ended December 31, 2016, primarily due to the Company’s efforts to control and reduce costs incurred in connection with third parties, services and wages and benefits, which partially offset the impact of inflation on general expenses.
Other income (expense), net
Other income, net increased from R$116.3 million in the fiscal year ended December 31, 2016 to R$877.6 million in the fiscal year ended December 31, 2017. This was mainly due to gains related to the assignment of credit rights in the amount of R$1,034 million deriving from certain indemnity lawsuits filed against the federal government.
Interest in earnings of associates
Equity in earnings of associates includes our 3% interest in Radar, 51% interest in Tellus Brasil, 50% interest in Novvi Limited, 51% interest in Janus Brasil, 50% interest in Vertical and other investments. Equity in earnings of associates increased to R$17.2 million in the fiscal year ended December 31, 2017 from negative R$4.4 million in the fiscal year ended December 31, 2016, mainly due to better business performance.
Equity in earnings of joint ventures
Equity in earnings of joint ventures includes our 50% interests in Raízen Energia and Raízen Combustíveis. Equity income decreased to R$985.1 million in the fiscal year ended December 31, 2017 from R$1,570.1 million in the fiscal year ended December 31, 2016. This was a result of the factors detailed above for Raízen Energia and Raízen Combustíveis. These factors are not consolidated into our financial statements but accounted for in equity, in accordance with IFRS 11.
Finance results, net
Finance results, net in the fiscal year ended December 31, 2017 totaled a net financial expense of R$2,751.5 million compared with a net financial expense of R$3,055.8 million in the fiscal year ended December 31, 2016, a decrease of R$304.3 million, or 10%. This was mainly due to cost of debt pegged to the CDI rate, which decreased from 13.63% p.a. in December 31, 2016 to 6.89% p.a. in December 31, 2017.
101
For a better understanding of our finance results, we break down our cost of debt as shown in the following table:
| | | | | | | | | | | | |
| | | For the Fiscal Year
Ended December 31, | | | %Variation | |
| | | 2017 | | | 2016 | |
| | | (in millions of reais, except percentages) | |
Cost of gross debt | | | | | | | | | | | | |
Interest on debt | | | (1,787.3 | ) | | | (1,835.5 | ) | | | (2.63 | )% |
Monetary and exchange rate variation | | | (198.9 | ) | | | 865.2 | | | | (122.99 | )% |
Derivatives | | | (34.7 | ) | | | (1,463.4 | ) | | | (97.63 | )% |
Amortization of borrowing costs | | | (38.9 | ) | | | (73.8 | ) | | | (47.29 | )% |
Discounts obtained from financial operations | | | — | | | | 86.0 | | | | (100.00 | )% |
Guarantees and warranties on debt | | | (157.5 | ) | | | (50.8 | ) | | | 210.04 | % |
| | | | | | | | | | | | |
| | | (2,217.3 | ) | | | (2,472.3 | ) | | | (10.31 | )% |
Income from financial investments | | | 578.6 | | | | 534.7 | | | | 8.21 | % |
| | | | | | | | | | | | |
Cost of debt, net | | | (1,638.7 | ) | | | (1,937.6 | ) | | | (15.43 | )% |
| | | | | | | | | | | | |
Other charges and monetary variations | | | | | | | | | | | | |
Interest on other receivables | | | 120.0 | | | | 263.2 | | | | (54.41 | )% |
Monetary variation on leases and concessions agreements | | | (244.2 | ) | | | (296.1 | ) | | | (17.53 | )% |
Monetary variation on leases | | | (131.2 | ) | | | (207.7 | ) | | | (36.83 | )% |
Bank charges | | | (355.2 | ) | | | (314.0 | ) | | | 13.12 | % |
Advances on real state credits | | | (20.2 | ) | | | (39.7 | ) | | | (49.12 | )% |
Interest on contingencies and contracts | | | (52.7 | ) | | | (92.0 | ) | | | (42.72 | )% |
Interest on other liabilities | | | (409.7 | ) | | | (414.5 | ) | | | (1.16 | )% |
Interest on shareholders’ equity | | | (16.9 | ) | | | (9.4 | ) | | | 79.79 | % |
Exchange variation | | | (2.7 | ) | | | (8.0 | ) | | | (66.25 | )% |
| | | | | | | | | | | | |
| | | (1,112.8 | ) | | | (1,118.2 | ) | | | (0.48 | )% |
| | | | | | | | | | | | |
Finance results, net | | | (2,751.5 | ) | | | (3,055.8 | ) | | | (9.96 | )% |
| | | | | | | | | | | | |
Reconciliation | | | | | | | | | | | | |
Finance expense | | | (3,704.5 | ) | | | (3,673.4 | ) | | | 0.85 | % |
Finance income | | | 870.7 | | | | 1,102.9 | | | | (21.05 | )% |
Foreign exchange losses, net | | | (199.8 | ) | | | 997.1 | | | | (120.04 | )% |
Derivatives | | | 282.1 | | | | (1,482.4 | ) | | | (119.03 | )% |
| | | | | | | | | | | | |
| | | (2,751.5 | ) | | | (3,055.8 | ) | | | 9.96 | % |
| | | | | | | | | | | | |
Cost of gross debt.The total cost of gross debt (which includes interest expenses, exchange variation and derivative gain or loss) decreased by R$255 million, or 10.31%. This was mainly due to the lower cost of debt indexed to the CDI rate. However, the increase in Rumo’s gross debt is due to the issuance of U.S.$500 million in Senior Notes due 2024, the proceeds of which were used to increase Rumo’s capital and liability management at the holding level, and also the issuance of U.S.$750 million in Senior Notes due 2024 by Rumo Logística, the proceeds of which were used for liability management.
Interest income.Interest income grew R$43.9 million, due to the higher average cash balance associated primarily with Rumo’s R$2,640 million capital increase.
Other charges and monetary variations.Other charges and monetary variations decreased 0.48% to R$1,112.8 million. Banking expenses, fees and other expenses increased by R$41.2 million.
Income tax (expense) benefit
Income tax expenses amounted to R$428.4 million for the fiscal year ended December 31, 2017, compared to R$61.7 million in the fiscal year ended December 31, 2016. This increase was a consequence of the higher profit in the fiscal year ended December 31, 2017 as compared to the fiscal year ended December 31, 2016, mainly due to a R$788 million gain from an assignment of credit rights arising from certain indemnification actions proposed against the Brazilian federal government. In the fiscal year ended December 31, 2017, the effective tax rate was 29.05%, which was slightly lower than the nominal corporate tax rate of 34%, mainly due to interest in earnings of investees of R$340.8 million and tax incentives of R$74.4 million, which were partially offset by differences in tax rates on losses of overseas companies of R$89.1 million, interest on shareholders’ equity of R$21.4 million,non-deductible expenses of R$52.2 million and unrecognized tax losses of R$177.8 million.
102
Net income attributable to owners of the Parent
As a result of the foregoing, net income attributable to our owners was R$551 million in the fiscal year ended December 31, 2017, compared to R$277.8 million in the fiscal year ended December 31, 2016. This represented an increase of 98.34% after deducting net income attributable tonon-controlling interests of R$495.3 million and R$181.2 million in the fiscal year ended December 31, 2017 and the fiscal year ended December 31, 2016, respectively.
| B. | Liquidity and Capital Resources |
Overview
Our financial condition and liquidity are influenced by several factors, including:
| | • | �� | our ability to generate cash flow from our operations; |
| | • | | the level of our outstanding indebtedness and related accrued interest, which affects our net financial expenses; |
| | • | | prevailing Brazilian and international interest rates, which affect our debt service requirements; |
| | • | | exchange rate variations, which can affect both our U.S. dollar-denominated debt and our U.S. dollar-denominated supply agreements; and |
| | • | | credit ratings, including factors that may materially influence credit ratings, implications of potential changes in ratings and management’s expectations; and covenant compliance, including the implications of a breach of financial or other covenants and our capacity for additional borrowing under its covenants. |
Our cash needs have traditionally consisted of working capital requirements, servicing of our indebtedness, capital expenditures related to investments in operations, maintenance and expansion of plant facilities, as well as acquisitions. Our sources of liquidity have traditionally consisted of cash flows from our operations andshort-and long-term borrowings. We have financed acquisitions through seller financing, third-party financing or capital contributions by our shareholders. We believe our current working capital is sufficient for our present requirements and would expect to meet any potential shortfalls in our working capital needs through short- and long-term borrowings, capital contributions by our shareholders, or offerings of debt or equity securities in the domestic and international capital markets.
In the fiscal years ended December 31, 2018, 2017 and 2016, the cash flow used in investing activities was funded mainly by increased borrowing. As of December 31, 2018, our consolidated cash and cash equivalents (including marketable securities) amounted to R$7,824.6 million, compared to R$8,408.5 million for the fiscal year ended December 31, 2017, and R$5,791.2 million for the fiscal year ended December 31, 2016.
On December 31, 2018, Cosan S.A. had a positive consolidated working capital of R$3,595.3 million and profit for the year of R$1,903.8 million. On December 31, 2018, Cosan Logística had a positive consolidated working capital of R$1,606 million and profit for the year of R$272.3 million.
Cash Flows
The following table sets forth certain of our cash flow data for the periods indicated:
| | | | | | | | | | | | |
| | | For the Fiscal Year Ended
December 31, | |
| | | 2018 | | | 2017 | | | 2016 | |
Consolidated | | (in R$ millions, except percentages) | |
Cash flows generated by operating activities | | | 5,377.9 | | | | 4,088.1 | | | | 3,635.4 | |
Cash flows “used in” investing activities | | | (1,498.8 | ) | | | (3,577.4 | ) | | | (727.0 | ) |
Cash flows “used in” financing activities | | | (5,106.4 | ) | | | (565.7 | ) | | | (1,819.3 | ) |
Cash flows generated by operating activities
The net cash flows generated by operating activities in the fiscal year ended December 31, 2018 were R$5,377.9 million, compared to net cash flows generated by operating activities of R$4,088.1 million in the fiscal year ended December 31, 2017, reflecting higher operational performance of our business. In addition, changes in assets and liabilities were lower than the previous year, with a total amount of R$152.7 million in the fiscal year ended December 31, 2018, compared to (R$766.9 million) in the fiscal year ended December 31, 2017. For the fiscal year ended December 31, 2016, net cash flows generated by operating activities were R$3,635.4 million.
103
Cash flows “used in” investing activities
Net cash flows used in investing activities were R$1,498.8 million in the fiscal year ended December 31, 2018, compared to R$3,577.4 million in the fiscal year ended December 31, 2017. This variation was mainly attributable to a decrease in cash invested in marketable securities generated of R$2,200 million and a decrease in restricted cash of R$136.3 million. This change was partially offset by acquisition of property, plant and equipment, intangible assets, investments and contract asset used of R$170.8 million. For the fiscal year ended December 31, 2016, cash flows used in investing activities were R$727 million. See also “—Capital Expenditures.”
Cash flows “used in” financing activities
Net cash flows used in financing activities were R$5,106.4 million in the fiscal year ended December 31, 2018, compared to net cash flows from financing activities of R$565.7 million in the fiscal year ended December 31, 2017. This variation was primarily due to proceeds from repayment of principal loans, borrowings and debentures of R$1,500 million and for issuing shares in Cosan Logística of R$2,030.2 million in the fiscal year ended December 31, 2017. For the fiscal year ended December 31, 2016, net cash flows used in financing activities were R$1,819.3 million.
Indebtedness
As of December 31, 2018, our outstanding debt totaled R$22,574.3 million, of which R$2,115.3 million was short-term debt. Our debt consisted of R$8,424.4 million in local currency-denominated debt and R$14,149.9 million in foreign currency-denominated debt.
Our total debt of R$22,574.3 million at December 31, 2018 increased 4.1% as compared to our total debt of R$21,688.9 million at December 31, 2017, primarily reflecting the depreciation of thereal against the U.S. dollar. Our short-term debt, composed of our current portion of long-term debt and interest accrued, represented 8.8% of our total indebtedness at December 31, 2018. Our U.S. dollar-denominated debt at December 31, 2018 represented 60.2%, and our British pound sterling-denominated debt represented 2.5% of our total indebtedness. Our secured debt at December 31, 2018 represented 5.75% of our total indebtedness, mostly in the form of land mortgage deeds, assignment/pledge of credit rights, machinery and equipment, sugar and ethanol.
Certain of our long-term debt agreements require us or certain of our subsidiaries, as applicable, to comply with certain financial covenants, including our U.S.$500 million 5.950% senior notes with maturity in 2024, Rumo’s U.S.$750 million 7.375% senior notes with maturity in 2024, Rumo’s 5.875% senior notes due 2025, our U.S.$200 million and U.S.$300 million 8.25% perpetual notes, our U.S.$500 million 5.00% notes with maturity in 2023 and our R$850 million 9.50% notes with maturity in 2018, which limit the ability of our subsidiaries to, among other things, enter into certain transactions with shareholders or affiliates, make certain restricted payments (including, in certain circumstances, payments of dividends), engage in a merger, sale or consolidation transactions and create liens.
We and our subsidiaries are subject to certain restrictive financial covenants set forth in existing loans and financing agreements. For the fiscal year ended December 31, 2018, we and our subsidiaries were in compliance with our debt covenants.
The principal financing activities for the fiscal year ended December 31, 2018 are described below:
| | • | | On January 18, 2018, Rumo completed an offering of 5.875% senior notes due 2025 in an aggregate principal amount of U.S.$500 million. The proceeds of this offering were used for general corporate purposes, including but not limited to the repayment of outstanding indebtedness and investments in our logistics business. |
| | • | | On January 26, 2018, Malha Norte entered into an Export Credit note with Banco Bradesco S.A. in an amount of R$500 million. The Export Credit Note matures in December 2023. Interest accrues at a rate equivalent to 126% of the CDI rate and is payable semiannually. The proceeds from the Export Credit Note were used for working capital. |
| | • | | On May 23, 2018, Comgás made its seventh issuance of simple, nonconvertible, unsecured debentures in a single series, in the amount of R$215 million. The debentures will mature in May 2028. The proceeds of this issuance were used for working capital and general corporate purposes. |
104
The table below shows the profile of our debt instruments:
| | | | | | | | | | | | | | | | | | | | | | | | |
| | | Interest | | | | | | | | | | | | | | | |
Description | | Index | | Annual
interest | | | December 31,
2018 | | | December 31,
2017 | | | December 31,
2016 | | | Currency | | | Maturity |
With guarantee | | | | | | | | | | | | | | | | | | | | | | | | |
BNDES | | URTJLP | | | 9.08 | % | | | 2,584.3 | | | | 2,270.1 | | | | 2,663.1 | | | | R$ | | | Dec-2029 |
| | Fixed | | | 5.31 | % | | | 1,055.3 | | | | 1,281.4 | | | | 1,233.5 | | | | R$ | | | Feb-2025 |
| | TJ462 | | | 9.87 | % | | | 316.9 | | | | 485.8 | | | | 651.4 | | | | R$ | | | Oct-2020 |
| | Selic | | | 8.32 | % | | | 152.6 | | | | 221.2 | | | | 271.7 | | | | R$ | | | Oct-2020 |
| | Selic | | | 8.49 | % | | | 63.9 | | | | 66.8 | | | | 41.7 | | | | R$ | | | Jun-2023 |
| | TJLP | | | 9.06 | % | | | 107.7 | | | | 120.6 | | | | 137.1 | | | | R$ | | | Jun-2023 |
| | Selic | | | 13.65 | % | | | 3.9 | | | | 4.1 | | | | 5.3 | | | | R$ | | | Sep-2020 |
| | Fixed | | | 3.75 | % | | | 2.3 | | | | 2.7 | | | | 3.9 | | | | R$ | | | Jan-2024 |
| | IPCA | | | 11.69 | % | | | 2.2 | | | | 2.8 | | | | 3.5 | | | | R$ | | | Nov-2021 |
EIB | | U.S.$ | | | 3.88 | % | | | 89.0 | | | | 127.2 | | | | 170.8 | | | | U.S.$ | | | Jun-2020 |
| | U.S.$ | | | 2.94 | % | | | 54.5 | | | | 70.6 | | | | 89.9 | | | | U.S.$ | | | Sep-2020 |
| | US$ + LIBOR | | | 3.43 | % | | | 115.6 | | | | 138.8 | | | | 172.3 | | | | U.S.$ | | | May-2021 |
| | US$ + LIBOR | | | 3.18 | % | | | 130.4 | | | | 149.4 | | | | 180.0 | | | | U.S.$ | | | Sep-2021 |
FINEP** | | Fixed | | | 5.00 | % | | | 93.3 | | | | 93.1 | | | | 109.2 | | | | R$ | | | Nov-2022 |
| | | | | | | | | | | | | | | | | | | | | | | | |
| | | | | | | | | 4,771.9 | | | | 5,034.6 | | | | 5,733.4 | | | | | | | |
| | | | | | | | | | | | | | | | | | | | | | | | |
Without guarantee | | | | | | | | | | | | | | | | | | | | | | | | |
Foreign loans | | GBP + LIBOR | | | 4.22 | % | | | 363.3 | | | | 312.6 | | | | 218.2 | | | | GBP | | | Dec-2022 |
| | GBP + LIBOR | | | 2.43 | % | | | 199.8 | | | | 157.4 | | | | — | | | | GBP | | | Nov-2020 |
ECN | | 112% of CDI | | | 7.18 | % | | | — | | | | 59.9 | | | | 120.1 | | | | R$ | | | Dec-2018 |
| | 126% of CDI | | | 8.13 | % | | | 514.8 | | | | — | | | | — | | | | R$ | | | Dec-2023 |
| | 125% of CDI | | | 8.06 | % | | | 646.0 | | | | 644.8 | | | | 552.6 | | | | R$ | | | Dec-2023 |
| | CDI + 3.50% | | | 10.11 | % | | | — | | | | 295.0 | | | | 294.5 | | | | R$ | | | Dec-2018 |
| | CDI + 3.47% | | | — | | | | — | | | | — | | | | 80.5 | | | | R$ | | | — |
Perpetual Notes | | U.S.$ | | | 8.25 | % | | | 1,961.8 | | | | 1,674.8 | | | | 1,650.1 | | | | U.S.$ | | | — |
Resolution 4131* | | U.S.$ | | | 4.79 | % | | | 39.7 | | | | 68.3 | | | | 134.0 | | | | U.S.$ | | | Oct-2020 |
| | U.S.$ | | | 2.40 | % | | | — | | | | 415.8 | | | | 407.3 | | | | U.S.$ | | | Mar-2018 |
| | U.S.$ + LIBOR | | | 3.75 | % | | | 156.4 | | | | 50.9 | | | | 32.8 | | | | U.S.$ | | | Feb-2020 |
| | U.S.$ | | | 3.67 | % | | | 292.2 | | | | — | | | | — | | | | U.S.$ | | | May-2023 |
| | U.S.$ | | | 4.34 | % | | | 41.0 | | | | — | | | | — | | | | U.S.$ | | | Nov-2019 |
| | U.S.$ | | | 3.35 | % | | | 210.0 | | | | — | | | | — | | | | U.S.$ | | | Nov-2022 |
Senior Notes Due 2018 | | Fixed | | | 9.50 | % | | | — | | | | 168.1 | | | | 168.2 | | | | R$ | | | Mar-2018 |
Senior Notes Due 2023 | | U.S.$ | | | 5.00 | % | | | 409.6 | | | | 339.7 | | | | 322.1 | | | | U.S.$ | | | Mar-2023 |
Senior Notes Due 2024 | | U.S.$ | | | 7.38 | % | | | 3,061.6 | | | | 2,570.6 | | | | — | | | | U.S.$ | | | Feb-2024 |
Senior Notes Due 2024 | | U.S.$ | | | 5.95 | % | | | 2,022.8 | | | | 1,664.9 | | | | — | | | | U.S.$ | | | Sep-2024 |
Senior Notes Due 2025 | | U.S.$ | | | 5.88 | % | | | 1,997.4 | | | | — | | | | — | | | | U.S.$ | | | Jan-2025 |
Senior Notes Due 2027 | | U.S.$ | | | 7.00 | % | | | 2,977.7 | | | | 2,530.4 | | | | 2,304.4 | | | | U.S.$ | | | Jan-2027 |
Trade banks | | CDI + 4.91% p.a. | | | 12.14 | % | | | — | | | | 98.1 | | | | 163.8 | | | | R$ | | | Jun-2018 |
| | Fixed U.S.$ | | | 5.33 | % | | | 15.4 | | | | 94.9 | | | | 85.7 | | | | U.S.$ | | | Jun-2019 |
Working capital | | CDI + 2.80% p.a. | | | 9.88 | % | | | — | | | | 391.7 | | | | 390.0 | | | | R$ | | | Dec-2018 |
| | CDI + 2.95% p.a. | | | 10.04 | % | | | — | | | | 286.5 | | | | 287.2 | | | | R$ | | | Dec-2018 |
| | CDI + 0.31% p.m. | | | 10.93 | % | | | — | | | | 1.1 | | | | 10.0 | | | | R$ | | | Jan-2018 |
| | CDI + 0.33% p.m. | | | 11.20 | % | | | — | | | | 3.3 | | | | — | | | | R$ | | | Mar-2018 |
| | 120% of CDI | | | 7.74 | % | | | 30.8 | | | | 21.2 | | | | — | | | | R$ | | | Aug-2020 |
| | 120.85% of CDI | | | 7.77 | % | | | — | | | | 10.4 | | | | — | | | | R$ | | | Sep-2018 |
| | 120.75% of CDI | | | 7.77 | % | | | — | | | | 20.9 | | | | — | | | | R$ | | | Sep-2018 |
| | 125% of CDI | | | 8.06 | % | | | 5.0 | | | | — | | | | — | | | | R$ | | | Dec-2019 |
| | 122% of CDI | | | 7.86 | % | | | 15.4 | | | | — | | | | — | | | | R$ | | | Feb-2019 |
Bank overdrafts | | 125.5% of CDI | | | 8.08 | % | | | — | | | | 0.1 | | | | 22.6 | | | | R$ | | | Feb-2019 |
Prepayment | | U.S.$ + LIBOR | | | 3.81 | % | | | 11.7 | | | | 10.0 | | | | 55.6 | | | | U.S.$ | | | Apr-2019 |
FINIMP | | U.S.$ + LIBOR | | | — | | | | — | | | | — | | | | 40.8 | | | | U.S.$ | | | — |
Non-convertible debentures | | CDI + 2.05% p.a. | | | 8.57 | % | | | — | | | | 152.6 | | | | 154.3 | | | | R$ | | | — |
| | CDI + 1.30% p.a. | | | — | | | | — | | | | — | | | | 300.2 | | | | R$ | | | — |
| | CDI + 3.50% p.a. | | | 10.11 | % | | | — | | | | 1,359.1 | | | | 2,347.3 | | | | R$ | | | — |
| | IGPM + 6.10% | | | 14.61 | % | | | 228.0 | | | | — | | | | — | | | | R$ | | | May-2028 |
| | IPCA + 5.10% | | | 9.40 | % | | | — | | | | 363.9 | | | | 346.3 | | | | R$ | | | — |
| | IPCA + 5.57% | | | 9.47 | % | | | 203.6 | | | | 197.9 | | | | 183.2 | | | | R$ | | | Sep-2020 |
| | IPCA + 7.14% | | | 11.09 | % | | | 305.9 | | | | 293.3 | | | | 284.7 | | | | R$ | | | Dec-2020 |
| | IPCA + 7.48% | | | 11.45 | % | | | 275.0 | | | | 263.7 | | | | 255.9 | | | | R$ | | | Dec-2022 |
| | IPCA + 7.36% | | | 11.32 | % | | | 90.7 | | | | 86.9 | | | | 84.4 | | | | R$ | | | Dec-2025 |
| | IPCA + 5.87% | | | 9.78 | % | | | 767.6 | | | | 726.8 | | | | 660.0 | | | | R$ | | | Dec-2023 |
| | IPCA + 4.33% | | | 8.18 | % | | | 414.6 | | | | 396.3 | | | | — | | | | R$ | | | Oct-2024 |
| | 108 % of CDI | | | 6.92 | % | | | — | | | | 171.5 | | | | 350.9 | | | | R$ | | | — |
| | Fixed | | | 13.13 | % | | | — | | | | 163.8 | | | | 163.9 | | | | R$ | | | — |
| | 128% of CDI | | | 8.26 | % | | | 501.1 | | | | 499.6 | | | | — | | | | R$ | | | Dec-2025 |
| | CDI + 0.90% | | | 7.36 | % | | | 43.5 | | | | 87.5 | | | | 133.5 | | | | R$ | | | Sep-2019 |
| | | | | | | | | | | | | | | | | | | | | | | | |
| | | | | | | | | 17,802.4 | | | | 16,654.3 | | | | 12,605.1 | | | | | | | |
Consolidated Debt | | | | 22,574.3 | | | | 21,688.9 | | | | 18,338.5 | | | | | | | |
| | | | | | | | | | | | | | | | | | | |
Current | | | | 2,115.3 | | | | 3,903.3 | | | | 2,404.0 | | | | | | | |
| | | | | | | | | | | | | | | | | | | |
Non-current | | | | 20,459.0 | | | | 17,785.6 | | | | 15,934.5 | | | | | | | |
| | | | | | | | | | | | | | | | | | | |
| * | Resolution 4,131: funds raised outside of Brazil with several financial institutions. |
| ** | FINEP: Funding Authority for Studies and Projects. |
105
Unused Sources of Liquidity
On December 31, 2018, 2017 and 2016, we and our subsidiaries had unused available credit lines in the amount of R$2,609.8 million, R$522.3 million and R$797.7 million, respectively. The use of these credit lines is subject to certain contractual conditions.
Working Capital
As of December 31, 2018, we had working capital of R$5,718.8 million, compared to R$4,011.6 million as at December 31, 2017. The difference between the position at December 31, 2018 and December 31, 2017 was mainly attributable to an increase in marketable securities and trade receivables. See also “—Overview.”
Capital Expenditures
Our capital expenditures in property, plant and equipment, including acquisitions (net of cash acquired) were R$2,628.2 million during the fiscal year ended December 31, 2018, compared to R$2,457.5 million during the fiscal year ended December 31, 2017. For the fiscal year ended December 31, 2016 our capital expenditures were R$2,190.6 million.
In 2018, 2017 and 2016, our capital expenditures consisted primarily of the following:
| | • | | Rumo.Rumo has focused on investments in the renovation of assets, in particular its locomotives and railcar fleet, through the purchase of new rolling stock to replace assets in poor condition of use. |
| | • | | Comgás. Comgás has invested in the expansion of its network and has also undertaken network support investments in order to reinforce, restore and renovate the existing distribution network. |
| | • | | Moove. Moove has invested in modernization and maintenance of its assets. |
The following table sets forth our capital expenditures for the fiscal years ended December 31, 2018, 2017 and 2016:
| | | | | | | | | | | | |
| | | For the Fiscal Year Ended
December 31, | |
| | | 2018 | | | 2017 | | | 2016 | |
| | | (in millions ofreais) | |
Cosan Logística | | | 1,996.7 | | | | 2,045.4 | | | | 1,699.2 | |
Comgás | | | 531.7 | | | | 353.0 | | | | 438.4 | |
Moove | | | 47.3 | | | | 48.6 | | | | 41.6 | |
Cosan Corporate | | | 52.4 | | | | 10.5 | | | | 11.4 | |
| | | | | | | | | | | | |
Total consolidated capital expenditures | | | 2,628.2 | | | | 2,457.5 | | | | 2,190.6 | |
| | | | | | | | | | | | |
The main planned and undergoing projects related to capital expenditures are described in “Item 4. Information on the Company—D. Property, Plant and Equipment.” We expect to fund such planned and undergoing projects primarily through our and our subsidiaries’ working capital and existing or new indebtedness.
| C. | Research and Development, Patents, Licenses, etc. |
See “Item 4. Information on the Company—B. Business Overview—Patents, Licenses, Contracts and Processes” and “Item 4. Information on the Company—B. Business Overview—Research and Development.”
The following list sets forth, in our view, the most important trends, uncertainties and events that are reasonably likely to continue to have a material effect on our revenues, income from continuing operations, profitability, liquidity and capital resources, or that may cause reported financial information to be not necessarily indicative of future operating results or financial condition:
| | • | | The ongoing economic and political crisis in Brazil may adversely affect the performance of the Brazilian economy; |
| | • | | Developments and the perception of risk in other countries may adversely affect the Brazilian economy; |
| | • | | Potential inflation increases that could cause an increase in interest rates and lower growth in lending activities; |
| | • | | Continued market volatility and instability that could affect our revenues; |
106
| | • | | Restrictive regulations or government intervention; |
| | • | | Decreased liquidity in domestic and international capital markets; |
| | • | | Tax policies that could decrease our profitability; and |
| | • | | Currency fluctuation and exchange rate controls that could have an adverse impact on international investors. |
For more information, see “Item 3. Key Information—D. Risk Factors” where we present the risks we face in our business that may affect our commercial activities, operating results or liquidity.
| E. | Off-Balance Sheet Arrangements |
We have entered, in the normal course of business, into several types ofoff-balance sheet arrangements, as set forth below:
Acquisition of assets
Following the postponement of the 2014 Five-Year Tariff Review 2014 as a result of the publications of ARSESP Resolutions No. 493 and No. 494, both of which were published on May 27, 2014, which approved the “Tariff Review Process of Gas distribution companies in the State of São Paulo, defining event schedule,” and the “Provisional adjustment of marketing margins of São Paulo Gas Company—COMGÁS,” we are not subject to any set regulatory commitment to purchase assets as of December 31, 2018, 2017 and 2016.
Operating Leases
At December 31, 2018, 2017 and 2016, the future minimum lease payments undernon-cancellable operating leases are as follows:
| | | | | | | | | | | | |
| | | December 31,
2018 | | | December 31,
2017 | | | December 31,
2016 | |
| | | (in thousands ofreais) | |
Less than one year | | | 12,094 | | | | 10,358 | | | | 11,545 | |
Between one and five years | | | 33,231 | | | | 35,136 | | | | 31,050 | |
More than five years | | | 4,362 | | | | 10,708 | | | | 10,576 | |
| | | | | | | | | | | | |
Total | | | 49,687 | | | | 56,202 | | | | 53,171 | |
| | | | | | | | | | | | |
| F. | Tabular Disclosure of Contractual Obligations |
Contractual Financial Obligations
The following table sets forth the maturity schedule of our material contractual financial obligations (contracted undiscounted cash flows basis) at December 31, 2018:
| | | | | | | | | | | | | | | | | | | | |
| | | Less than
1 year | | | 1 to 2
years | | | 3 to 5
years | | | More than
5 years | | | Total | |
| | | (in millions ofreais) | |
Loans, borrowings and debentures(1) | | | (3,374 | ) | | | (3,527 | ) | | | (10,410 | ) | | | (21,132 | ) | | | (38,443 | ) |
Trade payables | | | (1,924 | ) | | | — | | | | — | | | | — | | | | (1,924 | ) |
Other financial liabilities | | | (456 | ) | | | — | | | | — | | | | — | | | | (456 | ) |
Tax installments—REFIS | | | (67 | ) | | | (16 | ) | | | (38 | ) | | | (111 | ) | | | (232 | ) |
Leases | | | (185 | ) | | | (153 | ) | | | (304 | ) | | | (196 | ) | | | (838 | ) |
Derivative financial instruments | | | 85 | | | | 19 | | | | (426 | ) | | | 3,776 | | | | 3,454 | |
Payables to related parties | | | (356 | ) | | | — | | | | — | | | | — | | | | (356 | ) |
Dividends payable | | | (187 | ) | | | — | | | | — | | | | — | | | | (187 | ) |
| | | | | | | | | | | | | | | | | | | | |
Total | | | (6,464 | ) | | | (3,678 | ) | | | (11,177 | ) | | | (17,663 | ) | | | (38,982 | ) |
| | | | | | | | | | | | | | | | | | | | |
| (1) | Include future interests based on the applicable rates at December 31, 2018. |
Since December 31, 2018, there have been no material changes to the contractual obligations described above.
107
Our long-term debt consists primarily of:
| | • | | R$409.6 million in senior notes due March 2023; |
| | • | | R$3,061.6 million in senior notes due February 2024; |
| | • | | R$2,022.8 million in senior notes due September 2024; |
| | • | | R$2,977.7 million in senior notes due January 2027; |
| | • | | R$4,289 million in BNDES (finance lease) financing due between 2020 and 2029; |
| | • | | R$1,961.8 million in perpetual notes with call option for Cosan S.A. beginning on November 5, 2015; |
| | • | | R$51.2 million in working capital due 2020; |
| | • | | R$389.5 million in the form of a loan from the European Investment Bank (EIB) due 2021; |
| | • | | R$739.3 million in the form of a Resolution4,131-type due May 2023; |
| | • | | R$2,830 million in debentures due 2028; |
| | • | | R$1,160.8 million in export credit notes (ECN) due 2023; and |
| | • | | R$683.6 million in other debts. |
We believe we will be able to refinance our existing debt on favorable market conditions.
Sales Commitments
None.
See “Forward-Looking Statements.”
| Item 6. | Directors, Senior Management and Employees |
Our board of directors and our executive officers are responsible for the operation of our business. Nevertheless, Mr. Rubens Ometto Silveira Mello, who controls all of our class B series 1 common shares, has the overall power to control us, including the power to establish our management policies.
| A. | Directors and Senior Management |
Board of Directors
Ourby-laws provide that our board of directors shall consist of between five and eleven directors, or such greater number as our board of directors may determine. Our board of directors currently consists of twelve directors.
Our board of directors is the decision-making body responsible for, among other things, determining policies and guidelines for our business. The board of directors also supervises our executive officers and monitors their implementation of policies and guidelines established from time to time by our board of directors.
Our board of directors is divided into three classes (Class I, Class II and Class III) that are, as nearly as possible, of equal size. Each class of directors is elected for a three-year term of office, and the terms are staggered so that the term of only one class of directors expires at each annual general meeting. Members of our board of directors are subject to removal at any time with or without cause at a general meeting of shareholders. Ourbye-laws do not and Bermuda law does not include any citizenship or residency requirements for members of our board of directors provided that we otherwise meet the residency requirements in the Companies Act 1981 which are satisfied by having a Bermuda resident director, a Bermuda resident corporate secretary or a Bermuda resident representative.
108
The following table lists the members of our board of directors:
| | | | | | | | | | | | | | | | | | | | | | | | |
| | | Initial Year of Appointment (1) | | | | | Position Held | |
Name | | Cosan
Limited | | | Cosan
S.A. | | | Cosan
Logística | | | Class(1) | | Cosan
Limited | | Cosan S.A. | | Cosan Logística | | Year of Birth | |
Rubens Ometto Silveira Mello | | | 2007 | | | | 2000 | | | | 2012 | | | III | | Director | | Chairman | | Chairman | | | 1950 | |
Marcelo Eduardo Martins | | | 2009 | | | | 2009 | | | | 2015 | | | III | | Director | | — | | — | | | 1966 | |
Mailson Ferreira da Nóbrega(2) | | | 2007 | | | | 2008 | | | | 2015 | | | I | | Director | | — | | Director | | | 1942 | |
Marcos Marinho Lutz | | | 2007 | | | | 2015 | | | | 2014 | | | II | | Director | | Vice Chairman | | Vice Chairman | | | 1969 | |
Pedro Isamu Mizutani | | | 2007 | | | | 2000 | | | | — | | | III | | Director | | — | | — | | | 1959 | |
Marcelo de Souza Scarcela Portela | | | 2007 | | | | 2009 | | | | 2017 | | | II | | Director | | Director | | Director | | | 1961 | |
José Alexandre Scheinkman(2) | | | 2007 | | | | — | | | | — | | | I | | Director | | — | | — | | | 1948 | |
Burkhard Otto Cordes | | | 2008 | | | | 2005 | | | | — | | | II | | Director | | Director | | Director | | | 1975 | |
Richard Steere Aldrich Junior(2) | | | 2016 | | | | — | | | | — | | | I | | Director | | — | | — | | | 1947 | |
Dan Ioschpe(2) | | | 2015 | | | | 2014 | | | | — | | | II | | Director | | Director | | — | | | 1967 | |
Roberto de Rezende Barbosa | | | 2015 | | | | — | | | | — | | | II | | Director | | — | | — | | | 1950 | |
Vasco Augusto Pinto Fonseca Dias Júnior | | | 2016 | | | | — | | | | — | | | III | | Director | | — | | — | | | 1956 | |
| (1) | The terms of the directors expire as follows: Class I Directors at the annual general meeting to be held in April 2020; Class II Directors at the annual general meeting to be held in April 2021; and Class III Directors at the annual general meeting to be held in April 2019). |
The following is a summary of the business experience of our current directors. Unless otherwise indicated, the business address of our current directors is Av. Brigadeiro Faria Lima, 4,100 – 16th floor, São Paulo – SP,04538-132, Brazil.
Rubens Ometto Silveira Mello. Mr. Mello is our chairman. He holds a degree in mechanical engineering from the Escola Politécnica of the University of São Paulo (1972). Mr. Mello has more than 40 years of experience in the management of large companies. He has also served as general director and chairman of the board of directors of Costa Pinto S.A. since 1980 and officer and chairman of the board of directors of Aguassanta Participações S.A., since 2001. Currently, Mr. Mello is the chairman of the boards of Cosan S.A., Comgás, Rumo, Cosan Logística S.A., Raízen, Radar and Moove. He is also one of the founders of UNICA, the Sugarcane Agroindustry Association of the State of São Paulo (UNICA—União da Agroindústria Canavieira do Estado de São Paulo). Prior to joining Cosan, Mr. Mello worked from 1971 to 1973 as an advisor to the board of executive officers of UNIBANCO União de Bancos Brasileiros S.A., and from 1973 to 1980 as chief financial officer of Indústrias Votorantim S.A.
Marcos Marinho Lutz. Mr. Lutz is a member of our board of directors and our chief executive officer. He has been a member of Cosan’s board of directors since 2015 and a member of Cosan Logística’s board of directors since 2014. He is also Cosan S.A.’s and Cosan Logística’s chief executive officer. Mr. Lutz holds a naval engineering degree from Escola Politécnica of the University of São Paulo and a master’s degree in business administration from Kellogg Graduate School of Management, Northwestern University. From 2002 to 2006, Mr. Lutz was the executive director of infrastructure and energy at CSN (SID) and a board member of MRS Logística, CFN Railways, and Itá Energética. Before that, Mr. Lutz was the chief operating officer at Ultracargo S.A., the logistics affiliate of the Ultra Group.
Marcelo Eduardo Martins. Mr. Martins was a member of our board of directors and of Cosan S.A.’s board of directors from March 23, 2009 until December 12, 2017 and member of Cosan Logística’s board of directors from April 30, 2015 until April 5, 2018. Mr. Martins also holds the position of chief financial officer and investor relations officer of the Company. His duties include identifying acquisition opportunities and implementing takeovers as well as business development activities for which the company may have strategic interest in the future. In July 2007, Mr. Martins was appointed as an executive officer of Aguassanta Participações S.A. Prior to joining the Cosan Group, Mr. Martins was the Chief Financial and Business Development Officer of Votorantim Cimentos between July 2003 and July 2007 and, prior to that, head of Latin American Fixed Income at Salomon Smith Barney (Citigroup) in New York. He has significant experience in capital markets, having worked at Citibank (where he began his career as a trainee in 1989), Unibanco, UBS and FleetBoston. He has a degree in business administration from the Getúlio Vargas Foundation.
109
Mailson Ferreira da Nóbrega. Mr. Nóbrega has been a member of our board of directors since 2007, of Cosan Logística S.A.’s board of directors since 2015 and of Rumo’s board of directors since 2017. He is an economist and was Brazil’s Minister of Finance from 1988 to 1990. He was previously Technical Consultant and Chief of Project Analysis Department at Banco do Brasil; Coordination Chief of Economic Affairs of the Ministry of Industry and Commerce and Secretary General of the Ministry of Finance. He performed as the chief executive officer of the European Brazilian Bank—EUROBRAZ, in London. Mr. Nóbrega is also member of the board of directors of the following companies: Grendene S.A., Rodobens Negócios Imobiliários S.A. and Fertilizantes Heringer S.A.
Pedro Isamu Mizutani. Mr. Mizutani has been a member of our board directors since 2007. Currently Mr. Mizutani is Raízen’s Officer. Mr. Mizutani holds a production-engineering degree from the Escola Politécnica of the University of São Paulo (1982), a postgraduate degree in finance from UNIMEP—Universidade Metodista de Piracicaba (1986) and a master’s degree in business management from FGV—Fundacão Getúlio Vargas, São Paulo, with an extension degree from Ohio University (2001). Mr. Mizutani has more than 30 years of experience in finance and administration with companies in the ethanol and sugar industries. He also served as a planning director of Usina Costa Pinto S.A. from 1983 to 1987, as financial manager from 1987 to 1988, and as administrative and financial director from 1988 to 1990. From 1990 to 2001, he acted as administrative and financial director of the group.
Marcelo de Souza Scarcela Portela. Mr. Portela is a member of our board of directors and the legal vice president and officer of Cosan S.A. and Cosan Logística. Mr. Portela is also a member of the board of directors of Rumo, Comgás and Cosan Logística. He holds a law degree from Faculdade de Direito da Universidade de São Paulo (1983), and completed graduate studies in commercial law from Faculdade de Direito da Universidade de São Paulo (1988) and McGill University Law School (1990) in Montréal, QC, Canada.
José Alexandre Scheinkman. Mr. Scheinkman is a member of our board of directors. He is a Columbia University Professor (Charles and Lynn Zhang Professor of Economics) and the Theodore A. Wells ’29 Professor of Economics (Emeritus) at Princeton University. He holds a bachelor’s degree in economics from the Federal University of Rio de Janeiro (1969), a Master’s (1973) and Ph.D. (1974) in economics from the University of Rochester, as well as a Master’s degree in Mathematics from the Institute of Pure and Applied Mathematics (Brazil – 1970). He is a member of several research groups and associations, including the National Bureau of Economic Research and the Cambridge Endowment for Research in Finance. He was awarded the title of doctor honoris causa by the Université Paris-Dauphine in 2001. He sits on the Scientific Council of the Europlace Institute of Finance (Paris), on the National Academy of Sciences, on the American Finance Association and in the Academic Council of INSPER. He was previously Vice-President for Financial Strategies of Goldman, Sachs & Co., a member of Axion Investments from 2003 to 2013,co-editor of the Journal of Political Economy and a member of the economic advisory group for the Sloan Foundation.
Burkhard Otto Cordes. Mr. Cordes has been a member of our board of directors since 2008 and of Cosan S.A.’s board of directors since 2005. He holds a degree in business administration from Fundação Armando Álvares Penteado (1997) and a master’s degree in finance fromIBMEC-SP (2001). Mr. Cordes has worked in financial markets at Banco BBM S.A., a company owned by Grupo Mariani, where he worked at its commercial division focusing corporate and middle market segments. Before holding his current position, he had worked at IBM Brasil in its financial division. Mr. Cordes is Mr. Mello’sson-in-law.
Richard Steere Aldrich Junior. Mr. Aldrich, Jr. graduated in the United States from Brown University (1970) and from Vanderbilt University School of Law (1975). In 1975, he joined Shearman & Sterling LLP as an associate, where he later became a partner, in 1984, a position in which he served until 2009. From 2009 to 2016 he was a partner at Skadden, Arps, Slate, Meagher & Flom LLP. Over the course of his career, he has been involved in offerings, mergers and acquisitions, debt restructurings and public and private financing transactions in Brazil and the United States.
Dan Ioschpe. Mr. Ioschpe is a member of Cosan S.A.’s board of directors since 2014. He graduated from the Federal University of Rio Grande do Sul with a bachelor’s degree in Business Administration, and also has a postgraduate degree from the Escola Superior de Propaganda e Marketing as well as a masters’ degree in business administration (MBA) from the Tuck School of Business at Dartmouth College (in the United States). He joined Iochpe-Maxion in 1986, where he held several positions until June 1996, when he left to take the presidency of AGCO in Brazil. He returned to Iochpe-Maxion in January 1998, becoming chief executive officer in the same year. He remained chief executive officer until March 2014, when he became chairman of the board of directors of Iochpe-Maxion.
110
Roberto de Rezende Barbosa. Mr. Barbosa worked as a trainee at Halles Bank and the Dacon dealership, assuming the family business in 1975. He was the chief executive officer of Grupo Nova América and is currently a board member at UNICA – the Federation of Sugarcane Industries of São Paulo State.
Vasco Augusto Pinto Fonseca Dias Júnior. Mr. Dias holds a bachelor’s degree in systems engineering from the Pontifical Catholic University of Rio de Janeiro and earned a graduate degree from the same university. He joined the Shell Group as an intern in 1979 and later became analyst and head of systems. In December 2000, he left the Shell Group to serve as Executive Officer at Companhia Siderúrgica Nacional – CSN. He returned to the Shell Group in 2005 as President for Latin America. He also served as the chief executive officer of Raízen S.A. from 2011 (at the time of the joint venture between Cosan and Shell) until March 2016.
Executive Officers
Our executive officers serve as our executive management body. They are responsible for our internal organization andday-to-day operations and for the implementation of the general policies and guidelines established from time to time by our board of directors.
Our executive officers are elected by our board of directors for an indeterminate term and are eligible for reelection. Our board of directors may remove any executive officer from office at any time with or without cause. Our executive officers hold meetings when called by any of our executive officers.
The following table lists our current executive officers:
| | | | | | | | | | | | | | | | | | | | | | |
Name | | Initial Year of Appointment | | | Position Held at | | Year
of
Birth | |
| | Cosan
Limited(1) | | | Cosan
S.A.(2) | | | Cosan
Logística(2) | | | Cosan Limited | | Cosan S.A. | | Cosan Logística |
Marcos Marinho Lutz | | | 2007 | | | | 2009 | | | | 2014 | | | Chief Executive Officer
and Board Member | | Chief Executive Officer
andVice-Chairman | | Chief Executive Officer
andVice-Chairman | | | 1969 | |
Marcelo Eduardo Martins | | | 2009 | | | | 2009 | | | | 2014 | | | Chief Financial Officer,
Investor Relations Officer
and Board Member | | Chief Financial Officer
and Investor Relations
Officer | | Chief Financial Officer
and Investor Relation
Officer | | | 1966 | |
Marcelo de Souza Scarcela Portela | | | 2015 | | | | 2009 | | | | 2014 | | | General Counsel
and Board Member | | Legal Vice President
and Board Member | | Legal Vice President
and Board Member | | | 1961 | |
Burkhard Otto Cordes | | | 2016 | | | | — | | | | — | | | Risk Officer and Board
Member | | Board Member | | Board Member | | | 1975 | |
| (1) | The terms of our executive officers are indeterminate. |
| (2) | The terms of the executive officers of Cosan S.A. and Cosan Logística expire at the annual general meetings of Cosan S.A. and Cosan Logística, respectively, to be held on in April 2019. |
Cosan Limited’s officers are Marcos Marinho Lutz, Marcelo Eduardo Martins, Marcelo de Souza Scarcela Portela and Burkhard Otto Cordes. Cosan S.A.’s officers are Marcos Marinho Lutz, Marcelo Eduardo Martins and Marcelo de Souza Scarcela Portela. Cosan Logística’s officers are Marcos Marinho Lutz, Marcelo Eduardo Martins and Marcelo de Souza Scarcela Portela.
Unless otherwise indicated, the business address of the executive officers is Av. Brigadeiro Faria Lima, 4,100 – 16th floor, São Paulo – SP,04543-011, Brazil.
Key managers
| | | | | | | | | | |
Name | | Initial Year
of Appointment | | | Position Held | | Year
of
Birth | |
Nelson Roseira Gomes Neto | | | 2015 | | | Chief Executive Officer—Comgás | | | 1970 | |
Guilherme Lelis Bernardo Machado | | | 2014 | | | Executive Officer—Cosan | | | 1978 | |
Rafael Bergman | | | 2018 | | | Chief Operating Officer—Comgás | | | 1978 | |
Julio Fontana Neto | | | 2015 | | | Chief Executive Officer—Rumo | | | 1955 | |
Ricardo Lewin | | | 2017 | | | Chief Financial Officer and
Investor Relations Officer—Rumo | | | 1974 | |
Daniel Rockenbach | | | 2015 | | | Chief Operational Officer of the South Operation—Rumo | | | 1966 | |
Darlan Fábio de David | | | 2014 | | | Chief Operational Officer for North Operations—Rumo | | | 1974 | |
111
The following is a summary of the business experience of our key managers.
Nelson Roseira Gomes Neto. Mr. Gomes Neto is Comgás’ chief executive officer. He holds a bachelor’s degree in engineering from Catholic University (1992), a master’s degree in corporate finance from PUC – IAG Master (1998) and a master’s degree in business administration from COPPEAD (2001). He joined ExxonMobil Corporation in 1991 as a trainee. Throughout the course of his career, he has served in positions of increasing managerial responsibility in several business lines such as Fuels Marketing, Convenience Retailing, Natural Gas, and since 2001 part of Lubricants business. In February 2008, he was appointed Brazil Lubricants Officer to Esso Brasileira de Petroleo Limitada, and in December 2008, he was appointed as Vice President of the Lubricants segment.
Guilherme Machado. Mr. Machado currently serves as chief financial and investor relations officer of Comgás. He has 16 years of professional experience, having previously worked at Esso Brasileira de Petróleo, at Cosan S.A. and at Rumo S.A. Mr. Machadoholds a bachelor’s degree in Production Engineering from the Federal Fluminense University in Rio de Janeiro and a master’s degree in Economics and Business Finance from FGV/RJ.
Rafael Bergman. Mr. Bergman is the operational and services officer of Comgás. He holds a business administration degree in Economics from the Pontifical Catholic University of Rio de Janeiro (1998) and a master’s degree in Finance from the London Business School (2004). He joined the Shell Group in 1999 and has held positions of increasing responsibility in Brazil, England and The Netherlands. In 2011, he joined Raízen and in 2016 he joined the Comgás as chief financial officer. In May 2018, he was appointed chief operating officer of Comgás.
Julio Fontana Neto. Mr. Neto is the chief executive officer of Rumo. He was formerly chief executive officer of MRS Logística S.A. with experience in logistics, railroad operations and infrastructure. He holds a bachelor’s degree in mechanical engineering (1978) and in business administration from Mackenzie University (1981) and a master’s degree in administration from IESE Business School – University of Navarra, Spain (2002).
Ricardo Lewin. Mr. Lewin was elected as chief financial officer and investor relations officer of Rumo in 2017. Previously, Mr. Lewin was head of mergers and acquisitions at Cosan S.A. for nine years. He also worked for Votorantim Cimentos, Banco BBV and Banco Itaú. Mr. Lewin holds a bachelor’s degree in engineering from the Polytechnic School of the University of São Paulo and a master’s degree in business administration from the University of California at Berkeley.
Daniel Rockenbach. Mr. Rockenbach joined Rumo in 2011, when he was appointed director of commercial and operational matters. He held this position until July 2013, when he became chief operational officer of north operation of Rumo. Mr. Rockenbach holds a bachelor’s degree in business administration from the Pontificia Catholic University of Rio Grande do Sul as well as a post-graduate degree in marketing from the Federal University of Rio Grande do Sul. During the course of his career, Mr. Rockenbach has worked at companies such as Ambev, ALL (as a corporate manager responsible for the mining, metallurgy and agriculture sectors) and MRS Logística (as an industrialized products manager). Recently, Mr. Rockenbach assumed the position of chief operational officer of the south operation, instead of the north operation.
Darlan Fábio de David. Mr. David holds a bachelor’s degree in electrical engineering from the Federal University of Rio Grande do Sul, an MBA in logistics, operations and services from COPPEAD (the business school of the Federal University of Rio de Janeiro), an MBA in business management from the Dom Cabral Foundation and has completed an executive development program at IMD in Switzerland. He has more than fifteen years of experience in the rail sector, having started as a trainee at ALL in 1998 and worked for six years at MRS Logística. He was also the chief executive officer of Rift Valley Railways and is currently Rumo’s chief operational officer for North Operations.
112
In addition, our Joint Venture with Shell is run by a management team drawn from Cosan S.A. and Shell with a proven track record in sugar, ethanol and fuels. The executive team is composed of:
Luis Henrique Guimarães. Mr. Guimarães became chief executive officer of the Joint Venture on April 1, 2016. He was formerly the chief executive officer of Comgás, and after that the Fuels Operational Officer and responsible for the Joint Venture’s Downstream division, which covers the retail, commercial and aviation businesses. Mr. Guimarães joined Shell in 1987 and worked in several positions in the lubricants and retail businesses in Brazil and abroad (based in London). In 2007, he became Shell’s Chief Marketing Officer for Lubricants in North America, based in Houston.
Guilherme José de Vasconcelos Cerqueira. Mr. Cerqueira is the chief financial officer and officer for investor relations officer of the Joint Venture. Since 1988, Mr. Cerqueira has held several positions within the Shell Group, including management positions at Shell International Ltd., in London, United Kingdom, between 2004 and 2007. At Raízen, he held the position of controller from Raízen’s creation in April 2011 until April 2014, when he became chief financial officer responsible for finance, contracting, procurement and investor relations. Mr. Cerqueira led the team responsible for the issuance of Raízen’s first asset-backed bond (Agriculture Receivable Security) at the end of October 2014 which opened the market for the whole industry: the transaction gathered interest from over 2,000 investors and raised R$675 million. He holds a bachelor’s degree in Mechanical Engineering from the Universidade Federal do Rio de Janeiro. He also holds an MBA from COPPEAD.
João Alberto Fernandez Abreu. Mr. Abreu became Vice-President of Ethanol, Sugar and Bioenergy at Raízen Energia. He holds a bachelor’s degree in production/mechanics engineering from Pontifícia Universidade Católica in Rio de Janeiro and a MBA from Fundação Dom Cabral. He also took extensive courses in business at the University of Pennsylvania. Mr. Abreu worked for 18 years at Shell in England and Argentina, and in positions such as General Manager of Network in Latin America and General Manager of Sales and Operations in Brazil. He was Executive Director and member of the board of directors at Petróleo Sabbá, an affiliate of Raízen which operates in northern Brazil, and is currently a member of the board of directors of Iogen Energy. In 2012, Mr. Abreu became Bioenergy Director and Chief Technology Officer. He was responsible for the increase of 40% at the EBITDA of the department and for the development and implementation of the first integrated cellulosic ethanol plant worldwide, a U.S.$110 million project. In 2014, he became Agroindustrial executive director at Raízen.
Ricardo Dell Aquila Mussa.Mr. Mussa manages logistics, supply and distribution for the Raízen joint venture since January 2017. Mr. Mussa holds a bachelor’s degree in production engineering from the Escola Politécnica da Universidade de São Paulo. He has held various positions in the supply chains of multinationals such as Unilever and Danone, principally in the agricultural commodities purchasing area. He was national logistics manager for Danone in 2007 and manufacturing manager at the principal cosmetics plant of Unilever in Latin America in 2006 and 2007. He was also global director for purchasing of oils and fats at Unilever and responsible for agricultural commodities purchasing in over 25 countries. In 2002, he worked for Unilever USA in Connecticut in the strategic purchasing sector—he also worked in the planning department and was also responsible for the purchasing of chemical products in Latin America. He joined Cosan S.A. in 2007 and was one of the founders of Radar, and was its chief executive officer for five years. In 2014, he took the helm of Cosan S.A.’s lubricants business and more recently became an Executive in Raízen.
José Leonardo Martin de Pontesis the Executive Officer for fuels distribution at Raízen Combustíveis. Prior to holding this position, he was the executive Director for Logistics, responsible for all the fuels operations in Brazil and global ethanol and sugar operations. From 2011 to 2013 he had occupied the B2C and B2B commercial direction. Mr. Pontes holds a bachelor’s degree in Business Administration with an emphasis on Finance by Rio de Janeiro State University and post graduate degrees in Strategy, Negotiation and Leadership from the universities of Cranfield, Harvard and INSEAD, respectively. Mr. Pontes has 18 years of experience in the fuels and energy markets. At the Shell Group, he worked for 13 years in Brazil and Europe in several positions, including positions relating to global fuels pricing strategy, commercial and business development and strategic planning. In 2009, Mr. Pontes led the retail strategy and general management of business development for Latin America.
113
Filipe Affonso Ferreira is the chief executive officer of Moove for Brazil. He holds a degree in Business Administration and professional experience accumulated during an international career. He began his career in finance, covering the areas of strategic planning and business management in large multinational companies such as Alcoa, Mars, Goodyear and Bunge. In the last three companies, he has occupied the position of chief executive officer for Brazil and Latin America and led successful turn-around processes while implementing business growth strategies.
The executive board of the Joint Venture is overseen by the supervisory board. The supervisory board is responsible for appointing members of the executive board and monitors the activities and reports of the executive board. The supervisory board consists of three directors nominated by Cosan S.A. and three directors nominated by Shell. Our chairman, Rubens Ometto Silveira Mello, is the chairman of the supervisory board. Cosan S.A. and Shell have each designated a shareholder representative who is responsible for determining the Joint Venture’s strategic priorities and resolving any deadlock within the supervisory board. Our shareholder representative is Rubens Ometto Silveira Mello.
Our Relationship with our Executive Officers, Directors and Key Managers
Mr. Burkhard Otto Cordes is a member of Cosan S.A.’s, Cosan Logística’s and Cosan Limited’s boards of directors and serves as financial manager in Aguassanta Participações S.A. Mr. Cordes is Mr. Mello’sson-in-law.
There are no arrangements or understandings with any of our shareholders, customers, suppliers or others, pursuant to which any director or member of our senior management has been or will be selected.
Committees of the Board of Directors
Audit Committee
The members of our audit committee are Messrs. José Alexandre Scheinkman (chairman), Mailson Ferreira da Nóbrega, and Richard Steere Aldrich Junior. Our board of directors has determined that José Alexandre Scheinkman (chairman), Mailson Ferreira da Nóbrega, and Richard Steere Aldrich Junior meet the independence requirements of the SEC and the NYSE listing standards. For a discussion of the role of our audit committee, see “—C. Summary of Significant Differences of Corporate Governance Practices—Audit Committee.”
Under ourbye-laws, our board of directors is responsible for establishing the annual aggregate compensation that we pay to the members of our board of directors and our executive officers.
The aggregate amount of compensation paid to all members of the board of directors and its executive officers was R$100.5 million during the fiscal year ended December 31, 2018, R$142.9 million during the fiscal year ended December 31, 2017 and R$161.9 million in the fiscal year ended December 31, 2016. Our compensation strategy aims to reflect best market practice, help us retain our executives and incentivize them to produce superior results.
Our executive officers receive the same benefits generally provided to our employees. Members of our board of directors are not entitled to these benefits.
We currently have no employment agreements with our directors and executive officers providing for benefits upon the termination of employment. Our directors and executive officers who serve for us and Cosan S.A. and Cosan Logística will receive compensation from each of the companies which they serve.
See “—E. Share Ownership—Equity-Based Compensation Plans” for information on the equity-based compensation plans in place at Cosan Limited and Cosan S.A.
| C. | Summary of Significant Differences of Corporate Governance Practices |
The NYSE Corporate Governance Rules provide that we are required to disclose any significant differences on our corporate governance practices from those required to be followed by U.S. companies under NYSE listing standards. We have summarized these significant differences below.
114
We are permitted to follow practice in Bermuda in lieu of the provisions of the NYSE Corporate Governance Rules, except that we will be required to have a qualifying audit committee under Section 303A.06 of the Rules, or avail ourselves of an appropriate exemption. In addition, Section 303A.12(b) provides that our chief executive officer is obligated to promptly notify the NYSE in writing after any of our executive officers becomes aware of any materialnon-compliance with any applicable provisions of the NYSE Corporate Governance Rules.
Majority of Independent Directors
NYSE Rule 303A.01 provides that each U.S. company that is listed on the Exchange must have a majority of independent directors. Bermuda corporate law does not require that we have a majority of independent directors. Under ourby-laws, at least 40% of our directors are required to be independent directors; which requirement increases to 60% following the death or permanent incapacitation of Mr. Rubens Ometto Silveira Mello.
Separate Meetings ofNon-Management Directors
NYSE Rule 303A.03 provides that thenon-management directors of each U.S. company that is listed on the Exchange must meet at regularly scheduled executive sessions without management. We are not required to have such executive sessions for thenon-management directors under Bermuda law.
Nominating and Corporate Governance Committee
NYSE Rule 303A.04 provides that each U.S. company that is listed on the Exchange must have a nominating/corporate governance committee composed entirely of independent directors. We are not required to have such a committee under Bermuda law. We believe that, pursuant to ourbye-laws, the role of a nominating committee is generally performed by our board of directors and that the role of the corporate governance committee is generally performed by either our board of directors or our senior management.
Compensation Committee
NYSE Rule 303A.05 provides that each U.S. company that is listed on the Exchange must have a compensation committee composed entirely of independent directors. We are not required to have such a committee under Bermuda law.
Audit Committee
NYSE Rule 303A.06 and the requirements of Rule10A-3 of the SEC provide that each listed company is required to have an audit committee consisting entirely of independent members that comply with the requirements of Rule10A-3. In addition, the company must have an internal audit function and otherwise fulfill the other requirements of the NYSE rules and Rule10A-3 of the SEC.
While we are not required under Bermuda law to have an audit committee, we have formed a committee that has the following responsibilities:
| | • | | pre-approve services to be provided by our independent auditor; |
| | • | | review auditor independence issues and rotation policy; |
| | • | | supervise the appointment of our independent auditors; |
| | • | | discuss with management and auditors major audit, accounting and internal control issues; |
| | • | | review quarterly financial statements prior to their publication, including the related notes, management’s report and auditor’s opinion; |
| | • | | review our annual report and financial statements; |
| | • | | provide recommendations to the board on the audit committee’s policies and practices; |
115
| | • | | review recommendations given by our independent auditor and internal audits and management’s responses; |
| | • | | provide recommendations on the audit committee’sbye-laws; and |
| | • | | the receipt, retention and treatment of complaints received by the issuer regarding accounting, internal controls or auditing matters. |
For details of the membership of our Audit Committee, see “—A. Directors and Senior Management—Board of Directors—Committees of the Board of Directors—Audit Committee.”
Equity Compensation Plans
NYSE Rule 303A.08 provides that shareholders must be given the opportunity to vote on all equity compensation plans and material revisions thereto, with certain limited exemptions as described in the rule. Under Bermuda law, shareholderpre-approval is not required for the adoption of equity compensation plans nor any material revision thereto.
Corporate Governance Guidelines
NYSE Rule 303A.09 provides that each U.S. listed company must adopt and disclose its corporate governance guidelines. We do not have a similar requirement under Bermuda law. In addition, we have adopted a written policy of trading of securities and disclosure matters.
Code of Business Conduct and Ethics
NYSE Rule 303A.10 provides that each U.S. listed company must adopt and disclose a code of business conduct and ethics for directors, officers and employees and promptly disclose any waivers of the code for directors or executive officers. Although not required under Bermuda law, the Company has adopted a code of business conduct and ethics for directors, officers and employees as provided for in NYSE Rule 303A.10, which has been filed with the SEC.
As of December 31, 2018, we had 11,632 employees. The following table sets forth the number of our total employees for the dates indicated:
| | | | | | | | | | | | |
| | | December 31, 2018 | | | December 31, 2017 | | | December 31, 2016 | |
Industrial | | | 7,900 | | | | 7,868 | | | | 7,709 | |
Administrative | | | 2,255 | | | | 1,928 | | | | 1,853 | |
Port | | | 1,477 | | | | 1,434 | | | | 1,414 | |
| | | | | | | | | | | | |
Total(1) | | | 11,632 | | | | 11,230 | | | | 10,976 | |
| | | | | | | | | | | | |
| (1) | As of December 31, 2018, 2017 and 2016, respectively, 11,163, 10,889 and 10,687 of our employees were based in Brazil and 469, 341 and 289 were based outside of Brazil. |
The increase in the number of our employees from December 31, 2017 to December 31, 2018 was due to new projects and business acquisitions. The increase in the number of our employees from December 31, 2016 to December 31, 2017 was due to process optimization and reorganization of certain structures.
In addition, during the course of 2018, we had an average of 290 temporary employees.
We believe that we have good relations with our employees and the unions that represent them. Collective bargaining agreements to which we are party have eitherone-year ortwo-year terms, are subject to annual renewal and are subject to changes in Brazilian law. We apply the terms of bargaining agreements entered into with the unions equally to unionized andnon-unionized employees.
116
Our total annual payroll was R$2,006.4 million as of December 31, 2018, which includes a provision for vacations, and bonuses, taxes and social contributions.
We offer our employees, including our executive officers, various benefits, which are provided in accordance with the employee’s position in our company. Benefits include medical (including dental) assistance, meal and transport vouchers, life insurance, maternity leave, scholarships and funeral assistance and nursery assistance. All of our employees participate in profit sharing plans developed with the labor unions of which our employees are members, which provide performance-based compensation.
As of December 31, 2018, the following members of the board of directors owned Cosan Limited shares:
| | | | | | | | | | |
Name | | Position Held –
Cosan Limited | | Cosan Limited
Class A – Common
Shares | | | Cosan Limited
Class B – Common
Shares | |
Rubens Ometto Silveira Mello* | | Chairman | | | 19,514,418 | | | | 96,332,044 | |
Other | | Board Members | | | 1,627,858 | | | | – | |
| * | Shares owned directly and indirectly by Mr. Rubens Ometto Silveira Mello include the total shares of the Cosan Limited controlling group, which is notwholly-owned by him. |
Other than as disclosed in the table above, none of the members of our board of directors or our executive officers currently owns or holds class A common shares or class B common shares of our Company.
Equity-Based Compensation Plans
Below is a description of our equity-based compensation plans. See note 23 to our audited consolidated financial statements for additional information.
Cosan Limited
Equity Incentive Plan
We have adopted a Cosan Limited equity incentive plan. We have reserved up to 5% of our issued and outstanding class A common shares as of the granting date for issuance under our equity incentive plan. The plan is intended to attract, retain and motivate our directors, officers and employees, to link compensation to the overall performance of the company in order to promote cooperation among our diverse areas of business and to create an ownership interest in the company with respect to these directors, officers and employees in order align their interests with the interests of our shareholders. No shares or options have been issued or granted in connection with this incentive plan.
Long-Term Retention Plan
We have adopted a long-term retention plan, or the “LTR Plan,” aimed at rewarding and retaining certain high-level executives of strategic importance to the Company who may be granted certain share based awards as may be determined by our board of directors. Participation in the LTR Plan is subject to selection by our Board of Directors. Under the LTR Plan, each beneficiary may receive, subject to the terms and conditions of the LTR Plan, up to 1% each of the total number of issued and outstanding shares of Cosan Limited (the precise amount being granted is at the discretion of the Board of Directors). Beneficiaries may receive the equivalent of the share grant in cash, at the discretion of our Board of Directors. Any grants of shares or cash under the LTR Plan are to be delivered to the beneficiary over the course of a period of up to 10 years. Currently, five key executives are each eligible to receive share grants or cash of up to 1% each of our issued share capital over the course of the next 10 years, in an amount to be defined by our Board of Directors annually.
The executives who participate in the Plan have entered into a Terms of Governance between themselves and the Company which will regulate their rights, privileges, protections and obligations as shareholders of the Company should our chairman, Rubens Ometto Silveira Mello, no longer be with the Company.
117
As of December 31, 2018, an aggregate of 2,053,632 shares have been granted in 2017, in 2018 and in 2019 up to the date hereof to executives participating in the LTR Plan. Concurrently with the abovementioned grants of shares, our Board of Directors granted certain executives an additional payment of U.S.$316,425 in cash. In addition, on September 29, 2017, our board of directors decided to reward executives for their contribution to the performance of the Company by granting them 255,000 share appreciation rights. The rights entitle the executives to a cash payment after five years of service. The amount payable will be determined based on the increase share price between the grant date and the vesting date. The rights must be exercised on vesting date and will expire if not exercised on that date.
Cosan S.A.
At the shareholder’s meeting held on July 29, 2011, the guidelines for the outlining and structuring of the stock option compensation plan for Cosan S.A.’s officers and employees were approved. These guidelines authorize the issuance of shares accounting for up to 5% of Cosan S.A.’s total capital. This stock option plan was established to attract and retain officers and key employees, offering them the opportunity to become shareholders in Cosan S.A. On August 18, 2011, Cosan S.A.’s board of directors approved a total stock option grant of up to 12,000,000 common shares to be issued or treasury shares held by Cosan S.A., corresponding to 2.41% of Cosan S.A.’s share capital at that time. On August 18, 2011, 9,825,000 options related to the shared based compensation were granted.
If a holder of stock options ceases to be an executive officer, manager or eligible employee for any reason (other than redundancy, death, retirement or permanent incapacitation), after partially exercising his or her option to purchase Cosan S.A.’s common shares, the options that have not yet been exercised will be extinguished as of the date that the holder ceases to be an executive officer, manager or eligible employee.
Cosan S.A. stock options held by Cosan S.A.’s executive officers may, at their option, be canceled and converted into awards of Cosan Limited, and, as a result, we will comply with the limit of shares we have reserved for our equity incentive plan. Cosan S.A.’s stock options will be converted based upon a ratio equal to the initial offering price of our common stock, divided by the weighted average stock price of Cosan S.A.’s common stock for a specified period immediately preceding the date of the completion of our initial public offering. The converted securities, if unvested, generally will continue to vest over their original vesting periods.
On May 21, 2013, the board of directors of Cosan S.A. approved the second program of Stock Option Purchase or Subscription of Shares – Calendar Year 2013. As part of this approval, the board of directors of Cosan S.A. determined that the beneficiaries may purchase or subscribe common shares of the Cosan S.A., with grants of up to 1 million shares, which options may be exercised after at least five years from the approval at a price of R$45.22 per share (such price to be adjusted pursuant to the IPCA until the date of the subscription or purchase).
On August 17, 2014, the board of directors of Cosan S.A. approved the third program of Stock Option Purchase or Subscription of Shares – Calendar Year 2014. As part of this approval, the board of directors of Cosan S.A. determined that the beneficiaries may purchase or subscribe common shares of Cosan S.A., with grants of up to 320,000 shares, which options may be exercised after at least five years from the approval at a price of R$39.02 per share (such price to be adjusted pursuant to IPCA index until the date of the subscription or purchase).
On August 31, 2015, a total of 759,000 options to purchase or subscribe common shares of Cosan S.A. were granted following a decision to that effect by the board of directors of Cosan S.A. The weighted average strike price of such outstanding options is R$19.96 per share (such price to be adjusted monthly pursuant to IPCA index until the date of the subscription or purchase). The options may be exercised after at least five years from the approval date.
On April 27, 2017 and July 31, 2017, two new share-based payment plans were approved in the meeting of the subsidiary Cosan S.A., with 274,000 and 298,107 shares, respectively. The eligible executives may be granted ordinary shares or cash, at the choice of Cosan S.A., forno-cash consideration, after five years.
On July 31, 2018, a new share-based payment plan allowing for a total award of up to 210,000 shares of Cosan S.A. was approved. The eligible executives may be granted ordinary shares or cash, at the choice of Cosan S.A., forno-cash consideration, after five years.
118
Cosan Logística
On January 2, 2017, Cosan Logística granted 1,522,220 and 1,513,180 shares, respectively, of the share-based compensation plan. These will be transferred in full and free of charge 5 years from the approval of the grant, in a quantity adjusted by the number proportional to the dividends paid in the period, according to the employment status and incentives met by the relevant beneficiary at Rumo S.A. under the terms of each share-granting program. Given the characteristics of the Plan, the fair value of the share on the grant date is R$6.10.
On September 1, 2017, Cosan Logística granted 870,900 shares of the share-based compensation plan, which will be transferred in full and free of charge 5 years from the approval of the grant, in a quantity adjusted by the number proportional to the dividends paid in the period, according to the employment status and incentives met by the relevant beneficiary at Rumo S.A., under the terms of each share-granting program. Given the characteristics of the plan, the fair value on the grant date is R$10.42.
On August 1, 2018, a new share-based payment plan allowing for a total award of up to 1,149,544 shares of Rumo S.A. was approved. The eligible executives may be granted ordinary shares or cash, at the choice of Rumo S.A., forno-cash consideration, after five years.
Comgás
On April 20, 2017 and December 8, 2017, two new share-based compensation models were approved in the Shareholders’ Meeting of the Comgás subsidiary, which became effective as of the grant.
On April 20, 2017 and August 12, 2017, Comgás granted 61,300 and 97,780 restricted shares, respectively, which will be fully transferred five years from the approval of the grant, conditioned on the exercise of the functions of the Company beneficiary, under the terms of each share-granting program.
On August 1, 2018, Comgás awarded 96,787 restricted shares to certain eligible executives, which will be fully transferred five years from the approval of the grant. The final transfer of the restricted shares to the executives is subject to the terms of the applicable share-grant program.
The Black and Scholes methodology was used to calculate the fair value of the shares granted under the terms of the stock-based compensation plan. Given the characteristics of the plan, the value of the share on the grant date was R$36.37.
| Item 7. | Major Shareholders and Related Party Transactions |
Cosan Limited
As of the date of this annual report, our authorized share capital is U.S.$11,888,863.60, consisting of 1,000,000,000 class A common shares, par value U.S.$0.01 per share and 188,886,360 class B series 1 common shares, par value U.S.$0.01 per share. Of these, 148,343,668 class A common shares were issued and outstanding and 96,332,044 class B series 1 common shares were issued and outstanding as of December 31, 2018. As a result of the tender offer completed on January 3, 2019, we had 134,115,534 issued and outstanding Class A common shares as of the date of this annual report. Each of our class A common shares entitles its holder to one vote. Each of our class B common shares entitles its holder to 10 votes. The chairman of our board of directors, Mr. Rubens Ometto Silveira Mello controls 42.8% of our issued and outstanding share capital, and 86.39% of our voting power by virtue of his control of 100% of. our class B series 1 common shares and 11.19% of our class A common shares. No class B series 2 common shares are currently issued and outstanding. Other than the entities and individuals mentioned below, no other single shareholder holds more than 5.0% of our issued and outstanding share capital.
On December 22, 2017, we acquired 22,025,248 Class A common shares pursuant to a tender offer at a purchase price of U.S.$9.65 per share, for a total cost of approximately U.S.$212.5 million, excluding fees and other related expenses. These shares represented 13.04% of the issued and outstanding Class A common stock of Cosan Limited as of December 21, 2017. The shares accepted for purchase included 1,299,859 additional shares that Cosan Limited elected to purchase pursuant to its right to purchase up to an additional 2% of its outstanding Class A common shares. After giving effect to the purchase, we had 146,867,137 outstanding Class A common shares remaining.
119
On January 3, 2019, we acquired 14,228,134 Class A common shares pursuant to a tender offer at a purchase price of U.S.$8.88 per share, for a total cost of approximately U.S.$126.3 million, excluding fees and other related expenses. These shares represented 9.6% of the issued and outstanding Class A common stock of Cosan as of December 31, 2018. The shares accepted for purchase included 2,966,873 additional shares that Cosan elected to purchase pursuant to its right to purchase up to an additional 2% of its outstanding Class A common shares. After giving effect to the purchase, we had 134,115,534 outstanding Class A common shares remaining.
On April 24, 2019, we announced the cancellation of 32,239,807 Class A common shares held in treasury, representing 11.91% of Cosan Limited’s capital stock. After giving effect to the cancellation, we had 142,115,534 total Class A common shares remaining.
The following table sets forth the principal holders of our issued and outstanding share capital and their respective shareholding as of the date of this annual report:
| | | | | | | | | | | | | | | | | | | | | | | | |
| | | Class A
common
shares | | | % | | | Class B
common
shares | | | % | | | Total Number
of Shares | | | % | |
Shareholders | | | | | | | | | | | | | | | | | | | | | | | | |
Controlling group | | | 19,514,418 | | | | 11.19% | | | | 96,332,044 | | | | 100.00% | | | | 115,846,462 | | | | 42.80% | |
Renaissance Technologies LLC | | | 1,549,696 | | | | 0.89% | | | | — | | | | — | | | | 1,549,696 | | | | 0.57% | |
M&G Investment Management Limited | | | 3,222,113 | | | | 1.85% | | | | — | | | | — | | | | 3,222,113 | | | | 1.19% | |
Eastspring Investments (Singapore) Limited | | | 3,805,730 | | | | 2.18% | | | | — | | | | — | | | | 3,805,730 | | | | 1.41% | |
Other | | | 106,023,577 | | | | 60.81% | | | | — | | | | — | | | | 106,023,577 | | | | 39.17% | |
Total shares outstanding | | | 134,115,534 | | | | 94.37% | | | | 96,332,044 | | | | 100.00% | | | | 230,447,578 | | | | 96.65% | |
Treasury shares | | | 8,000,000 | | | | 5.63% | | | | — | | | | — | | | | 8,000,000 | | | | 3.35% | |
Total | | | 142,115,534 | | | | 100.00% | | | | 96,332,044 | | | | 100.00% | | | | 238,447,578 | | | | 100.00% | |
Controlling Group: Queluz Holdings Limited, Usina Costa Pinto S.A., MSOR Participações S.A. and Usina Bom Jesus S.A. Açúcar e Álcool
On November 24, 2009, a corporate reorganization was approved within companies from our controlling group (Aguassanta Participações S.A., Queluz Holdings Limited, or “Queluz,” and Usina Bom Jesus S.A. Açúcar e Álcool), intended to consolidate their control with Mr. Rubens Ometto Silveira Mello.
This reorganization resulted in the transference by an affiliate of Queluz of up to approximately 5,500,000 class A common shares issued by Cosan Limited that did not exceed 1% of total Class A shares, pursuant to Securities Act Rule 144 and other applicable provisions. Its class B share position remained unaltered.
Queluz Holdings Limited and Costa Pinto own all of our class B series 1 common shares. Queluz Holdings Limited, MSOR Participações S.A. and Usina Bom Jesus S.A. Açúcar e Álcool also hold in aggregate 8.32% of our class A common shares. These companies are indirectly controlled by Mr. Rubens Ometto Silveira Mello, the chairman of our board of directors through several companies controlled directly and indirectly by him. Although the control is exercised by Mr. Rubens Ometto Silveira Mello, there are some family members and other individuals who are also beneficial owners of minority interests in these companies.
Voting Rights of Principal Shareholders
Our principal shareholders do not have voting rights distinct from those of our other shareholders of the same class of shares. See “Item 10. Additional Information—B. Memorandum andBy-laws.”
Cosan S.A.
As of December 31, 2017, we owned 58.21% of Cosan S.A.’s common shares. Prior to our initial public offering, Usina Costa Pinto S.A. Açúcar e Álcool and Aguassanta Participações S.A., each company indirectly controlled by our Chairman, Mr. Rubens Ometto Silveira Mello and his family, were the controlling shareholders of Cosan.
120
Rezende Barbosa
On June 18, 2009, Cosan S.A. entered into an agreement with Rezende Barbosa to acquire 100% of the outstanding shares of Curupay S.A. Participações, or “Curupay.” The acquisition was carried out through the merger of Curupay into Cosan S.A., resulting in the issuance by Cosan S.A. of 44,300,389 new common shares, fully subscribed andpaid-in by Rezende Barbosa.
Pursuant to an agreement dated June 18, 2009, as amended on October 7, 2016 and August 28, 2017, the Rezende Barbosa Family has the right to have one member on the supervisory board of Cosan S.A. and one member on our board of directors. Cosan Limited has, subject to limited exceptions, a right of first refusal on shares of Cosan S.A. (CSAN3) owned by the Rezende Barbosa family.
Cosan Logística
On February 8, 1999, São Francisco and Tate & Lyle do Brasil Serviços e Participações S.A., or “Tate & Lyle,” entered into a shareholders’ agreement that governs the rights of the shareholders of Cosan Portuária (formerly São Francisco Operadora Portuária de Granéis Ltda.). In April 2004, Cosan S.A. acquired 90.0% of the outstanding capital stock of Cosan Portúaria through a Cosan S.A. capital increase in the amount of U.S.$1.5 million, which was fully subscribed by Cosan S.A.’s shareholder, São Francisco, using shares that it held at Cosan Portuária.
Cosan S.A. has signed a memorandum of understanding dated April 9, 2008 with Rezende Barbosa with the intention of merging into a new entity the port terminal facilities of Cosan Portuária with those at the neighboring site of Teaçu Armazéns Gerais S.A., owned by Rezende, or the “merged entity.” Cosan S.A. asked Tate & Lyle to provide its approval as the minority shareholder in Cosan Portuária to the arrangements. Tate & Lyle’s and Cosan S.A.’s equity interests in the merged entity would be held by a holding company owned by Cosan S.A. and Tate & Lyle. Because of the creation of the holding company, Cosan S.A. and Tate & Lyle entered into a shareholders’ agreement with respect to the holding company, named Copsapar Participações S.A., in order to govern: (1) the election of the board of directors; (2) the exercise of voting rights in general shareholder meetings and meetings of the board of directors; and (3) the preemptive rights of shareholders.
On April 13, 2010, Tate & Lyle, through a Share Purchase Agreement, sold its entire stake on Copsapar Participações S.A. to Bunge Açúcar e Bioenergia Ltda., that had, on the same date, agreed to replace Tate & Lyle on the shareholder agreement with respect to Copsapar Participações S.A.
Rumo
On February 24, 2014, Cosan S.A., through its subsidiary Rumo Logística, submitted to ALL a binding proposal for the incorporation of ALL by Rumo. The merger was completed on April 1, 2015. See Item 4. Information on the Company—A. History and Development of the Company” for further information.
Radar
In August 2008, as amended on November 4, 2016, Cosan S.A. entered into a shareholders’ agreement with TIAA-CREF regarding its subsidiary Radar, whose corporate purpose is to identify and acquire rural properties with high appreciation potential for subsequent leasing and/or sale. Cosan S.A. currently holds approximately 3% of Radar’s capital, with the remaining 97% being divided among other investors part of TIAA-CREF group. According to the shareholders’ agreement, Cosan S.A. retains the majority of votes on Radar’s Board of Directors, although it is not consolidated due to certain restriction on Cosan S.A.’s decision-making power.
Tellus
On July 1, 2011 Cosan S.A. entered into a shareholders’ agreement with TIAA-CREF in order to govern certain of their rights, duties and obligations as shareholders of Tellus Brasil Participações S.A.
121
Janus
On August 19, 2014 Cosan S.A. entered into a shareholders’ agreement with TIAA-CREF in order to govern certain of their rights, duties and obligations as shareholders of Janus Brasil Participações S.A.
Comma
On July, 3, 2012 Cosan S.A. entered into the European lubricants and specialties market by signing a sale and purchase agreement with Esso Petroleum Company to acquire Comma Oil & Chemicals Limited. The value of the transaction, after all adjustments, was less than U.S.$100 million. Comma continued to operate in the ordinary course under the Comma brand, manufacturing and selling Comma-branded and private label products following the change in control, in order to facilitate Cosan S.A.’s entry into the European lubricants market.
Comgás
On November, 5, 2012 Cosan S.A. concluded the acquisition of 60.05% of Comgás from BG Group for R$3.4 billion.
In December 2012, the put options held by three vehicles of the Shell Group against Cosan Limited were exercised. As a result, the Company delivered to Shell 17,187,937 common shares issued by Cosan S.A., representing 4.21% of its capital, and received 21,805,645 common shares of Comgás. These were transferred to Cosan S.A., under the same price and payment term conditions of the transaction with Shell. At the conclusion of this transaction, the Company reduced its interest in Cosan S.A. to 57.98% and Cosan S.A. increased its interest in Comgás to 79.87%, with Shell no longer being a shareholder of Comgás.
At the end of this transaction, Cosan S.A. and Integral Investments B.V. terminated the Comgás shareholders’ agreement dated December 19, 2012.
Shareholders’ Agreements and Other Arrangements
Agreements Between Shell and Cosan S.A.
Shell and Cosan S.A. have entered into other definitive agreements, among others, concerning the scope of the Joint Venture, the governance and management of the Joint Venture and the granting of reciprocal put and call options concerning their interests in the Joint Venture. Each of these agreements was entered into on June 1, 2011.
The shareholders’ agreements for Raízen Energia and Raízen Combustíveis establish the scope and governance of the Joint Venture, as well as its dividend policy. The agreements provide that the scope of the Joint Venture is the global production of sugar cane-based ethanol and sugar and the distribution, commercialization and sale of fuel products within Brazil. Cosan S.A., Shell and their respective affiliates are prohibited from competing with the Joint Venture as long as they remain shareholders of the Joint Venture (subject to customary exceptions).
The shareholders’ agreements provide that the Joint Venture will be governed by supervisory boards that are composed of six members: three nominated by Cosan S.A., with Mr. Rubens Ometto Silveira Mello acting as chairman, and three nominated by Shell. Most decisions by the supervisory boards require a quorum of two members and are generally made by a majority present and voting. Certain significant matters, however, will require the consent of five of the six or four of the six members, as the case may be.
The matters which require the consent of five of the six or four of the six members include but are not limited to the following:
| | • | | setting the general strategic guidelines and direction for the Joint Venture and amending and updating the Joint Venture’s business plan; |
| | • | | appointing, removing or terminating members of the executive board; |
| | • | | determining the compensation and benefits of certain employees; |
| | • | | amending key policies and procedures of the Joint Venture; |
| | • | | adopting or amending the annual and capital budgets; |
| | • | | instituting or settling any litigation or dispute in excess of a specified sum or which could damage the reputation of the Joint Venture, Cosan S.A. or Shell; |
122
| | • | | selling, assigning, transferring or encumbering assets of the Joint Venture outside of the ordinary course of business in excess of a specified amount; |
| | • | | entering into transactions (including mergers, stock purchases or asset purchases) of which the value or purchase price exceeds a specified amount; |
| | • | | making capital expenditures in excess of a specified amount, subject to certain exceptions; |
| | • | | submitting any matters, including financial statements and reports, to the meeting of the Joint Venture’s shareholders; |
| | • | | entering into any contract, agreement or instrument outside of the ordinary course of business and that provides for payments in excess of a specified amount; |
| | • | | entering into material amendments, modifications or waivers or terminating any contract where payment obligations exceed a specified amount; |
| | • | | making any decision to borrow money or guarantee the payment or performance of any obligation in excess of a specified amount or to prepay indebtedness of a specified amount; |
| | • | | creating any encumbrance over or the issuance of any Joint Venture securities or any option relating to any Joint Venture securities, subject to certain exceptions; |
| | • | | approving the credit limits or the extension of credit to any customer of the Joint Venture in excess of a specified amount; and |
| | • | | entering into, amending, terminating or renewing any insurance policy. |
If the supervisory boards cannot reach a decision with respect to a matter that is their responsibility, one representative of Cosan S.A. and one representative of Shell will meet to attempt to resolve the matter. Any decision by these shareholder representatives must be unanimous. If the shareholder representatives cannot reach a joint decision, no decision would be taken or effected and the status quo would prevail.
Additionally, certain matters require the consent of the shareholders of the Joint Venture. These matters include, but are not limited to, removal of any member of a supervisory board; approval of supervisory board resolutions relating to dividend payments; approval of management accounts and financial statements; amendments to thebye-laws of Raízen Energia or Raízen Combustíveis; and issuance of securities by the Joint Venture.
The shareholders’ agreements provide that a shareholder may lose certain governance rights if it fails to make capital contributions that may be required pursuant to the shareholders’ agreements or to make certain payments required pursuant to the Framework Agreement. If the delinquent party pays or contributes such amounts in full within a specified cure period, the respective governance rights of the shareholders are returned to their original state prior to any such delinquency.
Theday-to-day management of the Joint Venture is conducted by the executive boards, composed of a chief executive officer and other senior executive officers. The shareholders’ agreements set forth the various functions and responsibilities of the chief executive officer and senior management, as well as the actions that may be taken by the executives without the approval of the relevant supervisory board.
In November 2016, Cosan S.A. and Shell executed amendments to certain agreements between them to remove the fixed date call options over Raízen Energia and Raízen Combustíveis shares exercisable in 2021 and 2026, and replace them with certain call and put options exercisable by Shell or Cosan S.A. upon the occurrence of certain events including, among others: (i) fundamental breaches of the obligations provided for in the agreements governing the Joint Venture; (ii) breach of anticorruption laws, (iii) insolvency or bankruptcy of a party, (iv) change of control, and (v) in the event of the death or disability of Cosan S.A.’s current Chairman, Mr. Rubens Ometto Silveira Mello. Moreover, Cosan S.A. and Shell agreed to renew the existinglock-up period for five years from the date of the execution of the amendment, following which the parties may sell their shares in each of Raízen Energia and Raízen Combustíveis subject to compliance with certain preemption rights in each other’s favor.
123
Comgás Companhia de Gás de São Paulo—Shareholders’ Agreement
Cosan S.A. and Integral Investments B.V., or Integral, were parties to a Comgás shareholders’ agreement dated December 19, 2012. The shareholders’ agreement established the terms and conditions that regulated the relationship between the parties as shareholders’ of Comgás. On December 12, 2017, we exercised a put option with Shell relating to shares in Comgás and bought a total of 21,805,645 shares in Comgás, which represents 16.77% of Comgás’s share capital for R$1,042 million. As a result, Integral Investments B.V. ceased to be a shareholder of Comgás and the Comgás shareholders’ agreement was terminated.
Cosan Limited – Shareholders’ Agreement
Aguassanta and Costa Pinto, our indirect controlling shareholders, entered into a shareholders’ agreement dated June 15, 2007, pursuant to which they undertake to vote jointly with respect to any matter related to us and our subsidiaries. Aguassanta and Costa Pinto have agreed to meet before any shareholders’ or board of directors meeting to reach an agreement as to their votes regarding such matters. The vote of the indirect shareholder that owns a greater equity stake in our Company shall prevail.
Radar Propriedades Agrícolas S.A. – Shareholders’ Agreement
Mansilla Participações Ltda., Teachers Insurance and Annuity Association of America, Cosan S.A. and Radar II Propriedades Agrícolas entered into this shareholders’ agreement on August 27, 2008, amended on November 4, 2016. This shareholders’ agreement consolidates Radar’s shareholders resolutions about share control, transfer of shares, preemption rights, tag along and the right to appoint the members of the board of directors. Subject to certain exceptions, the corporate resolutions shall be taken by shareholders representing the majority of the voting shares.
Radar II Propriedades Agrícolas S.A.—Shareholders Agreement
The shareholders’ agreement of Radar II Propriedades Agrícolas S.A. was executed by and among Mansilla Participações Ltda., Teachers Insurance and Annuity Association of America, a New York Corporation and Cosan S.A. on September 28, 2012, amended on November 4, 2016. This Shareholders Agreement consolidates Radar II’s shareholders resolutions about share control, transfer of shares, preemption rights, tag along and the right to appoint the members of the Board of Directors. Except by the relevant decisions, the corporate resolutions shall be taken by the shareholders representing the majority of the voting shares.
Cosan S.A. – Shareholders’ Agreement
The shareholders’ agreement of Cosan S.A. was executed by and among Cosan Limited and Rezende Barbosa S.A. Administração e Participações, on September 06, 2009, partially succeeded by Messrs. Roberto de Rezende Barbosa, Renato Eugênio de Rezende Barbosa, and José Eugenio de Rezende Barbosa Sobrinho, on December 31, 2011, amended on October 7, 2016 and on August 28, 2017. This shareholders agreement consolidates the resolutions of Cosan S.A.s shareholders about the appointment of the members of the Board of Directors and the transfer of shares. The shareholders also agreed to exercise their voting rights in the general meetings of the company without the possibility of veto rights.
Rumo S.A.—Shareholders’ Agreement
Cosan Logística S.A. and Mrs. Julia Dora Antonia Koranyi Arduini entered into the Arduini Shareholders’ Agreement on November 28, 2016. The Arduini Shareholders’ Agreement defines the terms and conditions that govern the relationship between the parties to the agreement, in particular with respect to: (1) the election of members of our board of directors; (2) the restrictions on the sale and transfer of our shares; and (3) voting arrangements for our shareholders, general meeting and board of directors meeting. The Arduini Shareholders’ Agreement will remain in force for 10 years from November 28, 2016 and may be terminated early if Mr. Rubens Mello leaves the position of chairman of our board of directors or if Julia Arduini’s interest in our company decreases by 50% after the three-yearlock-up period on the transfer of shares to which the parties are subject. In addition, the Arduini Shareholders’ Agreement states that our shareholders and board of directors’ meetings will be preceded by preliminary meetings between the parties to the Arduini Shareholders’ Agreement, which shall determine the voting instructions for their representatives at those meetings, who shall vote together as a block.
124
Tellus Brasil Participações S.A. – Shareholders’ Agreement
Shareholders Agreement of Tellus Brasil Participações S.A., executed by and among TIAA-CREF Global Agriculture LLC, Nova Gaia Brasil Participações Ltda., Terraviva Brasil Participações S.A., Radar Propriedades Agrícolas S.A., and Cosan S.A. on July 1, 2011. This Shareholders Agreement consolidates Tellus’ shareholder resolutions about share control, transfer of shares, preemption rights, tag along and right to appoint the members of the Board of Directors. Except by the relevant decisions, the corporate resolutions shall be taken by shareholders representing the majority of the voting shares.
Janus Brasil Participações S.A. – Shareholders’ Agreement
Shareholders Agreement of Janus Brasil Participações S.A., executed by and among TIAA-CREF Global Agriculture LLC, Helios Brasil Participações Ltda., Iris Brasil Participações S.A., Radar Propriedades Agrícolas S.A. and Cosan S.A. on September 23, 2014. This Shareholders Agreement consolidates Janus’ shareholder resolutions about share control, transfer of shares, preemption rights, tag along and the right to appoint the members of the Board of Directors. Except by the relevant decisions, the corporate resolutions shall be taken by shareholders representing the majority of the voting shares.
Cosan Biomassa S.A. – Shareholders’ Agreement
The shareholders’ agreement of Cosan Biomassa S.A., or “Cosan Biomassa,” was entered into by and among Cosan S.A. and Sumitomo Corporation on May 13, 2016, or the “Cosan Biomassa Shareholders’ Agreement.” This shareholders’ agreement provides Cosan Biomassa with shareholder control and contains transfer of shares, preemption rights, tag along and drag along rights and the right to appoint the members of the board of directors. The shareholders’ agreement also lists certain reserved matters with regard to which the parties shall have the right of veto so as long as each signatory’s equity interest in Cosan Biomassa is equal to or greater than 15% of the total and voting share capital of Cosan S.A.
Brado Logística e Participações S.A. – Shareholders’ Agreement
The shareholders’ agreement of Brado Logística e Participações S.A., or “Brado,” was entered into by and among Fundo de Investimento do Fundo de Garantia do Tempo deServiço-FI-FGTS, or“FI-FGTS,” Logística Brasil-Fundo de Investimento em Participações, Deminvest Empreendimentos e Participações S.A., Markinvest Gestão de Participações Ltda., or the “Original Shareholders,” and Brado Holdings S.A., with the intervention of Brado Logística Participações S.A., Brado Logística S.A. andALL- América Latina Logística S.A. (current Rumo S.A.) on August 5, 2013. This shareholders’ agreement resolutions about share control, transfer of shares, preemption rights, tag along and the right to appoint the members of the board of directors. The shareholders’ agreement also provides that certain reserved matters are subject to a right of veto on the part of the signatories.
Cosan Investimentos e Participações S.A.—Shareholders Agreement
The shareholders’ agreement of Cosan Investimentos e Participações S.A., or “CIP,” was executed by and among Cosan S.A., Banco Bradesco BBI S.A. (as successor to Fundo de Investimento em Participações Multisetorial Plus II), or “Bradesco,” and Itaú Unibanco S.A. (as successor to Razac Fundo de Investimento em Participações), or “Itaú,” on June 27, 2014. This shareholders’ agreement CIP’s shareholders resolutions about share control, transfer of shares or encumbrance and the right to appoint the members of the board of directors and the officers (with all officers to be nominated by Cosan S.A.). With the exception of the relevant decisions, the corporate resolutions shall be taken by shareholders representing the majority of the voting shares (unless a higher quorum or special approval is required).
The parties to the shareholders’ agreement have granted each other the following put and call options: (i) call option granted to Cosan S.A. by Bradesco on all Class “A” Preferred Shares; (ii) call option granted to Cosan S.A. by Itaú on all Class “B” Preferred Shares; (iii) put option granted to Bradesco by Cosan S.A. on all Class “A” Preferred Shares; and (iv) put option granted to Itaú by Cosan S.A. on all Class “B” Preferred Shares.
125
| B. | Related Party Transactions |
We engage in related party transactions with certain of our affiliates, some of which are of a recurring nature. Financial information with respect to certain material related party transactions is set forth in note 5.4 to our consolidated financial statements attached hereto.
Our board of directors delegates to the audit committee the responsibility for reviewing and approving all related party transactions (within the meaning of Item 404 of RegulationS-K of the SEC). The audit committee is responsible for obtaining information from our directors, executive officers and major shareholders with respect to related party transactions and for then determining, based on the facts and circumstances, whether our company or a related party has a direct or indirect material interest in the transaction. As required under SEC rules, transactions that are determined to be directly or indirectly material to our company or a related party has been disclosed herein.
In October 2008, a private placement of the Company’s class A shares was made in the amount of R$96 million (U.S.$50 million) by the controlling shareholder, Mr. Rubens Ometto Silveira Mello, and R$288.1 (U.S.$150 million) by the funds managed by Gávea Investimentos Ltda., at R$8.6 (U.S.$4.50) per class A share or BDR subscribed. The offering was extended to all class A share or BDR holders, as permitted by applicable law. The offering was concluded on October 27, 2008. As a result of this transaction and other securities transaction undertaken since then, as of the date of this annual report, Mr. Rubens Ometto Silveira Mello holds 38.3% of the Company’s total capital and 85.3% of its voting capital.
In the normal course of business, we have operational and financing transactions with related parties. The significant related party balances and transactions are described in note 5.4 to our financial statements included elsewhere in this annual report.
Guarantees with Related Parties
As a result of Cosan S.A.’s participation in the PESA federal government financing program between 1998 and 2000, Amaralina mortgaged land to secure the restructuring of Cosan S.A.’s debt, and Agrícola Ponte Alta and Pedro Ometto S.A. mortgaged land to secure the restructuring of the debt of Da Barra.
| C. | Interests of Experts and Counsel |
Not applicable.
| Item 8. | Financial Information |
| A. | Consolidated Statements and Other Financial Information |
See “Item 18. Financial Statements.”
Legal Proceedings
We are party to numerous legal proceedings, the most relevant of which are further described below.
Probable Losses
In the ordinary course of our business, we are party to a number of legal proceedings for which we deem the risk of loss as probable for which we have recorded provisions in an aggregate amount of R$1,363.2 million as of December 31, 2018 and R$1,348.2 million as of December 31, 2017. Provisions relating to probable losses are categorized into tax, civil, environmental, regulatory, and labor, as described below.
126
Tax. We recorded provisions of R$534.1 million and R$501.2 million for tax proceedings involving probable risk of loss as of December 31, 2018 and December 31, 2017, respectively. The principal tax proceedings for which the risk of loss is probable are described below:
| | • | | FINSOCIAL – Offset requests.The Brazilian federal tax authorities refused to ratify requests made by CLE toset-off undue payments of FINSOCIAL, a social tax levy, against other tax debts.Based on a favorable judicial decision, Mobil acquired the right toset-off FINSOCIAL tax payments against certain COFINS payments. However, a subsequent favorable judicial decision granted CLE immunity against the enforcement of such COFINS-related debts. Therefore, previousset-off requests were extinguished, since the COFINS debts ceased to exist, and CLE sought to reuse the relevant tax credits toset-off other tax debts. However, the Brazilian federal tax authorities refused to ratify part of theset-offs, claiming that the COFINS immunity applied only to the fiscal year during which the lawsuit was filed (i.e., in 1992). No judicial deposits were made for these proceedings. The provision for this proceedings was R$287 million as of December 31, 2018 and R$280.2 million as of December 31, 2017. The risk of loss is classified as probable. |
| | • | | Social Security Contributions – In June 2010, Raízen Energia filed an ordinary action challenging the obligation to accrue the social security contributions tax based on gross revenue. Currently, the case records are in the Court of Appeals awaiting judgment of the appeal filed by the Brazilian federal government against a favorable first level decision. The risk of loss is classified as probable and as of December 31, 2018, Cosan had recorded provisions in connection with this proceeding in the aggregate amount of R$56 million and Raízen had recorded provisions in connection with this proceeding in the aggregate amount of R$327.5 million, and had judicially deposited the same amount (the two together therefore cancel each other out). The alleged underlying facts occurred both before and after the formation of the Raízen joint venture on April 1, 2011 and, therefore, these amounts are subject to reimbursement by Raízen’s shareholders for a portion of any loss in the event of an adverse decision. |
| | • | | ICMS - We have provisioned amounts relating to tax assessments issued against us by the tax authorities related to several types of ICMS credits, including: (a) an assessment notice related to ICMS payments for raw material purchases which are considered for “use and consumption” and therefore, according to the tax authorities, are not eligible for compensation; (b) an assessment, as sole obligor, for allegedly disregarding withholding obligations of ICMS taxes in relation to a tolling agreement, arising from an agricultural partnership between the Company’s sugarcane plants and Central Paulista Ltda. Açúcar e Álcool.; (c) an assessment notice related to ICMS payments related to the exportation of crystallized sugar not considered under tributary immunity; (d) assessment notice related to the ICMS under tributary substitution regime; and (e) ICMS assessment notice related to interstate operations taxed as internal transactions. No judicial deposits have been made in connection with these proceedings. These provisions amounted to R$72.9 million as of December 31, 2018 and R$99.4 million as of December 31, 2017. |
Civil, regulatory, environmental and other claims. We, our subsidiaries and jointly-controlled entities are parties to a several number of civil legal claims related to (1) indemnity for material and moral damages; (2) termination or litigation of in relation to different kinds of agreements (3) public civil claims related to sugarcane stubble burning; (4) environmental matters; and (5) compliance with certain conduct adjustment agreement and other matters. Provisions for civil, regulatory and environmental claims as of December 31, 2018 amounted to R$362.7 million and R$375.6 million as of December 31, 2017. As of December 31, 2018, R$199.5 million in judicial deposits were made for civil and environmental claims, and this figure was R$196 million as of December 31, 2017. Cosan S.A., its subsidiaries and jointly-controlled entities are also parties to a number of regulatory legal proceedings related to (1) collection of fines by the ANTT; (2) discussions on the tariff ceiling imposed by the ANTT; and (3) certain other matters.
Labor claims. We, our subsidiaries and jointly-controlled entities are also parties to a number of labor claims filed by former employees and service providers challenging, among other matters, the payment of overtime, night shift premiums and risk premiums, the recognition of employment relationships and the reimbursement of discounts from payroll, such as social contribution and trade union charges. Additionally, we are involved in several labor administrative and judicial proceedings such as labor investigations and class actions filed by the labor prosecutor’s office regarding allegednon-compliance with certain labor regulations, including work and safety rules, labor conditions and work environment, and social assistance plans. Moreover, we entered into certain consent orders (Termos de Ajustamento de Conduta) with Brazilian authorities and in the event we fail to comply with such consent orders, we could be subject to fines. Provisions for labor claims as of December 31, 2018 amounted to R$466.3 million and R$471.3 million as of December 31, 2017.
127
Possible Losses
In addition, there are currently certain legal proceedings pending in which we are involved for which we have not recorded provisions, as we deem the likelihood of loss as possible. If adverse decisions are rendered against us in any of these legal proceedings, our results of operations or financial condition could be materially and adversely affected. The aggregate amount involved in proceedings for which our risk of loss has been deemed possible as of December 31, 2018 totaled R$16,895.1 million, of which R$11,485.9 million, R$3,258.1 million, R$990.9 million, R$699.3 million and R$460.9 million were related to tax, civil, labor and regulatory and environmental claims, respectively. The principal proceedings for which we deem the risk of loss as possible are described below:
| | • | | Withholding Income Tax – capital gain ExxonMobil. The Brazilian federal tax authorities issued a tax assessment against CLE, as the responsible party for the collection of withholding income tax allegedly due on the capital gains earned by ExxonMobil International Holdings B.V. and ExxonMobil Brasil Holdings B.V., companies incorporated outside of Brazil, in connection with the sale of cooperatives headquartered in the Netherlands. According to the Brazilian tax authorities, the real intention of CLE was to acquire Esso Brasileira de Petróleo Ltda. The updated amount under discussion in these proceedings is R$1.1 billion, including interest and a 150% penalty, of which R$853.6 million is classified as a possible risk of loss as of December 31, 2018 and R$823.9 million as of December 31, 2017. Currently, CLE is awaiting judgment of the motion for clarification regarding the decision that in part permitted the special appeal filed in the Superior Chamber of Tax Appeals. |
| | • | | Goodwill on the acquisition of Esso. The Brazilian federal tax authorities issued three tax assessments against CLE for the collection of corporate income taxes relating to 2009, 2010 and 2011 due to the write off of goodwill expenses accrued in connection with the acquisition of cooperatives which controlled Esso Brasileira de Petróleo Ltda. According to CLE, the updated amount under discussion is of R$609.3 million, including interest and a 150% fine, of which R$435.9 million is classified as a possible risk of loss and R$173.4 million is classified as a remote risk of loss in the fiscal year ended December 31, 2018. Currently, Cosan is awaiting a decision on the motion for clarification filed against the partially favorable decision rendered by the Administrative Court of Tax Appeals. In addition, on December 14, 2017, CLE received a tax assessment notice, relating to 2012, due to the write off of goodwill expenses accrued in connection with the acquisition of cooperatives which controlled Esso Brasileira de Petróleo Ltda. According to CLE, the updated amount under discussion is R$185.2 million, including interest and a 150% fine, of which R$144.9 million is classified as a possible risk of loss and R$40.2 million is classified as a remote risk of loss as of December 31, 2018. CLE is awaiting judgment of the administrative court. In addition, CLE has received a tax assessment notice relating to 2013 in connection with the write off of goodwill expenses accrued in relation to the acquisition of cooperatives which controlled Esso Brasileira de Petróleo Ltda. According to CLE, the updated amount under discussion is R$153.9 million as of December 31, 2018. The risk of loss is classified as possible. CLE is awaiting judgment of the administrative court. |
| | • | | ICMS – inventory differences.The tax authority of the state of São Paulo issued two tax assessment notices, one against Raízen Energia and one against Cosan S.A., in February, 2012 relating to ICMS taxes on inventory differences. A decision rendered by the First Administrative Trial Court was partially favorable with respect to one of these tax assessments, which is currently pending a decision by the second administrative trial court. In relation to the other tax assessment, the first and second administrative trial court’s decisions were unfavorable and a decision on the appeals filed is currently pending. The total amount involved in such proceedings is R$1.3 billion. The risk of loss is partially classified as remote (R$820.4 million) and partially classified as possible (R$546 million) in the fiscal year ended December 31, 2018. |
128
| | • | | ICMS. We are parties to various proceedings relating to ICMS, including proceedings relating to: (i) tax assessment notices received in relation to unpaid ICMS andnon-compliance with ancillary obligations, in connection with the agricultural and industrial tolling services partnership; (ii) ICMS levied on the remittances for the export of crystallized sugar, which the Company understands are tax exempt. However, tax authorities classify crystallized sugar as a semi-finished product subject to ICMS; (iii) ICMS withholding rate differences on the sale or purchase of goods, which after the operation, had their tax registrations cancelled; (iv) disallowance of ICMS tax credits on the sale of diesel fuel to customers engaged in the agro-industrial business; (v) ICMS payments on inventory differences arising from erroneous calculations by the State Tax Administration of São Paulo, Bahia, Mato Grosso and Paraíba; (vi) ICMS related to the competition between various Brazilian states to attract economic activities by granting tax benefits; (vii) CLE being a party to a legal proceeding with respect to the state fund of fiscal equilibrium (Fundo Estadual de Equilíbrio Fiscal), or “FEEF,” (deposit of 10% of ICMS tax exempted by the use of tax benefits) on the industrialization and commercialization of lube oils, considering that the constitutional immunity provided for in art. 155, § 2, X, “b” of CF / 88 cannot be considered as a tax benefit under Law No. 7,248 / 2016, regulated by State Decree No. 45,810/2016. Judicial deposits have been made for the corresponding amount of R$4.8 million as of December 31, 2018; (viii) ICMS exemptions in relation to the transportation of goods for export. There is a favorable position for taxpayers in the higher courts; (ix) assessment from State Tax Administration of São Paulo on the grounds that the Company was not authorized to operate as a general warehouse in the state. At the time of the granting of the state registration, the tax authorities allowed the Company’s activities, including the issuance of invoices; and (x) tax assessment notice issued by the São Paulo State Treasury Department, against Malha Paulista, in relation to the period from February 2011 to July 2015, alleging certain infractions for alleged lack of payment of ICMS on railroad services for export and ICMS credits accrual considered undue. The total amount involved in these proceedings was R$2,684 million as of December 31, 2018. The change of loss in these proceedings is estimated as possible. |
| | • | | Environmental Civil Class Action. Cosan is being sued by the Municipality of Ulianópolis, by means of the civil class actionNo. 0000749-68.2011.8.14.0130, for environmental damages related to alleged irregular waste disposal in a landfill located in the Municipality of Ulianópolis, in the state of Pará. Eight other companies are involved in the same lawsuit, and the plaintiff intends to declare all of them as jointly liable for restoring the environmental damage involved therein. The plaintiff seeks R$167.3 million but the specific amount needed to restore the damage cannot be estimated. It is also important to highlight that more than 50 companies are involved in the same matter by means of other lawsuits and a civil investigation currently being held by the state of Pará’s Public Prosecutor’s Office. Therefore, it is expected by some of these companies that any settlement or condemnation in this matter should comprise all of them. The lawsuit is currently suspended due to a plea from the Public Prosecutor’s Office. According to the Company’s information, the amount under discussion in these proceedings is R$167.3 million, of which R$15.3 million is classified as a possible risk of loss and R$152 million is classified as a remote risk of loss. |
| | • | | Malha Paulista – MS Teixeira Prumo Engenharia.Rumo’s subsidiary Malha Paulista currently is a party to a labor class action (ação civil pública) stemming from allegations by the Labor Prosecutor’s Office that certain persons working for MS Teixeira were working in degrading conditions analogous to indentured servitude. MS Teixeira was a subcontractor to Malha Paulista’s contractor for certain services, Prumo Engenharia. Malha Paulista has been ordered by the courts to undertake (and/or refrain from undertaking) various actions with respect to the working environment and to pay an indemnity for collective moral damages, as well as fines of R$100 thousand per breach or per worker in the event of future labor breaches. As of the date of this annual report, neither we nor Rumo have made provisions with respect to these proceedings as the external counsel advising Rumo on these proceedings has assessed the risk of loss as possible. An adverse outcome in this lawsuit could result in losses of approximately R$28.8 million to Rumo, and adversely affect Rumo’s reputation. However eventual future loss on this lawsuit cannot lead the inclusion of Malha Paulista on the list of Brazilian Ministry of Labor, containing the employers that practices supposed labor irregularities. |
| | • | | Annulment Action. The Brazilian Ministry of Labor has imposed a fine and served an infraction notice on Malha Paulista in connection with the abovementioned allegations that certain employees of MS Teixeira were working in degrading conditions analogous to indentured servitude. Malha Paulista has challenged the infraction notice in an administrative proceeding with the Brazilian Ministry of Labor, pending a final decision. Prumo Engenharia has admitted responsibility for the degrading conditions in which certain employees were working, including acknowledging its status as their employer and paying all applicable employment termination fees. This process was recognized and duly recorded by Brazilian Ministry of Labor. In spite of this, Malha Paulista has been included in a list of employers that employ workers in a condition analogous to indenture servitude by the Brazilian Ministry of Labor. On April 13, 2018, as part of annulment action currently being heard, the 83rd Labor Court of São Paulo granted an injunction, requiring that Malha Paulista be removed from the list until a final and unappealable judicial verdict is issued. The Regional Labor Appeals Court of São Paulo upheld the injunction following an appeal. The annulment proceeding is currently in the discovery phase. The facts under discussion in the annulment proceeding are similar to those at issue in the abovementioned labor class action. However, in the labor class action, the Labor Prosecutor’s Office is seeking the payment of damages and compliance with certain labor obligations by Malha Paulista, while in the annulment proceeding Malha Paulista is seeking the annulment of the Brazilian Ministry of Labor’s infraction notice. We estimate that the risk of loss in these proceedings is possible. |
129
| | • | | Malha Paulista – COS Emergencial Intermediação e Agendamento Ltda. Malha Paulista has contracted COS Emergencial Intermediação e Agendamento Ltda., or “COS Emergencial,” to perform property security services from 2006 until 2012. However, COS Emergencial’s managers were accused by the Federal Public Prosecutor’s Office of employing workers in degrading working conditions analogous to indentured servitude between the years of 2005 and 2010. According to testimony, the defendants had not complied with certain requirements to provide adequate working conditions, had left their employees for long periods without food, water, sanitation, communication and basic equipment, and had submitted them to long continuous periods of work. The lower court convicted the defendants and the Federal Public Prosecutor’s Office filed an appeal seeking to increase the defendants’ sentence. Even though there is no allegation that Malha Paulista committed any crime, one of the defendants stated in his defense that Malha Paulista was responsible for overseeing its contracted companies, and should therefore have identified the abovementioned working condition irregularities and sanctioned COS Emergencial or rescinded its agreement with COS Emergencial. We estimate that the risk of loss in these proceedings is possible. |
| | • | | Malha Paulista working conditions of engine/train drivers. Labor unions and the Labor Public Prosecutor’s Office filed a public civil action against Malha Paulista in connection with the working conditions of engine/train drivers, requesting the (i) prohibition of theso-called “stand-alone driving” (when only train driver is in the train cockpit driving it, without any assistant present), (ii) installation and proper maintenance of toilets in all locomotives, and (iii) payment of moral collective damages in the amount of R$30 million. The 36rdLabor Court of São Paulo has ordered Malha Paulista stop the stand-alone driving practice and pay moral collective damages to the train drivers in the amount of R$100 thousand per train driver. Malha Paulista has appealed to the Regional Appeal Labor Court of São Paulo and the appeal is currently pending. The total amount involved is R$4.1 million and we estimate the risk of loss as possible. |
| | • | | Malha Oeste working conditions of engine/train drivers. A labor union has filed a collective action against Malha Oeste requesting the prohibition of the monoconduction (when the train driver is in the train cockpit driving without an assistant). The 1st Labor Court of Bauru has declared the dismissal of the action without prejudice, for the existence ofres judicata. The labor union filed an appeal to Regional Appeal Labor Court of Campinas and the appeal is currently pending. The total amount involved is R$2.5 million and we estimate the risk of loss as possible. |
| | • | | Road cargo transportation and labor conditions of lorry drivers. The Labor Public Prosecutor’s Office filed a public civil action against Rumo requesting the (i) prohibition of outsourcing the road cargo transportation, (ii) compliance with overtime limits and breaks and (iii) payment of moral collective damages in the amount of R$91.5 million. The 1st Labor Court of Araraquara in the state of São Paulo has ordered Rumo not to outsource the road cargo transportation and to ensure compliance with the legal overtime limit and mandatory breaks, in addition to paying R$15 million of moral collective damages. Rumo appealed and the Regional Appeal Labor Court of Campinas in the state of São Paulo ruled partially in favor of Rumo, enabling the outsourcing of road cargo transportation and reducing the amount of moral collective damages to R$5 million, but maintaining the obligation to comply with overtime limit and mandatory breaks. Rumo appealed to the Superior Labor Court and the appeal is currently pending. The Brazilian Supreme Court has recently ruled that outsourcing is generally permitted. While we expect this ruling to have a positive effect on Rumo’s ongoing proceeding, we cannot guarantee that Rumo will be successful. |
130
| | • | | Brado Logística.This is an arbitration relating to the Brado Shareholders’ Agreement. Rumo may be required to either make payment of the amount under dispute (R$615.6 million as of December 31, 2018), or issue new shares in an amount corresponding to the amount involved, which may result in the dilution of its existing shareholders, including Cosan Logística. We estimate that the risk of Rumo being required to make payment of the amount involved or to be required to issue new shares is possible. The result of this arbitration could make Rumo increase its share participation on Brado.FI-FGTS is also a signatory to the Brado Shareholders’ Agreement and, although it is not a party to the proceedings involving the shareholders of Brado, it has been granted the same option as was granted to other parties to the Brado Shareholders’ Agreement. The exercise of the option byFI-FGTS may occur between the fifth and the seventh anniversary of the date of signing of the Brado Shareholders’ Agreement (entered on August 5, 2013). For further information, please see “Item 3. Key Information—D. Risk Factors—Risks Related to Our Businesses, the Operations of Our Joint Venture, and Industries in Which We Operate—The exercise of an option granted under the shareholders’ agreement of one of Rumo’s subsidiaries, Brado Logística, may have a material adverse effect on Rumo’s financial condition or result in a dilution of Rumo’s shareholders’ equity interest.” |
| | • | | Rumo Arbitration.Rumo is involved in a confidential arbitration. The plaintiff, a sugar trading company, is seeking indemnification claims in an amount of approximately R$461.6 million have been made by the plaintiff (a sugar trading company) in connection with the allegedly undue termination of a rail service and investments contract. Rumo filed a counterclaim, whereby it argues that the claims of the opposing party cannot be admitted in court. Rumo also claims the responsibility of the opposing party to pay damages arising from its unconditional termination of the agreement. The parties have filed an application and response or counterclaim. After presenting their initial allegations, both parties will present their replies. A decision will be made as to the evidence which must be provided based on order to be issued by the arbitration tribunal. Rumo’s counsel has assessed the risk of loss as possible. |
| | • | | CADE (Agrovia). In July, 2018, Rumo became aware that a preliminary investigation was started by CADE following certain allegations made by Agrovia S.A., or “Agrovia.” Agrovia alleges that Rumo abused its dominant position in the sugar market resulting in damages to Agrovia. Rumo has sought to refute the arguments presented by the CADE and has pointed out that most of the facts have already been analyzed and rejected in separate administrative proceedings. In March, 2019 the CADE started an administrative procedure accusing Rumo of abusing of its dominant position against Agrovia. As of the date of this annual report, Rumo has not yet presented its defense arguments. Rumo’s counsel has assessed the risk of loss as possible. |
| | • | | CADE (Seara). In January, 2018, Rumo became aware that a preliminary investigation was started by CADE in relation to an alleged unilateral conduct practiced by Rumo against Seara Industrial de Produtos Agropecuários Ltda. The preliminary investigation aims to collect information and documents so that CADE can decide whether to begin administrative proceedings. Rumo has sought to refute these accusations, including by the submission of documents, such as a technical opinion from ANTAQ. Rumo believes that the chance that an administrative proceeding will be brought is possible and the chance of loss in such a proceeding is possible. As the investigation is still its preliminary stages, the amount involved cannot be assessed at this stage. |
| | • | | Lawsuits concerning the economic-financial balance of leasing and concession contracts. Rumo’s subsidiaries Malha Paulista and Malha Oeste are parties to several lawsuits with the Brazilian government relating to the restoration of the economic-financial balance of the contracts entered into by the parties under the concession for certain railroad networks and the leasing of the related equipment. The Brazilian government filed actions to collect unpaid installments of the leasing and concession contracts. Malha Paulista and Malha Oeste, in turn, filed their own lawsuits seeking the restoration of the economic-financial balance of the contracts. In both cases, the trial court rendered interlocutory decisions authorizing Malha Paulista and Malha Oeste to guarantee the maturing installments by letters of guarantee issued by financial institutions. The trial court ruled in Malha Oeste’s favor on December 19, 2014, and partially in Malha Paulista’s favor on October, 2015. The parties filed appeals against both decisions. The appeal of Malha Paulista was partially accepted, in order to guarantee the right to reimburse counsel involved for the fees incurred. As of the date of this annual report, the appeal regarding Malha Oeste is still pending. The appeal of Malha Paulista was partially accepted and both parties presented new appeals to the Superior Brazilian Courts. The aggregate payments alleged to be owed by Malha Paulista and Malha Oeste total R$3,101.9 million. Accordingly, an adverse outcome in either of these lawsuits could result in significant losses to Rumo. In particular, Malha Paulista and Malha Oeste would be required to pay the installments guaranteed by letters of guarantee. The risk of loss in these proceedings is estimated as possible. |
131
| | • | | Rumo’s subsidiary Malha Sul also filed a lawsuit against the Brazilian government in order to restore the economic-financial balance of certain leasing and concession contracts. Malha Sul argues that it is being required to make some payments that are under the government’s responsibility. As of the date of this annual report, no decision has been issued authorizing Malha Sul to suspend the payment of the grants. |
| | • | | Malha Oeste and Malha Sul ANTT Proceedings. Malha Oeste and Malha Sul are party to preliminary proceedings being conducted by ANTT in relation to certain alleged failures by Malha Oeste and Malha Sul to comply with their contractual obligations pursuant to certain concession agreements. Specifically, the ANTT is alleging that Malha Oeste and Malha Sul have failed to comply with certain deadlines for the presentation of documents and financial information in relation to their respective concessions. If the preliminary proceedings are decided against Malha Oeste and Malha Sul, we expect that Malha Oeste and Malha Sul will be given the opportunity to remedy the alleged breaches and/or to pursue the proceedings in court before any of the concession agreements in question is terminated. We estimate that the risk of loss in these proceedings is possible. |
| | • | | Portofer lawsuit. The Federal Prosecutor’s Office filed public civil action against ALL and Malha Paulista, relating to irregularities in the public bidding of the railroad network of Porto de Santos in the state of São Paulo. According to the Federal Prosecutor’s Office, the government leased the railroad network to FERROBAN, FERRONORTE and FERROVIA NOVOESTE without having held prior bidding proceedings. ALL and Malha Paulista were included in this lawsuit as defendants because they are successors to these companies. Certain allegations of anticompetitive practice have been made in connection with these proceedings, based on the fact that the concession agreement related to the railroad network within the Port of Santos was directly awarded to FERROBAN, FERRONORTE and FERROVIA NOVOESTE without holding a bidding process, which the Federal Prosecutor’s Office believes should have been held. However, in the complaint, the Federal Prosecutor’s Office did not allege that anticompetitive practices were committed by the defendants themselves. Accordingly, even if the outcome of the lawsuit is negative for the defendants, the defendants will still be able to enter into contracts with the Brazilian public sector, and, if the concession agreement is deemed void, the government will be required to indemnify the defendants for investments made unless the Federal Prosecutor’s Office can prove that such persons acted in order to avoid a bidding procedure. In any event, it is likely that the renewal clause of the agreement will be deemed void. An adverse outcome in this lawsuit could result in the loss of ALL’s and Malha Paulista’s concession, a new bidding process being held in relation to the railroad network of Porto de Santos and the restitution of any unamortized investment made by ALL in the network. The trial court dismissed the injunction request of the Federal Prosecutor’s Office, pursuant to which the Federal Prosecutor’s Office requested the commencement of a new bidding proceeding and that the Brazilian government be prevented from renewing the current concession contract. ALL and Malha Paulista presented a defense in connection to this case, arguing the maintenance of the current concession agreement. The court denied the injunction requested by the Federal Prosecutor’s Office. The court also denied the Federal Prosecutor’s requests. The Federal Prosecutor has filed an appeal. The risk of loss in these proceedings is estimated as possible. The Brazilian Court of Auditors (Tribunal de Contas da União), or “TCU,” is also analyzing the legality of these lease agreements. Malha Paulista and ALL have presented their defense, stating that a legal exception to the bidding rule authorizes the execution of the contract without a public bidding process. Until the date hereof, no final decision has been issued by TCU on this matter. |
| | • | | Rumo/ALL Investigation. During the course of 2016, Rumo became aware of certain press reports alleging that improper payments to government officials were made by former employees of ALL (prior to being acquired by Rumo) in connection with an investment by Fundo de Investimento do Fundo de Garantia do Tempo de Serviço, or“FI-FGTS,” in Rumo’s indirect subsidiary Brado Logística and in ALL. As a result of these allegations, Rumo has engaged external legal counsel and consultants to conduct an internal investigation. The report of the investigation was submitted to the Federal Prosecutor’s Office (without being made available to the Company, in accordance with the terms of the engagement). At this time, we can neither predict the outcome of the internal investigation, the consequences of any findings or any measures that may be taken by local authorities, any of which may have a material adverse effect on Rumo. See “Item 3. Key Information—D. Risk Factors—Risks Related to Our Businesses, the Operations of Our Joint Venture, and Industries in Which We Operate—We cannot predict the outcome of an investigation into the conduct of former employees of ALL prior to its acquisition by Rumo.” The TCU is also analyzing the regularity of this investment byFI-FGTS in Rumo’s indirect subsidiary Brado Logística and in ALL. Rumo and ALL have presented their defense, stating that the investment generates a financial return toFI-FGTS that justifies it. Until the date hereof, no final decision has been issued by TCU on this matter. |
| | • | | Perpetual Notes. We have received atax assessment notice relating to the exchange variation and interest incurred on our perpetual notes. The tax authorities understand that certain corporate transactions carried out were intended to postpone the settlement of debt contracted abroad through the issuance of perpetual bonds. The perpetual bonds were issued to reduce the positive result of exchange variation, the amount of which is R$86.6 million with a possible risk of loss. These three notices of infraction are being contested at the administrative level. |
132
| | • | | Comgás tax assessment notice.Comgás has received a tax assessment notice in an amount of R$284.3 million in relation to income tax withheld at source (IRRF) on capital gains. As a result of certain contractual arrangements, this contingency is the responsibility of the former controlling shareholder of Comgás. |
| | • | | Goodwill Comgás. Comgás received a tax assessment notice on April 7, 2016 requiring Comgás to pay certain additional income tax and social contribution on net income arising in connection with the amortization of goodwill on certain investments in the 2013 to 2014 calculation periods. According to Comgás, the updated amount under discussion was R$983.5 million, including interest and a 150% fine, of which R$729.5 million was classified as a possible risk of loss and R$254 million is classified as a remote risk of loss as of December 31, 2018. |
| | • | | Tax assessment notices. The Company and its subsidiaries have received assessment notices based on the following: (i) Comgás was aware of the offsetting procedures, using income tax credits (IRPJ), in a possible amount of R$342.8 million as of December 31, 2018; and (ii) CLE has a requirement of IPI at restricting its constitutional immunity from oil lubricant derived, in a possible amount of R$184.6 million as of December 31, 2018. |
Certain Tax Proceedings
We are parties to certain other tax proceedings, including the following primary proceedings:
| | • | | Tax assessment notices issued to require additional income tax, social contribution, PIS and COFINS, for the calendar years 2005 to 2008 as a result of the following alleged violations: (a) improper deduction from taxable income and CSLL calculation basis of financial costs arising from loans with foreign financial institutions, (b) improper exclusion from taxable income and CSLL calculation basis of financial income from securities issued by the Government of Austria and the Government of Spain, (c) no inclusion, in the income tax and CSLL calculation basis, of gains earned in swap operations, and the absence of taxation of financial income resulting from these contracts by PIS and COFINS, (d) improper exclusion from taxable income and the CSLL calculation basis, using PIS and COFINS credits, and (e) improper exclusion from taxable income and CSLL calculation using deferred CSLL. A reduction in tax assessment resulted from a favorable CARF judgment that involved the cancellation of most tax requirements. The risk of loss changed from possible to remote. |
| | • | | Malha Paulista has received a tax assessment notice relating to the absence of taxation of PIS and COFINS on revenues from mutual traffic and rights of passage invoiced against Malha Norte in the amount of R$33.8 million as of December 31, 2018. The chance of loss is considered possible as tax already has been collected by the concessionaire. |
| | • | | Malha Paulista had part of its IRPJ credit balance not accepted based on the argument that it would not be entitled to IRRF compensation on swap transactions. The amount involved is R$75 million. |
| | • | | We are a party to certain legal proceedings related to INSS payment with a possible risk of loss, as follows: (a) proceedings regarding the legality and constitutionality of Normative Instruction MPS/SRP Nº 03/2005, which restricted the constitutional immunity over social contributions on export revenues made via trading companies. The right to assess part of the charge has prescribed, as a result of which the risk of loss has changed from possible to remote with respect to an amount of R$358.4 million as of December 31, 2018; (b) assessment of SENAR (Rural apprenticeship scheme) social contribution on direct and indirect exports, in which the tax authorities disregard the right to constitutional immunity, in an amount of R$15.8 million as of December 31, 2018; and (c) requirement for security contribution on the acquisition of shares through stock option plans, in an amount of R$48 million as of December 31, 2018. |
| | • | | The Brazilian tax authorities issued tax assessments in 2011 and 2013 against Rumo concerning: (a) amortization expense disallowance based on future profitability, as well as financial expenses; and(b) non-taxation of supposed capital gain on the disposal of equity interest in a Company of the same group, in an amount of R$529.8 million as of December 31, 2018. |
| | • | | Rumo has received an assessment relating to the disregard of the tax benefits of REPORTO (PIS and COFINS suspension), on the grounds that the locomotives and freight cars purchased in 2010, 2011 and 2012 were used outside the limits of the port. Therefore, Rumo was assessed to pay PIS and COFINS, as well as a fine corresponding to 50% of the value of acquired assets, in the amount of R$449 million as of December 31, 2018. |
| | • | | The tax authorities have partially rejected the installment requests for federal tax debts made by Malha Sul and Intermodal, arguing that the Net Operating Losses, or “NOLs,” offered by the companies were not sufficient to discharge their existing debts. The amount involved is R$112.7 million as of December 31, 2018. The probability of loss is considered possible, since the NOLs existed and were available for such use. |
133
Judicial Deposits
In accordance with court orders concerning certain tax, civil and labor lawsuits, we had bank judicial deposits in an aggregate amount of R$878.8 million as of December 31, 2018.
Criminal Environmental Claims
Cosan S.A. and its subsidiaries are parties to nine criminal environmental lawsuits and are being investigated in certain environmental police inquiries in process in the states of São Paulo, Pará, Rio Grande do Sul, Mato Grosso do Sul, Paraná, Rio de Janeiro, Minas Gerais and Santa Catarina. The main crimes alleged are noise pollution; contamination of soil and rivers; burning; deforestation of native forest; emission of pollutants into the atmosphere and irregular transportation of dangerous products.
Cosan Logística and its subsidiaries are parties to eight criminal environmental lawsuits and are being investigated in certain environmental police inquiries in the States of São Paulo, Rio Grande do Sul, Mato Grosso do Sul and Santa Catarina. The main crimes alleged are noise pollution; contamination of soil and rivers; deforestation of native forest and irregular transportation of dangerous products. The probability of loss in these cases is possible.
Criminal Proceedings Involving Members of Our Management
Certain members of our management are parties to criminal proceedings, as follows:
Mr. Rubens Mello
Mr. Rubens Ometto Silveira Mello, in his capacity as a representative of Usina da Barra S.A. – Açúcar e Álcool (the former corporate name of Raízen Energia), was named a defendant in a complaint filed on September 24, 2007 alleging the crimes of disobedience and pollution in connection with the burning of sugarcane by the company in contravention of a judicial decision in a public civil class action which banned this practice in the region. In a motion, Mr. Mello pleaded (1) the illegitimacy of his status as a defendant, given that he did not participate in the alleged conduct and was not the owner or lessor nor did he exercise control over the area in which the alleged conduct took place, (2) the fact that the alleged conduct does not constitute a crime, given that the notice regarding the prohibition against the burning of sugarcane was not given by the competent authority and (3) that the right to the controlled burning of sugarcane in the region was reestablished in the context of the public civil class action and that the allegations with regards to the crimes of disobedience and pollution should therefore be disregarded. The motion was granted in part in relation to the suspension of the criminal proceeding until the rendering of a final judgment in the public civil action. While the statute of limitations with respect to the crime of pollution was tolled, the statute of limitations with respect to the crime of disobedience was not suspended and has expired. Accordingly, the complaint with respect to the crime of pollution was remanded to the state authorities in order for the investigations in connection with crime of pollution to continue. As of the date of this annual report, this criminal proceeding remains suspended pending a final decision in the related public civil class action as to whether the crime of pollution was in fact committed. As of the date of this annual report, such final decision is still pending. In the event the criminal proceeding is permitted to advance, Mr. Mello will be subject to the applicable criminal penalties. In the opinion of counsel responsible for Mr. Mello’s defense, compelling legal arguments exist that would support dismissal of the charges against Mr. Mello, and the likelihood of a decision favorable to Mr. Mello is probable.
Mr. Rubens Mello and Mr. Guilherme Cerqueira
Mr. Cerqueira, an executive officer of Raízen Centroeste Açúcar e Álcool Ltda. (formerly known as Cosan Centro-Oeste Açúcar e Álcool Ltda.), and Mr. Mello, while an executive officer of Raízen Centroeste Açúcar e Álcool Ltda., were named defendants, together with Raízen Centroeste Açúcar e Álcool Ltda., in a complaint filed on July 20, 2011 alleging artificial price fixing of fuel and the formation of a cartel for the purpose of establishing regional market control. In their defense, Mr. Mello and Mr. Cerqueira maintain that their status as defendants in the proceeding is not proper given the lack of proof of their involvement in the alleged illicit acts. Mr. Mello and Mr. Cerqueira also maintain that the increase in the price of ethanol resulted solely from market forces (i.e., that the increase in the price of ethanol did not result from criminal conduct, but rather the lawful exercise of a recognized constitutional right of free enterprise). The claim was accepted and the criminal proceedings are currently in an initial phase.
The defendants filed a motion ofhabeas corpus, which was partially granted on May 18, 2017 with regards to the crime of conspiracy but rejected with regards to the crime of cartel formation. Decision on the appeals is still pending. On February 21, 2018, the judge ordered a stay of the action and the cancellation of scheduled hearings pending a decision from the Brazilian Superior Court of Justice (Superior Tribunal de Justiça). As a result of an additionalhabeas corpus filed by aco-defendant, the prosecutor’s appeal was dismissed by the Supreme Court of Justice (Supremo Tribunal de Justiça). This decision extended its effects to all defendants.
134
Mr. Rubens Mello, Mr. Marcos Lutz and Mr. Pedro Mizutani
Mr. Rubens Mello, Mr. Marcos Lutz and Mr. Pedro Mizutani were named as defendants in a criminal complaint filed on August 28, 2014 to determine whether they have committed tax evasion in connection with the alleged failure to adequately pay state value added taxes (ICMS). The determination as to whether outstanding taxes are in fact due is at issue in a separate tax collection enforcement proceeding that is independent of the criminal proceeding. Bank letters of credit and insurance guarantees have been deposited with the relevant court in order to secure the amount in controversy. Given the fact that the crime of tax evasion requires there to be an actual loss to the tax authorities, such deposits have generally been interpreted by the Brazilian courts to eliminate criminal liability given that there would no longer exist a direct or indirect risk of harm to the public treasury and the allegedly illicit conduct of the defendants would no longer constitute a crime. This understanding, however, may change depending on the judge’s final decision. In view of the foregoing, the defense filed a motion requesting that the criminal proceedings (which are currently suspended) be terminated for lack of cause. The criminal action is currently suspended and there is still an appeal pending with regards to the filing of the accusation. In the opinion of counsel responsible for the defense, the likelihood of a decision favorable to the defendants is possible. In any event the payment of the amounts due would be sufficient to extinguish liability.
Mr. Marcelo Martins
Mr. Marcelo Eduardo Martins is a defendant in a criminal suit filed by the Public Prosecutor of the state of Bahia on July 4, 2016, regarding the crime of tax evasion for the alleged failure to pay ICMS by Votorantim Cimentos N/NE S/A prior to Mr. Martins joining Cosan S.A. A reply to the indictment has already been filed and the case is being analyzed. The related tax enforcement is duly guaranteed by means of a bank guarantee letter. In the opinion of counsel responsible for the defense, the likelihood of a decision favorable to the defendant is possible.
Mr. Ricardo Dell Aquila Mussa and Mr. Nelson Roseira Gomes Neto
Mr. Ricardo Dell Aquila Mussa and Mr. Nelson Roseira Gomes Neto are among the defendants in a criminal proceeding initiated by Nike International Ltd. and Nike do Brasil Comércio e Participações Ltda. in connection with alleged crimes against intellectual property and trademarks (as provided for in Brazilian law) relating to the alleged unauthorized use of a registered trademark, as well as the importing of products marked with brands illegally reproduced or copied from a third party (in each case, in their respective capacities prior to joining Raízen and Comgás, respectively). All defendants have already presented their respective defenses, and a favorable decision of acquittal was granted by a first instance court on November 13, 2017. The prosecution has appealed. According to counsel responsible for this lawsuit, the chance of a decision favorable to the defendants is probable.
Dividends and Dividend Policy
Dividend Rights
Cosan Limited is a holding company and can only pay dividends to the extent, if any, that funds are received from our subsidiaries. Our dividend policy is similar to the current dividend policy of our principal subsidiaries, Cosan S.A. and Cosan Logística. Brazilian corporate law requires that theby-laws of a Brazilian company specify a minimum percentage of the available income for the annual distribution of dividends, known as the mandatory dividend, which must be paid to shareholders as either dividends or interest attributable to shareholders’ equity. We intend to pay cash dividends, representing on an annual basis 25% of our annual consolidated net income, to holders of class A common shares and class B common shares in proportion to the number of shares held by them unless our board of directors has determined, in its discretion, that such distribution would not be advisable or appropriate in light of our financial condition or we are unable to meet applicable statutory solvency requirements under Bermuda law.
Our board of directors may, in its discretion, amend or repeal our dividend policy. You may not receive the level of dividends provided for in the dividend policy or any dividends at all due to a number of factors, such as:
| | • | | we are a holding company, and therefore, our ability to pay dividends will depend on our ability to receive distributions from our subsidiaries; |
| | • | | our subsidiaries may become subject to covenants restricting their ability to distribute dividends under credit facilities, term loans or other indebtedness; |
135
| | • | | any imposition of restrictions on conversions and remittances by the Brazilian government could hinder or prevent us from converting into U.S. dollars or other foreign currencies and remitting abroad dividends of our Brazilian subsidiaries; |
| | • | | our shareholders have no contractual or other legal rights to dividends pursuant to Bermuda law; and |
| | • | | we may not have sufficient cash to pay dividends due to changes in our operating earnings, working capital requirements and anticipated cash needs. |
Under Bermuda law, a company’s board of directors may declare and pay dividends from time to time unless there are reasonable grounds for believing that the company is or would, after the payment, be unable to pay its liabilities as they become due or that the realizable value of its assets would thereby be less than the aggregate of its liabilities and issued share capital and share premium accounts. Under ourbye-laws, each class A common share and class B common share is entitled to dividends if, as and when dividends are declared by our board of directors, subject to any preferred dividend right of holders of any preference shares. There are no restrictions on our ability to transfer funds (other than funds denominated in Bermuda dollars) in or out of Bermuda or to pay dividends to U.S. residents who are holders of our common shares.
We expect to have sufficient available cash to pay dividends in accordance with our dividend policy. We do not, however, plan to pay dividends in the event that we do not generate sufficient cash from operations. In addition, we will not pay dividends if we believe that such payment will limit or preclude our or our subsidiaries’ ability to pursue growth opportunities. Although ourbye-laws and Cosan S.A.’sby-laws do not restrict us from borrowing funds to pay dividends, we do not intend to borrow funds to pay dividends.
The dividend rights attaching to our class A common shares and class B common shares are not cumulative in the event that we do not, for any reason, pay dividends on those shares.
Any cash dividends payable to holders of our common shares quoted on the NYSE will be paid to Mellon Investors Services LLC, our transfer agent in the United States, for disbursement to those holders.
Cosan S.A. Dividend Policy
Brazilian corporate law and Cosan S.A.’sby-laws require that Cosan S.A. distributes annually to its shareholders a mandatory minimum dividend, unless Cosan S.A.’s board of directors notifies the shareholders that such distribution is not advisable in light of Cosan S.A.’s financial condition as reflected in Cosan S.A.’s consolidated financial statements. The basis of the mandatory dividend is a percentage of the net income, as adjusted pursuant to the Brazilian Corporation Law. Under ourby-laws, a minimum of 25% of our adjusted net income should be intended for distribution and payment to our shareholders as mandatory dividend. However, the payment of mandatory dividends to our shareholders may be limited to the amount of realized net income in a given year, provided the difference is recorded as an unrealized income reserve.
We are required by the Brazilian Corporation Law and ourby-laws to hold an annual shareholders’ meeting no later than four months after the end of each fiscal year, at which time the allocation of the results of operations in any year and the distribution of an annual dividend are reviewed. The distribution of annual dividends is based on our audited financial statements prepared for the immediately preceding fiscal year.
Calculation of Adjusted Net Income
At each annual shareholders’ meeting, our board of directors is required to recommend how to allocate our net income for the preceding fiscal year, which recommendation our board of executive officers initially submits to our board of directors for approval.
This allocation is subject to approval by our common shareholders. The Brazilian Corporation Law defines “net income” for any fiscal year as our net income after income taxes for that fiscal year, net of any accumulated losses from prior fiscal years and any amounts allocated to employees’ participation in our net income in that fiscal year. Under the Brazilian Corporation Law, our adjusted net profit available for distribution are equal to our net profit in any fiscal year, reduced by amounts allocated to our legal reserve and other applicable reserves, and increased by any reversals of reserves that we constituted in prior years.
136
Reserve Accounts
Under the Brazilian Corporation Law and ourby-laws, we are required to maintain a legal reserve. In addition, we are permitted by the Brazilian Corporation Law to establish the following discretionary reserves:
| | • | | a contingency reserve for an anticipated loss that is deemed probable in future years. Any amount allocated in a previous year must be reversed in the fiscal year in which the loss had been anticipated if the loss does not occur as projected or charged off in the event that the anticipated loss occurs; |
| | • | | a reserve for investment projects, in an amount based on a capital expenditure budget approved by our shareholders; |
| | • | | an unrealized income reserve; and |
| | • | | a tax incentive investment reserve, included in our capital reserve accounts, in the amount of the reduction in our income tax obligations due to government tax incentive programs. |
Allocations to each of these reserves (other than the legal reserve) are subject to approval by our common shareholders voting at our annual shareholders’ meeting.
The Brazilian Corporation Law provides that the legal reserve and the tax incentive investment reserve may be credited to shareholders’ equity or used to absorb losses, but these reserves are unavailable for the payment of distributions in subsequent years.
The amounts allocated to the other reserves may be credited to shareholders’ equity and used for the payment of distributions in subsequent years.
Cosan Logística’s Dividend Policy
Cosan Logística’s dividend policy is the same as of Cosan S.A.
Joint Venture’s Dividend Policy
The shareholders’ agreement between Cosan S.A. and Shell also establish the dividend policy of the Joint Venture. The dividend policy states that the Joint Venture seeks to maximize the amount of profits to be distributed to its shareholders in a manner consistent with its leverage ratio objectives and capital investment requirements. The supervisory boards must propose, and the shareholders approve, an allocation of the net profit of the Joint Venture in accordance with the shareholders’ agreements. The shareholders’ agreements provide that net profit is subject to the following allocation order:
| | �� | | first, up to 5% of net profit to the respective company’s legal reserve, which may not exceed a specified amount, the lower of 20% of the respective company’s capital stock or 30% of the capital plus any capital surplus; |
| | • | | second, a variable amount of net profit to each shareholder based on certain tax attributes contributed by it to the Joint Venture; Cosan S.A. is entitled to receive preferential dividends equivalent to the amount of any tax savings from the amortization of goodwill it contributes to the Joint Venture. Similarly, Shell is entitled to receive preferential dividends equivalent to the amount of any tax savings from the amortization of accumulated losses that it contributes to the Joint Venture; |
| | • | | third, a nominal amount of net profit to the holders of certain preferred shares; |
| | • | | fourth, 1% of net profit to the shareholders; |
| | • | | fifth, a variable amount, capped at a specified percentage of net profit, to the respective company’s statutory reserve for operations and projects, such amount not to exceed 80% of net profits or 80% of the respective company’s share capital; and |
| | • | | sixth,the distribution of the remaining amount of net profit to be determined by the shareholders. |
Brazilian Taxation
Dividends paid by Cosan S.A. to us are currently not subject to withholding income tax in Brazil, to the extent that such amounts are related to profits generated since January 1, 1996. The only exception would be for amounts related to 2014 tax statements. In this case, considering new tax legislation enacted in May 2014, if the amounts calculated using the accounting criteria in force in December 2007 (i.e., without IFRS effects) exceed a certain exemption limit, they would be taxed at a rate of 25%. Cosan S.A. did not surpass the exemption limit.
137
Brazilian tax laws permit Cosan S.A. to make distributions to shareholders of interest on shareholders’ equity and treat those payments as a deductible expense for purposes of calculating Brazilian income tax and social contributions. For tax purposes, this interest is limited to the daily pro rata portion of the TJLP, as determined by the Brazilian Central Bank quarterly, and the amount of the deduction is limited to the largest of (1) 50% of net income (after social contributions but before income tax and the amount to be distributed as interest on shareholders’ equity) related to the period in respect of which the payment is made; and (2) 50% of the sum of retained profits and profit reserves as of the date of the beginning of the period in respect of which the payment is made. A payment to us of interest on shareholders’ equity is subject to withholding income tax at the rate of 25%.
Dividend Payments
On May 26, 2015, the board of directors approved the distribution of the dividends received by Cosan Limited from Cosan S.A. and Cosan Logística S.A. (“Cosan Logística”) on May 26, 2015. The dividends were paid to shareholders for the fiscal year ended December 31, 2014 totaling U.S.$29,648,408.93 corresponding to U.S.$0.11201145 per common share or the equivalent inreais to holders of Brazilian depositary receipts, or “BDRs,” without withholding income tax.
On May 13, 2016, the board of directors approved the distribution of the dividends received by Cosan Limited from Cosan S.A. The dividends were paid to shareholders for the fiscal year ended December 31, 2015 totaling U.S.$24,052,065.65 corresponding to U.S.$0.09086851 per common share or the equivalent inreais to holders of BDRs, without withholding income tax.
On May 5, 2017, the board of directors approved the distribution of the dividends received by Cosan Limited from Cosan S.A. The dividends were paid to shareholders for the fiscal year ended December 31, 2016 totaling U.S.$20,000,000.00, corresponding to U.S.$0.0755598 per common share or the equivalent inreais to holders of BDRs, without withholding income tax.
On April 27, 2018, the board of directors approved the distribution of the dividends received by Cosan Limited from Cosan S.A. The dividends were paid to shareholders for the fiscal year ended December 31, 2017 totaling U.S.$20,000,000.00, corresponding to U.S.$0.08223712 per common share or the equivalent inreais to holders of BDRs, without withholding income tax.
None.
| Item 9. | The Offer and Listing |
| A. | Offer and Listing Details |
Prior to August 16, 2007, no public market existed for our class A common shares. Since August 16, 2007, our class A common shares have been listed on the NYSE and trade under the symbol “CZZ.”
Our BDRs were previously listed on the B3 under the symbol “CZLT33.” On April 19, 2018, we submitted to the B3 a proposal relating to the discontinuation of our BDR program pursuant to the procedure set forth in the B3’s Issuer Guide (Manual do Emissor). On October 10, 2018, we completed our deregistration with the CVM and the delisting of our BDRs from the B3. The discontinuation of our BDR program was intended to reduce our regulatory costs and concentrate liquidity of the Company’s stock on the NYSE.
The following information concerning the trading history of our class A common shares is presented solely for informational purposes. This information should not be viewed as indicative of future sales prices for our class A common shares on the NYSE. Actual future sales prices for our class A common shares are likely to be significantly different from their trading history.
138
The following table sets forth the high and low closing sales prices for our class A common shares on the NYSE for the periods indicated.
| | | | |
COSAN LIMITED CLASS A COMMON SHARES; TICKER: CZZ | | NYSE |
| | | High | | Low |
| | | (U.S.$ per common share) |
Fiscal Year Ended December 31, 2014 | | 14.66 | | 6.18 |
Fiscal Year Ended December 31, 2015 | | 8.06 | | 2.75 |
Fiscal Year Ended December 31, 2016 | | 9.33 | | 2.69 |
Fiscal Year Ended December 31, 2017 | | 10.13 | | 5.69 |
Fiscal Year Ended December 31, 2018 | | 11.76 | | 6.26 |
| | | | |
Fiscal Quarter | | | | |
First Fiscal Quarter 2016 | | 4.92 | | 2.60 |
Second Fiscal Quarter 2016 | | 6.51 | | 4.55 |
Third Fiscal Quarter 2016 | | 7.46 | | 6.22 |
Fourth Fiscal Quarter 2016 | | 9.29 | | 6.92 |
First Fiscal Quarter 2017 | | 9.33 | | 7.33 |
Second Fiscal Quarter 2017 | | 9.03 | | 5.69 |
Third Fiscal Quarter 2017 | | 8.41 | | 6.32 |
Fourth Fiscal Quarter 2017 | | 10.13 | | 7.87 |
First Fiscal Quarter 2018 | | 11.76 | | 10.09 |
Second Fiscal Quarter 2018 | | 10.78 | | 7.63 |
Third Fiscal Quarter 2018 | | 8.52 | | 6.26 |
Fourth Fiscal Quarter 2018 | | 8.95 | | 6.70 |
| | | | |
Month | | | | |
October 2018 | | 8.45 | | 6.70 |
November 2018 | | 8.89 | | 7.38 |
December 2018 | | 8.95 | | 8.13 |
January 2019 | | 11.03 | | 9.18 |
February 2019 | | 11.73 | | 10.84 |
March 2019 | | 13.03 | | 10.85 |
April 2019 (through April 26, 2019) | | 12.72 | | 11.59 |
Source: Bloomberg
On April 26, 2019, the reported closing sale price of our class A common shares on the NYSE was U.S.$12.16 and R$47.85 per class A common share.
Not applicable.
Our class A common shares are listed on the NYSE and trade under the symbol “CZZ.”
Not applicable.
Not applicable.
Not applicable.
139
| Item 10. | Additional Information |
Not applicable.
General
We are a limited liability exempted company incorporated under the laws of Bermuda on April 30, 2007. We are registered with the Registrar of Companies in Bermuda under registration number EC 39981. Our registered office is located at Crawford House, 50 Cedar Avenue, Hamilton HM 11, Bermuda.
The objects of our business are set forth in our memorandum of association and provide that we have unrestricted objects and powers and rights including to:
| | • | | import, export, produce and sell ethanol, sugar, sugarcane and other sugarby-products; |
| | • | | distribute and sell fuel and other fuelby-products; |
| | • | | produce and market electricity, steam and otherco-generationby-products; |
| | • | | render technical services related to the activities mentioned above; and |
| | • | | hold equity interests in other companies. |
There have been no bankruptcy, receivership or similar proceedings with respect to us or our subsidiaries.
Issued Share Capital
Under ourbye-laws, the holders of our class A common shares and class B common shares will be offered the preemptive right to purchase, in the first instance, on a pro rata basis according to their ownership interests, additional shares in the event of any increase in share capital. However, this preemptive right may be waived by (1) a majority of our board of directors in the case of an offering (whether or not registered under the Securities Act) or (2) a majority of the independent directors on our board of directors in any circumstance.
Pursuant to and in accordance with the Notice to the Public dated June 1, 2005 issued by the Bermuda Monetary Authority, there is no limitation on the right ofnon-residents of Bermuda to hold our shares as long as we remain listed on the NYSE or another appointed stock exchange.
Common Shares
Holders of class A common shares are entitled to one vote per share on all matters submitted to a vote of shareholders in general meeting. Holders of class B series 1 common shares or class B series 2 common shares are entitled to 10 votes per share on all matters submitted to a vote of shareholders in general meeting, except as otherwise provided by ourbye-laws.
Except for the conversion provisions relating to our class B common shares, holders of our class A common shares and class B common shares have no redemption, conversion or sinking fund rights. Unless a different majority is required by law or by ourbye-laws, resolutions to be approved by holders of common shares require approval by a simple majority of votes cast at a meeting at which a quorum is present.
In the event of our liquidation, dissolution orwinding-up, the holders of class A common shares and class B common shares are entitled to share equally and ratably in our assets, if any, remaining after the payment of all of our debts and liabilities, subject to any liquidation preference on any outstanding preference shares.
140
Preference Shares
Under ourbye-laws, we may, subject to the affirmative vote of a majority of our board of directors and, in certain circumstances as provided for in ourbye-laws, a majority of our class A common shares and class B common shares, each voting as a separate class, establish one or more series of preference shares having such number of shares, designations, dividend rates, relative voting rights, conversion or exchange rights, redemption rights, liquidation rights and other relative participation, optional or other special rights, qualifications, limitations or restrictions as may be fixed. Such rights, preferences, powers and limitations as may be established could also have the effect of discouraging an attempt to obtain control of us. There are no outstanding preference shares, and we have no present plans to issue any preference shares.
Dividend Rights
For information concerning dividend rights of our class A common shares, class B series 1 common shares and class B series 2 common shares, see “Item 8. Financial Information—A. Consolidated Statements and Other Financial Information—Dividends and Dividend Policy.”
Tag-along Rights
Following the consummation of our initial public offering, no person or group of persons (other than a holder of class B series 1 common shares) may, in a transaction or series of transactions, acquire, directly or indirectly, the beneficial ownership of class A common shares representing more than 15% of our issued and outstanding common shares from any person or otherwise acquire control over our company, unless the terms and conditions of such transaction or transactions include an offer by the acquiring person or group of persons to the holders of all other class A common shares or class B common shares to acquire at the option of each applicable shareholder, all or any part of the respective shares owned by such shareholder. The price per share paid by the acquiring person or group of persons will be equivalent to the greater of (1) the highest price per share paid by the acquiring person or group of persons to acquire any such class A shares representing 15% of our issued and outstanding common shares or control, as applicable and (2) a price determined based on an appraisal report. Thetag-along tender offer must be launched promptly after closing of the sale that triggers application of thetag-along provision and be completed within 60 days after the consummation of the transaction or series of transactions. In the event that thetag-along tender offer is not completed within the60-day period, the holder or holders of the shares acquired in the sale that triggered the preemption rights will not be entitled to vote such shares, and we will be entitled to compel such holder or holders to sell these shares to unaffiliated persons deemed acceptable by a majority of our board of directors at the lower of (A) the lowest acquisition price for the class A common shares and (B) the then prevailing market price on the NYSE or such other stock exchange which constitutes the principal market for the class A common shares on a date selected by our board of directors that is not more than ten trading days on the applicable exchange following the expiration of the60-day period.
Conversion
Our class A common shares are not convertible into any other shares of our authorized share capital.
Each class B common share is convertible at any time after three years following our initial public offering (August 16, 2007), at the option of the holder, into one class A common share. In addition, each class B common share will, subject to limited exceptions applicable to class B series 1 common shares referred to below, automatically convert into one class A common share upon any transfer of its current beneficial ownership, whether or not for value.
Following the death of Mr. Rubens Ometto Silveira Mello or a determination by66-2/3% of our board of directors based on the medical determination of two internationally recognized certified physicians that he is permanently mentally incapacitated, the beneficial ownership of class B series 1 common shares may be transferred from him to his immediate family members without resulting in the automatic conversion of those shares into class A common shares. So long as class B common shares are issued and outstanding, in the case of death or permanent incapacitation of Mr. Rubens Ometto Silveira Mello, the following actions or events will be subject to approval by a majority of the then independent members of our board of directors, in addition to any other approval of shareholders or members of our board required by Bermuda law or ourbye-laws:
| | • | | appointment of the chief executive officer of our company or any of its subsidiaries (including successors thereof); |
| | • | | changes to the core business strategy of our company or any of its subsidiaries; |
| | • | | change of name or corporate purpose of our company or any of its subsidiaries; |
| | • | | amendments to any rights of the class B series 1 common shares; |
141
| | • | | any recapitalization, stock split, combination, reclassification or similar action affecting equity interests in our company or any of its subsidiaries; |
| | • | | redemption, capital reduction or other acquisition for value of any shares of equity interests in our company or any of its subsidiaries; |
| | • | | any transaction or series of transactions resulting in aspin-off, delisting, merger, amalgamation, reorganization or combination of or by our company or any of its subsidiaries with, or any acquisition of, another person involving an amount in excess of U.S.$250 million; |
| | • | | any sale, lease, assignment, transfer or other disposition of assets valued, in the aggregate, in excess of U.S.$250 million; |
| | • | | any voluntary liquidation, reorganization, dissolution orwinding-up of, or a voluntary filing for bankruptcy protection by our company or any of its subsidiaries; |
| | • | | the approval of the limit of the compensation of members of the board of directors or executive officers of our company or any of its subsidiaries; |
| | • | | the making of any investment in excess of U.S.$250 million other than investments in the ordinary course of business; |
| | • | | entering into any Joint Venture, partnership or any similar arrangement other than in the ordinary course of business; |
| | • | | any related-party transactions; |
| | • | | the incurrence of any liens on properties valued, in the aggregate, in excess of U.S.$250 million; |
| | • | | amendment of the provisions of any of the foregoing actions or events; and |
| | • | | agreeing to, or otherwise committing to take, any of the foregoing actions. |
Mr. Rubens Ometto Silveira Mello may also transfer his class B series 1 common shares to a trust, corporation, partnership or limited liability company in which he and, following his death or permanent incapacitation, a member or members of his immediate family, directly or indirectly, retain sole dispositive power and exclusive voting control with respect to such entity and the class B series 1 common shares held by such entity. In addition, any such trust, corporation, partnership, or limited liability company that directly holds class B series 1 common shares may distribute those shares to its respective partners, members or owners (which may further distribute the class B series 1 common shares to their respective partners, members or owners) without triggering a conversion to class A common shares, provided that Mr. Rubens Ometto Silveira Mello and, following his death or permanent incapacitation, his immediate family members continue to hold sole dispositive power and exclusive voting control over the class B series 1 common shares.
Class B common shares also will automatically convert into class A common shares when the aggregate outstanding class B series 1 common shares represent less than 45% of our total voting power in respect of the issued and outstanding share capital in the company. In addition, class B series 2 common shares will automatically convert into class A common shares if all the class B series 1 common shares convert into class A common shares.
Once transferred and converted into class A common shares, class B common shares will not be reissued. No class of common shares may be subdivided or combined unless the other class of common shares concurrently is subdivided or combined in the same proportion and in the same manner.
Transfer of Shares
Our board of directors may, in its discretion and without assigning any reason, refuse to register the transfer of a share that it is not fully paid. Our board of directors may also refuse to register the transfer of a share unless the instrument of transfer for such share is duly stamped (if required by law), is in respect of one class of shares, is in favor of less than five persons jointly and is accompanied by the relevant share certificate (if one has been issued) and such other evidence of the transferor’s right to make the transfer as our board of directors shall reasonably require. Any transfer of beneficial ownership of class B series 1 common shares or class B series 2 common shares not registered with the company will be null and void. For a period of three years following our initial public offering (August 16, 2007), holders of our class B series 2 common shares may not transfer less than all of the class B series 2 common shares that they own. Subject to these restrictions as are more fully set out in ourbye-laws a holder of shares in the company may transfer the title to all or any of such holder’s shares in the company by completing a form of transfer in such form as our board of directors may reasonably approve. The instrument of transfer must be signed by the transferor and transferee, although in the case of a fully paid share, our board of directors may accept the instrument signed only by the transferor. The board may also accept mechanically executed transfers.
142
Meetings of Shareholders
Under Bermuda law, a company is required to convene at least one general meeting of shareholders in each calendar year. Bermuda law provides that a special general meeting of shareholders may be called by the board of directors of a company and must be called upon the requisition of shareholders holding not less than 10% of thepaid-up capital of the company as of the date of deposit carries the right to vote. Bermuda law also requires that shareholders be given at least five days’ advance notice of a general meeting, but the accidental omission to give notice to, or thenon-receipt of a notice by, any person entitled to receive notice does not invalidate the proceedings at the meeting. Ourbye-laws provide that the chairman of the board of directors may call an annual general meeting or a special general meeting. Special general meetings of the shareholders may also be convened by our board of directors.
Under ourbye-laws, at least 10 clear days’ notice of an annual general meeting or a special general meeting must be given to each shareholder entitled to receive notice of such meeting. This notice requirement is subject to the ability to hold such meetings on shorter notice if notice is served pursuant to Bermuda law in the manner provided by the Companies Act 1981. The quorum required for a general meeting of shareholders is two or more persons present in person or by proxy and entitled to vote representing the holders of more than 45% of the aggregate voting power of the shares in the Company which by their terms carry the right to vote.
Any action required to be taken at a meeting of shareholders except in the case of the removal of auditors or directors may be taken without a meeting and without vote if a consent or consents in writing, setting forth the action so taken, is signed by the holders of issued and outstanding shares of the company, their proxy or corporate representative representing the percentage of votes required if the resolution had been voted on at a meeting of the shareholders. Notice of any resolution in writing shall be given to all shareholders entitled to attend a vote at a shareholder meeting.
Access to Books and Records and Dissemination of Information
Members of the general public have the right to inspect the public documents of a company available at the office of the Registrar of Companies in Bermuda. These documents include the company’s memorandum of association and any alteration to its memorandum of association. The shareholders have the additional right to inspect thebye-laws of the company, minutes of general meetings and the company’s audited consolidated financial statements, which audited financial statements must be presented at the annual general meeting unless waived in accordance with the provisions of the Companies Act 1981. The register of shareholders of a company is also open to inspection by shareholders and by members of the general public without charge. The register of shareholders is required to be open for inspection for not less than two hours in any business day (subject to the ability of a company to close the register of shareholders for not more than 30 days in a year in accordance with the procedure set out in the Companies Act 1981). A company is required to maintain its share register in Bermuda but may, subject to the provisions of the Companies Act 1981, establish a branch register outside Bermuda. A company is required to keep at its registered office a register of directors and officers that is open for inspection for not less than two hours in any business day by members of the general public without charge. Bermuda law does not, however, provide a general right for shareholders to inspect or obtain copies of any other corporate records.
Election and Removal of Directors
Ourbye-laws provide that our board of directors must consist of between five and eleven directors or such greater number as the board may determine. Our board of directors currently consists of twelve directors. Ourbye-laws provide that at least 40% (and, following the death or permanent incapacitation of Mr. Rubens Ometto Silveira Mello, at least 60%) of the members of our board of directors must be independent (as defined by the rules promulgated by (1) the U.S. Securities and Exchange Commission under the Exchange Act and (2) by the NYSE or any other principal securities exchange on which the class A common shares are so listed).
Our board of directors is divided into three classes that are, as nearly as possible, of equal size. Each class of directors is elected for a three-year term of office, and the terms are staggered so that the term of only one class of directors expires at each annual general meeting. There is also no requirement under Bermuda law or in ourbye-laws that our directors must retire at a certain age.
Any shareholder wishing to propose for election as a director a person who is not an existing director must give notice to the company of the intention to propose that person for election. The notice must be given not later than 90 days before the first anniversary of the last annual general meeting, or ten days after the notice of the general meeting, at which the directors will be elected, whichever is earlier.
143
Ourbye-laws provide that a director may be removed with or without cause by a majority of the other directors then in office. Ourbye-laws also provide that a director may be removed for cause by the affirmative vote of the holders of a majority of the shareholder votes cast at a general meeting at which a quorum is present, provided that notice is given to the director of the shareholders’ general meeting convened to remove the director. A director may be removed without cause upon the affirmative vote of the holders of a majority of the aggregate voting power of the shares of the Company which carry the right to vote on all matters submitted to shareholders, provided that notice is given to the director of the general meeting convened to remove the director, which notice must contain a summary of the facts justifying the removal and must be served on the director not less than fourteen days before the meeting. As long as a director has made a written request deposited at the registered office of the Company pursuant to the Companies Act 1981, a director is entitled to attend the general meeting and be heard at any general meeting called for his removal.
So long as a quorum remains in office, our board of directors may fill any casual vacancy occurring.
Proceedings of Board of Directors
Ourbye-laws provide that our business is to be managed and conducted by our board of directors. Bermuda law permits both individual and corporate directors and there is no requirement in ourbye-laws or Bermuda law that directors hold any of our shares.
The remuneration of our directors is determined by our board of directors, and there is no requirement that a specified number or percentage of “independent” directors must approve any such determination. Our directors may also be paid all travel, hotel and other expenses properly incurred by them in connection with our business or their duties as directors.
Provided that he or she discloses a direct or indirect interest in any contract or arrangement with us as required by Bermuda law, ourbye-laws provide that a director is entitled to be counted in the quorum, but may not vote in respect of any such contract or arrangement in which he or she is interested. Under Bermuda law, a director (including the spouse, children or any company (other than a company which is a holding company or a subsidiary of the company making the loan) of which such director, spouse or children own or control, directly or indirectly, more than 20% of the total capital or loan debt) cannot borrow from us without the consent of any shareholders holding in the aggregate not less than 90% of the total voting rights of all shareholders having the right to vote at any general meeting of the shareholders.
Waiver of Claims by Shareholders; Indemnification of Directors and Officers
Ourbye-laws contain a provision by virtue of which our shareholders waive any claim or right of action that they may have, both individually and on our behalf, against any director or officer in relation to any action or failure to take action by such director or officer, except in respect of any fraud or dishonesty of such director or officer. We understand that, in the opinion of the staff of the SEC, the operation of this provision as a waiver of the right to sue for violations of U.S. federal securities laws would likely be unenforceable in U.S. courts.
Ourbye-laws also indemnify our directors and officers in respect of their actions and omissions, except in respect of their fraud or dishonesty, which cannot be indemnified in accordance with the Companies Act 1981.
Amalgamations, Mergers and Other Business Combinations
Under Bermuda law, the amalgamation, merger or other business combination of a Bermuda company with another company (other than certain affiliated companies), unless thebye-laws otherwise provide requires the amalgamation or other business combination to be approved by a majority of the Bermuda company’s board of directors and by a majority of 75% of those voting at the general meeting of the Bermuda company. The quorum for the shareholder approval is two persons holding or representing at leastone-third of the issued shares of the Company.
Ourbye-laws provide that an amalgamation (but not a merger) or other business combination as defined in ourbye-laws (other than with a wholly-owned subsidiary) that has been approved by our board of directors must only be approved by a majority of the votes cast at a general meeting of our shareholders at which the quorum must be two persons representing the holders of more than 45% of the aggregate voting power of thepaid-up and outstanding shares carrying the right to vote. Any amalgamation or other business combination (as defined in ourbye-laws) not approved by our board of directors must be approved by resolution passed by 66 2/3% of all votes attaching to all shares then in issue entitling the holder to attend and vote on the resolution.
144
Specified Transactions Involving Interested Shareholders
Specified transactions include the following:
| | • | | any merger, consolidation or amalgamation of the Company with an interested shareholder; |
| | • | | any disposition or security arrangement with or for the benefit of any interested shareholder involving any of our assets, securities or commitments or those of any subsidiary or any interested shareholder that has an aggregate fair market value and/or involves aggregate commitments of U.S.$250 million or more or constitutes more than 10% of the book value of the total assets or 10% of the shareholders’ equity of the entity in question; |
| | • | | the adoption of any plan for our liquidation or dissolution or for the discontinuation into another jurisdiction, unless proposed or adopted independently of any interested shareholder; or |
| | • | | any reclassification of our shares or other securities, or recapitalization, or any merger, consolidation or amalgamation with any of our subsidiaries or any other transaction that has the effect of increasing the proportionate share of any class of shares beneficially owned by an interested shareholder. |
In addition to any affirmative vote required by law or ourbye-laws, a specified transaction with any interested shareholder will require the affirmative vote of not less than 66 2/3% of the aggregate voting power of the voting shares, voting together as a single class, excluding voting shares beneficially owned by any interested shareholder. Alternatively, a specified transaction may proceed with any affirmative vote required by law or ourbye-laws if the following principal conditions are satisfied in relation to common shares: (1) the approval of a majority of directors who are not affiliates of the interested shareholder; and (2) the aggregate amount of the cash and the fair market value as of the date of the consummation of the specified transaction of consideration other than cash to be received by the holder of common shares in such specified transaction shall be at least equal to the highest per share amount paid by the interested shareholder within atwo-year period immediately prior to the first public announcement of the proposed specified transaction; or in the transaction in which he or she became such an interested shareholder (whichever is higher) or, if higher, the closing sales prices of such shares on the NYSE on the announcement date for the specified transaction or on the date of the transaction in which he or she became such an interested shareholder.
For purposes of ourbye-laws, an “interested shareholder” includes, among others, any person who is or has publicly disclosed an intention to become the beneficial owner of shares representing 10% or more of our aggregate voting power of the voting shares.
Non-Competition Provision Applicable to Brazil
Ourbye-laws provide that we will operate and conduct business in Brazil exclusively through Cosan and its subsidiaries, and we will not compete, directly or indirectly, with Cosan in Brazil, unless otherwise approved by a majority of our independent directors.
Amendment of Memorandum of Association andBy-laws
Bermuda law provides that the memorandum of association of a company may be amended by a resolution passed at a general meeting of shareholders of which due notice has been given.
Ourbye-laws provide that nobye-law will be rescinded, altered or amended, unless it has been approved by a resolution of our board of directors and by a resolution of the shareholders. In the case of rescission, alteration or amendment to thebye-laws relating to interpretation, rights of shares, modification of rights, indemnity of directors and officers, amalgamations and other business combinations, specified transactions involving interested shareholders, our discontinuation into another jurisdiction,tag-along rights and amendment or alterations ofbye-laws, the required resolutions must include the affirmative vote of at least 66 2/3% of our directors then in office and holders of at least 66 2/3% of class A common shares and at least a majority of class B common shares then in issue entitling the holder to attend and vote on the resolution, with each class voting separately as a class. In the case of rescission, alteration or amendment to thebye-laws relating to the transmission of shares upon the death of a holder of class B series 1 shares, election of directors, the removal of directors, the increase of share capital and the alteration of share capital, the requisite affirmative votes are a majority of the directors then in office and holders of a majority of each of class A common shares and class B common shares then in issue entitling the holder to attend and vote on the resolution, with each class voting separately as a class.
145
Under Bermuda law, the holders of an aggregate of not less than 20% in par value of the company’s issued and outstanding share capital or any class thereof and or the holders of not less in the aggregate than 20% of the company’s debentures entitled to object to amendments to the memorandum of association have the right to apply to the Bermuda court for an annulment of any amendment of the memorandum of association adopted by shareholders at any general meeting, other than an amendment which alters or reduces a company’s share capital as provided in the Companies Act 1981.
Where such an application is made, the amendment becomes effective only to the extent that it is confirmed by the Bermuda court. An application for an annulment of an amendment of the memorandum of association must be made within 21 days after the date on which the resolution altering the company’s memorandum of association is passed and may be made on behalf of persons entitled to make the application by one or more of their number as they may appoint in writing for the purpose. No application may be made by shareholders voting in favor of the amendment.
Modification of Rights
While we have more than one class of shares and more than one series of class B common shares, the rights attaching to any class or series, unless otherwise provided for by the terms of issue of the relevant class or series, may be modified with the consent in writing of the holders or the approval of the votes cast at a general meeting representing not less than 66 2/3% of the aggregate voting power of the shares in issue and not less than 75% of the aggregate voting power of the issued shares of that class or series, as the case may be. The quorum for any such general meeting will be two or more persons holding or representing by proxyone-third of the voting power of the issued shares of the class or series, as the case may be. Ourbye-laws specify that the creation or issue of shares ranking equally with existing shares will not, unless expressly provided by the terms of issue of those new shares, vary the rights attached to existing shares.
Appraisal Rights and Shareholder Suits
Under Bermuda law, in the event of an amalgamation or merger of a Bermuda company with another company, a shareholder of the Bermuda company who is not satisfied that fair value has been offered for such shareholder’s shares may apply to the Bermuda court to appraise the fair value of those shares within one month of the giving of the notice of the shareholders’ meeting called to approve the amalgamation or merger.
Class actions and derivative actions are generally not available to shareholders under Bermuda law. Bermuda courts, however, may permit in certain circumstances a shareholder to commence an action in the name of a company to remedy a wrong to the company where the challenged act would allegedly be beyond the power of the company or illegal. In addition, consideration would be given by a Bermuda court to acts that would allegedly constitute a fraud against the minority shareholders or, for instance, where an act requires the approval of a greater percentage of the company’s shareholders’ voting power than that which actually approved it.
When the affairs of a company are being conducted in a manner which is oppressive or prejudicial to the interests of some or all of the shareholders, one or more shareholders may apply to a Bermuda court, which may make such order as it sees fit, including an order regulating the conduct of the company’s affairs in the future or ordering the purchase of the shares of any shareholders by other shareholders or by the company.
Capitalization of Profits and Reserves
Pursuant to ourbye-laws, our board of directors may capitalize any part of the amount of our share premium account or any reserve or fund which is available for distribution by either: (1) paying up unissued shares to be allotted on a pro rata basis to shareholders as fully paid bonus shares; or (2) paying up in full partly paid shares of those shareholders who would be entitled to such sums if they were distributed by way of dividend or other distribution (or partly in one way and partly the other) provided that a share premium account may be applied only in paying up of unissued shares to be issued to such shareholders as fully paid.
146
Untraced Shareholders
Ourbye-laws provide that our board of directors may forfeit any dividend or other monies payable in respect of any shares which remain unclaimed for six years. In addition, we are entitled to cease sending dividend warrants and checks by post or otherwise to a shareholder if such instruments have been returned undelivered to, or left uncashed by, such shareholder on at least two consecutive occasions or, following one such occasion, reasonable inquires have failed to establish the shareholder’s new address. This entitlement ceases if the shareholder claims a dividend or cashes a dividend check or a warrant.
Certain Provisions of Bermuda Law
We have been designated by the Bermuda Monetary Authority as anon-resident for Bermuda exchange control purposes. This designation allows us to engage in transactions only in currencies other than the Bermuda dollar, and there are no restrictions on our ability to transfer funds (other than funds denominated in Bermuda dollars) in and out of Bermuda or to pay dividends to U.S. residents who are holders of our common shares.
Pursuant to a Notice to the Public dated June 1, 2005, issued by the Bermuda Monetary Authority, the Bermuda Monetary Authority granted general permission for the issue and subsequent transfer of any shares of a Bermuda company to and betweennon-residents of Bermuda where any shares of the company are listed and remain so listed on an appointed stock exchange, which includes the NYSE. Approvals or permissions given by the Bermuda Monetary Authority do not constitute a guarantee by the Bermuda Monetary Authority as to our performance or our creditworthiness. Accordingly, in giving such permissions, the Bermuda Monetary Authority will not be liable for the financial soundness, performance or default of our business or for the correctness of any opinions or statements expressed in this annual report.
In accordance with Bermuda law, share certificates are only issued in the names of companies, partnerships or individuals. In the case of a shareholder acting in a special capacity (for example, as a trustee), certificates may, at the request of the shareholder, record the capacity in which the shareholder is acting. Notwithstanding such recording of any special capacity, we are not bound to investigate or see to the execution of any such trust. We will take no notice of any trust applicable to any of our shares, whether or not we have been notified of such trust.
Registrar or Transfer Agent
A register of holders of the class A common shares and class B common shares and any other issued share capital is maintained by Compass Administration Services Ltd. in Bermuda, and a branch register is maintained in the United States by Mellon Investor Services LLC, which serves as branch registrar and transfer agent.
Anti-takeover Effects of ourBy-laws
Ourbye-laws contain provisions that could make it more difficult for a third party to acquire us without the consent of our board of directors. These provisions provide, among other things, for:
| | • | | a classified board of directors with staggered three-year terms; |
| | • | | restrictions on the time period in which directors may be nominated; |
| | • | | the affirmative vote of a majority of our directors then in office and a majority of all votes cast at a general meeting or, if not approved by a majority of the directors in office, at least 66 2/3% of all votes attaching to all shares then in issue for amalgamation and other business combination transactions; and |
| | • | | thetag-along rights described under“—Tag-along Rights.” |
On September 20, 2017, we entered into an indenture with U.S. Bank National Association as trustee, principal paying agent, transfer agent and registrar in connection with our 5.950% senior notes due 2024.
Except as described above, for the two years immediately preceding the publication of this annual report, we were not a party to any material contract outside the ordinary course of business.
147
On April 17, 2018, the board of directors of the Company approved the voluntary termination of its BDR program, with the consequent delisting and suspension of BDR trading in B3, as well as the cancelation of its registration as a category “A” foreign issuer with the CVM, in accordance with CVM Rule 480/09, as amended.
There are no legislative or other legal provisions currently in force in Bermuda or arising under ourby-laws that restrict the payment of dividends to holders of Cosan Limited shares by reason of such holders not being resident in Bermuda. There are no limitations, either under the laws of Bermuda or in theby-laws, on the right ofnon-Bermuda nationals to hold or vote Cosan Limited shares.
U.S. Federal Income Tax Considerations
The following is a description of the material U.S. federal income tax consequences of owning and disposing of our common shares. It does not purport to be a comprehensive description of all of the tax considerations that may be relevant to a particular person’s decision to hold the securities. This discussion applies to you only if you are a U.S. Holder (as defined below) that holds our common shares as capital assets for U.S. federal income tax purposes.
This discussion does not describe all of the tax consequences that may be relevant to you in light of your particular circumstances, including alternative minimum tax consequences, the potential application of the provisions of the Internal Revenue Code of 1986, as amended, or the “Code,” known as the Medicare contribution tax and differing tax consequences applicable to you if you are, for instance:
| | • | | a financial institution; |
| | • | | a regulated investment company; |
| | • | | a dealer or electing trader in securities that uses amark-to-market method of tax accounting; |
| | • | | holding our common shares as part of a “straddle,” integrated transaction or similar transaction; |
| | • | | a person whose functional currency for U.S. federal income tax purposes is not the U.S. dollar; |
| | • | | a partnership for U.S. federal income tax purposes; |
| | • | | a person that owns or is deemed to own 10% or more of our stock (by vote or value); |
If you are a partnership for U.S. federal income tax purposes holding our common shares, the U.S. federal income tax treatment of your partners will generally depend on the status of the partners and the activities of your partnership. Partnerships holding our common shares and partners in such partnerships should consult their tax advisers as to the particular U.S. federal income tax consequences of holding and disposing of our common shares.
This discussion is based on the Code, administrative pronouncements, judicial decisions and final, temporary and proposed Treasury regulations, all as of the date hereof, any of which is subject to change, possibly with retroactive effect. Please consult your tax adviser concerning the U.S. federal, state and local andnon-U.S. tax consequences of owning and disposing of our common shares in your particular circumstances.
As used herein, the term “U.S. Holder” means a beneficial owner of our common shares that is, for U.S. federal income tax purposes:
| | • | | a citizen or individual resident of the United States; |
| | • | | a corporation, or other entity taxable as a corporation, created or organized in or under the laws of the United States or any state therein or the District of Columbia; or |
| | • | | an estate or trust the income of which is subject to U.S. federal income taxation regardless of its source. |
This discussion generally assumes that we are not, and will not become, a passive foreign investment company, as described below.
148
Taxation of Distributions
Distributions paid on our common shares, other than certainpro rata distributions of common shares, will be treated as dividends to the extent paid out of our current or accumulated earnings and profits (as determined under U.S. federal income tax principles). Because we do not expect to determine our earnings and profits in accordance with U.S. federal income tax principles, you should expect that a distribution will generally be reported as a dividend. Subject to applicable limitations, dividends paid to certainnon-corporate U.S. Holders will be eligible for taxation as “qualified dividend income” and therefore will be taxable at rates applicable to long-term capital gains, provided that certain holding period and other requirements are satisfied. The amount of the dividend will be treated as foreign-source dividend income to you and will not be eligible for the dividends-received deduction generally allowed to U.S. corporations under the Code.
Dividends will be included in your income on the date you receive them.
Sale or Other Disposition of Common Shares
For U.S. federal income tax purposes, gain or loss you realize on the sale or other disposition of our common shares will be capital gain or loss, and will be long-term capital gain or loss if you held those shares for more than one year at the time of disposition. The amount of gain or loss will be equal to the difference between your tax basis in the shares disposed of and the amount realized on the disposition. The gain or loss will generally be U.S.-source gain or loss for foreign tax credit purposes.
Passive Foreign Investment Company Rules
In general, anon-U.S. corporation will be a “passive foreign investment company,” or “PFIC,” for U.S. federal income tax purposes for any taxable year in which, after applying certain look-through rules, either (1) at least 75% of its gross income is “passive income” or (2) at least 50% of the average quarterly value of its assets consists of assets that produce “passive income” or are held for the production of “passive income.” Passive income for this purpose generally includes dividends, interest, royalties, rents and gains from foreign currency, securities and certain commodities transactions. Based on the current composition of our income and the composition of our assets, we do not believe that we were a PFIC for our taxable year ended December 31, 2018. However, because PFIC status depends upon the composition of our income and assets and the market value of our assets (including, among others, goodwill and less than 25% owned equity investments) from time to time, we cannot assure you that we will not be considered a PFIC for any taxable year.
If we were a PFIC for any taxable year during which you held our common shares, gain recognized by you on a sale or other disposition (including certain pledges) of the common shares would be allocated ratably over your holding period for the common shares. The amounts allocated to the taxable year of the sale or other disposition and to any year before we became a PFIC would be taxed as ordinary income. The amount allocated to each other taxable year would be subject to tax at the highest rate on ordinary income in effect for individuals or corporations, as appropriate for that taxable year, and an interest charge would be imposed on the resulting tax liability. Further, to the extent any distribution in respect of our common shares exceeded 125% of the average of the annual distributions on common shares received by you during the preceding three years or your holding period, whichever was shorter, that distribution would be subject to taxation in the same manner as gain, described immediately above. Certain elections might be available that would result in alternative treatments (such asmark-to-market treatment) of our common shares. You should consult your tax adviser to determine whether these elections would be available and, if so, what the consequences of the alternative treatments would be in your particular circumstances.
In addition, if we were a PFIC for the taxable year in which we paid a dividend or for the prior taxable year, the favorable tax rates applicable to long-term capital gains discussed above with respect to dividends paid tonon-corporate U.S. Holders would not apply.
If a U.S. Holder owns our common shares during any year in which the Company is a PFIC, the U.S. Holder generally must file annual reports containing such information as the U.S. Treasury may require on IRS Form 8621 (or any successor form) with respect to the Company, generally with the U.S. Holder’s federal income tax return for that year.
U.S. Holders should consult their tax advisers regarding the potential application of the PFIC rules.
149
Information Reporting and Backup Withholding
Payments of dividends and sales proceeds that are made within the United States or through certain U.S.-related financial intermediaries generally are subject to information reporting and backup withholding unless (1) you are a corporation or other exempt recipient or (2) in the case of backup withholding, you provide a correct taxpayer identification number and certify that you are not subject to backup withholding.
The amount of any backup withholding from a payment to you will be allowed as a credit against your U.S. federal income tax liability and may entitle you to a refund, provided that the required information is timely furnished to the Internal Revenue Service.
Bermuda Tax Considerations
The Company has received an assurance from the Ministry of Finance granting an exemption, until March 31, 2035, from the imposition of tax under any applicable Bermuda law computed on profits or income or computed on any capital asset, gain or appreciation, or any tax in the nature of estate duty or inheritance tax, provided that such exemption shall not prevent the application of any such tax or duty to such persons as are ordinarily resident in Bermuda and shall not prevent the application of any tax payable in accordance with the Land Tax Act 1967 or otherwise payable in relation to land in Bermuda leased to the Company.
| F. | Dividends and Paying Agents |
Not applicable.
Not applicable.
Statements contained in this annual report as to the contents of any contract or other document referred to are not necessarily complete, and each of these statements is qualified in all respects by reference to the full text of such contract or other document filed as an exhibit hereto. A copy of the complete annual report including the exhibits and schedules filed herewith may be inspected without charge at the public reference facilities maintained by the SEC at 100 F Street NE., Washington, D.C., and at the SEC’s regional offices located at 233 Broadway, New York, N.Y., 10279 and North Western Atrium Center, 500 West Madison Street, Suite 1400, Chicago, Illinois 60661-2511. Copies of such materials may be obtained by mail from the Public Reference Section of the SEC, 100 F Street NE., Washington, D.C., at prescribed rates. Such reports and other information may also be inspected at the offices of the New York Stock Exchange, 11 Wall Street, New York, N.Y. 10005, on which our class A common shares are listed. In addition, the SEC maintains a website that contains information which we have filed electronically with the SEC, including our annual reports, periodic reports and other filings, which can be accessed over the Internet at http://www.sec.gov.
We are subject to the information and periodic reporting requirements of the Securities Exchange Act of 1934 as amended, and, in accordance therewith, file periodic reports and other information with the SEC. However, as a foreign private issuer, we are exempt from the rules under the Exchange Act relating to the furnishing and content of proxy statements and relating to short-swing profits reporting and liability.
Not applicable.
150
| Item 11. | Quantitative and Qualitative Disclosures About Market Risk |
Risk Management
We consider market risk to be the potential loss arising from adverse changes in market rates and prices. The company, its subsidiaries and jointly-controlled entities are exposed to market risks, chief of which are: (1) credit risk; (2) liquidity risk; (3) commodities risk; (4) interest rate risk; and (5) foreign currency exchange rate risk. In order to manage its market risks, the Company has adopted policies and procedures which establish limits and monitor risk exposure and counterparties and approve financial instruments. Risk and financial instrument management activities are carried out through the definition of strategies, establishment of control systems and determination of limits to exposure to market risks. We periodically review our exposure to market risks and determine at the senior management level how to manage and reduce the impact of these risks.
The Company uses derivatives solely to manage market risk, especially commodity price and foreign exchange rate fluctuations. Although the value of these hedge instruments varies, these variations are usually offset by the value of the related hedged item. The parties to these agreements are mainly trade boards and trading companies in the case of futures, options and price setting, and major financial institutions in the case of foreign exchange derivatives and interest rate swaps. The company does not use derivatives or other hedge instruments for speculative purposes.
As a result, we do not believe that we are subject to any material credit risk arising from these contracts, and accordingly, we do not anticipate any material credit related losses.
Credit Risk
Credit risk is managed through specific rules concerning client acceptance which require credit rating checks and limits for customer exposure, applicable to all subsidiaries and jointly-controlled entities. Raízen Energia generally requires a letter of credit from a reputable bank for most of our sugar export sales. We do not believe that we are subject to any material credit risk and we do not anticipate any material credit-related losses. Management believes that any credit risk is covered by the allowance for doubtful accounts recorded in our statement of financial position.
Liquidity Risk
Liquidity risk arises where we may encounter difficulties in meeting the obligations associated with our financial liabilities that are settled by delivering cash or another financial asset. Our approach to managing liquidity is to ensure, as far as possible, that we will have sufficient liquidity to meet our liabilities when they are due, under both normal and stressed conditions, without incurring unacceptable losses or risking damage to our reputation. Please see note 32 to our audited consolidated financial statements for measures on which our management has been working to enable us to honor our commitments.
Commodities Risk
Mainly applicable to Raízen Energia, agricultural commodity prices and supply levels change according to unpredictable factors such as the weather, investments, government programs and policies and changes in world demand, among others.
Raízen conducts sensitivity tests to estimate its exposure to these risks and uses derivatives to mitigate its exposure to sugar price oscillation on the international market. Derivative operations allow the Company to ensure an average margin for future sales. Raízen actively manages its open positions and monitors the result of these activities on a daily basis through effectivemark-to-market controls and price impact simulations so that it may adjust targets and strategies due to changes in market conditions.
For risk management purposes and to evaluate the overall level of commodity price exposure, Raízen further reduces its exposure to commodity market risk related to the sugar and ethanol produced from sugarcane that is purchased from growers and sugarcane harvested from leased land, as both costs are linked to TSR. The price of sugarcane supplied by growers or the lease payments incurred to produce sugarcane harvested by Raízen from leased land is indexed to the market price of sugar and ethanol, which provides a partial natural hedge to domestic sugar and ethanol sales price exposure.
The table below provides information about the Company’s sugar derivative contracts that are sensitive to changes in commodity prices, specifically sugar prices as of December 31, 2018. For the derivative contracts the table presents the notional amounts in tons, the weighted average contract prices, and the total U.S. dollar contract amount by expected maturity dates.
151
Price Risk—Commodities Derivatives Opened as at December 31, 2018
| | | | | | | | | | | | | | | | | | | | | | | | | | | | |
Derivatives | | Purchased
/ Sold | | | Market | | | Agreement | | | Maturity date | | | Notional | | | Notional | | | Fair value | |
| | | | | | | | | | | | | | | (unit) | | | (R$ thousand) | |
Future | | | Sold | | | | NYSE LIFFE | | | | Sugar#5 | | | | Feb-19 to Jul-19 | | | | 5,350 | | | | 153,984 | | | | (62 | ) |
Future | | | Sold | | | | ICE | | | | Sugar#11 | | | | Feb-19 to Sep-20 | | | | 1,889,290 | | | | 2,171,039 | | | | 160,006 | |
Options | | | Sold | | | | ICE | | | | Sugar#11 | | | | Feb-19 toSep-20 | | | | 1,107 | | | | 29 | | | | (28,956 | ) |
Options | | | Sold | | | | OTC | | | | Sugar#11 | | | | Apr-19 to Sep-19 | | | | — | | | | — | | | | 1,544 | |
| | | | | | | | | | | | | | | | | | | | | | | | | | | | |
Sub-total of sugar future sold | | | | | | | | | | | | | | | | | | | 1,895,747 | | | | 2,325,052 | | | | 132,532 | |
Future | | | Purchased | | | | NYSE LIFFE | | | | Sugar#5 | | | | Feb-19 toJul-19 | | | | (5,400 | ) | | | (155,837 | ) | | | 44 | |
Future | | | Purchased | | | | ICE | | | | Sugar#11 | | | | Feb-19 toFeb-20 | | | | (514,222 | ) | | | (562,484 | ) | | | (29,040 | ) |
Options | | | Purchased | | | | ICE | | | | Sugar#11 | | | | Feb-19 toSep-20 | | | | (1,006 | ) | | | (56 | ) | | | 33,470 | |
| | | | | | | | | | | | | | | | | | | | | | | | | | | | |
Sub-total of sugar future purchased | | | | | | | | | | | | | | | | | | | (520,628 | ) | | | (718,377 | ) | | | 4,474 | |
Sub-total of sugar future | | | | | | | | | | | | | | | | | | | 1,375,119 | | | | 1,606,675 | | | | 137,006 | |
| | | | | | | | | | | | | |
Future | | | Sold | | | | B3 | | | | Ethanol | | | | Jan-19 | | | | 10,320 | | | | 17,857 | | | | (112 | ) |
Future | | | Sold | | | | CHGOETHNL | | | | Ethanol | | | | Jan-19 toDec-19 | | | | 1,217,465 | | | | 1,052,320 | | | | 269,419 | |
Future | | | Sold | | | | NYMEX | | | | Ethanol | | | | Jan-19 toDec-19 | | | | 121,000 | | | | 232,508 | | | | (7,390 | ) |
Options | | | Sold | | | | OTC | | | | Ethanol | | | | Jan-19 | | | | 665,941 | | | | 64,028 | | | | (66,561 | ) |
Options | | | Sold | | | | CHGOETHNL | | | | Ethanol | | | | Feb-19 | | | | 7,949 | | | | 2,633 | | | | 64 | |
| | | | | | | | | | | | | | | | | | | | | | | | | | | | |
Sub-total of ethanol future sold | | | | | | | | | | | | | | | | | | | 2,022,675 | | | | 1,369,346 | | | | 195,420 | |
Future | | | Purchased | | | | B3 | | | | Ethanol | | | | Jan-19 | | | | (2,550 | ) | | | (4,413 | ) | | | 33 | |
Future | | | Purchased | | | | NYMEX | | | | Ethanol | | | | Jan-19 toDec-19 | | | | (110,600 | ) | | | (212,279 | ) | | | 8,669 | |
Future | | | Purchased | | | | CHGOETHNL | | | | Ethanol | | | | Jan-19 toDec-19 | | | | (1,284,639 | ) | | | (1,092,371 | ) | | | (276,768 | ) |
Options | | | Purchased | | | | OTC | | | | Ethanol | | | | Jan-19 | | | | (600,024 | ) | | | (51,837 | ) | | | 53,965 | |
Options | | | Purchased | | | | CHGOETHNL | | | | Ethanol | | | | Jan-19 toFeb-19 | | | | (42,927 | ) | | | (33,500 | ) | | | (35 | ) |
| | | | | | | | | | | | | | | | | | | | | | | | | | | | |
Sub-total of ethanol future purchased | | | | | | | | | | | | | | | | | | | (2,040,740 | ) | | | (1,394,400 | ) | | | (214,136 | ) |
Physical fixed | | | Sold | | | | CHGOETHNL | | | | Ethanol | | | | Jan-19 toDec-19 | | | | 1,607,529 | | | | 2,921,639 | | | | 82,473 | |
Physical fixed | | | Purchased | | | | CHGOETHNL | | | | Ethanol | | | | Jan-19 toDec-19 | | | | (2,278,747 | ) | | | (3,687,483 | ) | | | 6,495 | |
| | | | | | | | | | | | | | | | | | | | | | | | | | | | |
Sub-total of physical fixed | | | | | | | | | | | | | | | | | | | (671,218 | ) | | | (765,844 | ) | | | 88,968 | |
Sub-total of ethanol future and physical fixed | | | | | | | | | | | | | | | | | | | (689,283 | ) | | | (790,898 | ) | | | 70,252 | |
| | | | | | | | | | | | | |
Future | | | Purchased | | | | OTC | | | | Gasoline | | | | Jan-19 toOct-19 | | | | (346,173 | ) | | | (493,152 | ) | | | (54,843 | ) |
| | | | | | | | | | | | | | | | | | | | | | | | | | | | |
Sub-total of gasoline future purchased | | | | | | | | | | | | | | | | | | | (346,173 | ) | | | (493,152 | ) | | | (54,843 | ) |
Future | | | Sold | | | | NYMEX | | | | Gasoline | | | | Jan-19 toJun-19 | | | | 647,782 | | | | 1,181,286 | | | | 340,124 | |
Options | | | Sold | | | | OTC | | | | Gasoline | | | | Sep-18 to Mar-20 | | | | 702 | | | | 2,720 | | | | 45,250 | |
| | | | | | | | | | | | | | | | | | | | | | | | | | | | |
Sub-total of future gasoline sold | | | | | | | | | | | | | | | | | | | 648,484 | | | | 1,184,006 | | | | 385,374 | |
Sub-total of gasoline future | | | | | | | | | | | | | | | | | | | 302,311 | | | | 690,854 | | | | 330,531 | |
| | | | | | | | | | | | | |
Physical fixed | | | Purchased | | | | CCEE/OTC | | | | Energy | | | | Jan-19 toDec-21 | | | | 4,999 | | | | 680,296 | | | | (984,941 | ) |
Physical fixed | | | Sold | | | | CCEE/OTC | | | | Energy | | | | Jan-19 toDec-21 | | | | (4,999 | ) | | | (904,383 | ) | | | 994,888 | |
| | | | | | | | | | | | | | | | | | | | | | | | | | | | |
Sub-total of energy future and physical fixed | | | | | | | | | | | | | | | | | | | — | | | | (224,087 | ) | | | 9,947 | |
Future | | | Sold | | | | NYMEX | | |
| Heating oil
/ Gasoline |
| | | Jan-19 | | | | 230,781 | | | | 399,237 | | | | 24,054 | |
| | | | | | | | | | | | | | | | | | | | | | | | | | | | |
Sub-total of heating oil and gasoline future sold | | | | | | | | | | | | | | | | | | | 230,781 | | | | 399,237 | | | | 24,054 | |
Sub-total of heating oil, gasoline and energy | | | | | | | | | | | | | | | | | | | 533,092 | | | | 866,004 | | | | 364,532 | |
| | | | | | | | | | | | | |
Net exposure to commodity derivatives in December, 2018 | | | | | | | | | | | | | | | | | | | | | | | 1,681,781 | | | | 571,790 | |
| | | | | | | | | | | | | | | | | |
Interest Rate Risk
We have fixed and floating rate indebtedness and, therefore, we are exposed to market risk as a result of changes in interest rates. See “Item 5. Operating and Financial Review and Prospects—B. Liquidity and Capital Resources—Indebtedness” for further information.
Our interest rate risk refers to the impact of an increase in the LIBOR (London Interbank Offered Rate) indexed interest rate, TJLP (Long-term Interest Rate), TR (Reference Interest Rate),IGP-M (General Market Price Index), IPCA (Consumer Price Index) and CDI (Interbank Deposit Certificate) indexed debt on the Company’s finance results.
As of December 31, 2018, 14.13%, or R$3,189.1 million (16%, or R$3,469.0 million as of December 31, 2017) of our consolidated total debt outstanding was fixed rate debt.
152
The majority of our debt, except the jointly-controlled subsidiary Raízen, is dollar-denominated with fixed interest rates orreal-denominated debts indexed to the CDI or TJLP. Most of our outstanding debt is linked to the CDI note. We have a substantial amount of cash and cash equivalents and marketable securities indexed to the CDI, which provides a partial natural hedge to our interest rate exposure of ourreal-denominated debts.
Based on the foregoing, we believe that as of December 31, 2018, a hypothetical 10% increase in all interest rates would increase our financial expenses by R$79.2 million per year based on the net financial expenses we recorded in our consolidated statement of profit or loss for the fiscal year ended December 31, 2018.
Foreign Currency Exchange Rate Risk
The foreign exchange variations to which we are exposed are mainly related to our outstanding perpetual notes in an aggregate amount of U.S.$500 million. We use derivatives to hedge the cash flows for payment of part of the interest on this debt against a possible appreciation of U.S. dollar against thereal. In addition, basic oil imports for the lubricants business are also exposed to foreign exchange variations, hedged by derivatives on acase-by-case basis.
A significant portion of the revenue of the jointly-controlled subsidiary Raízen Energia is U.S. dollar denominated. Most of Raízen Energia’s costs are denominated inreais and therefore, when thereal appreciates against the U.S. dollar, its operating margins are adversely affected. A considerable part of Raízen’s debt is also denominated in dollars exposing it to the risk of variations in thereal to U.S. dollar exchange rate (derivative financial instruments are used to hedge the cash flows for payment of interest of these debts).
Raízen Energia has foreign exchange derivatives in order to mitigate its exposure to the effect of foreign exchange variations on its sugar and ethanol export revenues, combined with cash outlays to cover its debt commitments in foreign currency, mainly the U.S. dollar. The exchange rate derivatives together with the sugar price derivatives allow Raízen to ensure an average margin from future sales. Raízen actively manages open positions, and the results of these activities are monitored on a daily basis through effectivemark-to-market controls and price impact simulations that allow Raízen to adjust targets and strategies as a result of changes in market conditions. Raízen uses financial derivative instruments to hedge foreign exchange risk.
At December 31, 2018, our foreign exchange exposure, net was R$1,390.2 million (R$1,333 million in the fiscal year ended December 31, 2017) which were represented by cash and cash equivalents, loans and derivatives contracts as disclosed in note 21 of our consolidated financial statements.
As a measure of our market risk with respect to our foreign currency exposure, a hypothetical 10% appreciation of therealagainst the U.S. dollar would increase in profit for the year by R$139 million per year, based on the foreign exchange exposure for the fiscal year ended December 31, 2018, before considering the effects on U.S. dollar derivative contracts and other dollar denominated assets and liabilities, as set forth below:
| | | | | | | | | | | | |
U.S. dollar financial instruments outstanding at December 31, 2018: | | Notional
amount/
Quantity | | | Estimated
Fair value
Asset (Liability) | | | Foreign Exchange
Gain/ Loss – 10%
FX rate Decrease | |
| | | (in thousands ofreais) | |
Denominated debt | | | 13,791,662 | | | | 13,791,662 | | | | 1,379,166 | |
Denominated receivables | | | (51,734 | ) | | | (51,734 | ) | | | (5,173 | ) |
Foreign exchange exposure, net | | | 1,390,205 | | | | 1,390,205 | | | | 139,021 | |
| Item 12. | Description of Securities other than Equity Securities |
Not applicable.
153
PART II
| Item 13. | Defaults, Dividend Arrearages and Delinquencies |
None.
| Item 14. | Material Modifications to the Rights of Security Holders |
None.
| Item 15. | Controls and Procedures |
(a) Disclosure Controls and Procedures
As of December 31, 2018, under management’s supervision and with its participation, including that of our Chief Executive Officer and Chief Financial Officer, we performed an evaluation of our disclosure controls and procedures (as defined in Rule13a-15(e) under the Securities Exchange Act of 1934).
Based on this evaluation, our Chief Executive Officer and Chief Financial Officer concluded that our disclosure controls and procedures were effective as of December 31, 2018 to ensure that information required to be disclosed under the Exchange Act is recorded, authorized, processed, summarized and reported within the time periods specified in the Commission’s rules and forms, and the information required to be disclosed is accumulated and communicated, in order to allow timely decisions regarding required disclosure.
(b) Management’s Annual Report on Internal Control over Financial Reporting
Management is responsible for establishing and maintaining adequate internal control over financial reporting, as defined in Rule13a-15(f) under the Securities Act of 1934. Management conducted an assessment of the effectiveness of internal control over financial reporting based on recommendations and correlated layers established in the Internal Controls Integrated Framework issued by the Committee of Sponsoring Organizations of the Treadway Commission, or “COSO 2013.” Based on this assessment and those criteria, management concluded that internal control over financial reporting was effective as of December 31, 2018.
Because of its inherent limitations, internal control over financial reporting may not prevent or detect misstatements. Therefore even those systems determined to be effective can provide only reasonable assurance with respect to financial statement preparation and presentation. Also, projections of any evaluation of effectiveness to future periods are subject to the risk that controls may become inadequate because of changes in conditions.
(c) Attestation Report of the Registered Public Accounting Firm
The effectiveness of the internal control over financial reporting, as of December 31, 2018, has been audited by KPMG, an independent registered public accounting firm, whose attestation report on such matter appears on page F-5 of our audited financial statements.
(d) Changes in Internal Control over Financial Reporting
There was no change in our internal control over financial reporting that occurred during the period covered by this annual report that has materially affected, or is reasonably likely to materially affect, our internal control over financial reporting.
| Item 16A. | Audit Committee Financial Expert |
Audit Committee
We have an audit committee responsible for advising the board about the selection of independent auditors, reviewing the scope of the audit, validating other allowed services provided by our independent auditors, and evaluating our internal controls on a steady basis. The members of our audit committee are Messrs. José Alexandre Scheinkman (chairman), Mailson Ferreira da Nóbrega, and Richard Steere Aldrich Junior.
These members are independent, and our board of directors has determined that both José Alexandre Scheinkman and Mailson Ferreira da Nóbrega are “Audit Committee Financial Experts” in accordance with SEC rules and regulations.
154
NYSE Rule 303A.10 provides that each U.S. listed company must adopt and disclose a code of business conduct and ethics for directors, officers and employees and promptly disclose any waivers of the code for directors or executive officers. Although not required under Bermuda law, the Company has adopted a code of business conduct and ethics for directors, officers and employees as provided for in NYSE Rule 303A.10, which has been filed with the SEC. See Exhibit 11.1.
| Item 16C. | Principal Accountant Fees and Services |
The following table describes the total amount billed to us by KPMG for services performed during the fiscal years ended December 31, 2018 and 2017:
| | | | | | | | |
| | | At December 31, 2018 | | | At December 31, 2017 | |
| | | (in thousands ofreais) | |
Audit fees | | | 6,629.2 | | | | 5,450.9 | |
Audit related fees | | | 497.5 | | | | 1,737.4 | |
All other fees | | | 421.8 | | | | 169.3 | |
| | | | | | | | |
Total consolidated audit fees | | | 7,548.5 | | | | 7,357.6 | |
| | | | | | | | |
Audit Fees
Audit fees are fees billed for the audit of our annual consolidated financial statements and for the reviews of our quarterly consolidated financial statements furnished on Form6-K.
Audit Related Fees
Audit related fees correspond to services provided in connection with assistance related to review of documents to be filed with local and foreign regulatory bodies, including documents regarding compliance with legislation and regulations, audit of specific financial statements and prospectus review, due diligence activities, assurance of special purpose reports, and other previously agreed-upon procedures.
Other Fees
Other fees refer to other assurance services regarding the review of comfort letters in connection with our bond issuances.
Pre-Approval Policies and Procedures
Our audit committee approves all audit, audit-related services, tax services and other services provided by our principal accountants. Any services provided by our principal accountants that are not specifically included within the scope of the audit must bepre-approved by the board of directors in advance of any engagement. The board of directors is permitted to approve certain fees for audit-related services, tax services and other services pursuant to ade minimis exception prior to the completion of the audit engagement.
| Item 16D. | Exemptions from the Listing Standards for Audit Committees |
Not applicable.
155
| Item 16E. | Purchases of Equity Securities by the Issuer and Affiliated Purchasers |
The following table reflects purchases of our equity securities by us or our affiliates in 2018 and the first quarter of 2019.
| | | | | | | | | | | | | | | | |
Months | | Total Number of
Class A Common
Shares Purchased(1) | | | Average Price
Paid per Class A
Common Share
in U.S.$(1) | | | Total Number of
Class A Common
Shares Purchased
as Part of Publicly
Announced Plans
or Programs | | | Maximum Number
(or Approximate
Dollar Value)
of Class A Common
Shares that May
Yet Be Purchased
Under the Plans
or Programs | |
January 2018 | | | — | | | | — | | | | — | | | | — | |
February 2018 | | | — | | | | — | | | | — | | | | — | |
March 2018 | | | — | | | | — | | | | — | | | | — | |
April 2018 | | | — | | | | — | | | | — | | | | — | |
May 2018 | | | — | | | | — | | | | — | | | | — | |
June 2018 | | | — | | | | — | | | | — | | | | — | |
July 2018 | | | — | | | | — | | | | — | | | | — | |
August 2018 | | | — | | | | — | | | | — | | | | — | |
September 2018 | | | — | | | | — | | | | — | | | | — | |
October 2018 | | | — | | | | — | | | | — | | | | — | |
November 2018 | | | — | | | | — | | | | — | | | | — | |
December 2018 | | | — | | | | — | | | | — | | | | — | |
January 2019 | | | 14,228,134 | | | | 8.88 | | | | — | | | | — | |
February 2019 | | | — | | | | — | | | | — | | | | — | |
March 2019 | | | — | | | | — | | | | — | | | | — | |
| | | | | | | | | | | | | | | | |
Total | | | 14,228,134 | | | | 8.88 | | | | — | | | | — | |
| | | | | | | | | | | | | | | | |
| (1) | On January 3, 2019, we acquired 14,228,134 Class A common shares pursuant to a tender offer at a purchase price of U.S.$8.88 per share, for a total cost of approximately U.S.$126.3 million, excluding fees and other related expenses. These shares represented 9.6% of the issued and outstanding Class A common stock of Cosan Limited as of December 31, 2018. The shares accepted for purchase included 2,966,873 additional shares that Cosan Limited elected to purchase pursuant to its right to purchase up to an additional 2% of its outstanding Class A common shares. After giving effect to the purchase, we had 134,115,534 outstanding Class A common shares remaining. For further information on our tender offer, please see “Item 4. Information on the Company—A. History and Development of the Company—History” and “Item 7. Major Shareholders and Related Party Transactions—A. Major Shareholders—Cosan Limited.” |
| Item 16F. | Change in Registrant’s Certifying Accountant |
Not applicable.
| Item 16G. | Corporate Governance |
For a comparison of the significant differences between our corporate governance practices and the NYSE Corporate Governance Standards, please see “Item 6. Directors, Senior Management and Employees—C. Summary of Significant Differences of Corporate Governance Practices.”
| Item 16H. | Mine Safety Disclosure |
Not applicable.
156
PART III
| Item 17. | Financial Statements |
We have responded to Item 18 in lieu of responding to this Item.
| Item 18. | Financial Statements |
See our audited consolidated financial statements beginning on pageF-1.
We are filing the following documents as part of this annual report on Form20-F:
| | |
| 1.1 | | Memorandum of Association (incorporated by reference to Exhibit 3.1 to our amended registration statement filed on FormF-1/A with the Securities and Exchange Commission on August 9, 2007). |
| 1.2 | | Bye-laws (incorporated by reference to Exhibit 3.2 to our amended registration statement filed on FormF-1/A with the Securities and Exchange Commission on August 9, 2007). |
| 2.1 | | Indenture dated November 5, 2010 among Cosan Overseas Limited, Cosan S.A. Indústria e Comércio, The Bank of New York Mellon, as Trustee, New York Paying Agent, Transfer Agent and Registrar, The Bank of New York Mellon (London Branch), as London Paying Agent and The Bank of New York Mellon (Luxembourg) S.A., as Paying Agent and Transfer Agent (incorporated by reference to Exhibit 2.5 of our annual report on Form20-F for the year ended March 31, 2011). |
| 2.2 | | Indenture dated June 20, 2016 among Cosan Luxembourg S.A., Cosan S.A. Indústria e Comércio, Deutsche Bank Trust Company, as Trustee, New York Paying Agent, Transfer Agent and Registrar and Deutsche Bank Luxembourg S.A., as Luxembourg Paying Agent (incorporated by reference to Exhibit 2.2 of our annual report on Form20-F for the year ended December 31, 2016). |
| 2.3 | | Indenture dated September 20, 2017 among Cosan Limited and U.S. Bank National Association, as Trustee, Principal Paying Agent, Registrar and Transfer Agent (incorporated by reference to Exhibit 2.3 of our annual report on Form20-F for the year ended December 31, 2017). |
| 4.1 | | Agreement for the Sale and Purchase of all of the Member Interests in ParentCo-Operative 1 and ParentCo-Operative 2 dated April 23, 2008, between ExxonMobil International Holdings B.V., as vendor, and the registrant’s subsidiaries Cosan S.A. Indústria e Comércio and Usina da Barra S.A. Açúcar e Álcool, as purchasers* (incorporated by reference to Exhibit 4.3 of our Amendment to our Current Report filed on Form6-K/A on June 10, 2009). |
| 4.2 | | Framework Agreement dated August 25, 2010 among Cosan S.A. Indústria e Comércio, Cosan Distribuidora de Combustíveis S.A., Cosan Limited, Houches Holdings S.A., Shell Brasil Limitada, Shell Brazil Holding B.V., Shell Overseas Holdings Limited and Milimétrica Participações S.A., or Framework Agreement (incorporated by reference to Exhibit 4.3 of our annual report on Form20-F for the year ended March 31, 2010). |
| 4.3 | | First Amendment to the Framework Agreement, dated as of April 7, 2011 (incorporated by reference to Exhibit 4.4 of our annual report on Form20-F for the year ended March 31, 2011). |
| 4.4 | | Second Amendment to the Framework Agreement, dated as of June 1, 2011 (incorporated by reference to Exhibit 4.5 of our annual report on Form20-F for the year ended March 31, 2011). |
| 4.5 | | Third Amendment to the Framework Agreement, dated as of March 21, 2012 (incorporated by reference to Exhibit 4.5 of our annual report on Form20-F for the year ended December 31, 2017). |
| 4.6 | | Joint Venture Agreement among Cosan S.A. Indústria e Comércio, Cosan Limited, Raízen Combustíveis S.A., Raízen S.A., Shell Brazil Holding B.V., Shell Overseas Holdings Limited and Raízen Energia Participações S.A. dated June 1, 2011, and the Amendment and Restatement Agreement to the Joint Venture Agreement, dated as of November 22, 2016 (incorporated by reference to Exhibit 4.6 of our annual report on Form20-F for the year ended March 31, 2011). |
| 4.7 | | Operating and Coordination Agreement dated June 1, 2011 relating to Raízen Energia Participações S.A., Raízen Combustíveis S.A. and Raízen S.A. (incorporated by reference to Exhibit 4.7 of our annual report on Form20-F for the year ended March 31, 2011). |
| 4.8 | | Shareholders Agreement of Raízen Combustíveis S.A., dated as of June 1, 2011, and amendments thereto dated as of December 26, 2013, December 19, 2014, November 22, 2016 and August 23, 2018 (incorporated by reference to Exhibit 4.8 of our annual report on Form20-F for the year ended March 31, 2011). |
| 4.9 | | Shareholders Agreement of Raízen Energia Participações S.A., dated as of June 1, 2011, and amendments thereto dated as of June 23, 2014, November 22, 2016, May 25, 2018 and August 16, 2018 (incorporated by reference to Exhibit 4.9 of our annual report on Form20-F for the year ended March 31, 2011). |
| 4.10 | | Term Loan among Cosan Cayman Limited, certain Lenders party thereto and Morgan Stanley Senior Funding, Inc., as administrative agent for the Lenders dated April 1, 2011 (incorporated by reference to Exhibit 4.10 of our annual report on Form20-F for the year ended March 31, 2012). |
157
| | |
| 4.11 | | Share Purchase Agreement for the acquisition of Comma Oil & Chemicals Limited dated February 29, 2012, between Esso Petroleum Company, Limited and Cosan S.A. Indústria e Comércio (incorporated by reference to Exhibit 4.11 of our annual report on Form20-F for the year ended March 31, 2013). |
| 4.12 | | Share Purchase Agreement for the acquisition of Comgás dated May 28, 2012, between Integra Investments B.V., BG Energy Holdings Limited, Provence Participações S.A. and Cosan S.A. Indústria e Comércio (incorporated by reference to Exhibit 4.12 of our annual report on Form20-F for the year ended March 31, 2013). |
| 8.1 | | Subsidiaries of the Registrant. |
| 11.1 | | Code of Ethics (incorporated by reference from our exhibit 11.1 to our annual report filed on Form20-F for the Fiscal Year ended April 30, 2008). |
| 12.1 | | Certification pursuant to section 302 of the Sarbanes-Oxley Act of 2002 of the Chief Executive Officer. |
| 12.2 | | Certification pursuant to section 302 of the Sarbanes-Oxley Act of 2002 of the Chief Financial Officer. |
| 13.1 | | Certification pursuant to 18 U.S.C. section 1350, as adopted pursuant to section 906 of the Sarbanes-Oxley Act of 2002, of the Chief Executive Officer. |
| 13.2 | | Certification pursuant to 18 U.S.C. section 1350, as adopted pursuant to section 906 of the Sarbanes-Oxley Act of 2002, of the Chief Financial Officer. |
| 13.3 | | Financial Statements for the fiscal years ended March 31, 2019, 2018 and 2017 of Raízen Energia and Raízen Combustíveis.** |
| 101.INS | | XBRL Instance Document |
| 101.SCH | | XBRL Taxonomy Extension Schema Document |
| 101.CAL | | XBRL Taxonomy Extension Calculation Linkbase Document |
| 101.DEF | | XBRL Taxonomy Extension Definition Linkbase Document |
| 101.LAB | | XBRL Taxonomy Extension Label Linkbase Document |
| 101.PRE | | XBRL Taxonomy Extension Presentation Linkbase Document |
| * | Portions of this item have been omitted pursuant to a request for confidential treatment. |
| ** | Since the fiscal year of these companies differ to those of Cosan Limited, the financial statements will be filed at a later date. |
158
SIGNATURES
The registrant hereby certifies that it meets all of the requirements for filing on Form20-F and that it has duly caused and authorized the undersigned to sign this annual report on its behalf.
| | |
| COSAN LIMITED |
| |
| By: | | /s/ Marcelo Eduardo Martins |
| | Name: Marcelo Eduardo Martins |
| | Title: Chief Financial Officer |
Date: April 30, 2019
Cosan Limited
Consolidated financial statements as of
December 31, 2018 and 2017
F-1
Contents
F-2
Management’s Annual Report on Internal Control overFinancial Reporting
The management of Cosan Limited (the “Company”) is responsible for establishing and maintaining adequate internal control over financial reporting for the Company.
The Company’s internal control over financial reporting is a process designed to provide reasonable assurance regarding the reliability of financial reporting and the preparation of financial statements for external purposes in accordance with generally accepted accounting principles. The Company’s internal control over financial reporting includes those policies and procedures that (i) pertain to the maintenance of records that, in reasonable detail, accurately and fairly reflect the transactions and dispositions of the assets of the company; (ii) provide reasonable assurance that transactions are recorded as necessary to permit preparation of financial statements in accordance with generally accepted accounting principles, and that receipts and expenditures of the Company are being made only in accordance with authorizations of management and directors of the Company; and (iii) provide reasonable assurance regarding perception or timely detection of unauthorized acquisition, use or disposition of the Company’s assets that could have a material effect on the financial statements.
Because of its inherent limitations, internal control over financial reporting may not prevent or detect misstatements. Therefore even those systems determined to be effective can provide only reasonable assurance with respect to financial statement preparation and presentation. Also, projections of any evaluation of effectiveness to future periods are subject to the risk that controls may become inadequate because of the changes in conditions.
Management assessed the effectiveness of the Company’s internal control over financial reporting as of December 31, 2018, based on the criteria set forth inInternal Control - Integrated Framework 2013 issued by the Committee of Sponsoring Organization of the Treadway Commission (COSO). Based on that assessment management has concluded that as of December 31, 2018, the Company’s internal control over financial reporting is effective.
Management assessment of the effectiveness of the Company’s internal control over financial reporting as of December 31, 2018 has been audited by KPMG Auditores Independentes, the Company’s independent registered public accounting firm, as stated in their report which appears herein.
São Paulo, Brazil
April 30, 2019
| | |
/s/ Marcos Marinho Lutz | | /s/ Marcelo Eduardo Martins |
Marcos Marinho Lutz | | Marcelo Eduardo Martins |
Chief Executive Officer | | Chief Financial and Investor Relations Officer |
F-3
Report of Independent Registered Public Accounting Firm
To the Shareholders and the Board of Directors
Cosan Limited
Opinions on the Consolidated Financial Statements and Internal Control Over Financial Reporting
We have audited the accompanying consolidated statements of financial position of Cosan Limited and subsidiaries (the Company) as of December 31, 2018 and 2017, the related consolidated statements of profit or loss and other comprehensive income, changes in equity and cash flows for each of the years in the three-year period ended December 31, 2018, and the related notes (collectively, the consolidated financial statements). We also have audited the Company’s internal control over financial reporting as of December 31, 2018, based on criteria established in Internal Control – Integrated Framework (2013) issued by the Committee of Sponsoring Organizations of the Treadway Commission.
In our opinion, the consolidated financial statements referred to above present fairly, in all material respects, the financial position of the Company as of December 31, 2018 and 2017, and the results of its operations and its cash flows for each of the years in the three-year period ended December 31, 2018, in conformity with International Financial Reporting Standards (IFRS) issued by the International Accounting Standards Board (IASB). Also in our opinion, the Company maintained, in all material respects, effective internal control over financial reporting as of December 31, 2018, based on criteria established in Internal Control – Integrated Framework (2013) issued by the Committee of Sponsoring Organizations of the Treadway Commission.
Basis for Opinions
The Company’s management is responsible for these consolidated financial statements, for maintaining effective internal control over financial reporting, and for its assessment of the effectiveness of internal control over financial reporting, included in the accompanying “Management´s annual report on internal control over financial reporting”. Our responsibility is to express an opinion on the Company’s consolidated financial statements and an opinion on the Company’s internal control over financial reporting based on our audits. We are a public accounting firm registered with the Public Company Accounting Oversight Board (United States) (PCAOB) and are required to be independent with respect to the Company in accordance with the U.S. federal securities laws and the applicable rules and regulations of the Securities and Exchange Commission and the PCAOB.
We conducted our audits in accordance with the standards of the PCAOB. Those standards require that we plan and perform the audits to obtain reasonable assurance about whether the consolidated financial statements are free of material misstatement, whether due to error or fraud, and whether effective internal control over financial reporting was maintained in all material respects.
Our audits of the consolidated financial statements included performing procedures to assess the risks of material misstatement of the consolidated financial statements, whether due to error or fraud, and performing procedures that respond to those risks. Such procedures included examining, on a test basis, evidence regarding the amounts and disclosures in the consolidated financial statements. Our audits also included evaluating the accounting principles used and significant estimates made by management, as well as evaluating the overall presentation of the consolidated financial statements. Our audit of internal control over financial reporting included obtaining an understanding of internal control over financial reporting, assessing the risk that a material weakness exists, and testing and evaluating the design and operating effectiveness of internal control based on the assessed risk. Our audits also included performing such other procedures as we considered necessary in the circumstances. We believe that our audits provide a reasonable basis for our opinions.
F-4
Definition and Limitations of Internal Control Over Financial Reporting
A company’s internal control over financial reporting is a process designed to provide reasonable assurance regarding the reliability of financial reporting and the preparation of financial statements for external purposes in accordance with generally accepted accounting principles. A company’s internal control over financial reporting includes those policies and procedures that (1) pertain to the maintenance of records that, in reasonable detail, accurately and fairly reflect the transactions and dispositions of the assets of the company; (2) provide reasonable assurance that transactions are recorded as necessary to permit preparation of financial statements in accordance with generally accepted accounting principles, and that receipts and expenditures of the company are being made only in accordance with authorizations of management and directors of the company; and (3) provide reasonable assurance regarding prevention or timely detection of unauthorized acquisition, use, or disposition of the company’s assets that could have a material effect on the financial statements.
Because of its inherent limitations, internal control over financial reporting may not prevent or detect misstatements. Also, projections of any evaluation of effectiveness to future periods are subject to the risk that controls may become inadequate because of changes in conditions, or that the degree of compliance with the policies or procedures may deteriorate.
/s/ KPMG Auditores Independentes
We have served as the Company’s auditor since 2015.
São Paulo, SP, Brazil
April 30, 2019
F-5
Cosan Limited
Consolidated statements of financial position
(In thousands of Brazilian Reais—R$)
| | | | | | | | | | | | | | | |
| | | Note | | December 31, 2018 | | December 31, 2017 |
Assets | | | | | | | | | | | | | | | |
Cash and cash equivalents | | | | 5.1 | | | | | 3,621,798 | | | | | 4,555,177 | |
Marketable securities | | | | 5.2 | | | | | 4,202,835 | | | | | 3,853,343 | |
Trade receivables | | | | 5.3 | | | | | 1,545,643 | | | | | 1,277,766 | |
Derivative financial instruments | | | | 5.9 | | | | | 181,815 | | | | | 317,763 | |
Inventories | | | | 7 | | | | | 716,290 | | | | | 663,061 | |
Receivables from related parties | | | | 5.4 | | | | | 44,680 | | | | | 30,059 | |
Income tax receivable | | | | | | | | | 279,157 | | | | | 312,274 | |
Other current taxes receivable | | | | 6 | | | | | 796,199 | | | | | 327,410 | |
Dividends receivable | | | | | | | | | 27,320 | | | | | 13,466 | |
Other financial assets | | | | | | | | | — | | | | | 1,340,000 | |
Other current assets | | | | | | | | | 543,853 | | | | | 343,617 | |
| | | | | | | | | | | | | | | |
Total current assets | | | | | | | | | 11,959,590 | | | | | 13,033,936 | |
Tradenon-current receivables | | | | 5.3 | | | | | 42,549 | | | | | 44,654 | |
Restricted cash | | | | 5.2 | | | | | 115,124 | | | | | 225,634 | |
Deferred tax assets | | | | 13 | | | | | 1,540,693 | | | | | 1,636,080 | |
Receivables from related parties | | | | 5.4 | | | | | 90,390 | | | | | 169,755 | |
Income tax receivable | | | | | | | | | 260,330 | | | | | 247,996 | |
Othernon-current taxes receivables | | | | 6 | | | | | 851,492 | | | | | 778,820 | |
Judicial deposits | | | | 14 | | | | | 878,807 | | | | | 766,107 | |
Derivative financial instruments | | | | 5.9 | | | | | 2,367,042 | | | | | 844,450 | |
Othernon-current assets | | | | | | | | | 407,915 | | | | | 472,753 | |
Investments in associates | | | | 8.1 | | | | | 378,519 | | | | | 301,342 | |
Investments in joint ventures | | | | 9 | | | | | 8,077,907 | | | | | 8,447,799 | |
Property, plant and equipment | | | | 10.1 | | | | | 12,417,822 | | | | | 11,681,575 | |
Intangible assets and goodwill | | | | 10.2 | | | | | 16,972,536 | | | | | 16,973,610 | |
| | | | | | | | | | | | | | | |
Totalnon-current assets | | | | | | | | | 44,401,126 | | | | | 42,590,575 | |
| | | | | | | | | | | | | | | |
Total assets | | | | | | | | | 56,360,716 | | | | | 55,624,511 | |
| | | | | | | | | | | | | | | |
The accompanying notes are an integral part of these financial statements.
F-6
Cosan Limited
Consolidated statements of financial position
(In thousands of Brazilian Reais—R$)
| | | | | | | | | | | | | | | |
| | | Note | | December 31, 2018 | | December 31, 2017 |
Liabilities | | | | | | | | | | | | | | | |
Loans, borrowings and debentures | | | | 5.5 | | | | | 2,115,305 | | | | | 3,903,392 | |
Leases | | | | 5.6 | | | | | 120,491 | | | | | 261,344 | |
Real estate credit certificates | | | | | | | | | — | | | | | 86,745 | |
Derivative financial instruments | | | | 5.9 | | | | | 3,880 | | | | | 1,520 | |
Trade payables | | | | 5.7 | | | | | 1,923,920 | | | | | 2,433,995 | |
Employee benefits payables | | | | | | | | | 339,968 | | | | | 291,080 | |
Income tax payable | | | | | | | | | 36,164 | | | | | 21,146 | |
Other taxes payables | | | | 12 | | | | | 245,587 | | | | | 418,878 | |
Dividends payable | | | | | | | | | 187,415 | | | | | 191,478 | |
Concessions payable | | | | 11 | | | | | 28,797 | | | | | 27,413 | |
Payables to related parties | | | | 5.4 | | | | | 355,971 | | | | | 328,263 | |
Deferred revenue | | | | | | | | | 9,473 | | | | | 11,529 | |
Other financial liabilities | | | | | | | | | 455,702 | | | | | 382,702 | |
Other current liabilities | | | | | | | | | 418,145 | | | | | 662,835 | |
| | | | | | | | | | | | | | | |
Total current liabilities | | | | | | | | | 6,240,818 | | | | | 9,022,320 | |
Loans, borrowings and debentures | | | | 5.5 | | | | | 20,459,008 | | | | | 17,785,554 | |
Leases | | | | 5.6 | | | | | 432,859 | | | | | 682,794 | |
Preferred shareholders payable in subsidiaries | | | | 5.8 | | | | | 1,097,490 | | | | | 1,442,679 | |
Derivative financial instruments | | | | 5.9 | | | | | 21,834 | | | | | 113,565 | |
Other taxes payables | | | | 12 | | | | | 154,599 | | | | | 161,637 | |
Provision for legal proceedings | | | | 14 | | | | | 1,363,168 | | | | | 1,348,157 | |
Concessions payable | | | | 11 | | | | | 3,179,771 | | | | | 2,905,921 | |
Post-employment benefits | | | | 22 | | | | | 579,870 | | | | | 485,459 | |
Deferred tax liabilities | | | | 13 | | | | | 4,093,019 | | | | | 3,902,310 | |
Deferred revenue | | | | | | | | | 42,044 | | | | | 56,495 | |
Othernon-current liabilities | | | | | | | | | 726,880 | | | | | 658,207 | |
| | | | | | | | | | | | | | | |
Totalnon-current liabilities | | | | | | | | | 32,150,542 | | | | | 29,542,778 | |
| | | | | | | | | | | | | | | |
Total liabilities | | | | | | | | | 38,391,360 | | | | | 38,565,098 | |
| | | | | | | | | | | | | | | |
Shareholders’ equity | | | | 15 | | | | | | | | | | | |
Share capital | | | | | | | | | 5,328 | | | | | 5,328 | |
Additionalpaid-in capital | | | | | | | | | 3,112,274 | | | | | 3,245,543 | |
Accumulated other comprehensive loss | | | | | | | | | (587,173 | ) | | | | (394,212 | ) |
Retained earnings | | | | | | | | | 4,083,974 | | | | | 3,182,098 | |
Equity attributable to: | | | | | | | | | | | | | | | |
Owners of the Company | | | | | | | | | 6,614,403 | | | | | 6,038,757 | |
Non-controlling interests | | | | 8.2 | | | | | 11,354,953 | | | | | 11,020,656 | |
| | | | | | | | | | | | | | | |
Total shareholders’ equity | | | | | | | | | 17,969,356 | | | | | 17,059,413 | |
| | | | | | | | | | | | | | | |
Total shareholders’ equity and liabilities | | | | | | | | | 56,360,716 | | | | | 55,624,511 | |
| | | | | | | | | | | | | | | |
The accompanying notes are an integral part of these financial statements.
F-7
Cosan Limited
Consolidated statement of profit or loss and other comprehensive income
(In thousands of Brazilian Reais – R$, except earnings per share)
| | | | | | | | | | | | | | | | | | | | |
| | | Note | | December 31, 2018 | | December 31, 2017 | | December 31, 2016 |
Net sales | | | | 17 | | | | | 16,843,933 | | | | | 13,582,463 | | | | | 12,518,139 | |
Cost of sales | | | | 18 | | | | | (12,119,917 | ) | | | | (9,232,210 | ) | | | | (8,317,490 | ) |
| | | | | | | | | | | | | | | | | | | | |
Gross profit | | | | | | | | | 4,724,016 | | | | | 4,350,253 | | | | | 4,200,649 | |
Selling expenses | | | | 18 | | | | | (1,023,485 | ) | | | | (1,068,663 | ) | | | | (1,037,542 | ) |
General and administrative expenses | | | | 18 | | | | | (981,834 | ) | | | | (935,290 | ) | | | | (1,000,734 | ) |
Other income (expenses), net | | | | 19 | | | | | 738,151 | | | | | 877,599 | | | | | (116,302 | ) |
| | | | | | | | | | | | | | | | | | | | |
Operating expenses | | | | | | | | | (1,267,168 | ) | | | | (1,126,354 | ) | | | | (2,154,578 | ) |
Profit before equity in earnings of investees, finance results and taxes | | | | | | | | | 3,456,848 | | | | | 3,223,899 | | | | | 2,046,071 | |
| | | | | | | | | | | | | | | | | | | | |
Interest in earnings of associates | | | | 8 | | | | | 51,473 | | | | | 17,162 | | | | | (4,440 | ) |
Interest in earnings of joint ventures | | | | 9 | | | | | 946,282 | | | | | 985,090 | | | | | 1,570,132 | |
| | | | | | | | | | | | | | | | | | | | |
Equity in earnings of investees | | | | | | | | | 997,755 | | | | | 1,002,252 | | | | | 1,565,692 | |
Finance expense | | | | | | | | | (2,849,228 | ) | | | | (3,704,515 | ) | | | | (3,673,356 | ) |
Finance income | | | | | | | | | 1,032,725 | | | | | 870,739 | | | | | 1,102,918 | |
Foreign exchange, net | | | | | | | | | (1,555,215 | ) | | | | (199,777 | ) | | | | 997,109 | |
Derivatives | | | | | | | | | 1,760,782 | | | | | 282,054 | | | | | (1,482,447 | ) |
| | | | | | | | | | | | | | | | | | | | |
Finance results, net | | | | 20 | | | | | (1,610,936 | ) | | | | (2,751,499 | ) | | | | (3,055,776 | ) |
Profit before taxes | | | | | | | | | 2,843,667 | | | | | 1,474,652 | | | | | 555,987 | |
| | | | | | | | | | | | | | | | | | | | |
Income tax (expenses), benefits | | | | 13 | | | | | | | | | | | | | | | | |
Current | | | | | | | | | (464,867 | ) | | | | (134,517 | ) | | | | (228,634 | ) |
Deferred | | | | | | | | | (295,620 | ) | | | | (293,838 | ) | | | | 166,932 | |
| | | | | | | | | | | | | | | | | | | | |
| | | | | | | | | (760,487 | ) | | | | (428,355 | ) | | | | (61,702 | ) |
| | | | | | | | | | | | | | | | | | | | |
Profit from continuing operations | | | | | | | | | 2,083,180 | | | | | 1,046,297 | | | | | 494,285 | |
Loss from discontinued operation, net of tax | | | | | | | | | — | | | | | — | | | | | (35,262 | ) |
| | | | | | | | | | | | | | | | | | | | |
Profit for the year | | | | | | | | | 2,083,180 | | | | | 1,046,297 | | | | | 459,023 | |
| | | | | | | | | | | | | | | | | | | | |
Other comprehensive income (loss) | | | | | | | | | | | | | | | | | | | | |
Items that will never be reclassified to profit or loss | | | | | | | | | | | | | | | | | | | | |
Gain on share subscription of subsidiary | | | | | | | | | — | | | | | 9,000 | | | | | 6,000 | |
Actuarial loss on defined benefit plan | | | | | | | | | (82,286 | ) | | | | (24,121 | ) | | | | (87,037 | ) |
Taxes over actuarial loss on defined benefit plan | | | | | | | | | 27,977 | | | | | 8,201 | | | | | 29,988 | |
| | | | | | | | | | | | | | | | | | | | |
| | | | | | | | | (54,309 | ) | | | | (6,920 | ) | | | | (51,049 | ) |
Items that are or may subsequently be reclassified to profit or loss: | | | | | | | | | | | | | | | | | | | | |
Foreign currency translation effect | | | | | | | | | (161,574 | ) | | | | (50,085 | ) | | | | 146,092 | |
Gain on cash flow hedge in joint ventures | | | | | | | | | 6,883 | | | | | 204,611 | | | | | 45,778 | |
Changes in fair value of financial assets | | | | | | | | | 244 | | | | | 3,459 | | | | | (70 | ) |
| | | | | | | | | | | | | | | | | | | | |
| | | | | | | | | (154,447 | ) | | | | 157,985 | | | | | 191,800 | |
Total other comprehensive (loss) income, net of tax | | | | | | | | | (208,756 | ) | | | | 151,065 | | | | | 140,751 | |
| | | | | | | | | | | | | | | | | | | | |
Comprehensive income—Continued operation | | | | | | | | | 1,874,424 | | | | | 1,197,362 | | | | | 599,774 | |
Comprehensive income—Discontinuing operations | | | | | | | | | — | | | | | — | | | | | (124,629 | ) |
| | | | | | | | | | | | | | | | | | | | |
Total comprehensive income | | | | | | | | | 1,874,424 | | | | | 1,197,362 | | | | | 475,145 | |
Total net income attributable to: | | | | | | | | | | | | | | | | | | | | |
Owners of the Company | | | | | | | | | 975,448 | | | | | 551,021 | | | | | 277,804 | |
Non-controlling interests | | | | | | | | | 1,107,732 | | | | | 495,276 | | | | | 181,219 | |
| | | | | | | | | | | | | | | | | | | | |
| | | | | | | | | 2,083,180 | | | | | 1,046,297 | | | | | 459,023 | |
Total comprehensive income attributable to: | | | | | | | | | | | | | | | | | | | | |
Owners of the Company | | | | | | | | | 782,487 | | | | | 637,263 | | | | | 275,557 | |
Non-controlling interests | | | | | | | | | 1,091,937 | | | | | 560,099 | | | | | 199,588 | |
| | | | | | | | | | | | | | | | | | | | |
| | | | | | | | | 1,874,424 | | | | | 1,197,362 | | | | | 475,145 | |
Basic earnings (loss) per share from: | | | | | | | | | | | | | | | | | | | | |
Continuing operations | | | | 16 | | | | R$ | 3.9967 | | | | R$ | 2.0951 | | | | R$ | 1.2283 | |
Discontinuing operations | | | | 16 | | | | | — �� | | | | | — | | | | (R$ | 0.1788 | ) |
| | | | | | | | | | | | | | | | | | | | |
| | | | | | | | R$ | 3.9967 | | | | R$ | 2.0951 | | | | R$ | 1.0495 | |
Diluted earnings (loss) per share from: | | | | | | | | | | | | | | | | | | | | |
Continuing operations | | | | 16 | | | | R$ | 3.8271 | | | | R$ | 2.0468 | | | | R$ | 1.1577 | |
Discontinuing operations | | | | 16 | | | | | — | | | | | — | | | | (R$ | 0.1780 | ) |
| | | | | | | | | | | | | | | | | | | | |
| | | | | | | | R$ | 3.8271 | | | | R$ | 2.0468 | | | | R$ | 0.9797 | |
The accompanying notes are an integral part of these financial statements.
F-8
Cosan Limited
Consolidated statement of changes in equity
(In thousands of Brazilian Reais—R$)
| | | | | | | | | | | | | | | | | | | | | | | | | | | | |
| | | Share
capital | | | Additional
paid-in
capital | | | Accumulated
other
comprehensive
loss | | | Retained
earnings | | | Equity
attributable
to owners
of the
Company | | | Non-controlling
interest | | | Total equity | |
At January 1, 2016 | | | 5,328 | | | | 4,006,562 | | | | (478,207 | ) | | | 2,380,035 | | | | 5,913,718 | | | | 10,275,532 | | | | 16,189,250 | |
Net income for the year | | | — | | | | — | | | | — | | | | 277,804 | | | | 277,804 | | | | 181,219 | | | | 459,023 | |
Other comprehensive income (Note 15): | | | | | | | | | | | | | | | | | | | | | | | | | | | | |
Gain on cash flow hedge in joint ventures | | | — | | | | — | | | | 28,746 | | | | — | | | | 28,746 | | | | 17,032 | | | | 45,778 | |
Foreign currency translation effects | | | — | | | | — | | | | 112,770 | | | | — | | | | 112,770 | | | | 33,322 | | | | 146,092 | |
Actuarial loss on defined benefit plan | | | — | | | | — | | | | (22,839 | ) | | | — | | | | (22,839 | ) | | | (34,210 | ) | | | (57,049 | ) |
Investment property | | | — | | | | — | | | | (118,832 | ) | | | 118,832 | | | | — | | | | — | | | | — | |
Fair value of financial assets | | | — | | | | — | | | | (5,797 | ) | | | 5,797 | | | | — | | | | — | | | | — | |
Gain on share subscription of a subsidiary | | | — | | | | — | | | | 3,751 | | | | — | | | | 3,751 | | | | 2,249 | | | | 6,000 | |
Change in fair value of financial assets | | | — | | | | — | | | | (46 | ) | | | — | | | | (46 | ) | | | (24 | ) | | | (70 | ) |
| | | | | | | | | | | | | | | | | | | | | | | | | | | | |
Total comprehensive income for the year | | | — | | | | — | | | | (2,247 | ) | | | 402,433 | | | | 400,186 | | | | 199,588 | | | | 599,774 | |
| | | | | | | | | | | | | | | | | | | | | | | | | | | | |
Contributions by and distributions to owners of the Company: | | | | | | | | | | | | | | | | | | | | | | | | | | | | |
Share options exercised—Subsidiaries | | | — | | | | 23,684 | | | | — | | | | — | | | | 23,684 | | | | 13,643 | | | | 37,327 | |
Dividends—non-controlling interests | | | — | | | | (8,106 | ) | | | — | | | | — | | | | (8,106 | ) | | | 8,106 | | | | — | |
Dividends | | | — | | | | — | | | | — | | | | (86,470 | ) | | | (86,470 | ) | | | (888,935 | ) | | | (975,405 | ) |
Write-off of investment | | | — | | | | — | | | | — | | | | — | | | | — | | | | (1,622,005 | ) | | | (1,622,005 | ) |
Share-based payment transactions | | | — | | | | 6,949 | | | | — | | | | — | | | | 6,949 | | | | 4,672 | | | | 11,621 | |
| | | | | | | | | | | | | | | | | | | | | | | | | | | | |
Total contributions by and distributions to owners of the Company | | | — | | | | 22,527 | | | | — | | | | (86,470 | ) | | | (63,943 | ) | | | (2,484,519 | ) | | | (2,548,462 | ) |
| | | | | | | | | | | | | | | | | | | | | | | | | | | | |
Transactions with owners of the Company | | | | | | | | | | | | | | | | | | | | | | | | | | | | |
Change of shareholding interest in subsidiary | | | — | | | | 22,502 | | | | — | | | | — | | | | 22,502 | | | | 1,746,685 | | | | 1,769,187 | |
| | | | | | | | | | | | | | | | | | | | | | | | | | | | |
At December 31, 2016 | | | 5,328 | | | | 4,051,591 | | | | (480,454 | ) | | | 2,695,998 | | | | 6,272,463 | | | | 9,737,286 | | | | 16,009,749 | |
| | | | | | | | | | | | | | | | | | | | | | | | | | | | |
The accompanying notes are an integral part of these financial statements.
F-9
Cosan Limited
Consolidated statement of changes in equity
(In thousands of Brazilian Reais—R$)
| | | | | | | | | | | | | | | | | | | | | | | | | | | | |
| | | Share
capital | | | Additional
paid-in
capital | | | Accumulated
other
comprehensive
loss | | | Retained
earnings | | | Equity
attributable
to owners
of the
Company | | | Non-controlling
interest | | | Total equity | |
At January 1, 2017 | | | 5,328 | | | | 4,051,591 | | | | (480,454 | ) | | | 2,695,998 | | | | 6,272,463 | | | | 9,737,286 | | | | 16,009,749 | |
Net income for the year | | | — | | | | — | | | | — | | | | 551,021 | | | | 551,021 | | | | 495,276 | | | | 1,046,297 | |
Other comprehensive income (Note 15): | | | | | | | | | | | | | | | | | | | | | | | | | | | | |
Gain on cash flow hedge in joint ventures | | | — | | | | — | | | | 127,994 | | | | — | | | | 127,994 | | | | 76,617 | | | | 204,611 | |
Foreign currency translation effects | | | — | | | | — | | | | (42,055 | ) | | | — | | | | (42,055 | ) | | | (8,030 | ) | | | (50,085 | ) |
Actuarial loss on defined benefit plan | | | — | | | | — | | | | (7,445 | ) | | | — | | | | (7,445 | ) | | | (8,475 | ) | | | (15,920 | ) |
Gain on share subscription of a subsidiary | | | — | | | | — | | | | 5,598 | | | | — | | | | 5,598 | | | | 3,402 | | | | 9,000 | |
Change in fair value of financial assets | | | — | | | | — | | | | 2,150 | | | | — | | | | 2,150 | | | | 1,309 | | | | 3,459 | |
| | | | | | | | | | | | | | | | | | | | | | | | | | | | |
Total comprehensive income for the year | | | — | | | | — | | | | 86,242 | | | | 551,021 | | | | 637,263 | | | | 560,099 | | | | 1,197,362 | |
| | | | | | | | | | | | | | | | | | | | | | | | | | | | |
Contributions by and distributions to owners of the Company: | | | | | | | | | | | | | | | | | | | | | | | | | | | | |
Capital increase in subsidiary | | | — | | | | — | | | | — | | | | — | | | | — | | | | 2,052,962 | | | | 2,052,962 | |
Dividends—non-controlling interests | | | — | | | | (19,725 | ) | | | — | | | | — | | | | (19,725 | ) | | | 19,725 | | | | — | |
Share options exercised—Subsidiaries | | | — | | | | 23,477 | | | | — | | | | — | | | | 23,477 | | | | 13,489 | | | | 36,966 | |
Dividends | | | — | | | | — | | | | — | | | | (64,921 | ) | | | (64,921 | ) | | | (727,224 | ) | | | (792,145 | ) |
Treasury shares acquired | | | — | | | | (704,225 | ) | | | — | | | | — | | | | (704,225 | ) | | | — | | | | (704,225 | ) |
Share-based payment transactions | | | — | | | | 55,478 | | | | — | | | | — | | | | 55,478 | | | | 8,180 | | | | 63,658 | |
| | | | | | | | | | | | | | | | | | | | | | | | | | | | |
Total contributions by and distributions to owners of the Company | | | — | | | | (644,995 | ) | | | — | | | | (64,921 | ) | | | (709,916 | ) | | | 1,367,132 | | | | 657,216 | |
| | | | | | | | | | | | | | | | | | | | | | | | | | | | |
Transactions with owners of the Company | | | | | | | | | | | | | | | | | | | | | | | | | | | | |
Change of shareholding interest in subsidiary | | | — | | | | (161,053 | ) | | | — | | | | — | | | | (161,053 | ) | | | (643,861 | ) | | | (804,914 | ) |
| | | | | | | | | | | | | | | | | | | | | | | | | | | | |
At December 31, 2017 | | | 5,328 | | | | 3,245,543 | | | | (394,212 | ) | | | 3,182,098 | | | | 6,038,757 | | | | 11,020,656 | | | | 17,059,413 | |
| | | | | | | | | | | | | | | | | | | | | | | | | | | | |
The accompanying notes are an integral part of these financial statements.
F-10
Cosan Limited
Consolidated statement of changes in equity
(In thousands of Brazilian Reais—R$)
| | | | | | | | | | | | | | | | | | | | | | | | | | | | |
| | | Share
capital | | | Additional
paid-in
capital | | | Accumulated
other
comprehensive
loss | | | Retained
earnings | | | Equity
attributable
to owners
of the
Company | | | Non-controlling
interest | | | Total equity | |
At December 31, 2017 | | | 5,328 | | | | 3,245,543 | | | | (394,212 | ) | | | 3,182,098 | | | | 6,038,757 | | | | 11,020,656 | | | | 17,059,413 | |
Adjustment on initial application of IFRS 9, net of tax—Note 3.3 | | | — | | | | — | | | | — | | | | (3,950 | ) | | | (3,950 | ) | | | (4,738 | ) | | | (8,688 | ) |
| | | | | | | | | | | | | | | | | | | | | | | | | | | | |
At January 1, 2018 | | | 5,328 | | | | 3,245,543 | | | | (394,212 | ) | | | 3,178,148 | | | | 6,034,807 | | | | 11,015,918 | | | | 17,050,725 | |
Net income for the year | | | — | | | | — | | | | — | | | | 975,448 | | | | 975,448 | | | | 1,107,732 | | | | 2,083,180 | |
Other comprehensive income (Note 15): | | | | | | | | | | | | | | | | | | | | | | | | | | | | |
Gain on cash flow hedge in joint ventures | | | — | | | | — | | | | 4,961 | | | | — | | | | 4,961 | | | | 1,922 | | | | 6,883 | |
Foreign currency translation effects | | | — | | | | — | | | | (169,823 | ) | | | — | | | | (169,823 | ) | | | 8,249 | | | | (161,574 | ) |
Actuarial loss on defined benefit plan | | | — | | | | — | | | | (28,245 | ) | | | — | | | | (28,245 | ) | | | (26,064 | ) | | | (54,309 | ) |
Change in fair value of financial assets | | | — | | | | — | | | | 146 | | | | — | | | | 146 | | | | 98 | | | | 244 | |
| | | | | | | | | | | | | | | | | | | | | | | | | | | | |
Total comprehensive income for the year | | | — | | | | — | | | | (192,961 | ) | | | 975,448 | | | | 782,487 | | | | 1,091,937 | | | | 1,874,424 | |
| | | | | | | | | | | | | | | | | | | | | | | | | | | | |
Contributions by and distributions to owners of the Company: | | | | | | | | | | | | | | | | | | | | | | | | | | | | |
Dividends—non-controlling interests | | | — | | | | (12,368 | ) | | | — | | | | — | | | | (12,368 | ) | | | 12,368 | | | | — | |
Share options exercised—Subsidiaries | | | — | | | | 14,795 | | | | — | | | | — | | | | 14,795 | | | | 9,753 | | | | 24,548 | |
Dividends | | | — | | | | — | | | | — | | | | (69,622 | ) | | | (69,622 | ) | | | (355,871 | ) | | | (425,493 | ) |
Business combination | | | — | | | | — | | | | — | | | | — | | | | — | | | | 7,199 | | | | 7,199 | |
Share-based payment transactions | | | — | | | | 44,122 | | | | — | | | | — | | | | 44,122 | | | | 9,496 | | | | 53,618 | |
| | | | | | | | | | | | | | | | | | | | | | | | | | | | |
Total contributions by and distributions to owners of the Company | | | — | | | | 46,549 | | | | — | | | | (69,622 | ) | | | (23,073 | ) | | | (317,055 | ) | | | (340,128 | ) |
| | | | | | | | | | | | | | | | | | | | | | | | | | | | |
Transactions with owners of the Company | | | | | | | | | | | | | | | | | | | | | | | | | | | | |
Change of shareholding interest in subsidiary | | | — | | | | (179,818 | ) | | | — | | | | — | | | | (179,818 | ) | | | (435,847 | ) | | | (615,665 | ) |
| | | | | | | | | | | | | | | | | | | | | | | | | | | | |
At December 31, 2018 | | | 5,328 | | | | 3,112,274 | | | | (587,173 | ) | | | 4,083,974 | | | | 6,614,403 | | | | 11,354,953 | | | | 17,969,356 | |
| | | | | | | | | | | | | | | | | | | | | | | | | | | | |
The accompanying notes are an integral part of these financial statements.
F-11
Cosan Limited
Consolidated statement of cash flows
(In thousands of Brazilian Reais—R$ unless otherwise stated)
| | | | | | | | | | | | | | | | |
| | | Note | | | December 31, 2018 | | | December 31, 2017 | | | December 31, 2016 | |
Cash flows from operating activities | | | | | | | | | | | | | | | | |
Profit before taxes | | | | | | | 2,843,667 | | | | 1,474,652 | | | | 555,987 | |
Adjustments for: | | | | | | | | | | | | | | | | |
Depreciation, amortization and impairment | | | | | | | 2,061,344 | | | | 1,938,393 | | | | 1,735,332 | |
Lease and concession | | | 11 | | | | 199,405 | | | | 193,252 | | | | 193,637 | |
Interest in earnings of associates | | | 8.1 | | | | (51,473 | ) | | | (17,162 | ) | | | 4,440 | |
Interest in earnings of joint ventures | | | 9 | | | | (946,282 | ) | | | (985,090 | ) | | | (1,570,132 | ) |
Loss on disposals assets | | | | | | | 684 | | | | 43,068 | | | | 24,006 | |
Share-based payment | | | | | | | 55,246 | | | | 52,016 | | | | 11,621 | |
Legal proceedings provision | | | | | | | 113,829 | | | | 172,351 | | | | 97,435 | |
Indexation charges, interest and exchange, net | | | | | | | 1,819,710 | | | | 2,861,772 | | | | 3,188,277 | |
Provisions for employee benefits | | | | | | | 184,859 | | | | 166,298 | | | | 150,334 | |
Allowance for doubtful accounts | | | | | | | 14,603 | | | | 31,838 | | | | 27,226 | |
Sales of credit rights | | | | | | | — | | | | (1,039,966 | ) | | | — | |
Indemnity | | | 19 | | | | (726,000 | ) | | | — | | | | — | |
Recovering tax credits | | | 6 | | | | (338,040 | ) | | | — | | | | — | |
Other | | | | | | | (6,371 | ) | | | (36,448 | ) | | | (308,572 | ) |
| | | | | | | | | | | | | | | | |
| | | | | | | 5,225,181 | | | | 4,854,974 | | | | 4,109,591 | |
Changes in: | | | | | | | | | | | | | | | | |
Trade receivables | | | | | | | (172,743 | ) | | | (252,079 | ) | | | (8,427 | ) |
Inventories | | | | | | | (8,784 | ) | | | (40,224 | ) | | | 6,690 | |
Recoverable taxes | | | | | | | (49,262 | ) | | | (227,248 | ) | | | 247,628 | |
Income tax and other tax | | | | | | | (589,850 | ) | | | (110,944 | ) | | | (143,659 | ) |
Related parties, net | | | | | | | (54,871 | ) | | | (1,215 | ) | | | 13,066 | |
Trade payables | | | | | | | 381,849 | | | | 174,248 | | | | (138,690 | ) |
Employee benefits | | | | | | | (160,740 | ) | | | (121,540 | ) | | | (127,487 | ) |
Provision for legal proceedings | | | | | | | (132,215 | ) | | | (79,206 | ) | | | (56,145 | ) |
Other financial assets | | | | | | | 40,106 | | | | 90,966 | | | | (55,000 | ) |
Judicial deposits | | | | | | | (76,017 | ) | | | (32,224 | ) | | | (29,614 | ) |
Discontinued operation | | | | | | | — | | | | — | | | | 70,087 | |
Cash received on sale of credit rights | | | 1 | | | | 1,340,000 | | | | — | | | | — | |
Post-employment benefits | | | | | | | (34,904 | ) | | | (30,617 | ) | | | (30,262 | ) |
Concessions payable | | | | | | | (105,848 | ) | | | (111,922 | ) | | | (107,729 | ) |
Other assets and liabilities, net | | | | | | | (223,974 | ) | | | (24,868 | ) | | | (114,661 | ) |
| | | | | | | | | | | | | | | | |
| | | | | | | 152,747 | | | | (766,873 | ) | | | (474,203 | ) |
Net cash generated by operating activities | | | | | | | 5,377,928 | | | | 4,088,101 | | | | 3,635,388 | |
| | | | | | | | | | | | | | | | |
Cash flows from investing activities | | | | | | | | | | | | | | | | |
Capital contribution in associates | | | | | | | (7,517 | ) | | | (15,320 | ) | | | (22,802 | ) |
Non-controlling interest acquisition | | | | | | | — | | | | — | | | | (54,122 | ) |
Acquisition of subsidiary, net of cash acquired | | | | | | | (135,648 | ) | | | (116,514 | ) | | | — | |
Marketable securities, net | | | | | | | (148,306 | ) | | | (2,331,232 | ) | | | (626,279 | ) |
Restricted cash, net | | | | | | | 111,672 | | | | (24,635 | ) | | | 59,162 | |
Dividends received from associates | | | | | | | 15,327 | | | | 13,929 | | | | 12,229 | |
Dividends received from joint ventures | | | | | | | 1,292,127 | | | | 1,346,460 | | | | 1,230,367 | |
Acquisition of property, plant and equipment, intangible assets, investments and contract asset | | | | | | | (2,628,241 | ) | | | (2,457,458 | ) | | | (2,190,505 | ) |
Put option exercised paid | | | | | | | — | | | | — | | | | (186,052 | ) |
Other receivables from related parties | | | | | | | — | | | | — | | | | 11,338 | |
Discontinued operation | | | | | | | — | | | | — | | | | (13,934 | ) |
Net cash from sale of discontinued operations | | | | | | | — | | | | (689 | ) | | | 1,053,768 | |
Cash received on sale of fixed assets, and intangible assets | | | | | | | 1,817 | | | | 8,097 | | | | (189 | ) |
| | | | | | | | | | | | | | | | |
Net cash used in investing activities | | | | | | | (1,498,769 | ) | | | (3,577,362 | ) | | | (727,019 | ) |
F-12
Cosan Limited
Consolidated statement of cash flows
(In thousands of Brazilian Reais—R$ unless otherwise stated)
| | | | | | | | | | | | | | | | |
| | | Note | | | December 31, 2018 | | | December 31, 2017 | | | December 31, 2016 | |
Cash flows from financing activities | | | | | | | | | | | | | | | | |
Loans, borrowings and debentures raised | | | 5.5 | | | | 3,761,058 | | | | 6,248,712 | | | | 7,527,792 | |
Repayment of principal on loans, borrowings and debentures | | | 5.5 | | | | (5,342,670 | ) | | | (3,839,633 | ) | | | (7,203,109 | ) |
Payment of interest on loans, borrowings and debentures | | | 5.5 | | | | (1,465,666 | ) | | | (1,602,034 | ) | | | (1,449,181 | ) |
Payment of financial instruments derivatives | | | | | | | (1,097,220 | ) | | | (588,144 | ) | | | (1,365,065 | ) |
Receipt of financial instruments derivatives | | | | | | | 1,384,506 | | | | 313,443 | | | | 991,457 | |
Payment of principal on financing leases | | | 5.6 | | | | (384,752 | ) | | | (348,114 | ) | | | (413,267 | ) |
Payment of interest on financing leases | | | 5.6 | | | | (150,799 | ) | | | (283,430 | ) | | | (330,452 | ) |
Repayments of advance of real estate credits | | | | | | | (91,842 | ) | | | (129,503 | ) | | | (128,932 | ) |
Proceeds from issuing shares | | | | | | | — | | | | 2,030,212 | | | | 1,979,174 | |
Payments to redeem entity’s shares | | | | | | | (607,932 | ) | | | (780,931 | ) | | | — | |
Non-controlling interest subscription | | | | | | | 4,163 | | | | 20,375 | | | | 28,764 | |
Acquisition ofnon-controlling interests | | | | | | | (268,322 | ) | | | (554,045 | ) | | | — | |
Dividends paid | | | | | | | (871,480 | ) | | | (1,089,840 | ) | | | (1,440,544 | ) |
Discontinued operation | | | | | | | — | | | | — | | | | (53,272 | ) |
Share options exercised | | | | | | | 24,548 | | | | 37,184 | | | | 37,327 | |
| | | | | | | | | | | | | | | | |
Net cash used in financing activities | | | | | | | (5,106,408 | ) | | | (565,748 | ) | | | (1,819,308 | ) |
(Decrease) increase in cash and cash equivalents | | | | | | | (1,227,249 | ) | | | (55,009 | ) | | | 1,089,061 | |
| | | | | | | | | | | | | | | | |
Cash and cash equivalents at beginning of year | | | | | | | 4,555,177 | | | | 4,499,588 | | | | 3,505,824 | |
| | | | | | | | | | | | | | | | |
Effect of exchange rate Fluctuations on cash held | | | | | | | 293,870 | | | | 110,598 | | | | (95,297 | ) |
| | | | | | | | | | | | | | | | |
Cash and cash equivalents at end of year | | | | | | | 3,621,798 | | | | 4,555,177 | | | | 4,499,588 | |
| | | | | | | | | | | | | | | | |
Additional information | | | | | | | | | | | | | | | | |
Income tax paid | | | | | | | 315,278 | | | | 90,099 | | | | 83,376 | |
The accompanying notes are an integral part of these financial statements.
Recognition of tax assets related to the exclusion of a tax on sales and services which applies to goods, and transportation and communication (Imposto sobre Operações relativas à Circulação de Mercadorias e Prestação de Serviços de Transporte Interestadual e Intermunicipal e de Comunicação), or “ICMS,” from the calculation basis of PIS and COFINS (respectively, the profit participation contribution and the social security financing contribution, both of which are social contributions due on certain revenues net of some expenses) contributions to the subsidiaries Rumo S.A. (“Rumo”), Companhia de Gás de São Paulo – (“Comgás”) and Cosan Lubrificantes e Especialidades S.A. (“CLE”), in the amount of R$ 431,283, which R$ 326,987 is recorded under “Other current tax receivables” and R$ 104,296 as of “Interest on other receivables,” respectively.
Usually, the Company and its subsidiaries acquire assets with a term payment, and do not generate impacts on the statement of cash flows, for the year ended December 31, 2018 there were no impacts of this nature.
Intangible addition in the amount of R$ 128,654 and accounts payable in the amount of R$ 129,038 related to the new agreement entered between the subsidiary CLE and Exxon Mobil Lubricants Trading Company (“Exxon Mobil”) (note 1).
| | • | | Disclosure of interest and dividends |
The Company discloses the dividends and interest on shareholders’ equity received as cash flow from investing activities, with the purpose of avoiding distortions in its cash flows from operation activities.
Interest received or paid is classified as cash flow from financing activities, as it is considered to refer to the costs of obtaining financial resources.
F-13
Cosan Limited
Notes to the consolidated financial statements
(In thousands of Brazilian Reais—R$ unless otherwise stated)
Cosan Limited (“Cosan”) was incorporated in Bermuda on April 30, 2007. Cosan’s class A common shares are traded on the New York Stock Exchange, or “NYSE,” (ticker—CZZ). Mr. Rubens Ometto Silveira Mello is the ultimate controlling shareholder of Cosan. Cosan controls its subsidiaries Cosan S.A. and Cosan Logística S.A. (“Cosan Logística”) through a 60.25% and 72.50% interest, respectively. Cosan, Cosan S.A., Cosan Logística and its subsidiaries are collectively referred to as the “Company.”
In November 2016, Cosan S.A. and Shell International Petroleum Company Limited (“Shell”) executed amendments to certain agreements between them to remove the fixed date call options over Raízen Energia S.A. (“Raízen Energia”) and Raízen Combustíveis (“Raízen Combustíveis”) or the “Joint Ventures,” shares exercisable in 2021 and 2026, and replace them with certain call and put options exercisable by Shell or Cosan S.A. upon the occurrence of certain events including, among others: (i) fundamental breaches of the obligations provided for in the agreements governing the Joint Venture; (ii) breach of anticorruption laws, (iii) insolvency or bankruptcy of a party, (iv) change of control, and (v) in the event of the death or disability of Cosan S.A.’s current Chairman, Mr. Rubens Ometto Silveira Mello. Moreover, Cosan S.A. and Shell agreed to renew the existinglock-up period for five years from the date of the execution of the amendment, following which the parties may sell their shares in each of Raízen Energia and Raízen Combustíveis subject to compliance with certain preemption rights in each other’s favor.
On February 23, 2017, TPG VI Fundo de Investimento em Participações (“TPG”), a shareholder of Rumo, exercised its right to exchange 11,479,987 shares issued by Rumo for shares issued by Cosan S.A. pursuant to the shareholders’ agreement entered into in 2010, subsequently added, between Cosan Logística, TPG, GIF, Cosan S.A. and the Company. Cosan S.A. and GIF agreed to settle financially the stock replacement obligation through of payment of R$ 275,780 and the shares received were valued at fair value in the amount of R$ 97,924 and recorded as capital reserve.
On October 16, 2017, Shell Gas B.V., Integral Investments B.V. and Shell Brazil Holding B.V. (“Shell Brazil”) exercised their put option on the shares issued by Comgás S.A. against Cosan S.A., which transferred its 16.77% of Comgás S.A share capital to Cosan S.A and received from Cosan 17,187,937 shares issued by Cosan S.A. (4.21% share capital).
On December 21, 2017, there was a sale of credit rights related to the assets recorded in the statement of financial position and also the contingent assets in the amount of R$ 1,340,000 (“purchase price”), arising from certain lawsuits, aiming at condemning the Union as a result of the fixing of sugar and alcohol prices below their cost of production. The amount was received on January 31, 2018, as shown at statement of cash flows.
On March 19, 2018, the subsidiary CLE entered into an agreement with Exxon Mobil which grants the exclusive production, import, distribution and marketing rights in Brazil, Bolivia, Paraguay and Uruguay of lubricants and certain other related products under the Mobil brand until November 30, 2038. This agreement came into force on December 1, 2018.
On April 19, 2018, the Company submitted to the São Paulo Stock, Commodities and Futures Exchange (B3 S.A. – Brasil, Bolsa, Balcão), or “B3,” a proposal relating to the discontinuation of our Brazilian Depositary Receipts, or “BDRs,” program pursuant to the procedure set forth in the B3’s Issuer Guide (Manual do Emissor). Once completed, we will take the requisite steps to complete our deregistration with the Brazilian Securities Commission (Comissão de Valores Mobiliários), or “CVM,” and the delisting of our BDRs from the B3. The discontinuation of our BDR program is intended to reduce our regulatory costs and concentrate liquidity of the Company’s stock on the NYSE.
On April 20, 2018, the General Meeting approved the merger of Brado Holding S.A., Rumo Malha Norte Holding Ltda. and Tezza Consultoria de Negócios Ltda. by “Rumo”, so that the merged companies will be extinguished and “Rumo” will succeed the merged ones. This transaction serves the interest of the parties and their shareholders, generating benefits to the parties by providing administrative efficiency and reducing operating costs. In addition, the incorporation of PGT S.A. was approved by ALL Armazéns Gerais Ltda.
On April 24, 2018, Raízen Combustíveis and its subsidiary Raízen Argentina Holdings S.A.U. entered into a contract for the acquisition of Shell’s downstream business in Argentina through the acquisition of 100% of the shares issued by Shell Compañía Argentina de Petróleo S.A and Energina Compañía Argentina de Petróleo S.A. (“Shell Argentina”). The acquisition process was completed on October 1, 2018.
At May 31, 2018, Cosan through its subsidiary Cosan Lubes Investments Limited (“CLI”), acquired control of the companies TTA—SAS Techniques et Technologie Appliquées (“TTA”) in France and LubrigrupoII, S.A. (“LubrigrupoII”) in Portugal, in the amount of R$ 44,235 and R$ 11,339 respectively, generating an additional goodwill in the Lubricants segment of R$ 23,618 and R$ 6,856, respectively. The transferred consideration, net of cash received, totaled R$ 33,028 and R$ 10,044, respectively.
F-14
Cosan Limited
Notes to the consolidated financial statements
(In thousands of Brazilian Reais—R$ unless otherwise stated)
On June 30, 2018, the contingent consideration regarding the acquisition of Stanbridge Group Limited (“Stanbridge”) in November 2017 by the subsidiary Moove Lubricants Limited (“Moove Lubricants”) – previously known as “Comma Oil and Chemicals Limited,” was increased by R$ 31,726 (Note 10.2), due to the fulfillment of certain contractual conditions that resulted in an adjustment to the acquisition accounting.
Additionally, part of the purchase price was allocated in “Customer Relationship” at the amount of R$ 136,499 (Note 10.2), which represents a measurement period adjustment.
On August 7, 2018 BNDES approved financing in the amount of R$ 2,887,298, for the subsidiary Rumo S.A., to support investments in the concession of rail freight transportation. On December 27, 2018, the amount of R$ 799,999 was raised.
At December 20, 2018, Cosan through its subsidiary CLI, acquired control of the company Commercial Lubricants, LLC (d/b/a Metrolube) (“Metrolube”) in New York, United States of America, in the preliminary amount of R$ 112,858, generating an additional goodwill in the Moove segment of R$ 67,548. The transferred consideration, net of cash received, totaled R$ 112,858.
On December 21, 2018, the subsidiary CLI and CVC Fund VII (“CVC”) entered into an investment agreement in which there will be a contribution of R$ 562,000 through the issuance of new common shares representing approximately 30% of Moove’s capital. Of the total capital increase, Moove will receive R$ 434,000 on the closing of the transaction and up to approximately R$ 128,000 until 2021, if certain targets defined in the Investment Agreement are met, without any change in the ownership interest. On March 29, 2019, the transaction was concluded between CVC and CLI, with the completion of conditions precedent, including regulatory approvals, corporate restructuring and applicable bids and the amount of the R$ 434,000 was received.
As announced to the market, on August 2, 2018, the Civil Police of the State of Paraná launched on July 31, 2018, the Operation “Controlled Margin,” with the objective of collecting statements and obtaining documents from employees of fuel distributors operating in Paraná, including Raízen Combustíveis, on suspicion of possible practices to control the final price of fuel sold at retailers located in that region. On the same date, search and seizure warrants were executed and three of Raízen’s employees were temporarily arrested and on August 3, 2018, the court determined the release of them. To this moment, in view of the existing information, no irregular conduct may be attributed to Raízen or its employees. No complaints were filed against any employees of Raízen, and no court order was issued determining the freeze of any assets or funds in its bank accounts.
In addition, also on July 31, 2018, in connection with theso-called “Operação Dubai,” the Prosecution Office of the Federal District filed a complaint against, among other parties, Raízen and one employee on the grounds of alleged anticompetitive practice. In this context, the assessment of Raízen Combustíveis, on the basis of the information available, is that the above claims do not find factual and legal support. In an autonomous action and aiming to obtain indemnification for the damages potentially suffered by the civil society due to these conducts, the Prosecution Office filed a redress action in the face of all those involved, which is in the initial stage of the proceedings. There is an application for the blocking of assets and securities against, among others, Raízen Combustíveis, in the amount of R$ 120,000 which was not effected due to guarantees given in court. Both procedures are being defended and appealed to, since Raízen Combustíveis understands that there are no elements that constitute the responsibility of its or its representatives in the investigated practices.
There was no relevant update on this topic since the disclosure of the material fact up to the year ended December 31, 2018.
At the present date there is no definitive decision or material impact on the business.
However, if the operations prove to be true in the future, any penalties may have an effect on the future financial position, profit or loss from operation and cash flows of Raízen Combustíveis. Regarding to the financial statements of Raízen Combustíveis, it is currently not practicable to determine whether there is any probable loss arising from a present obligation in view of a past event or a reasonable measure regarding the possible provision for contingencies on this matter in this financial information, through interest in earnings of joint ventures.
F-15
Cosan Limited
Notes to the consolidated financial statements
(In thousands of Brazilian Reais—R$ unless otherwise stated)
The consolidated financial statements have been prepared in accordance with International Financial Reporting Standards (IFRS) as issued by the International Accounting Standards Board (IASB).
The relevant information of the financial statements, and only them, are being evidenced and correspond to those used by management in its management.
These consolidated financial statements were authorized for issue by the Board of Directors on February 15, 2019.
Certain amounts of the comparative balances, in the statements of profit or loss, statements of cash flows and in the notes 4, 5, 5.1, 5.5, 5.9, 5.10, 13, 14 and 22, were reclassified to improve the disclosures in the financial statements. These reclassifications had inconsequential impacts on the Company’s financial statements.
Accounting policies are included in the relevant notes to the consolidated financial statements. The accounting policies below are applied throughout the financial statements.
| 3.1 | Functional and presentation currency |
The consolidated financial statements are presented in Brazilian Reais. However, the functional currency of Cosan Limited is the U.S. Dollar (U.S.$). The Brazilian Real is the functional currency of Cosan S.A., Cosan Logística, its subsidiaries and joint ventures, located in Brazil, as it is the currency of the primary economic environment in which they operate, generate and expend cash. The main functional currency for the subsidiaries located outside Brazil is U.S. Dollar, Euro or the Pound Sterling.
Transactions in foreign currencies are translated to the respective functional currencies of each subsidiary using the exchange rates at the dates of the transactions. Monetary assets and liabilities denominated in foreign currencies at the reporting date are translated to the functional currency using the exchange rate at the reporting date.
The assets and liabilities derived from foreign operations, including goodwill and fair value adjustments arising on acquisition, are translated to Brazilian Reais using the exchange rates at the reporting date. Income and expenses of foreign operations are translated to Brazilian Reais using the exchange rates at the dates of the transactions.
Foreign currency translation are recognized and presented in other comprehensive income (loss) in equity. However, if the foreign operation is anon-wholly owned subsidiary, then the relevant proportion of the translation difference is allocated tonon-controlling interests. When a foreign operation is disposed of such that control, significant influence or joint control is lost, the cumulative amount in the translation reserve related to that foreign operation is reclassified to profit or loss as part of the gain or loss on disposal.
These consolidated financial statements have been translated to the Brazilian Real using the following criteria:
| | a) | assets and liabilities have been translated using the exchange rate at the statement of financial position date; |
| | b) | statement of profit or loss, comprehensive income and statement of cash flows have been translated using the monthly average exchange rate; and |
| | c) | shareholders’ equity has been translated using the historical exchange rate. |
Translation effects have been recognized in shareholders’ equity in “Foreign currency translation effects.”
The consolidated financial statements of each subsidiary included in these consolidated financial statements and equity method investments are prepared based on their respective functional currencies. For subsidiaries whose functional currency is a currency other than the Brazilian Real, asset and liability accounts are translated into the Company’s reporting currency using exchange rates in effect at the date of the statement of financial position, and income and expense items are translated using monthly average exchange rates and shareholders’ equity has been translated using the historical exchange rate. The resulting translation adjustments are reported in a separate component of shareholders’ equity, as cumulative translation adjustment.
F-16
Cosan Limited
Notes to the consolidated financial statements
(In thousands of Brazilian Reais—R$ unless otherwise stated)
The exchange rates of the Real (R$) for the functional currencies of its subsidiaries on December 31, 2018 and 2017 are:
| | | | | | | | |
Currency | | December 31, 2018 | | | December 31, 2017 | |
United States dollar (USD) | | | 3,8748 | | | | 3,3080 | |
Pound Sterling (GBP) | | | 4,9617 | | | | 4,4714 | |
Euro (EUR) | | | 4,4390 | | | | 3,9693 | |
| 3.2 | Use of judgments and estimates |
The preparation of the consolidated financial statements in conformity with IFRS requires management to make judgments, estimates and assumptions that affect the application of accounting policies and the reported amounts of assets, liabilities, revenue and expenses at the end of the reporting period. Actual results may differ from these estimates.
Estimates and underlying assumptions are reviewed on an ongoing basis and recognized prospectively. Information about critical judgments, assumptions and estimation uncertainties in applying accounting policies that have the most significant effect on the amounts recognized in the consolidated financial statements is included in the following notes:
i. Note 5.7 – Trade payables
ii. Note 5.10 – Recognized fair value measurements
iii. Note 9 – Investments in joint ventures
iv. Notes 10.1 and 10.2 – Property, plant and equipment and intangible assets and goodwill
v. Note 11.1 – Commitments
vi. Note 13 – Income tax
vii. Note 14 –Provision for legal proceedings
viii. Note 22 –Post-employment benefits
ix. Note 23 – Share-based payment
| 3.3 | Changes in significant accounting policies |
| | i. | IFRS 9 Financial Instruments |
The Company applied IFRS 9 with the initial application date of January 1, 2018, retrospectively, except as described below:
| | • | | the Company has adopted the exception of notre-presenting comparative information from previous periods regarding the classification and measurement requirements (including impairment). Differences in the balances of financial assets and liabilities arising from the adoption of IFRS9 were recorded in retained earnings and reserves on January 1, 2018. Thus, the information presented for 2017 generally does not reflect the requirements of IFRS 9, but the requirements of IAS 39; |
| | • | | certain definitions were made based on the facts and circumstances existing at the date of initial application: i) determination of the business model in which a financial asset is held; ii) the designation and revocation of prior designations of certain financial assets and liabilities as measured at fair value through profit or loss; and |
| | • | | all hedge relationship designations in accordance with IAS 39 existing as of December 31, 2017 meet the hedging criteria in accordance with IFRS 9 as of January 1, 2018 and are therefore designated as continuing hedge relationships. |
F-17
Cosan Limited
Notes to the consolidated financial statements
(In thousands of Brazilian Reais—R$ unless otherwise stated)
The total impact on the Company’s financial position as at January 1, 2018 is as follows:
| | | | |
Assets | | | | |
Trades receivables | | | (10,932 | ) |
Investments in joint ventures | | | (1,340 | ) |
Deferred tax | | | 3,584 | |
Equity | | | | |
Retained earnings | | | 8,688 | |
| | a) | Classification and measurement |
The Company initially measures a financial asset at its fair value plus, in the case of a financial asset not at fair value through profit or loss, transaction costs, except those measured at amortized cost for financial assets that are kept within a business model with the objective of obtaining contractual cash flows that meet the ‘solely payments of principal and interest’ on the principal amount outstanding “SPPI criterion.”
Under IFRS 9, debt financial instruments are subsequently measured at fair value through profit or loss, or “FVPL,” amortized cost, or fair value through other comprehensive income “FVOCI.”
The classification is based on two criteria: the Company’s business model for managing the assets; and whether the instruments’ contractual cash flows represent SPPI criterion.
The evaluation of the Company’s business models was carried out from the date of initial application on January 1, 2018 and retrospectively applied to financial assets that were not derecognized before January 1, 2018. The assessment of whether cash flows contractual debt instruments are solely composed of principal and interest were made based on the facts and circumstances as in the initial recognition of the assets. This category includes trade accounts receivable, cash and cash equivalents, restricted cash, receivables from related parties, other financial assets and dividends and interest on shareholders’ equity receivable. No new measurement of financial assets was carried out.
The adoption of IFRS 9 has fundamentally changed the Company’s accounting for impairment losses for financial assets by replacing IAS 39’s incurred loss approach with a forward-looking expected credit loss (ECL) approach.
The Company recognizes a provision for expected credit loss for its trade receivable. The simplified standard approach is applied and the expected credit losses for the entire life of the asset are calculated. The Company has established a provisioning matrix that is based on the historical experience of credit loss of each business segment, adjusted for specific prospective factors for the debtors and for the economic environment.
The joint ventures Raízen Energia and Raízen Combustívies adopted an expected loss matrix considering the grouping of customers with similar default characteristics, by sales channel and internal rating. The impact of the adoption of the standard was a loss of R$ 2,680 (R$ 1,340 in the interest in earnings of joint ventures of Cosan S.A.).
The Company applied the changes of hedge accounting prospectively. At the date of initial application, all of the Company’s existing hedging relationships were eligible to be treated as continuing hedging relationships. Consistent with previous periods, the Company continued to designate the change in the fair value of the entire forward contract in the Company’s cash flow hedge relationships and, as such, the adoption of the hedge accounting requirements of IFRS 9 had no significant impact on the Company’s consolidated financial statements.
According to IAS 39, all gains and losses arising from the Company’s cash flow hedge relationships were eligible to be subsequently reclassified to income. Therefore, after the adoption of IFRS 9, the net cash flow hedge gain or loss was presented under “Other comprehensive income not being reclassified to income.” This amendment applies only prospectively from the date of initial application of IFRS 9 and has no impact on the presentation of comparative figures.
F-18
Cosan Limited
Notes to the consolidated financial statements
(In thousands of Brazilian Reais—R$ unless otherwise stated)
| | ii. | IFRS 15 Revenue from Contracts with Customers |
The assets deriving from infrastructure concession assets during the construction period at and contracts with clients at Comgás and CLE, respectively, which were previously accounted as ‘intangible assets’ are now booked as ‘contract asset,’ presented in the statement of financial position in the ‘Other non-current assets.’
The Company has adopted the retrospective method with cumulative transitional effect. In summary, the following adjustments were made to the amounts recognized in the statement of financial position at the date of initial application:
| | | | | | | | | | | | | | | | |
| | | January 1, 2018 | |
| | | IAS 18 | | | IFRS 12 | | | Reclassification | | | IFRS 15 | |
Intangible assets | | | 8,346 | | | | 180,152 | | | | (188,498 | ) | | | — | |
Othernon-current assets (contract asset) | | | — | | | | — | | | | 188,498 | | | | 188,498 | |
Additionally, the subsidiary CLE pays fees to the customer in order to obtain a new contract. In most cases, these payments are associated with a volume acquired by the customer and are not capitalized, being recognized as a cost of sales. On December 31, 2018, the incremental costs of obtaining a contract and costs to fulfil a contract was R$ 73,585. In 2017, such fees were recognized as selling expenses when incurred in the amount of R$ 82,941.
The following segment information is used by Cosan’s senior management (the “Chief Operating Decision Maker”) to assess the performance of the operating segments and to make decisions with regards to the allocation of resources. This information is prepared on a basis consistent with the accounting policies used in the preparation of the financial statements. Cosan evaluates the performance of its operating segments based on the measure of Earnings Before Interest Tax, Depreciation and Amortization (“EBITDA”).
Reported segments:
| | i. | Raízen Energia: production and marketing of a variety of products derived from sugar cane, including raw sugar (Very High Polarization, or “VHP”), anhydrous and hydrated ethanol, and activities related to energy cogeneration from sugarcane bagasse. In addition, this segment holds interests in companies engaged in research and development on new technology; |
| | ii. | Raízen Combustíveis: distribution and marketing of fuels, mainly through a franchised network of service stations under the “Shell” brand throughout Brazil,petroleum refining, the operation of fuel resellers, the manufacture and sale of automotive and industrial lubricants, and the production and sale of liquefied petroleum gas throughout Argentina; |
| | iii. | Comgás: distribution of piped natural gas to part of the State of São Paulo to customers in the industrial, residential, commercial, automotive and cogeneration sectors; |
| | iv. | Logistic: logistics services for rail transportation, storage and port loading of commodities, mainly for grains and sugar, leasing of locomotives, wagons and another railway equipment; and |
| | v. | Moove: Production and distribution of lubricants licensed under the Mobil brand in Brazil, Bolivia, Uruguay, Paraguay, Argentina, the United States and European market through the subsidiaries CLE, Stanbridge, TTA, LubrigrupoII, Cosan Lubrificantes S.R.L (“Cosan S.R.L”) and Moove Lubricants under the Comma brand for the European and Asian market and corporate activities (“Moove”). |
Reconciliation:
| | i. | Cosan Corporate: digital wallet platform and other investments, in addition to the corporate activities of the Company. The Cosan corporate segment includes the financing subsidiaries for the Cosan group. |
Although, Raízen Energia and Raízen Combustíveis are equity accounted joint ventures and are no longer proportionally consolidated, senior management continues to review segment information. A reconciliation of these segments is presented in the column “Deconsolidation of joint ventures.”
F-19
Cosan Limited
Notes to the consolidated financial statements
(In thousands of Brazilian Reais—R$ unless otherwise stated)
| | | | | | | | | | | | | | | | | | | | | | | | | | | | | | | | | | | | | | | | |
| | | December 31, 2018 | |
| | | Reported segments | | | Reconciliation | | | Consolidated | |
| | | Raízen
Energia | | | Raízen Combustíveis | | | Comgás | | | Moove | | | Logistic | | | Cosan
Corporate | | | Deconsolidated
effects | | | Segment
elimination | |
| | | Brazil | | | Argentina | |
Statement of profit or loss: | | | | | | | | | | | | | | | | | | | | | | | | | | | | | | | | | | | | | | | | |
Gross sales | | | 21,296,564 | | | | 85,793,511 | | | | 4,497,337 | | | | 8,695,208 | | | | 4,381,188 | | | | 6,988,737 | | | | 9,273 | | | | (111,587,412 | ) | | | (40,128 | ) | | | 20,034,278 | |
Domestic market(i) | | | 16,271,074 | | | | 83,350,683 | | | | 4,497,337 | | | | 8,695,208 | | | | 4,242,819 | | | | 6,689,177 | | | | 9,273 | | | | (104,119,094 | ) | | | (40,128 | ) | | | 19,596,349 | |
External market(i) | | | 5,025,490 | | | | 2,442,828 | | | | — | | | | — | | | | 138,369 | | | | 299,560 | | | | — | | | | (7,468,318 | ) | | | — | | | | 437,929 | |
Net sales | | | 19,798,546 | | | | 81,960,154 | | | | 3,243,937 | | | | 6,840,011 | | | | 3,449,949 | | | | 6,584,936 | | | | 9,165 | | | | (105,002,637 | ) | | | (40,128 | ) | | | 16,843,933 | |
Cost of sales | | | (18,136,443 | ) | | | (78,223,747 | ) | | | (3,074,701 | ) | | | (4,901,715 | ) | | | (2,781,084 | ) | | | (4,465,634 | ) | | | (11,612 | ) | | | 99,434,891 | | | | 40,128 | | | | (12,119,917 | ) |
Gross profit | | | 1,662,103 | | | | 3,736,407 | | | | 169,236 | | | | 1,938,297 | | | | 668,865 | | | | 2,119,302 | | | | (2,448 | ) | | | (5,567,746 | ) | | | — | | | | 4,724,016 | |
Selling expenses | | | (768,831 | ) | | | (1,378,292 | ) | | | (128,443 | ) | | | (613,046 | ) | | | (393,317 | ) | | | (12,872 | ) | | | (4,250 | ) | | | 2,275,566 | | | | — | | | | (1,023,485 | ) |
General and administrative expenses | | | (664,690 | ) | | | (479,848 | ) | | | (46,400 | ) | | | (367,670 | ) | | | (132,336 | ) | | | (301,698 | ) | | | (180,130 | ) | | | 1,190,938 | | | | — | | | | (981,834 | ) |
Other income (expenses), net | | | 570,343 | | | | 455,250 | | | | 11,566 | | | | 763,609 | | | | 2,391 | | | | (65,302 | ) | | | 37,453 | | | | (1,037,159 | ) | | | — | | | | 738,151 | |
Equity in earnings of associates | | | — | | | | (9,953 | ) | | | — | | | | — | | | | (349 | ) | | | 10,179 | | | | 2,125,688 | | | | 9,953 | | | | (2,084,045 | ) | | | 51,473 | |
Equity in earnings of joint ventures | | | 22,139 | | | | 1 | | | | — | | | | — | | | | — | | | | — | | | | 946,282 | | | | (22,140 | ) | | | — | | | | 946,282 | |
Finance results | | | (318,335 | ) | | | (445,909 | ) | | | (7,692 | ) | | | 78,773 | | | | (27,279 | ) | | | (1,208,819 | ) | | | (453,611 | ) | | | 771,936 | | | | — | | | | (1,610,936 | ) |
Finance expense | | | (968,066 | ) | | | (460,734 | ) | | | (12,818 | ) | | | (504,071 | ) | | | (35,157 | ) | | | (1,518,156 | ) | | | (798,507 | ) | | | 1,441,618 | | | | 6,663 | | | | (2,849,228 | ) |
Finance Income | | | 583,546 | | | | 206,718 | | | | 5,686 | | | | 581,181 | | | | 9,928 | | | | 224,531 | | | | 223,748 | | | | (795,950 | ) | | | (6,663 | ) | | | 1,032,725 | |
Foreign exchange losses, net | | | (90,780 | ) | | | (763,008 | ) | | | (560 | ) | | | (93,780 | ) | | | (26,875 | ) | | | (668,063 | ) | | | (766,497 | ) | | | 854,348 | | | | — | | | | (1,555,215 | ) |
Derivatives | | | 156,965 | | | | 571,115 | | | | — | | | | 95,443 | | | | 24,825 | | | | 752,869 | | | | 887,645 | | | | (728,080 | ) | | | — | | | | 1,760,782 | |
Income tax (expense)benefit | | | 9,007 | | | | (443,136 | ) | | | (8,221 | ) | | | (540,995 | ) | | | (49,439 | ) | | | (268,440 | ) | | | 98,387 | | | | 442,350 | | | | — | | | | (760,487 | ) |
| | | | | | | | | | | | | | | | | | | | | | | | | | | | | | | | | | | | | | | | |
Profit (loss) from continuing operations | | | 511,736 | | | | 1,434,520 | | | | (9,954 | ) | | | 1,258,968 | | | | 68,536 | | | | 272,350 | | | | 2,567,371 | | | | (1,936,302 | ) | | | (2,084,045 | ) | | | 2,083,180 | |
| | | | | | | | | | | | | | | | | | | | | | | | | | | | | | | | | | | | | | | | |
Net income attributable to: | | | | | | | | | | | | | | | | | | | | | | | | | | | | | | | | | | | | | | | | |
Owners of the Parent | | | 507,580 | | | | 1,386,362 | | | | (9,953 | ) | | | 1,008,191 | | | | 67,880 | | | | 54,114 | | | | 2,562,278 | | | | (1,883,989 | ) | | | (2,717,015 | ) | | | 975,448 | |
Non-controlling interests | | | 4,156 | | | | 48,158 | | | | — | | | | 250,777 | | | | 656 | | | | 218,236 | | | | 5,093 | | | | (52,314 | ) | | | 632,970 | | | | 1,107,732 | |
| | | | | | | | | | | | | | | | | | | | | | | | | | | | | | | | | | | | | | | | |
| | | 511,736 | | | | 1,434,520 | | | | (9,953 | ) | | | 1,258,968 | | | | 68,536 | | | | 272,350 | | | | 2,567,371 | | | | (1,936,303 | ) | | | (2,084,045 | ) | | | 2,083,180 | |
Other select data: | | | | | | | | | | | | | | | | | | | | | | | | | | | | | | | | | | | | | | | | |
Depreciation and amortization | | | 2,147,455 | | | | 191,114 | | | | 76,140 | | | | 464,517 | | | | 91,972 | | | | 1,491,306 | | | | 13,549 | | | | (2,414,709 | ) | | | — | | | | 2,061,344 | |
EBITDA | | | 2,968,519 | | | | 2,514,679 | | | | 82,099 | | | | 2,185,707 | | | | 237,226 | | | | 3,240,915 | | | | 2,936,144 | | | | (5,565,297 | ) | | | (2,084,045 | ) | | | 6,515,947 | |
Additions to PP&E, intangible and biological assets | | | 2,573,428 | | | | 258,066 | | | | 136,725 | | | | 531,739 | | | | 47,346 | | | | 1,996,746 | | | | 52,410 | | | | (2,968,219 | ) | | | — | | | | 2,628,241 | |
Reconciliation of EBITDA: | | | | | | | | | | | | | | | | | | | | | | | | | | | | | | | | | | | | | | | | |
Profit (loss) for the year | | | 511,736 | | | | 1,434,520 | | | | (9,954 | ) | | | 1,258,968 | | | | 68,536 | | | | 272,350 | | | | 2,567,371 | | | | (1,936,302 | ) | | | (2,084,045 | ) | | | 2,083,180 | |
Income tax and social contribution | | | (9,007 | ) | | | 443,136 | | | | 8,221 | | | | 540,995 | | | | 49,439 | | | | 268,440 | | | | (98,387 | ) | | | (442,350 | ) | | | — | | | | 760,487 | |
Finance results, net | | | 318,335 | | | | 445,909 | | | | 7,692 | | | | (78,773 | ) | | | 27,279 | | | | 1,208,819 | | | | 453,611 | | | | (771,936 | ) | | | — | | | | 1,610,936 | |
Depreciation and amortization | | | 2,147,455 | | | | 191,114 | | | | 76,140 | | | | 464,517 | | | | 91,972 | | | | 1,491,306 | | | | 13,549 | | | | (2,414,709 | ) | | | — | | | | 2,061,344 | |
| | | | | | | | | | | | | | | | | | | | | | | | | | | | | | | | | | | | | | | | |
EBITDA | | | 2,968,519 | | | | 2,514,679 | | | | 82,099 | | | | 2,185,707 | | | | 237,226 | | | | 3,240,915 | | | | 2,936,144 | | | | (5,565,297 | ) | | | (2,084,045 | ) | | | 6,515,947 | |
| | | | | | | | | | | | | | | | | | | | | | | | | | | | | | | | | | | | | | | | |
| (i) | Domestic markets: sales within the countries where each entity is located; external markets: sales export. |
F-20
Cosan Limited
Notes to the consolidated financial statements
(In thousands of Brazilian Reais—R$ unless otherwise stated)
| | | | | | | | | | | | | | | | | | | | | | | | | | | | | | | | | | | | |
| | | December 31, 2017 | |
| | | Reported segments | | | Reconciliation | | | | |
| | | Raízen
Energia | | | Raízen
Combustíveis | | | Comgás | | | Moove | | | Logistic | | | Cosan
Corporate | | | Deconsolidated
effects | | | Segment
eliminations | | | Consolidated | |
Statement of profit or loss: | | | | | | | | | | | | | | | | | | | | | | | | | | | | | | | | | | | | |
Gross sales | | | 14,060,676 | | | | 75,681,280 | | | | 7,097,156 | | | | 2,787,145 | | | | 6,332,656 | | | | 4,285 | | | | (89,741,956 | ) | | | (34,706 | ) | | | 16,186,536 | |
Domestic market | | | 7,903,059 | | | | 74,080,815 | | | | 7,097,156 | | | | 2,730,321 | | | | 6,062,622 | | | | 4,285 | | | | (81,983,874 | ) | | | (34,706 | ) | | | 15,859,678 | |
External market | | | 6,157,617 | | | | 1,600,465 | | | | — | | | | 56,824 | | | | 270,034 | | | | — | | | | (7,758,082 | ) | | | — | | | | 326,858 | |
Net sales | | | 13,152,678 | | | | 72,789,148 | | | | 5,537,857 | | | | — | | | | 5,946,349 | | | | 3,441 | | | | (85,941,826 | ) | | | (34,706 | ) | | | 13,582,463 | |
Cost of sales | | | (10,907,652 | ) | | | (68,875,292 | ) | | | (3,492,375 | ) | | | (1,545,657 | ) | | | (4,220,988 | ) | | | (7,896 | ) | | | 79,782,944 | | | | 34,706 | | | | (9,232,210 | ) |
Gross profit | | | 2,245,026 | | | | 3,913,856 | | | | 2,045,482 | | | | 583,865 | | | | 1,725,361 | | | | (4,455 | ) | | | (6,158,882 | ) | | | — | | | | 4,350,253 | |
Selling expenses | | | (803,157 | ) | | | (1,345,847 | ) | | | (652,901 | ) | | | (386,705 | ) | | | (28,846 | ) | | | (211 | ) | | | 2,149,004 | | | | — | | | | (1,068,663 | ) |
General and administrative expenses | | | (618,064 | ) | | | (455,743 | ) | | | (344,990 | ) | | | (94,002 | ) | | | (285,409 | ) | | | (210,889 | ) | | | 1,073,807 | | | | — | | | | (935,290 | ) |
Other income (expense), net | | | (107,953 | ) | | | 312,187 | | | | (26,422 | ) | | | (3,679 | ) | | | (3,304 | ) | | | 911,004 | | | | (204,234 | ) | | | — | | | | 877,599 | |
Finance results | | | 129 | | | | (359,767 | ) | | | (225,541 | ) | | | (54,370 | ) | | | (1,665,842 | ) | | | (805,746 | ) | | | 359,638 | | | | — | | | | (2,751,499 | ) |
Finance expense | | | (905,213 | ) | | | (251,038 | ) | | | (623,924 | ) | | | (46,250 | ) | | | (1,900,092 | ) | | | (1,134,580 | ) | | | 1,156,251 | | | | 331 | | | | (3,704,515 | ) |
Finance income | | | 681,362 | | | | 134,904 | | | | 398,758 | | | | 17,805 | | | | 261,661 | | | | 192,845 | | | | (816,266 | ) | | | (331 | ) | | | 870,738 | |
Foreign exchange losses, net | | | (54,866 | ) | | | (105,513 | ) | | | (11,501 | ) | | | (7,478 | ) | | | (127,508 | ) | | | (53,290 | ) | | | 160,379 | | | | — | | | | (199,777 | ) |
Derivatives | | | 278,846 | | | | (138,120 | ) | | | 11,126 | | | | (18,447 | ) | | | 100,097 | | | | 189,279 | | | | (140,726 | ) | | | — | | | | 282,055 | |
Interest in earnings of associates | | | (54,544 | ) | | | — | | | | — | | | | (7,665 | ) | | | 4,243 | | | | 1,112,654 | | | | 54,544 | | | | (1,092,070 | ) | | | 17,162 | |
Interest in earnings of joint ventures | | | — | | | | — | | | | — | | | | — | | | | — | | | | 985,090 | | | | — | | | | — | | | | 985,090 | |
Income tax expense benefit | | | (78,937 | ) | | | (615,806 | ) | | | (235,972 | ) | | | (20,141 | ) | | | (10,215 | ) | | | (162,027 | ) | | | 694,743 | | | | — | | | | (428,355 | ) |
| | | | | | | | | | | | | | | | | | | | | | | | | | | | | | | | | | | | |
Profit (loss) from continuing operations | | | 582,500 | | | | 1,448,880 | | | | 559,656 | | | | 17,303 | | | | (264,012 | ) | | | 1,825,420 | | | | (2,031,380 | ) | | | (1,092,070 | ) | | | 1,046,297 | |
Total net income attributable to: | | | | | | | | | | | | | | | | | | | | | | | | | | | | | | | | | | | | |
Owners of the Company | | | 582,500 | | | | 1,389,260 | | | | 364,455 | | | | 17,303 | | | | (79,515 | ) | | | 1,818,468 | | | | (1,971,760 | ) | | | (1,569,690 | ) | | | 551,021 | |
Non-controlling interests | | | — | | | | 59,620 | | | | 195,201 | | | | — | | | | (184,497 | ) | | | 6,952 | | | | (59,620 | ) | | | 477,620 | | | | 495,276 | |
| | | | | | | | | | | | | | | | | | | | | | | | | | | | | | | | | | | | |
| | | 582,500 | | | | 1,448,880 | | | | 559,656 | | | | 17,303 | | | | (264,012 | ) | | | 1,825,420 | | | | (2,031,380 | ) | | | (1,092,070 | ) | | | 1,046,297 | |
Other selected data: | | | | | | | | | | | | | | | | | | | | | | | | | | | | | | | | | | | | |
Depreciation and amortization | | | 2,131,088 | | | | 635,920 | | | | 496,755 | | | | 82,898 | | | | 1,341,687 | | | | 17,053 | | | | (2,767,008 | ) | | | — | | | | 1,938,393 | |
EBITDA | | | 2,792,396 | | | | 3,060,373 | | | | 1,517,924 | | | | 174,712 | | | | 2,753,732 | | | | 2,810,246 | | | | (5,852,769 | ) | | | (1,092,070 | ) | | | 6,164,544 | |
Additions to PP&E, intangible and biological assets | | | 2,226,162 | | | | 853,975 | | | | 352,958 | | | | 48,612 | | | | 2,045,390 | | | | 10,498 | | | | (3,080,137 | ) | | | — | | | | 2,457,458 | |
Reconciliation of EBITDA: | | | | | | | | | | | | | | | | | | | | | | | | | | | | | | | | | | | | |
Profit (loss) for the year | | | 582,500 | | | | 1,448,880 | | | | 559,656 | | | | 17,303 | | | | (264,012 | ) | | | 1,825,420 | | | | (2,031,380 | ) | | | (1,092,070 | ) | | | 1,046,297 | |
Income tax and social contribution | | | 78,937 | | | | 615,806 | | | | 235,972 | | | | 20,141 | | | | 10,215 | | | | 162,027 | | | | (694,743 | ) | | | — | | | | 428,355 | |
Finance result, net | | | (129 | ) | | | 359,767 | | | | 225,541 | | | | 54,370 | | | | 1,665,842 | | | | 805,746 | | | | (359,638 | ) | | | — | | | | 2,751,499 | |
Depreciation and amortization | | | 2,131,088 | | | | 635,920 | | | | 496,755 | | | | 82,898 | | | | 1,341,687 | | | | 17,053 | | | | (2,767,008 | ) | | | — | | | | 1,938,393 | |
| | | | | | | | | | | | | | | | | | | | | | | | | | | | | | | | | | | | |
EBITDA | | | 2,792,396 | | | | 3,060,373 | | | | 1,517,924 | | | | 174,712 | | | | 2,753,732 | | | | 2,810,246 | | | | (5,852,769 | ) | | | (1,092,070 | ) | | | 6,164,544 | |
| | | | | | | | | | | | | | | | | | | | | | | | | | | | | | | | | | | | |
F-21
Cosan Limited
Notes to the consolidated financial statements
(In thousands of Brazilian Reais—R$ unless otherwise stated)
| | | | | | | | | | | | | | | | | | | | | | | | | | | | | | | | | | | | | | | | |
| | | | | | | | | | | | | | | | | | | | | | | | | | | | | | | |
| | | December 31, 2016 | |
| | | Reported segments | | | Reconciliation | | | | |
| | | Raízen
Energia | | | Raízen
Combustíveis | | | Comgás | | | Radar | | | Moove | | | Logistic | | | Cosan
Corporate | | | Deconsolidated
effects | | | Segment
eliminations | | | Consolidated | |
Statement of profit or loss: | | | | | | | | | | | | | | | | | | | | | | | | | | | | | | | | | | | | | | | | |
Goss sales | | | 13,887,406 | | | | 70,729,562 | | | | 7,022,449 | | | | — | | | | 2,530,479 | | | | 5,496,948 | | | | 1,176 | | | | (84,616,968 | ) | | | (38,209 | ) | | | 15,012,843 | |
Domestic market | | | 6,859,999 | | | | 70,729,562 | | | | 7,022,449 | | | | — | | | | 2,486,156 | | | | 5,254,363 | | | | 1,176 | | | | (77,589,561 | ) | | | (38,209 | ) | | | 14,725,935 | |
External market | | | 7,027,407 | | | | — | | | | — | | | | — | | | | 44,323 | | | | 242,585 | | | | — | | | | (7,027,407 | ) | | | — | | | | 286,908 | |
Net sales | | | 13,133,737 | | | | 68,143,047 | | | | 5,657,246 | | | | — | | | | 1,883,674 | | | | 5,014,555 | | | | 873 | | | | (81,276,784 | ) | | | (38,209 | ) | | | 12,518,139 | |
Cost of sales | | | (9,967,530 | ) | | | (64,445,939 | ) | | | (3,174,134 | ) | | | — | | | | (1,398,751 | ) | | | (3,769,147 | ) | | | (13,667 | ) | | | 74,413,469 | | | | 38,209 | | | | (8,317,490 | ) |
Gross profit | | | 3,166,207 | | | | 3,697,108 | | | | 2,483,112 | | | | — | | | | 484,923 | | | | 1,245,408 | | | | (12,794 | ) | | | (6,863,315 | ) | | | — | | | | 4,200,649 | |
Selling expenses | | | (732,680 | ) | | | (1,303,338 | ) | | | (670,557 | ) | | | — | | | | (362,045 | ) | | | (4,649 | ) | | | (291 | ) | | | 2,036,018 | | | | — | | | | (1,037,542 | ) |
General and administrative expenses | | | (567,400 | ) | | | (447,762 | ) | | | (332,349 | ) | | | — | | | | (72,567 | ) | | | (342,961 | ) | | | (252,857 | ) | | | 1,015,162 | | | | — | | | | (1,000,734 | ) |
Other income (expense), net | | | (15,249 | ) | | | 844,257 | | | | (26,437 | ) | | | — | | | | 7,523 | | | | (539 | ) | | | (96,849 | ) | | | (829,008 | ) | | | — | | | | (116,302 | ) |
Finance results | | | 531,049 | | | | (584,487 | ) | | | (263,169 | ) | | | — | | | | (77,301 | ) | | | (1,673,482 | ) | | | (1,147,709 | ) | | | 53,438 | | | | 105,885 | | | | (3,055,776 | ) |
Finance expense | | | (918,912 | ) | | | (273,874 | ) | | | (730,422 | ) | | | — | | | | (49,102 | ) | | | (1,951,393 | ) | | | (1,048,324 | ) | | | 1,192,786 | | | | 105,885 | | | | (3,673,356 | ) |
Finance income | | | 653,670 | | | | 233,453 | | | | 466,646 | | | | — | | | | 4,928 | | | | 302,371 | | | | 328,973 | | | | (887,123 | ) | | | — | | | | 1,102,918 | |
Foreign exchange losses, net | | | (57,951 | ) | | | 750,939 | | | | 223,943 | | | | — | | | | 47,288 | | | | 76,082 | | | | 649,796 | | | | (692,988 | ) | | | — | | | | 997,109 | |
Derivatives | | | 854,242 | | | | (1,295,005 | ) | | | (223,336 | ) | | | — | | | | (80,415 | ) | | | (100,542 | ) | | | (1,078,154 | ) | | | 440,763 | | | | — | | | | (1,482,447 | ) |
Interest in earnings of associates | | | (68,641 | ) | | | (310 | ) | | | — | | | | — | | | | (9,755 | ) | | | 8,381 | | | | 1,066,818 | | | | 68,951 | | | | (1,069,884 | ) | | | (4,440 | ) |
Interest in earnings of joint ventures | | | — | | | | — | | | | — | | | | — | | | | — | | | | — | | | | 1,570,132 | | | | — | | | | — | | | | 1,570,132 | |
Income tax expense benefit | | | (658,860 | ) | | | (673,099 | ) | | | (369,966 | ) | | | — | | | | (553 | ) | | | 34,513 | | | | 310,305 | | | | 1,331,959 | | | | (36,001 | ) | | | (61,702 | ) |
| | | | | | | | | | | | | | | | | | | | | | | | | | | | | | | | | | | | | | | | |
Profit (loss) from continuing operations | | | 1,654,426 | | | | 1,532,369 | | | | 820,634 | | | | — | | | | (29,775 | ) | | | (733,329 | ) | | | 1,436,755 | | | | (3,186,795 | ) | | | (1,000,000 | ) | | | 494,285 | |
Profit from discontinued operation, net of tax | | | — | | | | — | | | | — | | | | 69,261 | | | | — | | | | — | | | | (123,386 | ) | | | — | | | | 18,863 | | | | (35,262 | ) |
Total net income attributable to: | | | | | | | | | | | | | | | | | | | | | | | | | | | | | | | | | | | | | | | | |
Owners of the Company | | | 1,654,338 | | | | 1,476,244 | | | | 514,228 | | | | 21,664 | | | | (29,775 | ) | | | (206,694 | ) | | | 1,313,369 | | | | (3,130,582 | ) | | | (1,334,988 | ) | | | 277,804 | |
Non-controlling interests | | | 88 | | | | 56,125 | | | | 306,406 | | | | 47,597 | | | | — | | | | (526,635 | ) | | | — | | | | (56,213 | ) | | | 353,851 | | | | 181,219 | |
| | | | | | | | | | | | | | | | | | | | | | | | | | | | | | | | | | | | | | | | |
| | | 1,654,426 | | | | 1,532,369 | | | | 820,634 | | | | 69,261 | | | | (29,775 | ) | | | (733,329 | ) | | | 1,313,369 | | | | (3,186,795 | ) | | | (981,137 | ) | | | 459,023 | |
Other selected data: | | | | | | | | | | | | | | | | | | | | | | | | | | | | | | | | | | | | | | | | |
Depreciation and amortization | | | 2,192,019 | | | | 624,395 | | | | 510,957 | | | | — | | | | 88,350 | | | | 1,120,019 | | | | 16,007 | | | | (2,816,414 | ) | | | — | | | | 1,735,333 | |
EBITDA | | | 3,974,256 | | | | 3,414,350 | | | | 1,964,726 | | | | — | | | | 136,429 | | | | 2,025,659 | | | | 2,290,166 | | | | (7,388,606 | ) | | | (1,069,884 | ) | | | 5,347,096 | |
Additions to PP&E, intangible and biological assets | | | 2,001,509 | | | | 797,009 | | | | 438,366 | | | | — | | | | 41,557 | | | | 1,699,226 | | | | 11,356 | | | | (2,798,518 | ) | | | — | | | | 2,190,505 | |
Reconciliation of EBITDA: | | | | | | | | | | | | | | | | | | | | | | | | | | | | | | | | | | | | | | | | |
Profit (loss) for the year | | | 1,654,426 | | | | 1,532,369 | | | | 820,634 | | | | — | | | | (29,775 | ) | | | (733,329 | ) | | | 1,436,755 | | | | (3,186,795 | ) | | | (1,000,000 | ) | | | 494,285 | |
Income tax and social contribution | | | 658,860 | | | | 673,099 | | | | 369,966 | | | | — | | | | 553 | | | | (34,513 | ) | | | (310,305 | ) | | | (1,331,959 | ) | | | 36,001 | | | | 61,702 | |
Finance result, net | | | (531,049 | ) | | | 584,487 | | | | 263,169 | | | | — | | | | 77,301 | | | | 1,673,482 | | | | 1,147,709 | | | | (53,438 | ) | | | (105,885 | ) | | | 3,055,776 | |
Depreciation and amortization | | | 2,192,019 | | | | 624,395 | | | | 510,957 | | | | — | | | | 88,350 | | | | 1,120,019 | | | | 16,007 | | | | (2,816,414 | ) | | | — | | | | 1,735,333 | |
| | | | | | | | | | | | | | | | | | | | | | | | | | | | | | | | | | | | | | | | |
EBITDA | | | 3,974,256 | | | | 3,414,350 | | | | 1,964,726 | | | | — | | | | 136,429 | | | | 2,025,659 | | | | 2,290,166 | | | | (7,388,606 | ) | | | (1,069,884 | ) | | | 5,347,096 | |
| | | | | | | | | | | | | | | | | | | | | | | | | | | | | | | | | | | | | | | | |
F-22
Cosan Limited
Notes to the consolidated financial statements
(In thousands of Brazilian Reais—R$ unless otherwise stated)
| | | | | | | | | | | | | | | | | | | | | | | | | | | | | | | | | | | | | | | | |
| | | December 31, 2018 | |
| | | Reported segments | | | Reconciliation | | | Consolidated | |
| | | Raízen
Energia | | | Raízen Combustíveis | | | Comgás | | | Moove | | | Logistic | | | Cosan
Corporate | | | Deconsolidated
effects | | | Segment
elimination | |
| | | Brazil | | | Argentina | |
Statement of financial position: | | | | | | | | | | | | | | | | | | | | | | | | | | | | | | | | | | | | | | | | |
Cash and cash equivalents | | | 2,437,571 | | | | 864,105 | | | | 490,960 | | | | 602,618 | | | | 206,702 | | | | 143,710 | | | | 2,668,768 | | | | (3,792,636 | ) | | | — | | | | 3,621,798 | |
Marketable securities | | | — | | | | — | | | | — | | | | 1,124,723 | | | | 13,033 | | | | 2,843,435 | | | | 221,644 | | | | — | | | | — | | | | 4,202,835 | |
Trade receivables | | | 1,061,297 | | | | 2,747,503 | | | | 372,202 | | | | 695,147 | | | | 446,645 | | | | 438,062 | | | | 8,338 | | | | (4,181,002 | ) | | | — | | | | 1,588,192 | |
Derivative financial instruments | | | 1,956,616 | | | | 639,976 | | | | — | | | | 368,928 | | | | 29,976 | | | | 892,461 | | | | 1,257,492 | | | | (2,596,592 | ) | | | — | | | | 2,548,857 | |
Inventories | | | 3,618,573 | | | | 2,078,003 | | | | 1,284,087 | | | | 65,259 | | | | 385,901 | | | | 263,386 | | | | 1,744 | | | | (6,980,663 | ) | | | — | | | | 716,290 | |
Other financial assets | | | 516,519 | | | | — | | | | — | | | | — | | | | — | | | | — | | | | — | | | | (516,519 | ) | | | — | | | | — | |
Other current assets | | | 3,203,838 | | | | 3,045,745 | | | | 1,122,633 | | | | 641,042 | | | | 161,076 | | | | 413,267 | | | | 1,016,569 | | | | (7,372,216 | ) | | | (540,745 | ) | | | 1,691,209 | |
Othernon-current assets | | | 4,141,547 | | | | 3,508,485 | | | | 66,117 | | | | 282,572 | | | | 750,088 | | | | 2,693,158 | | | | 1,536,566 | | | | (7,716,149 | ) | | | (1,117,633 | ) | | | 4,144,751 | |
Investments in associates | | | — | | | | (266 | ) | | | 266 | | | | — | | | | 13,799 | | | | 44,001 | | | | 13,111,569 | | | | — | | | | (12,790,850 | ) | | | 378,519 | |
Investments in joint ventures | | | 567,785 | | | | 266 | | | | — | | | | — | | | | — | | | | — | | | | 8,077,907 | | | | (568,051 | ) | | | — | | | | 8,077,907 | |
Biological assets | | | 740,473 | | | | — | | | | — | | | | — | | | | — | | | | — | | | | — | | | | (740,739 | ) | | | — | | | | — | |
Property, plant and equipment | | | 10,912,819 | | | | 2,292,355 | | | | 3,182,272 | | | | — | | | | 321,746 | | | | 11,916,818 | | | | 179,258 | | | | (16,387,446 | ) | | | — | | | | 12,417,822 | |
Intangible assets and goodwill | | | 3,626,819 | | | | 2,513,923 | | | | 8,591 | | | | 8,279,593 | | | | 1,191,627 | | | | 7,493,882 | | | | 7,434 | | | | (6,149,333 | ) | | | — | | | | 16,972,536 | |
Loans, borrowings and debentures | | | (12,702,418 | ) | | | (4,665,127 | ) | | | (971,268 | ) | | | (3,651,545 | ) | | | (759,169 | ) | | | (10,594,381 | ) | | | (7,569,218 | ) | | | 18,338,813 | | | | — | | | | (22,574,313 | ) |
Derivative financial instruments | | | (1,223,260 | ) | | | (31,469 | ) | | | — | | | | — | | | | (3,880 | ) | | | — | | | | (21,834 | ) | | | 1,254,729 | | | | — | | | | (25,714 | ) |
Trade payables | | | (3,090,299 | ) | | | (1,603,481 | ) | | | (1,003,917 | ) | | | (1,012,895 | ) | | | (452,300 | ) | | | (451,637 | ) | | | (7,088 | ) | | | 5,697,697 | | | | — | | | | (1,923,920 | ) |
Employee benefits payable | | | (343,670 | ) | | | (73,481 | ) | | | (36,829 | ) | | | (63,520 | ) | | | (37,850 | ) | | | (207,397 | ) | | | (31,201 | ) | | | 453,980 | | | | — | | | | (339,968 | ) |
Preferred shareholders payable in subsidiaries | | | — | | | | — | | | | — | | | | — | | | | — | | | | — | | | | (1,097,490 | ) | | | — | | | | — | | | | (1,097,490 | ) |
Lease | | | — | | | | — | | | | — | | | | — | | | | — | | | | (553,350 | ) | | | — | | | | — | | | | — | | | | (553,350 | ) |
Other current liabilities | | | (2,448,741 | ) | | | (4,520,490 | ) | | | (624,633 | ) | | | (159,060 | ) | | | (499,759 | ) | | | (770,695 | ) | | | (849,832 | ) | | | 7,593,864 | | | | 542,092 | | | | (1,737,254 | ) |
Othernon-current liabilities | | | (1,305,251 | ) | | | (5,028,754 | ) | | | (834,456 | ) | | | (2,009,997 | ) | | | (794,110 | ) | | | (6,263,836 | ) | | | (2,187,599 | ) | | | 7,168,461 | | | | 1,116,191 | | | | (10,139,351 | ) |
| | | | | | | | | | | | | | | | | | | | | | | | | | | | | | | | | | | | | | | | |
Total assets (net of liabilities) allocated by segment | | | 11,670,218 | | | | 1,767,293 | | | | 3,056,025 | | | | 5,162,865 | | | | 973,525 | | | | 8,300,884 | | | | 16,323,027 | | | | (16,493,536 | ) | | | (12,790,945 | ) | | | 17,969,356 | |
| | | | | | | | | | | | | | | | | | | | | | | | | | | | | | | | | | | | | | | | |
Total assets | | | 32,783,857 | | | | 17,690,095 | | | | 6,527,128 | | | | 12,059,882 | | | | 3,520,593 | | | | 27,142,180 | | | | 28,087,289 | | | | (57,001,080 | ) | | | (14,449,228 | ) | | | 56,360,716 | |
| | | | | | | | | | | | | | | | | | | | | | | | | | | | | | | | | | | | | | | | |
Equity attributable to owners of the Company | | | 11,632,885 | | | | 1,533,603 | | | | 3,056,025 | | | | 4,175,508 | | | | 966,465 | | | | 1,661,512 | | | | 16,322,616 | | | | (16,222,513 | ) | | | (16,511,698 | ) | | | 6,614,403 | |
Non-controlling interests | | | 37,333 | | | | 233,690 | | | | — | | | | 987,357 | | | | 7,060 | | | | 6,639,372 | | | | 411 | | | | (271,023 | ) | | | 3,720,753 | | | | 11,354,953 | |
| | | | | | | | | | | | | | | | | | | | | | | | | | | | | | | | | | | | | | | | |
Total shareholders’ equity | | | 11,670,218 | | | | 1,767,293 | | | | 3,056,025 | | | | 5,162,865 | | | | 973,525 | | | | 8,300,884 | | | | 16,323,027 | | | | (16,493,536 | ) | | | (12,790,945 | ) | | | 17,969,356 | |
F-23
Cosan Limited
Notes to the consolidated financial statements
(In thousands of Brazilian Reais—R$ unless otherwise stated)
| | | | | | | | | | | | | | | | | | | | | | | | | | | | | | | | | | | | |
| | | | | | | | | | | | | | | | | | | | | | | | | | | | |
| | | December 31, 2017 | |
| | | Reported segments | | | Reconciliation | | | | |
Statement of financial position: | | Raízen
Energia | | | Raízen
Combustíveis | | | Comgás | | | Moove | | | Logistic | | | Cosan
Corporate | | | Deconsolidated
effects | | | Segment
elimination | | | Consolidated | |
Cash and cash equivalents | | | 2,069,357 | | | | 1,221,890 | | | | 1,727,521 | | | | 192,115 | | | | 179,909 | | | | 2,455,632 | | | | (3,291,247 | ) | | | — | | | | 4,555,177 | |
Marketable securities | | | — | | | | — | | | | 509,544 | | | | 5,439 | | | | 3,153,160 | | | | 185,200 | | | | — | | | | — | | | | 3,853,343 | |
Trade receivables | | | 688,235 | | | | 2,679,114 | | | | 640,682 | | | | 310,006 | | | | 371,718 | | | | 14 | | | | (3,367,349 | ) | | | — | | | | 1,322,420 | |
Derivative financial instruments | | | 453,775 | | | | 88,496 | | | | 458,476 | | | | 2,581 | | | | 110,107 | | | | 591,049 | | | | (542,271 | ) | | | — | | | | 1,162,213 | |
Inventories | | | 2,804,223 | | | | 2,416,833 | | | | 76,548 | | | | 301,850 | | | | 282,291 | | | | 2,372 | | | | (5,221,056 | ) | | | — | | | | 663,061 | |
Other financial assets | | | 476,181 | | | | — | | | | — | | | | — | | | | — | | | | 1,340,000 | | | | (476,181 | ) | | | — | | | | 1,340,000 | |
Other current assets | | | 2,114,733 | | | | 1,406,945 | | | | 155,815 | | | | 98,419 | | | | 438,369 | | | | 900,345 | | | | (3,521,678 | ) | | | (566,122 | ) | | | 1,026,826 | |
Othernon-current assets | | | 3,373,565 | | | | 1,335,986 | | | | 356,962 | | | | 70,055 | | | | 2,770,618 | | | | 1,100,740 | | | | (4,709,551 | ) | | | (1,230 | ) | | | 4,297,145 | |
Investments in associates | | | 348,523 | | | | — | | | | — | | | | 12,113 | | | | 41,930 | | | | 11,862,366 | | | | (348,523 | ) | | | (11,615,067 | ) | | | 301,342 | |
Investments in joint ventures | | | — | | | | — | | | | — | | | | — | | | | — | | | | 8,447,799 | | | | — | | | | — | | | | 8,447,799 | |
Biological assets | | | 880,668 | | | | — | | | | — | | | | — | | | | — | | | | — | | | | (880,668 | ) | | | — | | | | — | |
Property, plant and equipment | | | 10,753,205 | | | | 2,329,858 | | | | — | | | | 270,229 | | | | 11,266,278 | | | | 145,068 | | | | (13,083,063 | ) | | | — | | | | 11,681,575 | |
Intangible assets and goodwill | | | 3,669,903 | | | | 4,600,777 | | | | 8,471,087 | | | | 873,924 | | | | 7,622,969 | | | | 5,630 | | | | (8,270,680 | ) | | | — | | | | 16,973,610 | |
Loans, borrowings and debentures | | | (10,853,768 | ) | | | (2,741,312 | ) | | | (4,212,504 | ) | | | (589,292 | ) | | | (9,670,946 | ) | | | (7,216,204 | ) | | | 13,595,080 | | | | — | | | | (21,688,946 | ) |
Derivative financial instruments | | | (250,033 | ) | | | (218,888 | ) | | | — | | | | (8,293 | ) | | | — | | | | (106,792 | ) | | | 468,921 | | | | — | | | | (115,085 | ) |
Trade payables | | | (1,341,867 | ) | | | (2,124,538 | ) | | | (1,444,835 | ) | | | (353,474 | ) | | | (628,597 | ) | | | (7,089 | ) | | | 3,466,405 | | | | — | | | | (2,433,995 | ) |
Real estate credit certificates | | | — | | | | — | | | | — | | | | — | | | | (86,745 | ) | | | — | | | | — | | | | — | | | | (86,745 | ) |
Employee benefits payable | | | (356,155 | ) | | | (94,158 | ) | | | (59,059 | ) | | | (34,125 | ) | | | (166,864 | ) | | | (31,032 | ) | | | 450,313 | | | | — | | | | (291,080 | ) |
Preferred shareholders payable in subsidiaries | | | — | | | | — | | | | — | | | | — | | | | — | | | | (1,442,679 | ) | | | — | | | | — | | | | (1,442,679 | ) |
Lease | | | — | | | | — | | | | — | | | | — | | | | (944,138 | ) | | | — | | | | — | | | | — | | | | (944,138 | ) |
Other current liabilities | | | (1,412,872 | ) | | | (1,387,037 | ) | | | (358,430 | ) | | | (237,302 | ) | | | (778,049 | ) | | | (1,237,815 | ) | | | 2,799,909 | | | | 567,352 | | | | (2,044,244 | ) |
Othernon-current liabilities | | | (1,345,322 | ) | | | (4,392,359 | ) | | | (1,782,718 | ) | | | (212,710 | ) | | | (5,938,422 | ) | | | (1,663,907 | ) | | | 5,737,681 | | | | 79,571 | | | | (9,518,186 | ) |
| | | | | | | | | | | | | | | | | | | | | | | | | | | | | | | | | | | | |
Total assets (net of liabilities) allocated by segment | | | 12,072,351 | | | | 5,121,607 | | | | 4,539,089 | | | | 701,535 | | | | 8,023,588 | | | | 15,330,697 | | | | (17,193,958 | ) | | | (11,535,496 | ) | | | 17,059,413 | |
| | | | | | | | | | | | | | | | | | | | | | | | | | | | | | | | | | | | |
Total assets | | | 27,632,368 | | | | 16,079,899 | | | | 12,396,635 | | | | 2,136,731 | | | | 26,237,349 | | | | 27,036,215 | | | | (43,712,267 | ) | | | (12,182,419 | ) | | | 55,624,511 | |
| | | | | | | | | | | | | | | | | | | | | | | | | | | | | | | | | | | | |
Equity attributable to owners of the Company | | | 12,073,314 | | | | 4,888,966 | | | | 3,688,494 | | | | 701,535 | | | | 2,211,005 | | | | 15,330,321 | | | | (16,962,280 | ) | | | (15,892,598 | ) | | | 6,038,757 | |
Non-controlling interests | | | (963 | ) | | | 232,641 | | | | 850,595 | | | | — | | | | 5,812,583 | | | | 376 | | | | (231,678 | ) | | | 4,357,102 | | | | 11,020,656 | |
| | | | | | | | | | | | | | | | | | | | | | | | | | | | | | | | | | | | |
Total shareholders’ equity | | | 12,072,351 | | | | 5,121,607 | | | | 4,539,089 | | | | 701,535 | | | | 8,023,588 | | | | 15,330,697 | | | | (17,193,958 | ) | | | (11,535,496 | ) | | | 17,059,413 | |
F-24
Cosan Limited
Notes to the consolidated financial statements
(In thousands of Brazilian Reais—R$ unless otherwise stated)
| | | | | | | | | | | | |
| | | December 31, 2018 | | | December 31, 2017 | | | December 31, 2016 | |
Reported segment | | | | | | | | | | | | |
Raízen Energia | | | | | | | | | | | | |
Ethanol | | | 8,569,437 | | | | 6,550,652 | | | | 6,480,409 | |
Sugar | | | 3,670,749 | | | | 5,377,351 | | | | 5,794,771 | |
Diesel | | | 3,314,377 | | | | — | | | | — | |
Cogeneration | | | 2,836,658 | | | | 884,300 | | | | 520,468 | |
Gas | | | 758,572 | | | | — | | | | — | |
Other | | | 648,753 | | | | 340,375 | | | | 338,089 | |
| | | | | | | | | | | | |
| | | 19,798,546 | | | | 13,152,678 | | | | 13,133,737 | |
Raízen Combustíveis | | | | | | | | | | | | |
Fuels | | | 84,031,837 | | | | 72,789,148 | | | | 68,143,047 | |
Other | | | 1,172,254 | | | | — | | | | — | |
| | | | | | | | | | | | |
| | | 85,204,091 | | | | 72,789,148 | | | | 68,143,047 | |
Comgás | | | | | | | | | | | | |
Industrial | | | 4,411,737 | | | | 3,494,396 | | | | 3,640,921 | |
Residential | | | 986,073 | | | | 849,723 | | | | 793,335 | |
Commercial | | | 387,069 | | | | 320,049 | | | | 238,390 | |
Cogeneration | | | 315,925 | | | | 229,716 | | | | 216,032 | |
Automotive | | | 262,813 | | | | 224,203 | | | | 205,986 | |
Thermogeneration | | | — | | | | — | | | | 116,419 | |
Construction revenue | | | 415,753 | | | | 351,193 | | | | 339,025 | |
Other | | | 60,641 | | | | 68,577 | | | | 107,138 | |
| | | | | | | | | | | | |
| | | 6,840,011 | | | | 5,537,857 | | | | 5,657,246 | |
Moove | | | | | | | | | | | | |
Finished goods | | | 3,096,658 | | | | 1,876,935 | | | | 1,642,899 | |
Basic oil | | | 317,878 | | | | 220,515 | | | | 219,092 | |
Services | | | 35,413 | | | | 32,072 | | | | 21,683 | |
| | | | | | | | | | | | |
| | | 3,449,949 | | | | 2,129,522 | | | | 1,883,674 | |
Logistic | | | | | | | | | | | | |
North operations | | | 4,913,436 | | | | 4,439,766 | | | | 3,651,455 | |
South operations | | | 1,412,300 | | | | 1,283,085 | | | | 1,097,700 | |
Container operations | | | 259,200 | | | | 223,498 | | | | 265,400 | |
| | | | | | | | | | | | |
| | | 6,584,936 | | | | 5,946,349 | | | | 5,014,555 | |
Reconciliation | | | | | | | | | | | | |
Cosan Corporate | | | 9,165 | | | | 3,441 | | | | 873 | |
| | | | | | | | | | | | |
Deconsolidated of joint ventures and eliminations | | | (105,042,765 | ) | | | (85,976,532 | ) | | | (81,314,993 | ) |
| | | | | | | | | | | | |
Total | | | 16,843,933 | | | | 13,582,463 | | | | 12,518,139 | |
| | | | | | | | | | | | |
F-25
Cosan Limited
Notes to the consolidated financial statements
(In thousands of Brazilian Reais—R$ unless otherwise stated)
| 4.2 | Information on geographical area |
| | | | | | | | | | | | | | | | | | | | |
| | | Net sales | | | Non-current assets | |
| | | December
31, 2018 | | | December
31, 2017 | | | December
31, 2016 | | | December
31, 2018 | | | December
31, 2017 | |
Brazil | | | 14,729,253 | | | | 12,988,974 | | | | 11,837,757 | | | | 3,345,639 | | | | 4,009,212 | |
Europe(i) | | | 1,836,739 | | | | 538,148 | | | | 576,662 | | | | 451,039 | | | | 287,933 | |
Latin America(ii) | | | 157,287 | | | | 52,932 | | | | 74,746 | | | | 22,866 | | | | — | |
North America | | | 55,549 | | | | 14 | | | | 7,247 | | | | 107,352 | | | | — | |
Asia and Other | | | 65,105 | | | | 2,395 | | | | 21,727 | | | | — | | | | — | |
| | | | | | | | | | | | | | | | | | | | |
Total | | | 16,843,933 | | | | 13,582,463 | | | | 12,518,139 | | | | 3,926,896 | | | | 4,297,145 | |
| i. | England, France, Spain and Portugal; and |
| ii. | Argentina, Bolivia, Uruguay and Paraguay |
The majority of Rumo’s transports and port elevation is for the agricultural commodities industry, especially corn, sugar, soy and derivatives thereof. Rumo’s major clients are export companies participating in this market. In the fiscal year ended December 31, 2018, 2017 and 2016, the six major clients accounted for 48.02%, 52.5% and 51.6%, respectively.
No customers or specific group represented 10% or more of net sales for the periods presented in other segments.
F-26
Cosan Limited
Notes to the consolidated financial statements
(In thousands of Brazilian Reais—R$ unless otherwise stated)
| 5 | Financial assets and liabilities |
The carrying amount of financial assets and financial liabilities are as follows:
| | | | | | | | | | | | |
| | | Note | | | December 31, 2018 | | | December 31, 2017 | |
Assets | | | | | | | | | | | | |
Fair value through profit or loss | | | | | | | | | | | | |
Cash and cash equivalents | | | 5.1 | | | | 1,600,590 | | | | 1,852,114 | |
Marketable securities | | | 5.2 | | | | 4,202,835 | | | | 3,853,343 | |
Derivative financial instruments | | | 5.9 | | | | 2,548,857 | | | | 1,162,213 | |
| | | | | | | | | | | | |
| | | | | | | 8,352,282 | | | | 6,867,670 | |
Amortized costi | | | | | | | | | | | | |
Cash and cash equivalents | | | 5.1 | | | | 2,021,208 | | | | — | |
Trade receivables | | | 5.3 | | | | 1,588,192 | | | | — | |
Restricted cash | | | 5.2 | | | | 115,124 | | | | — | |
Receivables from related parties | | | 5.4 | | | | 135,070 | | | | — | |
Dividends receivable | | | | | | | 27,320 | | | | — | |
| | | | | | | | | | | | |
| | | | | | | 3,886,914 | | | | — | |
Loans and receivables | | | | | | | | | | | | |
Cash and cash equivalents | | | 5.1 | | | | — | | | | 2,703,063 | |
Trade receivables | | | 5.3 | | | | — | | | | 1,322,420 | |
Restricted cash | | | 5.2 | | | | — | | | | 225,634 | |
Receivables from related parties | | | 5.4 | | | | — | | | | 199,814 | |
Other financial assets | | | | | | | — | | | | 1,340,000 | |
Dividends receivable | | | | | | | — | | | | 13,466 | |
| | | | | | | | | | | | |
| | | | | | | — | | | | 5,804,397 | |
Total | | | | | | | 12,239,196 | | | | 12,672,067 | |
| | | | | | | | | | | | |
Liabilities | | | | | | | | | | | | |
Amortized cost | | | | | | | | | | | | |
Loans, borrowings and debentures | | | 5.5 | | | | 10,005,187 | | | | 13,858,709 | |
Leases | | | 5.6 | | | | 553,350 | | | | 944,138 | |
Real state credit certificates | | | | | | | — | | | | 86,745 | |
Trade payables | | | 5.7 | | | | 1,923,920 | | | | 2,433,995 | |
Other financial liabilities | | | | | | | 455,702 | | | | 382,702 | |
Payables to related parties | | | 5.4 | | | | 355,971 | | | | 328,263 | |
Dividends payable | | | | | | | 187,415 | | | | 191,478 | |
Tax installments—REFIS | | | 12 | | | | 216,984 | | | | 229,745 | |
Trade payables—Corporate operation / Agreements | | | | | | | — | | | | 210,476 | |
Preferred shareholders payable in subsidiaries | | | 5.8 | | | | 1,097,490 | | | | 1,442,679 | |
| | | | | | | | | | | | |
| | | | | | | 14,796,019 | | | | 20,108,930 | |
Fair value through profit or loss | | | | | | | | | | | | |
Loans, borrowings and debentures | | | 5.5 | | | | 12,569,126 | | | | 7,830,237 | |
Contingent consideration | | | 5.8 | | | | 64,969 | | | | 116,542 | |
Derivative financial instruments | | | 5.9 | | | | 25,714 | | | | 115,085 | |
| | | | | | | | | | | | |
| | | | | | | 12,659,809 | | | | 8,061,864 | |
| | | | | | | 27,455,828 | | | | 28,170,794 | |
| | | | | | | | | | | | |
| i | Due to the transition method chosen, comparative information has not been restated to reflect the new requirements. |
F-27
Cosan Limited
Notes to the consolidated financial statements
(In thousands of Brazilian Reais—R$ unless otherwise stated)
The effect and policy of initially applying IFRS 9 on the Company’s financial instruments is described in Note 3.
Financial assets are derecognized when the rights to receive cash flows from the financial assets have expired or have been transferred and the Company has transferred substantially all the risks and rewards of ownership.
The Company derecognizes a financial liability when its contractual obligations are discharged or cancelled or expire. The Company also derecognizes a financial liability when its terms are modified, and the cash flows of the modified liability are substantially different, in which case a new financial liability based on the modified terms is recognized at fair value.
| 5.1 | Cash and cash equivalents |
Accounting policy
Cash and cash equivalents comprise cash balances, call deposits and highly liquid short-term investments with maturities of three months or less from the acquisition date that are subject to an insignificant risk of changes in their fair value.
| | | | | | | | |
| | | December 31, 2018 | | | December 31, 2017 | |
Cash and bank accounts | | | 111,410 | | | | 53,525 | |
Savings account | | | 1,335,774 | | | | 2,115,562 | |
Financial Investments | | | 2,174,614 | | | | 2,386,090 | |
| | | | | | | | |
| | | 3,621,798 | | | | 4,555,177 | |
| | | | | | | | |
Financial investments are composed as follows:
| | | | | | | | |
| | | December 31,
2018 | | | December 31,
2017 | |
Investment fund | | | | | | | | |
Repurchase agreements | | | 1,179,503 | | | | 1,474,509 | |
Bank certificate of deposits—CDB | | | 421,087 | | | | 377,605 | |
| | | | | | | | |
| | | 1,600,590 | | | | 1,852,114 | |
| | | | | | | | |
Bank investments | | | | | | | | |
Repurchase agreements | | | — | | | | 153,461 | |
Bank certificate of deposits—CDB | | | 571,840 | | | | 374,651 | |
Other | | | 2,184 | | | | 5,864 | |
| | | | | | | | |
| | | 574,024 | | | | 533,976 | |
| | | | | | | | |
| | | 2,174,614 | | | | 2,386,090 | |
| | | | | | | | |
The Company’s onshore financial investments are remunerated at rates around 100% of the interbank deposit certificate (“CDI”) in 2018 (100% of CDI in 2017) and offshore financial investments are remunerated at rates around 100% of Fed Funds. The sensitivity analysis on interest rate risks is in note 21.
F-28
Cosan Limited
Notes to the consolidated financial statements
(In thousands of Brazilian Reais—R$ unless otherwise stated)
| 5.2 | Marketable securities and restricted cash |
Accounting policy
Marketable securities are measured and classified at fair value through profit or loss. Restricted cash are measured and classified at amortized cost, both of them with the average maturity of government bonds between two and five years, however they can be promptly redeemed and are subject to an insignificant risk of change in value.
| | | | | | | | | | |
| | | December 31, 2018 | | December 31, 2017 |
Marketable securities | | | | | | | | | | |
Government security(i) | | | | 4,144,797 | | | | | 3,640,726 | |
Bank certificate of deposit—CDB | | | | 58,038 | | | | | 212,617 | |
| | | | | | | | | | |
| | | | 4,202,835 | | | | | 3,853,343 | |
| | | | | | | | | | |
Restricted cash | | | | | | | | | | |
Investments linked to loans | | | | 31,254 | | | | | 93,251 | |
Securities pledged as collateral | | | | 83,870 | | | | | 132,383 | |
| | | | | | | | | | |
| | | | 115,124 | | | | | 225,634 | |
| | | | | | | | | | |
| i. | Sovereign debt securities have stated interest connected to Special System for Settlement and Custody (Sistema Especial de Liquidação e de Custódia), or “SELIC.” |
Accounting policy
Trade receivables are recognized initially at the amount of consideration that is unconditional unless they contain significant financing components, when they are recognized at fair value. The Company holds the trade receivables with the objective to collect the contractual cash flows and therefore measures them subsequently at amortized cost using the effective interest method.
To measure the expected credit losses and trade receivables have been grouped based on shared credit risk characteristics and overdue. The provision allowance for doubtful accounts is recorded in selling expense.
The expected loss rates are based on the corresponding historical credit losses experienced within this period. The historical loss rates may be adjusted to reflect current and forward-looking information on macroeconomic factors affecting the ability of the customers to settle the receivables. The Company has identified the interest rate implicit in the contract to be the most relevant factor, and accordingly adjusts the historical loss rates based on expected changes in this factor.
| | | | | | | | | | |
| | | December 31, 2018 | | December 31, 2017 |
Domestic – Brazilian Reais | | | | 1,609,421 | | | | | 1,388,837 | |
Export – Foreign currency | | | | 104,355 | | | | | 54,635 | |
| | | | | | | | | | |
| | | | 1,713,776 | | | | | 1,443,472 | |
Allowance for doubtful accounts | | | | (125,584 | ) | | | | (121,052 | ) |
| | | | | | | | | | |
| | | | 1,588,192 | | | | | 1,322,420 | |
Current | | | | 1,545,643 | | | | | 1,277,766 | |
| | | | | | | | | | |
Non-current | | | | 42,549 | | | | | 44,654 | |
| | | | | | | | | | |
F-29
Cosan Limited
Notes to the consolidated financial statements
(In thousands of Brazilian Reais—R$ unless otherwise stated)
The ageing of trade receivables is as follows:
| | | | | | | | |
| | | December 31,
2018 | | | December 31,
2017 | |
Not overdue | | | 1,382,193 | | | | 1,033,076 | |
Overdue: | | | | | | | | |
From 1 to 30 days | | | 116,665 | | | | 160,654 | |
From 31 to 60 days | | | 27,649 | | | | 26,881 | |
From 61 to 90 days | | | 20,734 | | | | 64,947 | |
More than 90 days | | | 166,535 | | | | 157,914 | |
Allowance for doubtful accounts | | | (125,584 | ) | | | (121,052 | ) |
| | | | | | | | |
| | | 1,588,192 | | | | 1,322,420 | |
| | | | | | | | |
Changes in the allowance for doubtful accounts are as follows:
| | | | |
At January 1, 2017 | | | (90,286 | ) |
Provision/reversal | | | (30,766 | ) |
| | | | |
At December 31, 2017 | | | (121,052 | ) |
Provision/reversal | | | (4,532 | ) |
| | | | |
At December 31, 2018 | | | (125,584 | ) |
| | | | |
5.4 Related parties
Accounting policy
Sales and purchases involving related parties are made at regular market prices. The outstanding balances at year-end are not guaranteed nor subject to interest, and they are settled in cash. There were no guarantees given or received regarding any accounts receivable or payable involving related parties. In the year ended December 31, 2018, the Company did not account for any impairment of trade receivable related to amounts owed by related parties.
F-30
Cosan Limited
Notes to the consolidated financial statements
(In thousands of Brazilian Reais—R$ unless otherwise stated)
| | a) | Receivables from and payables to related parties: |
| | | | | | | | |
| | | December 31, 2018 | | | December 31, 2017 | |
Current Asset | | | | | | | | |
Corporate operation / Agreements | | | | | | | | |
Raízen Energia(i) | | | 38,205 | | | | 22,283 | |
Raízen Combustíveis(i) | | | 6,263 | | | | 6,094 | |
Aguassanta Participações S.A. | | | 29 | | | | 17 | |
Other | | | 183 | | | | 1,665 | |
| | | | | | | | |
| | | 44,680 | | | | 30,059 | |
Non-current assets | | | | | | | | |
Preferred shares | | | | | | | | |
Raízen Energia(i) | | | 37,470 | | | | 87,969 | |
Raízen Combustíveis(i) | | | 27,523 | | | | 18,086 | |
Janus Brasil Participações S.A | | | — | | | | 30,423 | |
| | | | | | | | |
| | | 64,993 | | | | 136,478 | |
Financial operations | | | | | | | | |
Rezende Barbosa(ii) | | | 23,144 | | | | 31,444 | |
Other | | | 2,253 | | | | 1,833 | |
| | | | | | | | |
| | | 25,397 | | | | 33,277 | |
| | | | | | | | |
Total assets | | | 90,390 | | | | 169,755 | |
| | | | | | | | |
Current liabilities | | | | | | | | |
Corporate operations / agreements | | | | | | | | |
Raízen Energia(i) | | | 215,582 | | | | 198,198 | |
Raízen Combustíveis(i) | | | 136,779 | | | | 128,189 | |
Other | | | 3,610 | | | | 1,876 | |
| | | | | | | | |
Total liabilities | | | 355,971 | | | | 328,263 | |
| | | | | | | | |
| i. | Current and non-current assets receivable from Raízen Energia and Raízen Combustíveis are, primarily, tax credits which will be reimbursed to the Company when realized. The preferred shares are used to Raízen reimburse Cosan, with preferential dividends, when the net operating loss is consumed in Raízen. |
Current liabilities represent reimburse to Raízen Energia and Raízen Combustíveis related to expenses regarding legal disputes and other liabilities, generated before the formation of joint ventures, which are responsibility of Cosan S.A..
| ii. | The Company has receivables with Rezende Barbosa for the repayment of loans taken prior to the acquisition of the subsidiaries in 2009. These receivables are secured by Cosan S.A. shares. |
F-31
Cosan Limited
Notes to the consolidated financial statements
(In thousands of Brazilian Reais—R$ unless otherwise stated)
| | b) | Related party transactions: |
| | | | | | | | | | | | |
| | | December 31, 2018 | | | | December 31, 2017 | | | | December 31, 2016 | |
| | | | | | | | | | | | |
Product sales | | | | | | | | | | | | |
Raízen Energia | | | 304,648 | | | | 411,443 | | | | 416,507 | |
Raízen Combustíveis | | | 188,895 | | | | 154,104 | | | | 135,581 | |
Other | | | 15,117 | | | | 8,381 | | | | — | |
| | | | | | | | | | | | |
| | | 508,660 | | | | 573,928 | | | | 552,088 | |
Purchase of goods / inputs | | | | | | | | | | | | |
Raízen Energia | | | (3,672 | ) | | | (1,347 | ) | | | (1,703 | ) |
Raízen Combustíveis | | | (1,205,231 | ) | | | (1,006,515 | ) | | | (817,198 | ) |
| | | | | | | | | | | | |
| | | (1,208,903 | ) | | | (1,007,862 | ) | | | (818,901 | ) |
Discontinued operation | | | | | | | | | | | | |
Raízen Energia | | | — | | | | — | | | | 57,007 | |
| | | | | | | | | | | | |
| | | — | | | | — | | | | 57,007 | |
Shared income (expense) | | | | | | | | | | | | |
Raízen Energia | | | (73,105 | ) | | | (70,914 | ) | | | (72,597 | ) |
| | | | | | | | | | | | |
| | | (73,105 | ) | | | (70,914 | ) | | | (72,597 | ) |
Finance result | | | | | | | | | | | | |
Usina Santa Luiza S.A. | | | (241 | ) | | | (378 | ) | | | (180 | ) |
Raízen Energia | | | 4,100 | | | | 7,727 | | | | 2,441 | |
Other | | | 2,879 | | | | 3 | | | | (8 | ) |
| | | | | | | | | | | | |
| | | 6,738 | | | | 7,352 | | | | 2,253 | |
| | | | | | | | | | | | |
| | | | | | | | | | | | |
Total | | | (766,610 | ) | | | (497,496 | ) | | | (280,150 | ) |
| | | | | | | | | | | | |
| | c) | Officers’ and directors’ compensation |
The Company has a compensation policy approved by the Board of Directors. Compensation of the Company’s key management personnel includes salaries,non-cash benefits and contributions to a post-employment defined benefit plan.
| | | | | | | | | | | | |
| | | December 31, 2018 | | | | December 31, 2017 | | | | December 31, 2016 | |
| | | | | | | | | | | | |
Short-term benefits to officers and directors | | | 86,810 | | | | 76,976 | | | | 146,469 | |
Post-employment benefits | | | 476 | | | | 934 | | | | 918 | |
Other long-term benefits | | | 547 | | | | 664 | | | | 533 | |
Benefits from termination of employment contract | | | 1,193 | | | | 635 | | | | 2,367 | |
Stock option expense | | | 11,423 | | | | 63,658 | | | | 11,621 | |
| | | | | | | | | | | | |
| | | 100,449 | | | | 142,867 | | | | 161,908 | |
| | | | | | | | | | | | |
| 5.5 | Loans, borrowings and debentures |
Accounting policy
Borrowings are initially recognized at fair value, net of transaction costs incurred. Borrowings are subsequently measured at amortized cost.
Borrowings are removed from the statement of financial position when the obligation specified in the contract is discharged, cancelled or expired. The difference between the carrying amount of a financial liability that has been extinguished or transferred to another party and the consideration paid, including anynon-cash assets transferred or liabilities assumed, is recognized in profit or loss as other income or finance costs.
F-32
Cosan Limited
Notes to the consolidated financial statements
(In thousands of Brazilian Reais—R$ unless otherwise stated)
Borrowings are classified as current liabilities unless the Company has an unconditional right to defer settlement of the liability for at least 12 months after the reporting period.
Financial guarantee contracts issued by the Company are initially measured at their fair values and, if not designated as at fair value through profit or loss, are subsequently measured at the higher of:
| | i. | the amount of the obligation under the contract; and |
| | ii. | the amount initially recognized less, where appropriate, cumulative amortization recognized in accordance with the revenue recognition policies. |
| | | | | | | | | | | | | | | | | | | | | | | | |
| | | Interest | | | | | | | | | | | | | |
Description | | Index | | | Annual
interest
rate | | | December 31,
2018 | | | December 31,
2017 | | | Maturity | | | Objective | |
With guarantee | | | | | | | | | | | | | | | | | | | | | | | | |
BNDES | | | URTJLP | | | | 9.08% | | | | 2,584,347 | | | | 2,270,055 | | | | Dec-29 | | | | Expansion project | |
| | | Fixed | | | | 5.31% | | | | 1,055,281 | | | | 1,281,416 | | | | Feb-25 | | | | Expansion project | |
| | | TJ462 | | | | 9.87% | | | | 316,854 | | | | 485,807 | | | | Oct-20 | | | | Investment | |
| | | Selic | | | | 8.32% | | | | 152,562 | | | | 221,222 | | | | Oct-20 | | | | Investment | |
| | | Selic | | | | 8.49% | | | | 63,852 | | | | 66,794 | | | | Jun-23 | | | | Investment | |
| | | TJLP | | | | 9.06% | | | | 107,731 | | | | 120,573 | | | | Jun-23 | | | | Investment | |
| | | Selic | | | | 13.65% | | | | 3,930 | | | | 4,075 | | | | Sep-20 | | | | Expansion project | |
| | | Fixed | | | | 3.75% | | | | 2,261 | | | | 2,695 | | | | Jan-24 | | | | Expansion project | |
| | | IPCA | | | | 11.69% | | | | 2,211 | | | | 2,840 | | | | Nov-21 | | | | Expansion project | |
EIB | | | U.S.$ | | | | 3.88% | | | | 89,003 | | | | 127,190 | | | | Jun-20 | | | | Investment | |
| | | U.S.$ | | | | 2.94% | | | | 54,508 | | | | 70,611 | | | | Sep-20 | | | | Investment | |
| | | U.S.$ + LIBOR | | | | 3.43% | | | | 115,581 | | | | 138,778 | | | | May-21 | | | | Investment | |
| | | U.S.$ + LIBOR | | | | 3.18% | | | | 130,402 | | | | 149,386 | | | | Sep-21 | | | | Investment | |
FINEP | | | Fixed | | | | 5.00% | | | | 93,309 | | | | 93,058 | | | | Nov-22 | | | | Investment | |
| | | | | | | | | | | | | | | | | | | | | | | | |
| | | | | | | | | | | 4,771,832 | | | | 5,034,500 | | | | | | | | | |
Without guarantee | | | | | | | | | | | | | | | | | | | | | | | | |
Foreign loans | | | GBP + Libor | | | | 4.22% | | | | 363,250 | | | | 312,642 | | | | Dec-22 | | | | Acquisition | |
| | | GBP + Libor | | | | 2.43% | | | | 199,794 | | | | 157,432 | | | | Nov-20 | | | | Acquisition | |
NCE | | | 112% of CDI | | | | 7.18% | | | | — | | | | 59,858 | | | | Dec-18 | | | | Exportation | |
| | | 126% of CDI | | | | 8.13% | | | | 514,817 | | | | — | | | | Dec-23 | | | | Exportation | |
| | | CDI + 3.50% | | | | 10.11% | | | | — | | | | 294,968 | | | | Dec-18 | | | | Exportation | |
| | | 125% of CDI | | | | 8.06% | | | | 646,024 | | | | 644,766 | | | | Dec-23 | | | | Exportation | |
Perpetual Notes | | | U.S.$ | | | | 8.25% | | | | 1,961,819 | | | | 1,674,847 | | | | — | | | | Acquisition | |
Resolution 4.131 | | | U.S.$ | | | | 4.79% | | | | 39,738 | | | | 68,305 | | | | Oct-20 | | | | Working capital | |
| | | U.S.$ + Libor | | | | 3.75% | | | | 156,387 | | | | 50,868 | | | | Feb-20 | | | | Working capital | |
| | | U.S.$ | | | | 2.40% | | | | — | | | | 415,762 | | | | Mar-18 | | | | Working capital | |
| | | U.S.$ | | | | 3.67% | | | | 292,172 | | | | — | | | | May-23 | | | | Working capital | |
| | | U.S.$ | | | | 4.34% | | | | 41,033 | | | | — | | | | Nov-19 | | | | Working capital | |
| | | U.S.$ | | | | 3.35% | | | | 209,987 | | | | — | | | | Nov-22 | | | | Working capital | |
Senior Notes Due 2018 | | | Fixed | | | | 9.50% | | | | — | | | | 168,052 | | | | Mar-18 | | | | Acquisition | |
Senior Notes Due 2023 | | | U.S.$ | | | | 5.00% | | | | 409,590 | | | | 339,665 | | | | Mar-23 | | | | Acquisition | |
Senior Notes Due 2024 | | | U.S.$ | | | | 7.38% | | | | 3,061,566 | | | | 2,570,622 | | | | Feb-24 | | | | Acquisition | |
Senior Notes Due 2024 | | | U.S.$ | | | | 5.95% | | | | 2,022,793 | | | | 1,664,850 | | | | Sep-24 | | | | Acquisition | |
Senior Notes Due 2025 | | | U.S.$ | | | | 5.88% | | | | 1,997,394 | | | | — | | | | Jan-25 | | | | Acquisition | |
Senior Notes Due 2027 | | | U.S.$ | | | | 7.00% | | | | 2,977,721 | | | | 2,530,443 | | | | Jan-27 | | | | Acquisition | |
Trade banks | | | CDI + 4.91% p.a. | | | | 12.14% | | | | — | | | | 98,117 | | | | Jun-18 | | | | Working capital | |
| | | Fixed U.S.$ | | | | 5.33% | | | | 15,499 | | | | 95,040 | | | | Jun-19 | | | | Working capital | |
F-33
Cosan Limited
Notes to the consolidated financial statements
(In thousands of Brazilian Reais—R$ unless otherwise stated)
| | | | | | | | | | | | | | | | | | | | | | | | |
| | | Interest | | | | | | | | | | | | | |
Description | | Index | | | Annual
interest
rate | | | December 31,
2018 | | | December 31,
2017 | | | Maturity | | | Objective | |
Working capital | | | CDI + 2.80% p.a. | | | | 9.88% | | | | — | | | | 391,693 | | | | Dec-18 | | | | Working capital | |
| | | CDI + 2.95% p.a. | | | | 10.04% | | | | — | | | | 286,463 | | | | Dec-18 | | | | Working capital | |
| | | CDI + 0.31% p.m. | | | | 10.93% | | | | — | | | | 1,117 | | | | Jan-18 | | | | Working capital | |
| | | CDI + 0.33% p.m. | | | | 11.20% | | | | — | | | | 3,345 | | | | Mar-18 | | | | Working capital | |
| | | 120% of CDI | | | | 7.74% | | | | 30,828 | | | | 21,221 | | | | Aug-20 | | | | Working capital | |
| | | 120.85% of CDI | | | | 7.77% | | | | — | | | | 10,440 | | | | Sep-18 | | | | Working capital | |
| | | 120.75% of CDI | | | | 7.77% | | | | — | | | | 20,879 | | | | Sep-18 | | | | Working capital | |
| | | 125% of CDI | | | | 8.06% | | | | 5,018 | | | | — | | | | Dec-19 | | | | Working capital | |
| | | 122% of CDI | | | | 7.86% | | | | 15,402 | | | | — | | | | Feb-19 | | | | Working capital | |
Bank overdrafts | | | 125.5% of CDI | | | | 8.08% | | | | — | | | | 94 | | | | Feb-19 | | | | Working capital | |
Prepayment | | | U.S.$+Libor | | | | 3.81% | | | | 11,706 | | | | 10,039 | | | | Apr-19 | | | | Working capital | |
Non-convertible debentures | | | CDI + 2.05% p.a. | | | | 8.57% | | | | — | | | | 152,573 | | | | — | | | | Working capital | |
| | | CDI + 3.50% p.a. | | | | 10.11% | | | | — | | | | 1,359,125 | | | | — | | | | Working capital | |
| | | IGPM + 6.10% | | | | 14.61% | | | | 228,010 | | | | — | | | | May-28 | | | | Working capital | |
| | | IPCA + 5.10% | | | | 9.40% | | | | — | | | | 363,894 | | | | — | | | | Working capital | |
| | | IPCA + 5.57% | | | | 9.47% | | | | 203,613 | | | | 197,923 | | | | Sep-20 | | | | Working capital | |
| | | IPCA + 7.14% | | | | 11.09% | | | | 305,894 | | | | 293,312 | | | | Dec-20 | | | | Working capital | |
| | | IPCA + 7.48% | | | | 11.45% | | | | 275,014 | | | | 263,701 | | | | Dec-22 | | | | Working capital | |
| | | IPCA + 7.36% | | | | 11.32% | | | | 90,656 | | | | 86,927 | | | | Dec-25 | | | | Working capital | |
| | | IPCA + 5.87% | | | | 9.78% | | | | 767,638 | | | | 726,827 | | | | Dec-23 | | | | Working capital | |
| | | IPCA + 4.33% | | | | 8.18% | | | | 414,583 | | | | 396,328 | | | | Oct-24 | | | | Working capital | |
| | | 108 % of CDI | | | | 6.92% | | | | — | | | | 171,515 | | | | — | | | | Working capital | |
| | | Fixed | | | | 13.13% | | | | — | | | | 163,750 | | | | — | | | | Working capital | |
| | | 128 % of CDI | | | | 8.26% | | | | 501,064 | | | | 499,576 | | | | Dec-25 | | | | Working capital | |
| | | CDI + 0.90% | | | | 7.36% | | | | 43,471 | | | | 87,467 | | | | Sep-19 | | | | Working capital | |
| | | | | | | | | | | | | | | | | | | | | | | | |
| | | | | | | | | | | 17,802,481 | | | | 16,654,446 | | | | | | | | | |
| | | | | | | | | | | | | | | | | | | | | | | | |
Total | | | | | | | | | | | 22,574,313 | | | | 21,688,946 | | | | | | | | | |
| | | | | | | | | | | | | | | | | | | | | | | | |
Current | | | | | | | | | | | 2,115,305 | | | | 3,903,392 | | | | | | | | | |
| | | | | | | | | | | | | | | | | | | | | | | | |
Non-current | | | | | | | | | | | 20,459,008 | | | | 17,785,554 | | | | | | | | | |
| | | | | | | | | | | | | | | | | | | | | | | | |
F-34
Cosan Limited
Notes to the consolidated financial statements
(In thousands of Brazilian Reais—R$ unless otherwise stated)
The Company used the annual average rate of the CDI of 6.40% and long-term interest rate (“TJLP”) of 6.98 %.
Non-current borrowings are scheduled to fall due as follows:
| | | | | | | | |
| | | December 31, 2018 | | | | December 31, 2017 | |
| | | | | | | | |
13 to 24 months | | | 2,113,502 | | | | 2,087,933 | |
25 to 36 months | | | 1,310,790 | | | | 2,188,717 | |
37 to 48 months | | | 1,201,227 | | | | 1,334,529 | |
49 to 60 months | | | 2,429,146 | | | | 1,051,146 | |
61 to 72 months | | | 5,783,465 | | | | 1,762,197 | |
73 to 84 months | | | 2,332,961 | | | | 4,914,452 | |
85 to 96 months | | | 475,964 | | | | 429,244 | |
Thereafter | | | 4,811,953 | | | | 4,017,336 | |
| | | | | | | | |
| | | 20,459,008 | | | | 17,785,554 | |
| | | | | | | | |
The carrying amounts of loans, borrowings and debentures are denominated in the following currencies:
| | | | | | | | |
| | | December 31, 2018 | | | | December 31, 2017 | |
| | | | | | | | |
Reais (R$) | | | 8,424,373 | | | | 11,312,466 | |
Dollar (U.S.$) | | | 13,586,897 | | | | 9,906,406 | |
Pound (GBP) | | | 563,043 | | | | 470,074 | |
| | | | | | | | |
| | | 22,574,313 | | | | 21,688,946 | |
| | | | | | | | |
At December 31, 2018, all dated debts denominated in U.S. Dollars, in the subsidiaries, have currency risk protection through derivatives (Note 5.9). For the 5th Issuance of debentures denominated in R$ of the Comgás subsidiary, a derivative operation was carried out in which its future cash flow was protected, and the IPCA interest rate risk was changed by percentage of the CDI.
Below are the movements that occurred for the year ended December 31, 2018:
| | | | |
At January 1, 2017 | | | 18,338,497 | |
Raised | | | 6,248,712 | |
Repayment of principal on loans, borrowings and debentures | | | (3,839,633 | ) |
Payment of interest on loans, borrowings and debentures | | | (1,602,034 | ) |
Interest, exchange rate and fair value | | | 2,543,404 | |
| | | | |
At December 31, 2017 | | | 21,688,946 | |
Raised | | | 3,761,058 | |
Repayment of principal on loans, borrowings and debentures | | | (5,342,670 | ) |
Payment of interest on loans, borrowings and debentures | | | (1,465,666 | ) |
Interest, exchange rate and fair value | | | 3,932,645 | |
| | | | |
At December 31, 2018 | | | 22,574,313 | |
| | | | |
Some financing agreements with the Brazilian National Economic and Social Development Bank (Banco Nacional de Desenvolvimento Econômico e Social), or “BNDES,” of the subsidiaries Comgás and Rumo, are guaranteed by bank guarantee, or by real guarantees (assets) and escrow account. On December 31, 2018, the balance of bank guarantees contracted was R$ 1,195,048 and R$ 2,475,175 with an average cost of 0.96% p.a. and 2.32% p.a., respectively (R$ 1,509,889 and R$ 1,183,208 as of December 31, 2017).
F-35
Cosan Limited
Notes to the consolidated financial statements
(In thousands of Brazilian Reais—R$ unless otherwise stated)
As of December 31, 2018, the subsidiary Rumo had available credit lines from BNDES, which were not used, in the total amount of R$ 2,108,824 (R$ 21,325 on December 31, 2017).
As of December 31, 2018, the subsidiary Cosan S.A. had available credit lines from financial institutions AA, which were not used, in the total amount of R$ 501,000 (R$ 501,000 on December 31, 2017).
The use of these credit lines is subject to certain contractual conditions.
Under the terms of the major borrowing facilities, the Company is required to comply with the following financial covenants:
| | | | | | |
Debit | | Triggers | | Ratios | |
Debenture 3rd issue | | Net onerous debt / EBITDA can not exceed 4.00 | | | 0.71 | |
| | Short-term indebtedness / Total indebtedness can not exceed 0.6 | | | 0.17 | |
Debenture 4th issue | | Net onerous debt / EBITDA can not exceed 4.00 | | | 0.71 | |
| | Short-term indebtedness / Total indebtedness can not exceed 0.6 | | | 0.17 | |
Debenture 5th Issue | | Net onerous debt / EBITDA can not exceed 4.00 | | | 0.71 | |
Debenture 6th Issue | | Net onerous debt / EBITDA can not exceed 4.00 | | | 0.71 | |
Debenture 7th Issue | | Net onerous debt / EBITDA can not exceed 4.00 | | | 0.71 | |
Senior Notes 2027 | | Pro forma(i)net debt / EBITDA not higher than or equal to 3.5 | | | 2.4 | |
BNDES | | Net Financial Debt / EBITDA <= 4.0x in December 31, 2018 | | | 2.06 | |
BNDES | | EBITDA / Consolidated Finance Result> = 1.40x in December, 2018 | | | 2.68 | |
| (i) | Included joint ventures. |
For the other Loans, borrowings and debentures of the Company there are no financial clauses.
As at December 31, 2018, the Company and its subsidiaries were in compliance with all debt financial covenants.
| | d) | Fair value and exposure to financial risk |
The fair value of the loans is based on the discounted cash flow using its implicit discount rate. They are classified as a level 2 fair value in the hierarchy (Note 5.10) due to the use of unobservable data, including own credit risk.
The details of the Company’s exposure to risks arising from loans are shown in note 21.
Accounting policy
The determination of whether an arrangement is, or contains, a lease is based on the substance of the arrangement at the inception date. The classification of the lease as operational or financial is determined based on an evaluation of the terms and conditions of the contracts. The Company identified the cases in which it assumes substantially all the risks and benefits of ownership of the said assets, recording such cases as a financial lease.
| | a) | Finance lease liabilities |
Leases of property, plant and equipment that transfer to the Company substantially all of the risks and rewards of ownership are classified as finance leases. The leased assets are measured initially at an amount equal to the lower of their fair value and the present value of the minimum lease payments. Subsequent to initial recognition, the assets are accounted for in accordance with the accounting policy applicable to that asset.
F-36
Cosan Limited
Notes to the consolidated financial statements
(In thousands of Brazilian Reais—R$ unless otherwise stated)
A leased asset is depreciated over the useful life of the asset. However, if there is no reasonable certainty that the Company will obtain ownership by the end of the lease term, the asset is depreciated over the shorter of the estimated useful life of the asset and the lease term.
Assets held under other leases are classified as operating leases and are not recognized in the Company’s statement of financial position.
Payments made under operating leases are recognized in profit or loss on a straight-line basis over the term of the lease (Note 18). Lease incentives received are recognized as an integral part of the total lease expense, over the term of the lease.
Minimum lease payments made under finance leases are apportioned between the finance expense and the reduction of the outstanding liability. The finance expense is allocated to each period during the lease term to produce a constant periodic rate of interest on the remaining balance of the liability.
The amounts paid in advance by the Company are recorded as assets and allocated in income linearly during the term of the contract. The expenses incurred during the grace period are recorded in income and maintained as payables, being written off in proportion to the payment of current installments.
| | a) | Finance lease liabilities are payable as follows: |
| | | | | | | | | | | | | | | | | | | | |
| | | December 31, 2018 | | | December 31, 2017 | |
| | | Less than
one year | | | Between
one and
five years | | | More than
five years | | | Total | | | Total | |
Future value of minimum payments lease | | | 176,169 | | | | 422,421 | | | | 165,838 | | | | 764,428 | | | | 1,250,860 | |
Rolling stock | | | 150,241 | | | | 348,111 | | | | 101,790 | | | | 600,142 | | | | 1,060,759 | |
Terminal | | | 23,400 | | | | 73,637 | | | | 64,048 | | | | 161,085 | | | | 184,484 | |
Other | | | 2,528 | | | | 673 | | | | — | | | | 3,201 | | | | 5,617 | |
Interest | | | (55,678 | ) | | | (128,941 | ) | | | (26,459 | ) | | | (211,078 | ) | | | (306,722 | ) |
Rolling stock | | | (44,284 | ) | | | (98,797 | ) | | | (16,567 | ) | | | (159,648 | ) | | | (241,509 | ) |
Terminal | | | (11,152 | ) | | | (30,099 | ) | | | (9,892 | ) | | | (51,143 | ) | | | (64,528 | ) |
Other | | | (242 | ) | | | (45 | ) | | | — | | | | (287 | ) | | | (685 | ) |
| | | | | | | | | | | | | | | | | | | | |
Present value of minimum lease payments | | | 120,491 | | | | 293,480 | | | | 139,379 | | | | 553,350 | | | | 944,138 | |
| | | | | | | | | | | | | | | | | | | | |
Current | | | | | | | | | | | | | | | 120,491 | | | | 261,344 | |
| | | | | | | | | | | | | | | | | | | | |
Non-current | | | | | | | | | | | | | | | 432,859 | | | | 682,794 | |
| | | | | | | | | | | | | | | | | | | | |
The lease agreements have varying expirations, with last due to expire in June 2043. The amounts are adjusted annually for inflation rates (as general market price index, orIGP-M, and Brazilian consumer price index, or IPCA) or may incur interest based on the TJLP or CDI and some contracts have renewal or purchase options that were considered in determining the classification as financial lease.
Below are the movements that occurred for the year ended December 31, 2018 and 2017.
| | | | | | | | |
| | | December 31, 2018 | | | December 31, 2017 | |
At the beginning of the year | | | 944,138 | | | | 1,397,543 | |
Interest, exchange rate and fair value | | | 144,763 | | | | 178,139 | |
Payment of principal | | | (384,752 | ) | | | (348,114 | ) |
Payment of interest | | | (150,799 | ) | | | (283,430 | ) |
| | | | | | | | |
At the end of the year | | | 553,350 | | | | 944,138 | |
| | | | | | | | |
F-37
Cosan Limited
Notes to the consolidated financial statements
(In thousands of Brazilian Reais—R$ unless otherwise stated)
At December 31, 2018 and 2017, the future minimum lease payments undernon-cancellable operating leases are as follows:
| | | | | | | | | | | | | | | | | | | | |
| | | December 31, 2018 | | | December 31, 2017 | |
| | | Less than
one year | | | Between
one and
five years | | | More than
five years | | | Total | | | Total | |
Locomotive | | | 678 | | | | 509 | | | | — | | | | 1,187 | | | | 1,695 | |
Rail car | | | 8,925 | | | | 24,332 | | | | 866 | | | | 34,123 | | | | 38,449 | |
Other | | | 2,491 | | | | 8,390 | | | | 3,496 | | | | 14,377 | | | | 16,058 | |
| | | | | | | | | | | | | | | | | | | | |
| | | 12,094 | | | | 33,231 | | | | 4,362 | | | | 49,687 | | | | 56,202 | |
| | | | | | | | | | | | | | | | | | | | |
Accounting policy
Trade payables are unsecured and are usually paid within 30 days of recognition.
The carrying amounts of trade and other payables are the same as their fair values, due to their short-term nature.
| | | | | | | | |
| | | December 31, 2018 | | | | December 31, 2017 | |
| | | | | | | | |
Natural gas suppliers | | | 838,105 | | | | 1,563,930 | |
Materials and service suppliers | | | 1,073,227 | | | | 1,162,496 | |
Fuels and lubricants suppliers | | | 1,367 | | | | 1,814 | |
Judicial deposits | | | — | | | | (294,976 | ) |
Other | | | 11,221 | | | | 731 | |
| | | | | | | | |
| | | 1,923,920 | | | | 2,433,995 | |
| | | | | | | | |
Comgás, a subsidiary of the Company, has entered into natural gas supply contracts with Petróleo Brasileiro S.A. (“Petrobras”) and Gas Brasiliano Distribuidora S.A. (“Gas Brasiliano”) which contain the following conditions:
| | i. | Contract with Petrobras entered into in January 2008 and due to expire in December 2021 providing for the delivery of 4.22 million m³/day of Brazilian-sourced natural gas (“Firme Nacional”). |
| | ii. | Contract with Petrobras entered into in June 1999 and due to expire in June 2021 providing for the delivery of 8.10 million m³/day of Bolivian-sourced natural gas (“TCQ”). |
| | iii. | Gas contract entered into as part of the Priority Thermoelectric Program (“PTP”) with Petrobras for the supply of 0.3 million m³/day to Ingredion Brasil Ingredientes Industriais Ltda., due to expire on March 31, 2023. |
| | iv. | Contract with Gas Brasiliano entered into in April 2008 and due to expire on March 26, 2019 with a contracted average monthly volume of 0.760 million m³ and contracted annual volume of 9.12 million m³. |
The contracts for the supply of natural gas, Firme Nacional and TCQ contracts have prices made up of two components: one indexed to a basket of fuel oils in the international market and readjusted on a quarterly basis; and another adjusted annually based on local and/or U.S. inflation rates. Both contracts are indexed to the U.S. dollar.
Amendments to the Firme Nacional and TCQ contracts came into force on November 14, 2018. These amendments extend that maturities of each of the Firme Nacional and TCQ contracts until December 2021.
The abovementioned amendments required the settlement of an aggregate amount of R$ 995,951 (the portion related to the interest on the principal amount was reversed in the amount the R$ 177,423 in the financial results), a balance in dispute between the parties which was generated from January 2014 to October 2015 as a result of the difference between (i) the price charged in the TCQ gas supply agreement between Comgás and Petrobras and (ii) the price charged in the Firme Nacional contract between Petrobras and Gas Brasiliano. The judicial deposit in the updated gross amount of R$ 396,559 was also was collected (the amount of R$ 101,583 related to the monetary variation on the judicial deposit was recorded in the financial result).
F-38
Cosan Limited
Notes to the consolidated financial statements
(In thousands of Brazilian Reais—R$ unless otherwise stated)
The impacts of the closing of the legal disputes with Petrobras in relation to the cost of gas are shown in: (i) the reduction of the balance of suppliers in the statement of financial position in the amount of R$ 995,951, and (ii) the reversal of the financial and income tax and social contributions in the consolidated statement of profit or loss of the year in the amount of R$ 67,071.
| 5.8 | Preferred shareholders payable in subsidiaries |
Accounting policy
Financial liabilities are measured at amortized cost, taking into account the outstanding balance of the initial contribution, increased by interest on the principal, less dividends paid.
On June 27, 2014, the subsidiary Cosan S.A. performed a corporate reorganization and created the subsidiary Cosan Investimentos e Participações S.A. (“CIP”), to optimize its capital structure and improve its debt profile. A contribution of R$ 2,000,000 was received through twonon-voting preferred shares—Fundo de Investimentos em Participações Multisetoriais Plus II (“FIP Multisetorial”) and Razac Fundo de Investimentos em Participações (“FIP Razac”). CIP received from Cosan a 50% interest in the joint ventures, Raízen Energia and Raízen Combustíveis, and the commitments contributed were debentures and working capital financing.
The shareholders’ agreement has exit clauses, in which the Company may repurchase these interests and for the reason was recorded a financial liability and amount of R$ 2,000,000 plus interest minus dividends from Joint Ventures considered as repayments.
The Company will be required to pay investors if they exercise the option to sell the investment in 2021.
5.9 Derivative financial instruments
Accounting policy
Derivatives are initially recognized at fair value on the date a derivative contract is entered into and are subsequently remeasured to their fair value at the end of each reporting period. The accounting for subsequent changes in fair value depends on whether the derivative is designated as a hedging instrument, and if so, the nature of the item being hedged. The Company designates certain derivatives as either:
| | i. | hedges of the fair value of recognized assets or liabilities or a firm commitment (fair value hedges); or |
| | ii. | hedges of a particular risk associated with the cash flows of recognized assets and liabilities and highly probable forecast transactions (cash flow hedges). |
At inception of the hedge relationship, the Company documents the economic relationship between hedging instruments and hedged items including whether changes in the cash flows of the hedging instruments are expected to offset changes in the cash flows of hedged items. The Company documents its risk management objective and strategy for undertaking its hedge transactions. Changes in the fair value of any derivative instrument that does not qualify for hedge accounting are recognized immediately in profit or loss and are included in other gains / (losses).
The fair values of derivative financial instruments designated in hedge relationships are disclosed below. The full fair value of a hedging derivative is classified as anon-current asset or liability when the remaining maturity of the hedged item is more than 12 months; it is classified as a current asset or liability when the remaining maturity of the hedged item is less than 12 months.
The Company makes an assessment, both at the inception of the hedge relationship as well as on an ongoing basis, of whether the hedging instruments are expected to be highly effective in offsetting the changes in the fair value or cash flows of the respective hedged items attributable to the hedged risk, and whether the actual results of each hedge are within a range of 60% to 140% (80% — 125% until December 31, 2017).
F-39
Cosan Limited
Notes to the consolidated financial statements
(In thousands of Brazilian Reais—R$ unless otherwise stated)
To protect the Company’s exposure to risk were are using observable data such as quoted prices in active markets, or discounted cash flow based on market curves, and the consolidated data are presented below:
| | | | | | | | | | | | | | | | |
| | | Notional | | | Fair value | |
| | | December 31, 2018 | | | December 31, 2017 | | | December 31, 2018 | | | December 31, 2017 | |
Exchange rate derivatives | | | | | | | | | | | | | | | | |
Forward agreements | | | 907,832 | | | | 494,302 | | | | 1,719 | | | | (457 | ) |
Interest rate and exchange rate risk | | | | | | | | | | | | | | | | |
Swap agreements (interest rate) | | | 2,114,926 | | | | 2,446,369 | | | | 394,497 | | | | 330,712 | |
Swap agreements (exchange and interest rate) | | | 11,896,908 | | | | 7,217,792 | | | | 2,126,927 | | | | 716,873 | |
| | | | | | | | | | | | | | | | |
| | | 14,011,834 | | | | 9,664,161 | | | | 2,521,424 | | | | 1,047,585 | |
Total financial instruments | | | | 2,523,143 | | | | 1,047,128 | |
| | | | | | | | | |
Assets | | | | | | | | | | | 2,548,857 | | | | 1,162,213 | |
| | | | | | | | | | | | | | | | |
Liabilities | | | | | | | | | | | (25,714 | ) | | | (115,085 | ) |
| | | | | | | | | | | | | | | | |
Derivatives are only used for economic hedging purposes and not as speculative investments.
Currently the Company has adopted the hedge accounting of fair value for some its operations that both the hedging instruments and the hedged items are accounted for at fair value through profit or loss. Operations and accounting effects of this adoption are as follows:
| | | | | | | | | | | | |
| | | Debt(i) | | | Derivative(ii) | | | Total | |
At January 01, 2017 | | | (1,534,072 | ) | | | 146,697 | | | | (1,387,375 | ) |
Initial measurement | | | (2,461,836 | ) | | | — | | | | (2,461,836 | ) |
Interest amortization | | | 173,186 | | | | 49,653 | | | | 222,839 | |
Fair value | | | (395,499 | ) | | | 162,356 | | | | (233,143 | ) |
| | | | | | | | | | | | |
At December 31, 2017 | | | (4,218,221 | ) | | | 358,706 | | | | (3,859,515 | ) |
Initial measurement | | | (3,478,165 | ) | | | — | | | | (3,478,165 | ) |
Principal amortization | | | 364,491 | | | | (37,956 | ) | | | 326,535 | |
Interest amortization | | | 409,277 | | | | 35,033 | | | | 444,310 | |
Fair value | | | (1,541,898 | ) | | | 988,806 | | | | (553,092 | ) |
| | | | | | | | | | | | |
At December 31, 2018 | | | (8,464,516 | ) | | | 1,344,589 | | | | (7,119,927 | ) |
| | | | | | | | | | | | |
| (i) | Loans, borrowings and debentures (Note 5.5). |
| (ii) | Derivative financial instruments. |
| 5.10 | Recognized fair value measurements |
Accounting policy
When the fair value of financial assets and liabilities cannot be derived from active markets, their fair value is determined using valuation techniques including the discounted cash flow model. The inputs to these models are taken from observable markets where possible, but when this is not feasible, a degree of judgment is required in determining fair values. Judgment is required in the determination of inputs such as liquidity risk, credit risk and volatility. Changes in these variables could affect the reported fair value of financial instruments.
The Company has an established control framework with respect to the measurement of fair values. This includes a valuation team that has overall responsibility for overseeing all significant fair value measurements, including Level 3 fair values, and reports directly to the Board.
F-40
Cosan Limited
Notes to the consolidated financial statements
(In thousands of Brazilian Reais—R$ unless otherwise stated)
The Company regularly reviews significant unobservable inputs and valuation adjustments. If third party information, such as broker quotes or pricing services, is used to measure fair values, then the treasury assesses the evidence obtained from the third parties to support the conclusion that these valuations meet the requirements of Company’s policy, including the level in the fair value hierarchy in which the valuations should be classified.
Significant valuation issues are reported to the Board. When measuring the fair value of an asset or a liability, the Company uses observable market data as far as possible. Fair values are categorized into different levels in a fair value hierarchy based on the inputs used in the valuation techniques as follows.
| | • | | Level 1: inputs represent unadjusted quoted prices for identical instruments exchanged in active markets. |
| | • | | Level 2: inputs include directly or indirectly observable inputs (other than Level 1inputs) such as quoted prices for similar financial instruments exchanged in active markets, quoted prices for identical or similar financial instruments exchanged in inactive markets and other market observable inputs. The fair value of the majority of the company’s investments in securities, derivative contracts and bonds. |
| | • | | Level 3: inputs for the asset or liability that are not based on observable market data (unobservable inputs). Management is required to use its own assumptions regarding unobservable inputs as there is little, if any, market activity in these instruments or related observable inputs that can be corroborated at the measurement date. |
If the inputs used to measure the fair value of an asset or a liability fall into different levels of the fair value hierarchy, then the fair value measurement is categorized in its entirety in the same level of the fair value hierarchy as the lowest level input that is significant to the entire measurement.
Specific valuation techniques used to value financial instruments include:
| | i. | the use of quoted market prices; |
| | ii. | the fair value is calculated as the present value of the estimated future cash flows. Estimates of future floating-rate cash flows are based on quoted swap rates, futures prices and interbank borrowing rates. Estimated cash flows are discounted using a yield curve constructed from similar sources and which reflects the relevant benchmark interbank rate used by market participants for this purpose when pricing interest rate swaps. The fair value estimate is subject to a credit risk adjustment that reflects the credit risk of the Company and of the counterparty; this is calculated based on credit spreads derived from current credit default swap or bond prices; |
| | iii. | for other financial instruments we analyze discounted cash flow. |
The market value of the Senior Notes are listed on the Luxembourg Stock Exchange (Note 5.5) is based on their quoted market price are as follows:
| | | | | | | | | | |
| | | Company | | December 31, 2018 | | | December 31, 2017 | |
Senior Notes 2018 | | Cosan S.A. | | | — | | | | 100.37 | % |
Senior Notes 2023 | | Cosan S.A. | | | 96.86 | % | | | 101.54 | % |
Senior Notes 2024 | | Rumo Luxembourg | | | 104.27 | % | | | 107.86 | % |
Senior Notes 2024 | | Cosan Limited | | | 98.55 | % | | �� | 102.79 | % |
Senior Notes 2025 | | Rumo Luxembourg | | | 94.94 | % | | | — | |
Senior Notes 2027 | | Cosan S.A. | | | 101.15 | % | | | 108.14 | % |
Perpetual Notes | | Cosan S.A. | | | 101.21 | % | | | 102.83 | % |
All of the resulting fair value estimates are included in level 2 except for a contingent consideration payable where the fair values have been determined based on present values and the discount rates used were adjusted for counterparty or own credit risk.
F-41
Cosan Limited
Notes to the consolidated financial statements
(In thousands of Brazilian Reais—R$ unless otherwise stated)
The carrying amounts and fair value of financial assets and financial liabilities are as follows:
| | | | | | | | | | | | | | | | | | | | | | | | | | | | |
| | | | | | | | | | | | Assets and liabilities measured at fair value | |
| | | | | | Carrying amount | | | December 31, 2018 | | | December 31, 2017 | |
| | | Note | | | December 31, 2018 | | | December 31, 2017 | | | Level 2 | | | Level 3 | | | Level 2 | | | Level 3 | |
Assets | | | | | | | | | | | | | | | | | | | | | | | | | | | | |
Investment funds | | | 5.1 | | | | 1,600,590 | | | | 1,852,114 | | | | 1,600,590 | | | | — | | | | 1,852,114 | | | | — | |
Marketable securities | | | 5.2 | | | | 4,202,835 | | | | 3,853,343 | | | | 4,202,835 | | | | — | | | | 3,853,343 | | | | — | |
Derivative financial instruments | | | 5.9 | | | | 2,548,857 | | | | 1,162,213 | | | | 2,548,857 | | | | — | | | | 1,162,213 | | | | — | |
| | | | | | | | | | | | | | | | | | | | | | | | | | | | |
Total | | | | | | | 8,352,282 | | | | 6,867,670 | | | | 8,352,282 | | | | — | | | | 6,867,670 | | | | — | |
| | | | | | | | | | | | | | | | | | | | | | | | | | | | |
Liabilities | | | | | | | | | | | | | | | | | | | | | | | | | | | | |
Loans, borrowings and debentures | | | 5.5 | | | | (12,569,126 | ) | | | (7,830,237 | ) | | | (12,569,126 | ) | | | — | | | | (7,830,237 | ) | | | — | |
Contingent consideration(i) | | | | | | | (64,969 | ) | | | (116,542 | ) | | | — | | | | (64,969 | ) | | | — | | | | (116,542 | ) |
Derivative financial instruments | | | 5.9 | | | | (25,714 | ) | | | (115,085 | ) | | | (25,714 | ) | | | — | | | | (115,085 | ) | | | — | |
| | | | | | | | | | | | | | | | | | | | | | | | | | | | |
Total | | | | | | | (12,659,809 | ) | | | (8,061,864 | ) | | | (12,594,840 | ) | | | (64,969 | ) | | | (7,945,322 | ) | | | (116,542 | ) |
| | | | | | | | | | | | | | | | | | | | | | | | | | | | |
| (i) | The valuation of the contingent consideration considers the present value of expected payment, discounted using a risk-adjusted discount rate. The expected payment is determined by considering the probable scenarios of forecast revenue and EBITDA, the amount to be paid under each scenario and the probability of each scenario. The significant unobservable inputs are the forecast of the annual growth rate of revenue, EBITDA margin forecast and the 13% discount rate adjusted for risk. |
The following table presents the changes in level 3 items:
| | | | |
At January 01, 2017 | | | 166,807 | |
Repayment of principal | | | (50,265 | ) |
| | | | |
At December 31, 2017 | | | 116,542 | |
Repayment of principal | | | (52,240 | ) |
Interest and exchange variation | | | 667 | |
| | | | |
At December 31, 2018 | | | 64,969 | |
| | | | |
| 6 | Other current tax receivables |
Accounting policy
Current tax assets primarily include (i) tax effects which are recognized in the consolidated statement of profit or loss when the asset is sold to a third-party or recovered through amortization of the asset’s remaining economic life; and (ii) income tax receivables that are expected to be recovered either as refunds from taxing authorities or as a reduction to future tax obligations.
| | | | | | | | |
| | | December 31, 2018 | | | December 31, 2017 | |
COFINS—Revenue tax(i) | | | 646,135 | | | | 278,512 | |
ICMS—State VAT | | | 575,494 | | | | 477,160 | |
ICMS CIAP—State VAT | | | 183,845 | | | | 214,745 | |
PIS—Revenue tax(i) | | | 169,460 | | | | 73,214 | |
Credit installment | | | 40,261 | | | | 38,926 | |
Other | | | 32,496 | | | | 23,673 | |
| | | | | | | | |
| | | 1,647,691 | | | | 1,106,230 | |
Current | | | 796,199 | | | | 327,410 | |
| | | | | | | | |
Non-Current | | | 851,492 | | | | 778,820 | |
| | | | | | | | |
F-42
Cosan Limited
Notes to the consolidated financial statements
(In thousands of Brazilian Reais—R$ unless otherwise stated)
| | i. | On March 15, 2017, in case that sets a judicial precedent, the Federal Supreme Court (Supremo Tribunal Federal) or “STF,” granted Extraordinary Appeal 574,706 against a decision that required the inclusion of ICMS in the calculation of the tax base of PIS and COFINS. |
Accordingly, based on the STF’s decision, the subsidiary Comgás and Rumo recognized certain credits deriving from PIS and COFINS contributions in the amount of R$ 188,216 and R$ 11,054, respectively, partially as deductions of revenues and partially as other revenues. For Comgás, PIS and COFINS credits are taken into consideration in the regulator’s accounting system and will be reversed in favor of concession users through tariff revisions or annual readjustments once the decision is final and unappealable pursuant to CSPE Regulation 399/2006 and applicable legislation. In addition to the credits recognized by the STF decision, the subsidiary Comgás has a contingent asset in an amount of approximately R$ 569,000 (taking into account amounts from July 2008) arising from a judicial proceeding which has not yet been decided.
The subsidiary CLE obtained a final and unappealable decision on June 15, 2018 with regards to the period from 2001 onwards as a result of which it recognized an amount of R$ 232,013. Pursuant to a contract between the subsidiaries Cosan S.A. and CLE, the amount of R$ 200,866 accrued between September 2001 and February 2017 is due to Cosan S.A whereas amounts accruing from March 2017 (totalling R$ 31,148) are due to the subsidiary CLE.
In summary, the Company recognized on a consolidated basis the amount of R$ 431,283 (R$ 139,013 recorded as deduction of gross sales, R$ 199,027 in other income, and R$ 93,243 for the finance results). As this is a transaction with no cash effect, an amount of R$ 338,040 was adjusted in the cash flow as “Recovering tax credits,” recorded in “other income (expenses), net,” and an amount of R$ 93,243 as “Interest on other receivables.”
Accounting policy
Inventories are stated at the lower of cost and net realizable value (net realizable value is the estimated selling price in the ordinary course of business less the estimated costs of completion and the estimated costs necessary to make the sale). Cost comprises direct materials, direct labor and an appropriate proportion of variable and fixed overhead expenditure, the latter being allocated based on normal operating capacity. Costs are assigned to individual items of inventory based on weighted average costs.
Appropriate allowance is made for risks associated with holding and selling inventories due to obsolescence. Inventories are written down further when their net realizable value falls below cost.
| | | | | | | | |
| | | December 31, 2018 | | | December 31, 2017 | |
Finished goods | | | 389,896 | | | | 298,860 | |
Raw material for construction process | | | 45,397 | | | | 53,213 | |
Fuels and lubricants | | | 6,224 | | | | 4,207 | |
Spare parts and accessories | | | 224,005 | | | | 244,256 | |
Warehouse and others | | | 50,768 | | | | 62,525 | |
| | | | | | | | |
| | | 716,290 | | | | 663,061 | |
| | | | | | | | |
| 8 | Investments in associates |
| 8.1 | Investments in subsidiaries and associates |
Accounting policy
Subsidiaries are all entities over which the Company has control. Subsidiaries are fully consolidated from the date of acquisition of control and continue to be consolidated until the date that control ceases to exist. They are deconsolidated from the date that control ceases.
F-43
Cosan Limited
Notes to the consolidated financial statements
(In thousands of Brazilian Reais—R$ unless otherwise stated)
The financial statements of subsidiaries are prepared for the same reporting period as that of the parent company, using consistent accounting policies. When necessary, adjustments are made to the financial statements of subsidiaries to bring their accounting policies into line with the Company’s accounting policies.
All intra-group assets and liabilities, equity, income, expenses and cash flows relating to transactions between members of the Company are eliminated in full on consolidation. Unrealized gains arising from transactions with equity accounted investees are eliminated against the investment to the extent of the Company’s interest in the investee. Unrealized losses are similarly eliminated, but only to the extent that there is no evidence of impairment.
Associates are those entities in which the Company has significant influence, but not control or joint control, over the financial and operating policies.
Investments in associates are accounted for under the equity method and are recognized initially at cost. The cost of the investment includes transaction costs.
Under the equity method of accounting, the share attributable to the Company of the profit or loss for the period of such investments is accounted for in the statement of profit or loss, in “Equity in investees.” Unrealized gains and losses arising on transactions between the Company and the investees are eliminated based on the percentage of interest held in such investees. The other comprehensive income of subsidiaries, associates and jointly controlled entities is recorded directly in the Company’s shareholders’ equity, in “Other comprehensive income.”
Intra-group balances and transactions, and any unrealized income and expenses arising from intra-group transactions, are eliminated in preparing the consolidated financial statements.
Unrealized gains arising from transactions with equity accounted investees are eliminated against the investment to the extent of the Company’s interest in the investee. Unrealized losses are similarly eliminated, but only to the extent that there is no evidence of impairment.
F-44
Cosan Limited
Notes to the consolidated financial statements
(In thousands of Brazilian Reais—R$ unless otherwise stated)
Cosan’s subsidiaries are listed below:
| | | | | | | | |
| | | December 31, 2018 | | | December 31, 2017 | |
Directly owned subsidiaries | | | | | | | | |
Cosan Logística S.A. | | | 72.50 | % | | | 72.53 | % |
Cosan S.A. | | | 60.25 | % | | | 58.21 | % |
Interest of Cosan S.A. in its subsidiaries | | | | | | | | |
Moove Lubricants Limited(vi) | | | 100.00 | % | | | 100.00 | % |
Comgás(ii) | | | 80.12 | % | | | 79.87 | % |
Cosan Biomassa S.A.(i) | | | 100.00 | % | | | 100.00 | % |
Cosan Cayman II Limited | | | 100.00 | % | | | 100.00 | % |
Cosan Global Limited | | | 100.00 | % | | | 100.00 | % |
Cosan Investimentos e Participações S.A. | | | 100.00 | % | | | 100.00 | % |
Cosan Lubes Investments Limited(vi) | | | 100.00 | % | | | 100.00 | % |
Airport Energy Limited(vi) | | | 100.00 | % | | | 100.00 | % |
Airport Energy Services Limited(vi) | | | 100.00 | % | | | 100.00 | % |
Wessesx Petroleum Limited(vi) | | | 100.00 | % | | | 100.00 | % |
Stanbridge Group Limited(vi) | | | 100.00 | % | | | 100.00 | % |
TTA(iii) | | | 75.00 | % | | | — | |
Cosan Lubrificantes S.R.L(iii) | | | 100.00 | % | | | — | |
LubrigrupoII(iii) | | | 100.00 | % | | | — | |
Metrolube(iii) | | | 100.00 | % | | | — | |
Cosan Lubrificantes e Especialidades S.A. | | | 100.00 | % | | | 100.00 | % |
Cosan Luxembourg S.A.(i) | | | 100.00 | % | | | 100.00 | % |
Cosan Overseas Limited | | | 100.00 | % | | | 100.00 | % |
Cosan Paraguay S.A. | | | 100.00 | % | | | 100.00 | % |
Cosan US. Inc. | | | 100.00 | % | | | 100.00 | % |
Ilha Terminal Distribuição de Produtos Químicos | | | 100.00 | % | | | 100.00 | % |
Pasadena Empreendimentos e Participações S.A.(i) | | | 100.00 | % | | | 100.00 | % |
Zip Lube S.A. | | | 100.00 | % | | | 100.00 | % |
Payly Soluções de Pagamento S.A.(iv) | | | 100.00 | % | | | — | |
Rumo S.A. | | | 1.71 | % | | | 1.71 | % |
Interest of Cosan Logística in its subsidiaries | | | | | | | | |
Rumo S.A. | | | 28.47 | % | | | 28.47 | % |
Logispot Armazéns Gerais S.A. | | | 14.52 | % | | | 14.52 | % |
Elevações Portuárias S.A. | | | 28.47 | % | | | 28.47 | % |
Rumo Luxembourg Sarl | | | 28.47 | % | | | 28.47 | % |
Rumo Intermodal S.A. | | | 28.47 | % | | | 28.47 | % |
Rumo Malha Oeste S.A. | | | 28.47 | % | | | 28.47 | % |
Rumo Malha Paulista S.A. | | | 28.47 | % | | | 28.47 | % |
Rumo Malha Sul S.A. | | | 28.47 | % | | | 28.47 | % |
Rumo Malha Norte S.A. | | | 28.40 | % | | | 28.33 | % |
Boswells S.A. | | | 28.47 | % | | | 28.47 | % |
Brado Holding S.A.(v) | | | — | | | | 28.47 | % |
ALL Serviços Ltda.(v) | | | — | | | | 28.47 | % |
ALL Argentina S.A. | | | 28.47 | % | | | 28.47 | % |
Paranaguá S.A. | | | 28.47 | % | | | 28.47 | % |
ALL Armazéns Gerais Ltda. | | | 28.47 | % | | | 28.47 | % |
Portofer Ltda. | | | 28.47 | % | | | 28.47 | % |
Brado Logística e Participações S.A. | | | 17.71 | % | | | 17.71 | % |
Brado Logística S.A. | | | 17.71 | % | | | 17.71 | % |
ALL Mesopotâmica S.A. | | | 20.09 | % | | | 20.09 | % |
ALL Central S.A. | | | 20.94 | % | | | 20.94 | % |
Servicios de Inversión Logística Integrales S.A | | | 28.47 | % | | | 28.47 | % |
PGT S.A.(v) | | | — | | | | 28.47 | % |
F-45
Cosan Limited
Notes to the consolidated financial statements
(In thousands of Brazilian Reais—R$ unless otherwise stated)
| | i. | Management has concluded that there are no material uncertainties that cast doubt on the continuity of the subsidiaries. Although they had a combined amount of uncovered liabilities of R$ 75,275 as of December 31, 2018, no events or conditions were identified that individually or collectively could raise significant doubts related to their ability to maintain their operational continuity. The subsidiaries have the financial support of the Company. |
| | ii. | As of June 30, 2018, the Company increased its interest, in Comgás to 80.12% due to the capital increase arising from the partial use of the goodwill tax benefit, according to Ordinary / Extraordinary General Meeting of April 25, 2018, of the subsidiary Comgás. As a consequence, a loss in shareholders’ equity was recognized in the total amount of R$ 7,888. |
| | iii. | Acquisition of control / Company formation in the Moove segment as described in the note 1. |
| | iv. | Subsidiary established on August 1, 2018 to start the new business“e-wallet.” |
| | v. | As mentioned in Note 1, the merger of Brado Holding S.A., Rumo Malha Norte Holding Ltda. and Tezza Consultoria de Negócios Ltda. (“ALL Serviços Ltda.”) by “Rumo.” In addition, the incorporation of PGT S.A. by ALL Armazéns Gerais Ltda.. |
| | vi. | The United Kingdom’s withdrawal from the European Union is scheduled to become effective on March 29, 2019, but there is still uncertainty as to whether the withdrawal agreement reached with the European Union, or a variation thereof, will be approved by the United Kingdom parliament. |
Set out below are the associates as at December 31, 2018 which are material to the Company:
| | | | | | | | | | | | | | | | |
| | | Shares issued
by the associate | | | Shares held
by Cosan | | | Cosan
ownership
interest | | | Economic
benefit (%) | |
Radar II Propriedades Agrícolas S.A. | | | 81,440,221 | | | | 24,920,708 | | | | 51.00 | % | | | 3.00 | % |
Radar Propriedades Agrícolas S.A. | | | 1,735,703 | | | | 531,125 | | | | 51.00 | % | | | 2.51 | % |
Tellus Brasil Participações S.A. | | | 120,920,492 | | | | 61,359,624 | | | | 50.74 | % | | | 5.00 | % |
Usina Santa Luiza S.A. | | | 28,553,200 | | | | 9,516,782 | | | | 33.33 | % | | | 33.33 | % |
Janus Brasil Participações S.A. | | | 207,712,545 | | | | 105,461,644 | | | | 50.77 | % | | | 5.00 | % |
Novvi Limited Liability Company | | | 1,011,000 | | | | 202,200 | | | | 20.00 | % | | | 20.00 | % |
| | | | | | | | | | | | | | | | | | | | | | | | |
| | | At
January 1, 2018 | | | Interest in
earnings (losses)
of subsidiaries | | | Other
comprehensive
income (losses) | | | Dividends | | | Increase/
reduction
of capital | | | At
December 31, 2018 | |
Tellus Brasil Participações S.A. | | | 98,723 | | | | 5,618 | | | | — | | | | (3,232 | ) | | | — | | | | 101,109 | |
Novvi Limited Liability Company | | | 11,756 | | | | (524 | ) | | | 2,217 | | | | — | | | | — | | | | 13,449 | |
Janus Brasil Participações S.A. | | | 51,426 | | | | 9,142 | | | | — | | | | (4,386 | ) | | | 37,639 | | | | 93,821 | |
Radar Propriedades Agrícolas S.A | | | 57,532 | | | | 2,528 | | | | 202 | | | | (678 | ) | | | — | | | | 59,584 | |
Radar II Propriedades Agrícolas S.A | | | 31,126 | | | | 1,634 | | | | 42 | | | | (566 | ) | | | — | | | | 32,236 | |
Usina Santa Luiza S.A. | | | 4,389 | | | | 22,987 | | | | — | | | | — | | | | 1,833 | | | | 29,209 | |
Other | | | 46,390 | | | | 10,088 | | | | 741 | | | | (8,108 | ) | | | — | | | | 49,111 | |
| | | | | | | | | | | | | | | | | | | | | | | | |
| | | 301,342 | | | | 51,473 | | | | 3,202 | | | | (16,970 | ) | | | 39,472 | | | | 378,519 | |
| | | | | | | | | | | | | | | | | | | | | | | | |
| | | | | | | | | | | | | | | | | | | | | | | | | | | | |
| | | At
January 1, 2017 | | | Interest in
earnings (losses)
of subsidiaries | | | Other
comprehensive
income (losses) | | | Dividends | | | Increase/
reduction
of capital | | | Assumption
of assets
and liabilities | | | At
December 31, 2017 | |
Tellus Brasil Participações S.A. | | | 97,002 | | | | 4,972 | | | | — | | | | (3,251 | ) | | | — | | | | — | | | | 98,723 | |
Novvi Limited Liability Company | | | 18,838 | | | | (7,665 | ) | | | 583 | | | | — | | | | — | | | | — | | | | 11,756 | |
Janus Brasil Participações S.A. | | | 33,998 | | | | 3,014 | | | | 3,181 | | | | (1,840 | ) | | | 13,073 | | | | — | | | | 51,426 | |
Radar Propriedades Agrícolas S.A | | | 55,148 | | | | 3,128 | | | | 232 | | | | (976 | ) | | | — | | | | — | | | | 57,532 | |
Radar II Propriedades Agrícolas S.A | | | 30,537 | | | | 1,704 | | | | 46 | | | | (1,161 | ) | | | — | | | | — | | | | 31,126 | |
Usina Santa Luiza S.A. | | | — | | | | 8,979 | | | | — | | | | — | | | | 1,433 | | | | (6,023 | ) | | | 4,389 | |
Other | | | 51,424 | | | | 3,030 | | | | — | | | | (9,002 | ) | | | — | | | | 938 | | | | 46,390 | |
| | | | | | | | | | | | | | | | | | | | | | | | | | | | |
| | | 286,947 | | | | 17,162 | | | | 4,042 | | | | (16,230 | ) | | | 14,506 | | | | (5,085 | ) | | | 301,342 | |
| | | | | | | | | | | | | | | | | | | | | | | | | | | | |
F-46
Cosan Limited
Notes to the consolidated financial statements
(In thousands of Brazilian Reais—R$ unless otherwise stated)
Financial information of associates:
| | | | | | | | | | | | | | | | | | | | | | | | | | | | | | | | |
| | | December 31, 2018 | | | December 31, 2017 | |
| | | Assets | | | Liabilities | | | Shareholders’
equity | | | Profit or
(loss) in
the year | | | Assets | | | Liabilities | | | Shareholders’
equity | | | Profit or
(loss) in
the year | |
Radar Propriedades Agrícolas S.A. | | | 2,240,694 | | | | (302,946 | ) | | | 1,937,748 | | | | 100,628 | | | | 2,362,536 | | | | (63,915 | ) | | | (2,298,621 | ) | | | 125,441 | |
Radar II Propriedades Agrícolas S.A. | | | 829,739 | | | | (18 | ) | | | 829,721 | | | | 54,509 | | | | 1,026,024 | | | | (53 | ) | | | (1,025,971 | ) | | | 56,197 | |
Novvi Limited Liability Company | | | 81,729 | | | | (6,255 | ) | | | 75,474 | | | | 11,750 | | | | 42,739 | | | | (7,095 | ) | | | (35,644 | ) | | | (24,415 | ) |
Tellus Brasil Participações Ltda | | | 172,895 | | | | (214,712 | ) | | | (41,817 | ) | | | (34,637 | ) | | | 2,029,201 | | | | (99,135 | ) | | | (1,930,066 | ) | | | 97,044 | |
Usina Santa Luiza S.A. | | | 110,629 | | | | (22,993 | ) | | | (87,636 | ) | | | (74,467 | ) | | | 37,218 | | | | (24,050 | ) | | | (13,168 | ) | | | (5,625 | ) |
Janus Brasil Participações S.A. | | | 1,981,825 | | | | (142,347 | ) | | | 1,839,478 | | | | 133,134 | | | | 1,753,327 | | | | (162,531 | ) | | | (1,590,796 | ) | | | 116,357 | |
| 8.2 | Non-controlling interests in subsidiaries |
Accounting policy
Transactions withnon-controlling interests that do not result in loss of control are accounted for as equity transactions – that is, as transactions with the owners in their capacity as owners.
Set out below is summarized financial information for each subsidiary that hasnon-controlling interests that are material to the group. The amounts disclosed for each subsidiary are before inter-company eliminations.
| | | | | | | | | | | | |
| | | Shares issued by
the subsidiary | | | Shares held by
non-controlling
shareholders | | | Non-controlling
interest | |
Comgás | | | 132,023,251 | | | | 26,243,394 | | | | 19.88 | % |
Logispot Armazéns Gerais S.A. | | | 2,040,816 | | | | 1,000,000 | | | | 49.00 | % |
Rumo | | | 1,559,015,898 | | | | 1,088,431,798 | | | | 69.82 | % |
Brado Logística e Participações S.A. | | | 12,962,963 | | | | 4,897,407 | | | | 37.78 | % |
Rumo Malha Norte S.A. | | | 1,189,412,363 | | | | 5,709,179 | | | | 0.48 | % |
Cosan S.A. | | | 407,904,353 | | | | 156,000,696 | | | | 38.24 | % |
Cosan Logística | | | 463,224,241 | | | | 127,324,097 | | | | 27.49 | % |
The following table summarizes the information relating to each of the Company’s subsidiaries that has materialnon-controlling interests, before any intra-group elimination.
F-47
Cosan Limited
Notes to the consolidated financial statements
(In thousands of Brazilian Reais—R$ unless otherwise stated)
| | | | | | | | | | | | | | | | | | | | | | | | | | | | | | | | | | | | |
| | | At
January 1, 2018 | | | Interest in
earnings (losses)
of subsidiaries | | | Sales or
purchase
of interests | | | Other
comprehensive
income (losses) | | | Dividends | | | New
standards
adopted by
Company | | | Business
combination | | | Other | | | At
December 31, 2018 | |
Cosan S.A. | | | 3,795,050 | | | | 632,964 | | | | (448,538 | ) | | | (17,456 | ) | | | (216,702 | ) | | | (3,381 | ) | | | — | | | | 24,027 | | | | 3,765,964 | |
Cosan Logística | | | 607,284 | | | | 20,538 | | | | 404 | | | | 875 | | | | — | | | | (77 | ) | | | — | | | | 1,309 | | | | 630,333 | |
Comgás | | | 850,595 | | | | 250,774 | | | | 12,287 | | | | (6,418 | ) | | | (118,945 | ) | | | (1,280 | ) | | | — | | | | 345 | | | | 987,358 | |
Rumo | | | 5,732,763 | | | | 197,616 | | | | — | | | | 7,999 | | | | (2,742 | ) | | | — | | | | — | | | | (6,485 | ) | | | 5,929,151 | |
Logispot Armazéns Agrícolas S.A. | | | 34,588 | | | | 90 | | | | — | | | | — | | | | (22 | ) | | | — | | | | — | | | | — | | | | 34,656 | |
Other | | | 376 | | | | 5,750 | | | | — | | | | (795 | ) | | | (5,039 | ) | | | — | | | | 7,199 | | | | — | | | | 7,491 | |
| | | | | | | | | | | | | | | | | | | | | | | | | | | | | | | | | | | | |
| | | 11,020,656 | | | | 1,107,732 | | | | (435,847 | ) | | | (15,795 | ) | | | (343,450 | ) | | | (4,738 | ) | | | 7,199 | | | | 19,196 | | | | 11,354,953 | |
| | | | | | | | | | | | | | | | | | | | | | | | | | | | | | | | | | | | |
| | | | | | | | | | | | | | | | | | | | | | | | | | | | | | | | |
| | | At
January 1, 2017 | | | Interest in
earnings (losses)
of subsidiaries | | | Sales or
purchase
of interests | | | Other
comprehensive
income (losses) | | | Dividends | | | Capital
increase | | | Other | | | At
December 31, 2017 | |
Cosan S.A. | | | 3,343,719 | | | | 499,455 | | | | 148,465 | | | | 66,612 | | | | (274,177 | ) | | | — | | | | 10,976 | | | | 3,795,050 | |
Cosan Logística | | | 424,784 | | | | (21,840 | ) | | | (6,026 | ) | | | 124 | | | | — | | | | 209,786 | | | | 456 | | | | 607,284 | |
Comgás | | | 1,826,733 | | | | 195,206 | | | | (753,019 | ) | | | (3,130 | ) | | | (428,603 | ) | | | — | | | | 13,408 | | | | 850,595 | |
Rumo | | | 4,105,962 | | | | (182,997 | ) | | | (33,281 | ) | | | 999 | | | | (5,049 | ) | | | 1,843,176 | | | | 3,953 | | | | 5,732,763 | |
Logispot Armazéns Agrícolas S.A. | | | 36,088 | | | | (1,500 | ) | | | — | | | | — | | | | — | | | | — | | | | — | | | | 34,588 | |
Other | | | — | | | | 6,952 | | | | — | | | | — | | | | (19,395 | ) | | | — | | | | 12,819 | | | | 376 | |
| | | | | | | | | | | | | | | | | | | | | | | | | | | | | | | | |
| | | 9,737,286 | | | | 495,276 | | | | (643,861 | ) | | | 64,605 | | | | (727,224 | ) | | | 2,052,962 | | | | 41,612 | | | | 11,020,656 | |
| | | | | | | | | | | | | | | | | | | | | | | | | | | | | | | | |
F-48
Cosan Limited
Notes to the consolidated financial statements
(In thousands of Brazilian Reais—R$ unless otherwise stated)
Summarized statement of financial position:
| | | | | | | | | | | | | | | | | | | | | | | | | | | | | | | | |
| | | Comgás | | | Cosan S.A. | | | Cosan Logística | | | Rumo | |
| | | December 31, 2018 | | | December 31, 2017 | | | December 31, 2018 | | | December 31, 2017 | | | December 31, 2018 | | | December 31, 2017 | | | December 31, 2018 | | | December 31, 2017 | |
Current | | | | | | | | | | | | | | | | | | | | | | | | | | | | | | | | |
Assets | | | 3,223,524 | | | | 3,292,492 | | | | 2,076,250 | | | | 2,439,746 | | | | 7,147 | | | | 7,112 | | | | 297,823 | | | | 581,296 | |
Liabilities | | | (1,915,211 | ) | | | (3,126,675 | ) | | | (927,622 | ) | | | (1,074,408 | ) | | | (1,806 | ) | | | (3,625 | ) | | | (365,275 | ) | | | (585,226 | ) |
| | | | | | | | | | | | | | | | | | | | | | | | | | | | | | | | |
Net current assets | | | 1,308,313 | | | | 165,817 | | | | 1,148,628 | | | | 1,365,338 | | | | 5,341 | | | | 3,487 | | | | (67,452 | ) | | | (3,930 | ) |
Non-current | | | | | | | | | | | | | | | | | | | | | | | | | | | | | | | | |
Assets | | | 8,836,357 | | | | 9,104,142 | | | | 16,190,848 | | | | 14,154,927 | | | | 2,286,503 | | | | 2,207,520 | | | | 10,928,252 | | | | 10,239,474 | |
Liabilities | | | (4,981,805 | ) | | | (4,730,870 | ) | | | (7,410,761 | ) | | | (6,073,595 | ) | | | — | | | | — | | | | (2,832,600 | ) | | | (2,484,084 | ) |
| | | | | | | | | | | | | | | | | | | | | | | | | | | | | | | | |
Netnon-current assets | | | 3,854,552 | | | | 4,373,272 | | | | 8,780,087 | | | | 8,081,332 | | | | 2,286,503 | | | | 2,207,520 | | | | 8,095,652 | | | | 7,755,390 | |
Equity | | | 5,162,865 | | | | 4,539,089 | | | | 9,928,715 | | | | 9,446,670 | | | | 2,291,844 | | | | 2,211,007 | | | | 8,028,200 | | | | 7,751,460 | |
| | | | | | | | | | | | | | | | | | | | | | | | | | | | | | | | |
F-49
Cosan Limited
Notes to the consolidated financial statements
(In thousands of Brazilian Reais—R$ unless otherwise stated)
Summarized statement of profit or loss and other comprehensive income:
| | | | | | | | | | | | | | | | | | | | | | | | | | | | | | |
| | | Cosan S.A. | | Cosan Logística |
| | | December 31, 2018 | | December 31, 2017 | | December 31, 2016 | | December 31, 2018 | | December 31, 2017 | | December 31, 2016 |
Profit before taxes | | | | 1,662,663 | | | | | 1,606,191 | | | | | 754,717 | | | | | 74,643 | | | | | (78,218 | ) | | | | (206,412 | ) |
Income tax expenses | | | | (10,342 | ) | | | | (290,867 | ) | | | | 357,425 | | | | | — | | | | | (1,297 | ) | | | | (282 | ) |
Profit (loss) from discontinued operation | | | | — | | | | | — | | | | | (76,057 | ) | | | | — | | | | | — | | | | | — | |
Profit for the year | | | | 1,652,321 | | | | | 1,315,324 | | | | | 1,036,085 | | | | | 74,643 | | | | | (79,515 | ) | | | | (206,694 | ) |
| | | | | | | | | | | | | | | | | | | | | | | | | | | | | | |
Other comprehensive income (loss) | | | | (40,348 | ) | | | | 179,645 | | | | | (111,232 | ) | | | | 3,194 | | | | | 394 | | | | | 1,276 | |
| | | | | | | | | | | | | | | | | | | | | | | | | | | | | | |
Total comprehensive income | | | | 1,611,973 | | | | | 1,494,969 | | | | | 924,853 | | | | | 77,837 | | | | | (79,121 | ) | | | | (205,418 | ) |
| | | | | | | | | | | | | | | | | | | | | | | | | | | | | | |
Comprehensive income attributable tonon-controlling interests | | | | 616,490 | | | | | 622,254 | | | | | 348,764 | | | | | 21,395 | | | | | (21,707 | ) | | | | (56,515 | ) |
Dividends paid | | | | (446,295 | ) | | | | (376,679 | ) | | | | (866,834 | ) | | | | — | | | | | — | | | | | — | |
| | | Comgás | | Rumo |
| | | December 31, 2018 | | December 31, 2017 | | December 31, 2016 | | December 31, 2018 | | December 31, 2017 | | December 31, 2016 |
Net sales | | | | 6,840,011 | | | | | 5,537,857 | | | | | 5,657,246 | | | | | 645,088 | | | | | 734,840 | | | | | 40,759 | |
Profit before taxes | | | | 1,799,963 | | | | | 795,629 | | | | | 1,312,517 | | | | | 285,887 | | | | | (293,290 | ) | | | | (1,137,856 | ) |
Income tax expenses | | | | (540,995 | ) | | | | (235,972 | ) | | | | (411,418 | ) | | | | (21,530 | ) | | | | 32,483 | | | | | 74,626 | |
Profit for the year | | | | 1,258,968 | | | | | 559,657 | | | | | 901,099 | | | | | 264,357 | | | | | (260,807 | ) | | | | (1,063,230 | ) |
| | | | | | | | | | | | | | | | | | | | | | | | | | | | | | |
Other comprehensive income (loss) | | | | (32,300 | ) | | | | (15,585 | ) | | | | (56,012 | ) | | | | 11,182 | | | | | 1,383 | | | | | 4,746 | |
| | | | | | | | | | | | | | | | | | | | | | | | | | | | | | |
Total comprehensive income | | | | 1,226,668 | | | | | 544,072 | | | | | 845,087 | | | | | 275,539 | | | | | (259,424 | ) | | | | (1,058,484 | ) |
| | | | | | | | | | | | | | | | | | | | | | | | | | | | | | |
Comprehensive income attributable tonon-controlling interests | | | | 243,835 | | | | | 109,501 | | | | | 315,555 | | | | | 192,368 | | | | | (185,566 | ) | | | | (758,192 | ) |
Dividends paid | | | | 756,767 | | | | | 1,121,407 | | | | | (1,369,456 | ) | | | | — | | | | | — | | | | | — | |
F-50
Cosan Limited
Notes to the consolidated financial statements
(In thousands of Brazilian Reais—R$ unless otherwise stated)
Summarized statements of cash flows:
| | | | | | | | | | | | | | | | | | | | | | | | |
| | | Cosan S.A. | | | Cosan Logística | |
| | | December 31,
2018 | | | December 31,
2017 | | | December 31,
2016 | | | December 31,
2018 | | | December 31,
2017 | | | December 31,
2016 | |
Net cash generated by (used in) operating activities | | | 1,114,880 | | | | 98,643 | | | | (415,565 | ) | | | (2,688 | ) | | | (3,481 | ) | | | (3,992 | ) |
Net cash generated by (used in) investing activities | | | 1,097,236 | | | | 1,126,170 | | | | 2,032,424 | | | | 382 | | | | (748,482 | ) | | | (757,768 | ) |
Net cash provided by (used in) financing activities | | | (1,428,044 | ) | | | (2,147,738 | ) | | | (1,280,978 | ) | | | 2,584 | | | | 753,853 | | | | 587,915 | |
| | | | | | | | | | | | | | | | | | | | | | | | |
Increase (decrease) in cash and cash equivalents | | | 784,072 | | | | (922,925 | ) | | | 335,881 | | | | 278 | | | | 1,890 | | | | (173,845 | ) |
Cash and cash equivalents at the beginning of year | | | 144,005 | | | | 1,066,930 | | | | 731,049 | | | | 1,905 | | | | 15 | | | | 173,860 | |
| | | | | | | | | | | | | | | | | | | | | | | | |
Effect of exchange rate fluctuations on cash held | | | — | | | | — | | | | — | | | | — | | | | — | | | | — | |
| | | | | | | | | | | | | | | | | | | | | | | | |
Cash and cash equivalents at the end of year | | | 928,077 | | | | 144,005 | | | | 1,066,930 | | | | 2,183 | | | | 1,905 | | | | 15 | |
| | | | | | | | | | | | | | | | | | | | | | | | |
| | | Comgás | | | Rumo | |
| | | December 31,
2018 | | | December 31,
2017 | | | December 31,
2016 | | | December 31,
2018 | | | December 31,
2017 | | | December 31,
2016 | |
Net cash generated by (used in) operating activities | | | 1,573,171 | | | | 1,637,103 | | | | 2,087,724 | | | | 166,085 | | | | (529,337 | ) | | | 558,205 | |
Net cash generated by (used in) investing activities | | | (1,121,605 | ) | | | (634,776 | ) | | | (637,013 | ) | | | 32,164 | | | | (1,434,807 | ) | | | (761,601 | ) |
Net cash provided by (used in) financing activities | | | (1,576,470 | ) | | | (1,383,142 | ) | | | (1,310,018 | ) | | | (198,584 | ) | | | 1,962,035 | | | | 202,912 | |
| | | | | | | | | | | | | | | | | | | | | | | | |
Increase (decrease) in cash and cash equivalents | | | (1,124,904 | ) | | | (380,815 | ) | | | 140,693 | | | | (335 | ) | | | (2,109 | ) | | | (484 | ) |
Cash and cash equivalents at the beginning of year | | | 1,727,520 | | | | 2,108,336 | | | | 1,967,643 | | | | 930 | | | | 3,039 | | | | 3,523 | |
| | | | | | | | | | | | | | | | | | | | | | | | |
Effect of exchange rate fluctuations on cash held | | | — | | | | — | | | | — | | | | — | | | | — | | | | — | |
| | | | | | | | | | | | | | | | | | | | | | | | |
Cash and cash equivalents at the end of year | | | 602,616 | | | | 1,727,521 | | | | 2,108,336 | | | | 595 | | | | 930 | | | | 3,039 | |
| | | | | | | | | | | | | | | | | | | | | | | | |
F-51
Cosan Limited
Notes to the consolidated financial statements
(In thousands of Brazilian Reais—R$ unless otherwise stated)
| 9 | Investments in joint ventures |
Accounting policy
The Company entered into an agreement to form two joint ventures, accounting for 50% of the economic benefits of the companies.
Cosan holds joint-control of Raízen Combustíveis and Raízen Energia by virtue of its 50% equity interest in both companies and the requirement of unanimous consent of all shareholders on the decisions related to significant activities. Investments were classified as jointly-owned subsidiaries and, therefore, the equity method is used for all periods presented in these consolidated financial statements.
The agreements of joint-control require the unanimous consent of all parties for all relevant activities. The two partners have direct rights over the assets of the company and are jointly and severally accountable for the liabilities incurred by the partnership.
Changes to investments in joint ventures were as follows:
| | | | | | | | | | | | |
| | | Raízen
Combustível | | | Raízen
Combustível | | | Total | |
Shares issued by the joint venture | | | 1,661,418,472 | | | | 7,243,283,198 | | | | | |
Shares held by Cosan | | | 830,709,236 | | | | 3,621,641,599 | | | | | |
Cosan ownership interest | | | 50 | % | | | 50 | % | | | | |
| | | | | | | | | | | | |
At January 1, 2017 | | | 3,190,821 | | | | 5,315,574 | | | | 8,506,395 | |
Interest in earnings of joint ventures | | | 694,015 | | | | 291,075 | | | | 985,090 | |
Other comprehensive (losses) income | | | (5,349 | ) | | | 209,412 | | | | 204,063 | |
Interest on capital | | | (42,000 | ) | | | — | | | | (42,000 | ) |
Dividends | | | (651,500 | ) | | | (554,249 | ) | | | (1,205,749 | ) |
| | | | | | | | | | | | |
At December 31, 2017 | | | 3,185,987 | | | | 5,261,812 | | | | 8,447,799 | |
Interest in earnings of joint ventures | | | 693,226 | | | | 253,056 | | | | 946,282 | |
Other comprehensive (losses) income | | | 8,358 | | | | (54,881 | ) | | | (46,523 | ) |
Interest on capital | | | (88,200 | ) | | | — | | | | (88,200 | ) |
Changes in the accounting polices adopted by the Company | | | (1,258 | ) | | | (82 | ) | | | (1,340 | ) |
Dividends | | | (693,500 | ) | | | (486,611 | ) | | | (1,180,111 | ) |
| | | | | | | | | | | | |
At December 31, 2018 | | | 3,104,613 | | | | 4,973,294 | | | | 8,077,907 | |
| | | | | | | | | | | | |
The statement of financial position and statement of profit or loss of the joint ventures are disclosed in Note 4, Segments.
Pursuant to the terms of the Raízen Joint Venture—Framework Agreement, Cosan is responsible for certain legal proceedings that existed prior to the formation of Raízen, net of judicial deposits as of April 1, 2011, as well as tax installments under the tax amnesty and refinancing program (Programa de Refinanciamento), or “REFIS,” recorded in “Other taxes payable.” Additionally, Cosan granted access to Raízen a credit line(stand-by facility) in the amount of U.S.$ 350,000 thousand, which was unused at December 31, 2018.
F-52
Cosan Limited
Notes to the consolidated financial statements
(In thousands of Brazilian Reais—R$ unless otherwise stated)
| 10 | Property, plant and equipment, intangible assets and goodwill |
Accounting policy
The recoverable amount is determined based on calculations of the value in use, using the discounted cash flow determined by Management based on budgets that take into account the assumptions related to each business, using information available in the market and previous performance. Discounted cash flows were drawn up over aten-year period (except for Logistic and Comgás that consider the remaining period of their concession contracts) and carried forward in perpetuity without considering a real growth rate (except for Moove that consider growth rate of the final value of 3.75% from 2028). Management uses periods greater than five years in the preparation of discounted cash flows considering that reflects the estimated time of use of the asset and business groups.
The Company performs annually a review of impairment indicators for intangible assets with defined useful lives and property, plant and equipment. Also, an impairment test is undertaken for goodwill and intangible assets with indefinite useful lives. Impairment exists when the carrying value of an asset or cash generating unit exceeds its recoverable amount, which is the higher of its fair value less costs to sell and its value in use.
Assumptions used in discounted cash flow projections—estimates of future business performance, cash generation, long term growth and discount rates are used in our assessment of impairment of assets at the statement of financial position date. No reasonably plausible changes in a key assumption would cause impairment. The key assumptions used to determine the recoverable amount of the different cash generating units to which goodwill is allocated as explained in the Note 10.2.
| 10.1 | Property, plant and equipment |
Accounting policy
| | a) | Recognition and measurement |
Items of property, plant and equipment are measured at cost less accumulated depreciation and any accumulated impairment losses.
Subsequent expenditure is capitalized only when it is probable that the future economic benefits associated with the expenditure will flow to the Company. Ongoing repairs and maintenance are expensed as incurred.
Items of property, plant and equipment are depreciated from the date they are available for use or, in respect of constructed assets, from the date that the asset is completed and ready for use.
Depreciation is calculated on the carrying value of property, plant and equipment less their estimated residual values using the straight-line basis over their estimated useful lives, recognized in profit or loss, unless it is capitalized as part of the cost of another asset. Land is not depreciated.
Depreciation is calculated on a straight-line basis over the estimated useful lives of the assets as follows:
| | |
Buildings and improvements | | 4% to 5% |
Machinery, equipment and facilities | | 8% to 11% |
Airplanes, vessels and vehicles | | 10% to 20% |
Railcars | | 2.9% to 6% |
Locomotives | | 3.33% to 8% |
Permanent railways | | 4% |
Furniture and fixtures | | 10% to 15% |
Computer equipment | | 20% |
The residual values, useful lives and methods of depreciation of property, plant and equipment are reviewed annually and adjusted prospectively. During the fiscal year ended December 31, 2017, the subsidiary Rumo conducted a useful life review of a group of approximately 200 locomotives allocated to the logistics segment. Locomotives comprise individual components with different useful lives, and the review resulted in a reduction of useful lives of some components to reflect the time that the subsidiary Rumo intends to use those components through its economic life. The new useful life was applied starting from January 1st, 2018.
F-53
Cosan Limited
Notes to the consolidated financial statements
(In thousands of Brazilian Reais—R$ unless otherwise stated)
| | a) | Reconciliation of carrying amount |
| | | | | | | | | | | | | | | | | | | | | | | | | | | | |
| | | Consolidated | |
| | | Land,
buildings and
improvements | | | Machinery,
equipment
and
facilities | | | Railcars and
locomotives(ii) | | | Permanent
railways(i) | | | Construction
in progress | | | Other | | | Total | |
Cost | | | | | | | | | | | | | | | | | | | | | | | | | | | | |
At January 1, 2017 | | | 1,043,437 | | | | 716,310 | | | | 5,270,469 | | | | 4,474,856 | | | | 708,580 | | | | 326,361 | | | | 12,540,013 | |
Additions | | | 38 | | | | 5,911 | | | | 14,835 | | | | 3,729 | | | | 2,171,507 | | | | 1,296 | | | | 2,197,316 | |
Business combinations(iii) | | | — | | | | 2,867 | | | | — | | | | — | | | | — | | | | 17,736 | | | | 20,603 | |
Disposals | | | (2,239 | ) | | | (106,088 | ) | | | (125,206 | ) | | | (3,695 | ) | | | 25,350 | | | | (10,066 | ) | | | (221,944 | ) |
Transfers | | | 28,859 | | | | 255,398 | | | | 935,497 | | | | 661,226 | | | | (1,919,335 | ) | | | 5,249 | | | | (33,106 | ) |
| | | | | | | | | | | | | | | | | | | | | | | | | | | | |
At December 31, 2017 | | | 1,070,095 | | | | 874,398 | | | | 6,095,595 | | | | 5,136,116 | | | | 986,102 | | | | 340,576 | | | | 14,502,882 | |
Additions | | | 565 | | | | 8,702 | | | | 42,031 | | | | — | | | | 2,181,586 | | | | 9,662 | | | | 2,242,546 | |
Business combinations(iii) | | | — | | | | — | | | | — | | | | — | | | | — | | | | 5,699 | | | | 5,699 | |
Disposals | | | (4,183 | ) | | | (25,421 | ) | | | (189,143 | ) | | | — | | | | (1,538 | ) | | | (43,155 | ) | | | (263,440 | ) |
Transfers | | | 155,699 | | | | 173,251 | | | | 560,265 | | | | 991,023 | | | | (2,114,281 | ) | | | 78,624 | | | | (155,419 | ) |
Effect of exchange rate fluctuations | | | 21,251 | | | | 14,640 | | | | — | | | | — | | | | 2,259 | | | | 9,361 | | | | 47,511 | |
| | | | | | | | | | | | | | | | | | | | | | | | | | | | |
At December 31, 2018 | | | 1,243,427 | | | | 1,045,570 | | | | 6,508,748 | | | | 6,127,139 | | | | 1,054,128 | | | | 400,767 | | | | 16,379,779 | |
| | | | | | | | | | | | | | | | | | | | | | | | | | | | |
Depreciation | | | | | | | | | | | | | | | | | | | | | | | | | | | | |
At January 1, 2017 | | | (255,893 | ) | | | (287,745 | ) | | | (742,297 | ) | | | (542,228 | ) | | | — | | | | 14,598 | | | | (1,813,565 | ) |
Additions | | | (41,343 | ) | | | (135,580 | ) | | | (643,683 | ) | | | (395,677 | ) | | | — | | | | (16,700 | ) | | | (1,232,983 | ) |
Disposals | | | 234 | | | | 93,592 | | | | 99,753 | | | | 749 | | | | — | | | | 5,066 | | | | 199,394 | |
Transfers | | | (497 | ) | | | (14,413 | ) | | | 40,576 | | | | (12,621 | ) | | | — | | | | 12,802 | | | | 25,847 | |
| | | | | | | | | | | | | | | | | | | | | | | | | | | | |
At December 31, 2017 | | | (297,499 | ) | | | (344,146 | ) | | | (1,245,651 | ) | | | (949,777 | ) | | | — | | | | 15,766 | | | | (2,821,307 | ) |
Additions | | | (52,925 | ) | | | (116,002 | ) | | | (655,745 | ) | | | (467,634 | ) | | | — | | | | (28,423 | ) | | | (1,320,729 | ) |
Disposals | | | 3,518 | | | | 25,054 | | | | 186,557 | | | | — | | | | — | | | | 37,458 | | | | 252,587 | |
Transfers | | | (1,058 | ) | | | 2,609 | | | | 4,933 | | | | 33,343 | | | | — | | | | (20,905 | ) | | | 18,922 | |
Impairment | | | — | | | | — | | | | (33,808 | ) | | | (22,896 | ) | | | (10,842 | ) | | | (4,186 | ) | | | (71,732 | ) |
Effect of exchange rate fluctuations | | | (3,197 | ) | | | (10,724 | ) | | | — | | | | — | | | | — | | | | (5,777 | ) | | | (19,698 | ) |
| | | | | | | | | | | | | | | | | | | | | | | | | | | | |
At December 31, 2018 | | | (351,161 | ) | | | (443,209 | ) | | | (1,743,714 | ) | | | (1,406,964 | ) | | | (10,842 | ) | | | (6,067 | ) | | | (3,961,957 | ) |
| | | | | | | | | | | | | | | | | | | | | | | | | | | | |
At December 31, 2017 | | | 772,596 | | | | 530,252 | | | | 4,849,944 | | | | 4,186,339 | | | | 986,102 | | | | 356,342 | | | | 11,681,575 | |
| | | | | | | | | | | | | | | | | | | | | | | | | | | | |
At December 31, 2018 | | | 892,266 | | | | 602,361 | | | | 4,765,034 | | | | 4,720,175 | | | | 1,043,286 | | | | 394,700 | | | | 12,417,822 | |
| | | | | | | | | | | | | | | | | | | | | | | | | | | | |
| i. | Leasehold improvements and finance leases included. |
| ii. | On December 31, 2018, wagons and locomotives in the amount of R$ 745,203 (R$ 743,203 on December 31, 2017) were placed on bail to guarantee bank loans (Note 5.5). |
| iii. | Property, plant and equipment acquired on the acquisition of the full control of the companies as detailed in Note 1. |
F-54
Cosan Limited
Notes to the consolidated financial statements
(In thousands of Brazilian Reais—R$ unless otherwise stated)
| 10.2 | Intangible assets and goodwill |
Accounting policy
Goodwill is initially recognized based on the accounting policy for business combinations (see Note 1). Goodwill is measured at cost less accumulated impairment losses.
Goodwill acquired in a business combination is allocated to the Company’s CGUs, or groups of CGUs, that are expected to benefit from the synergies of the combination.
| | b) | Concession rights agreement |
The subsidiary Comgás has a public concession agreement for a gas distribution service in which the Concession Authority controls what services will be provided and the price, as well it holds a significant participation in the infrastructure at the end of the concession. This concession agreement represents the right to charge users for gas supply during the term of the agreement. Accordingly, the Company recognizes this right as an intangible asset.
The intangible asset comprises: (i) the concession right recognized upon the business combination of Comgás, which is being amortized over the concession period on a straight line basis, considering the extension of the distribution services for another 20 years; and (ii) the acquired or constructed assets underlying the concession necessary for the distribution of gas, which is being depreciated to match the period over which the future economic benefits of the asset are expected to accrue to the Company, or the final term of the concession, whatever occurs first. This period reflects the economic useful lives of each of the underlying assets that comprise the concession. This economic useful life is also used by the regulator, The Natural Gas Agency of the State of São Paulo, to determine the basis for measuring the tariff for rendering the services under the concession.
Accordingly with IFRIC 12 and IFRS 15, concession infrastructure assets of the Comgás during the construction period, previously recorded as intangible in progress, must be classified as contract assets (note 3.3).
The amortization of intangible assets reflects the pattern expected for the utilization of the future economic benefits by the Company, which corresponds to the useful lives of the assets comprising the infrastructure consonant to the São Paulo State Sanitation and Energy Regulatory Agency (“ARSESP”) provisions.
The amortization of the intangible assets is discontinued when the related asset is fully used or written off, and no longer is included in the calculation basis of the tariff for the rendering of the concession services, whichever occurs first.
Costs incurred on development of gas systems for new clients (including pipelines, valves, and general equipment) are recognized as intangible assets and amortized over the contract period.
| | d) | Other intangible assets |
Other intangible assets that are acquired by the Company and have a finite life are measured at cost less accumulated amortization and any accumulated impairment losses.
Subsequent expenditures are capitalized only when it increases the future economic benefits embodied in the specific asset to which it relates. All other expenditures are recognized in profit or loss as incurred.
F-55
Cosan Limited
Notes to the consolidated financial statements
(In thousands of Brazilian Reais—R$ unless otherwise stated)
Except for goodwill, intangible assets are amortized on a straight-line basis over their estimated useful lives, from the date that they are available for use or acquired.
Amortization methods, useful lives and residual values are reviewed at each reporting date and adjusted if appropriate.
Development costs for future products and other internally generated intangible assets are capitalized at cost, provided manufacture of the products is likely to bring the Cosan an economic benefit. If the criteria for recognition as assets are not met, the expenses are recognized in the income statement in the year in which they are incurred.
Capitalized development costs include all direct and indirect costs that are directly attributable to the development process. The costs are amortized using the straight-line method from the start of production over the expected life cycle of the models developed.
Amortization recognized during the year is allocated to the relevant functions in the income statement.
| | | | | | | | | | | | | | | | | | | | | | | | | | | | |
| | | Consolidated | |
| | | Goodwill | | | Concession
rights | | | Operating
license | | | Trademarks | | | Customer
relationships | | | Other | | | Total | |
Cost | | | | | | | | | | | | | | | | | | | | | | | | | | | | |
At January 1, 2017 | | | 715,259 | | | | 16,912,506 | | | | 435,624 | | | | 252,474 | | | | 946,824 | | | | 376,669 | | | | 19,639,356 | |
Additions | | | — | | | | 361,946 | | | | — | | | | — | | | | 65,813 | | | | 47,433 | | | | 475,192 | |
Business combinations(i) | | | 136,626 | | | | — | | | | — | | | | — | | | | — | | | | (4,221 | ) | | | 132,405 | |
Disposals | | | — | | | | (182,339 | ) | | | — | | | | — | | | | (11,554 | ) | | | (2,232 | ) | | | (196,125 | ) |
Transfers | | | — | | | | 341,154 | | | | — | | | | — | | | | (11,696 | ) | | | 9,299 | | | | 338,757 | |
| | | | | | | | | | | | | | | | | | | | | | | | | | | | |
At December 31, 2017 | | | 851,885 | | | | 17,433,267 | | | | 435,624 | | | | 252,474 | | | | 989,387 | | | | 426,948 | | | | 20,389,585 | |
Additions | | | — | | | | 412,053 | | | | — | | | | — | | | | 77,931 | | | | 76,642 | | | | 566,626 | |
Business combinations(i) | | | (6,878 | ) | | | — | | | | — | | | | — | | | | 136,626 | | | | 32,936 | | | | 162,684 | |
Disposals | | | — | | | | (131,263 | ) | | | — | | | | (228,270 | ) | | | (402,266 | ) | | | (66,808 | ) | | | (828,607 | ) |
Transfers | | | — | | | | 14,102 | | | | — | | | | — | | | | (74,632 | ) | | | 11,049 | | | | (49,481 | ) |
Transfer - contract assets - in progress | | | — | | | | 435,477 | | | | — | | | | — | | | | — | | | | — | | | | 435,477 | |
Adoption of IFRS 15 (Note 3.3) | | | — | | | | (653,332 | ) | | | — | | | | — | | | | — | | | | — | | | | (653,332 | ) |
Effect of exchange rate fluctuations | | | 38,227 | | | | — | | | | — | | | | 13,673 | | | | 15,817 | | | | 11,002 | | | | 78,719 | |
| | | | | | | | | | | | | | | | | | | | | | | | | | | | |
At December 31, 2018 | | | 883,234 | | | | 17,510,304 | | | | 435,624 | | | | 37,877 | | | | 742,863 | | | | 491,769 | | | | 20,101,671 | |
| | | | | | | | | | | | | | | | | | | | | | | | | | | | |
Depreciation | | | | | | | | | | | | | | | | | | | | | | | | | | | | |
At January 1, 2017 | | | — | | | | (1,319,980 | ) | | | (200,876 | ) | | | (182,616 | ) | | | (668,695 | ) | | | (157,750 | ) | | | (2,529,917 | ) |
Additions | | | — | | | | (490,025 | ) | | | (11,740 | ) | | | (22,827 | ) | | | (127,584 | ) | | | (52,266 | ) | | | (704,442 | ) |
Disposals | | | — | | | | 143,331 | | | | — | | | | — | | | | 8,132 | | | | 4,218 | | | | 155,681 | |
Transfers | | | — | | | | (337,983 | ) | | | — | | | | — | | | | 721 | | | | (35 | ) | | | (337,297 | ) |
| | | | | | | | | | | | | | | | | | | | | | | | | | | | |
At December 31, 2017 | | | — | | | | (2,004,657 | ) | | | (212,616 | ) | | | (205,443 | ) | | | (787,426 | ) | | | (205,833 | ) | | | (3,415,975 | ) |
Additions | | | — | | | | (472,939 | ) | | | (11,740 | ) | | | (22,827 | ) | | | (105,773 | ) | | | (62,285 | ) | | | (675,564 | ) |
Disposals | | | — | | | | 94,133 | | | | — | | | | 228,270 | | | | 400,679 | | | | 65,971 | | | | 789,053 | |
Transfers | | | — | | | | (360 | ) | | | — | | | | — | | | | 179,636 | | | | 397 | | | | 179,673 | |
Impairment | | | — | | | | — | | | | — | | | | — | | | | — | | | | (750 | ) | | | (750 | ) |
Effect of exchange rate fluctuations | | | — | | | | — | | | | — | | | | — | | | | (1,735 | ) | | | (3,837 | ) | | | (5,572 | ) |
| | | | | | | | | | | | | | | | | | | | | | | | | | | | |
At December 31, 2018 | | | — | | | | (2,383,823 | ) | | | (224,356 | ) | | | — | | | | (314,619 | ) | | | (206,337 | ) | | | (3,129,135 | ) |
| | | | | | | | | | | | | | | | | | | | | | | | | | | | |
At December 31, 2017 | | | 851,885 | | | | 15,428,610 | | | | 223,008 | | | | 47,031 | | | | 201,961 | | | | 221,115 | | | | 16,973,610 | |
| | | | | | | | | | | | | | | | | | | | | | | | | | | | |
At December 31, 2018 | | | 883,234 | | | | 15,126,481 | | | | 211,268 | | | | 37,877 | | | | 428,244 | | | | 285,432 | | | | 16,972,536 | |
| | | | | | | | | | | | | | | | | | | | | | | | | | | | |
| (i) | The goodwill of the acquisitions, according to Note 1, is composed by: a) Stanbridge from R$ 31,726; b) TTA from R$ 23,618; c) LubrigrupoII from R$ 6,856; and d) Metrolube from R$ 67,548. Additionally, goodwill from the acquisition of Stanbridge (preliminarily allocated at the acquisition date in November 2017) was allocated to Customer relationships in 2018, in the amount of R$ 136,626. |
F-56
Cosan Limited
Notes to the consolidated financial statements
(In thousands of Brazilian Reais—R$ unless otherwise stated)
| | a) | Amortization methods and useful lives |
| | | | | | | | | | |
Intangible assets (excluding goodwill) | | Annual rate of
amortization—% | | December 31,
2018 | | | December 31,
2017 | |
Comgás(i) | | Concession term | | | 8,225,270 | | | | 8,197,514 | |
Concession rights—Rumo(ii) | | Concession term | | | 7,119,068 | | | | 7,231,096 | |
| | | | | | | | | | |
| | | | | 15,344,338 | | | | 15,428,610 | |
Operating license for port terminal(iii) | | 4.00% | | | 211,268 | | | | 223,008 | |
Trademarks: | | | | | | | | | | |
Mobil | | 10.00% | | | — | | | | 22,827 | |
Comma | | — | | | 37,877 | | | | 24,204 | |
| | | | | | | | | | |
| | | | | 37,877 | | | | 47,031 | |
Customers relationship: | | | | | | | | | | |
Comgás | | 20.00% | | | 149,890 | | | | 174,459 | |
Moove | | 6.00% | | | 278,354 | | | | 27,502 | |
| | | | | | | | | | |
| | | | | 428,244 | | | | 201,961 | |
Other | | | | | | | | | | |
Software license | | 20.00% | | | 168,892 | | | | 167,520 | |
Other | | | | | 116,538 | | | | 53,595 | |
| | | | | | | | | | |
| | | | | 285,430 | | | | 221,115 | |
Total | | | | | 16,307,157 | | | | 16,121,725 | |
| | | | | | | | | | |
| (i) | Refers to the intangible asset for the public gas distribution service concession, which represents the right to charge users for the supply of gas, comprised of: (i) the concession rights recognized in the business combination and (ii) concession assets; |
| (ii) | Refers to the concession right agreement of Rumo Malha Norte S.A., which will be amortized until the end of the concession in 2079; |
| (iii) | Port operating license and customer relationships of Rumo, from the business combinations. |
| | b) | Impairment testing of cash-generating units (“CGU”) goodwill |
The Subsidiary annually tests the recoverable amounts of goodwill arising from business combination operations. Property, plant and equipment and defined-intangible assets that are subject to depreciation and amortization are tested for impairment whenever events or changes in circumstances indicate that the carrying amount may not be recoverable.
For the purposes of impairment analysis, the concession contracts were defined as cash-generating units, each registered in an individual company. The basis for evaluation and annual testing is September 30.
During the year ended December 31, 2018, we did not identify impairment indicators, so that no impairment test was required for fixed assets and intangible assets with a defined useful life, except for the cash generating unit represented by the Rumo Malha Oeste S.A. concession, which shows negative results and low cash generation.
The recoverable amount for the fixed assets of this cash-generating unit was determined using the discounted cash flow methodology of the cash-generating unit.
F-57
Cosan Limited
Notes to the consolidated financial statements
(In thousands of Brazilian Reais—R$ unless otherwise stated)
The main assumptions used were (i) EBITDA projected for the cash generating unit, without volume growth transported, within the remaining period of the concession, and (ii) the discount rate (WACC) of 8.28% per annum, before taxes. The calculation resulted in a recoverable amount of R$ 82,995, compared to a book value of R$ 155,443, which includes property, plant and equipment and intangible assets. A provision for impairment of R$ 72,448 was recorded for this cash-generating unit, allocated in proportion to the property, plant and equipment, as a contra-entry to “Other income (expenses) net,” note 19.
The balance of goodwill recorded by the Company is associated with the port loading operation and terminals, so that this cash-generating unit needs to be tested annually.
The recoverable amount of this cash-generating unit was determined by the net sales value of the unit, using the technique of EBITDA multiples, a technique considered level 3 in the hierarchy of fair value estimates.
The determination of the recoverability of the assets depends on certain key assumptions as described above that are influenced by the market, technological, and economic conditions in force at the time this recovery is tested and, therefore, it is not possible to determine whether new losses by recovery will occur in the future and, if they occur, whether these would be material.
The combined carrying amounts of goodwill allocated to each cash-generating unit are as follows:
| | | | | | | | |
| | | December 31,
2018 | | | December 31,
2017 | |
Moove cash generating unit | | | 782,740 | | | | 751,391 | |
Cosan cash-generating unit other business | | | 43 | | | | 43 | |
| | | | | | | | |
Total goodwill | | | 782,783 | | | | 751,434 | |
| | | | | | | | |
The recoverable amount is determined based on calculations of the value in use, using the discounted cash flow determined by Management based on budgets that take into account the assumptions related to each business, using information available in the market and previous performance. Discounted cash flows were drawn up over aten-year period and carried forward in perpetuity without considering a real growth rate. Management understands the use of periods greater than five years in the preparation of discounted cash flows as it reflects the estimated time of use of the asset and business groups.
The main assumptions used mainly consider the expectation of growth of the operations based on the Gross Domestic Product segmented by country, as well as considering the levels of average growth experienced in the last years and other macroeconomic aspects, as well as expectation of the price of sales of commodities, using discount rates that reflect specific business-related risks.
All these future cash flows were discounted at a rate of 9.3% (weighted-average cost of capital) and a growth rate of the final value of 3.75% from 2028 reflecting specific risks related to the relevant assets in its cash generating unit.
An increase of 6.3 percentage points in the discount rate should change so that the estimated recoverable amount is equal to the book value. The U.S. dollar has an impact on projections and, therefore, a fluctuation of in exchange rate would have an effect on the estimate.
As of December 31, 2018, no expense for impairment of assets and goodwill was recognized. The determination of the recoverability of the assets depends on certain key assumptions as described above that are influenced by the market, technological and economic conditions in place at the time that such recovery is tested, and therefore, it is not possible to determine whether new reduction losses of recovery will occur in the future and, if they occur, whether these would be material.
F-58
Cosan Limited
Notes to the consolidated financial statements
(In thousands of Brazilian Reais—R$ unless otherwise stated)
Accounting policy
Concessions represent arrangements between a public sector grantor and the subsidiary Rumo to operate a rail network consisting of four concessions that extend over approximately 12,000 kilometers of railway lines. Revenue from providing the service is received directly from the customers, through to logistic service.
The concession right generally means that the Rumo has an exclusive right to provide the service under the concession for a given period, after which the infrastructure assigned to the concession and required to provide the service is returned to the concession grantor, generally for no consideration. The concession arrangement must provide for the management or operation of the infrastructure. Another common feature is the existence of obligations to acquire or construct all the items required to provide the concession service over the concession term.
These concessions right is initially recognized with an intangible at cost (see Note 10.2), with cost understood to be the fair value of the service provided plus other direct costs that are directly attributable to the operation. They are then amortized over the duration of the concession.
| | | | | | | | | | | | | | | | |
| | | December 31, 2018 | | | December 31,
2017 | |
| | | Leases | | | Concessions | | | Total | | | Total | |
Payables | | | | | | | | | | | | | | | | |
Rumo Malha Sul | | | 31,546 | | | | 29,215 | | | | 60,761 | | | | 65,550 | |
Rumo Malha Paulista | | | 26,316 | | | | 19,576 | | | | 45,892 | | | | 48,139 | |
| | | | | | | | | | | | | | | | |
| | | 57,862 | | | | 48,791 | | | | 106,653 | | | | 113,689 | |
Court discussion | | | | | | | | | | | | | | | | |
Rumo Malha Paulista | | | 1,695,770 | | | | — | | | | 1,695,770 | | | | 1,535,470 | |
Rumo Malha Oeste | | | 1,324,853 | | | | 81,292 | | | | 1,406,145 | | | | 1,284,175 | |
| | | | | | | | | | | | | | | | |
| | | 3,020,623 | | | | 81,292 | | | | 3,101,915 | | | | 2,819,645 | |
Total | | | 3,078,485 | | | | 130,083 | | | | 3,208,568 | | | | 2,933,334 | |
| | | | | | | | | | | | | | | | |
Current | | | | | | | | | | | 28,797 | | | | 27,413 | |
| | | | | | | | | | | | | | | | |
Non-current | | | | | | | | | | | 3,179,771 | | | | 2,905,921 | |
| | | | | | | | | | | | | | | | |
Court Discussion:
The Company is challenging in court the economic and financial unbalance of certain leases and concession contracts.
In April 2004, Rumo Malha Paulista S.A. (“Rumo Malha Paulista”) filed an interlocutory injunction and subsequently Declaratory Action before the 21st Federal Court of Rio de Janeiro questioning the economic and financial unbalance of the Lease and Concession Agreements, due to the high disbursement incurred by the Company for the payment of labor judicial proceedings and other expenses involved, which are the responsibility of Rede Ferroviária Federal S.A., as provided in the bidding documents.
Rumo Malha Paulista required an injunction to suspend payment of installments due of the concession and lease agreements and to offset the credit balance resulting from labor amounts paid by Rumo with the amount charged by the Brazilian Government. In April 2005, the injunction was granted, suspending the enforceability of installments for 90 days by determining the completion of expertise. In July 2005, the suspension was extended for another 90 days. In September 2005, the injunction was overturned by the Federal Court of Rio de Janeiro. In January 2006, the suspension of payment of installments was granted, by means of judicial deposit. The amount related to the lease payment was deposited in court until October 2007, when the Company obtained a court order to replace the judicial deposits with a bank guarantee. In October 2015, a decision was handed down that partially upheld the action recognizing the occurrence of economic and financial balance of the agreements, allowing the Company to perform the part of compensation of the amounts claimed in the match against presented debt. Nevertheless, the Company believes that all amounts discussed shall be offset against payables based on clauses 7 and 10 of the bidding documents.
F-59
Cosan Limited
Notes to the consolidated financial statements
(In thousands of Brazilian Reais—R$ unless otherwise stated)
Management, supported by the opinion of its legal counsel, assesses the chances of success as probable, but the financial liability remains recognized as it is a contractual obligation not yet discharged and still depend on offsetting with the Company’s reimbursement rights.
Rumo Malha Oeste S.A. (“Rumo Malha Oeste”) also claiming the reestablishment of the economic-financial balance, lost by the cancellation of transportation contracts at the time of privatization, change in the regulatory environment and conditions set forth in the Privatization Tender—additionally, the growth forecasts that defined the value of the business did not materialize. The lawsuit is filed with the 16th Federal Court of Rio de Janeiro. To proceed with the legal discussion, the Company offered government securities (Treasury Bills—LFT) as an execution guarantee. In March 2008, the Company was authorized to replace the guarantee by a bank guarantee and in May 2008, the Company redeemed the treasury bills. In December 2014, a decision was handed down that upheld the action recognizing the occurrence of economic and financial balance of the contracts, with the amounts involved and certain related aspects still to be determined. In December 2015, the replacements of guarantee letters presented by Rumo were replaced with an insurance policy.
Management, supported by the opinion of its legal counsel, assesses the chances of success as probable, but the financial liability remains recognized as it is a contractual obligation not yet discharged and must still be offset against the company’s right to be reimbursed.
Judicial deposits at December 31, 2018 concerning the above claims totaled:
| | | | | | | | | | |
| | | December 31, 2018 | | December 31, 2017 |
Rumo Paulista | | | | 119,806 | | | | | 119,806 | |
Rumo Oeste | | | | 20,690 | | | | | 20,690 | |
| | | | | | | | | | |
| | | | 140,496 | | | | | 140,496 | |
| | | | | | | | | | |
The judicial deposits are recorded in the “regulatory” group, as described in Note 14.
| | a) | Commitments for the acquisition of assets and regulatory targets |
The balance of this account is considered as an asset or liability in accordance with the chart of accounts of the Regulatory. However, this account is excluded from the financial statements prepared in accordance with accounting practices adopted in Brazil and also IFRS, since the respective balance is not recorded as an asset or a liability, since its realization or settlement depends on future consumption by different consumers of the subsidiary Comgás. Therefore, the balances presented below are not recognized in the financial statements.
Regulatory assets (liabilities):
| | | | | | | | |
| | | December 31,
2018 | | | December 31,
2017 | |
Cost of gas to be recovered/(transferred) | | | 504,175 | | | | (174,090 | ) |
Credits of taxes to be recovered/(transferred) | | | (252,816 | ) | | | (46,807 | ) |
| | | | | | | | |
| | | 251,359 | | | | (220,897 | ) |
Expense not recognized in the statement of income before income tax and social contribution | | | 472,256 | | | | 193,114 | |
| | | | | | | | |
Regulatory assets (liabilities) | | | 672,810 | | | | 243,722 | |
Regulatory assets (liabilities) tax | | | (127,815 | ) | | | (12,222 | ) |
| | | | | | | | |
| | | 544,995 | | | | 231,500 | |
Adjustment | | | 3,713 | | | | (26,119 | ) |
Extemporaneous credits | | | (76,452 | ) | | | (12,267 | ) |
| | | | | | | | |
| | | 472,256 | | | | 193,114 | |
| | | | | | | | |
F-60
Cosan Limited
Notes to the consolidated financial statements
(In thousands of Brazilian Reais—R$ unless otherwise stated)
| | b) | Commitments with supply contracts |
Considering the current gas supply contracts, the subsidiary Comgás has a total financial commitment in an estimated present value of R$ 13,525,873, which amount includes the minimum established in contract in both commodity and transportation.
Accounting policy
The Company is subject to different taxes and levies such as municipal, estate and federal taxes, tax on deposits to and withdrawals from bank accounts, turnover taxes, regulatory fees and income taxes, among other, that represent an expense for the Company. It is also subject to other taxes over its activities that generally do not represent an expense.
| | | | | | | | | | |
| | | December 31, 2018 | | December 31, 2017 |
Tax amnesty and refinancing program—REFIS | | | | 216,984 | | | | | 229,745 | |
ICMS—State VAT | | | | 96,793 | | | | | 121,550 | |
COFINS—Revenue tax | | | | 47,017 | | | | | 146,641 | |
PIS—Revenue tax | | | | 7,654 | | | | | 31,563 | |
ISS—Service tax | | | | 4,666 | | | | | 7,697 | |
IOF—Financial tax | | | | 1,318 | | | | | 4,494 | |
INSS—Social security | | | | 7,337 | | | | | 36,601 | |
Other | | | | 18,417 | | | | | 2,224 | |
| | | | | | | | | | |
| | | | 400,186 | | | | | 580,515 | |
| | | | | | | | | | |
Current | | | | 245,587 | | | | | 418,878 | |
| | | | | | | | | | |
Non-Current | | | | 154,599 | | | | | 161,637 | |
| | | | | | | | | | |
The amounts due onnon-current liabilities present the following maturity schedule:
| | | | | | | | | | |
| | | Consolidated |
| | | December 31, 2018 | | December 31, 2017 |
13 to 24 months | | | | 14,658 | | | | | 19,748 | |
25 to 36 months | | | | 11,532 | | | | | 16,038 | |
37 to 48 months | | | | 11,214 | | | | | 11,204 | |
49 to 60 months | | | | 11,214 | | | | | 11,021 | |
61 to 72 months | | | | 11,175 | | | | | 11,021 | |
73 to 84 months | | | | 8,301 | | | | | 10,580 | |
85 to 96 months | | | | 8,301 | | | | | 8,377 | |
Thereafter | | | | 78,204 | | | | | 73,648 | |
| | | | | | | | | | |
| | | | 154,599 | | | | | 161,637 | |
| | | | | | | | | | |
| 13 | Income tax and social contribution |
Accounting policy
The income taxes rate is 34%. Current tax and deferred tax are recognized in profit or loss except for some transactions that are recognized directly in equity or in other comprehensive income.
Current tax is the expected tax payable or receivable on the taxable income or loss for the year, using tax rates enacted or substantively enacted at the reporting date, and any adjustment to tax payable in respect of previous years.
F-61
Cosan Limited
Notes to the consolidated financial statements
(In thousands of Brazilian Reais—R$ unless otherwise stated)
Deferred tax is recognized in respect of temporary differences between the carrying amounts of assets and liabilities for financial reporting purposes and the amounts used for taxation purposes and tax loss.
The measurement of deferred tax reflects the way the Company expects, at the end of the reporting period, to recover or settle the carrying amount of its assets and liabilities.
Deferred tax is measured at the tax rates that are expected to be applied to temporary differences when they reverse, using tax rates enacted or substantively enacted at the reporting date.
Deferred tax assets and liabilities are offset if there is a legally enforceable right to offset current tax liabilities and assets, and they relate to taxes levied by the same tax authority and the same taxable entity.
| | iii. | Recoverability of deferred income tax and social contribution |
In assessing the recoverability of deferred taxes, management considers the projections of future taxable income and the movements of temporary differences. When it is not probable that part or all the taxes will be realized, the tax asset is reversed. There is no deadline for the use of tax loss carryforwards and negative bases, but the use of these accumulated losses of previous years is limited to 30% of annual taxable profits.
In determining the amount of current and deferred tax, the Company considers the impact of uncertain tax positions and whether additional taxes and interest may be due. This assessment relies on estimates and assumptions and may involve a series of judgments about future events. New information may become available that causes the Company to change its judgment regarding the adequacy of existing tax liabilities; such changes to tax liabilities will impact tax expense in the period that such a determination is made.
| | a) | Reconciliation of income and social contribution tax expenses |
| | | | | | | | | | | | | | | |
| | | Consolidated |
| | | December 31, 2018 | | December 31, 2017 | | December 31, 2016 |
Profit before taxes | | | | 2,843,667 | | | | | 1,474,652 | | | | | 555,987 | |
Income tax and social contribution nominal rate (34%) | | | | (966,847 | ) | | | | (501,382 | ) | | | | (189,036 | ) |
Adjustments to determine the effective rate | | | | | | | | | | | | | | | |
Interest in earnings of investees(non-taxable income) | | | | 339,237 | | | | | 340,766 | | | | | 532,335 | |
Differences in tax rates on earnings / losses of overseas companies | | | | (12,423 | ) | | | | (89,070 | ) | | | | (150,233 | ) |
Granted income tax incentive | | | | 48,541 | | | | | 74,416 | | | | | 10,098 | |
Share-based payment transactions | | | | (1,363 | ) | | | | (4,022 | ) | | | | (3,950 | ) |
Interest on shareholders’ equity | | | | (19,777 | ) | | | | (21,495 | ) | | | | (45,573 | ) |
Non-deductible expenses (donations, gifts, etc.) | | | | (14,405 | ) | | | | (52,226 | ) | | | | (28,103 | ) |
Tax losses not recorded(i) | | | | (143,999 | ) | | | | (177,824 | ) | | | | (185,089 | ) |
Goodwill amortization effect | | | | 1,853 | | | | | 1,853 | | | | | 1,853 | |
Tax effects of discounts granted—PERT | | | | 218 | | | | | (4,438 | ) | | | | — | |
Tax loss carryforwards from previous years recorded | | | | — | | | | | (3,554 | ) | | | | — | |
Other | | | | 8,478 | | | | | 8,621 | | | | | (.4,004 | ) |
| | | | | | | | | | | | | | | |
Income tax and social contribution benefit (expense)—current and deferred | | | | (760,487 | ) | | | | (428,355 | ) | | | | (61,702 | ) |
| | | | | | | | | | | | | | | |
Effective rate—% | | | | 26.74 | | | | | 29.05 | | | | | 11.10 | |
| | | | | | | | | | | | | | | |
| (i) | Refers mainly to tax losses not recorded in subsidiaries of Rumo which under current conditions do not attend the requirements of future taxable profits that justify the recognition of the deferred tax assets. In accordance with Brazilian Federal Taxes rules those losses do not expire. |
F-62
Cosan Limited
Notes to the consolidated financial statements
(In thousands of Brazilian Reais—R$ unless otherwise stated)
| | b) | Deferred income tax assets and liabilities |
The tax effects of temporary differences that give rise to significant portions of the Company’s deferred tax assets and liabilities are presented below:
| | | | | | | | |
| | | Consolidated | |
| | | December 31, 2018 | | | December 31, 2017 | |
Assets credit of: | | | | | | | | |
Income tax loss carry forwards | | | 2,190,068 | | | | 2,112,707 | |
Social contribution tax loss carry forwards | | | 801,866 | | | | 772,304 | |
Temporary differences | | | | | | | | |
Foreign exchange—Loans and borrowings | | | 789,220 | | | | 548,568 | |
Legal proceedings provision | | | 396,577 | | | | 365,997 | |
Tax deductible goodwill | | | — | | | | 56,276 | |
Impairment provision | | | 241,083 | | | | 250,236 | |
Provisions for employee benefits | | | 175,178 | | | | 153,434 | |
Allowance for doubtful accounts | | | 30,327 | | | | 25,991 | |
Regulatory asset (liability) | | | 59,597 | | | | 65,318 | |
Impairment of tax credit | | | 74,900 | | | | 61,324 | |
Share-based payment transactions | | | 5,246 | | | | 1,602 | |
Profit sharing | | | 51,601 | | | | 40,195 | |
Interest on preferred shareholders payable in subsidiaries | | | 155,562 | | | | 218,599 | |
Property, plant and equipment—useful life review | | | 277,925 | | | | 160,490 | |
Contractual dispute | | | — | | | | 86,482 | |
Other | | | 276,095 | | | | 316,176 | |
| | | | | | | | |
Deferred taxes—Assets | | | 5,525,245 | | | | 5,235,699 | |
(-) Deferred taxes assets not recognized(i) | | | (2,104,742 | ) | | | (1,961,325 | ) |
Liabilities credit of: | | | | | | | | |
Temporary differences | | | | | | | | |
Business combination—property, plant and equipment | | | 63,574 | | | | 110,149 | |
Tax deductible goodwill | | | (389,679 | ) | | | (351,262 | ) |
Lease | | | (228,055 | ) | | | (277,091 | ) |
Concession contract | | | (6,745 | ) | | | (8,681 | ) |
Unrealized gains on derivatives instruments(ii) | | | (664,841 | ) | | | (115,503 | ) |
Fair value option in loans | | | 57,298 | | | | 23,855 | |
Income on formation of joint ventures | | | (1,135,036 | ) | | | (1,135,036 | ) |
Business combination—Intangible asset | | | (3,725,546 | ) | | | (3,741,522 | ) |
Other | | | 56,201 | | | | (45,513 | ) |
| | | | | | | | |
Total | | | (5,972,829 | ) | | | (5,540,604 | ) |
| | | | | | | | |
Total of deferred taxes recorded | | | (2,552,326 | ) | | | (2,266,230 | ) |
Deferred income tax—Assets | | | 1,540,693 | | | | 1,636,080 | |
| | | | | | | | |
Deferred income tax—Liabilities | | | (4,093,019 | ) | | | (3,902,310 | ) |
| | | | | | | | |
| (i) | Refers mainly to tax losses and temporary differences, in the amount of R$ 1,395,713 and R$ 680,723, respectively, of Rumo Malha Sul and Rumo Malha Oeste that under current conditions do not have predictability of generating taxable income to justify the accounting of assets referred to income tax and social contribution. |
| (ii) | The subsidiary Comgás changed the regime for the taxation of foreign exchange variation of the loans and financing from cash basis to accrual accounting for fiscal year 2018, therefore the deferred taxes on gains of income not realized with derivatives, started to be presented as deferred tax liability. Previously they were offset by the losses of the exchange variation of loans and financing. |
F-63
Cosan Limited
Notes to the consolidated financial statements
(In thousands of Brazilian Reais—R$ unless otherwise stated)
| | c) | Changes in deferred tax |
| | | | |
| | | Consolidated | |
At January 1, 2017 | | | (2,060,563 | ) |
Recorded through income | | | (426,341 | ) |
Property, plant and equipment—useful life review | | | 132,503 | |
Other comprehensive income | | | 8,201 | |
Tax loss carryforwards used to settle other tax installments | | | 3,555 | |
Tax loss carryforwards over change of shareholding interest in subsidiary | | | 60,583 | |
Other(i) | | | 15,832 | |
| | | | |
At December 31, 2017 | | | (2,266,230 | ) |
Recorded through income | | | (295,620 | ) |
Other comprehensive income | | | 27,977 | |
Tax loss carryforwards used to settle other tax installments | | | (2,114 | ) |
Business combination | | | (24,164 | ) |
Other(i) | | | 7,825 | |
| | | | |
At December 31, 2018 | | | (2,552,326 | ) |
| | | | |
| (i) | Exchange variation effect due to the conversion of offshore investments. |
The Company expects to realize the full deferred tax on tax losses and social contribution.
| 14 | Provision for legal proceedings |
Accounting policy
Provisions for legal proceedings are recognized as other expenses when the Company has a present legal or constructive obligation as a result of past events; it is probable that an outflow of resources will be required to settle the obligation; and the amount has been reliably estimated.
The assessment of probability loss includes the available evidence, hierarchy of laws, jurisprudence, the most recent court decisions and relevance in the legal system, as well as the opinion of outside counsel. Provisions are reviewed and adjusted according to circumstances, such as limitation period, conclusions of tax inspections or additional exposures identified based on new matters or court decisions.
Provisions for legal proceedings resulting from business combinations are estimated at fair value in the acquisition time.
The Company had provision for legal proceedings and judicial deposits recorded in the financial position at December 31, 2018 and 2017 in respect of:
| | | | | | | | | | | | | | | | |
| | | Provision for legal
proceedings | | | Judicial deposit | |
| | | December 31,
2018 | | | December 31,
2017 | | | December 31,
2018 | | | December 31,
2017 | |
Tax | | | 534,131 | | | | 501,247 | | | | 460,484 | | | | 371,703 | |
Civil, environmental and regulatory | | | 362,725 | | | | 375,561 | | | | 199,526 | | | | 196,026 | |
Labor | | | 466,312 | | | | 471,349 | | | | 218,797 | | | | 198,378 | |
| | | | | | | | | | | | | | | | |
| | | 1,363,168 | | | | 1,348,157 | | | | 878,807 | | | | 766,107 | |
| | | | | | | | | | | | | | | | |
F-64
Cosan Limited
Notes to the consolidated financial statements
(In thousands of Brazilian Reais—R$ unless otherwise stated)
Changes in provision for legal proceedings:
| | | | | | | | | | | | | | | | |
| | | Tax | | | Civil,
environmental
and
regulatory | | | Labor | | | Total | |
At January 1, 2017 | | | 479,532 | | | | 344,048 | | | | 444,984 | | | | 1,268,564 | |
Provisions | | | 15,821 | | | | 77,535 | | | | 140,445 | | | | 233,801 | |
Settlement / Write-offs | | | (14,047 | ) | | | (45,305 | ) | | | (148,204 | ) | | | (207,556 | ) |
Monetary variation(i) | | | 19,941 | | | | (717 | ) | | | 34,124 | | | | 53,348 | |
At December 31, 2017 | | | 501,247 | | | | 375,561 | | | | 471,349 | | | | 1,348,157 | |
Provisions | | | 20,325 | | | | 48,660 | | | | 97,427 | | | | 166,412 | |
Settlement / Write-offs | | | (22,024 | ) | | | (76,083 | ) | | | (134,336 | ) | | | (232,443 | ) |
Transfers | | | 7,178 | | | | (7,178 | ) | | | — | | | | — | |
Monetary variation(i) | | | 27,405 | | | | 21,765 | | | | 31,872 | | | | 81,042 | |
| | | | | | | | | | | | | | | | |
At December 31, 2018 | | | 534,131 | | | | 362,725 | | | | 466,312 | | | | 1,363,168 | |
| | | | | | | | | | | | | | | | |
| (i) | Includes interest reversal. |
The Company’s debts with legal proceedings are secured by assets, cash deposit, bank guarantee or insurance guarantee.
Tax: The principal tax proceedings for which the risk of loss is probable are described below:
| | | | | | | | |
| | | December 31,
2018 | | | December 31,
2017 | |
Compensation with FINSOCIAL(i) | | | 286,929 | | | | 280,158 | |
INSS—Social security(ii) | | | 80,134 | | | | 65,149 | |
State VAT—ICMS credit(iii) | | | 72,941 | | | | 99,423 | |
IPI—Excise tax credit—NT | | | 28,931 | | | | 678 | |
Federal income taxs | | | 1,589 | | | | 1,521 | |
PIS and COFINS | | | 171 | | | | 2,051 | |
| | | | | | | | |
Other | | | 63,436 | | | | 52,267 | |
| | | | | | | | |
| | | 534,131 | | | | 501,247 | |
| | | | | | | | |
| (i) | During the period from October 2003 to November 2006, the Company, through its subsidiary CLE, offset the FINSOCIAL tax against several other federal taxes, based on a final court decision in September 2003 following a decision that challenged the constitutionality of the FINSOCIAL. The offsetting of these taxes remains under discussion at the administrative level. No judicial deposits were made. |
| (ii) | The amounts that have been provisioned are mainly related to social security contributions levied on company´s earnings, pursuant to Article22-A of the 8.212/91 Law, which are being challenged on the grounds of constitutionality. Judicial deposits have been made monthly for the corresponding amounts. |
| (iii) | The amounts that have been provisioned refer to tax assessments by the tax authorities related to several types of ICMS credits. Amongst them: (a) assessment notice related to ICMS payments for the purchase of raw materials which are considered for “use and consumption”, therefore, not eligible for compensation; (b) assessment, as sole obligor, for withholding of ICMS on tolling agreement from an agricultural partnership with Central Paulista Ltda. Açúcar e Álcool; and (c) assessment notice related to the ICMS offset arising from the fact that the forward presumed profit is bigger than the consummated profit, under tributary substitution regime. |
F-65
Cosan Limited
Notes to the consolidated financial statements
(In thousands of Brazilian Reais—R$ unless otherwise stated)
Civil, regulatory, environmental and other claims: Company and its subsidiaries are parties to a number of civil legal claims related to (i) indemnity for material and moral damages; (ii) termination of different kinds of agreements (iii) public civil claims related to sugarcane stubble burning; and (iv) compliance with terms of conduct adjustment, among other issues:
As of December 31, 2018, R$ 199,526 in judicial deposits were made for civil and environmental claims, and this figure was R$ 196,026 as of December 31, 2017. Company and its subsidiaries are also parties to a number of regulatory legal proceedings related to (i) collection of fines by the Brazilian Transportation Authority (Agência Nacional de Transporte Terrestre), or “ANTT;” (ii) discussions on the tariff ceiling imposed by the ANTT; and (iii) certain other matters.
Labor claims: Cosan and its subsidiaries are also parties to a number of labor claims filed by former employees and service providers challenging, among other matters, the payment of overtime, night shift premiums and risk premiums, the recognition of employment relationships and the reimbursement of discounts from payroll, such as social contribution and trade union charges. Additionally, we are involved in several labor administrative and judicial proceedings such as labor investigations and class actions filed by the labor prosecutor’s office regarding allegednon-compliance with certain labor regulations, including work and safety rules, labor conditions and work environment, and social assistance plans. Moreover, we entered into certain consent orders (Termos de Ajustamento de Conduta) with Brazilian authorities and in the event, we fail to comply with such consent orders, we could be subject to fines.
Theprincipal proceedings for which we deem the risk of loss as possible are described below:
| | | | | | | | |
| | | December 31,
2018 | | | December 31,
2017 | |
Civil | | | 3,258,113 | | | | 2,865,572 | |
Labor | | | 990,913 | | | | 1,061,910 | |
Regulatory | | | 699,301 | | | | 606,133 | |
Environmental | | | 460,911 | | | | 378,462 | |
| | | | | | | | |
| | | 5,409,238 | | | | 4,912,077 | |
| | | | | | | | |
Tax:
| | | | | | | | |
| | | December 31,
2018 | | | December 31,
2017 | |
Federal income taxes(i) | | | 3,372,743 | | | | 2,766,174 | |
ICMS—State VAT(ii) | | | 2,684,248 | | | | 2,652,709 | |
PIS and COFINS—Revenue taxes(iii) | | | 1,408,519 | | | | 838,343 | |
IRRF—Withholding tax(iv) | | | 982,134 | | | | 914,545 | |
Goodwill Rumo(v) | | | 529,788 | | | | 512,120 | |
IPI—Excise tax credit—NT(vi) | | | 490,500 | | | | 523,121 | |
Penalties related to tax positions(vii) | | | 449,039 | | | | 429,249 | |
MP 470—Tax installments(viii) | | | 297,902 | | | | 290,389 | |
Foreign financial operation(ix) | | | 290,220 | | | | 280,414 | |
INSS—Social security and other(x) | | | 260,712 | | | | 556,252 | |
Compensation with IPI—IN 67/98(xi) | | | 134,642 | | | | 132,270 | |
Stock option(xii) | | | 67,991 | | | | 65,776 | |
Financial transactions tax on loan | | | 52,585 | | | | 51,330 | |
Compensation credit award | | | 43,121 | | | | 41,350 | |
Social security contributions | | | 4,121 | | | | 45,985 | |
Other | | | 417,598 | | | | 902,698 | |
| | | | | | | | |
| | | 11,485,863 | | | | 11,002,725 | |
| | | | | | | | |
| (i) | The Company, and its controlled companies, received assessment notices based on the following: |
| | a) | Tax benefits that arose from the deduction of goodwill amortization; |
F-66
Cosan Limited
Notes to the consolidated financial statements
(In thousands of Brazilian Reais—R$ unless otherwise stated)
| | b) | Exchange variation and interest incurred as the tax authorities understand that the corporate transactions carried out were intended to postpone the settlement of debt contracted abroad through the issuance of Perpetual Bonds, in order to reduce Positive result of exchange variation; |
| | c) | The subsidiary Comgás was known of the no recognition of the offsetting procedures made in 2015, using income taxes credits (“IRPJ”); |
| | d) | Isolated fine of 50%, resulting fromnon-homologation of compensations; and |
| | e) | Tax assessments that require IRPJ and social contributions (“CSLL”) related to: (i) Malha Norte Goodwill: Tax assessment notices drawn up for the collection of IRPJ and CSLL, cumulated with interest for late payment and fines and isolated. In the opinion of the Federal Revenue, Rumo Malha Norte would have unduly amortized the goodwill calculated on the acquisition of Brasil Ferrovias S/A and Novoeste Brasil S/A.; (ii) GIF, TPG and Teaçu: tax assessment notices issued for the collection of IRPJ and CSLL, plus a fine and default interest, as well as an isolated fine, for the following reasons: Deduction of the actual profit and the CSLL tax base from the amount corresponding to the amortization in acquisition of interest in Teaçu Armazéns Gerais S/A; Deduction, of the actual profit and the basis of calculation of CSLL, of the amount corresponding to the amortization of the goodwill paid by the companies TPG Participações S.A. and GIF LOG Participações S.A in the acquisition of shares issued by Rumo Logística S/A; and (iii) Labor provisions: In 2009, under the assumption that the Company would have excluded from the calculation of the actual profit and the adjusted basis of calculation of CSLL labor provisions. According to the tax authorities, thewrite-off of labor provisions was made by the Company without the individualization of the proceedings (provisions and reversals), which would impact on the tax calculation. The likelihood of loss is possible, considering that the occurrence of the decay and that the Company complied with all tax rules regarding the addition and exclusion of provisions in the determination of IRPJ and CSLL. |
| (ii) | In summary, these demands relate basically: |
| | • | | Tax assessments issued against the Company for unpaid ICMS andnon-compliance with accessory obligations, in connection with the agricultural and industrial tolling services partnership; |
| | • | | ICMS levied on the remittances for the export of crystallized sugar, which the Company understands are tax exempt. However, the tax authorities classify crystallized sugar as a semi-finished product, which is therefore subject to ICMS; |
| | • | | ICMS withholding rate differences on the sale or purchase the goods, which after the operation, had their tax registrations cancelled; |
| | • | | Disallowance of ICMS tax credits on the sale of diesel fuel to customers engaged in the agro industrial business; |
| | • | | ICMS payments on inventory differences arising from erroneous calculations by the State Tax Administration; |
| | • | | ICMS related to the tax war caused by tax benefits granted composed by all States representatives; |
| | • | | The subsidiary CLE has been discussing the state fund of fiscal equilibrium (Fundo Estadual de Equilíbrio Fiscal), or “FEEF,” (deposit of 10% of ICMS tax exempted by the use of tax benefits) on the industrialization and commercialization of lube oils, considering that the constitutional immunity provided for in art. 155, § 2, X, “b” of CF / 88 cannot be considered as a tax benefit under Law No. 7,248/2016, regulated by State Decree No. 45,810/2016. Judicial deposits have been made for the corresponding amounts; |
| | • | | ICMS exemption in the transportation of goods for exportation; |
| | • | | Assessment from State Tax Administration of São Paulo on the grounds that the Company was not authorized to operate as a general warehouse in that state. At the time of the release of the state registration, the tax authorities allowed the Company’s activities, including issuance of invoices. |
| | • | | Tax assessment notice issued by the São Paulo State Treasury Department, against Rumo Malha Paulista, covering the period from February 2011 to July 2015, with the indication of infractions for alleged lack of payment of ICMS on railroad services for export and ICMS credits accrual considered undue. |
| (iii) | Refers mainly to the reversal of PIS and COFINS credits, provided by Laws 10,637/2002 and 10,833/2003, respectively. Those reversals arise from a differing interpretation of the laws by the tax authorities in relation to raw materials. These discussions are still at the administrative level. |
Tax authorities assessed the Rumo Malha Paulista fornon-taxation of PIS and COFINS on revenues from mutual traffic and rite of passage billed against Rumo Malha Norte. The chance of loss is considered possible as tax already has been collected by the concessionaire responsible for transporting from origin.
| (iv) | The subsidiary CLE received an assessment notice related to the withholding income tax on an alleged capital gain arising from the acquisition of assets of foreign companies. |
The subsidiary Comgás received an assessment notice related to the withholding income tax on an alleged capital gain of a former shareholder due to contractual arrangements.
Rumo Malha Paulista had part of its IRPJ credit balance glossed based on the argument that the Company would not be entitled to IRRF compensation on swap transactions.
| (v) | Tax assessment issued by the Brazilian Tax Authority in 2011 and 2013 against Rumo S.A. concerning: (a) amortization expense disallowance based on future profitability, as well as financial expenses; and(b) non-taxation of supposed capital gain on disposal of equity interest in a Company of the same group. |
| (vi) | Legal demands related to the SRF Normative Instruction no. 67/98 that allowed for the refunding of IPI tax payments for sales of refined sugar from January 14, 1992 through November 16, 1997 and fiscal requirement, at the exit of lubricating grease, of product immune to the collection of IPI, because it is derived from petroleum. |
| (vii) | The Company was assessed due to the disregard of the tax benefits of REPORTO (PIS and COFINS suspension), on the grounds that the locomotives and freight cars purchased in 2010 were used outside the limits area of the port. Therefore, the Company was assessed to pay PIS and COFINS, as well as an isolated fine corresponding to 50% of the value of acquired assets. |
F-67
Cosan Limited
Notes to the consolidated financial statements
(In thousands of Brazilian Reais—R$ unless otherwise stated)
| (viii) | The Tax Authority partially rejected the Company requests for payment of its federal tax debts, pursuant to provisional measure n. 470 (MP 470), on the ground that the tax loss offered is not sufficient to settle the respective debts. The likelihood of loss is considered as possible since the results are indicated existed and are available for such use. |
| (ix) | Tax assessment notices issued requiring additional income tax, social contribution, PIS and COFINS, for the calendar years 2005 to 2008 as a result of the following alleged violations: (a) improper exclusion of financial costs arising from loans with foreign financial institutions from the corporate income tax and social contribution calculation basis, (b) improper exclusion of financial income from securities issued by the Government of Austria and the Government of Spain from the corporate income tax and social contribution calculation basis (c) no inclusion, in the corporate income tax and social contribution calculation basis, of gains earned in swap operations, andnon-taxation of financial income resulting from these contracts by PIS and COFINS, (d) improper offsetting from corporate income tax and the social contribution calculation basis by using PIS and COFINS credits. |
A favorable decision in the Administrative Tax Appeals Council (Conselho Administrativo de Recursos Fiscais), or “CARF,” may change its classification for remote losses.
| (x) | The legal proceeding related to INSS payment involve the following: (a) the legality and constitutionality questioning Normative Instruction MPS/SRP Nº 03/2005, which restricted the constitutional immunity over social contributions on export revenues through direct sales, consistent with the manner exports made via trading companies are now taxed; (b) assessment of SENAR (Rural apprenticeship scheme) social contribution on direct and indirect exports, in which the tax authorities disregard the right to constitutional immunity; and (c) requirement of social security contribution on stock purchase through stock option plans. |
| (xi) | SRF Normative Instruction no. 67/98 allowed for the refunding of IPI tax payments for sales of refined sugar from January 14, 1992 through November 16, 1997. Consequently, the Company applied for the offsetting of amounts paid during the periods against other tax liabilities. However, the tax authorities denied its application for both the reimbursement and offsetting of these amounts. The Company has challenged this ruling in an administrative proceeding. The subsidiary CLE has requirement of IPI, at restricting the constitutional immunity, because the lubricating oil is derived from petroleum. |
| (xii) | Tax assessments issued against the Rumo for the collection of social security contributions (20% on the amount paid) of amounts related to the Stock Option Plan granted to employees, managers and third parties. The main reason for the assessment is the alleged remunerative nature. |
Labor:
In 2010, Prumo Engenharia Ltda. (“Prumo Engenharia”), a company that provided services to ALL—América Latina Logística SA (“ALL”), was accused of incurring irregular labor practices during the execution of an engineering service for the Company’s indirect subsidiary, Rumo Malha Paulista. Although Prumo Engenharia assumed full responsibility for the condition of the workers in question, Rumo Malha Paulista was improperly included, in the Rumo S.A.’s view, in the register of employers of the Ministry of Labor, being granted a preliminary injunction determining the exclusion of said registration until the final and unappealable decision of the judicial process, which is processed in the secrecy of justice.
The Public Prosecutor’s Office also filed a public civil action against the Malha Paulista, without the inclusion of Prumo in the case, demanding payment of compensation for collective damages in the amount of R$ 100,000 (among other commitments), partially adjudicated proceeding condemning the Rumo S.A. in obligations of doing and not doing, as, in collective moral damages of R$ 28,900. In addition to demonstrating that the Rumo S.A. did not participate in the practice of irregularities, Rumo S.A. understands that the suit should be filed against Prumo, which is discussed in appeal. The risk of loss is considered possible and the case is awaiting decision of the Superior Labor Court.
F-68
Cosan Limited
Notes to the consolidated financial statements
(In thousands of Brazilian Reais—R$ unless otherwise stated)
Accounting policy
Incremental costs directly attributable to the issue of ordinary shares are recognized as a deduction from equity. Income taxes relating to transaction costs of an equity transaction are accounted for in accordance with policy described in Note 13.
At December 31, 2018, Cosan Limited’s share capital is composed of the following:
| | | | | | | | | | | | | | | | |
| | | Class A | | | % | | | Class B1
shares | | | % | |
Shareholders—Common shares |
Controlling group | | | 19,514,418 | | | | 11.20 | | | | 96,332,044 | | | | 100.00 | |
Renaissance Technologies LLC | | | 6,288,299 | | | | 3.60 | | | | — | | | | — | |
M&G Investment Management Limited | | | 5,651,331 | | | | 3.20 | | | | — | | | | — | |
Eastspring Investments (Singapore) Limited | | | 3,963,068 | | | | 2.30 | | | | — | | | | — | |
Free Float | | | 112,926,552 | | | | 64.80 | | | | — | | | | — | |
| | | | | | | | | | | | | | | | |
Total shares outstanding | | | 148,343,668 | | | | 85.10 | | | | 96,332,044 | | | | 100.00 | |
| | | | | | | | | | | | | | | | |
Treasury shares | | | 26,011,673 | | | | 14.90 | | | | — | | | | — | |
Total | | | 174,355,341 | | | | 100.00 | | | | 96,332,044 | | | | 100.00 | |
| | | | | | | | | | | | | | | | |
On December 31, 2018, the capital authorized is U.S.$ 11,889 thousand, divided into 1,000,000,000 Class A Shares of par value US$ 0.01 each and 188,886,360 Class B Shares or par value U.S.$ 0.01 each. The capital subscribed and paid by the Company is R$ 5,328, which is composed of 174,355,341 book-entry shares of common stock without par value. There have been no changes to the number of shares issued during the periods presented.
The Company holds 26,011,673 Class A treasury shares as of December 31, 2018 (27,488,204 as of December 31, 2017) with a market value of U.S.$ 8.80 per share as of December 31, 2018 (U.S.$ 9.70 per share as of December 31, 2017).
On December 22, 2017 the Company finished its tender offer to purchase own shares, and 22,025,248 common shares was bought for U.S.$ 9.65 per share. The transaction generated a cash outflow, as shown in the financing activity of statement of cash flow, in the amount of U.S.$ 212,544 thousand or R$ 707,770.
On December 31, 2018, the amount of 1,476,531 treasury shares was delivered to the beneficiaries of the Stock-Grant Plan – Equity-settled – Cosan Limited.
Accounting policy
Cosan Limited is a holding company and can only pay dividends to the extent, if any, that funds are received from its subsidiaries.
On May 16, 2018, the board of directors approved the distribution of the dividends received by Cosan Limited from Cosan S.A.. The dividends were paid to shareholders for the fiscal year ended December 31, 2017 totaling R$ 69,622 or U.S.$ 20,000, corresponding to R$ 0,2861 or U.S.$ 0,0822 per common share without withholding income tax.
F-69
Cosan Limited
Notes to the consolidated financial statements
(In thousands of Brazilian Reais—R$ unless otherwise stated)
| | d) | Other comprehensive (loss) income |
| | | | | | | | | | | | |
| | | December 31,
2017 | | | Comprehensive
(loss) income | | | December 31,
2018 | |
Foreign currency translation effect | | | (372,343 | ) | | | (161,574 | ) | | | (533,917 | ) |
Gain on cash flow hedge in joint ventures and subsidiaries | | | 14,610 | | | | 6,883 | | | | 21,493 | |
Actuarial loss on defined benefit plan | | | (44,937 | ) | | | (54,309 | ) | | | (99,246 | ) |
Financial instruments with subsidiaries | | | 15,000 | | | | — | | | | 15,000 | |
Change in fair values of financial assets | | | 841 | | | | 244 | | | | 1,085 | |
| | | | | | | | | | | | |
Total | | | (386,829 | ) | | | (208,756 | ) | | | (595,585 | ) |
| | | | | | | | | | | | |
Attributable to: | | | | | | | | | | | | |
Owners of the Company | | | (394,212 | ) | | | (192,961 | ) | | | (587,173 | ) |
Non-controlling interests | | | 7,383 | | | | (15,795 | ) | | | (8,412 | ) |
| | | | | | | | | | | | |
| | | December 31,
2016 | | | Comprehensive
(loss) income | | | December 31,
2017 | |
|
Foreign currency translation effect | | | (322,258 | ) | | | (50,085 | ) | | | (372,343 | ) |
(Loss) gain on cash flow hedge in joint ventures and subsidiaries | | | (190,001 | ) | | | 204,611 | | | | 14,610 | |
Actuarial loss on defined benefit plan | | | (29,017 | ) | | | (15,920 | ) | | | (44,937 | ) |
Financial instruments with subsidiaries | | | 6,000 | | | | 9,000 | | | | 15,000 | |
Change in fair values of financial assets | | | (2,618 | ) | | | 3,459 | | | | 841 | |
| | | | | | | | | | | | |
Total | | | (537,894 | ) | | | 151,065 | | | | (386,829 | ) |
| | | | | | | | | | | | |
Attributable to: | | | | | | | | | | | | |
Owners of the Company | | | (480,454 | ) | | | 86,242 | | | | (394,212 | ) |
Non-controlling interests | | | (57,440 | ) | | | 64,823 | | | | 7,383 | |
Accounting policy
| | a) | Basic earnings per share |
Basic earnings per share is calculated by dividing:
| | i. | the profit attributable to owners of the company, excluding any costs of servicing equity other than ordinary shares; and |
| | ii. | by the weighted average number of ordinary shares outstanding during the financial year, adjusted for bonus elements (share-based payment) in ordinary shares issued during the year and excluding treasury shares (Note 15). |
| | b) | Diluted earnings per share |
Diluted earnings per share adjusts the figures used in the determination of basic earnings per share to take into account:
| | i. | the after income tax effect of interest and other financing costs associated with dilutive potential ordinary shares; and |
| | ii. | the weighted average number of additional ordinary shares that would have been outstanding assuming the conversion of all dilutive potential ordinary shares. |
F-70
Cosan Limited
Notes to the consolidated financial statements
(In thousands of Brazilian Reais—R$ unless otherwise stated)
The Company’s subsidiaries have two categories of potential dilutive effects: share options and put options. For the share options, a calculation is done to determine the effect of the dilution in the profit attributable to shareholders of the parent due the exercise of the share options at subsidiaries. For the put option, is assumed to have been converted into ordinary shares, and the profit attributable to shareholders of the parent is adjusted.
The following table sets forth the calculation of earnings per share (in thousands of Brazilian Reais, except per share amounts):
| | | | | | | | | | | | |
| | | December 31,
2018 | | | December 31,
2017 | | | December 31,
2016 | |
Profit attributable from continued operation to ordinary equity holders for basic earnings | | | 975,448 | | | | 551,021 | | | | 325,132 | |
Loss attributable from discontinued operation to ordinary equity holders for basic earnings | | | — | | | | — | | | | (47,328 | ) |
Effect of dilution: | | | | | | | | | | | | |
Dilutive effect of subsidiary’s stock option plan | | | (2,882 | ) | | | (1,352 | ) | | | (3,096 | ) |
Dilutive effect of subsidiary’s stock option plan—discontinued operation | | | — | | | | — | | | | 200 | |
Dilutive effect of put option | | | — | | | | — | | | | (15,601 | ) |
| | | | | | | | | | | | |
Profit from continued operation attributable to ordinary equity holders adjusted for the effect of dilution | | | 972,566 | | | | 549,669 | | | | 306,435 | |
Loss from discontinued operation attributable to ordinary equity holders adjusted for the effect of dilution | | | — | | | | — | | | | (47,128 | ) |
| | | | | | | | | | | | |
Basic number of shares outstanding—In thousands of shares | | | 244,065 | | | | 262,999 | | | | 264,691 | |
Effect of dilution: | | | | | | | | | | | | |
Dilutive effect of stock option plan | | | 10,061 | | | | 5,553 | | | | — | |
| | | | | | | | | | | | |
Diluted number of shares outstanding—In thousands of shares | | | 254,126 | | | | 268,552 | | | | 264,691 | |
Basic earnings (loss) per share from: | | | | | | | | | | | | |
Continuing operations | | R$ | 3.997 | | | R$ | 2.095 | | | R$ | 1.2283 | |
Discontinuing operations | | R$ | 0.000 | | | R$ | 0.000 | | | (R$ | 0.1788 | ) |
| | | | | | | | | | | | |
| | | R$ 3.997 | | | R$ 2.095 | | | R$ 1.050 | |
Diluted earnings (loss) per share from: | | | | | | | | | | | | |
Continuing operations | | R$ | 3.827 | | | R$ | 2.047 | | | R$ | 1.1577 | |
Discontinuing operations | | R$ | 0.000 | | | R$ | 0.000 | | | (R$ | 0.1780 | ) |
| | | | | | | | | | | | |
| | | R$ 3.8271 | | | R$ 2.0468 | | | R$ 0.9797 | |
Thenon-controlling interests of the indirect subsidiary Brado have the right to exercise a liquidity option provided for in the shareholders’ agreement signed on August 5, 2013. This option would exchange all Brado shares held by such minority shareholders by shares of Rumo. The exchange ratio shall take into account the economic value for both Brado and Rumo shares. At the Company’s exclusive discretion, an equivalent cash payment is also possible.
For the year ended December 31, 2018, 3,264 share options indirect subsidiary Brado were excluded from the dilutedweighted-average number of ordinary shares calculation because their effect would have been anti-dilutive.
For the year ended December 31, 2018, 656,000 shares related to the share repurchase plan of subsidiary Cosan S.A. have an antidilutive effect, so they were not considered in the diluted earnings per share analysis.
F-71
Cosan Limited
Notes to the consolidated financial statements
(In thousands of Brazilian Reais—R$ unless otherwise stated)
Accounting policy
The Company recognizes revenues from the following main sources:
The Company operates in the production and distribution of lubricants including the brands Mobil and Comma, as well as the production and distribution of biomass pellets. Products are sold in contracts identified with individual customers and in sets, as a package of goods or services.
The Company recognizes sales revenues upon delivery to the customer as long as revenue and costs can be measured reliably, receipt of the consideration is probable and there is no continuous involvement of management with the products. Delivery is considered to be the moment when the customer accepts the goods, and the risks and benefits related to the property are transferred.
Some lubricant sales contracts cannot be purchased separately from a package of services. However, the goods and services are clearly distinct in the contracts. This sales modality represents two separate performance obligations and therefore revenue will be recognized for each of these performance obligations when control of the respective goods and services is transferred to the customer. The transaction price be allocated to different performance obligations based on the independent selling price, in which revenues are identified, measured and recorded separately.
Trade incentives, including cash incentives, discounts and volume rebates, and free or discounted goods or services, are accounted for as a reduction of revenue.
Discounts, rebates, credits, price concessions, performance bonuses and similar incentives are treated as variable consideration and included in the transaction price at the company’s best estimate, and is included in revenue to the extent that it is highly probable that there will be no significant reversal of the cumulative amount of revenue when any pricing uncertainty is resolved.
The Company provides gas distribution services through the subsidiary Comgás and logistics services through the subsidiary Cosan Logística. The fair value and selling prices of individual services are broadly similar.
The company provides gas distribution services through the subsidiary Comgás. Fair value and service selling prices are conveniently released and recognized when its value is measured reliably, recognized as having no result at the same volume as those delivered to customers based on the monthly measurements performed.
Refers to the portion of gas supplied for which metering and billing to customers have not yet occurred. This amount is estimated based on the period between measurement and the last day of the month.
The actual volume billed may be different from estimates. The Company believes that, based on its historical experience with similar operation, the unbilled estimated amount will not significantly differ from actual amounts.
Are recognized when the amount of revenue can be measured reliably, when it is probable that the economic benefits associated with the transaction will flow to the Company, when the stage of completion of the transaction at the end of the reporting period can be measured reliably, as well as when its amount and related costs can be measured reliably. Service prices are established based on service orders or contracts. Services for which payment is made in advance are recorded as deferred revenue in other liabilities and recognized in revenue when the services are rendered.
F-72
Cosan Limited
Notes to the consolidated financial statements
(In thousands of Brazilian Reais—R$ unless otherwise stated)
Consists in advances received from clients seeking investment in fixed assets in return for a rail service contract requiring future performance of services by the Company.
| | vii. | Infrastructure concessions |
The construction of the infrastructure necessary for gas distribution is considered a construction service rendered to the Conceding Authority, and the related income is recognized in profit or loss at finishing stage of the work.
Construction costs are recognized by reference to the stage of completion of the construction activity at the end of the reporting period, and are included in cost of sales.
The provision of infrastructure construction services is recognized in accordance with IFRS 15, against a contract asset.
The following is an analysis of the Company’s revenue for the year from continuing operations:
| | | | | | | | | | | | | | | |
| | | December 31, 2018 | | December 31, 2017 | | December 31, 2016 |
Gross revenue from sales of products and services | | | | 19,618,525 | | | | | 15,835,343 | | | | | 14,673,819 | |
Construction revenue | | | | 415,753 | | | | | 351,193 | | | | | 339,025 | |
Indirect taxes and deductions | | | | (3,190,345 | ) | | | | (2,604,073 | ) | | | | (2,494,705 | ) |
| | | | | | | | | | | | | | | |
Net sales | | | | 16,843,933 | | | | | 13,582,463 | | | | | 12,518,139 | |
| | | | | | | | | | | | | | | |
In the following table, revenue is disaggregated by products and service lines and timing of revenue recognition:
| | | | | | | | | | | | |
| | | December 31, 2018 | | | December 31, 2017 | | | December 31, 2016 | |
At a point in time | | | | | | | | | | | | |
Comgás—Gas distribution | | | 6,363,614 | | | | 5,118,087 | | | | 5,211,082 | |
Moove—Lubricants and basic oil | | | 3,414,536 | | | | 2,097,450 | | | | 1,861,991 | |
Other | | | 69,808 | | | | 72,018 | | | | 108,012 | |
| | | | | | | | | | | | |
| | | 9,847,958 | | | | 7,287,555 | | | | 7,181,085 | |
Over time | | | | | | | | | | | | |
Logistic—Transportation | | | 5,715,450 | | | | 4,993,849 | | | | 3,960,800 | |
Logistic—Port Elevation | | | 303,800 | | | | 330,800 | | | | 308,300 | |
Comgás—Construction revenue | | | 415,753 | | | | 351,193 | | | | 339,025 | |
Other services | | | 601,099 | | | | 653,771 | | | | 767,138 | |
| | | | | | | | | | | | |
| | | 7,036,102 | | | | 6,329,613 | | | | 5,375,263 | |
Elimination | | | (40,127 | ) | | | (34,705 | ) | | | (38,209 | ) |
| | | | | | | | | | | | |
Total of net sales | | | 16,843,933 | | | | 13,582,463 | | | | 12,518,139 | |
| | | | | | | | | | | | |
F-73
Cosan Limited
Notes to the consolidated financial statements
(In thousands of Brazilian Reais—R$ unless otherwise stated)
| 18 | Costs and expenses by nature |
The expenses are presented in the statement of profit and loss by function. The reconciliation of income by nature/purpose are as follows:
| | | | | | | | | | | | | | | |
| | | December 31, 2018 | | December 31, 2017 | | December 31, 2016 |
Raw materials and consumables used | | | | (7,245,378 | ) | | | | (4,757,593 | ) | | | | (4,320,833 | ) |
Construction cost | | | | (415,753 | ) | | | | (351,193 | ) | | | | (339,025 | ) |
Employee benefit expense | | | | (2,006,400 | ) | | | | (1,985,230 | ) | | | | (1,934,690 | ) |
Selling expenses | | | | (30,139 | ) | | | | (82,941 | ) | | | | (72,683 | ) |
Transportation expenses | | | | (1,674,771 | ) | | | | (1,533,050 | ) | | | | (1,394,544 | ) |
Leases and concessions expenses | | | | (212,081 | ) | | | | (193,252 | ) | | | | (193,637 | ) |
Leases expenses | | | | (14,157 | ) | | | | (15,234 | ) | | | | (38,977 | ) |
Depreciation and amortization | | | | (1,972,136 | ) | | | | (1,889,525 | ) | | | | (1,697,983 | ) |
Other | | | | (554,421 | ) | | | | (428,145 | ) | | | | (363,394 | ) |
| | | | | | | | | | | | | | | |
| | | | (14,125,236 | ) | | | | (11,236,163 | ) | | | | (10,355,766 | ) |
Cost of sales | | | | (12,119,917 | ) | | | | (9,232,210 | ) | | | | (8,317,490 | ) |
Selling | | | | (1,023,485 | ) | | | | (1,068,663 | ) | | | | (1,037,542 | ) |
General and administrative | | | | (981,834 | ) | | | | (935,290 | ) | | | | (1,000,734 | ) |
| | | | | | | | | | | | | | | |
| | | | (14,125,236 | ) | | | | (11,236,163 | ) | | | | (10,355,766 | ) |
| | | | | | | | | | | | | | | |
| 19 | Other income (expenses), net |
| | | | | | | | | | | | |
| | | December 31, 2018 | | | December 31, 2017 | | | December 31, 2016 | |
Gain on judicial dispute(i) | | | 726,000 | | | | — | | | | — | |
Tax extemporary credits(ii) | | | 199,027 | | | | — | | | | — | |
Revenue from sale of scrap | | | 45,952 | | | | 41,040 | | | | — | |
Insurance reimbursement income | | | 5,345 | | | | 22,852 | | | | 12,794 | |
Gain (loss) from port operations | | | 4,679 | | | | (1,028 | ) | | | — | |
Rental income | | | 831 | | | | 2,622 | | | | 2,889 | |
Gain on compensation claims | | | — | | | | 1,039,966 | | | | — | |
Loss on disposal of non-current assets and intangibles | | | (959 | ) | | | (32,558 | ) | | | (22,961 | ) |
Impairment | | | (72,448 | ) | | | — | | | | — | |
Net effect of legal proceedings, recoverable and tax installments | | | (115,383 | ) | | | (172,659 | ) | | | (111,841 | ) |
Other | | | (54,893 | ) | | | (22,636 | ) | | | 2,817 | |
| | | | | | | | | | | | |
| | | 738,151 | | | | 877,599 | | | | (116,302 | ) |
| | | | | | | | | | | | |
| (i) | The subsidiary Comgás and the supplier Petrobras settled judicial dispute that were not related to the cost of gas. As a result was recognized an indemnification in the net amount of R$ 726,000 (note 5.7). |
| (ii) | Gain on the recognition of the ICMS base of the PIS and COFINS base (note 6). |
F-74
Cosan Limited
Notes to the consolidated financial statements
(In thousands of Brazilian Reais—R$ unless otherwise stated)
20 Finance results
Accounting policy
Finance income comprises interest income on funds invested, dividend income, fair value gains on financial assets at fair value through profit or loss, gains on the remeasurement to fair value of anypre-existing interest in an acquire in a business combination, gains on hedging instruments that are recognized in profit or loss and reclassifications of net gains previously recognized in other comprehensive income. Interest income is recognized as it accrues in profit or loss, using the effective interest method. Dividend income is recognized in profit or loss on the date that the Company’s right to receive payment is established, which in the case of quoted securities is normally theex-dividend date.
Finance expense comprise interest expense on borrowings, unwinding of the discount on provisions and deferred consideration, dividends on preference shares classified as liabilities, fair value losses on financial assets at fair value through profit or loss and contingent consideration, impairment losses recognized on financial assets (other than trade receivables), losses on hedging instruments that are recognized in profit or loss and reclassifications of net losses previously recognized in other comprehensive income.
Borrowing costs that are not directly attributable to the acquisition, construction or production of a qualifying asset are recognized in profit or loss using the effective interest method.
Foreign exchange gains and losses on financial assets and financial liabilities are reported on a net basis as financial income or financial cost, depending on whether the net foreign currency fluctuations result in a gain or loss position.
Foreign currency gains and losses on financial assets and financial liabilities are reported on a net basis as either finance income or finance cost depending on whether the net foreign currency fluctuations result in a gain or loss position.
F-75
Cosan Limited
Notes to the consolidated financial statements
(In thousands of Brazilian Reais—R$ unless otherwise stated)
Details of finance income and costs are as follows:
| | | | | | | | | | | | |
| | | December 31, 2018 | | | December 31, 2017 | | | December 31, 2016 | |
Cost of gross debt | | | | | | | | | | | | |
Interest on debt | | | (1,605,222 | ) | | | (1,787,347 | ) | | | (1,835,474 | ) |
Monetary and exchange rate variation | | | (1,491,050 | ) | | | (198,858 | ) | | | 865,158 | |
Derivatives and fair value measurement | | | 1,532,273 | | | | (34,738 | ) | | | (1,463,395 | ) |
Amortization of borrowing costs | | | (54,251 | ) | | | (38,886 | ) | | | (73,832 | ) |
Discounts obtained from financial operations | | | — | | | | — | | | | 85,962 | |
Guarantees and warranties on debt | | | (109,046 | ) | | | (157,512 | ) | | | (50,819 | ) |
| | | | | | | | | | | | |
| | | (1,727,296 | ) | | | (2,217,341 | ) | | | (2,472,400 | ) |
Income from financial investment and exchange rate in cash and cash equivalents | | | 438,149 | | | | 578,611 | | | | 534,657 | |
| | | | | | | | | | | | |
Cost of debt, net | | | (1,289,147 | ) | | | (1,638,730 | ) | | | (1,937,743 | ) |
Other charges and monetary variations | | | | | | | | | | | | |
Interest on other receivables(i)(ii) | | | 460,861 | | | | 120,030 | | | | 263,180 | |
Interest on other liabilities | | | (212,799 | ) | | | (409,697 | ) | | | (414,540 | ) |
Monetary variation on leases and concessions agreements | | | (186,259 | ) | | | (244,198 | ) | | | (296,118 | ) |
Monetary variation on leases | | | (105,085 | ) | | | (131,185 | ) | | | (207,686 | ) |
Advances on real state credits | | | (5,091 | ) | | | (20,171 | ) | | | (39,671 | ) |
Interest on shareholders’ equity | | | (13,011 | ) | | | (16,883 | ) | | | (9,448 | ) |
Interest on contingencies and contracts | | | (102,525 | ) | | | (52,667 | ) | | | (91,977 | ) |
Bank charges and other | | | (94,809 | ) | | | (355,195 | ) | | | (314,014 | ) |
Exchange variation | | | (63,071 | ) | | | (2,803 | ) | | | (7,759 | ) |
| | | | | | | | | | | | |
| | | (321,789 | ) | | | (1,112,769 | ) | | | (1,118,033 | ) |
Finance results, net | | | (1,610,936 | ) | | | (2,751,499 | ) | | | (3,055,776 | ) |
| | | | | | | | | | | | |
Reconciliation | | | | | | | | | | | | |
Finance expense | | | (2,849,228 | ) | | | (3,704,515 | ) | | | (3,673,356 | ) |
Finance income | | | 1,032,725 | | | | 870,739 | | | | 1,102,918 | |
Foreign exchange (losses) gain, net | | | (1,555,215 | ) | | | (199,777 | ) | | | 997,109 | |
Derivatives | | | 1,760,782 | | | | 282,054 | | | | (1,482,447 | ) |
| | | | | | | | | | | | |
Finance results, net | | | (1,610,936 | ) | | | (2,751,499 | ) | | | (3,055,776 | ) |
| | | | | | | | | | | | |
| (i) | The subsidiary Comgás and the supplier Petrobras settled judicial dispute. As a result the portion related to the interest on the principal amount of supplier was reversed in the amount the R$ 177,423 (see note 19 (i)), as well as the amount of R$ 101,583 related to the monetary variation on the judicial deposit (note 5.8). |
| (ii) | It is Included the balance of R$ 93,243 related to the interest on PIS and COFINS as stated in the note 6. |
F-76
Cosan Limited
Notes to the consolidated financial statements
(In thousands of Brazilian Reais—R$ unless otherwise stated)
| 21 | Financial risk management |
This note explains the Company’s exposure to financial risks and how these risks could affect the group’s future financial performance. Current year profit and loss information has been included where relevant to add further context.
| | | | | | |
Risk | | Exposure arising from | | Measurement | | Management |
Market risk – foreign exchange | | (i) Future commercial transactions. (ii) Recognized financial assets and liabilities not denominated in BrazilianReais. | | (i) Cash flow forecasting (ii) Sensitivity analysis | | Foreign currency forwards and foreign currency options |
Market risk – interest rate | | Cash and cash equivalents, marketable securities, restricted cash, loans, borrowings and debentures, leases, derivative and real state credit certificates | | (i) Sensitivity analysis | | Interest rate swaps |
Credit risk | | Cash and cash equivalents, marketable securities, restricted cash, trade receivables, derivatives, receivables from related parties and dividends | | (i) Aging analysis (ii) Credit ratings | | Diversification of bank deposits, credit limits and letters of credit |
Liquidity risk | | Loans, borrowings and debentures, trade payables, other financial liabilities, REFIS, leases, derivative, real state credit certificates, payables to related parties and dividends | | (i) Rolling cash flow forecasts | | Availability of committed credit lines and borrowing facilities |
The Company’s risk management is predominantly controlled by a central treasury department under policies approved by the board of directors. Company treasury identifies, evaluates and hedges financial risks in closeco-operation with the Company’s operating units. The board provides written principles for overall risk management, as well as policies covering specific areas, such as foreign exchange risk, interest rate risk, credit risk, use of derivative financial instruments andnon-derivative financial instruments, and investment of excess liquidity.
Where all relevant criteria are met, hedge accounting is applied to remove the accounting mismatch between the hedging instrument and the hedged item. This will effectively result in recognizing interest expense at a fixed interest rate for the hedged floating rate loans and inventory at the fixed foreign currency rate for the hedged purchases.
The Company’s policy is to maintain a robust capital base to promote the confidence of investors, creditors and the market, and to ensure the future development of the business. Management monitors that the return on capital is adequate for each of its businesses.
The usage of financial instruments in order to protect against these areas of volatility is determined through an analysis of the risk exposure that management intends to cover.
The objective of market risk management is to manage and control market risk exposures within acceptable parameters, while optimizing the return.
The Company uses derivatives to manage market risks. All such transactions are carried out within the guidelines set by the risk management committee. Generally, the Company seeks to apply hedge accounting to manage volatility in profit or loss.
F-77
Cosan Limited
Notes to the consolidated financial statements
(In thousands of Brazilian Reais—R$ unless otherwise stated)
As at December 31, 2018 and December 31, 2017, the Company had the following net exposure to the exchange rate variations on assets and liabilities denominated in Dollar (U.S.$) and Euro (€):
| | | | | | | | |
| | | December 31,
2018 | | | December 31,
2017 | |
Cash and cash equivalents | | | 1,285,156 | | | | 782,103 | |
Trade receivables | | | 51,734 | | | | 25,797 | |
Trade payables | | | (245,885 | ) | | | (263,229 | ) |
Loans, borrowings and debentures | | | (13,480,808 | ) | | | (8,919,712 | ) |
Advances from clients | | | — | | | | (6,310 | ) |
Contingent consideration | | | (64,969 | ) | | | (64,213 | ) |
Payables to related parties | | | — | | | | (210,497 | ) |
Derivative financial instruments | | | 11,064,567 | | | | 7,323,116 | |
| | | | | | | | |
Foreign exchange exposure, net | | | (1,390,205 | ) | | | (1,332,945 | ) |
| | | | | | | | |
The sensitivity of profit or loss to changes in the exchange rates arises mainly from U.S. Dollar denominated financial instruments and the impact on other components of equity arises from foreign forward exchange contracts designated as cash flow hedges though its joint ventures.
A reasonably possible strengthening (weakening) of the Real to U.S. Dollar and Euro at December 31, 2018 would have affected the measurement of financial instruments denominated in a foreign currency and affected equity and profit or loss by the amounts shown below. This analysis assumes that all other variables, in particular interest rates, remain constant and ignores any impact of forecast sales and purchases. Stressed scenarios (positive and negative effects, before tax effects) were defined based on changes of a 25% and 50% to the U.S. Dollar and Euro exchange rates used in the probable scenario. The Company’s exposure to foreign currency changes for all other currencies is not material.
| | | | | | | | | | | | | | | | | | | | | | | | |
| | | | | | | | | Variation scenario | |
Instrument | | Risk factor | | | Probable | | | 25% | | | 50% | | | -25% | | | -50% | |
Cash and cash equivalents | | U.S.$ | fluctuation | | | | (15,437 | ) | | | 115,960 | | | | 231,921 | | | | (115,960 | ) | | | (231,921 | ) |
Trade receivables | | U.S.$ | fluctuation | | | | (1,666 | ) | | | 12,518 | | | | 25,034 | | | | (12,518 | ) | | | (25,034 | ) |
Trade payables | | U.S.$ | fluctuation | | | | 6,954 | | | | (59,699 | ) | | | (119,395 | ) | | | 59,699 | | | | 119,395 | |
Exchange rate derivatives | | U.S.$ | fluctuation | | | | (303,234 | ) | | | 2,019,566 | | | | 4,039,131 | | | | (2,019,566 | ) | | | (4,039,131 | ) |
Loans, borrowings and debentures | | U.S.$ | fluctuation | | | | 369,041 | | | | (2,772,244 | ) | | | (5,544,488 | ) | | | 2,772,244 | | | | 5,544,488 | |
Contingent consideration | | U.S.$ | fluctuation | | | | 2,093 | | | | (15,721 | ) | | | (31,439 | ) | | | 15,719 | | | | 31,438 | |
| | | | | | | | | | | | | | | | | | | | | | | | |
Impacts on profit or loss | | | | | | | 57,751 | | | | (699,620 | ) | | | (1,399,236 | ) | | | 699,618 | | | | 1,399,235 | |
| | | | | | | | | | | | | | | | | | | | | | | | |
The probable scenario considers the estimated exchange rates, made by a specialized third part, at the due date of the transactions for the companies with functional currency Real (positive and negative, before tax effects), as follows:
| | | | | | | | | | | | | | | | | | | | | | | | |
| | | Exchange rate sensitivity analysis (R$/U.S.$) | |
| | | December 31,
2018 | | | Scenario | |
| | | Probable | | | 25% | | | 50% | | | -25% | | | -50% | |
U.S.$ | | | 3.8748 | | | | 3.7500 | | | | 4.6875 | | | | 5.6250 | | | | 2.8125 | | | | 1.8750 | |
Euro | | | 4.4390 | | | | 4.4600 | | | | 5.5750 | | | | 6.6900 | | | | 3.3450 | | | | 2.2300 | |
F-78
Cosan Limited
Notes to the consolidated financial statements
(In thousands of Brazilian Reais—R$ unless otherwise stated)
The Company and its subsidiaries monitor the fluctuations in variable interest rates in connection with its borrowings, especially those that accrue interest using LIBOR, and uses derivative instruments in order to minimize variable interest rate fluctuation risks.
A sensitivity analysis on the interest rates on loans and borrowings in compensation for the CDI investments withpre-tax increases and decreases of 25% and 50% is presented below:
| | | | | | | | | | | | | | | | | | | | |
| | | December 31, 2018 | |
Exposure interest rate | | Probable | | | 25% | | | 50% | | | -25% | | | -50% | |
Cash and cash equivalents | | | 209,584 | | | | 52,396 | | | | 104,791 | | | | (52,396 | ) | | | (104,791 | ) |
Marketable securities | | | 321,489 | | | | 42,636 | | | | 53,270 | | | | (42,636 | ) | | | (53,270 | ) |
Restricted cash | | | 8,807 | | | | 2,202 | | | | 4,403 | | | | (2,202 | ) | | | (4,403 | ) |
Leases | | | (19,174 | ) | | | (3,981 | ) | | | (7,962 | ) | | | 3,981 | | | | 7,962 | |
Interest rate derivatives | | | (421,347 | ) | | | (1,317,767 | ) | | | (2,454,362 | ) | | | 1,550,236 | | | | 3,372,895 | |
Loans, borrowings and debentures | | | (891,462 | ) | | | (109,855 | ) | | | (219,709 | ) | | | 109,855 | | | | 219,709 | |
| | | | | | | | | | | | | | | | | | | | |
Impacts on profit or loss | | | (792,103 | ) | | | (1,334,369 | ) | | | (2,519,569 | ) | | | 1,566,838 | | | | 3,438,102 | |
| | | | | | | | | | | | | | | | | | | | |
The probable scenario considers the estimated interest rate, made by a specialized third part and Central Bank of Brazil (Banco Central do Brasil), or “BACEN,” as follows:
| | | | | | | | | | | | | | | | | | | | |
| | | Probable | | | 25% | | | 50% | | | -25% | | | -50% | |
SELIC | | | 7.65 | % | | | 9.56 | % | | | 11.48 | % | | | 5.74 | % | | | 3.83 | % |
CDI | | | 7.65 | % | | | 9.56 | % | | | 11.48 | % | | | 5.74 | % | | | 3.83 | % |
TJLP462 (TJLP + 1% p.a.) | | | 7.40 | % | | | 9.00 | % | | | 10.60 | % | | | 5.80 | % | | | 4.20 | % |
TJLP | | | 6.40 | % | | | 8.00 | % | | | 9.60 | % | | | 4.80 | % | | | 3.20 | % |
IPCA | | | 4.12 | % | | | 5.15 | % | | | 6.18 | % | | | 3.09 | % | | | 2.06 | % |
IGPM | | | 4.20 | % | | | 5.25 | % | | | 6.30 | % | | | 3.15 | % | | | 2.10 | % |
FED FUNDS | | | 2.90 | % | | | 3.63 | % | | | 4.35 | % | | | 2.18 | % | | | 1.45 | % |
LIBOR | | | 3.02 | % | | | 3.78 | % | | | 4.53 | % | | | 2.27 | % | | | 1.51 | % |
The Company’s regular operations expose it to potential defaults when customers, suppliers and counterparties are unable to comply with their financial or other commitments. The Company seeks to mitigate this risk by entering into transactions with a diverse pool of counterparties. However, the Company continues to remain subject to unexpected third party financial failures that could disrupt its operations. The exposure to credit risk was as follows:
| | | | | | | | |
| | | December 31,
2018 | | | December 31,
2017 | |
Cash and cash equivalents | | | 3,621,798 | | | | 4,555,177 | |
Trade receivables | | | 1,588,192 | | | | 1,322,420 | |
Derivative financial instruments | | | 2,548,857 | | | | 1,162,213 | |
Marketable securities | | | 4,202,835 | | | | 3,853,343 | |
Receivables from related parties | | | 135,070 | | | | 199,814 | |
Dividends | | | 27,320 | | | | 13,466 | |
Restricted cash | | | 115,124 | | | | 225,634 | |
| | | | | | | | |
| | | 12,239,196 | | | | 11,332,067 | |
| | | | | | | | |
The Company is also exposed to risks in connection with its cash management activities and temporary investments.
Liquid assets are invested primarily in government security and other investments in Banks with a minimum grade of “A.” Credit risk from balances with banks and financial institutions is managed by the Company’s treasury department in accordance with the Company’s policy.
F-79
Cosan Limited
Notes to the consolidated financial statements
(In thousands of Brazilian Reais—R$ unless otherwise stated)
Investments of surplus funds are made only with approved counterparties and within credit limits assigned to each counterparty. Counterparty credit limits are reviewed on an annual basis and may be updated throughout the year. The limits are set to minimize the concentration of risks and therefore mitigate financial loss through potential counterparty’s failure to make payments. The credit risk on cash and cash equivalents, marketable securities, restricted cash and derivative financial instruments are determined by rating instruments widely accepted by the market and are arranged as follows:
| | | | | | | | |
| | | December 31,
2018 | | | December 31,
2017 | |
AAA | | | 8,911,418 | | | | 3,499,345 | |
AA | | | 1,577,196 | | | | 6,159,553 | |
B | | | — | | | | 2,007 | |
BB+ | | | — | | | | 4,180 | |
| | | | | | | | |
| | | 10,488,614 | | | 9,665,085 | |
The Company’s approach to managing liquidity is to ensure, as far as possible, that it will have sufficient liquidity to meet its liabilities when they are due, under both normal and stressed conditions, without incurring unacceptable losses or risking damage to the Company’s reputation.
The financial liabilities of the Company sorted by due dates (based on undiscounted cash flows contracted) are as follows:
| | | | | | | | | | | | | | | | | | | | | | | | |
| | | December 31, 2018 | | | December 31,
2017 | |
| | | Up to 1 year | | | 1—2 years | | | 3—5 years | | | More than 5
years | | | Total | | | Total | |
Loans, borrowings and debentures | | | (3,374,037 | ) | | | (3,527,103 | ) | | | (10,409,527 | ) | | | (21,132,241 | ) | | | (38,442,908 | ) | | | (31,554,560 | ) |
Trade payables | | | (1,923,920 | ) | | | — | | | | — | | | | — | | | | (1,923,920 | ) | | | (2,433,995 | ) |
Other financial liabilities | | | (455,702 | ) | | | — | | | | — | | | | — | | | | (455,702 | ) | | | (382,702 | ) |
Tax installments—REFIS | | | (66,838 | ) | | | (16,423 | ) | | | (37,678 | ) | | | (111,419 | ) | | | (232,358 | ) | | | (244,957 | ) |
Leases | | | (184,903 | ) | | | (152,862 | ) | | | (304,120 | ) | | | (195,777 | ) | | | (837,662 | ) | | | (1,443,470 | ) |
Derivative financial instruments | | | 84,502 | | | | 18,631 | | | | (425,559 | ) | | | 3,776,308 | | | | 3,453,882 | | | | (110,909 | ) |
Real estate credits certificates | | | — | | | | — | | | | — | | | | — | | | | — | | | | (92,844 | ) |
Payables to related parties | | | (355,971 | ) | | | — | | | | — | | | | — | | | | (355,971 | ) | | | (328,263 | ) |
Dividends payable | | | (187,415 | ) | | | — | | | | — | | | | — | | | | (187,415 | ) | | | (191,478 | ) |
| | | | | | | | | | | | | | | | | | | | | | | | |
| | | (6,464,284 | ) | | | (3,677,757 | ) | | | (11,176,884 | ) | | | (17,663,129 | ) | | | (38,982,054 | ) | | | (36,783,178 | ) |
| | | | | | | | | | | | | | | | | | | | | | | | |
F-80
Cosan Limited
Notes to the consolidated financial statements
(In thousands of Brazilian Reais—R$ unless otherwise stated)
| 22 | Post-employment benefits |
Accounting policy
The cost of defined benefit pension plans and other post-employment and the present value of the pension obligation is determined using actuarial valuations. An actuarial valuation involves the use of various assumptions which may differ from actual results in the future. These include the determination of the discount rate, future salary increases, mortality rates and future pension increases. A defined benefit obligation is highly sensitive to changes in these assumptions. All assumptions are reviewed by management at each reporting date.
A defined contribution plan is a post-employment benefit plan under which an entity pays fixed contributions into a separate entity and has no legal or constructive obligation to pay further amounts. Obligations for contributions to defined contribution plans are recognized as an employee benefit expense in profit or loss in the periods during which related services are rendered by employees. Prepaid contributions are recognized as an asset to the extent that a cash refund or a reduction in future payments is available. Contributions to a defined contribution plan that is due more than 12 months after the end of the period in which the employees render the service are discounted to their present value.
The Company provides defined contribution plans to all employees. The plan assets are held Futura plan (Futura II – Supplementary Pension Entity) and Comgás Pension Plan – PLAC. The Company and its subsidiaries do not have a legal or constructive obligation to pay further contributions if the fund does not have sufficient assets to pay all of the benefits owed.
The Company is the sponsor of defined benefit pension plans for some of its employees. A defined benefit plan is a post-employment benefit plans other than a defined contribution plan.
The liability recognized in the statement of financial position in respect of defined benefit pension plans is the present value of the defined benefit obligation at the end of the reporting period less the fair value of plan assets. The defined benefit obligation is calculated annually by independent actuaries using the projected unit credit method.
The present value of the defined benefit obligation is determined by discounting the estimated future cash outflows, using interest rates that are denominated in the currency in which the benefits will be paid, and that have terms approximating to the terms of the related obligation.
Gains and losses arising from experience adjustments and changes in actuarial assumptions are recognized in the period in which they occur, directly in other comprehensive income.
Changes in the present value of the defined benefit obligation resulting from plan amendments or curtailments are recognized immediately in profit or loss as past service costs.
Some of the Company’s pension plan, even though it is substantially defined contribution, has a variable component, whose risk is linked to the payment of minimum benefit and to the increase of the future contributions of the sponsors in the benefits in the event of Death Tax of the active taxpayer as well as in Disability Retirement, limited to three salaries. Any actuarial liability calculated, is recorded by the Company.
Defined benefit plan paid off, whose active participants have apaid-up benefit calculated in accordance with the regulation, which is being updated to the date of receipt by the plan of readjustment index, which leads the company to adopt such a provision the present value of benefits and that assisted participants receive annuity under the plan. The main actuarial risks are:
| | i. | higher survival to that specified in mortality tables; |
| | ii. | the return on equity under the actuarial discount rate plus the accumulatedIGP-DI; and |
| | iii. | real family structure of different retirees established hypothesis. |
| | | | | | | | |
| | | December 31, 2018 | | | December 31, 2017 | |
Futura | | | 75,298 | | | | 44,431 | |
Futura II | | | 252 | | | | 201 | |
Comgás | | | 504,320 | | | | 440,827 | |
| | | | | | | | |
| | | 579,870 | | | | 485,459 | |
F-81
Cosan Limited
Notes to the consolidated financial statements
(In thousands of Brazilian Reais—R$ unless otherwise stated)
During the year ended December 31, 2018, the amount of sponsor contributions to the plans was R$ 459 (R$ 327 and R$ 212 on December 31, 2017 and 2016, respectively).
The Company contributes to the following post-employment defined benefit plans:
| | i. | Futura: The subsidiary CLE sponsors the Futura – Supplementary Pension Entity (“Futura”), formerly Previd Exxon—Private Pension Entity, which has the main objective supplemental benefits, within certain limits established in the regulations of the Retirement Plan. This plan was amended to close it to new entrants and approved by the relevant authorities on May 5, 2011. During the year ended December 31, 2018, the amounts of contributions totaled R$ 4,138 (R$ 3,896 and R$ 4,571 for the years ended December 31, 2017 and 2016, respectively). The weighted average duration of obligation is 10.8 years. In 2019 the subsidiary expects to make a contribution in the amount of R$ 4,311 in relation to its defined benefit plan; and |
| | ii. | Comgás:Obligations relating to post-employment benefit plans, which include medical assistance and incentive retirement, sick pay and disability benefits are recorded in accordance with CVM Deliberation 695. |
The defined benefit pension plan is governed by the employment laws of the Brazil, which require final salary payments to be adjusted for the consumer price index upon payment during retirement. The level of benefits provided depends on the member’s length of service and salary at retirement age. During the year ended December 31, 2018, the amounts of contributions totaled R$ 26,808 (R$ 22,796 and R$ 23,588 for the years ended December 31, 2017 and 2016, respectively). The weighted average duration of obligation is 13.8 years.
Details of the present value of the defined benefit obligation and the fair value of plan assets are as follows:
| | | | | | | | |
| | | December 31, 2018 | | | December 31, 2017 | |
Actuarial obligation at beginning of the year | | | 905,874 | | | | 833,129 | |
Current service cost | | | 584 | | | | 586 | |
Interest expense | | | 83,476 | | | | 87,205 | |
Actuarial (gain) loss arising from financial assumptions | | | 25,583 | | | | 72,223 | |
Actuarial (gain) loss arising from experience adjustment | | | 58,550 | | | | (30,944 | ) |
Actuarial gains and losses arising from adjustments to demographic assumptions | | | (447 | ) | | | (197 | ) |
Benefits payment | | | (60,828 | ) | | | (56,128 | ) |
| | | | | | | | |
Actuarial obligation at the end of the year | | | 1,012,792 | | | | 905,874 | |
| | | | | | | | |
Fair value of plan assets at beginning of the year | | | (420,616 | ) | | | (391,803 | ) |
Interest income | | | (38,648 | ) | | | (40,955 | ) |
Earnings on assets greater than discount rate | | | (3,792 | ) | | | (16,976 | ) |
Contributions paid | | | (30,946 | ) | | | (27,010 | ) |
Benefit payments | | | 60,828 | | | | 56,128 | |
| | | | | | | | |
Fair value of plan assets end of the year | | | (433,174 | ) | | | (420,616 | ) |
Superplus (deficit) for the year | | | 579,618 | | | | 485,258 | |
| | | | | | | | |
Net defined benefit liability | | | 579,618 | | | | 485,258 | |
| | | | | | | | |
Total expense recognized in profit or loss is as follow:
| | | | | | | | |
| | | December 31, 2018 | | | December 31, 2017 | |
Current service cost | | | (717 | ) | | | (271 | ) |
Interest expense | | | (48,404 | ) | | | (46,312 | ) |
| | | | | | | | |
| | | (49,121 | ) | | | (46,583 | ) |
| | | | | | | | |
F-82
Cosan Limited
Notes to the consolidated financial statements
(In thousands of Brazilian Reais—R$ unless otherwise stated)
Total amount recognized as accumulated other comprehensive income:
| | | | | | | | |
| | | December 31, 2018 | | | December 31, 2017 | |
Accumulated at the initial of the year | | | 226,129 | | | | 252,473 | |
Actuarial (gain) loss arising from financial assumptions | | | (25,583 | ) | | | (7,865 | ) |
Actuarial (gain) loss arising from experience adjustment | | | (33,636 | ) | | | (1,845 | ) |
Earnings on assets greater than discount rate | | | 3,792 | | | | (16,634 | ) |
| | | | | | | | |
Accumulated at the end of the year | | | 170,702 | | | | 226,129 | |
| | | | | | | | |
The plan assets are comprised of the following:
| | | | | | | | | | | | | | | | |
| | | December 31, 2018 | | | December 31, 2017 | |
| | | Amount | | | % | | | Amount | | | % | |
Fixed income bonds | | | 419,182 | | | | 96.77 | % | | | 408,347 | | | | 98.18 | % |
Variable-income securities | | | 10,959 | | | | 2.53 | % | | | 3,411 | | | | 0.82 | % |
Other | | | 3,032 | | | | 0.70 | % | | | 4,159 | | | | 1.00 | % |
| | | | | | | | | | | | | | | | |
| | | 433,173 | | | | 100.00 | % | | | 415,917 | | | | 100.00 | % |
| | | | | | | | | | | | | | | | |
Plan assets are comprised of financial assets with quoted prices in active markets and therefore are classified as Level 1 and Level 2 in the valuation hierarchy of fair value. The overall expected rate of return on plan assets is determined based on prevailing market expectations on that date, applicable to the period over which the obligation is to be settled.
The main assumptions used to determine the benefit obligations of the Company are as follows:
| | | | | | | | | | | | | | | | |
| | | Futura | | | Comgás | |
| | | December 31,
2018 | | | December 31,
2017 | | | December 31,
2018 | | | December 31,
2018 | |
Discount rate | | | 9.50 | % | | | 9.55 | % | | | 9.30 | % | | | 9.52 | % |
Inflation rate | | | 4.20 | % | | | 4.00 | % | | | 4.00 | % | | | 4.00 | % |
Future salary increases | | | N/A | | | | N/A | | | | 7.12 | % | | | 7.12 | % |
Increase in pension plans | | | 4.20 | % | | | 4.00 | % | | | 7.12 | % | | | 4.00 | % |
Sensitivity analysis
Changes in the discount rate for the statement of financial position date in one of the relevant actuarial assumptions, while maintaining other assumptions, would have affected the defined benefit obligation as shown below:
| | | | | | | | |
| | | Discount rate | |
| | | Increase | | | Decrease | |
| | | 0.50% | | | -0.50% | |
Futura | | | (25,152 | ) | | | 23,052 | |
Futura II | | | (125 | ) | | | 118 | |
Comgás | | | (31,530 | ) | | | 35,642 | |
There was no change in relation to previous years in the methods and assumptions used in preparing the sensitivity analysis.
F-83
Cosan Limited
Notes to the consolidated financial statements
(In thousands of Brazilian Reais—R$ unless otherwise stated)
Accounting policy
The fair value of share-based payment benefits at the grant date is recognized as employee benefit expense with a corresponding increase in shareholders’ equity for the period in which employees unconditionally acquire the right to benefits.
The amount recognized as an expense is adjusted to reflect the number of shares for which there is an expectation that the conditions of service andnon-market acquisition conditions will be met in such a way that the amount finally recognized as an expense is based on the number of actions that actually meet the conditions of the service andnon-market acquisition conditions on the date the vesting date is acquired. Fornon-vesting share-based payment benefits, the fair value on the grant date of the share-based payment is measured to reflect such conditions and there is no change to the difference between expected and actual benefits.
The plans have been administered by the Board of Directors of each Company, at its option, by a Committee, within the limits established in the guidelines for the elaboration and structuring of each plan and in the applicable legislation.
| | a) | Description of share-based payment arrangements |
| | i. | Equity-settled transactions |
The cost of equity-settled transactions with employees is measured by reference to the fair value of the equity instruments on the date on which they are granted and is recognized as an expense over the vesting period, which ends on the date on which the employees become fully entitled to the award. A corresponding credit is recognized within equity. In valuing equity-settled transactions, no account is taken of any vesting conditions, other than conditions linked to the price of the shares of the company (market conditions).Non-vesting conditions, such as the condition that employees contribute to a savings-related plan, are taken into account in the grant-date fair value, and failure to meet anon-vesting condition, where this is within the control of the employee is treated as a cancellation and any remaining unrecognized cost is expensed. The Black-Scholes model was developed for use in estimating the fair value of traded options that have no vesting restrictions. The model requires the use of subjective assumptions, including expected stock-price volatility, expected life of the stock option or stock grant and dividend yield. The last two years of historical data shares value of the Company and subsidiaries have been considered in setting the assumptions.
Expected volatility has been based on an evaluation of the historical volatility of the Company’s share price, particularly over the historical period commensurate with the expected term. The expected term of the instruments has been based on historical experience and general option holder behavior.
For other equity-settled share-based payment transactions, the goods or services received and the corresponding increase in equity are measured at the fair value of the goods or services received unless their fair value cannot be reliably estimated. If the fair value of the goods and services received cannot be reliably estimated, the transaction is measured by reference to the fair value of the equity instruments granted.
| | ii. | Cash-settled transactions |
The Company has a phantom stock plan that provides for the granting of stock appreciation rights (“SARs”) and other cash-based awards to certain employees. SARs provide the opportunity to receive a cash payment equal to the fair market value of the Company’s common shares less the grant price. Compensation expense is recognized based on the fair value, measured according to the market-to-market of the Cosan’s shares. Any changes in the liability are recognized in profit or loss.
| | iii. | Employee share scheme (Stock-based compensation plan) |
A scheme under which shares may be issued by the Company to employees for no cash consideration was approved by shareholders at the 2016 annual general meeting.
Under the scheme, eligible employees may be granted ordinary shares annually for no cash consideration. The number of shares issued to participants in the scheme is the offer amount divided by the weighted average price at which the Company’s shares are traded on the Stock Exchange. The shares are recognized at the closing share price on the grant date (grant date fair value) as an issue of treasury shares and as part of employee benefit costs in the period the shares are granted.
F-84
Cosan Limited
Notes to the consolidated financial statements
(In thousands of Brazilian Reais—R$ unless otherwise stated)
For equity-settled shared based compensation, expense is based on the grant date fair value of the awards expected to vest over the vesting period. For awards with graded vesting, the fair value of each tranche is recognized over its respective vesting period. At the end of each reporting period, the Companyre-assesses its estimates of the number of awards that are expected to vest and recognizes the impact of the revisions in the income statement.
The Black-Scholes methodology was used to calculate the fair value under the terms of the Stock-Based Compensation Plan.
The following share-based payment arrangements:
| | | | | | | | |
Type of award / grant date | | Company | | Expected life
(years) | | Granted | |
Stock option programs | | | | | | | | |
August 18, 2011—(A) | | Cosan S.A. | | 1 to 7 | | | 4,825,000 | |
August 18, 2011—(B) | | Cosan S.A. | | 1 to 12 | | | 5,000,000 | |
December 12, 2012—(C) | | Cosan S.A. | | 1 to 7 | | | 700,000 | |
April 24, 2013 | | Cosan S.A. | | 5 to 7 | | | 970,000 | |
April 25, 2014 | | Cosan S.A. | | 5 to 7 | | | 960,000 | |
August 31, 2015 | | Cosan S.A. | | 5 to 7 | | | 759,000 | |
| | | | | | | | |
| | | | | | | 13,214,000 | |
Stock grant programs | | | | | | | | |
October 1, 2015 | | Rumo | | 5 | | | 1,485,900 | |
January 2, 2017 | | Rumo | | 5 | | | 1,476,000 | |
April 20, 2017 | | Comgás | | 5 | | | 61,300 | |
April 27, 2017 | | Cosan S.A. | | 5 | | | 274,000 | |
July 31, 2017 | | Cosan S.A. | | 5 | | | 298,107 | |
August 12, 2017 | | Comgás | | 5 | | | 97,780 | |
August 18, 2017 | | Cosan Limited | | 5 | | | 2,053,632 | |
September 1, 2017 | | Rumo | | 5 | | | 870,900 | |
July 31, 2018 | | Cosan S.A. | | 5 | | | 210,602 | |
August 1, 2018 | | Rumo | | 5 | | | 1,149,544 | |
August 1, 2018 | | Comgás | | 5 | | | 96,787 | |
| | | | | | | | |
| | | | | | | 8,074,552 | |
Cash-settled transactions | | | | | | | | |
September 29, 2017 | | Cosan Limited | | 5 | | | 255,000 | |
F-85
Cosan Limited
Notes to the consolidated financial statements
(In thousands of Brazilian Reais—R$ unless otherwise stated)
| | b) | Measurement of fair values |
The weighted average fair value of the programs granted during the financial years ended December 31, 2018 and 2017 and principal assumptions used in applying the Black-Scholes model were as follows:
| | | | | | | | | | | | | | | | | | | | | | | | |
| | | Stock grant programs | |
| | | Cosan S.A. | | | Comgás | | | Rumo | |
| | | December 31,
2018 | | | December 31,
2017 | | | December 31,
2018 | | | December 31,
2017 | | | December 31,
2018 | | | December 31,
2017 | |
Weighted average fair value at grant date | | | 36.06 | | | | 34.17 | | | | 36.37 | | | | 36.83 | | | | 13.94 | | | | 10.42 | |
Weighted average of key assumptions: | | | | | | | | | | | | | | | | | | | | | | | | |
Share price at grant date | | | 38.61 | | | | 34.51 | | | | 54.25 | | | | 51.03 | | | | 13.94 | | | | 10.42 | |
Risk-free interest rate | | | 15.00 | % | | | 15.00 | % | | | 10.56 | % | | | 11.13 | % | | | 10.93 | % | | | 9.93 | % |
Dividend yield | | | 2.86 | % | | | 5.93 | % | | | 7.19 | % | | | 4.32 | % | | | — | | | | — | |
Volatility factor | | | 33.70 | % | | | 33.23 | % | | | 32.38 | % | | | 28.60 | % | | | 31.91 | % | | | 29.76 | % |
| | c) | Reconciliation of outstanding share options |
The movement in the number of awards outstanding and their related weighted-average exercise prices are as follows:
| | | | | | | | | | | | | | | | |
| | | Stock option
programs | | | Stock grant
programs | | | Total | | | Weighted-average
exercise price | |
At January 1, 2017 | | | 7,978,000 | | | | 1,522,220 | | | | 9,500,220 | | | | 29.05 | |
Granted | | | — | | | | 3,370,267 | | | | 3,370,267 | | | | 36.06 | |
Vested | | | (1,405,000 | ) | | | (8,206 | ) | | | (1,413,206 | ) | | | 23.19 | |
Cancelled | | | (427,000 | ) | | | (368,444 | ) | | | (795,444 | ) | | | — | |
| | | | | | | | | | | | | | | | |
At December 31, 2017 | | | 6,146,000 | | | | 4,515,837 | | | | 10,661,837 | | | | 29.84 | |
Granted | | | — | | | | 1,456,933 | | | | 1,456,933 | | | | — | |
Vested | | | (942,000 | ) | | | (57,874 | ) | | | (999,874 | ) | | | 23.32 | |
Cancelled | | | (175,000 | ) | | | (219,295 | ) | | | (394,295 | ) | | | — | |
| | | | | | | | | | | | | | | | |
At December 31, 2018 | | | 5,029,000 | | | | 5,695,601 | | | | 10,724,601 | | | | 33.77 | |
| | | | | | | | | | | | | | | | |
| | d) | Expense recognized in profit or loss |
Share-based compensation expense included in the income statement for the years ended December 31, 2018, 2017 and 2016 was as follows:
| | | | | | | | | | | | |
| | | Stock option
programs | | | Stock grant
programs | | | Total | |
December 31, 2016 | | | 8,369 | | | | 3,889 | | | | 12,258 | |
December 31, 2017 | | | 5,972 | | | | 59,967 | | | | 65,939 | |
| | | | | | | | | | | | |
December 31, 2018 | | | 3,925 | | | | 52,580 | | | | 56,505 | |
| | | | | | | | | | | | |
On January 18, 2019, the Board of Directors approved the contracting of financial advisors and the submission to B3 for a voluntary public offering for the acquisition of class A preferred shares issued by its subsidiary Comgás (ticker: CGAS5) at the price of R$ 82.00 per share. A private agreement was also signed with shareholders holding 9,847,236 Class A preferred shares issued by subsidiary Comgás, under which Cosan S.A undertakes to acquire, and the shareholders undertake to dispose of all such class A preferred shares in the Voluntary Plan. The class A preferred shares, subject to this private agreement, represent approximately 41.786% of the class A preferred shares outstanding.
On March 8, 2019, Cosan S.A. announced the conclusion of the tender offer held on the same date for acquisition of class A preferred shares issued by Comgás. A total of 19,496,165 preferred shares of Comgás were acquired by Cosan in the tender offer at a price of R$82.00 per preferred share, representing approximately 14.77% of Comgás’s capital stock.
On February 15, 2019, the Board of Directors approved the issuance of non-convertible debentures of Cosan S.A., in the total amount of R$ 1,700,000, with amortization in three semi-annual installments starting in February 2020, with a rate of 109% of the CDI, payable semi-annually in four installments starting in August 2019, and maturing on February 28, 2021. The debenture holders will be entitled to full redemption and early amortization as from the sixth month of the date of issuance, without payment of any premium.
F-86
Cosan Limited
Notes to the consolidated financial statements
(In thousands of Brazilian Reais—R$ unless otherwise stated)
On March 26, 2019, the Board of Directors approved the cancellation of 9,000,000 treasury shares of the Company.
On February 15, 2019, Rumo made a public offer of distribution of 500,000 debentures, all nominative, book entry, simple,non-convertible, unsecured, single series, of its 12th issue, with a nominal unit value of R$ 1, totaling R$ 500,000, maturing on February 15, 2029.
On March 28, 2019, Rumo hereby announces to the market that the Company’s economic proposal ranked first in the International Bidding promoted by ANTT, the scope of which is the subconcession of the public railway cargo transportation service, associated to exploration of the infrastructure of a railway network located between the cities of Porto Nacional (state of Tocantins) and Estrela d’Oeste (state of São Paulo). The amount of Rumo’s economic proposal was R$ 2,719,530.
On February 15, 2019, the Board of Directors approved the cancellation of 32,239,807 treasury shares of the Company. The cancellation was concluded on April 24, 2019.
25 New standards and interpretations not yet effective
Certain new standards and amendments to standards are effective for annual periods beginning after January 1, 2019 and earlier application is permitted; however, the Company has not early adopted the following new or amended standards in preparing these consolidated financial statements.
These standards change the recognition, measurement, presentation and disclosure of leases. It requires lessees to record all leases on the statement of financial position with exemptions available for low value and short-term leases. During 2018, the Company concluded the preparations for the new requirements in IFRS 16, except for technical discussions regarding the incremental discount rate and agricultural partnership contracts in joint ventures.
The Company leases various properties, equipment and cars. Rental contracts are typically made for fixed periods but may have extension options as described in below. Lease terms are negotiated on an individual basis and contain a wide range of different terms and conditions. The lease agreements do not impose any covenants, but leased assets may not be used as security for borrowing purposes.
Leases are recognized as aright-of-use asset and a corresponding liability at the date at which the leased asset is available for use by the Company. Each lease payment is allocated between the liability and finance cost. The finance cost is charged to profit or loss over the lease period so as to produce a constant periodic rate of interest on the remaining balance of the liability for each period. Theright-of-use asset is depreciated over the shorter of the asset’s useful life and the lease term on a straight-line basis.
Assets and liabilities arising from a lease are initially measured on a present value basis. Lease liabilities include the net present value of the following lease payments:
| | i. | fixed payments (includingin-substance fixed payments), less any lease incentives receivable; |
| | ii. | variable lease payment that are based on an index or a rate; |
| | iii. | amounts expected to be payable by the lessee under residual value guarantees; |
| | iv. | the exercise price of a purchase option if the lessee is reasonably certain to exercise that option; and |
| | v. | payments of penalties for terminating the lease, if the lease term reflects the lessee exercising that option. |
The lease payments are discounted using the interest rate implicit in the lease, if that rate can be determined, or the Company’s incremental borrowing rate.
Right-of-use assets are measured at cost comprising the following:
| | i. | the amount of the initial measurement of lease liability; |
| | ii. | any lease payments made at or before the commencement date less any lease incentives received; |
| | iii. | any initial direct costs, and; |
Payments associated with short-term leases and leases oflow-value assets are recognized on a straight-line basis as an expense in profit or loss. Short-term leases are leases with a lease term of 12 months or less.Low-value assets compriseIT-equipment and small items of office furniture.
F-87
Cosan Limited
Notes to the consolidated financial statements
(In thousands of Brazilian Reais—R$ unless otherwise stated)
Extension and termination options are included in a number of property and equipment leases across the Company. These terms are used to maximize operational flexibility in terms of managing contracts. The majority of extension and termination options held are exercisable only by the Company and not by the respective lessor.
To optimize lease costs during the contract period, the Company sometimes provides residual value guarantees in relation to equipment leases.
Impact on the statement of financial position (increase/(decrease)) as at January 1, 2019:
| | | | | | | | | | | | |
| | | Range | |
Assets | | | | | | | | | | | | |
Right-of-use assets | | | 1,100,000 | | | | to | | | | 1,200,000 | |
Deferred income tax | | | 40,000 | | | | to | | | | 50,000 | |
| | | | | | | | | | | | |
| | | 1,140,000 | | | | | | | | 1,250,000 | |
Liabilities | | | | | | | | | | | | |
Leases | | | 1,600,000 | | | | to | | | | 1,700,000 | |
Equity | | | (460,000 | ) | | | | | | | (450,000 | ) |
| | | | | | | | | | | | |
The Company has applied IFRS 16 using the modified retrospective approach and therefore the comparative information has not been restated and continues to be reported under IAS 17 and IFRIC 4. The details of accounting policies are disclosed separately for each period.
The joint ventures Raízen Energia and Raízen Combustíveis recognized the lease liability and the right to use asset at the date of the initial application for leases previously classified as operating leases, retrospectively, with cumulative effect. These joint ventures used as a practical expedient the use of a single discount rate on the lease portfolio with similar characteristics. The initial measurement of lease liabilities andrights-of-use assets is estimated between R$ 4,000,000 and R$ 5,000,000 (R$ 2,000 to R$ 2,500 in the interest in earnings of joint ventures, respectively). There are still technical discussions that may have a significant impact on the initial effects of these jointly controlled companies, such as whether the agricultural partnership contracts are within the scope of the standard.
| 25.2 | IFRIC Interpretation 23 Uncertainty over Income Tax Treatment |
The Interpretation addresses the accounting for income taxes when tax treatments involve uncertainty that affects the application of IAS 12 and does not apply to taxes or levies outside the scope of IAS 12, nor does it specifically include requirements relating to interest and penalties associated with uncertain tax treatments.
Company is subject to examination by the tax authorities, with the five fiscal years open in general. The Company has audits in progress at various stages of completion, one of which may be completed within the next 12 months. However, December 31, 2018, the Company had no uncertainties regarding the treatment of income tax.
| 25.3 | Amendments to IFRS 9: Prepayment Features with Negative Compensation |
Under IFRS 9, a debt instrument can be measured at amortized cost or at fair value through other comprehensive income, provided that the contractual cash flows are ‘solely payments of principal and interest on the principal amount outstanding’ (the SPPI criterion) and the instrument is held within the appropriate business model for that classification. The amendments to IFRS 9 clarify that a financial asset passes the SPPI criterion regardless of the event or circumstance that causes the early termination of the contract and irrespective of which party pays or receives reasonable compensation for the early termination of the contract.
The amendments should be applied retrospectively and are effective from January 1, 2019. These amendments have no impact on the consolidated financial statements of the Company.
F-88
Cosan Limited
Notes to the consolidated financial statements
(In thousands of Brazilian Reais—R$ unless otherwise stated)
| 25.4 | Amendments to IAS 19: Plan Amendment, Curtailment or Settlement |
The amendments to IAS 19 address the accounting when a plan amendment, curtailment or settlement occurs during a reporting period. The amendments specify that when a plan amendment, curtailment or settlement occurs during the annual reporting period, an entity is required to:
| | i. | Determine current service cost for the remainder of the period after the plan amendment, curtailment or settlement, using the actuarial assumptions used to remeasure the net defined benefit liability (asset) reflecting the benefits offered under the plan and the plan assets after that event; and |
| | ii. | Determine net interest for the remainder of the period after the plan amendment, curtailment or settlement using: the net defined benefit liability (asset) reflecting the benefits offered under the plan and the plan assets after that event; and the discount rate used to remeasure that net defined benefit liability (asset). |
The amendments also clarify that an entity first determines any past service cost, or a gain or loss on settlement, without considering the effect of the asset ceiling. This amount is recognized in profit or loss. An entity then determines the effect of the asset ceiling after the plan amendment, curtailment or settlement. Any change in that effect, excluding amounts included in the net interest, is recognized in other comprehensive income.
The amendments apply to plan amendments, curtailments, or settlements occurring on or after the beginning of the first annual reporting period that begins on or after January 1, 2019. These amendments will apply only to any future amendments, curtailments, or settlements of the Company.
| 25.5 | Annual Improvements to IFRS Standards 2015-2017 Cycle |
The amendments clarify that the income tax consequences of dividends are linked more directly to past transactions or events that generated distributable profits than to distributions to owners. Therefore, the Company recognizes the income tax consequences of dividends in profit or loss, other comprehensive income or equity according to where the entity originally recognized those past transactions or events.
The Company applies those amendments for annual reporting periods beginning on or after January 1, 2019. When the Company first applies those amendments, it applies them to the income tax consequences of dividends recognized on or after the beginning of the earliest comparative period. Since the Company’s current practice is in line with these amendments, the Company does not expect any effect on its consolidated financial statements.
The amendments clarify that an entity treats as part of general borrowings any borrowing originally made to develop a qualifying asset when substantially all the activities necessary to prepare that asset for its intended use or sale are complete.
The Company applies those amendments for annual reporting periods beginning on or after January 1, 2019. Since the Company’s current practice is in line with these amendments, the Company does not expect any effect on its consolidated financial statements.
| 25.6 | IFRS 17 Insurance Contracts |
This standard introduces a new model for accounting for insurance contracts. IFRS 17 is effective for reporting periods beginning on or after January 1, 2021, with comparative figures required. Based on preliminary work we estimate the impact will be immaterial, we are in the process of reviewing our existing arrangements to determine the impact on adoption.
No other new accounting pronouncement issued or in force during the fiscal year had or should have a material impact on the financial statements.
F-89