Table of Contents
UNITED STATES
SECURITIES AND EXCHANGE COMMISSION
Washington D.C. 20549
Form 6-K
REPORT OF FOREIGN ISSUER
PURSUANT TO RULE 13a-16 OR 15d-16
OF THE SECURITIES EXCHANGE ACT OF 1934
For the month of November 2015
Commission File Number: 001-33623
WuXi PharmaTech (Cayman) Inc.
288 Fute Zhong Road, Waigaoqiao Free Trade Zone
Shanghai 200131
People’s Republic of China
(Address of principal executive office)
Indicate by check mark whether the registrant files or will file annual reports under cover Form 20-F or Form 40-F.
Form 20-F x Form 40-F ¨
Indicate by check mark if the registrant is submitting the Form 6-K in paper as permitted by Regulation S-T Rule 101(b)(1): ¨
Indicate by check mark if the registrant is submitting the Form 6-K in paper as permitted by Regulation S-T Rule 101(b)(7): ¨
Indicate by check mark whether by furnishing the information contained in this Form, the registrant is also thereby furnishing the information to the Commission pursuant to Rule 12g3-2(b) under the Securities Exchange Act of 1934. Yes ¨ No x
If “Yes” is marked, indicate below the file number assigned to the registrant in connection with Rule 12g3-2(b):82-N/A
Table of Contents
Form 6-K
TABLE OF CONTENTS
| Page | ||||
| 3 | ||||
| 4 | ||||
Exhibit 99.2 — Investor Presentation, dated November 3, 2015 | 12 | |||
2
Table of Contents
Pursuant to the requirements of the Securities Exchange Act of 1934, the registrant has duly caused this report to be signed on its behalf by the undersigned, thereunto duly authorized.
| WuXi PharmaTech (Cayman) Inc. | ||
| By: | /s/ Edward Hu | |
| Name: | Edward Hu | |
| Title: | Chief Financial Officer | |
Date: November 3, 2015
3
Table of Contents
WuXi PharmaTech Announces Third-Quarter 2015 Results
SHANGHAI, November 3, 2015 /PRNewswire/ — WuXi PharmaTech (Cayman) Inc. (“WuXi” or the “Company”) (NYSE: WX) announces the following financial information for the third quarter ended September 30, 2015.
Third-Quarter 2015 Highlights
| • | Net Revenues Increased 23.1% Year Over Year to $213.6 Million |
| • | GAAP Diluted Earnings Per ADS Declined 53.7% Year Over Year to $0.21 |
| • | Non-GAAP Diluted Earnings Per ADS Attributable to WuXi Shareholders Decreased 41.8% Year Over Year to $0.31, Reflecting Exclusion of Share-Based Compensation of $0.09, Amortization of Acquired Intangible Assets of $0.02, and Deferred Tax Impact Related to Acquired Intangible Assets of ($.01) |
| • | Mark-to-Market Losses on Foreign-Exchange Forward Contracts of $7.3 Million and Realized Losses on Settled Foreign-Exchange Forward Contracts of $1.6 Million Resulted from RMB Depreciation Against the U.S. Dollar in the Quarter |
Third-Quarter 2015 GAAP Results
Third-quarter 2015 net revenues increased 23.1% year over year to $213.6 million. Laboratory Services revenue grew 18.0%, driven by our comprehensive and integrated drug discovery and development services. Revenue growth of 19.6% in Small-Molecule Manufacturing Services resulted from strong demand in both research manufacturing and commercial manufacturing. Biologics Services revenue had strong growth of 66.1% year over year from both development and manufacturing. Revenue growth of 34.8% in New Businesses and Other related mainly to the significant revenue increase in clinical site management services in China, offset by slower than expected growth in the emerging new businesses such as genomics, China healthcare initiatives, and e-commerce.
Third-quarter 2015 GAAP gross profit increased 14.7% year over year to $75.9 million due to 23.1% revenue growth, partially offset by increased labor costs in China and investments in new businesses. Gross margin decreased year over year to 35.5% from 38.1%. Gross margin in Laboratory Services decreased year over year to 38.3% from 41.2% due to increased labor costs in China and investments in new businesses. Gross margin in Small-Molecule Manufacturing Services was unchanged at 34.9%. The increase in gross margin in Biologics Services year over year to 32.7% from 28.6% was due to efficiencies of scale. Gross margin in New Businesses and Other decreased year over year to (1.7%) from 28.3% mainly as a result of investments in genomics and bioinformatics.
Third-quarter 2015 GAAP operating income decreased 7.0% year over year to $25.8 million mainly due to investments in new businesses, including increased selling and marketing, general and administrative, and research and development expenses and transaction expenses related to the proposed privatization, partially offset by the 14.7% increase in gross profit. Operating margin declined to 12.1% from 16.0% due to these increased operating expenses.
Third-quarter 2015 GAAP net income decreased 49.8% year over year to $16.1 million mainly due to an unfavorable change of $9.4 million in mark-to-market gains and losses on foreign-exchange forward contracts (losses of $7.3 million in the third quarter of 2015 compared to gains of $2.1 million in the third quarter of 2014), an adverse change of $3.1 million in realized gains and losses on settled foreign-exchange forward contracts (losses of $1.6 million in the third quarter of 2015 compared to gains of $1.5 million in the third quarter of 2014), the 7.0% year-over-year decrease in operating income, larger equity-method investment losses from our joint ventures with PRA and MedImmune and other equity-method investments, and higher interest expense due to higher loan balances needed to support increased investment.
4
Table of Contents
Third-quarter 2015 GAAP net income attributable to WuXi shareholders decreased 52.8% year over year to $15.1 million mainly due to the 49.8% year-over-year decrease in net income and net income attributable to non-controlling interests of $1.0 million in the third quarter of 2015.
Third-quarter 2015 GAAP diluted earnings per ADS attributable to WuXi shareholders decreased 53.7% year over year to $0.21 due to the 52.8% decrease in net income attributable to WuXi shareholders and a higher number of outstanding ADSs as a result of share issuances relating to the XenoBiotic Laboratories acquisition and vesting of restricted stock units. Third-quarter 2015 GAAP comprehensive income/loss attributable to WuXi shareholders was a $9.9 million loss versus income of $41.0 million in the third quarter of 2014 mainly due to the 52.8% decrease in net income and unfavorable changes in currency translation adjustments, unrealized gains and losses on available-for-sale securities, and cash flow hedges, net of tax.
Third-Quarter 2015 Non-GAAP Results
Non-GAAP financial results exclude the impact of share-based compensation expenses and the amortization of acquired intangible assets and the associated deferred tax impact.
Third-quarter 2015 non-GAAP gross profit increased 17.3% year over year to $79.6 million due to 23.1% revenue growth, partially offset by increased labor costs in China and investments in new businesses. Non-GAAP gross margin decreased year over year to 37.2% from 39.1% for the same reasons.
Third-quarter 2015 non-GAAP operating income was substantially unchanged at $33.9 million due to investments in new businesses, including increased selling and marketing, general and administrative, and research and development expenses and transaction expenses related to the proposed privatization, substantially offset by the 17.3% increase in non-GAAP gross profit. Non-GAAP operating margin decreased to 15.9% from 19.5% due to higher operating expenses.
Third-quarter 2015 non-GAAP net income decreased 38.0% year over year to $23.6 million mainly due to an unfavorable change of $9.4 million in mark-to-market gains and losses on foreign-exchange forward contracts (losses of $7.3 million in the third quarter of 2015 compared to gains of $2.1 million in the third quarter of 2014), an adverse change in realized gains and losses on settled foreign-exchange forward contracts (losses of $1.6 million in the third quarter of 2015 compared to gains of $1.5 million in the third quarter of 2014), larger equity-method investment losses from our joint ventures with PRA and MedImmune and other equity-method investments, and higher interest expense due to higher loan balances needed to support increased investment.
Third-quarter 2015 non-GAAP net income attributable to WuXi shareholders decreased 40.7% year over year to $22.6 million mainly due to the 38.0% year-over-year decrease in net income and net income attributable to noncontrolling interests of $1.0 million in the third quarter of 2015.
Third-quarter 2015 non-GAAP diluted earnings per ADS attributable to WuXi shareholders decreased 41.8% year over year to $0.31 due to the 40.7% decrease in net income attributable to WuXi shareholders and a higher number of outstanding ADSs as a result of share issuances relating to the XenoBiotic Laboratories acquisition and vesting of restricted stock units.
5
Table of Contents
Third-Quarter 2015 Results Preliminary; Upcoming WuXi Extraordinary General Meeting
The third-quarter 2015 results contained in this press release are preliminary, unaudited and unreviewed and are being released ahead of the upcoming extraordinary general meeting (or “EGM”) of the WuXi shareholders. The EGM is scheduled to be held on November 25, 2015 at 10:00 a.m. Shanghai time at the executive offices of the Company located at 288 Fute Zhong Road, China (Shanghai) Pilot Free Trade Zone, Shanghai, 200131, People’s Republic of China and is being convened to consider and vote on, among other matters, the proposal to authorize and approve the previously announced agreement and plan of merger dated as of August 14, 2015 and amended on October 20, 2015, among the Company, New WuXi Life Science Limited and WuXi Merger Limited, and the transactions contemplated thereby (the “Merger Transactions”). The related transaction statement on Schedule 13E-3 and the proxy statement (the “Proxy Statement”) attached as Exhibit (a)-(1) thereto were filed with the U.S. Securities and Exchange Commission (the “SEC”) on October 20, 2015. Investors, shareholders and holders of American Depositary Shares of WuXi (“ADSs”, each representing eight ordinary shares of WuXi) are urged to read carefully and in their entirety these materials and other materials filed with or furnished to the SEC when they become available, as they contain important information about the company, the proposed merger and related matters. The Proxy Statement was mailed to the Company’s ADS holders on or about October 26, 2015 and to the Company’s shareholders on or about November 2, 2015. The Special Committee of the Board, comprised of independent directors, that reviewed the transaction recommends that stockholders approve the transaction.
In light of the upcoming EGM and possible closing of the Merger Transactions shortly thereafter, WuXi does not intend to host a conference call to discuss the financial information contained in this press release, nor is the Company providing an update to its financial guidance.
6
Table of Contents
WUXI PHARMATECH (CAYMAN) INC.
UNAUDITED CONSOLIDATED BALANCE SHEETS
(in thousands of U.S. dollars, except ordinary share, ADS and par value data)
| September 30, 2015 | December 31, 2014 | |||||||
Assets: | ||||||||
Current assets: | ||||||||
Cash and cash equivalents | 155,241 | 211,456 | ||||||
Restricted cash | 256 | 793 | ||||||
Short-term investments | 201,992 | 223,533 | ||||||
Accounts receivable, net | 193,718 | 162,942 | ||||||
Amount due from related parties | 6,912 | 4,397 | ||||||
Inventories | 62,766 | 48,546 | ||||||
Prepaid expenses and other current assets | 47,462 | 31,990 | ||||||
|
|
|
| |||||
Total current assets | 668,347 | 683,657 | ||||||
|
|
|
| |||||
Non-current assets: | ||||||||
Goodwill | 86,758 | 53,619 | ||||||
Property, plant and equipment, net | 408,561 | 351,688 | ||||||
Long-term investments | 111,060 | 49,037 | ||||||
Intangible assets, net | 54,413 | 23,020 | ||||||
Land use rights | 13,570 | 14,120 | ||||||
Deferred tax assets | 6,143 | 1,417 | ||||||
Other non-current assets | 5,304 | 5,068 | ||||||
|
|
|
| |||||
Total non-current assets | 685,809 | 497,969 | ||||||
|
|
|
| |||||
Total assets | 1,354,156 | 1,181,626 | ||||||
|
|
|
| |||||
Liabilities and equity: | ||||||||
Current liabilities: | ||||||||
Short-term and current portion of long-term debt | 75,965 | 199,719 | ||||||
Accounts payable | 62,928 | 58,466 | ||||||
Amount due to related parties | 636 | 275 | ||||||
Accrued expenses | 53,540 | 43,454 | ||||||
Deferred revenue | 39,587 | 27,669 | ||||||
Advanced subsidies | 14,548 | 12,106 | ||||||
Other taxes payable | 3,036 | 2,299 | ||||||
Other current liabilities | 33,266 | 29,787 | ||||||
|
|
|
| |||||
Total current liabilities | 283,506 | 373,775 | ||||||
|
|
|
| |||||
Non-current liabilities: | ||||||||
Long-term debt, excluding current portion | 113,806 | 13,987 | ||||||
Advanced subsidies | 2,735 | 2,286 | ||||||
Other non-current liabilities | 25,802 | 13,724 | ||||||
|
|
|
| |||||
Total non-current liabilities | 142,343 | 29,997 | ||||||
|
|
|
| |||||
Total liabilities | 425,849 | 403,772 | ||||||
|
|
|
| |||||
Equity: | ||||||||
Ordinary shares ($0.02 par value, 5,002,550,000 authorized, 561,159,373 and 568,019,232 issued and outstanding as of December 31, 2014 and September 30, 2015, respectively) | 11,360 | 11,223 | ||||||
Additional paid-in capital | 395,218 | 295,308 | ||||||
Retained earnings | 467,088 | 415,329 | ||||||
Accumulated other comprehensive income | 29,492 | 55,994 | ||||||
|
|
|
| |||||
Equity attributable to WuXi shareholders | 903,158 | 777,854 | ||||||
|
|
|
| |||||
Noncontrolling interests | 25,149 | — | ||||||
|
|
|
| |||||
Total shareholders’ equity | 928,307 | 777,854 | ||||||
|
|
|
| |||||
Total liabilities and equity | 1,354,156 | 1,181,626 | ||||||
|
|
|
| |||||
7
Table of Contents
WUXI PHARMATECH (CAYMAN) INC.
UNAUDITED CONDENSED CONSOLIDATED STATEMENTS OF COMPREHENSIVE INCOME
(In thousands of U.S. dollars, except ADS data and per ADS data)
| Three Months Ended September 30, | Nine Months Ended September 30, | |||||||||||||||||||||||
| 2015 | 2014 | % Change | 2015 | 2014 | % Change | |||||||||||||||||||
Net revenues: | ||||||||||||||||||||||||
Laboratory services | 129,357 | 109,597 | 18.0 | % | 367,109 | 309,126 | 18.8 | % | ||||||||||||||||
Small-molecule manufacturing services | 52,527 | 43,901 | 19.6 | % | 143,969 | 125,311 | 14.9 | % | ||||||||||||||||
Biologics services | 25,022 | 15,062 | 66.1 | % | 57,781 | 35,680 | 61.9 | % | ||||||||||||||||
New business and other | 6,736 | 4,998 | 34.8 | % | 18,963 | 13,512 | 40.3 | % | ||||||||||||||||
|
|
|
|
|
|
|
|
|
|
|
| |||||||||||||
Total net revenues | 213,642 | 173,558 | 23.1 | % | 587,822 | 483,629 | 21.5 | % | ||||||||||||||||
|
|
|
|
|
|
|
|
|
|
|
| |||||||||||||
Cost of revenues: | ||||||||||||||||||||||||
Laboratory services | (79,866 | ) | (64,462 | ) | 23.9 | % | (228,267 | ) | (183,264 | ) | 24.6 | % | ||||||||||||
Small-molecule manufacturing services | (34,199 | ) | (28,565 | ) | 19.7 | % | (92,052 | ) | (83,691 | ) | 10.0 | % | ||||||||||||
Biologics services | (16,836 | ) | (10,756 | ) | 56.5 | % | (42,941 | ) | (25,474 | ) | 68.6 | % | ||||||||||||
New business and others | (6,852 | ) | (3,585 | ) | 91.1 | % | (19,159 | ) | (9,845 | ) | 94.6 | % | ||||||||||||
|
|
|
|
|
|
|
|
|
|
|
| |||||||||||||
Total cost of revenues | (137,753 | ) | (107,368 | ) | 28.3 | % | (382,419 | ) | (302,274 | ) | 26.5 | % | ||||||||||||
|
|
|
|
|
|
|
|
|
|
|
| |||||||||||||
Gross profit: | ||||||||||||||||||||||||
Laboratory services | 49,491 | 45,135 | 9.7 | % | 138,842 | 125,862 | 10.3 | % | ||||||||||||||||
Small-molecule manufacturing services | 18,328 | 15,336 | 19.5 | % | 51,917 | 41,620 | 24.7 | % | ||||||||||||||||
Biologics services | 8,186 | 4,306 | 90.1 | % | 14,840 | 10,206 | 45.4 | % | ||||||||||||||||
New business and other | (116 | ) | 1,413 | NA | (196 | ) | 3,667 | NA | ||||||||||||||||
|
|
|
|
|
|
|
|
|
|
|
| |||||||||||||
Total gross profit | 75,889 | 66,190 | 14.7 | % | 205,403 | 181,355 | 13.3 | % | ||||||||||||||||
|
|
|
|
|
|
|
|
|
|
|
| |||||||||||||
Operating expenses: | ||||||||||||||||||||||||
Selling and marketing expenses | (7,510 | ) | (5,944 | ) | 26.3 | % | (21,198 | ) | (15,485 | ) | 36.9 | % | ||||||||||||
General and administrative expenses | (35,531 | ) | (26,769 | ) | 32.7 | % | (103,260 | ) | (71,769 | ) | 43.9 | % | ||||||||||||
Research and development expenses | (7,027 | ) | (5,726 | ) | 22.7 | % | (21,079 | ) | (14,935 | ) | 41.1 | % | ||||||||||||
|
|
|
|
|
|
|
|
|
|
|
| |||||||||||||
Total operating expenses | (50,068 | ) | (38,439 | ) | 30.3 | % | (145,537 | ) | (102,189 | ) | 42.4 | % | ||||||||||||
|
|
|
|
|
|
|
|
|
|
|
| |||||||||||||
Operating income | 25,821 | 27,751 | (7.0 | %) | 59,866 | 79,166 | (24.4 | %) | ||||||||||||||||
|
|
|
|
|
|
|
|
|
|
|
| |||||||||||||
Other income (expenses), net: | ||||||||||||||||||||||||
Loss from equity-method investments | (1,588 | ) | (743 | ) | 113.7 | % | (3,945 | ) | (2,386 | ) | 65.3 | % | ||||||||||||
Other income (expenses), net | (6,430 | ) | 8,303 | NA | 1,046 | 7,483 | (86.0 | %) | ||||||||||||||||
Interest income (expenses), net | 2,717 | 3,946 | (31.1 | %) | 8,452 | 12,695 | (33.4 | %) | ||||||||||||||||
|
|
|
|
|
|
|
|
|
|
|
| |||||||||||||
Total other income (expenses), net | (5,301 | ) | 11,506 | NA | 5,553 | 17,792 | (68.8 | %) | ||||||||||||||||
|
|
|
|
|
|
|
|
|
|
|
| |||||||||||||
Income before income taxes | 20,520 | 39,257 | (47.7 | %) | 65,419 | 96,958 | (32.5 | %) | ||||||||||||||||
Income tax expense | (4,452 | ) | (7,257 | ) | (38.7 | %) | (12,120 | ) | (17,800 | ) | (31.9 | %) | ||||||||||||
|
|
|
|
|
|
|
|
|
|
|
| |||||||||||||
Net income | 16,068 | 32,000 | (49.8 | %) | 53,299 | 79,158 | (32.7 | %) | ||||||||||||||||
Less: Net income attr. to noncontrolling interests | (963 | ) | — | NA | (1,539 | ) | — | NA | ||||||||||||||||
|
|
|
|
|
|
|
|
|
|
|
| |||||||||||||
Net income attributable to WuXi shareholders | 15,105 | 32,000 | (52.8 | %) | 51,760 | 79,158 | (34.6 | %) | ||||||||||||||||
|
|
|
|
|
|
|
|
|
|
|
| |||||||||||||
Other comprehensive income: | ||||||||||||||||||||||||
Currency translation adjustments | (20,907 | ) | 7,440 | NA | (21,654 | ) | (3,718 | ) | 482.4 | % | ||||||||||||||
Unrealized gains (losses) on available-for-sale securities | (756 | ) | 2,181 | NA | (3,506 | ) | 2,106 | NA | ||||||||||||||||
Cash flow hedge, net of tax | (3,217 | ) | (632 | ) | 409.0 | % | (1,343 | ) | (632 | ) | 112.5 | % | ||||||||||||
|
|
|
|
|
|
|
|
|
|
|
| |||||||||||||
Other comprehensive income (loss) | (24,880 | ) | 8,989 | NA | (26,503 | ) | (2,244 | ) | * | |||||||||||||||
Less: Other comprehensive income (loss) attr. to noncontrolling interests | (103 | ) | — | NA | (108 | ) | — | NA | ||||||||||||||||
|
|
|
|
|
|
|
|
|
|
|
| |||||||||||||
Other comprehensive income (loss) attr. to WuXi shareholders | (24,983 | ) | 8,989 | NA | (26,611 | ) | (2,244 | ) | * | |||||||||||||||
|
|
|
|
|
|
|
|
|
|
|
| |||||||||||||
Comprehensive income attributable to WuXi shareholders | (9,878 | ) | 40,989 | NA | 25,149 | 76,914 | (67.3 | %) | ||||||||||||||||
|
|
|
|
|
|
|
|
|
|
|
| |||||||||||||
Basic net earnings per ADS | 0.21 | 0.46 | (53.7 | %) | 0.73 | 1.12 | (34.7 | %) | ||||||||||||||||
Diluted net earnings per ADS | 0.21 | 0.45 | (53.7 | %) | 0.72 | 1.10 | (34.7 | %) | ||||||||||||||||
|
|
|
|
|
|
|
|
|
|
|
| |||||||||||||
Weighted average ADS outstanding—basic | 70,974,295 | 69,573,192 | 2.0 | % | 70,648,818 | 70,563,939 | 0.1 | % | ||||||||||||||||
Weighted average ADS outstanding—diluted | 72,473,753 | 71,091,504 | 1.9 | % | 72,196,107 | 72,127,058 | 0.1 | % | ||||||||||||||||
|
|
|
|
|
|
|
|
|
|
|
| |||||||||||||
* > 1,000%
8
Table of Contents
WUXI PHARMATECH (CAYMAN) INC.
RECONCILIATION OF GAAP TO NON-GAAP
(in thousands of U.S. dollars, except ADS data and per ADS data)
| Three Months Ended September 30, | Nine Months Ended September 30, | |||||||||||||||||||||||
| 2015 | 2014 | % Change | 2015 | 2014 | % Change | |||||||||||||||||||
GAAP gross profit | 75,889 | 66,190 | 14.7 | % | 205,403 | 181,355 | 13.3 | % | ||||||||||||||||
GAAP gross margin | 35.5 | % | 38.1 | % | 34.9 | % | 37.5 | % | ||||||||||||||||
Adjustments: | ||||||||||||||||||||||||
Share-based compensation | 2,420 | 1,597 | 51.5 | % | 6,621 | 4,283 | 54.6 | % | ||||||||||||||||
Amortization of acquired intangible assets | 1,270 | 48 | * | 3,876 | 145 | * | ||||||||||||||||||
|
|
|
|
|
|
|
|
|
|
|
| |||||||||||||
Non-GAAP gross profit | 79,579 | 67,835 | 17.3 | % | 215,900 | 185,783 | 16.2 | % | ||||||||||||||||
Non-GAAP gross margin | 37.2 | % | 39.1 | % | 36.7 | % | 38.4 | % | ||||||||||||||||
|
|
|
|
|
|
|
|
|
|
|
| |||||||||||||
GAAP operating income | 25,821 | 27,751 | (7.0 | %) | 59,866 | 79,166 | (24.4 | %) | ||||||||||||||||
GAAP operating margin | 12.1 | % | 16.0 | % | 10.2 | % | 16.4 | % | ||||||||||||||||
Adjustments: | ||||||||||||||||||||||||
Share-based compensation | 6,811 | 6,121 | 11.3 | % | 21,798 | 16,406 | 32.9 | % | ||||||||||||||||
Amortization of acquired intangible assets | 1,270 | 48 | * | 3,876 | 145 | * | ||||||||||||||||||
|
|
|
|
|
|
|
|
|
|
|
| |||||||||||||
Non-GAAP operating income | 33,902 | 33,920 | (0.1 | %) | 85,540 | 95,717 | (10.6 | %) | ||||||||||||||||
Non-GAAP operating margin | 15.9 | % | 19.5 | % | 14.6 | % | 19.8 | % | ||||||||||||||||
|
|
|
|
|
|
|
|
|
|
|
| |||||||||||||
GAAP net income | 16,068 | 32,000 | (49.8 | %) | 53,299 | 79,158 | (32.7 | %) | ||||||||||||||||
GAAP net margin | 7.5 | % | 18.4 | % | 9.1 | % | 16.4 | % | ||||||||||||||||
Adjustments: | ||||||||||||||||||||||||
Share-based compensation | 6,811 | 6,121 | 11.3 | % | 21,798 | 16,406 | 32.9 | % | ||||||||||||||||
Amortization of acquired intangible assets | 1,270 | 48 | * | 3,876 | 145 | * | ||||||||||||||||||
Deferred tax impact related to acquired intangible assets | (500 | ) | (17 | ) | * | (1,315 | ) | (50 | ) | * | ||||||||||||||
|
|
|
|
|
|
|
|
|
|
|
| |||||||||||||
Non-GAAP net income | 23,649 | 38,152 | (38.0 | %) | 77,658 | 95,659 | (18.8 | %) | ||||||||||||||||
Non-GAAP net margin | 11.1 | % | 22.0 | % | 13.2 | % | 19.8 | % | ||||||||||||||||
Less: Net income attributable to noncontrolling interests | (1,026 | ) | — | NA | (1,677 | ) | — | NA | ||||||||||||||||
|
|
|
|
|
|
|
|
|
|
|
| |||||||||||||
Income attributable to WuXi shareholders of ADS (Non-GAAP): | ||||||||||||||||||||||||
Basic | 22,623 | 38,152 | (40.7 | %) | 75,981 | 95,659 | (20.6 | %) | ||||||||||||||||
Diluted | 22,623 | 38,152 | (40.7 | %) | 75,981 | 95,659 | (20.6 | %) | ||||||||||||||||
Basic earnings per ADS (Non-GAAP) attributable to WuXi shareholders | 0.32 | 0.55 | (41.9 | %) | 1.08 | 1.36 | (20.7 | %) | ||||||||||||||||
Diluted earnings per ADS (Non-GAAP) attributable to WuXi shareholders | 0.31 | 0.54 | (41.8 | %) | 1.05 | 1.33 | (20.6 | %) | ||||||||||||||||
Weighted average ADS outstanding | 70,974,295 | 69,573,192 | 2.0 | % | 70,648,818 | 70,563,939 | 0.1 | % | ||||||||||||||||
Weighted average ADS outstanding | 72,473,753 | 71,091,504 | 1.9 | % | 72,196,107 | 72,127,058 | 0.1 | % | ||||||||||||||||
|
|
|
|
|
|
|
|
|
|
|
| |||||||||||||
| * | > 1,000% |
We have provided the above financial information on a non-GAAP basis, which excludes share-based compensation expenses and the amortization and deferred tax impact of acquired intangible assets. The non-GAAP financial measures used herein are useful for understanding and assessing underlying business performance and operating trends, and we believe that management and investors benefit from referring to these non-GAAP financial measures in assessing our financial performance and liquidity and when planning and forecasting future periods. You should not view non-GAAP results on a stand-alone basis or as a substitute for results under GAAP, or as being comparable to results reported or forecasted by other companies.
9
Table of Contents
About WuXi PharmaTech
WuXi PharmaTech is a leading open-access R&D capability and technology platform company serving the pharmaceutical, biotechnology, and medical device industries, with operations in China and the United States. As a research-driven and customer-focused company, WuXi PharmaTech provides a broad and integrated portfolio of services throughout the drug and medical device R&D process. WuXi is also building a platform to provide clinical diagnostic services directly to physicians and their patients globally. WuXi PharmaTech’s services are designed to assist its global partners in shortening the cycle and lowering the cost of drug and medical device R&D. WuXi PharmaTech’s operating subsidiaries are known as WuXi AppTec. For more information, please visit: http://www.wuxiapptec.com.
Forward-Looking Statements
This press release may contain “forward-looking statements” within the meaning of the Private Securities Litigation Reform Act of 1995. Forward-looking statements are not historical facts, but instead are predictions about future events. Although we believe that our predictions are reasonable, future events are inherently uncertain, and our forward-looking statements may turn out to be incorrect. Our forward-looking statements are subject to risks relating to, among other things, the proposed privatization transaction, our ability to control our costs and sustain revenue growth, to realize the anticipated benefits of our investments, to protect our clients’ intellectual property, to compete effectively, and to complete the expansion of our small-molecule manufacturing facilities in Changzhou and other manufacturing facilities and potential co-development and acquisition activities. Additional information about these and other relevant risks can be found in our Annual Report on Form 20-F for the year ended December 31, 2014. The forward-looking statements in this press release speak only as of the date on which they are made, and we assume no obligation to update any forward-looking statements except as required by law.
Use of Non-GAAP Financial Measures
We have provided the third-quarter 2014 and 2015 financial information on a non-GAAP basis, which excludes share-based compensation expenses and the amortization and deferred tax impact of acquired intangible assets. The non-GAAP financial measures used in this press release are useful for understanding and assessing underlying business performance and operating trends, and we believe that management and investors benefit from referring to these non-GAAP financial measures in assessing our financial performance and liquidity and when planning and forecasting future periods. We expect to continue to provide such non-GAAP financial measures on a quarterly basis using a consistent method. You should not view non-GAAP results on a stand-alone basis or as a substitute for results under GAAP, or as being comparable to results reported or forecasted by other companies.
Statement Regarding Preliminary Unaudited Financial Information
The preliminary third quarter 2015 financial information in this press release is unreviewed, unaudited and subject to adjustment. Actual results could differ, perhaps materially, following any review of our 2015 quarterly financial information. Similarly, our quarterly results are subject to adjustment in conjunction with the audit of our annual financial results by our independent auditor.
For more information, please contact:
Ronald Aldridge
LaVoieHealthScience
Tel: +1-617-374-8800 × 109
Email:ron_aldridge@wuxiapptec.com
raldridge@lavoiehealthscience.com
10
Table of Contents
Daniel H. Burch
MacKenzie Partners, Inc.
Tel: 212-929-5748 (O) 516-429-2721 (M)
Email:dburch@mackenziepartners.com
RELATED LINK:http://www.wuxiapptec.com
SOURCE: WuXi PharmaTech (Cayman) Inc.
11
Table of Contents
Investor Presentation
November 3, 2015
12
Table of Contents
Cautionary Language Concerning Forward-Looking Statements
This presentation contains certain forward-looking statements about the future performance of WuXi PharmaTech (Cayman) Inc. (the “Company” or “WuXi”), including about the financial estimates and statements as to the expected timing, completion and effects of the transactions contemplated by the previously announced agreement and plan of merger(the “Merger Agreement”) datedasofAugust14, 2015 and amended on October 20, 2015, among the Company, New WuXi Life Science Limited (“Parent”) and WuXi Merger Limited (“Merger Sub”), a wholly owned subsidiary of Parent, the plan of merger required to be filed with the Registrar of Companies of the Cayman Islands, substantially in the form attached as Annex A to the Merger Agreement, including the Merger (as defined in the Merger Agreement) .
Forward-looking statements can generally be identified by the use of forward-looking terminology such as “will,” “should,” “may,” “believes,” “expects” or similar expressions. No assurance can be given that any of the events anticipated by the forward-looking statements will transpire or occur. Accordingly, actual results may differ materially and adversely from those expressed in any forward-looking statements. Such statements are based upon the current beliefs and expectations of the management of the Company and are subject to significant risks and uncertainties outside of our control. Among the risks and uncertainties that could cause actual results to differ from those described in the forward looking statements are the following: (1) the occurrence of any event, change or other circumstances that could give rise to the termination of the Merger agreement, (2) the risk that the Company’s shareholders may not adopt the Merger Agreement, (3)risks that any of the closing conditions to the proposed Merger may not be satisfied in a timely manner, (4) risks related to disruption of management time from ongoing business operations due to the proposed Merger, (5) failure to realize the benefits expected from the proposed Merger and (6) the effect of the announcement of the proposed Merger on the ability of the Company to retain customers and retain and hire key personnel and maintain relationships with its suppliers and customers, and on its operating results and businesses generally. Discussions of additional risks and uncertainties are contained in the Company’s filings with the U.S. Securities and Exchange Commission (the “SEC”). The Company is not under any obligation, and expressly disclaim any obligation, to update, alter, or otherwise revise any forward-looking statements, whether written or oral, that may be made from time to time, whether as a result of new information, future events, or otherwise. Persons reading this communication are cautioned not to place undue reliance on these forward-looking statements which speak only as of the date hereof.
13
Table of Contents
Additional Information and Where to Find It; Participants in Solicitation
Additional Information and Where to Find It
This communication does not constitute an offer to sell or the solicitation of an offer to buy any securities or a solicitation of any vote or approval. Additional information regarding the Merger and the Merger Agreement can be found in the transaction statement on Schedule 13E-3 and the proxy statement attached as Exhibit (a)-(1) thereto (as may be amended, the “Proxy Statement”) filed with the SEC on October 20, 2015, which can be obtained, along with other filings containing information about the Company, the proposed Merger and related matters, without charge, from the SEC’s website (www.sec.gov).In addition, persons wanting to receive copies of the definitive proxy statement may direct such requests to MacKenzie Partners, Inc., the Company’s proxy solicitor, toll-free 1-800-322-2885 (or+1-212-929-5500 outside of the United States) (call collect) or via email at com . wuxi@mackenziepartners.
INVESTORS, SHAREHOLDERS ANDADS HOLDERS ARE URGED TO READ CAREFULLY ANDINTHEIR ENTIRETY THESE MATERIALS ANDOTHER MATERIALS FILED WITH OR FURNISHED TO THE SEC WHEN THEY BECOME AVAILABLE, AS THEY CONTAIN IMPORTANT INFORMATION
ABOUTTHE COMPANY, THE PROPOSED MERGER AND RELATED MATTERS.
Participants in Solicitation
The Company and certain of its directors, executive officers and other members of management and employees may, under SEC rules, be deemed to be “participants” in the solicitation of proxies from our shareholders with respect to the proposed Merger. Further information regarding persons who may be deemed participants, including any direct or indirect interests they may have, is also set forth in the definitive Proxy Statement. Information about the directors and executive officers of the Company is set forth in the Proxy Statement, which was filed with the SEC on October 20, 2015. Investors may obtain additional information regarding the interest of such participants by reading the Proxy Statement.
14
Table of Contents
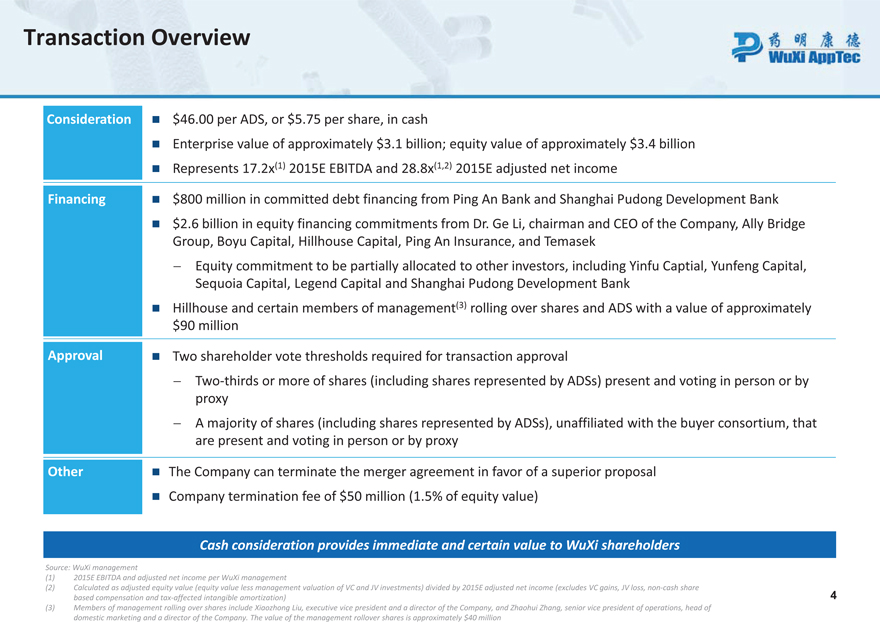
Transaction Overview
Consideration $46.00 per ADS, or $5.75 per share, in cash
Enterprise value of approximately $3.1 billion; equity value of approximately $3.4 billion Represents 17.2x (1) 2015E EBITDA and 28.8x (1,2) 2015E adjusted net income
Financing $800 million in committed debt financing from Ping An Bank and Shanghai Pudong Development Bank
$2.6 billion in equity financing commitments from Dr. Ge Li, chairman and CEO of the Company, Ally Bridge Group, Boyu Capital, Hillhouse Capital, Ping An Insurance, and Temasek
- Equity commitment to be partially allocated to other investors, including Yinfu Captial, Yunfeng Capital, Sequoia Capital, Legend Capital and Shanghai Pudong Development Bank Hillhouse and certain members of management (3) rolling over shares and ADS with a value of approximately $90 million
Approval Two shareholder vote thresholds required for transaction approval
- Two-thirds or more of shares (including shares represented by ADSs) present and voting in person or by proxy
- A majority of shares (including shares represented by ADSs), unaffiliated with the buyer consortium, that are present and voting in person or by proxy
Other The Company can terminate the merger agreement in favor of a superior proposal Company termination fee of $50 million (1.5% of equity value)
Cash consideration provides immediate and certain value to WuXi shareholders
Source: WuXi management
| (1) | 2015E EBITDA and adjusted net income per WuXi management |
(2) Calculated as adjusted equity value (equity value less management valuation of VC and JV investments) divided by 2015E adjusted net income (excludes VC gains, JV loss, non-cash share based compensation and tax-affected intangible amortization) 4
(3) Members of management rolling over shares include Xiaozhong Liu, executive vice president and a director of the Company, and Zhaohui Zhang, senior vice president of operations, head of domestic marketing and a director of the Company. The value of the management rollover shares is approximately $40 million
15
Table of Contents
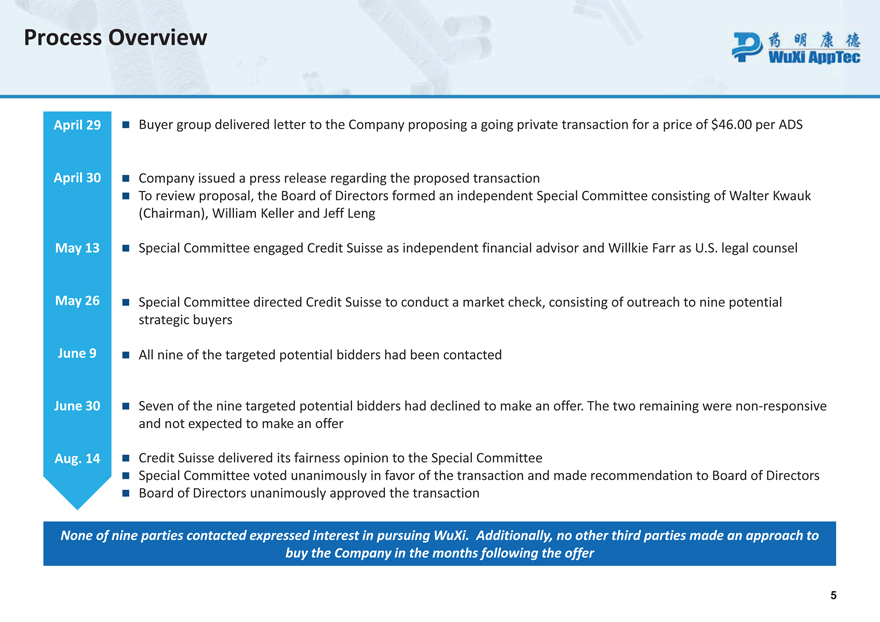
Process Overview
April 29 Buyer group delivered letter to the Company proposing a going private transaction for a price of $46.00 per ADS
April 30 Company issued a press release regarding the proposed transaction
To review proposal, the Board of Directors formed an independent Special Committee consisting of Walter Kwauk (Chairman), William Keller and Jeff Leng
May 13 Special Committee engaged Credit Suisse as independent financial advisor and Willkie Farr as U.S. legal counsel
May 26 Special Committee directed Credit Suisse to conduct a market check, consisting of outreach to nine potential strategic buyers
June 9 All nine of the targeted potential bidders had been contacted
June 30 Seven of the nine targeted potential bidders had declined to make an offer. The two remaining were non-responsive and not expected to make an offer
Aug. 14 Credit Suisse delivered its fairness opinion to the Special Committee
Special Committee voted unanimously in favor of the transaction and made recommendation to Board of Directors Board of Directors unanimously approved the transaction
None of nine parties contacted expressed interest in pursuing WuXi. Additionally, no other third parties made an approach to buy the Company in the months following the offer
| 5 |
16
Table of Contents
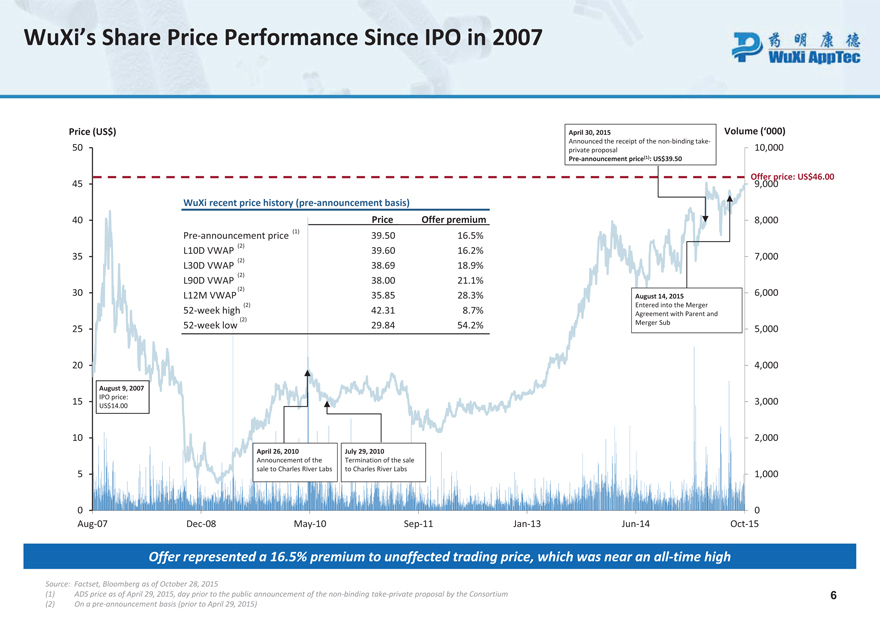
WuXi’s Share Price Performance Since IPO in 2007
Price (US$) 50 45 40 35 30 25 20 August 9, 2007 IPO price: 15 US$14.00 10 5 0 Aug-07 April 30, 2015 Volume (‘000)
Announced the receipt of the non-binding take-private proposal 10,000 Pre-announcement price(1): US$39.50
Offer 9,000 price: US$46.00 WuXi recent price history (pre-announcement basis) Price Offer premium 8,000 Pre-announcement price
(1) 39.50 16.5% (2) L10D VWAP 39.60 16.2% 7,000 (2) L30D VWAP 38.69 18.9% (2) L90D VWAP 38.00 21.1% (2) 6,000 L12M VWAP 35.85 28.3% August 14, 2015 (2) Entered into the Merger 52-week high 42.31 8.7% Agreement with Parent and (2) 52-week low 29.84 54.2% Merger Sub 5,000 4,000 3,000 2,000 April 26, 2010 July 29, 2010
Announcement of the Termination of the sale sale to Charles River Labs to Charles River Labs 1,000 0 Dec-08 May-10 Sep-11 Jan-13 Jun-14 Oct-15 Offer represented a 16.5% premium to unaffected trading price, which was near an all-time high
Source: Fact set, Bloomberg as of October 28, 2015 (1) ADS price as of April 29, 2015, day prior to the public announcement of the non-binding take-private proposal by the Consortium 6 (2) On a pre-announcement basis (prior to April 29, 2015)
17
Table of Contents
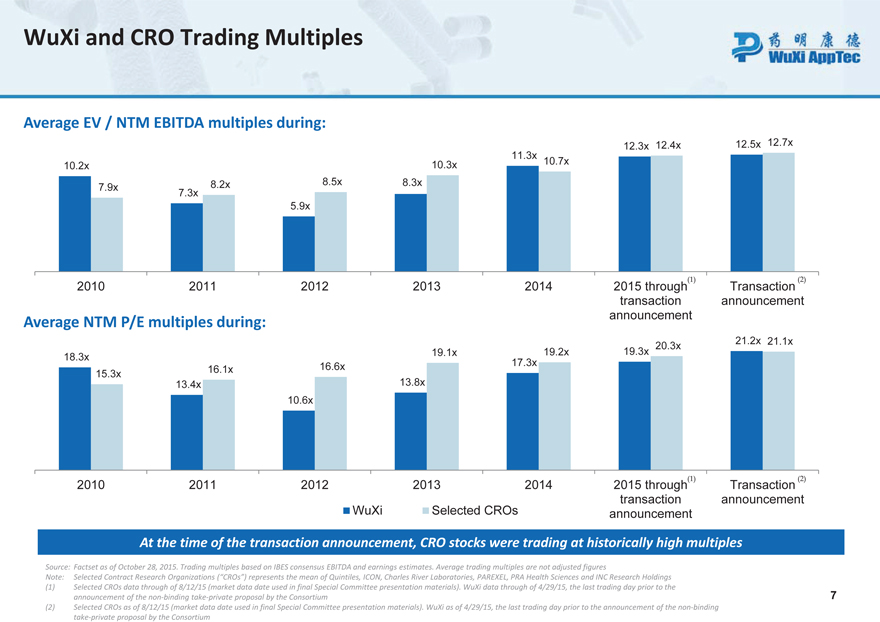
WuXi and CRO Trading Multiples
Average EV / NTM EBITDA multiples during:
12.3x 12.4x 12.5x 12.7x 11.3x 10.2x 10.3x 10.7x 8.2x 8.5x 8.3x 7.9x 7.3x 5.9x
| (1) | (2) |
2010 2011 2012 2013 2014 2015 through Transaction transaction announcement announcement
Average NTM P/E multiples during:
21.2x 21.1x 20.3x 19.1x 19.2x 19.3x 18.3x 16.6x 17.3x 15.3x 16.1x 13.4x 13.8x 10.6x
| (1) | (2) |
2010 2011 2012 2013 2014 2015 through Transaction WuXi Selected CROs transaction announcement announcement
At the time of the transaction announcement, CRO stocks were trading at historically high multiples
Source: Factset as of October 28, 2015. Trading multiples based on IBES consensus EBITDA and earnings estimates. Average trading multiples are not adjusted figures
Note: Selected Contract Research Organizations (“CROs”) represents the mean of Quintiles, ICON, Charles River Laboratories, PAREXEL, PRA Health Sciences and INC Research Holdings (1) Selected CROs data through of 8/12/15 (market data date used in final Special Committee presentation materials) . WuXi data through of 4/29/15, the last trading day prior to the announcement of the non-binding take-private proposal by the Consortium 7
(2) Selected CROs as of 8/12/15 (market data date used in final Special Committee presentation materials) . WuXi as of 4/29/15, the last trading day prior to the announcement of the non-binding take-private proposal by the Consortium
18
Table of Contents
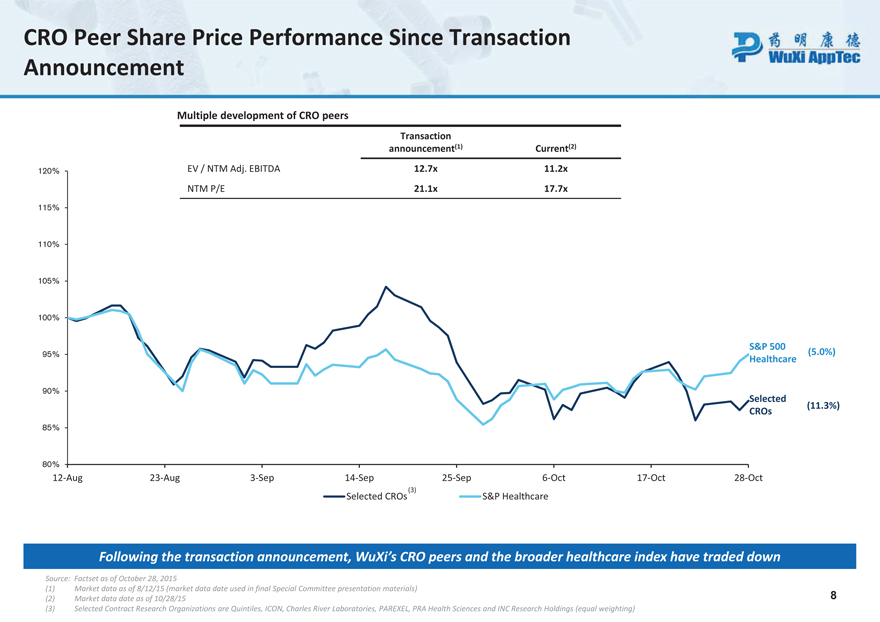
CRO Peer Share Price Performance Since Transaction Announcement
Multiple development of CRO peers
Transaction announcement (1) Current (2)
120% EV / NTM Adj. EBITDA 12.7x 11.2x
NTM P/E 21.1x 17.7x
115% 110% 105%
100%
S&P 500
95% (5.0%) Healthcare
90% Selected
(11.3%) CROs
85%
80%
12-Aug 23-Aug 3-Sep 14-Sep 25-Sep 6-Oct 17-Oct 28-Oct Selected CROs(3) S&P Healthcare
Following the transaction announcement, WuXi’s CRO peers and the broader healthcare index have traded down
Source: Factset as of October 28, 2015
| (1) | Market data as of 8/12/15 (market data date used in final Special Committee presentation materials) |
(2) Market data date as of 10/28/15 8 (3) Selected Contract Research Organizations are Quintiles, ICON, Charles River Laboratories, PAREXEL, PRA Health Sciences and INC Research Holdings (equal weighting)
19
Table of Contents
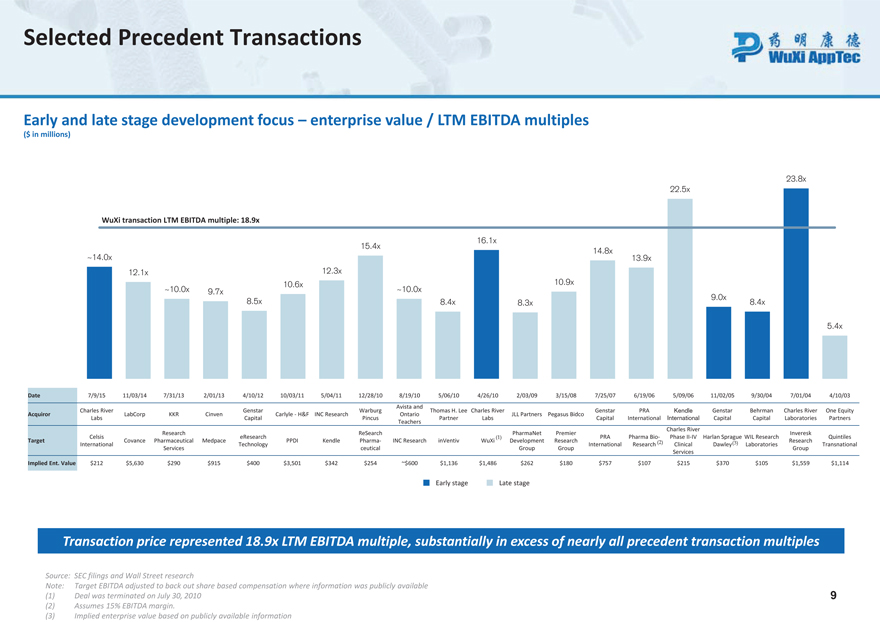
Selected Precedent Transactions Early and late stage development focus – enterprise value / LTM EBITDA multiples
($ in millions) 23.8x 22.5x WuXi transaction LTM EBITDA multiple: 18.9x 16.1x 15.4x 14.8x ~14.0x 13.9x 12.1x 12.3x 10.6x 10.9x ~10.0x 9.7x ~10.0x 9.0x 8.5x 8.4x 8.3x 8.4x 5.4x Date 7/9/15 11/03/14 7/31/13 2/01/13 4/10/12 10/03/11 5/04/11 12/28/10 8/19/10 5/06/10 4/26/10 2/03/09 3/15/08 7/25/07 6/19/06 5/09/06 11/02/05 9/30/04 7/01/04 4/10/03
Avista and Charles River Gen star Warburg Thomas H. Lee Charles River Genstar PRA Kendle Genstar Behrman Charles River One Equity Acquir or LabCorp KKR Cinven Carlyle -H&F INC Research Ontario JLL Partners Pegasus Bidco Labs Capital Pincus Partner Labs Capital International International Capital Capital Laboratories Partners Teachers Charles River Research ReSearch PharmaNet Premier Inveresk Celsis eResearch (1) PRA Pharma Bio- Phase II-IV Harlan Sprague WIL Research Quintiles Target Covance Pharmaceutical Medpace PPDI Kendle Pharma - INC Research inVentiv WuXi Development Research (2) (3) Research International Technology International Research Clinical Dawley Laboratories Transnational Services ceutical Group Group Group Services Implied Ent. Value $212 $5,630 $290 $915 $400 $3,501 $342 $254 ~$600 $1,136 $1,486 $262 $180 $757 $107 $215 $370 $105 $1,559 $1,114
Early stage Late stage Transaction price represented 18.9x LTM EBITDA multiple, substantially in excess of nearly all precedent transaction multiples Source: SEC filings and Wall Street research Note: Target EBITDA adjusted to back out share based compensation where information was publicly available (1) Deal was terminated on July 30, 2010 9 (2) Assumes 15% EBITDA margin. (3) Implied enterprise value based on publicly available information
20
Table of Contents
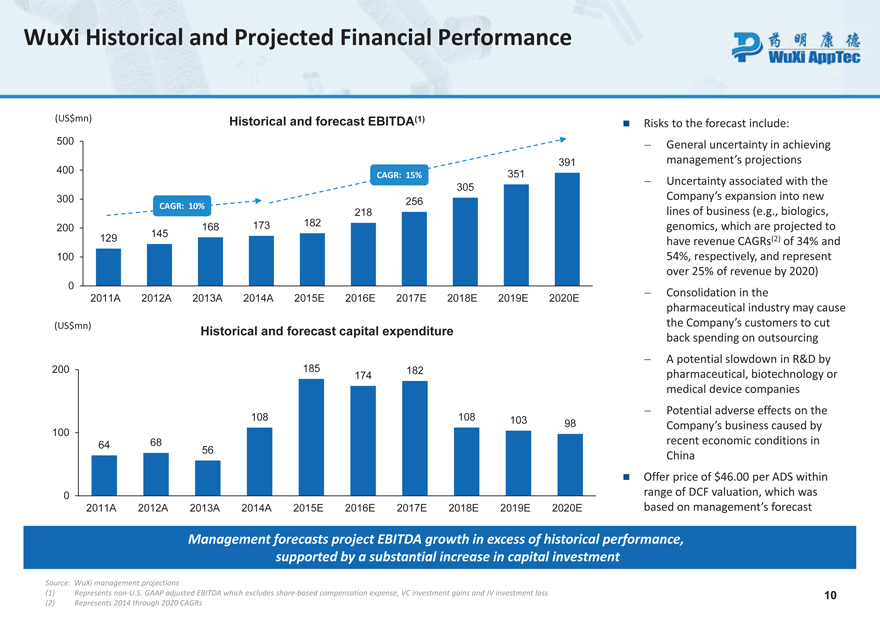
WuXi Historical and Projected Financial Performance
(US$mn) Historical and forecast EBITDA (1)
Risks to the forecast include:
500—General uncertainty in achieving 400 391 management’s projections
CAGR: 15% 351
- Uncertainty associated with the 305 Company’s expansion into new
300 CAGR: 10% 256
218 lines of business (e.g., biologics, 168 173 182 genomics, which are projected to
200
129 145 have revenue CAGRs(2) of 34% and 100 54%, respectively, and represent over 25% of revenue by 2020)
0
- Consolidation in the
2011A 2012A 2013A 2014A 2015E 2016E 2017E 2018E 2019E 2020E pharmaceutical industry may cause
(US$mn) the Company’s customers to cut
Historical and forecast capital expenditure back spending on outsourcing
185—A potential slowdown in R&D by
200 182
174 pharmaceutical, biotechnology or medical device companies
- Potential adverse effects on the
108 108 103
100 98 Company’s business caused by
64 68 56 recent economic conditions in China
Offer price of $46.00 per ADS within 0 range of DCF valuation, which was
2011A 2012A 2013A 2014A 2015E 2016E 2017E 2018E 2019E 2020E based on management’s forecast
Management forecasts project EBITDA growth in excess of historical performance, supported by a substantial increase in capital investment
Source: WuXi management projections
(1) Represents non-U.S. GAAP adjusted EBITDA which excludes share-based compensation expense, VC investment gains and JV investment loss 10 (2) Represents 2014 through 2020 CAGRs
21
Table of Contents
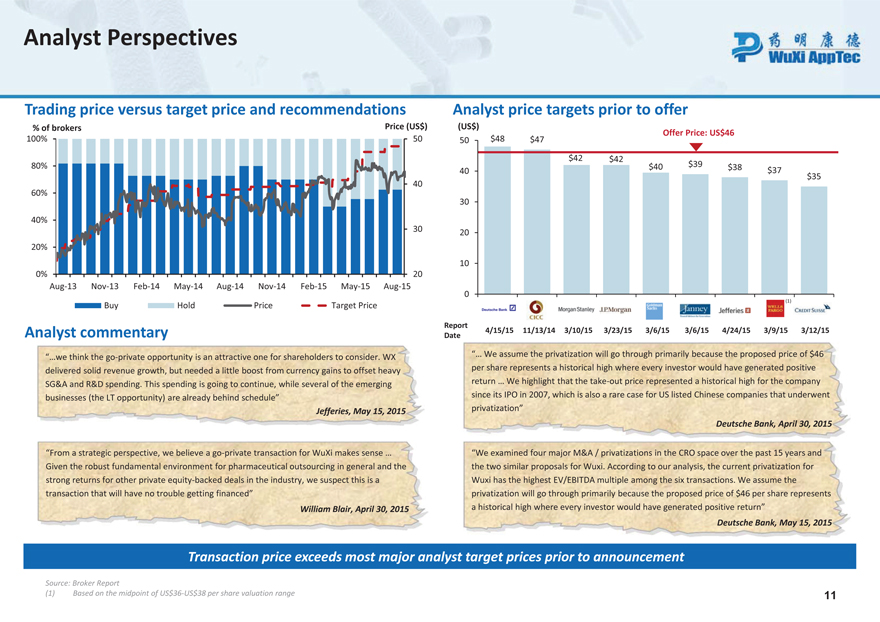
Analyst Perspectives
Trading price versus target price and recommendations
% of brokers Price (US$)
100% 50
80%
40 60%
40%
30
20%
0% 20
Aug-13 Nov-13 Feb-14 May-14 Aug-14 Nov-14 Feb-15 May-15 Aug-15
Buy Hold Price Target Price
Analyst commentary
“…we think the go-private opportunity is an attractive one for shareholders to consider. WX delivered solid revenue growth, but needed a little boost from currency gains to offset heavy SG&A and R&D spending. This spending is going to continue, while several of the emerging businesses (the LT opportunity) are already behind schedule”
Jefferies, May 15, 2015
“From a strategic perspective, we believe a go-private transaction for WuXi makes sense … Given the robust fundamental environment for pharmaceutical outsourcing in general and the strong returns for other private equity-backed deals in the industry, we suspect this is a transaction that will have no trouble getting financed”
William Blair, April 30, 2015
Analyst price targets prior to offer
(US$)
OfferPrice: US$46
50 $48 $47
$42 $42 $40 $39 $38
40 $37 $35
30 20 10
0
| (1) |
Report
4/15/15 11/13/14 3/10/15 3/23/15 3/6/15 3/6/15 4/24/15 3/9/15 3/12/15 Date
“… We assume the privatization will go through primarily because the proposed price of $46 per share represents a historical high where every investor would have generated positive return … We highlight that the take-out price represented a historical high for the company since its IPO in 2007, which is also a rare case for US listed Chinese companies that underwent privatization”
Deutsche Bank, April 30, 2015
“We examined four major M&A / privatizations in the CRO space over the past 15 years and the two similar proposals for Wuxi. According to our analysis, the current privatization for Wuxi has the highest EV/EBITDA multiple among the six transactions. We assume the privatization will go through primarily because the proposed price of $46 per share represents a historical high where every investor would have generated positive return”
Deutsche Bank, May 15, 2015
Transaction price exceeds most major analyst target prices prior to announcement
Source: Broker Report
| (1) | Based on the midpoint of US$36-US$38 per share valuation range 11 |
22
Table of Contents
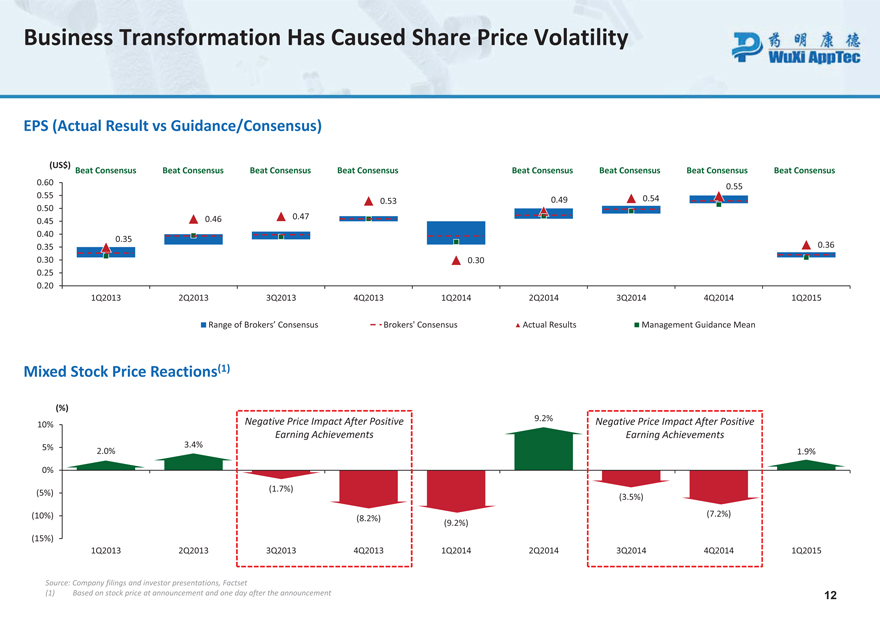
Business Transformation Has Caused Share Price Volatility
EPS (Actual Result vs Guidance/Consensus)
(US$)
Beat Consensus Beat Consensus Beat Consensus Beat Consensus Beat Consensus Beat Consensus Beat Consensus Beat Consensus
0.60
0.55 0.55 0.54 0.53 0.49 0.50 0.46 0.47 0.45 0.40 0.35
0.35 0.36 0.30 0.30 0.25 0.20 1Q2013 2Q2013 3Q2013 4Q2013 1Q2014 2Q2014 3Q2014 4Q2014 1Q2015
Range of Brokers’ Consensus Brokers’ Consensus Actual Results Management Guidance Mean
Mixed Stock Price Reactions (1)
(%)
Negative Price Impact After Positive 9.2% Negative Price Impact After Positive
10%
Earning Achievements Earning Achievements
5% 3.4%
2.0% 1.9%
0%
(1.7%) (5%)
(3.5%)
(10%) (7.2%) (8.2%) (9.2%) (15%)
1Q2013 2Q2013 3Q2013 4Q2013 1Q2014 2Q2014 3Q2014 4Q2014 1Q2015
Source: Company filings and investor presentations, Factset
| (1) | Based on stock price at announcement and one day after the announcement 12 |
23
Table of Contents
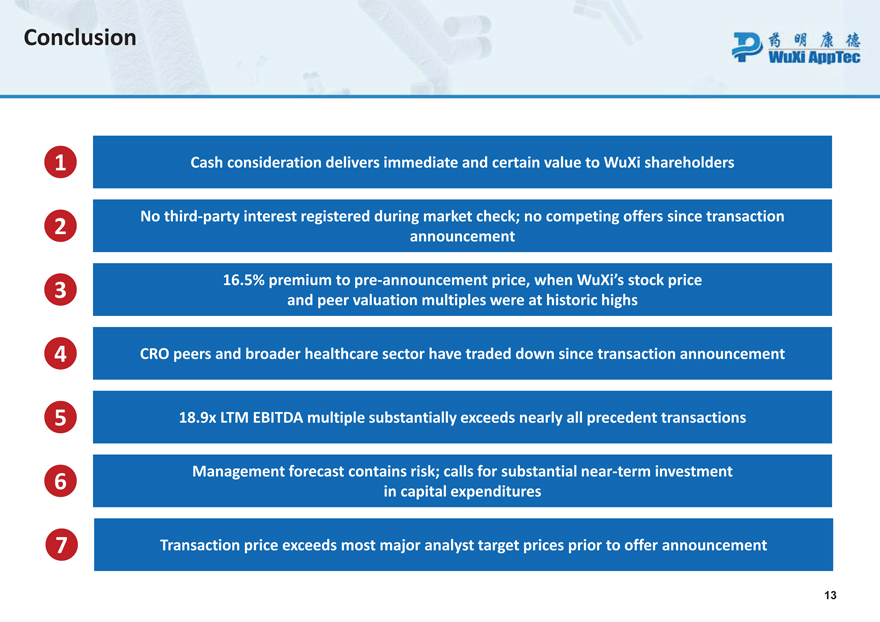
Conclusion 1 Cash consideration delivers immediate and certain value to WuXi shareholders No third-party interest registered during market check; no competing offers since transaction 2 announcement 16.5% premium to pre-announcement price, when WuXi’sstock price 3 and peer valuation multiples were at historic highs 4 CRO peers and broader healthcare sector have traded down since transaction announcement 5 18.9x LTM EBITDA multiple substantially exceeds nearly all precedent transactions Management forecast contains risk; calls for substantial near-term investment 6 in capital expenditures 7 Transaction price exceeds most major analyst target prices prior to offer announcement 13
24
Table of Contents
Appendix
25
Table of Contents
Composition of the Special Committee
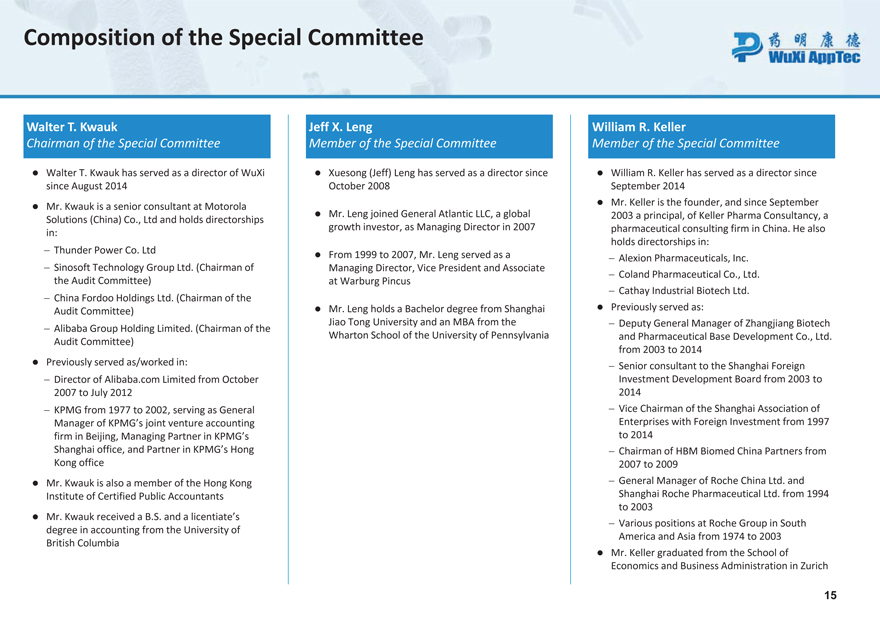
Walter T. Kwauk
Chairman of the Special Committee
- Walter T. Kwauk has served as a director of WuXi since August 2014
- Mr. Kwauk is a senior consultant at Motorola Solutions (China) Co., Ltd and holds directorships in:
- Thunder Power Co. Ltd
- Sinosoft Technology Group Ltd. (Chairman of the Audit Committee)
- China Fordoo Holdings Ltd. (Chairman of the Audit Committee)
- Alibaba Group Holding Limited. (Chairman of the Audit Committee)
- Previously served as/worked in:
- Director of Alibaba. com Limited from October 2007 to July 2012
- KPMG from 1977 to 2002, serving as General Manager of KPMG’s joint venture accounting firm in Beijing, Managing Partner in KPMG’s Shanghai office, and Partner in KPMG’s Hong Kong office
- Mr. Kwaukis also a member of the Hong Kong Institute of Certified Public Accountants
- Mr. Kwauk received a B.S. and a licentiate’s degree in accounting from the University of British Columbia
Jeff X. Leng
Member of the Special Committee
- Xuesong (Jeff) Lenghas served as a director since October 2008
- Mr. Lengjoined General Atlantic LLC, a global growth investor, as Managing Director in 2007
- From 1999 to 2007, Mr. Lengserved as a Managing Director, Vice President and Associate at Warburg Pincus
- Mr. Lengholds a Bachelor degree from Shanghai Jiao Tong University and an MBA from the Wharton School of the University of Pennsylvania
William R. Keller
Member of the Special Committee
- William R. Keller has served as a director since September 2014- Mr. Keller is the founder, and since September 2003 a principal, of Keller Pharma Consultancy, a pharmaceutical consulting firm in China. He also holds directorships in:
- Alexion Pharmaceuticals, Inc.
- Coland Pharmaceutical Co., Ltd.
- Cathay Industrial Biotech Ltd.
- Previously served as:
- Deputy General Manager of Zhangjiang Biotech and Pharmaceutical Base Development Co., Ltd. from 2003 to 2014
- Senior consultant to the Shanghai Foreign Investment Development Board from 2003 to 2014
- Vice Chairman of the Shanghai Association of Enterprises with Foreign Investment from 1997 to 2014
- Chairman of HBM Biomed China Partners from 2007 to 2009
- General Manager of Roche China Ltd. and Shanghai Roche Pharmaceutical Ltd. from 1994 to 2003
- Various positions at Roche Group in South America and Asia from 1974 to 2003- Mr. Keller graduated from the School of Economics and Business Administration in Zurich
15
26