 Visa Inc. Fiscal Third Quarter 2008 Financial Results July 30, 2008 Exhibit 99.2 |
 2 Fiscal Q3 2008 Earnings Results Safe Harbor Reminder • The following materials and management’s discussion of them may contain “forward- looking statements” within the meaning of Section 27A of the Securities Act of 1933, as amended, and Section 21E of the Securities Exchange Act of 1934, as amended. These statements can be identified by the terms “anticipate,” “believe,” “continue,” “could,” “estimate,” “expect,” “intend,” “may,” “plan,” “potential,” “predict,” “project,” “should,” “will” and similar expressions which are intended to identify forward-looking statements. In addition, any underlying assumptions are forward-looking statements. Such forward- looking statements include but are not limited to statements regarding certain of Visa’s goals and expectations with respect to adjusted earnings per share, revenue, adjusted operating margin and free cash flow and the growth rate in those items, as well as other measures of economic performance. • By their nature, forward-looking statements: (i) speak only as of the date they are made, (ii) are not guarantees of future performance or results and (iii) are subject to risks, uncertainties and assumptions that are difficult to predict or quantify. Therefore, actual results could differ materially and adversely from those forward-looking statements as a result of a variety of factors, including all the risks discussed under the heading “Risk Factors” in our Prospectus dated March 18, 2008, filed with the U.S. Securities and Exchange Commission pursuant to Rule 424(b)(4) on March 19, 2008. You are cautioned not to place undue reliance on such statements, which speak only as of the date of this presentation. Unless required to do so under U.S. federal securities laws or other applicable laws, we do not intend to update or revise any forward-looking statements. |
 3 Fiscal Q3 2008 Earnings Results 3 Solid Fiscal Third Quarter Results • Adjusted quarterly net income of $457 million or adjusted diluted earnings of $0.59 per share • Strong operating revenues of $1.6 billion, up 18% yearly on a pro forma basis • Continued positive secular trends • Business model resilience despite economic slowdown Note: See appendix for reconciliation of adjusted non-GAAP measures to the closest comparable GAAP measures. |
 4 Fiscal Q3 2008 Earnings Results $548 $357 $190 $652 $228 $424 Visa Inc. Credit Debit 2007 2008 Quarter ended March US$ in billions, nominal YOY Growth Payments Volume 19% 19% 20% Note: Figures may not sum due to rounding. ROW ROW $201 $229 U.S. $347 U.S. $388 U.S. ROW U.S. U.S. $264 $181 $177 ROW U.S. $195 $166 ROW ROW $24 $193 $35 Total |
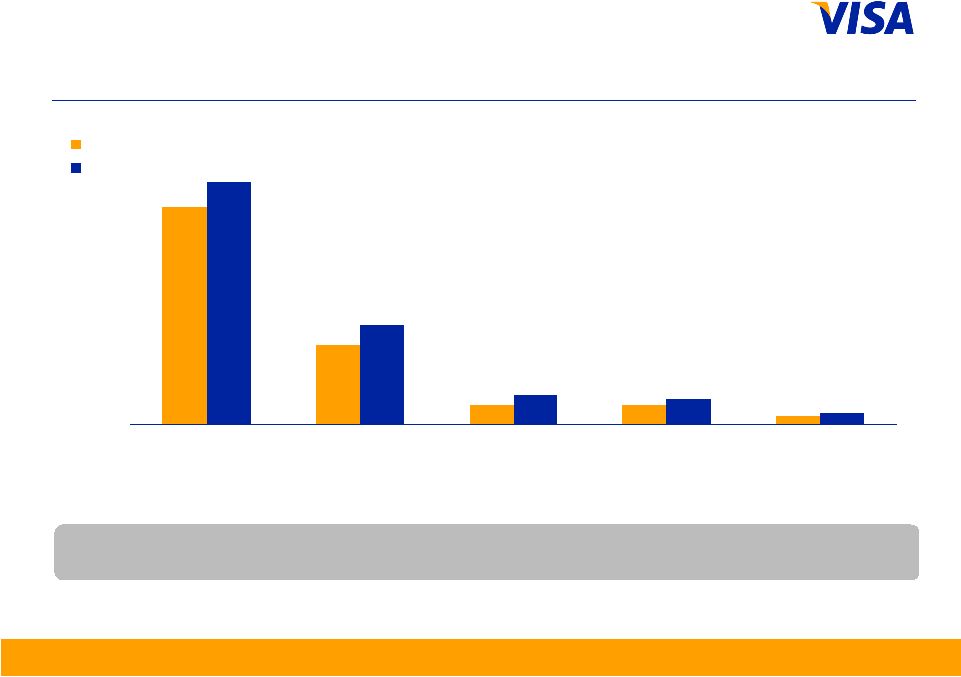 5 Fiscal Q3 2008 Earnings Results Quarter ended March US$ in billions, nominal 12% 27% 48% 31% 40% YOY Growth Payments Volume $347 $126 $31 $31 $12 $159 $46 $41 $17 $388 United States Asia Pacific (AP) Latin America and Caribbean (LAC) Canada Central and Eastern Europe, Middle East and Africa (CEMEA) 2007 2008 |
 6 Fiscal Q3 2008 Earnings Results 11,478 7,645 8,411 8,800 9,473 13,146 Total Transactions Processed Transactions Processed Transactions 2007 2008 Quarter ended March in millions YOY Growth Transactions 15% 15% 13% Note: Processed transactions represent transactions involving Visa, Visa Electron, Interlink and Plus cards processed on Visa’s networks. Total transactions represent payments and cash transactions as reported by Visa members on their operating certificates. Quarter ended June Debit Credit 61% 39% |
 7 Fiscal Q3 2008 Earnings Results 716 710 1,426 815 1,629 814 Credit Debit Visa Inc. 2007 2008 Quarter ended March in millions YOY Growth Total Cards 14% 15% 14% |
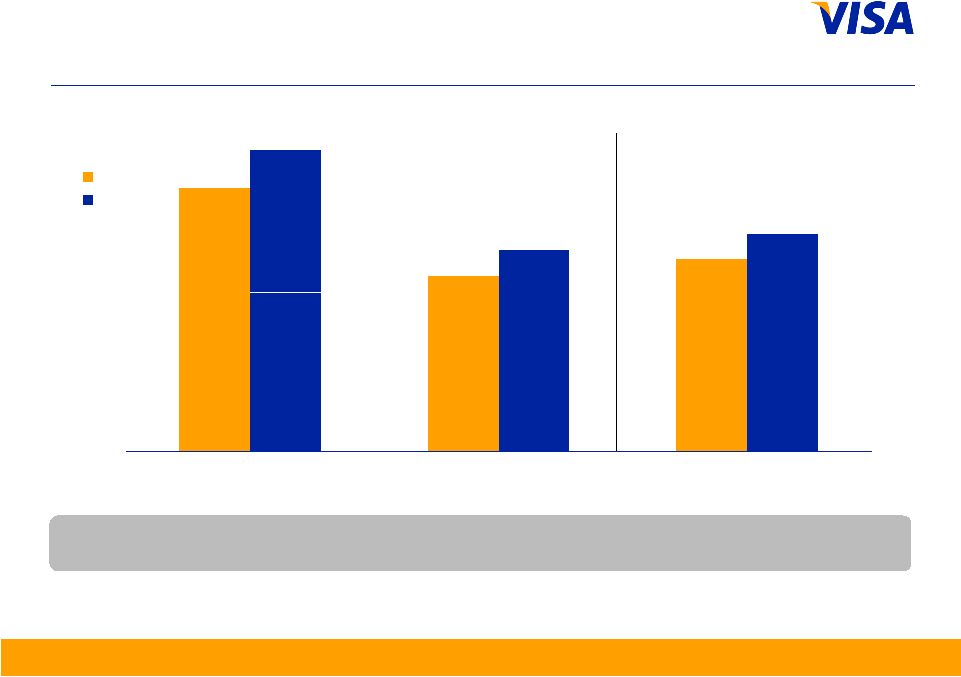
 8 Fiscal Q3 2008 Earnings Results $1,540 ($175) $1,365 ($274) $1,887 $1,613 Q3 FY 2007 Pro Forma Q3 FY 2008 Actual Revenue Detail US$ in millions Gross Revenues Incentives Net Operating Revenues 23% 57% 18% YOY Growth |
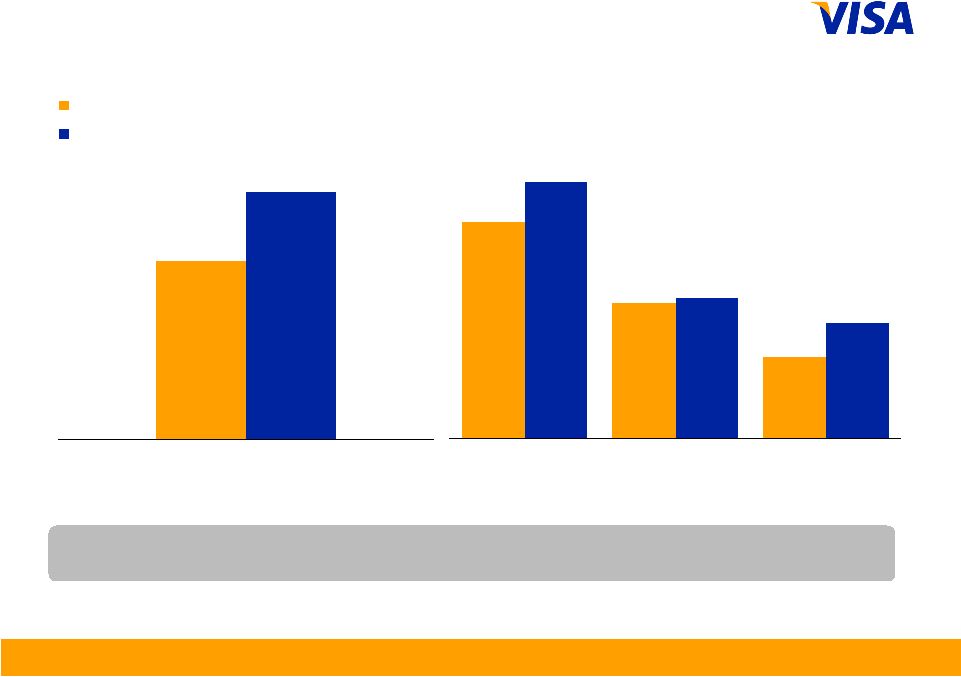
 9 Fiscal Q3 2008 Earnings Results $661 $449 $311 $119 $539 $749 $449 $150 Q3 FY 2007 Pro Forma Q3 FY 2008 Actual Revenue Detail US$ in millions Service Fees Data Processing Fees International Transaction Fees Other Revenue YOY Growth 13% 20% 44% 26% |
 10 Fiscal Q3 2008 Earnings Results $1,365 $852 $513 $883 $1,613 $730 Net Operating Revenues Total Operating Expenses Operating Income Adjusted Operating Margin US$ in millions YOY Growth 7 ppts 18% 4% 42% 38% 45% Operating Margin Q3 FY 2007 Pro Forma Q3 FY 2008 Actual |
 11 Fiscal Q3 2008 Earnings Results $293 $87 $244 $82 $108 $852 $38 $85 $84 $296 $271 $107 $40 $883 Q3 FY 2007 Pro Forma Q3 FY 2008 Actual Adjusted Operating Expenses US$ in millions Personnel Network, EDP & Communications Advertising, Marketing & Promotion Professional and Consulting Fees Depreciation and Amortization Administrative and Other Total Operating Expenses 1% (3%) 11% (1%) 5% 4% 4% Note: Restructuring contains Personnel, Professional fees and Administrative and Other expenses associated with organizational changes. See appendix for reconciliation of adjusted non-GAAP measures to the closest comparable GAAP measures. YOY Growth |
 12 Fiscal Q3 2008 Earnings Results Other Financial Results • Capital expenditures during the fiscal third quarter were $86 million and over half are attributable to the build-out of our new data center • Cash, cash equivalents, restricted cash and investment securities available-for-sale of $8.4 billion during the fiscal third quarter – $2.0 billion of restricted cash for litigation escrow – $2.7 billion for October redemption of European Class C shares |
 13 Fiscal Q3 2008 Earnings Results 11-15% 13 Annual net revenue growth Financial Metrics through Fiscal Year 2010 Annual adjusted operating margin Annual free cash flow (cash flow from operations plus cash reimbursements from litigation escrow less capital spending) Annual adjusted diluted class A common earnings per share growth Mid-to-High 40% Range 20% + $1 billion + |
 Appendix – Reconciliation of Non-GAAP Measures |
 15 Fiscal Q3 2008 Earnings Results 15 Pro Forma Quarterly Results of Operations (1) Visa Inc. had no operations prior to the reorganization on October 1, 2007. In order to provide insight into our operating results, the pro forma results of operations for the prior periods have been prepared for comparative purposes assuming that the reorganization had occurred on October 1, 2006. These pro forma statements of operations have been prepared in accordance with Statement of Financial Accounting Standards No. 141, “Business Combinations.” (2) Certain immaterial reclassifications were made to the quarter ended June 30 and September 30, 2007 pro forma financial statements to conform to the current presentation. US$ in millions December 31, 2006 March 31, 2007 June 30, 2007 (2) September 30, 2007 (2) Operating Revenues Service fees 577 $ 614 $ 661 $ 730 $ Data processing fees 377 370 449 463 Volume and support incentives (136) �� (187) (175) (216) International transaction fees 247 281 311 354 Other revenues 108 113 119 133 Total operating revenues 1,173 1,191 1,365 1,464 Operating Expenses Personnel 273 269 293 324 Network, EDP and communications 68 69 87 84 Advertising, marketing and promotion 205 182 244 444 Professional and consulting fees 101 136 159 156 Depreciation and amortization 55 54 55 64 Administrative and other 76 74 83 101 Litigation provision 2 13 - 2,638 Total operating expenses 780 797 921 3,811 Operating income (loss) 393 394 444 (2,347) Other Income (Expense) Interest expense (23) (24) (25) (24) Investment income, net 40 36 56 65 Other - - 8 - Total other income 17 12 39 41 Income (loss) before income taxes 410 406 483 (2,306) Income tax expense/(benefit) 161 160 184 (651) Net income (loss) 249 $ 246 $ 299 $ (1,655) $ Fiscal 2007 Quarter Ended (1) |
 16 Fiscal Q3 2008 Earnings Results 16 (1) Visa Inc. had no operations prior to the reorganization on October 1, 2007. In order to provide insight into our operating results, the pro forma results of operations for the prior periods have been prepared for comparative purposes assuming that the reorganization had occurred on October 1, 2006. These pro forma statements of operations have been prepared in accordance with Statement of Financial Accounting Standards No. 141, "Business Combinations.“ (2) Certain immaterial reclassifications were made to the three and nine months ended June 30, 2007 pro forma financial statements to conform to the current presentation. Pro Forma Results of Operations (1)(2) US$ in millions Operating Revenues Service fees 661 $ 1,852 $ Data processing fees 449 1,196 Volume and support incentives (175) (498) International transaction fees 311 839 Other revenues 119 340 Total operating revenues 1,365 3,729 299 $ 794 $ For the Nine Months Ended June 30, 2007 For the Three Months Ended June 30, 2007 Operating Expenses Personnel 293 835 Network, EDP, and communications 87 224 Advertising, marketing, and promotion 244 631 Professional and consulting fees 159 396 Depreciation and amortization 55 164 Administrative and other 83 233 Litigation provision - 15 Total operating expenses 921 2,498 Operating income 444 1,231 Other Income (Expense) Interest expense (25) (72) Investment income, net 56 132 Other 8 8 Total other income 39 68 Income before income taxes 483 1,299 Income tax expense 184 505 Net income |
 17 |
 18 Fiscal Q3 2008 Earnings Results 18 Weighted Avg. Class A Common Stock Outstanding Used in the Calculation of Adjusted Diluted EPS (1) For the three months ended March 31, 2008 and nine months ended June 30, 2008, for GAAP purposes, the number of class A common shares outstanding is weighted to reflect the issuance of 446,600,000 shares at the IPO date of March 19, 2008. In the calculation of the adjusted weighted average shares outstanding, these shares are assumed to have been issued at January 1, 2008 for the three months ended March 31, 2008 and October 1, 2007 for the nine months ended June 30, 2008. (2) For the three months ended March 31, 2008 and nine months ended June 30, 2008, for GAAP purposes, the number of class B common shares outstanding is weighted to reflect the redemption of 154,738,487 shares on March 28, 2008 and the reduction of the conversion ratio applicable to remaining shares outstanding to 0.71 to 1. In the calculation of the adjusted weighted average shares outstanding, these shares are weighted to assume that the redemption and reduction in conversion ratio had occurred at January 1, 2008 for the three months ended March 31, 2008 and October 1, 2007 for the nine months ended June 30, 2008. (3) For the three months ended March 31, 2008 and nine months ended June 30, 2008, for GAAP purposes, the number of class C (series I, II, III & IV) common shares is weighted to reflect the redemption of 159,657,751 shares of class C (series I) common stock on March 28, 2008, and the reclassification of all shares of class C (series II) common stock to temporary equity and 35,263,585 shares of class C (series III) common stock to liabilities on the IPO date of March 19, 2008. Upon reclassification of the class C (series II) and class C (series III) common stock these shares are no longer convertible into shares of class A common stock. In the calculation of adjusted weighted average shares outstanding, these shares are weighted to assume that the redemption and reclassifications occurred at January 1, 2008 for the three months ended March 31, 2008 and October 1, 2007 for the nine months ended June 30, 2008. (4) For GAAP purposes, the number of class A common shares outstanding is weighted to reflect the assumed issuance of class A common stock underlying stock options, restricted stock and restricted stock units to employees and directors at the IPO date of March 19, 2008 and during the three months ended June 30, 2008, by applying the treasury stock method. For the three months ended March 31, 2008 and nine months ended June 30, 2008, in the calculation of adjusted weighted shares outstanding, these shares are assumed to have been issued at October 1, 2007 and were outstanding for the entire period. The share adjustments also reflect the estimated number of stock options, restricted stock and restricted stock units estimated to be outstanding in October 2008 after the redemption of the class C (series II and series III) common shares held by Visa Europe. For the Three Months Ended For the Nine Months Ended For the three Months Ended June 30, 2008 June 30, 2008 March 31, 2008 Weighted Average Shares Outstanding - GAAP 776 767 778 Class A Shares (1) - 277 383 Class B Shares (2) - (159) (226) Class C Shares (3) - (109) (161) Class A Share Equivalents (4) 3 3 5 3 12 1 Adjusted Weighted Average Shares Outstanding - Non GAAP 779 779 779 Share Adjustments (in millions) |
 19 Fiscal Q3 2008 Earnings Results 19 Adjusted Diluted Earnings per Share Class A Common Stock • Management believes the presentation of adjusted operating income and adjusted net income provides a clearer understanding of the one-time items related to the Company's reorganization, initial public offering and other non-recurring events. These measures also adjust for expenses related to covered litigation that will be funded by the litigation escrow account and a $31 million after-tax charge taken in the third quarter related to non-recurring legacy litigation items that will not be funded by the litigation escrow account. These items have a significant impact on our financial results but are either non-recurring or have no operating cash impact. • Recognizing that we have a very complex equity structure incorporating multiple classes and series of common stock, the Company has also presented adjusted diluted class A earnings per share calculated below based on adjusted net income and the adjusted weighted average number of shares outstanding in the periods presented. This non-GAAP financial measure has been presented to illustrate our per share results reflecting our capital structure after the redemption of all class C (series II) common stock and a portion of class C (series III) common stock, which the Company intends to redeem in October 2008. The class C (series II) common stock is classified as temporary equity and the redeemable class C (series III) common stock is classified as a liability on the Company's consolidated balance sheet at June 30, 2008. Management believes this non-GAAP presentation provides the reader with a clearer understanding of our per share results by excluding these shares to be redeemed and allocating adjusted net income only to permanent equity. For the Three Months Ended For the Nine Months Ended For the Three Months Ended June 30, 2008 June 30, 2008 March 31, 2008 Adjusted net income 457 $ 1,301 $ 401 $ Adjusted weighted average number of diluted shares outstanding 779 779 779 Adjusted diluted earnings per share 0.59 $ 1.67 $ 0.52 $ (in millions, except per share data) |