 Visa Inc. Fiscal Second Quarter Financial Results May 5, 2011 Exhibit 99.2 |
 Fiscal Second Quarter 2011 Financial Results 2 Forward-Looking Information This presentation contains forward-looking statements within the meaning of the U.S. Private Securities Litigation Reform Act of 1995. These statements can be identified by the terms “expect,” “will,” “continue” and similar references to the future. Examples of such forward-looking statements include, but are not limited to, statements we make about gross and net revenue, incentive payments, expenses, operating margin, tax rate, earnings per share, capital expenditures, free cash flow and the growth of those items. By their nature, forward-looking statements: (i) speak only as of the date they are made, (ii) are neither statements of historical fact nor guarantees of future performance and (iii) are subject to risks, uncertainties, assumptions and changes in circumstances that are difficult to predict or quantify. Therefore, actual results could differ materially and adversely from those forward-looking statements because of a variety of factors, including the following: • the impact of timing and new laws, regulations and marketplace barriers, particularly the Wall Street Reform and Consumer Protection Act, including those affecting: – issuers’ and retailers’ choice among debit payment networks; – debit interchange rates; – the spread of regulation of debit payments to credit and other product categories; – the spread of U.S. regulations to other countries; – consumer privacy and data use and security; and – designation as a systemically important payment system; • developments in current or future disputes and our ability to absorb their impact, including: interchange; currency conversion; and tax; • macroeconomic factors such as: – global economic, political, health environmental and other conditions; – cross-border activity and currency exchange rates; and – material changes in our clients’ performance compared to our estimates; • industry and systemic developments, such as: – competitive pressure on client pricing and in the payments industry generally; – bank and merchant consolidation and their increased focus on payment card costs; – disintermediation from the payments value stream through government actions or bilateral agreements; – adverse changes in our relationships and reputation; – our clients’ failure to fund settlement obligations we have guaranteed; – disruption of our transaction processing systems or the inability to process transactions efficiently; – rapid technological developments; – account data breaches and increased fraudulent and other illegal activity involving our cards; and – issues arising at Visa Europe, including failure to maintain interoperability between our systems; • costs arising if Visa Europe were to exercise its right to require us to acquire all of its outstanding stock; • loss of organizational effectiveness or key employees; • failure to integrate successfully CyberSource, PlaySpan or other acquisitions; • changes in accounting principles or treatment; and the other factors discussed in our most recent Annual Report on Form 10-K and our most recent Quarterly Reports on Form 10-Q for the first and second quarters of our 2011 fiscal year on file with the U.S. Securities and Exchange Commission. You should not place undue reliance on such statements. Unless required to do so by law, we do not intend to update or revise any forward-looking statement, because of new information or future developments or otherwise. |
 Fiscal Second Quarter 2011 Financial Results 3 Solid Fiscal Second Quarter Results • Strong operating revenues of $2.2 billion, up 15% over prior year • Quarterly net income of $881 million, up 23% and diluted earnings per share of $1.23, up 28% over prior year • Continued positive secular trends and spending momentum contributed to double-digit growth in key underlying business drivers • Effectively repurchased 8.7 million shares at an average price of $72.58 for a total cost of $630 million, of which $230 million was from open market repurchases and $400 million was effectively executed through the March 2011 deposit into the litigation escrow account |
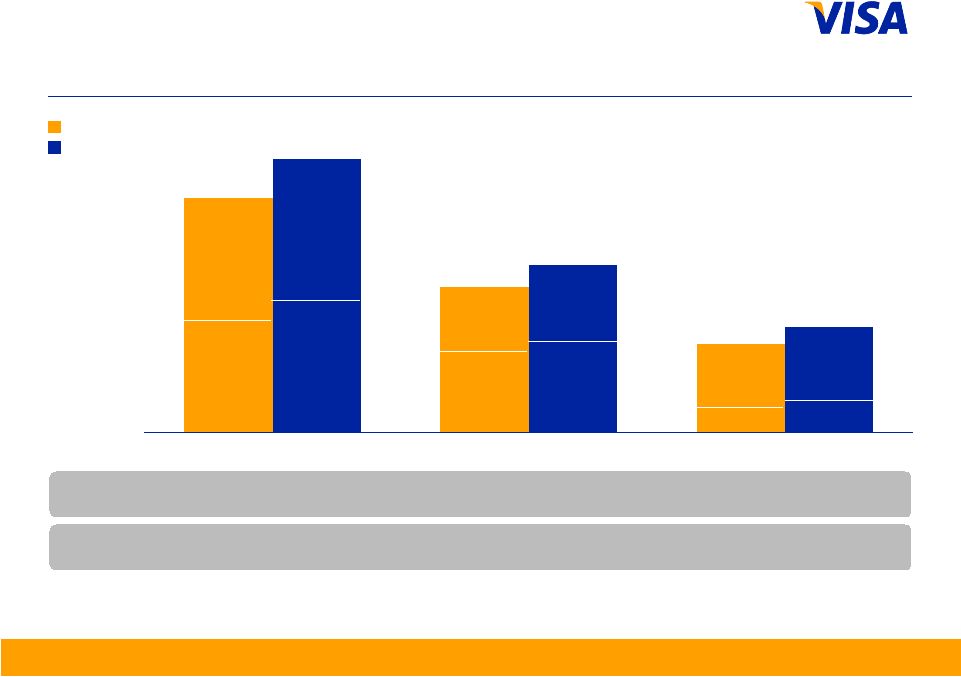 Fiscal Second Quarter 2011 Financial Results 4 Quarter ended December US$ in billions, nominal, except percentages Payments Volume Note: Figures may not sum due to rounding. Growth rates calculated based on whole numbers, not rounded numbers. From time to time, previously submitted volume information may be updated. Prior year volume information presented has not been updated, as changes made are not material. Constant dollar growth rates exclude the impact of foreign currency fluctuations against the U.S. dollar in measuring performance. ROW = Rest of World 2009 2010 769 478 291 897 550 348 Total Visa Inc. Credit Debit ROW 53 ROW 331 ROW 334 U.S. 438 U.S. 493 ROW 405 U.S. 201 278 ROW U.S. 238 U.S. 277 ROW 71 YOY Change (nominal) 15% 20% 17% YOY Change (constant) 15% 12% 19% U.S. 216 |
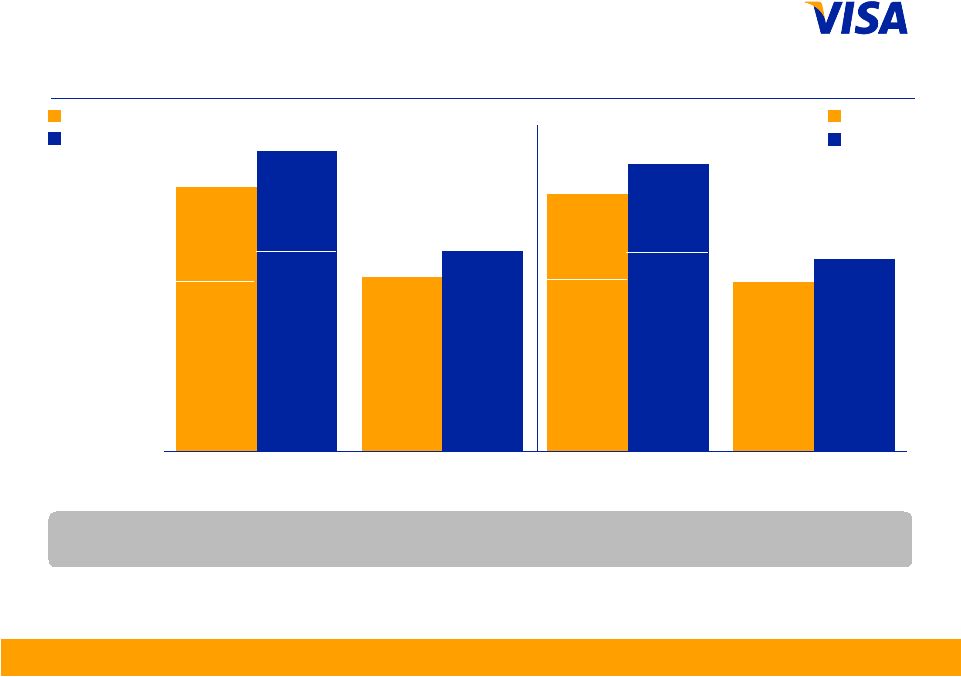
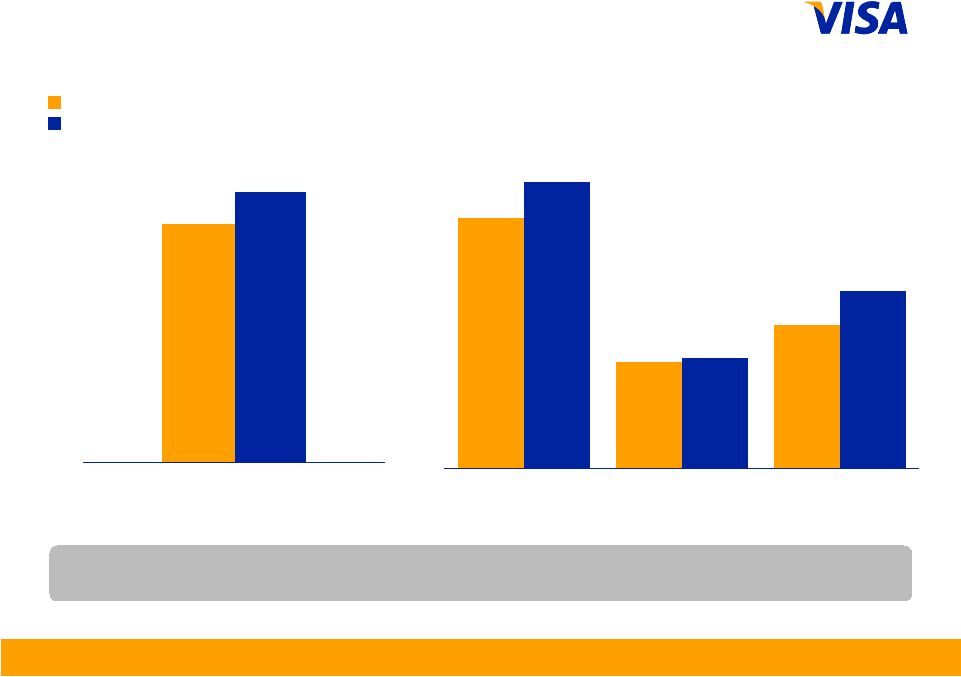
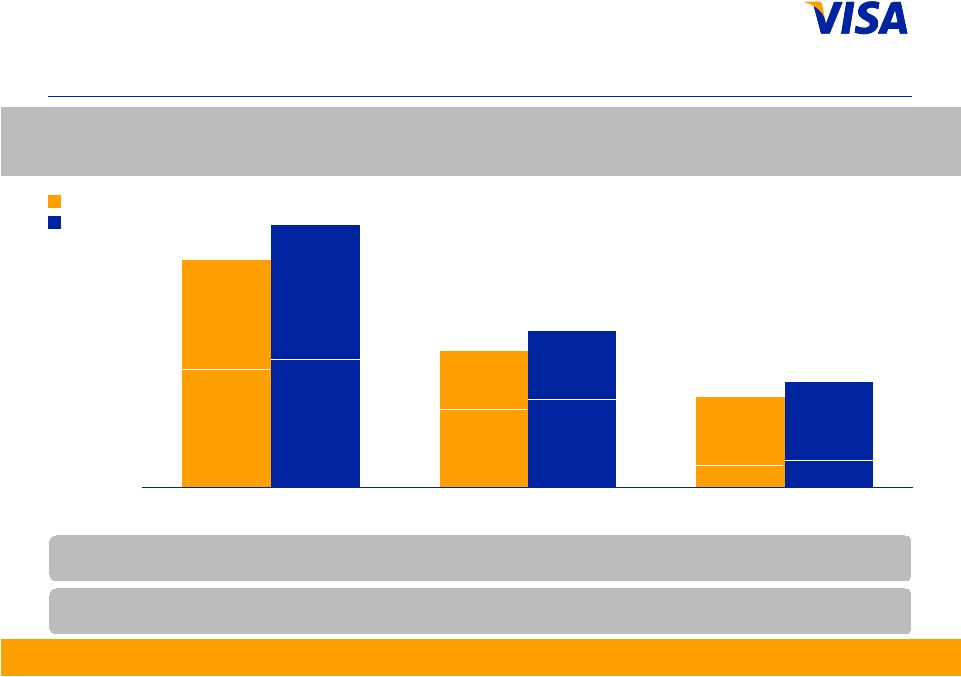 Fiscal Second Quarter 2011 Financial Results 5 745 449 296 861 516 345 Total Visa Inc. Credit Debit ROW 51 Quarter ended March US$ in billions, nominal, except percentages Payments Volume ROW 318 ROW 317 U.S. 427 U.S. 477 ROW 385 U.S. 182 266 ROW U.S. 199 U.S. 245 U.S. 277 ROW 68 Note: Current quarter payments volume and other select metrics are provided in the operational performance data supplement to provide more recent operating data. Service revenues continue to be recognized based on payments volume in the prior quarter. From time to time, reported payments volume information may be updated to reflect revised client submissions or other adjustments. Prior year volume information presented has not been updated, as changes made are not material. Figures may not sum due to rounding. YOY Change (nominal) 15% 17% 16% YOY Change (constant) 13% 11% 16% ROW = Rest of World 2010 2011 |
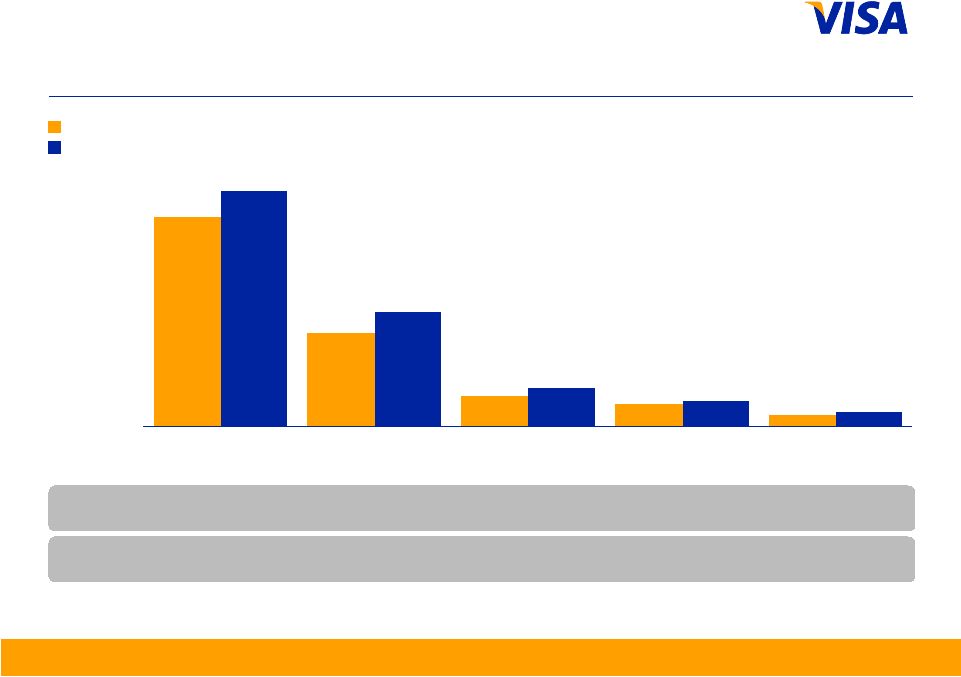 Fiscal Second Quarter 2011 Financial Results 6 Quarter ended December US$ in billions, nominal, except percentages Payments Volume Note: Growth rates calculated based on whole numbers, not rounded numbers. From time to time, previously submitted volume information may be updated. Prior year volume information presented has not been updated, as changes made are not material. Constant dollar growth rates exclude the impact of foreign currency fluctuations against the U.S. dollar in measuring performance. 2009 2010 493 240 81 53 30 23 47 64 197 438 United States Asia Pacific Latin America and Caribbean Canada Central and Eastern Europe, Middle East and Africa YOY Change (nominal) 12% 22% 26% 13% 33% YOY Change (constant) 12% 15% 26% 7% 32% |
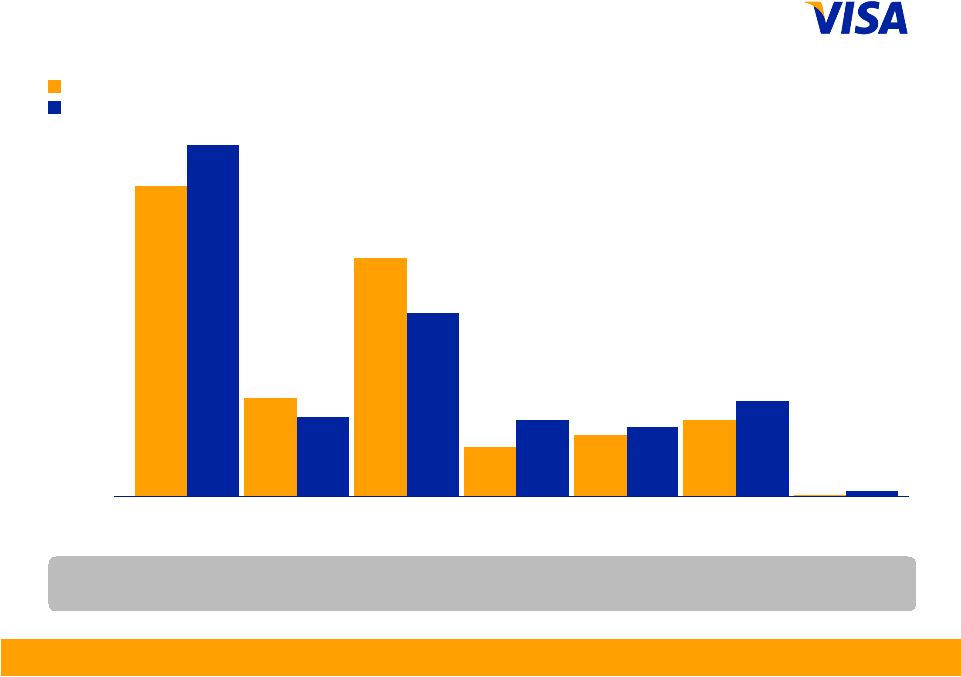
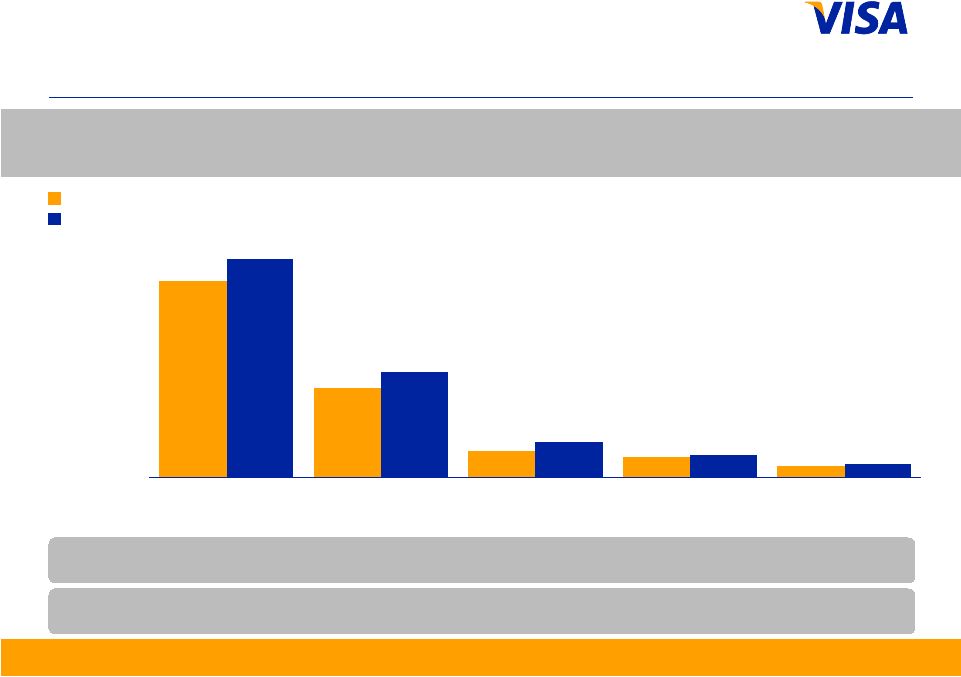 Fiscal Second Quarter 2011 Financial Results 7 477 230 77 48 30 23 43 58 195 427 United States Asia Pacific Latin America and Caribbean Canada Central and Eastern Europe, Middle East and Africa Quarter ended March US$ in billions, nominal, except percentages Payments Volume YOY Change (nominal) 12% 18% 33% 12% 34% YOY Change (constant) 12% 11% 26% 7% 31% 2010 2011 Note: Current quarter payments volume and other select metrics are provided in the operational performance data supplement to provide more recent operating data. Service revenues continue to be recognized based on payments volume in the prior quarter. From time to time, reported payments volume information may be updated to reflect revised client submissions or other adjustments. Prior year volume information presented has not been updated, as changes made are not material. Figures may not sum due to rounding. |
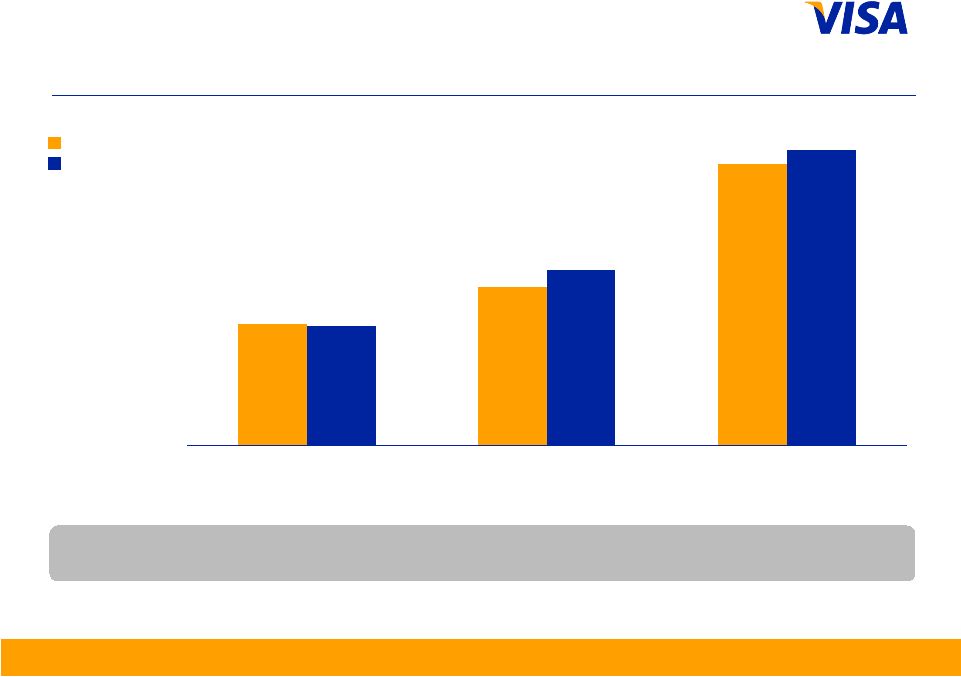
 Fiscal Second Quarter 2011 Financial Results 8 10,648 16,619 10,924 16,118 12,040 18,845 12,580 17,997 Total Transactions Processed Transactions Total Transactions Processed Transactions Quarter ended December in millions, except percentages Transactions Note: Processed transactions represent transactions involving Visa, Visa Electron, Interlink and Plus cards processed on Visa’s networks. Total transactions represent payments and cash transactions as reported by Visa clients on their operating certificates. From time to time, previously submitted transaction information may be updated. Prior year transaction information presented has not been updated, as changes made are not material. Quarter ended March Debit 64% Credit 36% Credit 37% Debit 63% Credit 36% Debit 64% Credit 35% Debit 65% YOY Change 13% 15% 12% 13% 2009 2010 2010 2011 |
 Fiscal Second Quarter 2011 Financial Results 9 Quarter ended December in millions, except percentages Total Cards YOY Change (2%) 10% 5% Note: From time to time, previously submitted cards information may be updated. Prior year cards information presented has not been updated, as changes made are not material. 2009 2010 1,897 784 1,024 1,808 1,127 770 Credit Debit Visa Inc. |
 Fiscal Second Quarter 2011 Financial Results 10 2,331 (372) 1,959 2,696 (451) 2,245 Revenue – Q2 2011 US$ in millions, except percentages Gross Revenues Incentives Net Operating Revenues YOY Change 16% 21% 15% Note: Growth rates calculated based on whole numbers, not rounded numbers. Fiscal 2010 Fiscal 2011 |
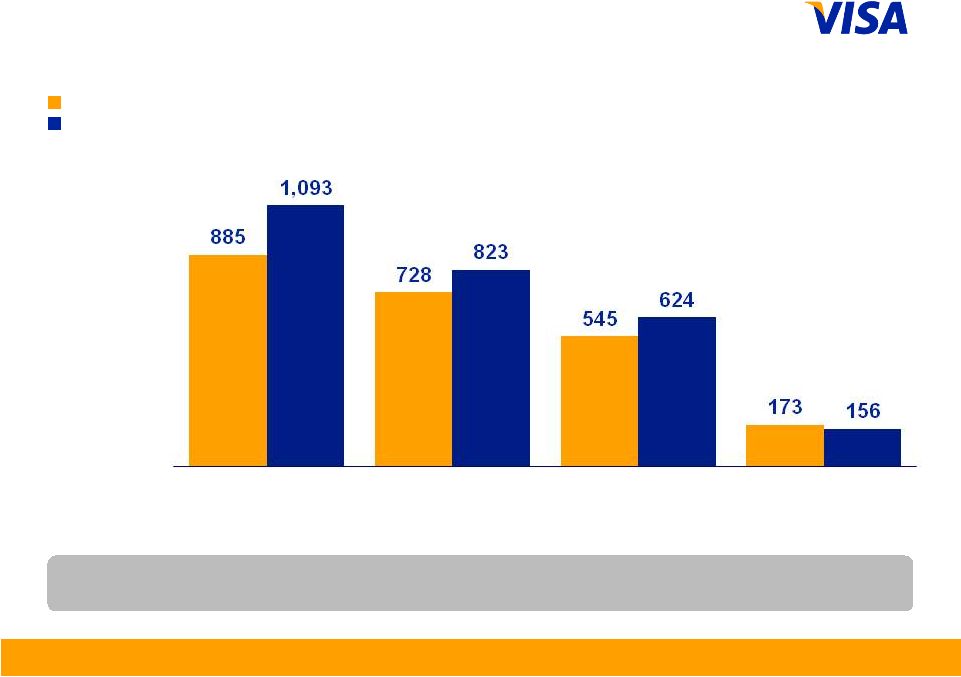 Fiscal Second Quarter 2011 Financial Results 11 Revenue Detail – Q2 2011 US$ in millions, except percentages Service Revenues Data Processing Revenues International Transaction Revenues Other Revenues YOY Change 24% 13% 14% (10%) Note: Growth rates calculated based on whole numbers, not rounded numbers. Fiscal 2010 Fiscal 2011 |
 Fiscal Second Quarter 2011 Financial Results 12 Operating Margin – Q2 2011 US$ in millions, except percentages 1,959 837 1,122 2,245 862 1,383 Net Operating Revenues Total Operating Expenses Operating Income 57% 62% Operating Margin YOY Change 5 ppt 15% 3% 23% Note: Growth rates calculated based on whole numbers, not rounded numbers. Fiscal 2010 Fiscal 2011 |
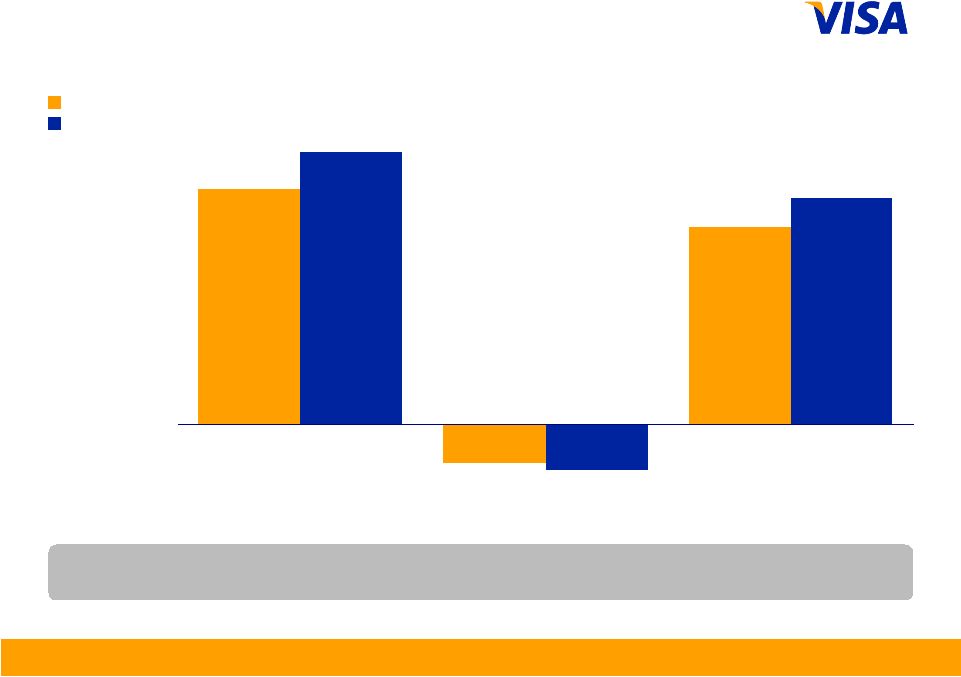
 Fiscal Second Quarter 2011 Financial Results 13 310 98 238 50 62 77 2 351 80 183 77 70 95 6 Operating Expenses – Q2 2011 US$ in millions, except percentages Personnel Network and Processing Marketing Professional Fees Depreciation and Amortization General and Administrative Litigation Provision YOY Change 14% (18%) (23%) 54% 12% 23% NM Note: Growth rates calculated based on whole numbers, not rounded numbers. Fiscal 2010 Fiscal 2011 |
 Fiscal Second Quarter 2011 Financial Results 14 Other Financial Results • Cash, cash equivalents, restricted cash and available-for-sale investment securities of $6.6 billion at the end of the fiscal second quarter which includes $3.0 billion of restricted cash in the litigation escrow account • Total free cash flow of $545 million for the fiscal second quarter and adjusted free cash flow of $383 million after the PlaySpan acquisition • Capital expenditures of $72 million during the fiscal second quarter Note: See appendix for reconciliation of adjusted non-GAAP measures to the closest comparable GAAP measures. |
 Fiscal Second Quarter 2011 Financial Results 15 Less than $900 million Marketing expenses Financial Metrics for Fiscal Year 2011 Annual operating margin About 60% 16% to 16.5% range* Client incentives as % of gross revenues Annual net revenue growth 11% to 15% range *Note - This range may change based on future developments regarding pending federal debit regulations. |
 Fiscal Second Quarter 2011 Financial Results 16 Financial Metrics for Fiscal Year 2011 Capital expenditures $250-$275 million Annual diluted class A common stock earnings per share growth 20% + GAAP tax rate 36.5% to 37% range Annual free cash flow $3 billion + |
 Appendix Reconciliation of Non-GAAP Measures |
     Fiscal Second Quarter 2011 Financial Results Calculation of Free Cash Flow US$ in millions (1) Includes changes in client incentives, trade receivables, settlement receivable/payable, and personnel incentives. Additions (+) / Reductions (-) to Net income attributable to Visa Inc. Net income attributable to Visa Inc. (as reported) 881 1,765 Capital Assets + Depreciation and amortization 70 137 - Capital expenditures (72) (2) (147) (10) Litigation + Litigation provision 6 6 + Accretion expense 3 7 - Settlement payments (71) (142) + Settlement payments funded by litigation escrow 70 8 140 11 Share-based Compensation + Share-based compensation 42 90 Pension + Pension expense 9 16 - Pension contribution - 9 - 16 Taxes + Income tax expense 497 995 - Income taxes paid (986) (489) (1,015) (20) Changes in Working Capital (1) +/- Changes in other working capital accounts 96 (155) Total Free Cash Flow 545 1,697 Less: PlaySpan Acquisition - Purchase consideration, net (162) (162) Adjusted Free Cash Flow 383 1,535 Three Months Ended March 31, 2011 Six Months Ended March 31, 2011 A1 |
  Fiscal Second Quarter 2011 Financial Results Impact of PlaySpan Acquisition US$ in millions, except per share data The following table presents the impact of the PlaySpan acquisition on Visa’s diluted earnings per share. Three Months Ended March 31, 2011 Net income attributable to Visa Inc. (as reported) 881 $ Taxable PlaySpan adjustments: Less: Operating revenue (1) (2) Addback: Deductible operating expenses (2) 6 Subtotal of taxable adjustments 4 Tax rate (3) 40% Tax impact of adjustments (2) Impact of taxable PlaySpan adjustments 2 Addback: Non-deductible adjustments (4) 5 Impact of PlaySpan 7 Adjusted net income attributable to Visa Inc. 888 $ Weighted average number of diluted shares outstanding (as reported) 714 Adjusted diluted earnings per share 1.24 $ Diluted earnings per share (as reported) 1.23 $ Impact of PlaySpan acquisition (0.01) $ (1) (2) (3) Represents tax rate applicable to PlaySpan. (4) Operating revenues recognized by Visa related to PlaySpan transactions since the acquisition in March 2011. Amount primarily represents data processing revenues. Operating expenses incurred by Visa related to PlaySpan. Amounts incurred subsequent to the acquisition primarily represent personnel, amortization of intangibles and normal operating expenses. Amount primarily represents professional fees related to closing the transaction and some minor compensation expense, which are non-deductible for tax purposes. A2 |