 Visa Inc. Fiscal First Quarter Financial Results February 8, 2012 Exhibit 99.2 |
 First Quarter Fiscal 2012 Financial Results 2 Forward-Looking Statements This presentation contains forward-looking statements within the meaning of the U.S. Private Securities Litigation Reform Act of 1995. These statements can be identified by the terms “expect,” “will,” “continue” and similar references to the future. Examples of such forward-looking statements include, but are not limited to, statements we make about our revenue, revenue, incentive payments, expenses, operating margin, tax rate, earnings per share, capital expenditures, free cash flow and and the growth of those items. By their nature, forward-looking statements: (i) speak only as of the date they are made, (ii) are neither statements of historical fact nor guarantees of future performance and (iii) are subject to risks, uncertainties, assumptions and changes in circumstances that are difficult to predict or quantify. Therefore, actual results could differ materially and adversely from those forward-looking statements because of a variety of factors, including the following: • the impact of new laws, regulations and marketplace barriers, including: • rules capping debit interchange reimbursement fees promulgated under the Reform Act; • rules under the Reform Act expanding issuers' and merchants' choice among debit payment networks; • increased regulation outside the United States and in other product categories; and • rules about consumer privacy and data use and security; • developments in current or future litigation or government enforcement, including interchange, antitrust and tax disputes; • economic factors, such as: • an increase or spread of the current European crisis involving sovereign debt and the euro; • other global economic, political and health conditions; • cross-border activity and currency exchange rates; and • material changes in our clients' performance compared to our estimates; • industry developments, such as competitive pressure, rapid technological developments and disintermediation from the payments value stream; • system developments, such as: • disruption of our transaction processing systems or the inability to process transactions efficiently; • account data breaches or increased fraudulent or other illegal activities involving our cards; and • issues arising at Visa Europe, including failure to maintain interoperability between our systems; • costs arising if Visa Europe were to exercise its right to require us to acquire all of its outstanding stock; • loss of organizational effectiveness or key employees; • failure to integrate recent acquisitions successfully or to effectively launch new products and businesses; • changes in accounting principles or treatments; and the other factors discussed in our most recent Annual Report on Form 10-K filed with the U.S. Securities and Exchange Commission. You should not place undue reliance on such statements. Unless required to do so by law, we do not intend to update or revise any forward-looking statement, because of new information or future developments or otherwise. |
 First Quarter Fiscal 2012 Financial Results 3 Solid Fiscal First Quarter Results Strong operating revenues of $2.5 billion, up 14% over prior year Quarterly net income of $1.0 billion, up 16%, and diluted earnings per share of $1.49, up 21% over prior year Continued positive secular trends and spending momentum contributed to growth in key underlying business drivers Total as-converted class A common stock was reduced by 16.2 million shares, which was funded from $1.6 billion of the Company’s operating cash on hand |
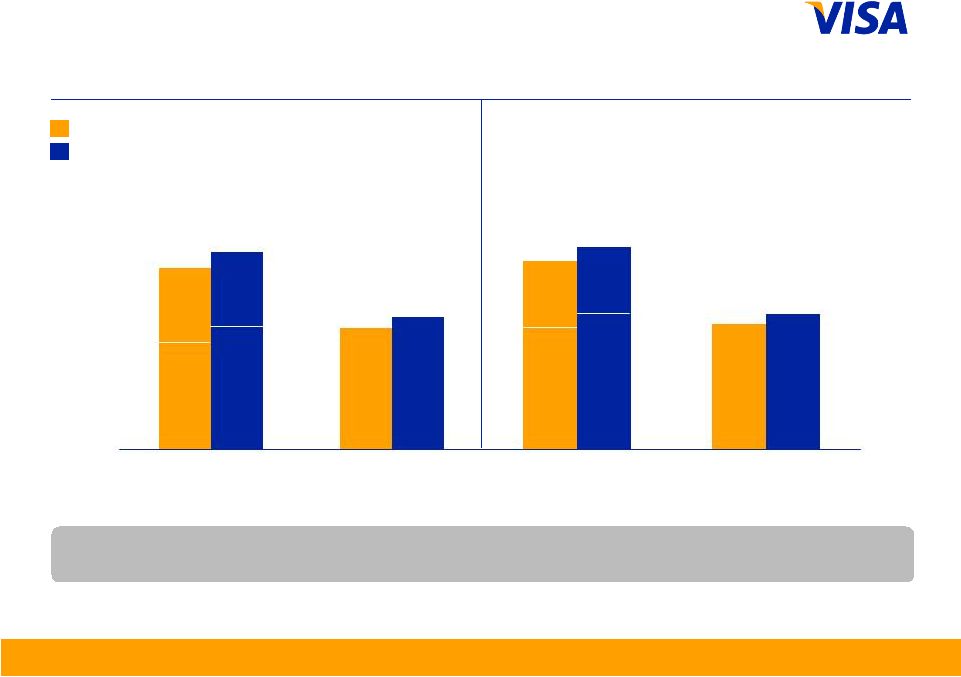
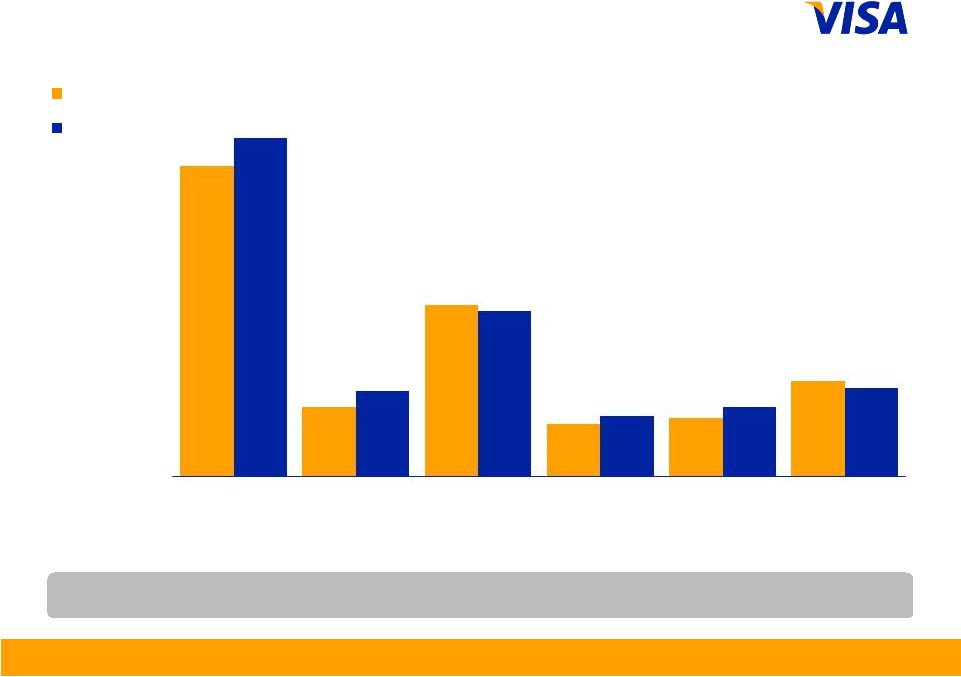
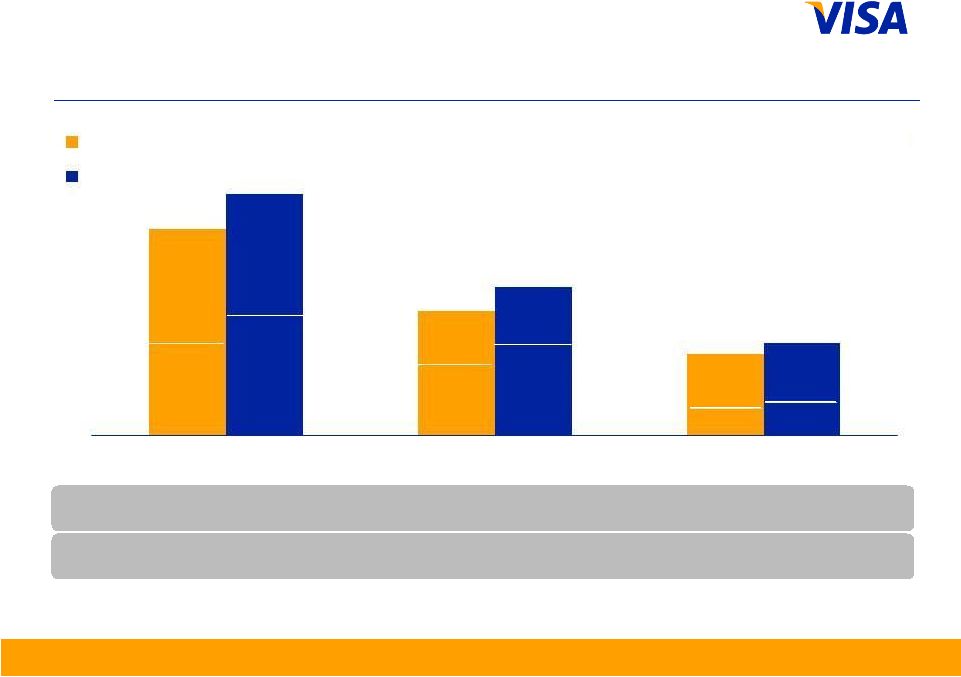 First Quarter Fiscal 2012 Financial Results 4 Payments Volume US$ in billions, nominal, except percentages YOY Change (nominal) 19% 14% 17% YOY Change (constant) 13% 14% 13% Note: Figures may not sum due to rounding. Growth rates calculated based on whole numbers, not rounded numbers. From time to time, previously submitted volume information may be updated. Prior year volume information presented has not been updated, as changes made are not material. Constant dollar growth rates exclude the impact of foreign currency fluctuations against the U.S. dollar in measuring performance. ROW = Quarter ended September 829 971 502 598 327 373 U.S. 473 ROW 356 U.S. 207 ROW 295 U.S. 517 ROW 454 U.S. 229 ROW 369 U.S. 288 ROW 85 U.S. 266 ROW 61 2010 2011 Total Visa Inc. Credit Debit Rest of World |
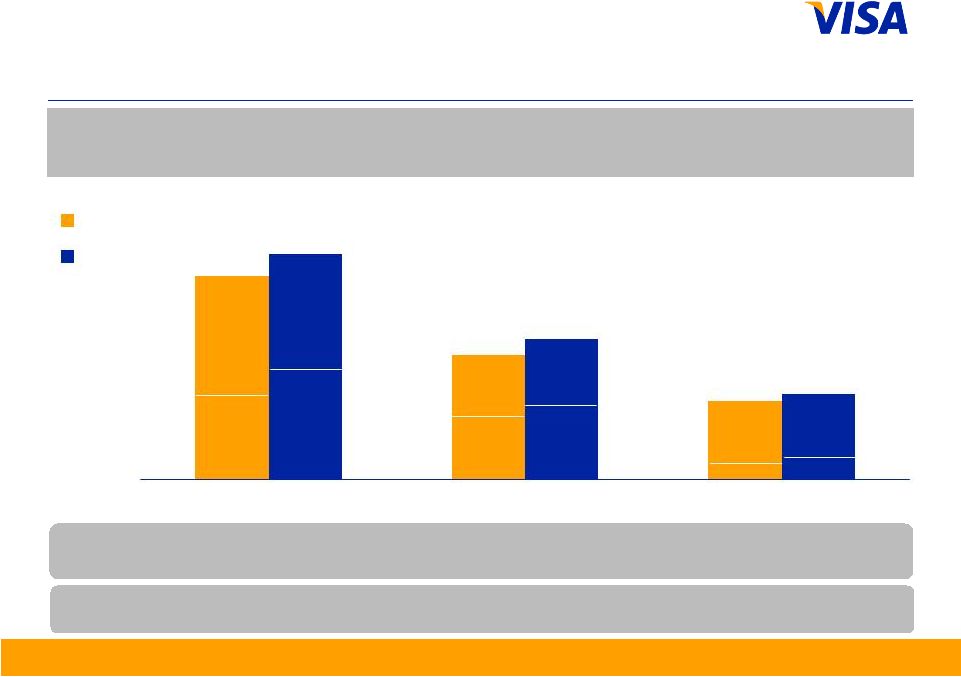 First Quarter Fiscal 2012 Financial Results 5 Payments Volume US$ in billions, nominal, except percentages YOY Change (nominal) 12% 9% 11% YOY Change (constant) 11% 12% 9% Note: Current quarter payments volume and other select metrics are provided in the operational performance data supplement to provide more recent operating data. Service revenues continue to be recognized based on payments volume in the prior quarter. From time to time, reported payments volume information may be updated to reflect revised client submissions or other adjustments. Prior year volume information presented has not been updated, as changes made are not material Figures may not sum due to rounding. ROW = Rest of World Quarter ended December 897 550 348 994 617 378 Total Visa Inc. Credit Debit 2010 2011 U.S. 493 ROW 405 U.S. 216 ROW 334 U.S. 277 ROW 71 U.S. 529 ROW 465 U.S. 237 ROW 380 ROW 86 U.S. 292 |
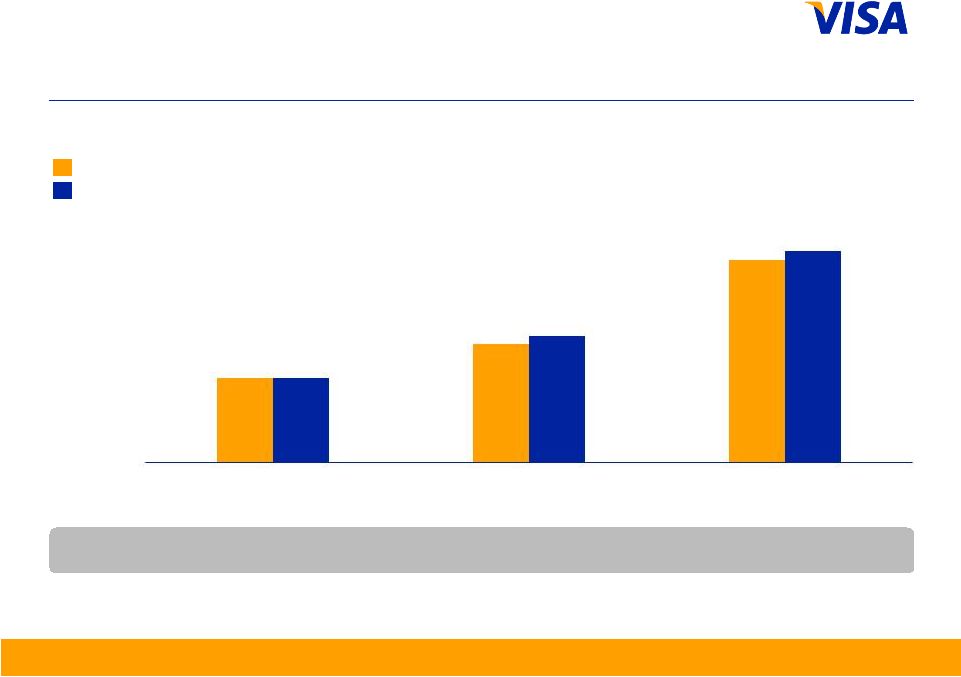
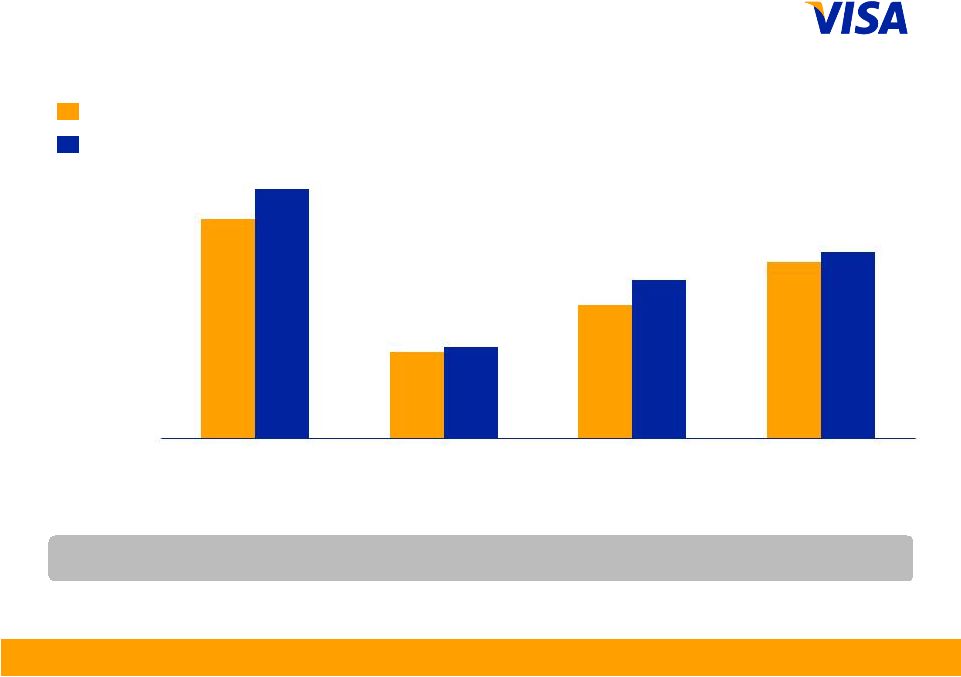
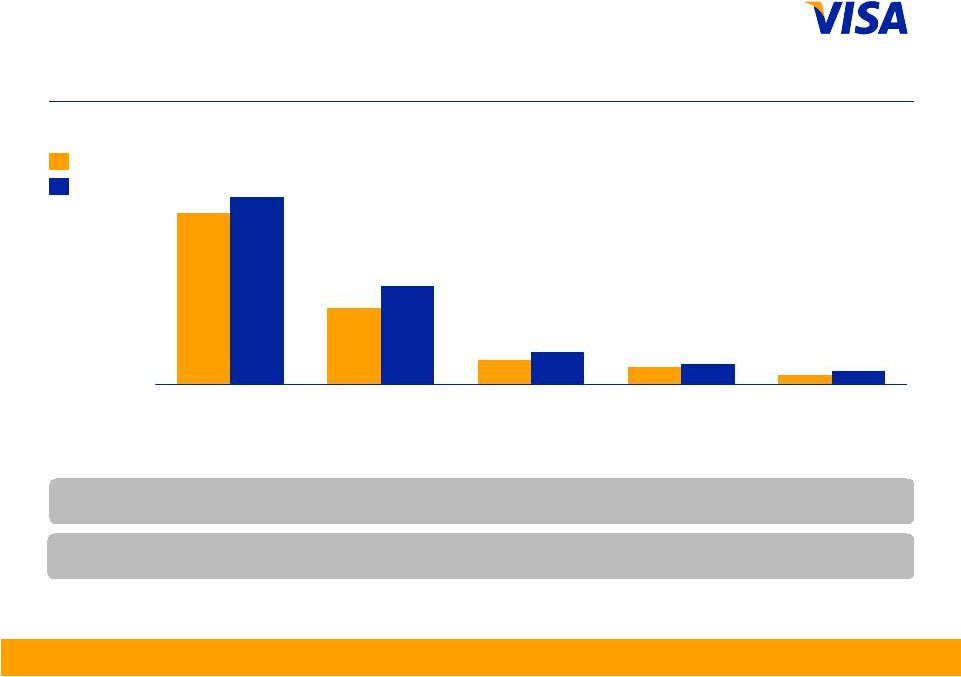 First Quarter Fiscal 2012 Financial Results 6 Payments Volume US$ in billions, nominal, except percentages YOY Change (nominal) 28% 15% 9% 30% 39% YOY Change (constant) 9% 17% 8% 24% 36% Note: Growth rates calculated based on whole numbers, not rounded numbers. From time to time, previously submitted volume information may be updated. Prior year volume information presented has not been updated, as changes made are not material. Constant dollar growth rates exclude the impact of foreign currency fluctuations against the U.S. dollar in measuring performance. Quarter ended September 2010 2011 473 212 68 49 27 517 272 89 56 37 United States Asia Pacific Latin America and Caribbean Canada Central and Eastern Europe, Middle East and Africa |
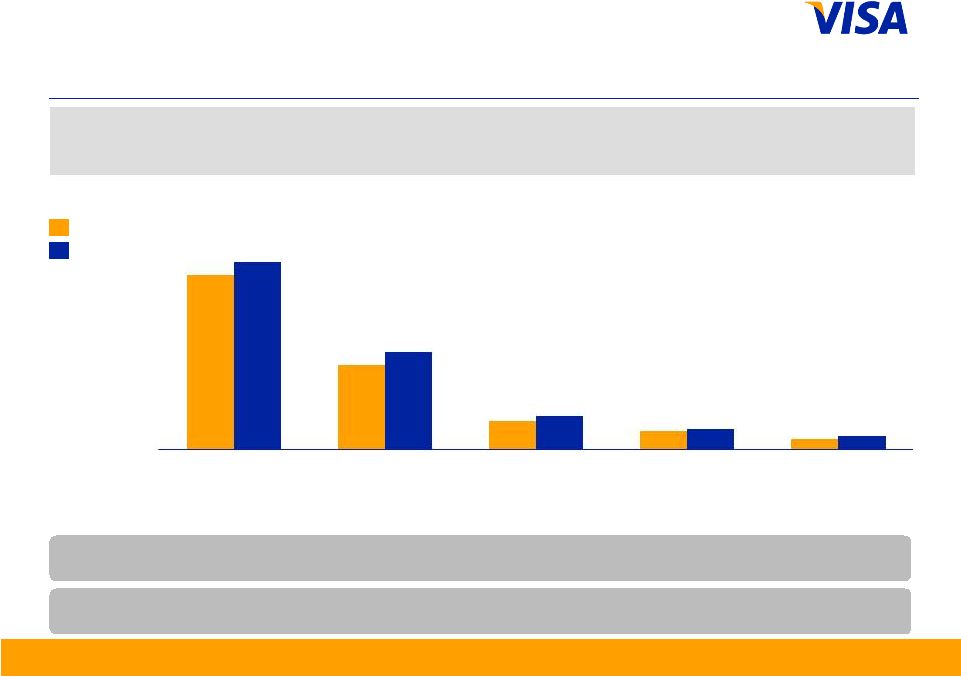 First Quarter Fiscal 2012 Financial Results 7 Payments Volume US$ in billions, nominal, except percentages Note: Current quarter payments volume and other select metrics are provided in the operational performance data supplement to provide more recent operating data. Service revenues continue to be recognized based on payments volume in the prior quarter. From time to time, reported payments volume information may be updated to reflect revised client submissions or other adjustments. Prior year volume information presented has not been updated, as changes made are not material. Figures may not sum due to rounding. YOY Change (nominal) 15% 7% 7% 16% 30% YOY Change (constant) 12% 8% 7% 22% 38% Quarter ended December 2010 2011 493 240 81 53 30 529 275 94 57 39 United States Asia Pacific Latin America and Caribbean Canada Central and Eastern Europe, Middle East and Africa |
 First Quarter Fiscal 2012 Financial Results 8 Transactions in millions, except percentages Quarter ended September Quarter ended December Note: Processed transactions represent transactions involving Visa, Visa Electron, Interlink and Plus cards processed on Visa’s networks. Total transactions represent payments and cash transactions as reported by Visa clients on their operating certificates. From time to time, previously submitted transaction information may be updated. Prior year transaction information presented has not been updated, as changes made are not material. YOY Change 9% 9% 8% 8% 2010 2011 18,845 12,580 20,339 13,600 Total Transactions Processed Transactions Credit 36% Debit 64% Credit 36% Debit 64% 18,149 12,119 19,808 13,263 Total Transactions Processed Transactions Credit 35% Debit 65% Credit 36% Debit 64% |
 First Quarter Fiscal 2012 Financial Results 9 Total Cards in millions, except percentages YOY Change 7% 4% 0% Note: From time to time, previously submitted card information may be updated. Prior year card information presented has not been updated, as changes made are not material Quarter ended September 2010 2011 770 1,081 1,850 774 1,157 1,930 Credit Debit Visa Inc. |
 First Quarter Fiscal 2012 Financial Results 10 Revenue – Q1 2012 US$ in millions, except percentages YOY Change 19% 14% 15% Note: Growth rates and percentage of gross revenues calculated based on whole numbers, not rounded numbers. FY12% of Gross Revenues 16% 84% 2,643 (405) 2,238 3,028 (481) 2,547 Gross Revenues Incentives Net Operating Revenues Fiscal 2011 Fiscal 2012 |
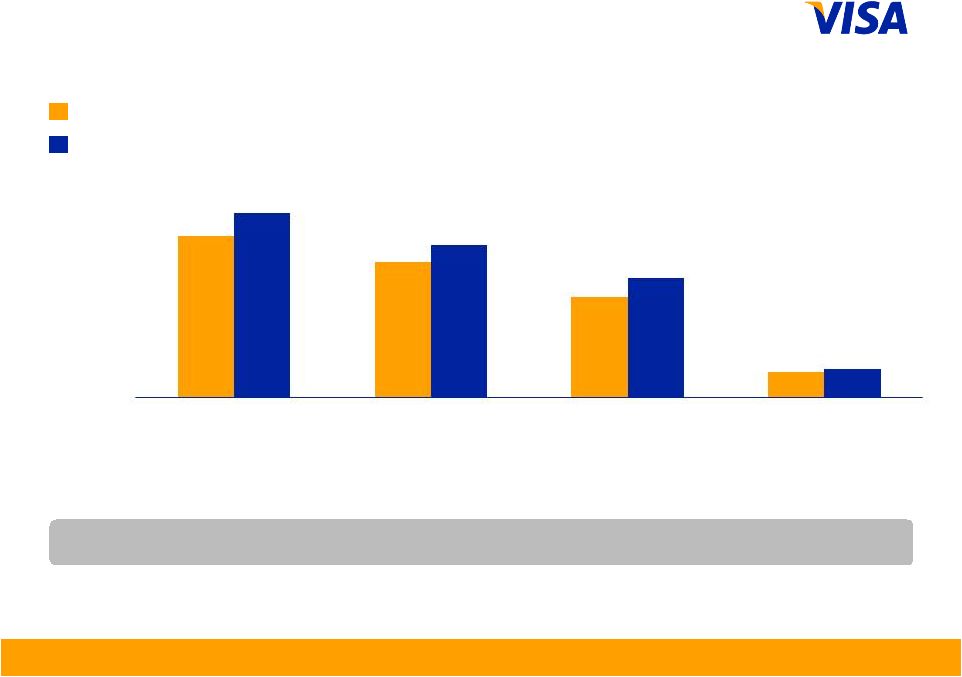 First Quarter Fiscal 2012 Financial Results 11 Revenue Detail – Q1 2012 US$ in millions, except percentages Note: Growth rates calculated based on whole numbers, not rounded numbers. YOY Change 13% 19% 14% 11% Fiscal 2011 Fiscal 2012 1,008 844 630 161 1,151 951 748 178 Service Revenues Data Processing Revenues International Transaction Revenues Other Revenues |
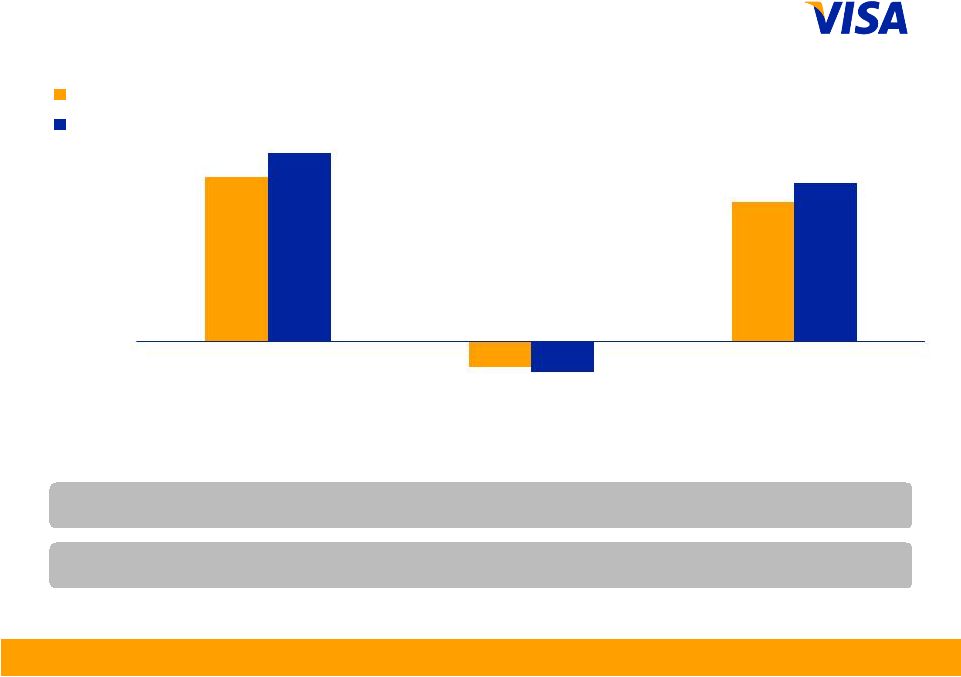
 First Quarter Fiscal 2012 Financial Results 12 Operating Margin – Q1 2012 US$ in millions, except percentages Note: Growth rates calculated based on whole numbers, not rounded numbers. YOY Change 7% 18% 14% 3 ppts Fiscal 2011 Fiscal 2012 2,238 872 1,366 61% 2,547 929 1,618 64% Net Operating Revenues Total Operating Expenses Operating Income Operating Margin |
 First Quarter Fiscal 2012 Financial Results 13 Operating Expenses – Q1 2012 US$ in millions, except percentages Note: Growth rates calculated based on whole numbers, not rounded numbers. YOY Change (4%) 16% 9% (7%) 18% 24% 357 80 197 61 67 110 389 98 190 70 80 102 Personnel Network and Processing Marketing Professional Fees Depreciation and Amortization General and Administrative Fiscal 2011 Fiscal 2012 |
 First Quarter Fiscal 2012 Financial Results 14 Other Financial Results • Cash, cash equivalents, restricted cash, and available-for-sale investment securities of $7.9 billion at the end of the fiscal first quarter, which includes $4.4 billion of restricted cash in the litigation escrow account • Free cash flow of $1.4 billion for the fiscal first quarter • Capital expenditures of $66 million during the fiscal first quarter |
 First Quarter Fiscal 2012 Financial Results 15 Marketing expenses Financial Metrics for Fiscal Year 2012 Annual operating margin Client incentives as % of gross revenues Annual net revenue growth Low double digits 17% to 18% range Under $1 billion About 60% |
 First Quarter Fiscal 2012 Financial Results 16 Financial Metrics for Fiscal Year 2012 Capital expenditures $350 million to $400 million range Adjusted annual diluted class A common stock earnings per share growth High teens Adjusted tax rate* 33% to 34% range Annual free cash flow Greater than $4 billion *Excludes the impact of possible non-cash revaluation of deferred tax liabilities, which could decrease the GAAP tax rate to 30% to 31%. These deferred tax liabilities are primarily associated with indefinite-lived intangible assets recorded as part of Visa’s October 2007 reorganization. |
 Appendix Reconciliation of Non-GAAP Measures |
 First Quarter Fiscal 2012 Financial Results A1 Calculation of Free Cash Flow US$ in millions (1) Includes changes in client incentives, trade receivable/payable, settlement receivable/payable, and personnel incentives. US$ in millions Additions (+) / Reductions (-) to Net income attributable to Visa Inc. Net income attributable to Visa Inc. (as reported) 1,029 Capital Assets + Depreciation and amortization 80 - Capital expenditures (66) 14 Litigation + Litigation provision - + Accretion expense 1 - Settlement payments (70) + Settlement payments funded by litigation escrow 70 1 Share-based Compensation + Share-based compensation 38 Pension + Pension expense 11 - Pension contribution - 11 Taxes + Income tax expense 590 - Income taxes paid (57) 533 Changes in Working Capital (1) +/- Changes in other working capital accounts (262) Total Free Cash Flow 1,364 Three Months Ended December 31, 2011 |