 Visa Inc. Fiscal Second Quarter Financial Results May 2, 2012 Exhibit 99.2 |
 Second Quarter Fiscal 2012 Financial Results 2 Forward-Looking Statements This presentation contains forward–looking statements within the meaning of the U.S. Private Securities Litigation Reform Act of 1995. These statements can be identified by the terms “expect,” “will,” “continue” and similar references to the future. Examples of such forward–looking statements include, but are not limited to, statements we make about our revenue, incentive payments, expenses, operating margin, tax rate, earnings per share, capital expenditures, free cash flow and and the growth of those items. By their nature, forward-looking statements: (i) speak only as of the date they are made, (ii) are neither statements of historical fact nor guarantees of future performance and (iii) are subject to risks, uncertainties, assumptions and changes in circumstances that are difficult to predict or quantify. Therefore, actual results could differ materially and adversely from those forward-looking statements because of a variety of factors, including the following: • the impact of new laws, regulations and marketplace barriers, including: • rules capping debit interchange reimbursement fees promulgated under the Reform Act; • rules under the Reform Act expanding issuers' and merchants' choice among debit payment networks; • U.S. government and other parties' reactions to the changes we have made to our business in response to the Reform Act; • increased regulation outside the United States and in other product categories; and • rules about consumer privacy and data use and security; • developments in current or future litigation or government enforcement, including interchange, antitrust and tax disputes; • economic factors, such as: • an increase or spread of the current European crisis involving sovereign debt and the euro; • other global economic, political and health conditions; • cross-border activity and currency exchange rates; and • material changes in our clients' performance compared to our estimates; • industry developments, such as competitive pressure, rapid technological developments and disintermediation from the payments value stream; • system developments, such as: • disruption of our transaction processing systems or the inability to process transactions efficiently; • account data breaches or increased fraudulent or other illegal activities involving our cards; and • issues arising at Visa Europe, including failure to maintain interoperability between our systems; • costs arising if Visa Europe were to exercise its right to require us to acquire all of its outstanding stock; • loss of organizational effectiveness or key employees; • failure to integrate recent acquisitions successfully or to effectively launch new products and businesses; • changes in accounting principles or treatments; and the other factors discussed in our most recent Annual Report on Form 10-K filed with the U.S. Securities and Exchange Commission. You should not place undue reliance on such statements. Unless required to do so by law, we do not intend to update or revise any forward–looking statement, because of new information or future developments or otherwise. |
 Second Quarter Fiscal 2012 Financial Results 3 Solid Fiscal Second Quarter Results • Strong operating revenues of $2.6 billion, up 15% over prior year • Adjusted quarterly net income of $1.1 billion, up 23%, and adjusted diluted earnings per share of $1.60, up 30% over prior year • Continued positive secular trends and spending momentum contributed to growth in key underlying business drivers Note: See appendix for reconciliation of adjusted non-GAAP measures to the closest comparable GAAP measures. |
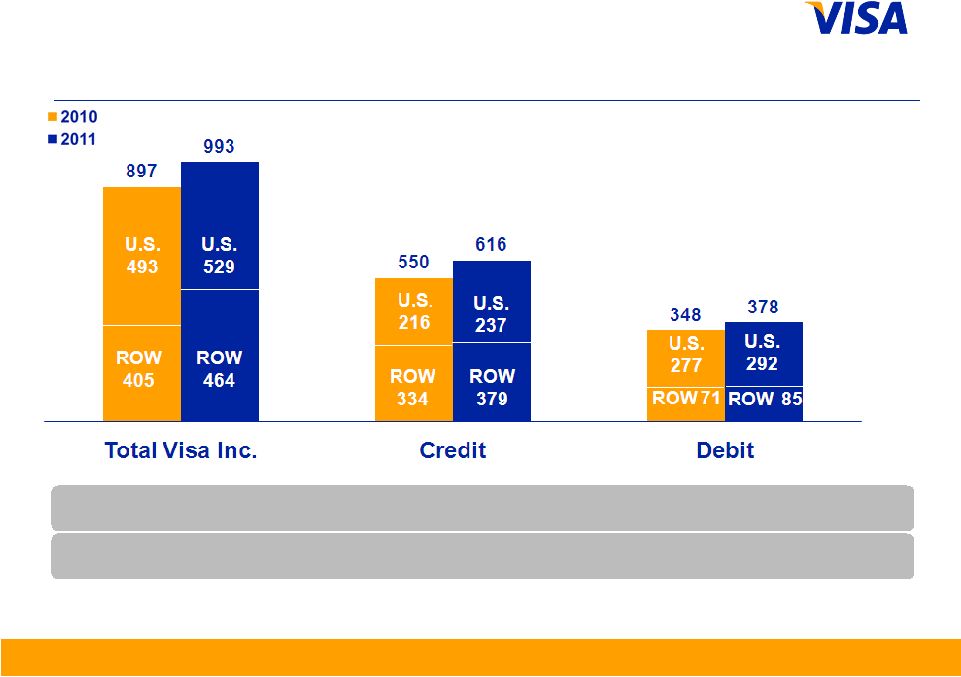 Second Quarter Fiscal 2012 Financial Results 4 Payments Volume US$ in billions, nominal, except percentages YOY Change (nominal) 12% 9% 11% YOY Change (constant) 11% 12% 9% Note: Figures may not sum due to rounding. Growth rates calculated based on whole numbers, not rounded numbers. From time to time, previously submitted volume information may be updated. Prior period updates are not material. Constant dollar growth rates exclude the impact of foreign currency fluctuations against the U.S. dollar in measuring performance. ROW = Rest of World Quarter ended December |
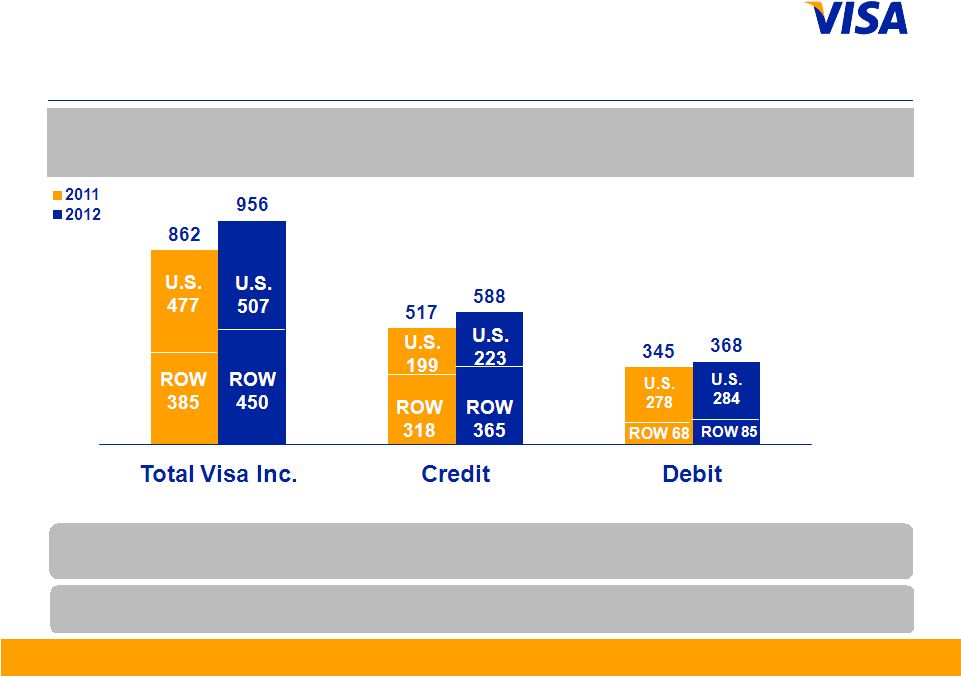 Second Quarter Fiscal 2012 Financial Results 5 Payments Volume US$ in billions, nominal, except percentages YOY Change (nominal) 14% 7% 11% YOY Change (constant) 11% 14% 7% Note: Current quarter payments volume and other select metrics are provided in the operational performance data supplement to provide more recent operating data. Service revenues continue to be recognized based on payments volume in the prior quarter. From time to time, reported payments volume information may be updated to reflect revised client submissions or other adjustments. Prior period updates are not material. Figures may not sum due to rounding. ROW = Rest of World Quarter ended March |
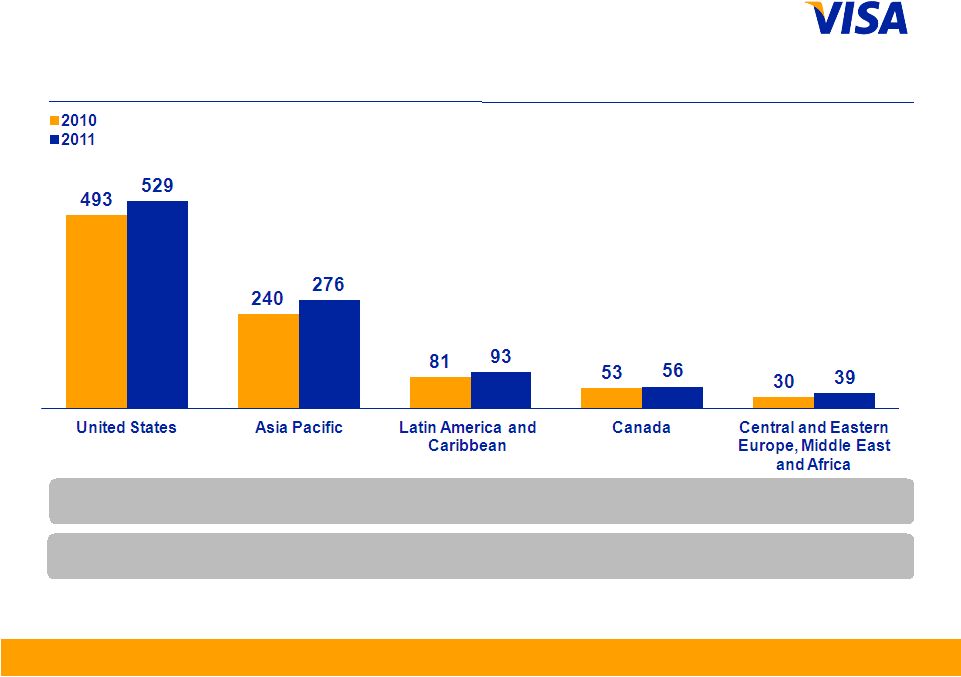 Second Quarter Fiscal 2012 Financial Results 6 Payments Volume US$ in billions, nominal, except percentages YOY Change (nominal) 15% 5% 7% 15% 29% YOY Change (constant) 7% 12% 6% 21% 37% Note: Growth rates calculated based on whole numbers, not rounded numbers. From time to time, previously submitted volume information may be updated. Prior period updates are not material. Constant dollar growth rates exclude the impact of foreign currency fluctuations against the U.S. dollar in measuring performance. Quarter ended December |
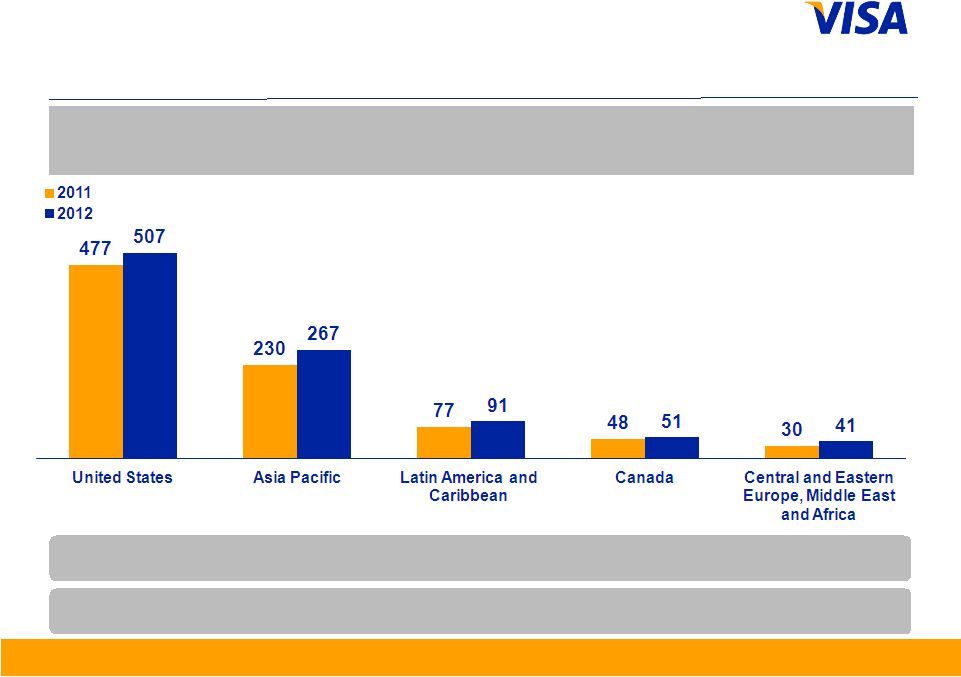 Second Quarter Fiscal 2012 Financial Results 7 Payments Volume US$ in billions, nominal, except percentages Note: Current quarter payments volume and other select metrics are provided in the operational performance data supplement to provide more recent operating data. Service revenues continue to be recognized based on payments volume in the prior quarter. From time to time, reported payments volume information may be updated to reflect revised client submissions or other adjustments. Prior period updates are not material. Figures may not sum due to rounding. YOY Change (nominal) 16% 7% 6% 19% 36% YOY Change (constant) 13% 9% 6% 25% 42% Quarter ended March |
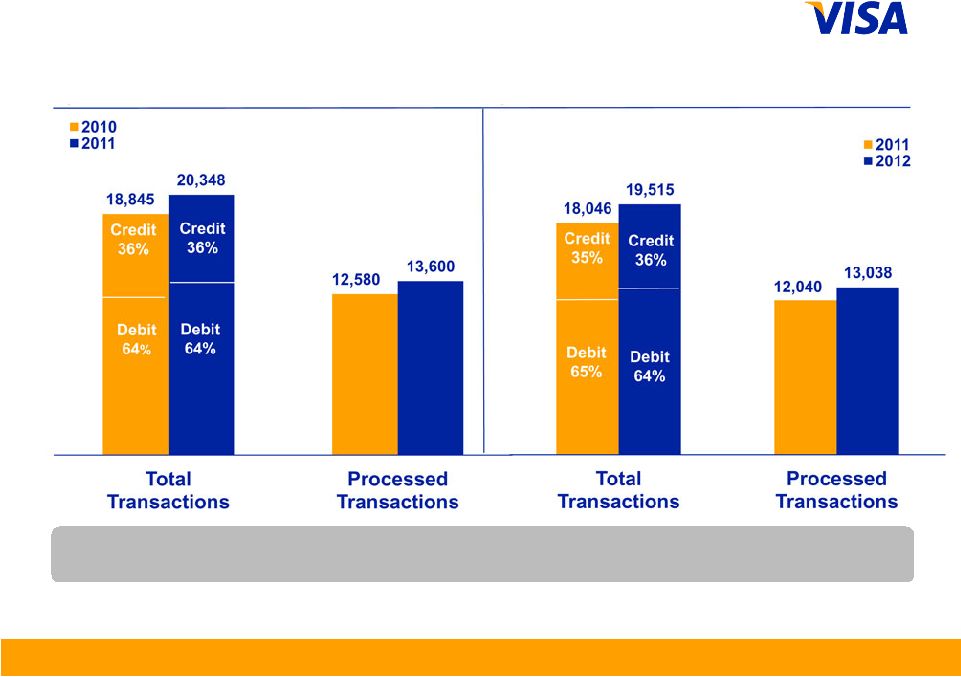 Second Quarter Fiscal 2012 Financial Results 8 Transactions in millions, except percentages Quarter ended December Quarter ended March Note: Processed transactions represent transactions involving Visa, Visa Electron, Interlink and Plus cards processed on Visa’s networks. Total transactions represent payments and cash transactions as reported by Visa clients on their operating certificates. From time to time, previously submitted transaction information may be updated. Prior period updates are not material. YOY Change 8% 8% 8% 8% |
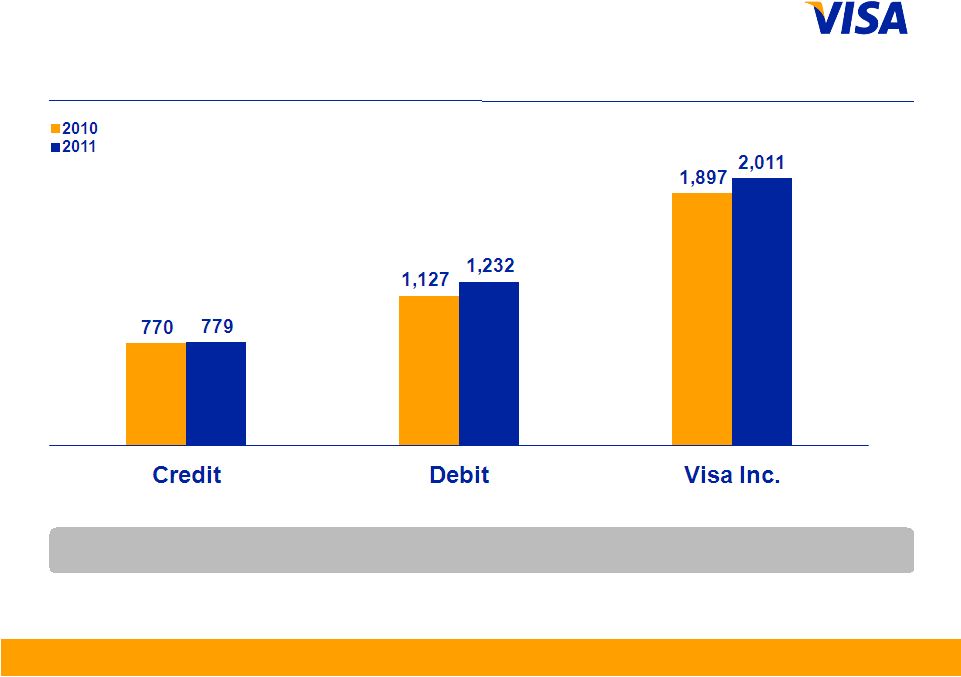 Second Quarter Fiscal 2012 Financial Results 9 Total Cards in millions, except percentages YOY Change 9% 6% 1% Note: From time to time, previously submitted card information may be updated. Prior period updates are not material. Quarter ended December |
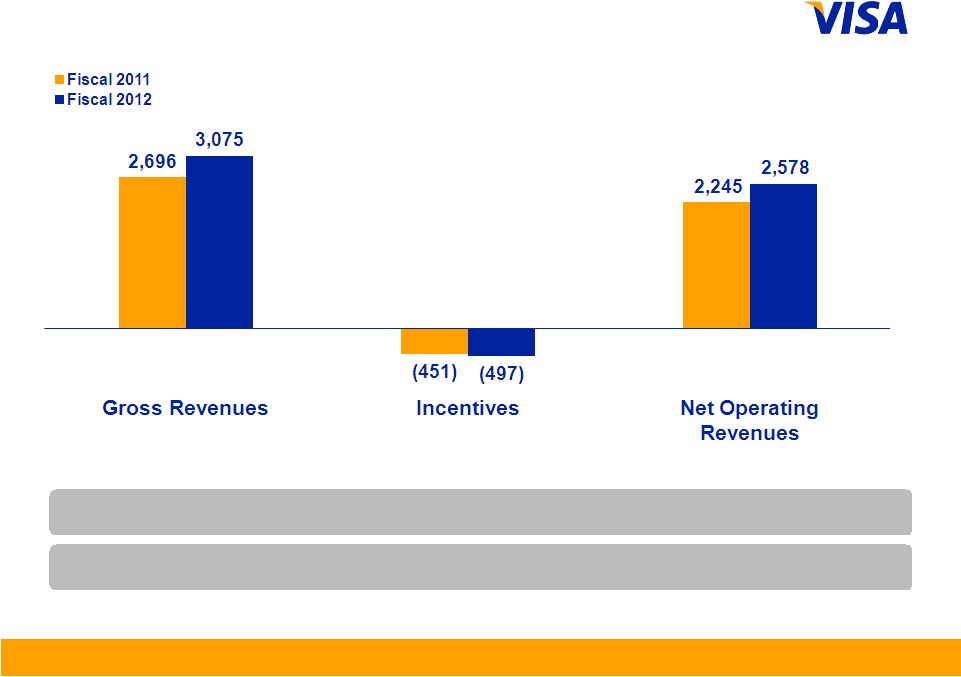 Second Quarter Fiscal 2012 Financial Results 10 Revenue – Q2 2012 US$ in millions, except percentages YOY Change 10% 15% 14% Note: Growth rates and percentage of gross revenues calculated based on whole numbers, not rounded numbers. FY12 % of Gross Revenues 16% 84% |
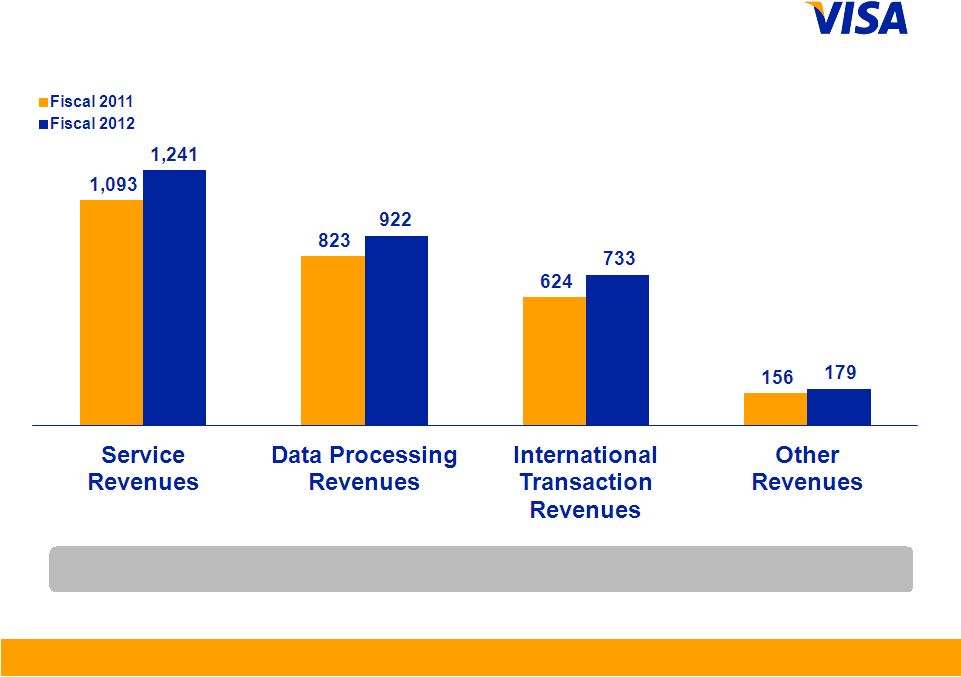 Second Quarter Fiscal 2012 Financial Results 11 Revenue Detail – Q2 2012 US$ in millions, except percentages Note: Growth rates calculated based on whole numbers, not rounded numbers. YOY Change 12% 17% 13% 14% |
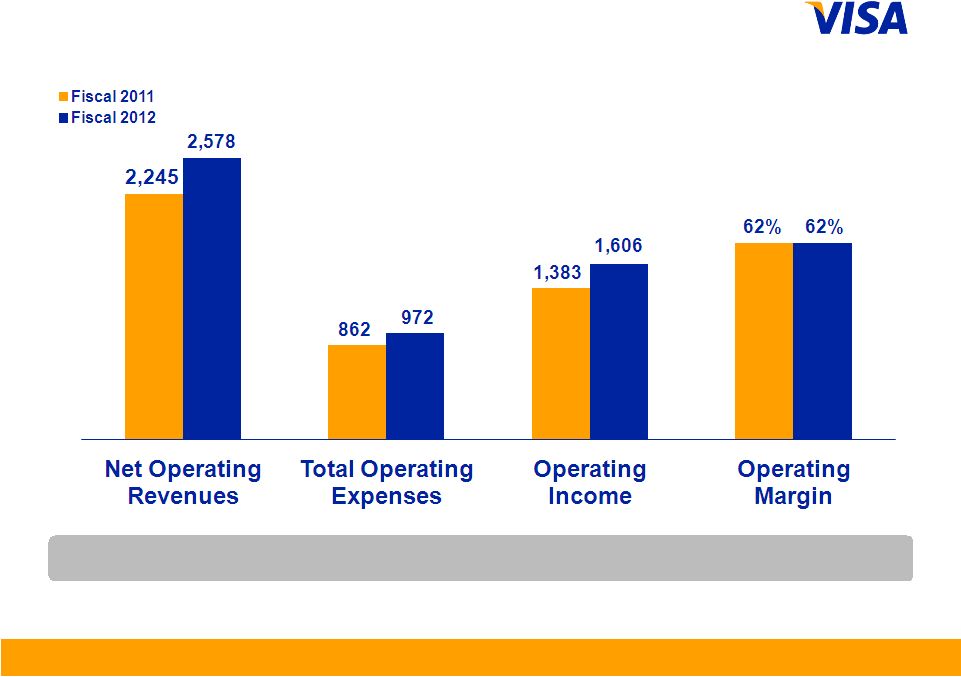 Second Quarter Fiscal 2012 Financial Results 12 Operating Margin – Q2 2012 US$ in millions, except percentages Note: Growth rates calculated based on whole numbers, not rounded numbers. YOY Change 13% 16% 15% NM |
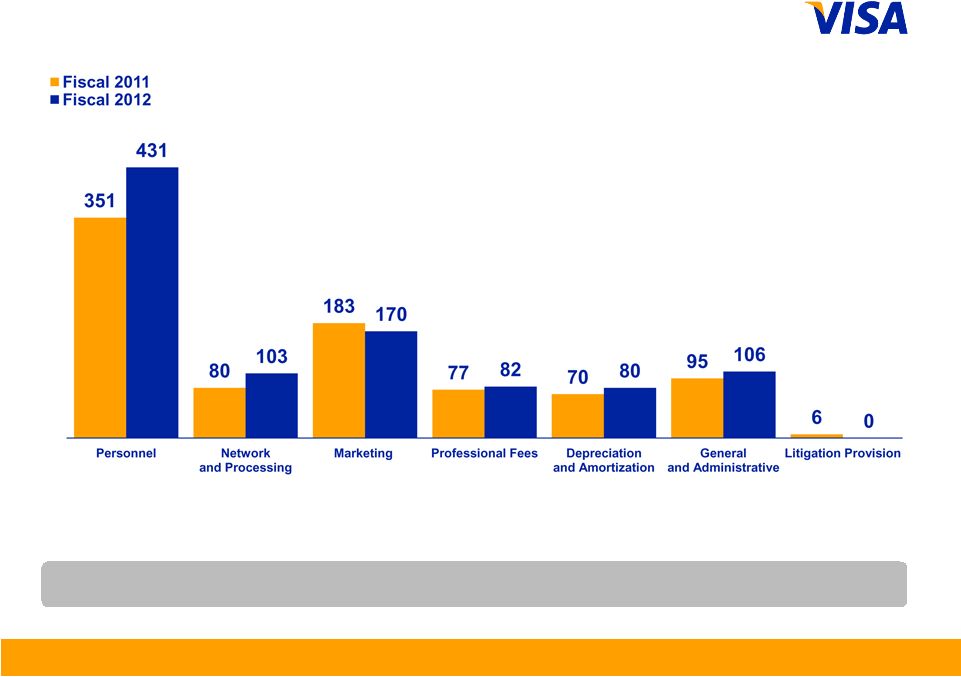 Second Quarter Fiscal 2012 Financial Results 13 Operating Expenses – Q2 2012 US$ in millions, except percentages Note: Growth rates calculated based on whole numbers, not rounded numbers. YOY Change 6% 16% 28% NM 12% (7%) 23% |
 Second Quarter Fiscal 2012 Financial Results 14 Other Financial Results • Cash, cash equivalents, restricted cash, and available-for-sale investment securities of $8.9 billion at the end of the fiscal second quarter, which includes $4.3 billion of restricted cash in the litigation escrow account • Free cash flow of $1.1 billion for the fiscal second quarter • Capital expenditures of $61 million during the fiscal second quarter |
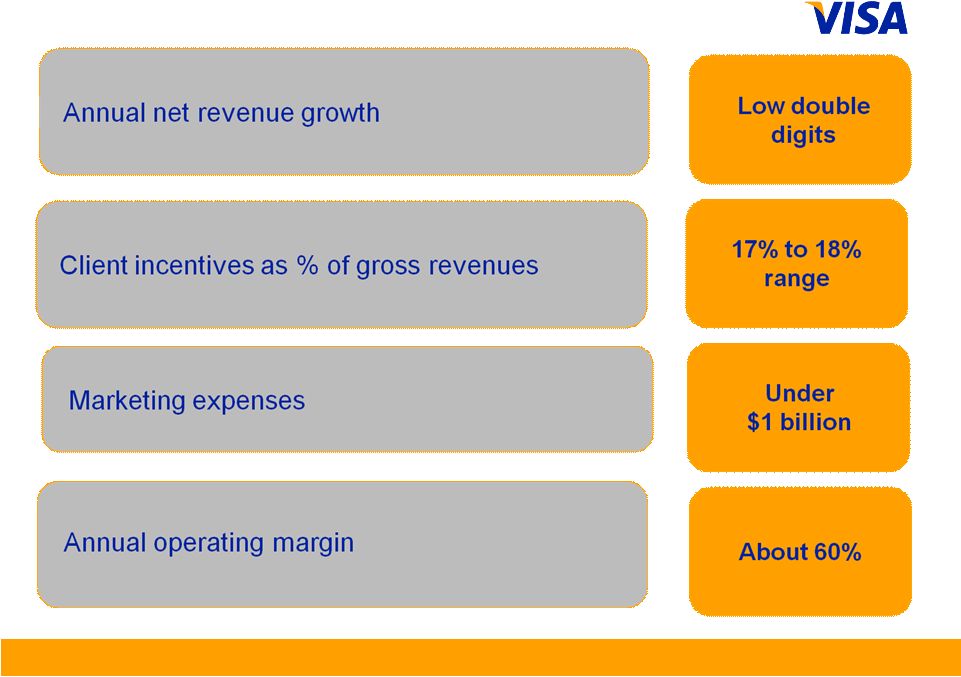 Second Quarter Fiscal 2012 Financial Results 15 Financial Metrics for Fiscal Year 2012 |
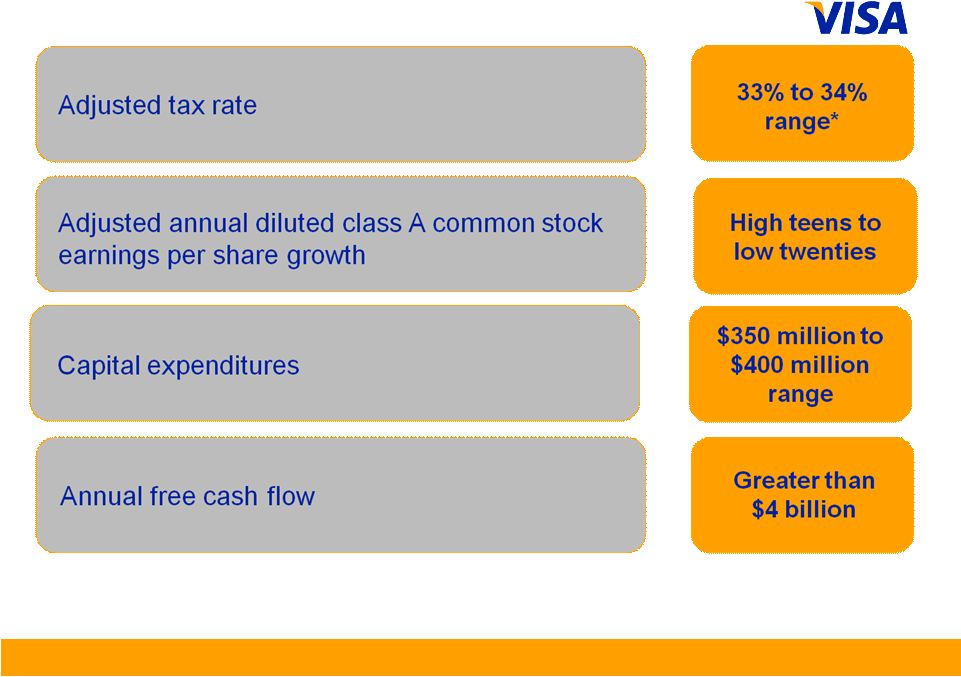 Second Quarter Fiscal 2012 Financial Results 16 Financial Metrics for Fiscal Year 2012 * Excludes the impact of one-time non-cash remeasurement of our existing net deferred tax liabilities, which would decrease the GAAP tax rate to 29% to 30%. These deferred tax liabilities are primarily associated with indefinite-lived intangible assets recorded as part of Visa’s October 2007 reorganization. |
 Appendix Reconciliation of Non-GAAP Measures |
   Second Quarter Fiscal 2012 Financial Results Reconciliation of Non-GAAP Financial Results US$ in millions, except per share data During the three months ended March 31, 2012, the state of California approved certain changes to its state tax apportionment rules, effective retroactively to the beginning of fiscal 2012, which lowered our overall state tax rate. As a result, in our income tax provision for the three months ended March 31, 2012, we recorded a one-time, non- cash benefit of $208 million resulting from the remeasurement of our existing net deferred tax liabilities primarily associated with $11 billion of indefinite-lived intangible assets previously recorded to reflect our reorganization in 2007. This adjustment has no cash impact to us. Management therefore believes that the resulting net income recorded is not indicative of Visa’s financial performance in the current or future periods. Management believes the presentation of adjusted net income and adjusted diluted earnings per share provides a clearer understanding of our operating performance for the periods. A1 Net income attributable to Visa Inc. Fully-diluted earnings per share (1) Net income attributable to Visa Inc. Fully-diluted earnings per share (1) As reported $1,292 $1.91 $2,321 $3.40 Impact of deferred tax adjustment (208) (0.31) (208) (0.30) Adjusted $1,084 $1.60 $2,113 $3.09 Weighted-average number of diluted shares (as reported) 676 683 (1) Earnings per share figures calculated based on whole numbers, not rounded numbers. Six Months Ended March 31, 2012 Three Months Ended March 31, 2012 Note: There were no comparable adjustments in the three months ended March 31, 2011. As such, we do not present adjusted results for that period. |
   Second Quarter Fiscal 2012 Financial Results Reconciliation of Non-GAAP Financial Results A2 As discussed in the previous slide, during the three months ended March 31, 2012, we recorded a one-time, non-cash benefit resulting from the remeasurement of our existing net deferred tax liabilities. This adjustment has no cash impact to us. Management therefore believes that the resulting benefit recorded in our effective income tax rates is not indicative of our financial performance in the current or future periods. Management believes the presentation of our adjusted effective income tax rates provides a clearer understanding of our operating performance for these periods. Three Months Ended March 31, 2012 (1) Six Months Ended March 31, 2012 (1) Effective income tax rate (as reported) 19.7% 28.1% Remeasurement of deferred tax liabilities 12.9% 6.4% Adjusted effective income tax rate 32.6% 34.6% (1) Effective income tax rate calculated based on whole numbers, not rounded numbers. Note: There were no comparable adjustments in the three months ended March 31, 2011. As such, we do not present adjusted results for that period. |
     Second Quarter Fiscal 2012 Financial Results Calculation of Free Cash Flow US$ in millions A3 (1) Includes changes in client incentives, trade receivable/payable, settlement receivable/payable, and personnel incentives. Additions (+) / Reductions (-) to Net income attributable to Visa Inc. Net income attributable to Visa Inc. (as reported) 1,292 2,321 Capital Assets + Depreciation and amortization 80 160 - Capital expenditures (61) (127) 19 33 Litigation + Litigation provision - - + Accretion expense - 1 - Settlement payments (70) (140) + Settlement payments funded by litigation escrow 70 140 - 1 Share-based Compensation + Share-based compensation 38 76 Pension + Pension expense 11 22 - Pension contribution - - 11 22 Taxes + Income tax expense 317 907 - Income taxes paid (1,014) (1,071) (697) (164) Changes in Working Capital (1) +/- Changes in other working capital accounts 413 151 Total Free Cash Flow 1,076 2,440 Three Months Ended March 31, 2012 Six Months Ended March 31, 2012 |