 Visa Inc. Fiscal First Quarter 2014 Financial Results January 30, 2014 Exhibit 99.2 |
Fiscal First Quarter 2014 Financial Results 2 Forward-Looking Statements This presentation contains forward-looking statements within the meaning of the U.S. Private Securities Litigation Reform Act of 1995. Forward-looking statements generally are identified by words such as "believes," "estimates," "expects," "intends," "may," "projects," "could," "should," "will," "will continue" and other similar expressions. Examples of forward-looking statements include, but are not limited to, statements we make about our revenue, client incentives, operating margin, earnings per share, free cash flow, and the growth of those items. By their nature, forward-looking statements: (i) speak only as of the date they are made; (ii) are not statements of historical fact or guarantees of future performance; and (iii) are subject to risks, uncertainties, assumptions or changes in circumstances that are difficult to predict or quantify. Therefore, actual results could differ materially and adversely from our forward-looking statements due to a variety of factors, including the following: • the impact of laws, regulations and marketplace barriers, including: • rules capping debit interchange reimbursement rates and expanding financial institutions’ and merchants’ choices among debit payment networks promulgated under the Dodd-Frank Wall Street Reform and Consumer Protection Act; • increased regulation in jurisdictions outside of the United States and in other product categories; • increased government support of national payment networks outside the United States; and • increased regulation on consumer privacy, data use and security; • developments in litigation and government enforcement, including those affecting interchange reimbursement fees, antitrust and tax; • new lawsuits, investigations or proceedings, or changes to our potential exposure in connection with pending lawsuits, investigations or proceedings; • economic factors, such as: • economic fragility in the Eurozone and in the United States; • general economic, political and social conditions in mature and emerging markets globally; • material changes in cross-border activity, foreign exchange controls and fluctuations in currency exchange rates; and • material changes in our financial institution clients' performance compared to our estimates; • industry developments, such as competitive pressure, rapid technological developments and disintermediation from our payments network; • system developments, such as: • disruption of our transaction processing systems or the inability to process transactions efficiently; • account data breaches or increased fraudulent or other illegal activities involving Visa-branded cards or payment products; and • failure to maintain systems interoperability with Visa Europe; • costs arising if Visa Europe were to exercise its right to require us to acquire all of its outstanding stock; • the loss of organizational effectiveness or key employees; • the failure to integrate acquisitions successfully or to effectively develop new products and businesses; • natural disasters, terrorist attacks, military or political conflicts, and public health emergencies; and various other factors, including those contained in our Annual Report on Form 10-K for the year ended September 30, 2013, and our other filings with the U.S. Securities and Exchange Commission. You should not place undue reliance on such statements. Except as required by law, we do not intend to update or revise any forward–looking statements as a result of new information, future developments or otherwise. |
 Solid Fiscal First Quarter Results Strong operating revenues of $3.2 billion, up 11% over prior year Repurchased 5.5 million shares of class A common stock in the open market at an average price of $199.56 per share, using $1.1 billion of cash on hand Continued positive secular trends and spending momentum contributed to growth in key underlying business drivers Quarterly net income of $1.4 billion and diluted earnings per share of $2.20, up 9% and 14%, respectively, over prior year Fiscal First Quarter 2014 Financial Results 3 |
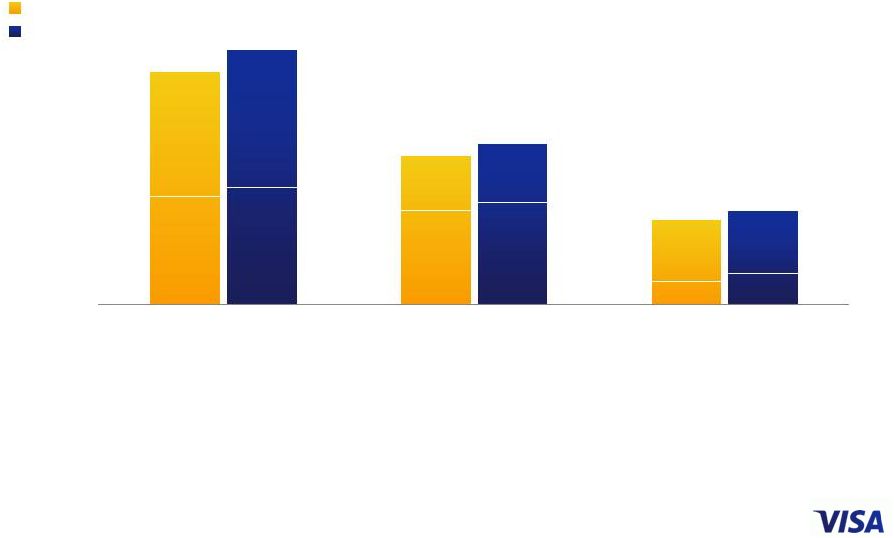 Fiscal First Quarter 2014 Financial Results 4 Quarter ended September Payments Volume US$ in billions, nominal, except percentages YOY Change (constant) 13% 13% 13% YOY Change (nominal) 8% 12% 10% Note: Figures may not recalculate exactly due to rounding. Percentage changes are calculated based on whole numbers, not the rounded numbers presented. From time to time, previously submitted volume information may be updated. Prior period updates are not material. Constant dollar growth rates exclude the impact of foreign currency fluctuations against the U.S. dollar in measuring performance. INTL 393 INTL 420 INTL 93 INTL 109 U.S. 522 U.S. 575 U.S. 250 U.S. 277 U.S. 272 U.S. 298 1,007 643 365 1,104 697 407 Total Visa Inc. Credit Debit 2012 2013 INTL 486 INTL 529 INTL = International |
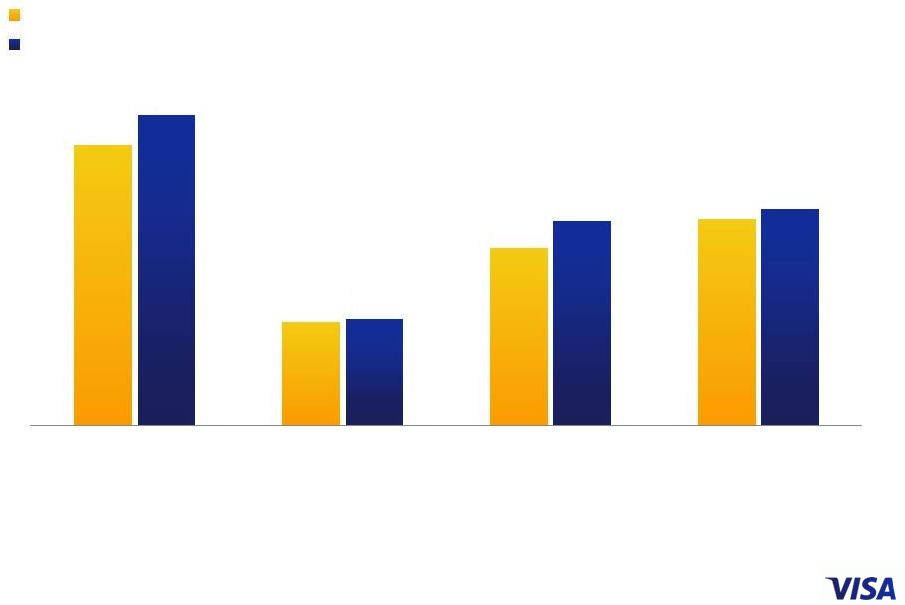
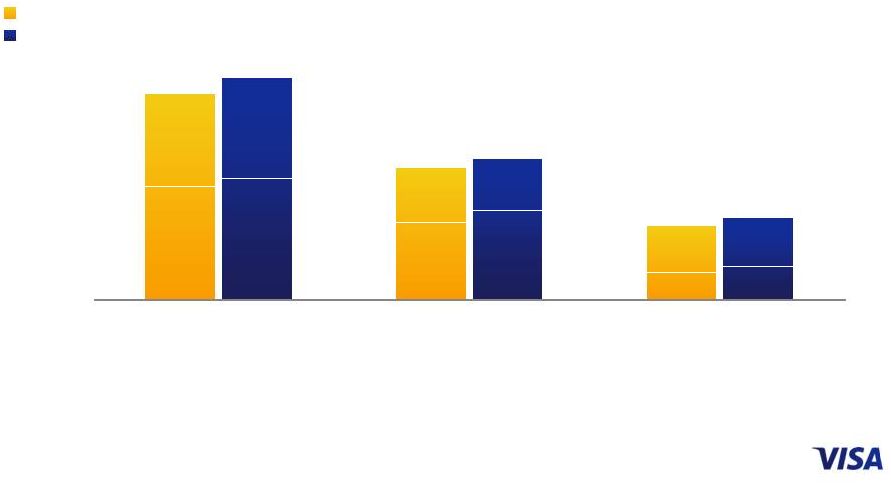 Fiscal First Quarter 2014 Financial Results 5 Quarter ended December Payments Volume US$ in billions, nominal, except percentages YOY Change (constant) 11% 11% 12% YOY Change (nominal) 7% 10% 8% Note: Current quarter payments volume and other select metrics are provided in the operational performance data supplement in the Press Release to provide more recent operating data. Service revenues continue to be recognized based on payments volume in the prior quarter. From time to time, reported payments volume information may be updated to reflect revised client submissions or other adjustments. Prior period updates are not material. Figures may not recalculate exactly due to rounding. Percentage changes are calculated based on whole numbers, not the rounded numbers presented. INTL 425 INTL 449 INTL 105 INTL 124 U.S. 545 U.S. 590 U.S. 262 U.S. 287 U.S. 282 U.S. 303 1,075 688 387 1,163 736 427 Total Visa Inc. Credit Debit 2012 2013 INTL 530 INTL 573 INTL = International |
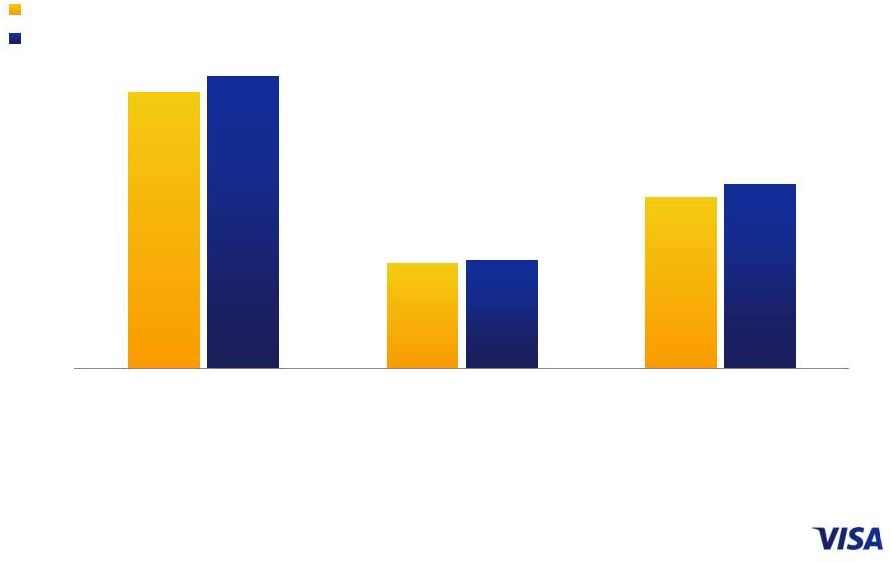
 Fiscal First Quarter 2014 Financial Results 6 Quarter ended December Transactions in millions, except percentages Note: Processed transactions represent transactions involving Visa, Visa Electron, Interlink and Plus cards processed on Visa’s networks. Total transactions represent payments and cash transactions as reported by Visa clients on their operating certificates. From time to time, previously submitted transaction information may be updated. Prior period updates are not material. Figures may not recalculate exactly due to rounding. Percentage changes are calculated based on whole numbers, not the rounded numbers presented. Credit 38% YOY Change 9% 13% Debit 62% Credit 38% 21,557 14,159 23,597 15,985 Total Transactions Processed Transactions 2012 2013 Debit 62% |
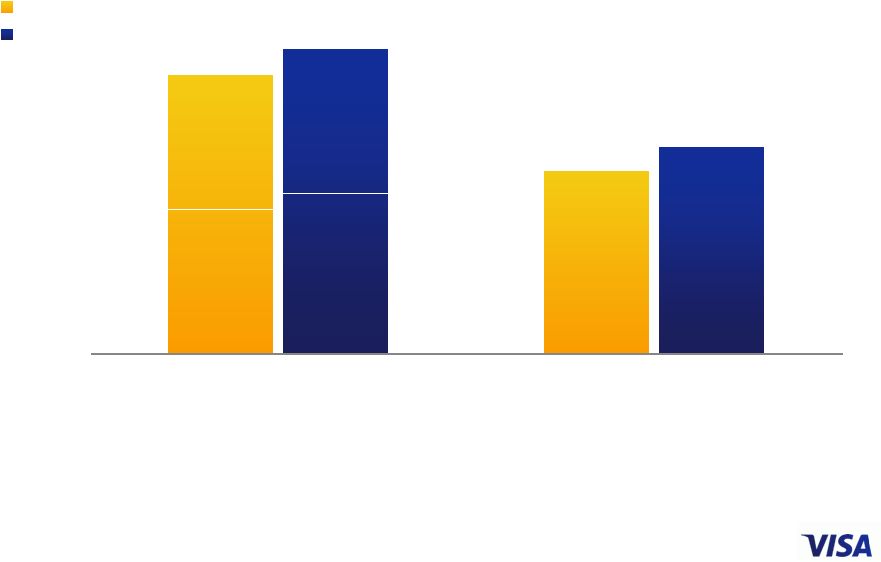
 Quarter ended September Total Cards in millions, except percentages Note: The data presented is based on results reported quarterly by Visa clients on their operating certificates. Estimates may be utilized if data is unavailable. From time to time, previously submitted card information may be updated. Prior period updates are not material. Figures may not recalculate exactly due to rounding. Percentage changes are calculated based on whole numbers, not the rounded numbers presented. YOY Change 3% 8% 6% 2,067 789 1,278 2,188 811 1,377 Visa Inc. Credit Debit 2012 2013 Fiscal First Quarter 2014 Financial Results 7 |
 Fiscal First Quarter 2014 Financial Results 8 Revenue – Q1 2014 US$ in millions, except percentages Note: Figures may not recalculate exactly due to rounding. Percentage changes are calculated based on whole numbers, not the rounded numbers presented. YOY Change 8% 11% 10% Fiscal 2014 % of Gross Revenues 16% 84% 3,399 (553) 2,846 3,754 (599) 3,155 Gross Revenues Incentives Net Operating Revenues Fiscal 2013 Fiscal 2014 |
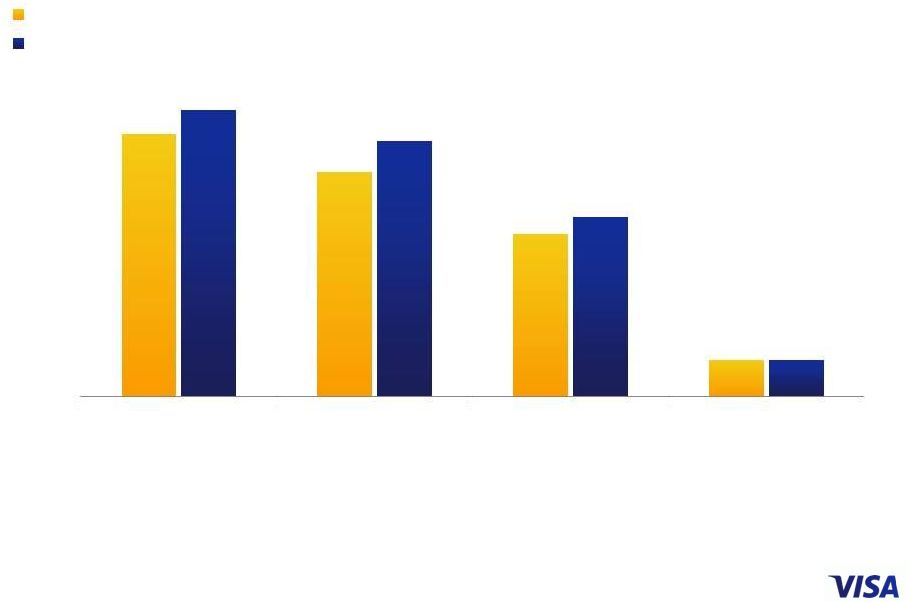 Fiscal First Quarter 2014 Financial Results 9 Revenue Detail – Q1 2014 US$ in millions, except percentages Note: Figures may not recalculate exactly due to rounding. Percentage changes are calculated based on whole numbers, not the rounded numbers presented. YOY Change 13% 11% 9% 0% 1,300 1,115 805 179 1,419 1,264 891 180 Service Revenues Data Processing Revenues International Transaction Revenues Other Revenues Fiscal 2013 Fiscal 2014 |
 Fiscal First Quarter 2014 Financial Results 10 Operating Margin – Q1 2014 US$ in millions, except percentages Note: Operating margin is calculated as operating income divided by net operating revenues. Figures may recalculate exactly due to rounding. Percentage changes are calculated based on whole numbers, not the rounded numbers presented. YOY Change 3% 15% 11% 3 ppts 2,846 1,046 1,800 63% 3,155 1,078 2,077 66% Net Operating Revenues Total Operating Expenses Operating Income Operating Margin Fiscal 2013 Fiscal 2014 |
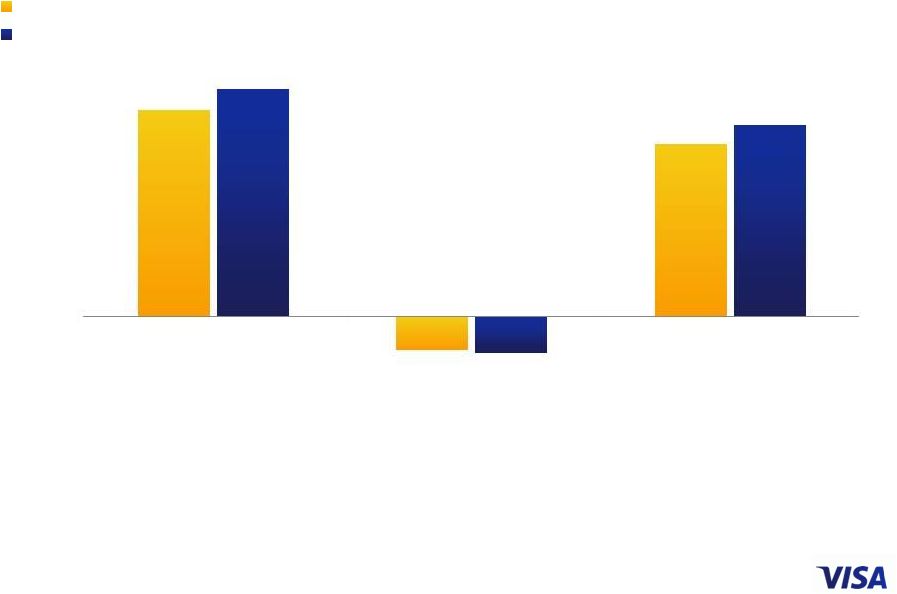
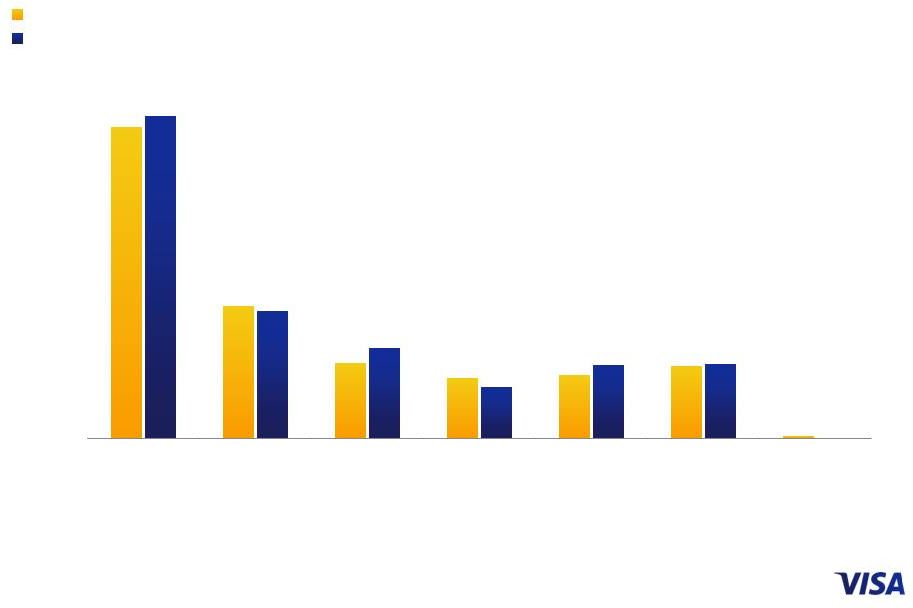 Note: Figures may not recalculate exactly due to rounding. Percentage changes are calculated based on whole numbers, not the rounded numbers presented. YOY Change 20% (15%) 4% 2% 16% (4%) NM Operating Expense – Q1 2014 US$ in millions, except percentages Fiscal First Quarter 2014 Financial Results 11 454 193 110 88 92 106 3 470 186 132 75 107 108 0 Personnel Marketing Network & Processing Professional Fees Depreciation & Amortization General & Administrative Litigation Provision Fiscal 2013 Fiscal 2014 |
Fiscal First Quarter 2014 Financial Results 12 Other Financial Results • Cash, cash equivalents and available-for-sale investment securities of $7.0 billion at the end of the fiscal first quarter • Free cash flow of $1.6 billion for the fiscal first quarter • Capital expenditures of $120 million during the fiscal first quarter |
 Fiscal First Quarter 2014 Financial Results 13 Financial Metrics for Fiscal Year 2014 Annual net revenue growth Client incentives as % of gross revenues Annual operating margin Annual diluted class A common stock earnings per share growth Annual free cash flow • Low double-digits on a constant dollar basis • Negative 2 ppts foreign currency impact • 16.5% to 17.5% range • Low 60s • Mid to high teens • About $5 billion |
 Appendix |
 Fiscal First Quarter 2014 Financial Results Calculation of Free Cash Flow US$ in millions A-1 Additions (+) / Reductions (-) to Net income Net income (as reported) 1,407 Capital Assets + Depreciation and amortization 107 - Capital expenditures (120) (13) Litigation + Litigation provision - - Settlement payments (1) + Settlement payments funded by litigation escrow - (1) Share-based Compensation + Share-based compensation 45 Pension + Pension expense 2 - Pension contribution - 2 Taxes + Income tax provision 676 - Income taxes paid (96) 580 Changes in Working Capital (1) +/- Changes in other working capital accounts (443) Total Free Cash Flow 1,577 Three Months Ended December 31, 2013 Includes changes in client incentives, trade receivable/payable, settlement receivable/payable and personnel incentives. (1) |