|
Exhibit 99.2 
|
Visa Inc.
Fiscal Second Quarter 2016 Financial Results
April 21, 2016
Forward-Looking Statements
This presentation contains forward-looking statements within the meaning of the U.S. Private Securities Litigation Reform Act of 1995. Forward-looking statements generally are identified by words such as “estimates,” believe, outlook, “will,” “continue” and other similar expressions. Examples of forward-looking statements include, but are not limited to, statements we make about our revenue, client incentives, operating margin, tax rate, earnings per share, free cash flow, and the growth of those items.
By their nature, forward-looking statements: (i) speak only as of the date they are made; (ii) are not statements of historical fact or guarantees of future performance; and (iii) are subject to risks, uncertainties, assumptions or changes in circumstances that are difficult to predict or quantify. Therefore, actual results could differ materially and adversely from our forward-looking statements due to a variety of factors, including the following: the impact of laws, regulations and marketplace barriers, including: increased regulation of fees, transaction routing, payment card practices or other aspects of the payments industry in the U.S., including new or revised regulations issued under the Dodd-Frank Wall Street Reform and Consumer Protection Act; increased regulation in jurisdictions outside of the U.S.; increased government support of national payments networks outside the U.S.; and increased regulation of consumer privacy, data use and security; developments in litigation and government enforcement, including those affecting interchange reimbursement fees, antitrust and tax; new lawsuits, investigations or proceedings, or changes to our potential exposure in connection with pending lawsuits, investigations or proceedings; economic factors, such as: economic fragility in the Eurozone, the U.S. and in other advanced and emerging markets; general economic, political and social conditions in mature and emerging markets globally; general stock market fluctuations which may impact consumer spending; material changes in cross-border activity, foreign exchange controls and fluctuations in currency exchange rates; and material changes in our financial institution clients’ performance compared to our estimates; industry developments, such as competitive pressure, rapid technological developments and disintermediation from our payments network; system developments, such as: disruption of our transaction processing systems or the inability to process transactions efficiently; account data breaches or increased fraudulent or other illegal activities involving Visa-branded cards or payment products; and failure to maintain systems interoperability with Visa Europe; the transaction with Visa Europe may not be consummated on the terms currently contemplated or at all; Visa Europe’s business may not be successfully integrated with our business or we may not achieve the anticipated benefits of the transaction; the costs and risks associated with the transaction with Visa Europe; matters arising in connection with Visa Europes or our efforts to comply with and satisfy applicable regulatory approvals and closing conditions relating to the transaction; the loss of organizational effectiveness or key employees; the failure to integrate acquisitions successfully or to effectively develop new products and businesses; natural disasters, terrorist attacks, military or political conflicts, and public health emergencies; and various other factors, including those more fully described in our filings with the U.S. Securities and Exchange Commission, including our Annual Report on Form 10K for the year ended September 30, 2015, and our subsequent reports on Forms 10-Q and 8-K.
You should not place undue reliance on such statements. Except as required by law, we do not intend to update or revise any forwardlooking statements as a result of new information, future developments or otherwise.
2 Fiscal Second Quarter 2016 Financial Results
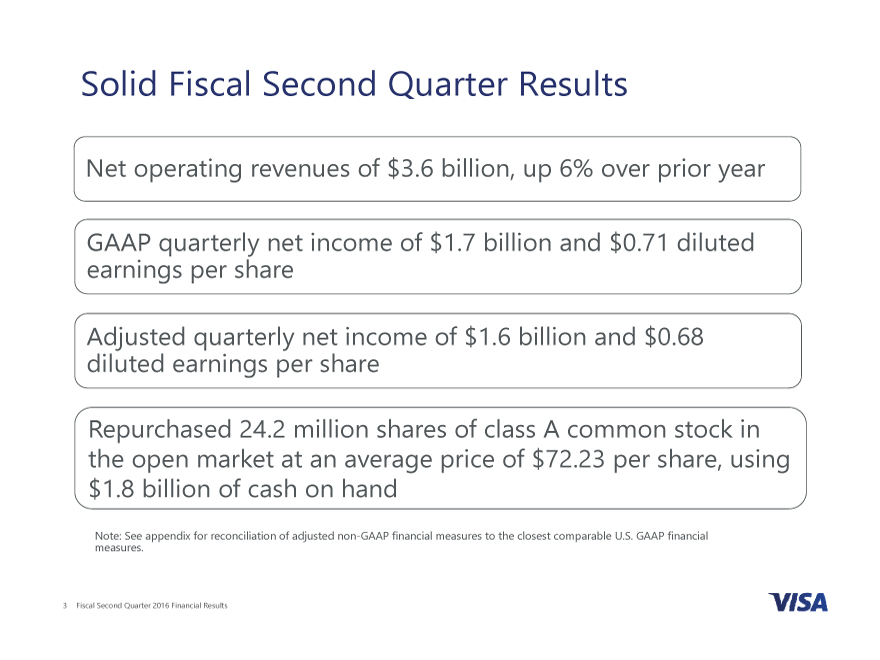
Solid Fiscal Second Quarter Results
Net operating revenues of $3.6 billion, up 6% over prior year
GAAP quarterly net income of $1.7 billion and $0.71 diluted earnings per share
Adjusted quarterly net income of $1.6 billion and $0.68 diluted earnings per share
Repurchased 24.2 million shares of class A common stock in the open market at an average price of $72.23 per share, using $1.8 billion of cash on hand
Note: See appendix for reconciliation of adjusted non-GAAP financial measures to the closest comparable GAAP financial measures.
3 Fiscal Second Quarter 2016 Financial Results
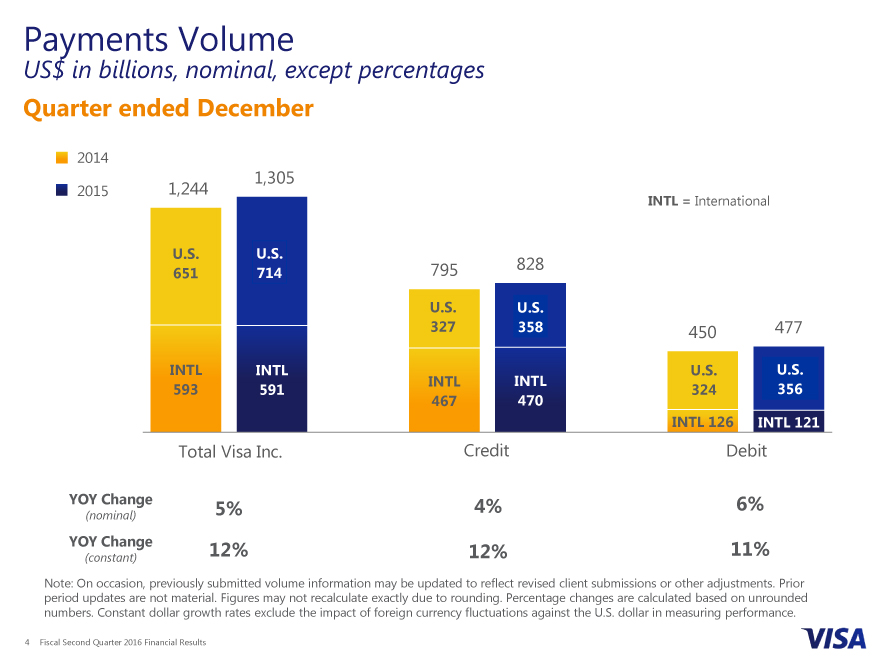
Payments Volume
US$ in billions, nominal, except percentages
Quarter ended December
2014
2015 1,244 1,305
INTL = International
U.S. U.S.
651 714 795 828
U.S. U.S.
327 358 450 477
INTL INTL U.S. U.S.
593 591 INTL INTL 324 356
467 470
INTL 126 INTL 121
Total Visa Inc. Credit Debit
YOY Change 5% 4% 6%
(nominal)
YOY Change 12% 12% 11%
(constant)
Note: On occasion, previously submitted volume information may be updated to reflect revised client submissions or other adjustments. Prior period updates are not material. Figures may not recalculate exactly due to rounding. Percentage changes are calculated based on unrounded numbers. Constant dollar growth rates exclude the impact of foreign currency fluctuations against the U.S. dollar in measuring performance.
4 Fiscal Second Quarter 2016 Financial Results
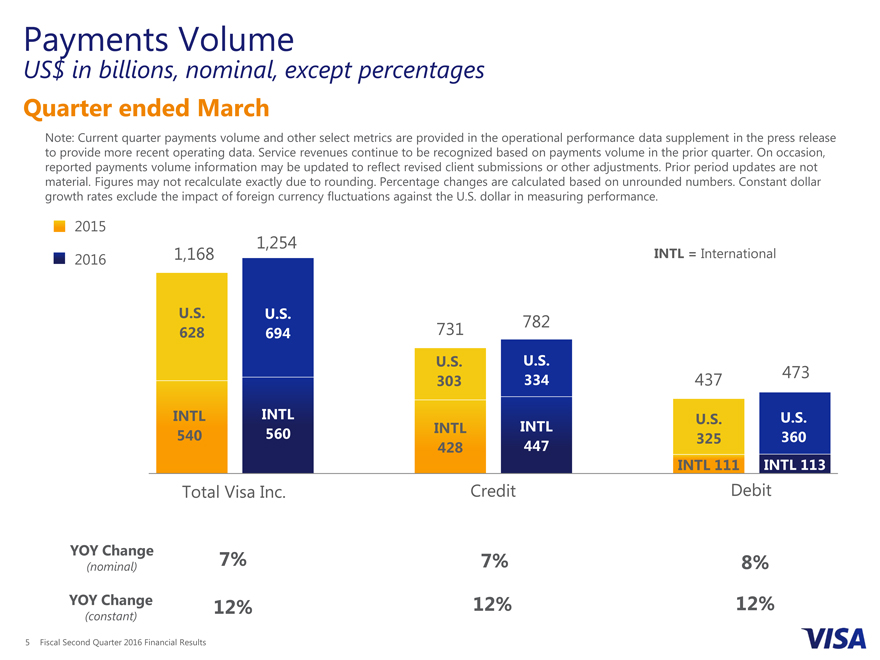
Payments Volume
US$ in billions, nominal, except percentages
Quarter ended March
Note: Current quarter payments volume and other select metrics are provided in the operational performance data supplement in the press release to provide more recent operating data. Service revenues continue to be recognized based on payments volume in the prior quarter. On occasion, reported payments volume information may be updated to reflect revised client submissions or other adjustments. Prior period updates are not material. Figures may not recalculate exactly due to rounding. Percentage changes are calculated based on unrounded numbers. Constant dollar growth rates exclude the impact of foreign currency fluctuations against the U.S. dollar in measuring performance.
2015
1,254
2016 1,168 INTL = International
U.S. U.S.
628 U.S. 694U.S. 731 782
575 631 U.S. U.S.
303 U.S. U. 334 S. 437 473
277 313
INTL INTL U.S. U.S.
540 560 INTL INTL INTL INTL U.S. 325 U.S. 360
428 447 298 319
420 457 INTL 111 INTL 113
INTL 109 INTL 127
Total Visa Inc. Credit Debit
YOY Change
(nominal) 7% 7% 8%
YOY Change 12% 12% 12%
(constant)
5 Fiscal Second Quarter 2016 Financial Results
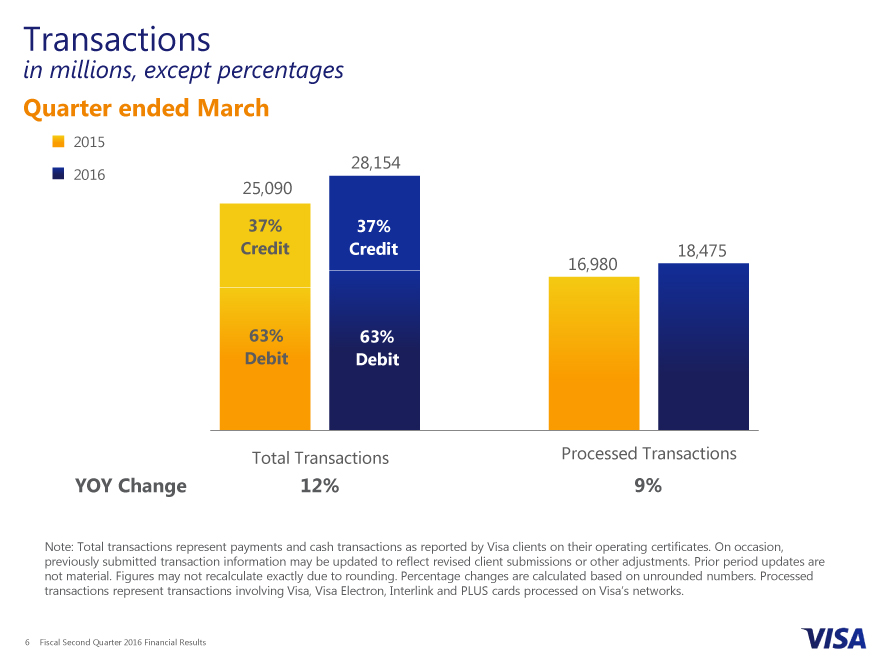
Transactions
in millions, except percentages
Quarter ended March
2015
2016 28,154
25,090
37% 37%
Credit Credit 18,475
Credit Credit 16,980
38% 38%
63% 63%
Debit Debit
Debit
62%
Total Transactions Processed Transactions
YOY Change 12% 9%
Note: Total transactions represent payments and cash transactions as reported by Visa clients on their operating certificates. On occasion, previously submitted transaction information may be updated to reflect revised client submissions or other adjustments. Prior period updates are not material. Figures may not recalculate exactly due to rounding. Percentage changes are calculated based on unrounded numbers. Processed transactions represent transactions involving Visa, Visa Electron, Interlink and PLUS cards processed on Visas networks.
6 Fiscal Second Quarter 2016 Financial Results
[Graphic Appears Here]
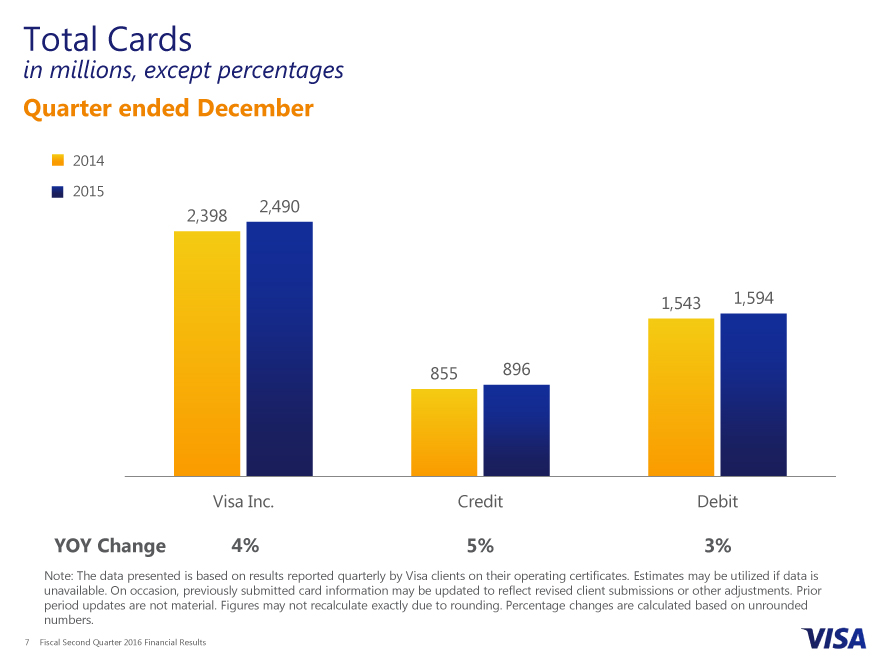
Total Cards
in millions, except percentages
Quarter ended December
2014 2015
2,490
2,398
1,543
1,594
855 896
Visa Inc. Credit Debit
YOY Change 4% 5% 3%
Note: The data presented is based on results reported quarterly by Visa clients on their operating certificates. Estimates may be utilized if data is unavailable. On occasion, previously submitted card information may be updated to reflect revised client submissions or other adjustments. Prior period updates are not material. Figures may not recalculate exactly due to rounding. Percentage changes are calculated based on unrounded numbers.
7 Fiscal Second Quarter 2016 Financial Results
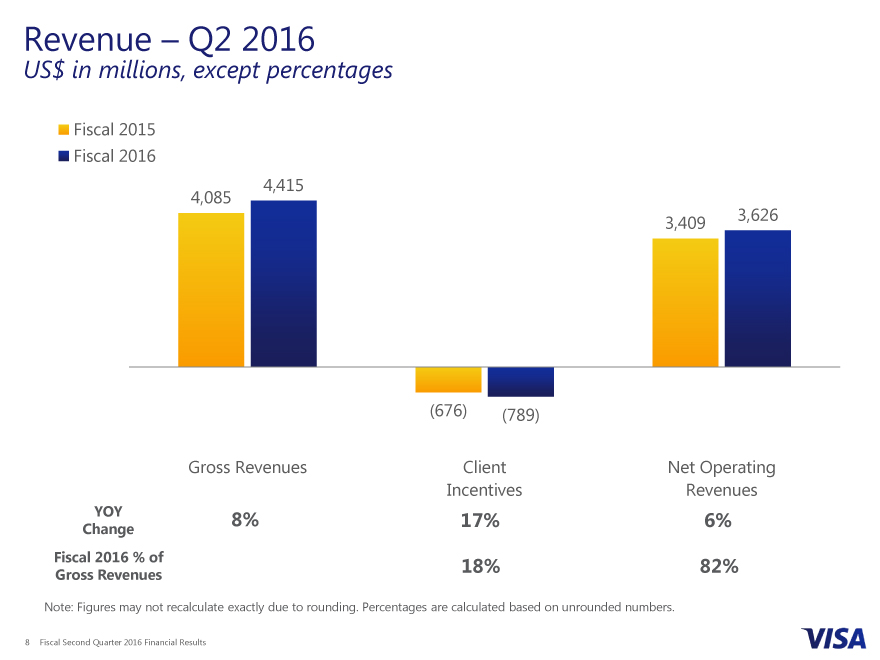
Revenue Q2 2016
US$ in millions, except percentages
Fiscal 2015
Fiscal 2016
4,415 4,085
3,409 3,626
(676)(789)
Gross Revenues Client Net Operating
Incentives Revenues
YOY 8% 17% 6%
Change
Fiscal 2016 % of 18% 82%
Gross Revenues
Note: Figures may not recalculate exactly due to rounding. Percentages are calculated based on unrounded numbers.
8 Fiscal Second Quarter 2016 Financial Results
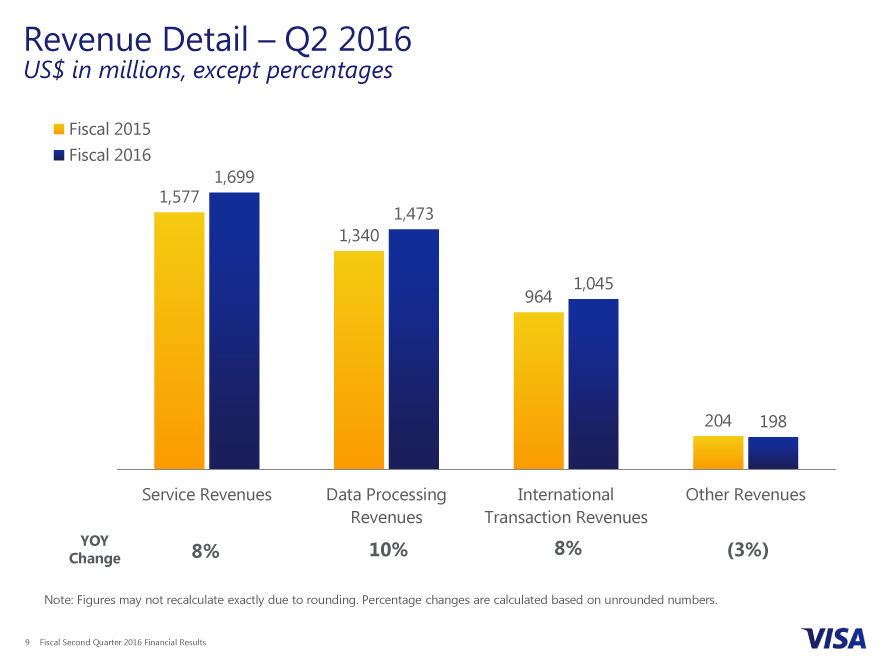
Revenue Detail Q2 2016
US$ in millions, except percentages
Fiscal 2015
Fiscal 2016
1,699
1,577
1,473
1,340
1,045
964
204 198
Service Revenues Data Processing International Other Revenues
Revenues Transaction Revenues
YOY 8% 10% 8%(3%)
Change
Note: Figures may not recalculate exactly due to rounding. Percentage changes are calculated based on unrounded numbers.
9 Fiscal Second Quarter 2016 Financial Results
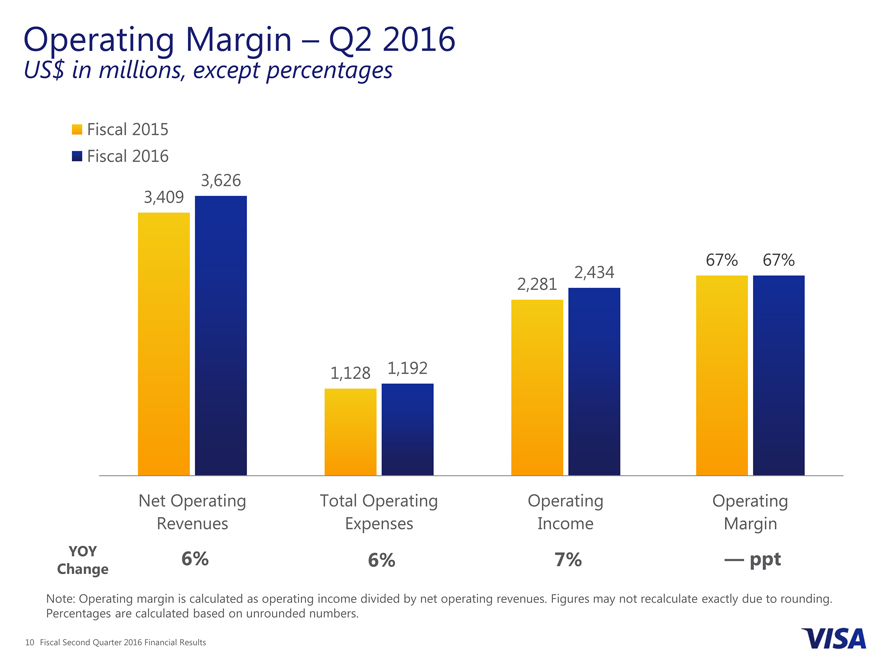
Operating Margin Q2 2016
US$ in millions, except percentages
Fiscal 2015
Fiscal 2016
3,409
3,626
67% 67% 2,434
2,281
1,128 1,192
Net Operating Total Operating Operating Operating
Revenues Expenses Income Margin
YOY 6% 6% 7% ppt
Change
Note: Operating margin is calculated as operating income divided by net operating revenues. Figures may not recalculate exactly due to rounding. Percentages are calculated based on unrounded numbers.
10 Fiscal Second Quarter 2016 Financial Results
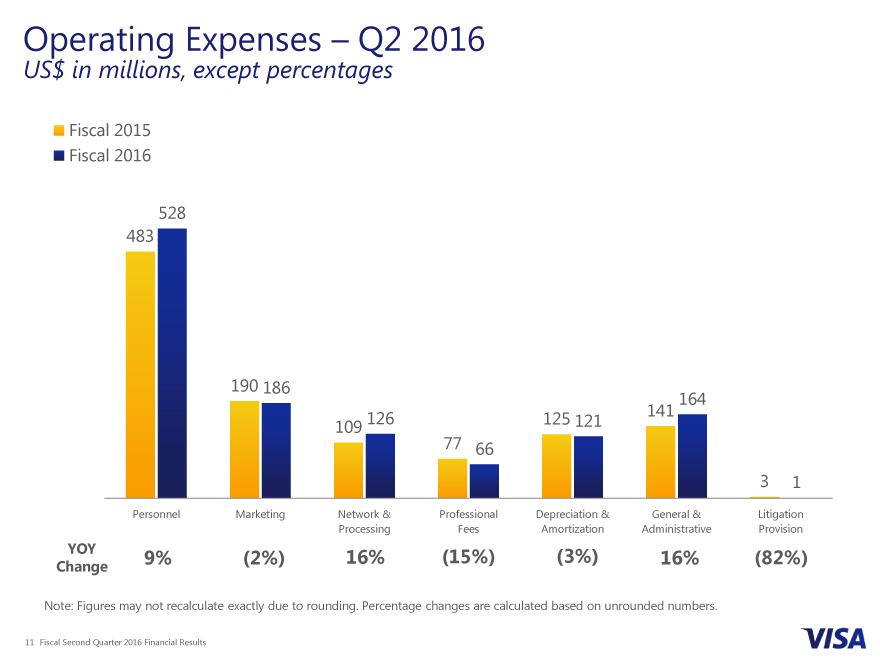
Operating Expenses Q2 2016
US$ in millions, except percentages
Fiscal 2015
Fiscal 2016
528
483
190 186 164
126 125 141
109 121
77 66
3 1
Personnel Marketing Network & Professional Depreciation & General & Litigation
Processing Fees Amortization Administrative Provision
YOY 9%(2%) 16%(15%)(3%) 16%(82%)
Change
Note: Figures may not recalculate exactly due to rounding. Percentage changes are calculated based on unrounded numbers.
11 Fiscal Second Quarter 2016 Financial Results
Other Financial Results
Cash, cash equivalents and available-for-sale investment securities of $23.4
billion at the end of the fiscal second quarter
Free cash flow of $830 million for the fiscal second quarter
Capital expenditures of $124 million during the fiscal second quarter
12 Fiscal Second Quarter 2016 Financial Results
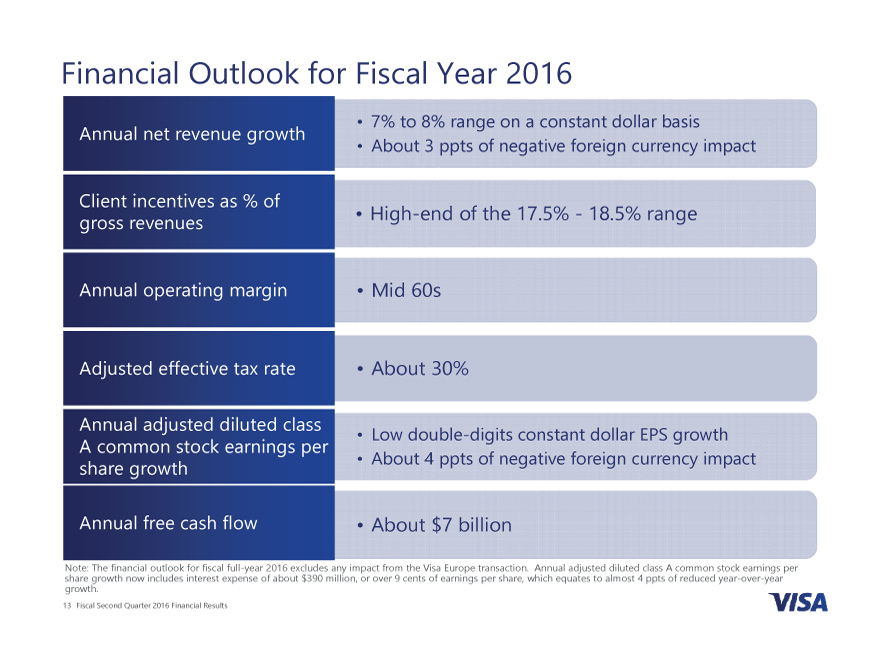
Financial Outlook for Fiscal Year 2016
Annual net revenue growth • 7% to 8% range on a constant dollar basis
• About 3 ppts of negative foreign currency impact
Client incentives as % of
gross revenues • High-end of the 17.5% - 18.5% range
Annual operating margin • Mid 60s
Adjusted effective tax rate • About 30%
Annual adjusted diluted class • Low double-digits constant dollar EPS growth
A common stock earnings per
share growth • About 4 ppts of negative foreign currency impact
Annual free cash flow • About $7 billion
Note: The financial outlook for fiscal full-year 2016 excludes any impact from the Visa Europe transaction. Annual adjusted diluted class A common stock earnings per share growth now includes interest expense of about $390 million, or over 9 cents of earnings per share, which equates to almost 4 ppts of reduced year-over-year
growth.
13 Fiscal Second Quarter 2016 Financial Results
Appendix
Reconciliation of Non-GAAP Financial Results
US$ in millions, except percentages and per share data
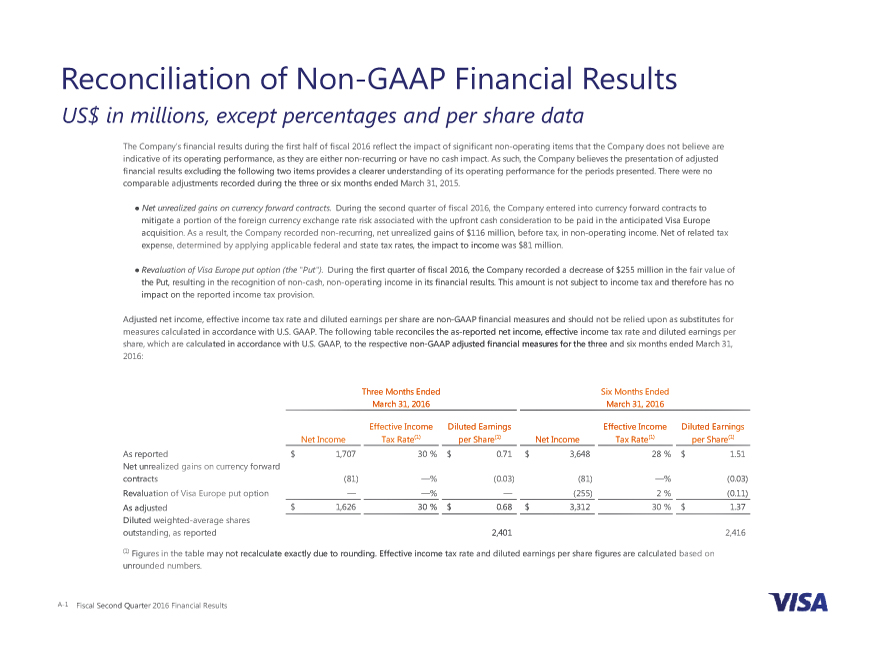
The Company’s financial results during the first half of fiscal 2016 reflect the impact of significant non-operating items that the Company does not believe are
indicative of its operating performance, as they are either non-recurring or have no cash impact. As such, the Company believes the presentation of adjusted
financial results excluding the following two items provides a clearer understanding of its operating performance for the periods presented. There were no
comparable adjustments recorded during the three or six months ended March 31, 2015.
Š Net unrealized gains on currency forward contracts. During the second quarter of fiscal 2016, the Company entered into currency forward contracts to
mitigate a portion of the foreign currency exchange rate risk associated with the upfront cash consideration to be paid in the anticipated Visa Europe
acquisition. As a result, the Company recorded non-recurring, net unrealized gains of $116 million, before tax, in non-operating income. Net of related tax
expense, determined by applying applicable federal and state tax rates, the impact to income was $81 million.
Š Revaluation of Visa Europe put option (the “Put”). During the first quarter of fiscal 2016, the Company recorded a decrease of $255 million in the fair value of
the Put, resulting in the recognition of non-cash, non-operating income in its financial results. This amount is not subject to income tax and therefore has no
impact on the reported income tax provision.
Adjusted net income, effective income tax rate and diluted earnings per share are non-GAAP financial measures and should not be relied upon as substitutes for
measures calculated in accordance with U.S. GAAP. The following table reconciles the as-reported net income, effective income tax rate and diluted earnings per
share, which are calculated in accordance with U.S. GAAP, to the respective non-GAAP adjusted financial measures for the three and six months ended March 31,
2016:
Three Months Ended Six Months Ended
March 31, 2016 March 31, 2016
Effective Income Diluted Earnings Effective Income Diluted Earnings
Net Income Tax Rate(1) per Share(1) Net Income Tax Rate(1) per Share(1)
As reported $ 1,707 30 % $ 0.71 $ 3,648 28 % $ 1.51
Net unrealized gains on currency forward
contracts (81) —% (0.03) (81) —% (0.03)
Revaluation of Visa Europe put option — —% — (255) 2 % (0.11)
As adjusted $ 1,626 30 % $ 0.68 $ 3,312 30 % $ 1.37
Diluted weighted-average shares
Calculation of Free Cash Flow
US$ in millions
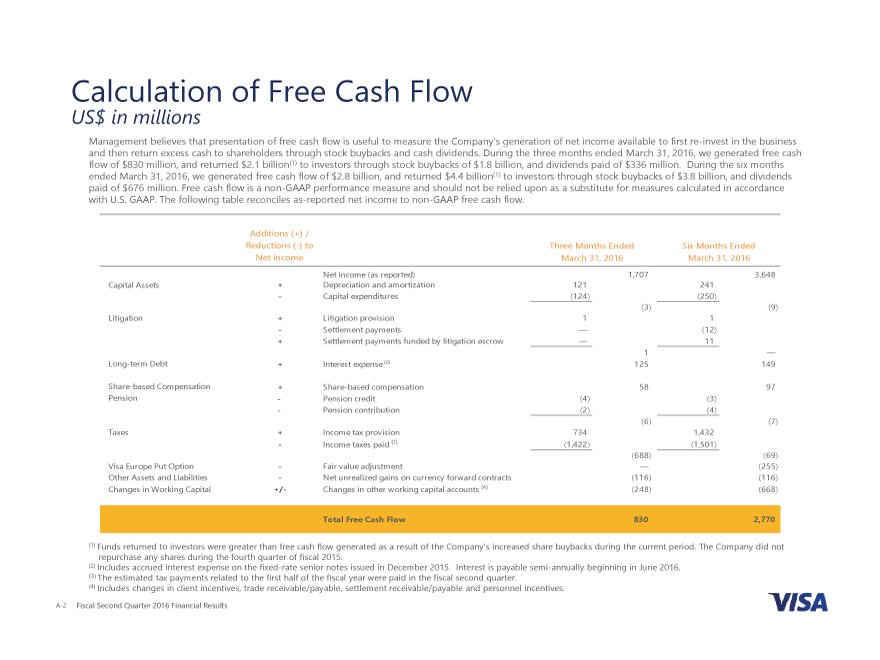
Management believes that presentation of free cash flow is useful to measure the Company’s generation of net income available to first re-invest in the business and then return excess cash to shareholders through stock buybacks and cash dividends. During the three months ended March 31, 2016, we generated free cash flow of $830 million, and returned $2.1 billion(1) to investors through stock buybacks of $1.8 billion, and dividends paid of $336 million. During the six months ended March 31, 2016, we generated free cash flow of $2.8 billion, and returned $4.4 billion(1) to investors through stock buybacks of $3.8 billion, and dividends paid of $676 million. Free cash flow is a non-GAAP performance measure and should not be relied upon as a substitute for measures calculated in accordance with U.S. GAAP. The following table reconciles as-reported net income to non-GAAP free cash flow.
Additions (+) /
Reductions (-) to Three Months Ended Six Months Ended
Net income March 31, 2016 March 31, 2016
Net income (as reported) 1,707 3,648
Capital Assets + Depreciation and amortization 121 241
- Capital expenditures (124) (250)
(3) (9)
Litigation + Litigation provision 1 1
- Settlement payments — (12)
+ Settlement payments funded by litigation escrow — 11
1 —
Long-term Debt + Interest expense (2) 125 149
Share-based Compensation + Share-based compensation 58 97
Pension - Pension credit (4) (3)
- Pension contribution (2) (4)
(6) (7)
Taxes + Income tax provision 734 1,432
- Income taxes paid (3) (1,422) (1,501)
(688) (69)
Visa Europe Put Option - Fair value adjustment — (255)
Other Assets and Liabilities - Net unrealized gains on currency forward contracts (116) (116)
Changes in Working Capital +/- Changes in other working capital accounts (4) (248) (668)
Total Free Cash Flow 830 2,770
(1) Funds returned to investors were greater than free cash flow generated as a result of the Company’s increased share buybacks during the current period. The Company did not repurchase any shares during the fourth quarter of fiscal 2015.
(2) Includes accrued interest expense on the fixed-rate senior notes issued in December 2015. Interest is payable semi-annually beginning in June 2016.
(3) The estimated tax payments related to the first half of the fiscal year were paid in the fiscal second quarter.
(4) Includes changes in client incentives, trade receivable/payable, settlement receivable/payable and personnel incentives.
A-2 Fiscal Second Quarter 2016 Financial Results