|
Exhibit 99.2 
|
Visa Inc.
Fiscal Third Quarter 2016 Financial Results
July 21, 2016
Forward-Looking Statements
This presentation contains forward-looking statements within the meaning of the U.S. Private Securities Litigation Reform Act of 1995. Forward-looking statements generally are identified by words such as “estimates,” “believe,“ “outlook,” “will,” “continue” and other similar expressions. Examples of forward-looking statements include, but are not limited to, statements we make about our revenue, client incentives, operating margin, tax rate, earnings per share, free cash flow, and the growth of those items.
By their nature, forward-looking statements: (i) speak only as of the date they are made; (ii) are not statements of historical fact or guarantees of future performance; and (iii) are subject to risks, uncertainties, assumptions or changes in circumstances that are difficult to predict or quantify. Therefore, actual results could differ materially and adversely from our forward-looking statements due to a variety of factors, including the following: the impact of laws, regulations and marketplace barriers, including: increased regulation of fees, transaction routing, payment card practices or other aspects of the payments industry in the U.S., including new or revised regulations issued under the Dodd-Frank Wall Street Reform and Consumer Protection Act;
increased regulation in Europe and other jurisdictions outside of the U.S.;
increased government support of national payments networks outside the U.S.; and increased regulation of consumer privacy, data use and security;
developments in litigation and government enforcement, including those affecting interchange reimbursement fees, antitrust and tax;
new lawsuits, investigations or proceedings, or changes to our potential exposure in connection with pending lawsuits, investigations or proceedings; economic factors, such as: uncertainty surrounding the Brexit, including the spillover to economic fragility in the Eurozone, the U.S. and in other advanced and emerging markets; general economic, political and social conditions in mature and emerging markets globally; general stock market fluctuations which may impact consumer spending; material changes in cross-border activity, foreign exchange controls and fluctuations in currency exchange rates; and material changes in our financial institution clients’ performance compared to our estimates;
industry developments, such as competitive pressure, rapid technological developments and disintermediation from our payments network;
system developments, such as:
disruption of our transaction processing systems or the inability to process transactions efficiently;
account data breaches or increased fraudulent or other illegal activities involving Visa-branded cards or payment products; and failure to maintain systems interoperability with Visa Europe; the loss of organizational effectiveness or key employees;
the failure to integrate acquisitions successfully, achieve the anticipated benefits of the acquisitions, or effectively develop new products and businesses; natural disasters, terrorist attacks, military or political conflicts, and public health emergencies; and various other factors, including those more fully described in our filings with the U.S. Securities and Exchange Commission, including our Annual Report on
Form 10-K for the year ended September 30, 2015, and our subsequent reports on Forms 10-Q and 8-K.
You should not place undue reliance on such statements. Except as required by law, we do not intend to update or revise any forward–looking statements as a result of new information, future developments or otherwise.
2 Fiscal Third Quarter 2016 Financial Results
Solid Fiscal Third Quarter Results
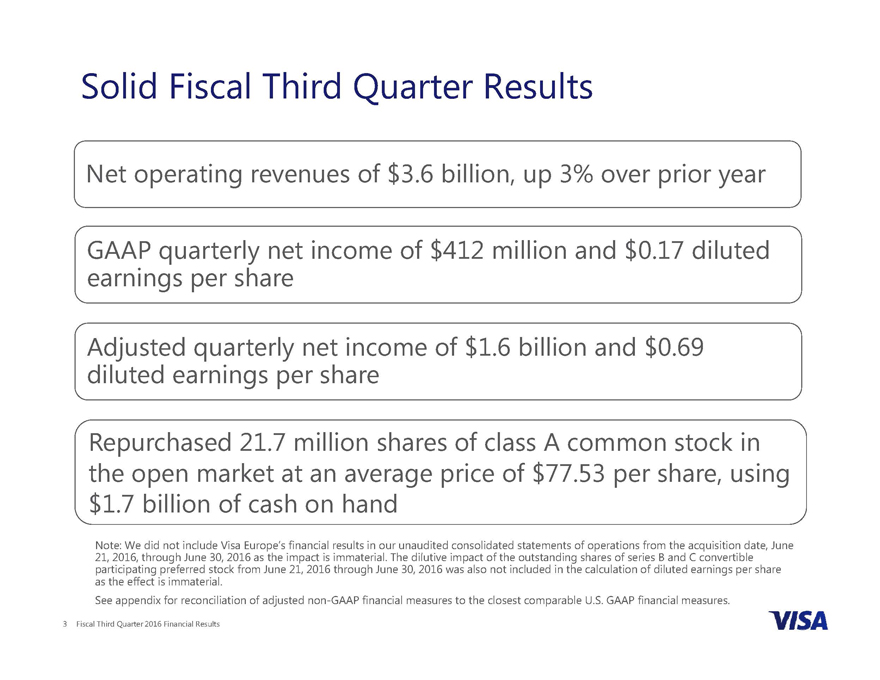
Net operating revenues of $3.6 billion, up 3% over prior year
earnings GAAP quarterly per share net income of $412 million and $0.17 diluted Adjusted diluted earnings quarterly per net share income of $1.6 billion and $0.69 Repurchased 21.7 million shares of class A common stock in the open market at an average price of $77.53 per share, using
$1.7 billion of cash on hand
21, Note: 2016, We through did not include June 30, Visa 2016 Europe’s as the impact financial is results immaterial in our . The unaudited dilutive impact consolidated of the statements outstanding of shares operations of series from B and the acquisition C convertible date, June as participating the effect is preferred immaterial stock . from June 21, 2016 through June 30, 2016 was also not included in the calculation of diluted earnings per share See appendix for reconciliation of adjusted non-GAAP financial measures to the closest comparable U.S. GAAP financial measures.
3 Fiscal Third Quarter 2016 Financial Results
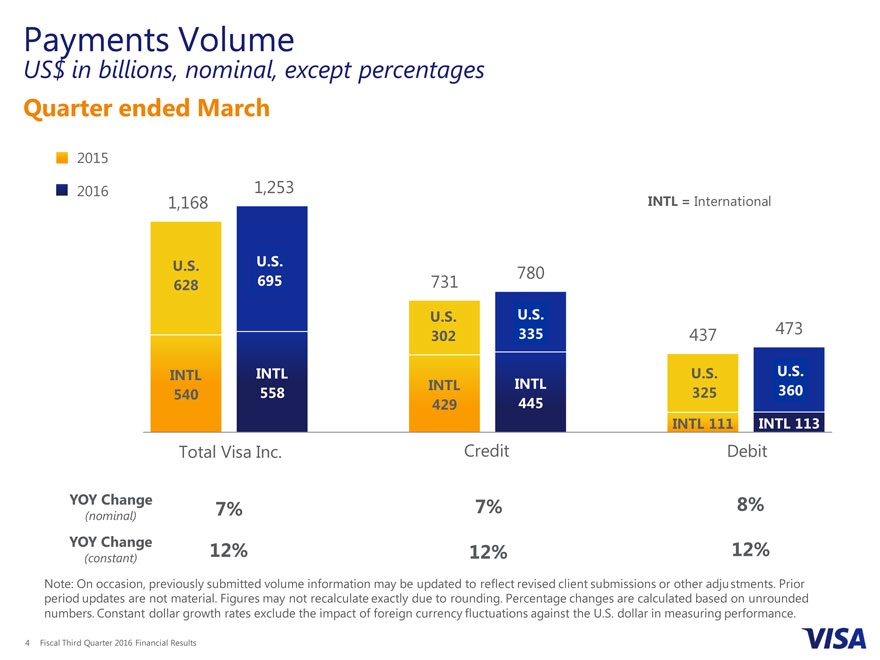
Payments Volume
US$ in billions, nominal, except percentages
Quarter ended March
2015
2016 1,253
1,168 INTL = International
U.S. [SERIES NAME] 780
628 [VALUE] 731
U.S.[SERIES NAME]
302[VALUE]437473
[SERIES NAME] INTL U.S.[SERIES NAME]
[VALUE] 558 [SERIES NAME]INTL325[VALUE]
[VALUE]445
INTL 111INTL 113
Total Visa Inc. Credit Debit
YOY Change 7% 7%8%
(nominal)
YOY Change 12% 12%12%
(constant)
Note: On occasion, previously submitted volume information may be updated to reflect revised client submissions or other adjustments. Prior period updates are not material. Figures may not recalculate exactly due to rounding. Percentage changes are calculated based on unrounded numbers. Constant dollar growth rates exclude the impact of foreign currency fluctuations against the U.S. dollar in measuring performance.
4 Fiscal Third Quarter 2016 Financial Results
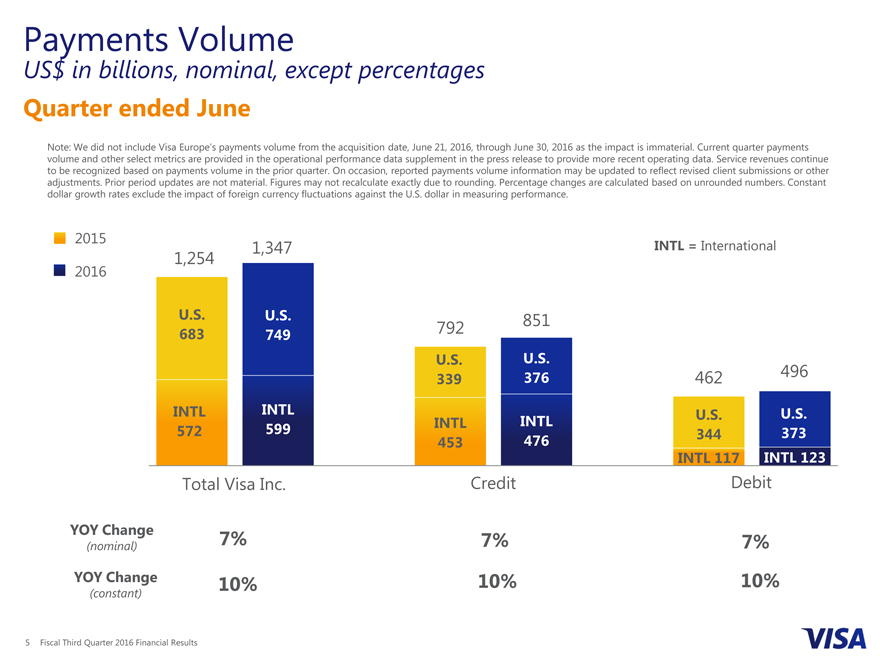
Payments Volume
US$ in billions, nominal, except percentages
Quarter ended June
Note: We did not include Visa Europe’s payments volume from the acquisition date, June 21, 2016, through June 30, 2016 as the impact is immaterial. Current quarter payments volume and other select metrics are provided in the operational performance data supplement in the press release to provide more recent operating data. Service revenues continue to be recognized based on payments volume in the prior quarter. On occasion, reported payments volume information may be updated to reflect revised client submissions or other adjustments. Prior period updates are not material. Figures may not recalculate exactly due to rounding. Percentage changes are calculated based on unrounded numbers. Constant dollar growth rates exclude the impact of foreign currency fluctuations against the U.S. dollar in measuring performance.
2015 1,347 INTL = International
1,254
2016
U.S. 683 U.S. 851 U.S. 749 792 INTL 572 U.S.
376 462 496
U.S. 339 INTL INTL 453 U.S. 599 U.S. 344 INTL U.
373 476
319
INTL 117 INTL 123
Total Visa Inc. Credit INTL 109 Debit INTL 127
YOY Change 7% 7%
(nominal) 7%
YOY Change 10% 10% 10%
(constant)
5 Fiscal Third Quarter 2016 Financial Results
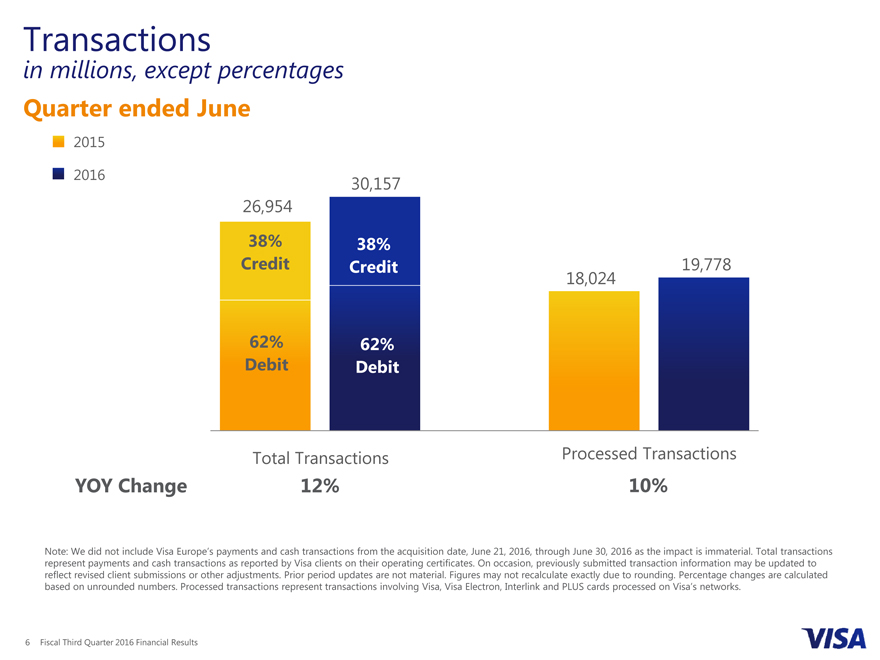
Transactions
in millions, except percentages
Quarter ended June
2015
2016 30,157 26,954
38% Credit 62% Debit 38% Credit 62% Debit 19,778 18,024
Total Transactions Processed Transactions
YOY Change 12% 10%
Note: We did not include Visa Europe’s payments and cash transactions from the acquisition date, June 21, 2016, through June 30, 2016 as the impact is immaterial. Total transactions represent payments and cash transactions as reported by Visa clients on their operating certificates. On occasion, previously submitted transaction information may be updated to reflect revised client submissions or other adjustments. Prior period updates are not material. Figures may not recalculate exactly due to rounding. Percentage changes are calculated based on unrounded numbers. Processed transactions represent transactions involving Visa, Visa Electron, Interlink and PLUS cards processed on Visa’s networks.
6 Fiscal Third Quarter 2016 Financial Results
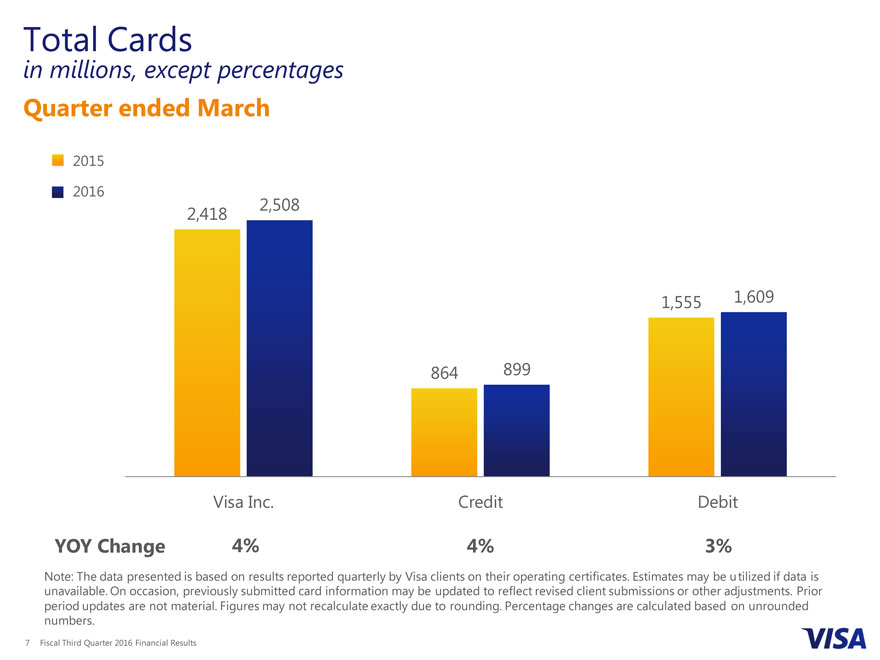
Total Cards
in millions, except percentages
Quarter ended March
2015
2016
2,418 2,508
1,555
1,609
864 899
Visa Inc. CreditDebit
YOY Change 4% 4%3%
Note: The data presented is based on results reported quarterly by Visa clients on their operating certificates. Estimates may be utilized if data is unavailable. On occasion, previously submitted card information may be updated to reflect revised client submissions or other adjustments. Prior period updates are not material. Figures may not recalculate exactly due to rounding. Percentage changes are calculated based on unrounded numbers.
7 Fiscal Third Quarter 2016 Financial Results
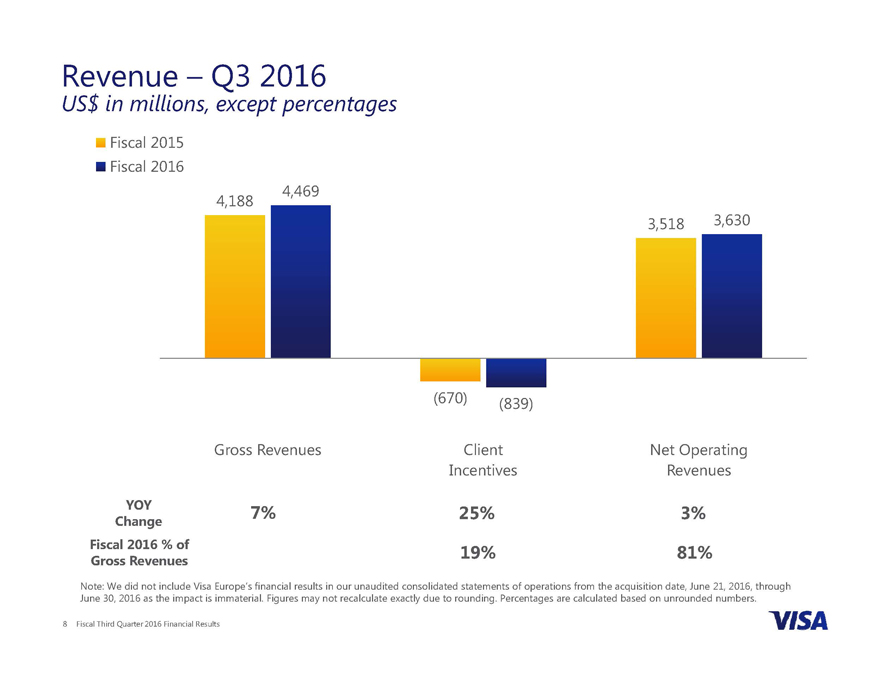
Revenue – Q3 2016
US$ in millions, except percentages
Fiscal 2015 Fiscal 2016
4,469 4,188
3,518 3,630
(670) (839)
Gross Revenues Client Net Operating Incentives Revenues
YOY 7% 25% 3%
Change
Fiscal 2016 % of 19% 81% Gross Revenues
Note: We did not include Visa Europe’s financial results in our unaudited consolidated statements of operations from the acquisition date, June 21, 2016, through June 30, 2016 as the impact is immaterial. Figures may not recalculate exactly due to rounding. Percentages are calculated based on unrounded numbers.
8 Fiscal Third Quarter 2016 Financial Results
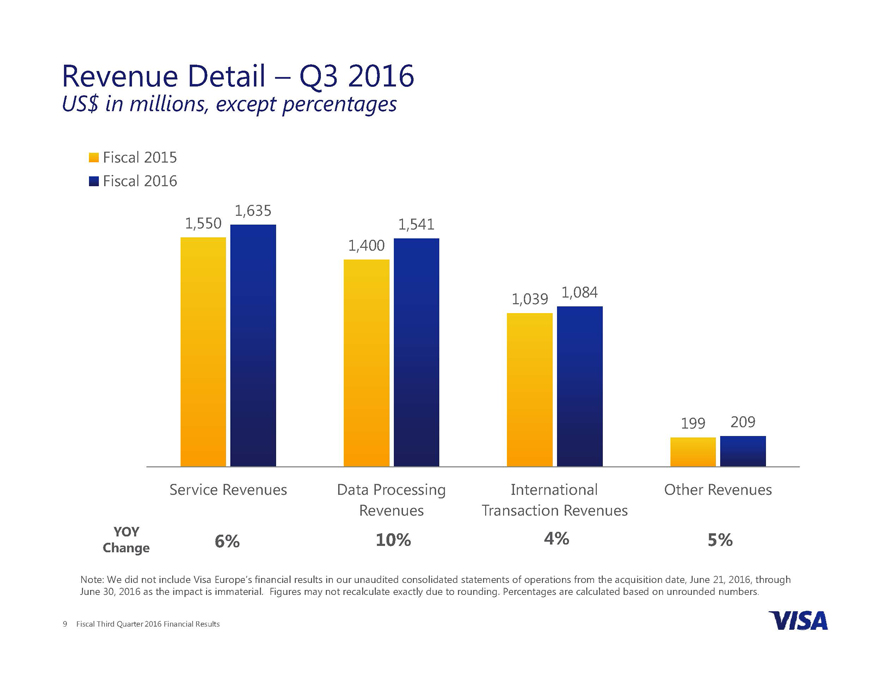
Revenue Detail – Q3 2016
US$ in millions, except percentages
Fiscal 2015 Fiscal 2016
1,635
1,550 1,541 1,400
1,039 1,084
199 209
Service Revenues Data Processing International Other Revenues Revenues Transaction Revenues
YOY 6% 10% 4% 5%
Change
Note: We did not include Visa Europe’s financial results in our unaudited consolidated statements of operations from the acquisition date, June 21, 2016, through June 30, 2016 as the impact is immaterial. Figures may not recalculate exactly due to rounding. Percentages are calculated based on unrounded numbers.
9 Fiscal Third Quarter 2016 Financial Results
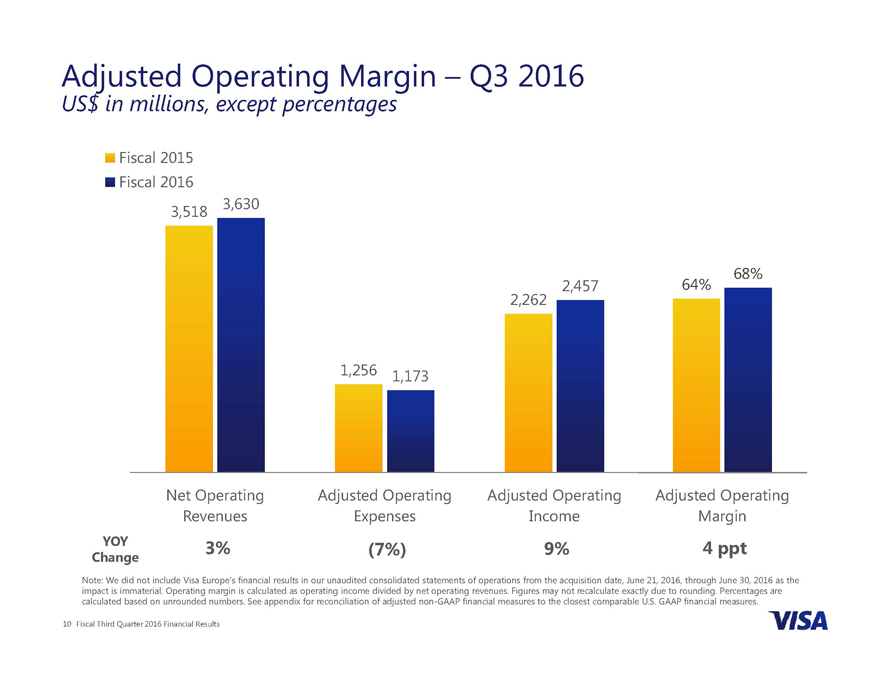
Adjusted Operating Margin – Q3 2016
US$ in millions, except percentages
Fiscal 2015 Fiscal 2016
3,518 3,630
68% 2,457 64% ,
1,256 1,173
Net Operating Adjusted Operating Adjusted Operating Adjusted Operating Revenues Expenses Income Margin
YOY 3%4 (7%) 9% ppt
Change
Note: We did not include Visa Europe’s financial results in our unaudited consolidated statements of operations from the acquisition date, June 21, 2016, through June 30, 2016 as the impact is immaterial. Operating margin is calculated as operating income divided by net operating revenues. Figures may not recalculate exactly due to rounding. Percentages are calculated based on unrounded numbers. See appendix for reconciliation of adjusted non-GAAP financial measures to the closest comparable U.S. GAAP financial measures.
10 Fiscal Third Quarter 2016 Financial Results
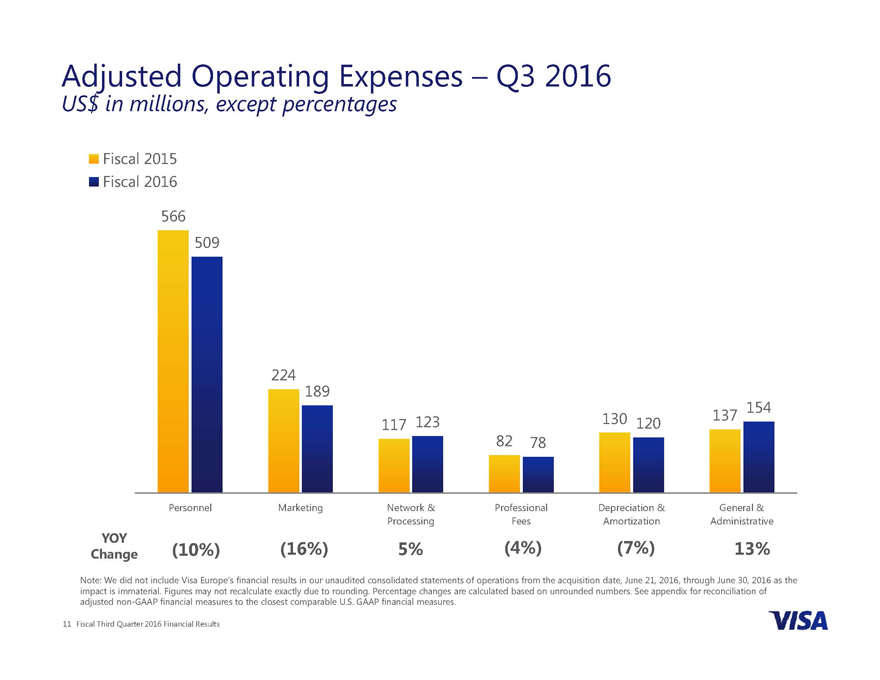
Adjusted Operating Expenses – Q3 2016
US$ in millions, except percentages
Fiscal 2015 Fiscal 2016 566 509
224 189
137 154 117 123 130 120
82 78
Personnel Marketing Network & Professional Depreciation & General & Processing Fees Amortization Administrative
YOY (4%) (7%)
Change (10%) (16%) 5% 13%
Note: We did not include Visa Europe’s financial results in our unaudited consolidated statements of operations from the acquisition date, June 21, 2016, through June 30, 2016 as the impact is immaterial. Figures may not recalculate exactly due to rounding. Percentage changes are calculated based on unrounded numbers. See appendix for reconciliation of adjusted non-GAAP financial measures to the closest comparable U.S. GAAP financial measures.
11 Fiscal Third Quarter 2016 Financial Results
Other Financial Results and Highlights
Cash, cash equivalents and available-for-sale investment securities of $12.4 billion at the end of the fiscal third quarter
Adjusted free cash flow of $2.0 billion for the fiscal third quarter
• Capital expenditures of $132 million during the fiscal third quarter
Authorized a new $5.0 billion share repurchase program
Note: 2016, through We did not June include 30, 2016 Visa as Europe’s the impact financial is immaterial. results in We our included unaudited preliminary consolidated balances statements of Visa of Europe operations as of from June the 30, 2016 acquisition in our date, unaudited June 21, consolidated balance sheets, pending final valuation.
See appendix for reconciliation of adjusted non-GAAP financial measures to the closest comparable U.S. GAAP financial measures.
12 Fiscal Third Quarter 2016 Financial Results
|
|
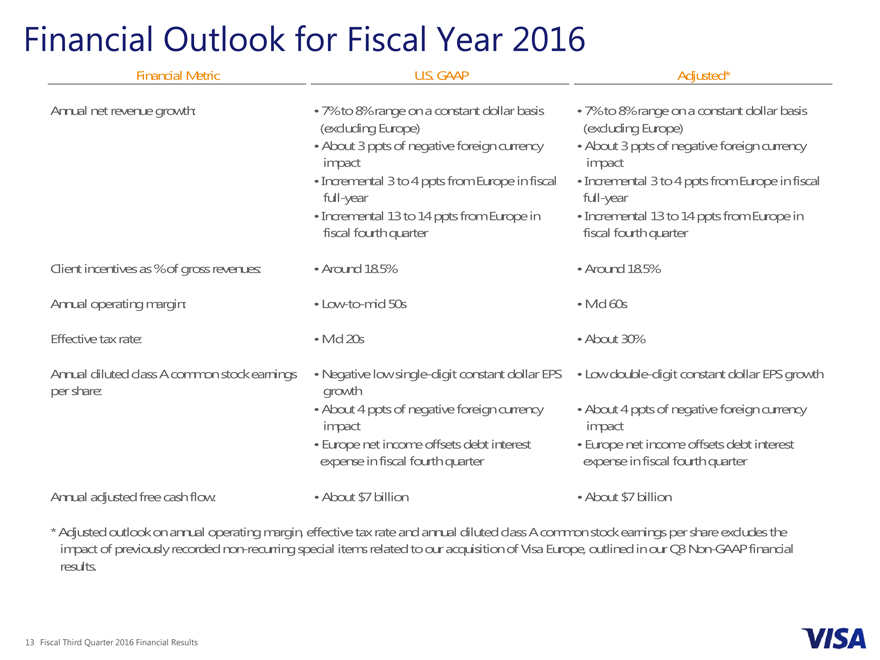
Financial Outlook for Fiscal Year 2016 Financial Metric Annual net revenue growth: Client incentives as % of gross revenues: Annual operating margin: Effective tax rate: Annual diluted class A common stock earnings per share: Annual adjusted free cash flow: U.S. GAAP • 7% to 8% range on a constant dollar basis (excluding Europe) • About 3 ppts of negative foreign currency impact • Incremental 3 to 4 ppts from Europe in fiscal full-year • Incremental 13 to 14 ppts from Europe in fiscal fourth quarter • Around 18.5% • Low-to-mid 50s • Mid 20s • Negative low single-digit constant dollar EPS growth • About 4 ppts of negative foreign currency impact • Europe net income offsets debt interest expense in fiscal fourth quarter • About $7 billion Adjusted* • 7% to 8% range on a constant dollar basis (excluding Europe) • About 3 ppts of negative foreign currency impact • Incremental 3 to 4 ppts from Europe in fiscal full-year • Incremental 13 to 14 ppts from Europe in fiscal fourth quarter • Around 18.5% • Mid 60s • About 30% • Low double-digit constant dollar EPS growth • About 4 ppts of negative foreign currency impact • Europe net income offsets debt interest expense in fiscal fourth quarter • About $7 billion * Adjusted outlook on annual operating margin, effective tax rate and annual diluted class A common stock earnings per share excludes the impact of previously recorded non-recurring special items related to our acquisition of Visa Europe, outlined in our Q3 Non-GAAP financial results.
|

|
Appendix
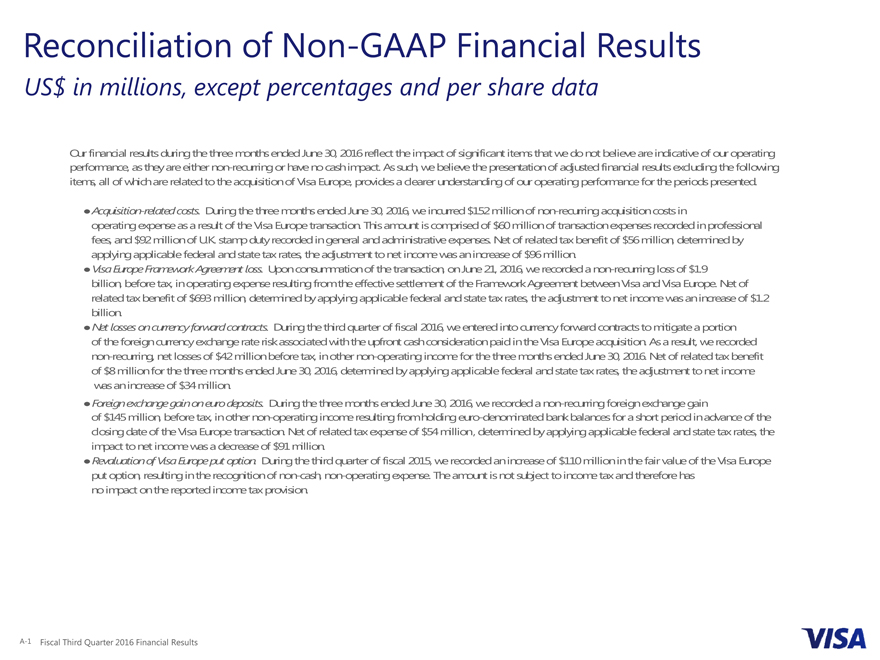
Reconciliation of Non-GAAP Financial Results
US$ in millions, except percentages and per share data
Our financial results during the three months ended June 30, 2016 reflect the impact of significant items that we do not believe are indicative of our operating performance, as they are either non-recurring or have no cash impact. As such, we believe the presentation of adjusted financial results excluding the following items, all of which are related to the acquisition of Visa Europe, provides a clearer understanding of our operating performance for the periods presented.
Š Acquisition-related costs. During the three months ended June 30, 2016, we incurred $152 million of non-recurring acquisition costs in operating expense as a result of the Visa Europe transaction. This amount is comprised of $60 million of transaction expenses recorded in professional fees, and $92 million of U.K. stamp duty recorded in general and administrative expenses. Net of related tax benefit of $56 million, determined by applying applicable federal and state tax rates, the adjustment to net income was an increase of $96 million.
Š Visa Europe Framework Agreement loss. Upon consummation of the transaction, on June 21, 2016, we recorded a non-recurring loss of $1.9 billion, before tax, in operating expense resulting from the effective settlement of the Framework Agreement between Visa and Visa Europe. Net of related tax benefit of $693 million, determined by applying applicable federal and state tax rates, the adjustment to net income was an increase of $1.2 billion.
Š Net losses on currency forward contracts. During the third quarter of fiscal 2016, we entered into currency forward contracts to mitigate a portion of the foreign currency exchange rate risk associated with the upfront cash consideration paid in the Visa Europe acquisition. As a result, we recorded non-recurring, net losses of $42 million before tax, in other non-operating income for the three months ended June 30, 2016. Net of related tax benefit of $8 million for the three months ended June 30, 2016, determined by applying applicable federal and state tax rates, the adjustment to net income was an increase of $34 million.
Š Foreign exchange gain on euro deposits. During the three months ended June 30, 2016, we recorded a non-recurring foreign exchange gain of $145 million, before tax, in other non-operating income resulting from holding euro-denominated bank balances for a short period in advance of the closing date of the Visa Europe transaction. Net of related tax expense of $54 million, determined by applying applicable federal and state tax rates, the impact to net income was a decrease of $91 million.
Š Revaluation of Visa Europe put option. During the third quarter of fiscal 2015, we recorded an increase of $110 million in the fair value of the Visa Europe put option, resulting in the recognition of non-cash, non-operating expense. The amount is not subject to income tax and therefore has no impact on the reported income tax provision.
A-1 Fiscal Third Quarter 2016 Financial Results
Reconciliation of Non-GAAP Financial Results (Continued)
US$ in millions, except percentages and per share data
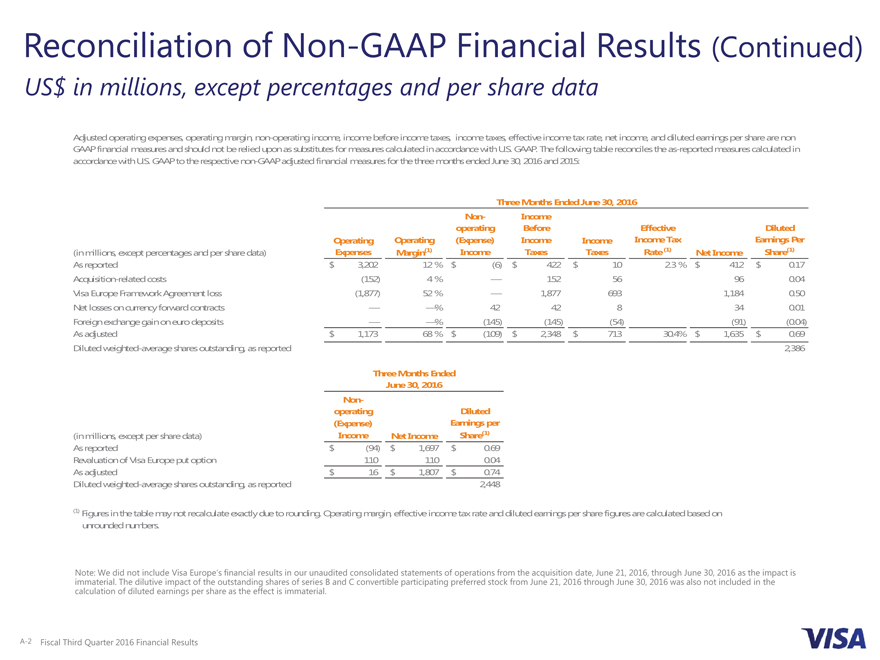
Adjusted operating expenses, operating margin, non-operating income, income before income taxes, income taxes, effective income tax rate, net income, and diluted earnings per share are non GAAP financial measures and should not be relied upon as substitutes for measures calculated in accordance with U.S. GAAP. The following table reconciles the as-reported measures calculated in accordance with U.S. GAAP to the respective non-GAAP adjusted financial measures for the three months ended June 30, 2016 and 2015:
Three Months Ended June 30, 2016 Non- Income operating Before Effective Diluted Operating Operating (Expense) Income Income Income Tax Earnings Per
(in millions, except percentages and per share data) Expenses Margin(1) Income Taxes Taxes Rate (1) Net Income Share(1)
As reported $ 3,202 12 % $ (6) $ 422 $ 10 2.3 % $ 412 $ 0.17 Acquisition-related costs (152) 4 % — 152 56 96 0.04 Visa Europe Framework Agreement loss (1,877) 52 % — 1,877 693 1,184 0.50 Net losses on currency forward contracts — —% 42 42 8 34 0.01 Foreign exchange gain on euro deposits — —% (145) (145) (54) (91) (0.04) As adjusted $ 1,173 68 % $ (109) $ 2,348 $ 713 30.4% $ 1,635 $ 0.69 Diluted weighted-average shares outstanding, as reported 2,386
Three Months Ended June 30, 2016 Non-operating Diluted (Expense) Earnings per
(in millions, except per share data) Income Net Income Share(1)
As reported $ (94) $ 1,697 $ 0.69 Revaluation of Visa Europe put option 110 110 0.04
, .
Diluted weighted-average shares outstanding, as reported 2,448
(1) Figures in the table may not recalculate exactly due to rounding. Operating margin, effective income tax rate and diluted earnings per share figures are calculated based on unrounded numbers.
Note: immaterial. We did The not dilutive include impact Visa Europe’s of the outstanding financial results shares in of our series unaudited B and C consolidated convertible participating statements of preferred operations stock from from the June acquisition 21, 2016 date, through June 21, June 2016, 30, 2016 through was June also not 30, 2016 included as the in impact the is calculation of diluted earnings per share as the effect is immaterial.
A-2 Fiscal Third Quarter 2016 Financial Results
Calculation of Adjusted Free Cash Flow
US$ in millions
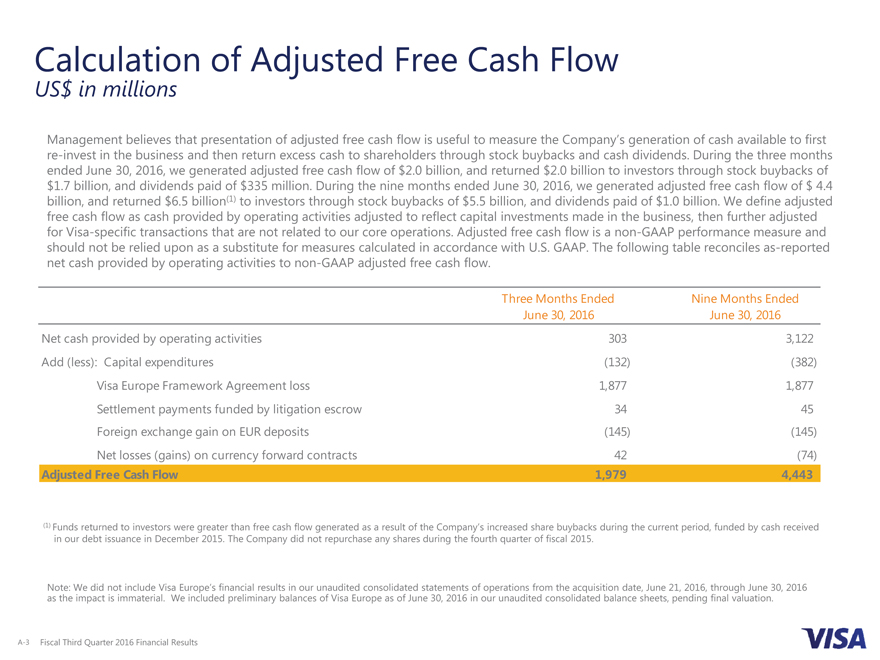
Management believes that presentation of adjusted free cash flow is useful to measure the Company’s generation of cash available to first re-invest in the business and then return excess cash to shareholders through stock buybacks and cash dividends. During the three months ended June 30, 2016, we generated adjusted free cash flow of $2.0 billion, and returned $2.0 billion to investors through stock buybacks of $1.7 billion, and dividends paid of $335 million. During the nine months ended June 30, 2016, we generated adjusted free cash flow of $ 4.4 billion, and returned $6.5 billion(1) to investors through stock buybacks of $5.5 billion, and dividends paid of $1.0 billion. We define adjusted free cash flow as cash provided by operating activities adjusted to reflect capital investments made in the business, then further adjusted for Visa-specific transactions that are not related to our core operations. Adjusted free cash flow is a non-GAAP performance measure and should not be relied upon as a substitute for measures calculated in accordance with U.S. GAAP. The following table reconciles as-reported net cash provided by operating activities to non-GAAP adjusted free cash flow.
Three Months Ended Nine Months Ended June 30, 2016 June 30, 2016 Net cash provided by operating activities 303 3,122 Add (less): Capital expenditures (132) (382) Visa Europe Framework Agreement loss 1,877 1,877 Settlement payments funded by litigation escrow 34 45 Foreign exchange gain on EUR deposits (145) (145) Net losses (gains) on currency forward contracts 42 (74)
Adjusted Free Cash Flow 1,979 4,443
(1) Funds returned to investors were greater than free cash flow generated as a result of the Company’s increased share buybacks during the current period, funded by cash received in our debt issuance in December 2015. The Company did not repurchase any shares during the fourth quarter of fiscal 2015.
as Note: the We impact did not is immaterial. include Visa We Europe’s included financial preliminary results balances in our unaudited of Visa Europe consolidated as of June statements 30, 2016 in of our operations unaudited from consolidated the acquisition balance date, sheets, June 21, pending 2016, through final valuation. June 30, 2016
A-3 Fiscal Third Quarter 2016 Financial Results