Exhibit 99.2 Visa Inc. Fiscal Third Quarter 2018 Financial Results July 25, 2018
Forward-Looking Statements This presentation contains forward-looking statements within the meaning of the U.S. Private Securities Litigation Reform Act of 1995 that relate to, among other things, our future operations, prospects, developments, strategies, business growth and financial outlook for fiscal full-year 2018. Forward-looking statements generally are identified by words such as "believes," "estimates," "expects," "intends," "may," "projects," “outlook”, "could," "should," "will," "continue" and other similar expressions. All statements other than statements of historical fact could be forward-looking statements, which speak only as of the date they are made, are not guarantees of future performance and are subject to certain risks, uncertainties and other factors, many of which are beyond our control and are difficult to predict. Actual results could differ materially from those expressed in, or implied by, our forward-looking statements due to a variety of factors, including, but not limited to: • increased oversight and regulation of the global payments industry and our business; • impact of government-imposed restrictions on payment systems; • outcome of tax, litigation and governmental investigation matters; • increasingly intense competition in the payments industry, including competition for our clients and merchants; • proliferation and continuous evolution of new technologies and business models; • our ability to maintain relationships with our clients, merchants and other third parties; • brand or reputational damage; • management changes; • impact of global economic, political, market and social events or conditions; • exposure to loss or illiquidity due to settlement guarantees; • uncertainty surrounding the impact of the United Kingdom’s withdrawal from the European Union; • cyber security attacks, breaches or failure of our networks; • failure to maintain interoperability with Visa Europe’s systems and to migrate European activity onto VisaNet successfully; • our ability to successfully integrate and manage our acquisitions and other strategic investments; and • other factors described in our filings with the U.S. Securities and Exchange Commission, including our Annual Report on Form 10-K for the year ended September 30, 2017, and our subsequent reports on Forms 10-Q and 8-K. Except as required by law, we do not intend to update or revise any forward-looking statements as a result of new information, future events or otherwise. 2 Fiscal Third Quarter 2018 Financial Results ©2018 Visa. All rights reserved.
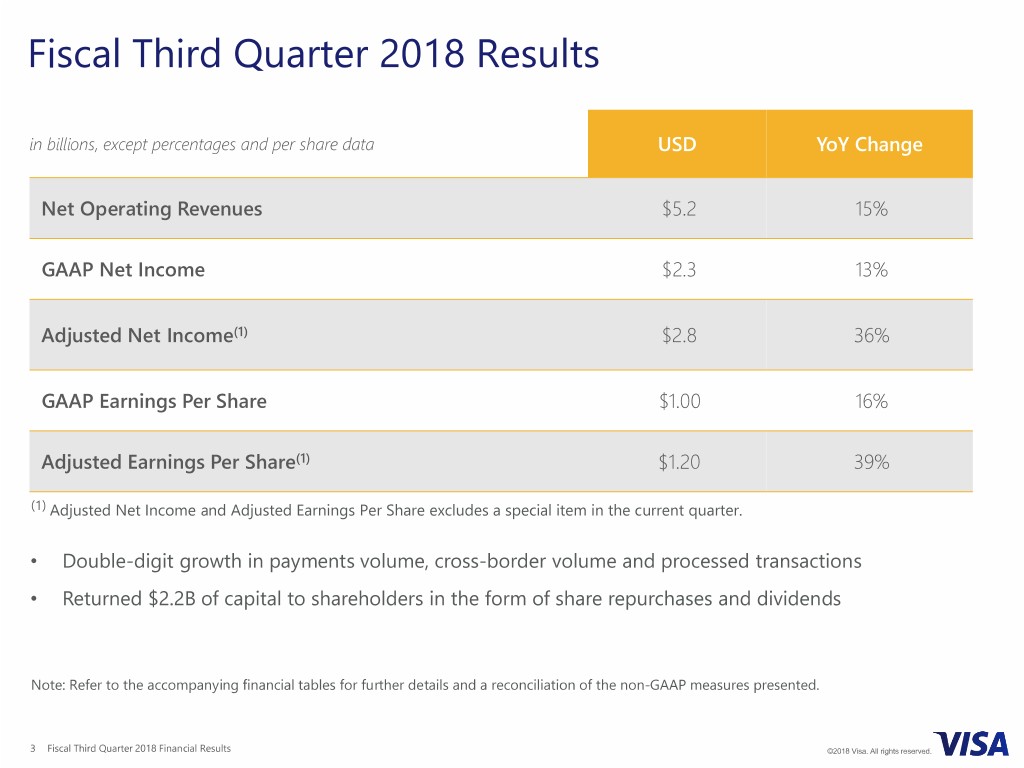
Fiscal Third Quarter 2018 Results in billions, except percentages and per share data USD YoY Change Net Operating Revenues $5.2 15% GAAP Net Income $2.3 13% Adjusted Net Income(1) $2.8 36% GAAP Earnings Per Share $1.00 16% Adjusted Earnings Per Share(1) $1.20 39% (1) Adjusted Net Income and Adjusted Earnings Per Share excludes a special item in the current quarter. • Double-digit growth in payments volume, cross-border volume and processed transactions • Returned $2.2B of capital to shareholders in the form of share repurchases and dividends Note: Refer to the accompanying financial tables for further details and a reconciliation of the non-GAAP measures presented. 3 Fiscal Third Quarter 2018 Financial Results ©2018 Visa. All rights reserved.
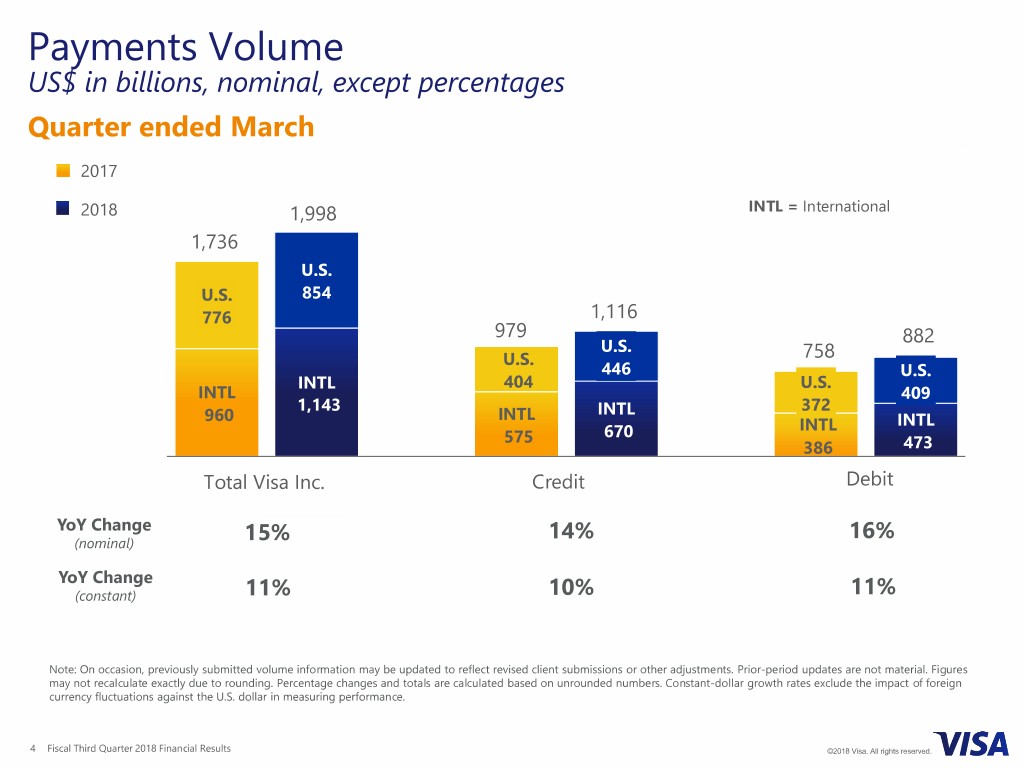
Payments Volume US$ in billions, nominal, except percentages Quarter ended March 2017 2018 1,998 INTL = International 1,736 U.S. U.S. 854 776 1,116 979 882 U.S. U.S. 758 446 U.S. INTL 404 U.S. INTL 409 1,143 372 960 INTL INTL INTL INTL 575 670 386 473 Total Visa Inc. Credit Debit YoY Change (nominal) 15% 14% 16% YoY Change (constant) 11% 10% 11% Note: On occasion, previously submitted volume information may be updated to reflect revised client submissions or other adjustments. Prior-period updates are not material. Figures may not recalculate exactly due to rounding. Percentage changes and totals are calculated based on unrounded numbers. Constant-dollar growth rates exclude the impact of foreign currency fluctuations against the U.S. dollar in measuring performance. 4 Fiscal Third Quarter 2018 Financial Results ©2018 Visa. All rights reserved.
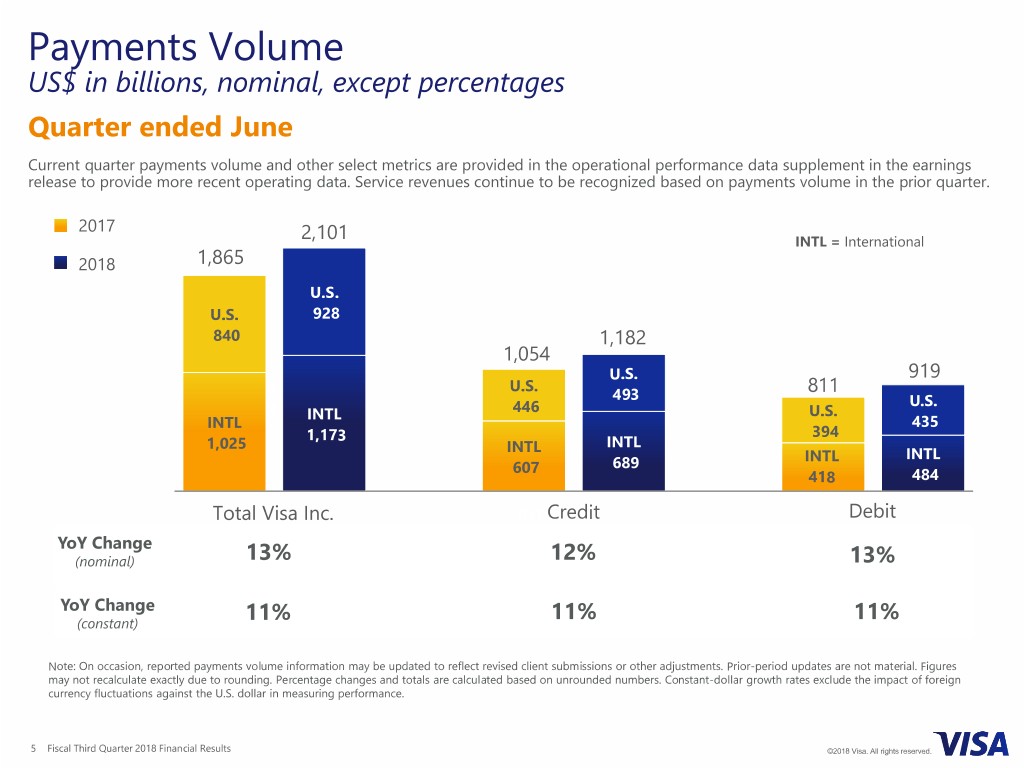
Payments Volume US$ in billions, nominal, except percentages Quarter ended June Current quarter payments volume and other select metrics are provided in the operational performance data supplement in the earnings release to provide more recent operating data. Service revenues continue to be recognized based on payments volume in the prior quarter. 2017 2,101 INTL = International 2018 1,865 U.S. U.S. 928 840 1,182 1,054 U.S. 919 U.S. U.S. U.S. 811 493 U.S. 575 INTL631 446 U.S. INTL 435 1,173 U.S. U.S. 394 1,025 INTL INTL INTL INTL 607277 313689 418 484 Total Visa Inc. INTLCredit Debit YoY Change 420 (nominal) 13% 12% INTL 09 13% YoY Change (constant) 11% 11% 11% Note: On occasion, reported payments volume information may be updated to reflect revised client submissions or other adjustments. Prior-period updates are not material. Figures may not recalculate exactly due to rounding. Percentage changes and totals are calculated based on unrounded numbers. Constant-dollar growth rates exclude the impact of foreign currency fluctuations against the U.S. dollar in measuring performance. 5 Fiscal Third Quarter 2018 Financial Results ©2018 Visa. All rights reserved.
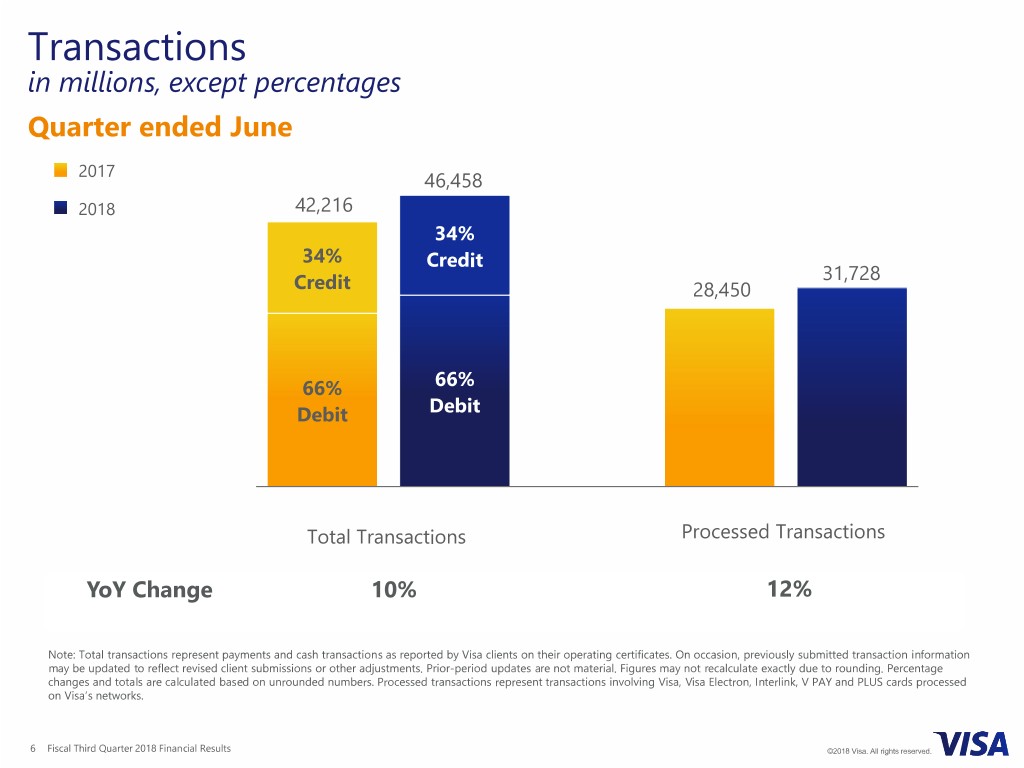
Transactions in millions, except percentages Quarter ended June 2017 46,458 2018 42,216 34% 34% Credit 31,728 Credit 28,450 Credit Credit 38% 38% 66% 66% Debit Debit Debit 62% Total Transactions Processed Transactions YoY Change 10% 12% Note: Total transactions represent payments and cash transactions as reported by Visa clients on their operating certificates. On occasion, previously submitted transaction information may be updated to reflect revised client submissions or other adjustments. Prior-period updates are not material. Figures may not recalculate exactly due to rounding. Percentage changes and totals are calculated based on unrounded numbers. Processed transactions represent transactions involving Visa, Visa Electron, Interlink, V PAY and PLUS cards processed on Visa’s networks. 6 Fiscal Third Quarter 2018 Financial Results ©2018 Visa. All rights reserved.
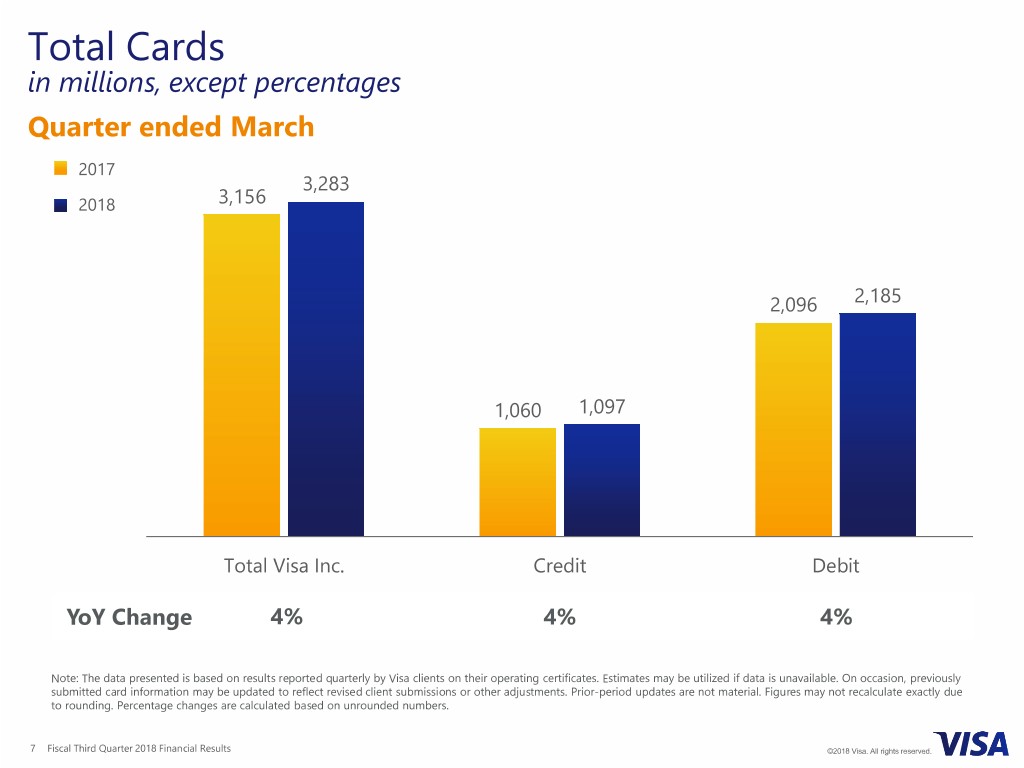
Total Cards in millions, except percentages Quarter ended March 2017 3,283 2018 3,156 2,096 2,185 1,060 1,097 Total Visa Inc. Credit Debit YoY Change 4% 4% 4% Note: The data presented is based on results reported quarterly by Visa clients on their operating certificates. Estimates may be utilized if data is unavailable. On occasion, previously submitted card information may be updated to reflect revised client submissions or other adjustments. Prior-period updates are not material. Figures may not recalculate exactly due to rounding. Percentage changes are calculated based on unrounded numbers. 7 Fiscal Third Quarter 2018 Financial Results ©2018 Visa. All rights reserved.
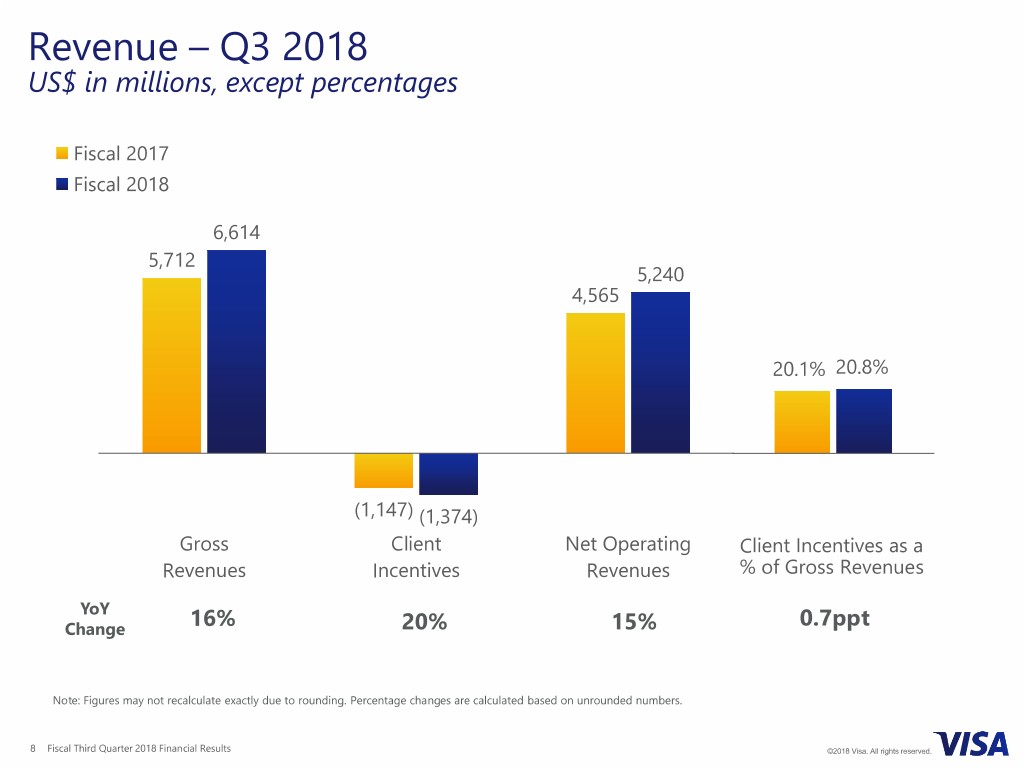
Revenue – Q3 2018 US$ in millions, except percentages Fiscal 2017 Fiscal 2018 6,614 5,712 5,240 4,565 20.1% 20.8% (1,147) (1,374) Gross Client Net Operating Client Incentives as a Revenues Incentives Revenues % of Gross Revenues YoY Change 16% 20% 15% 0.7ppt Note: Figures may not recalculate exactly due to rounding. Percentage changes are calculated based on unrounded numbers. 8 Fiscal Third Quarter 2018 Financial Results ©2018 Visa. All rights reserved.
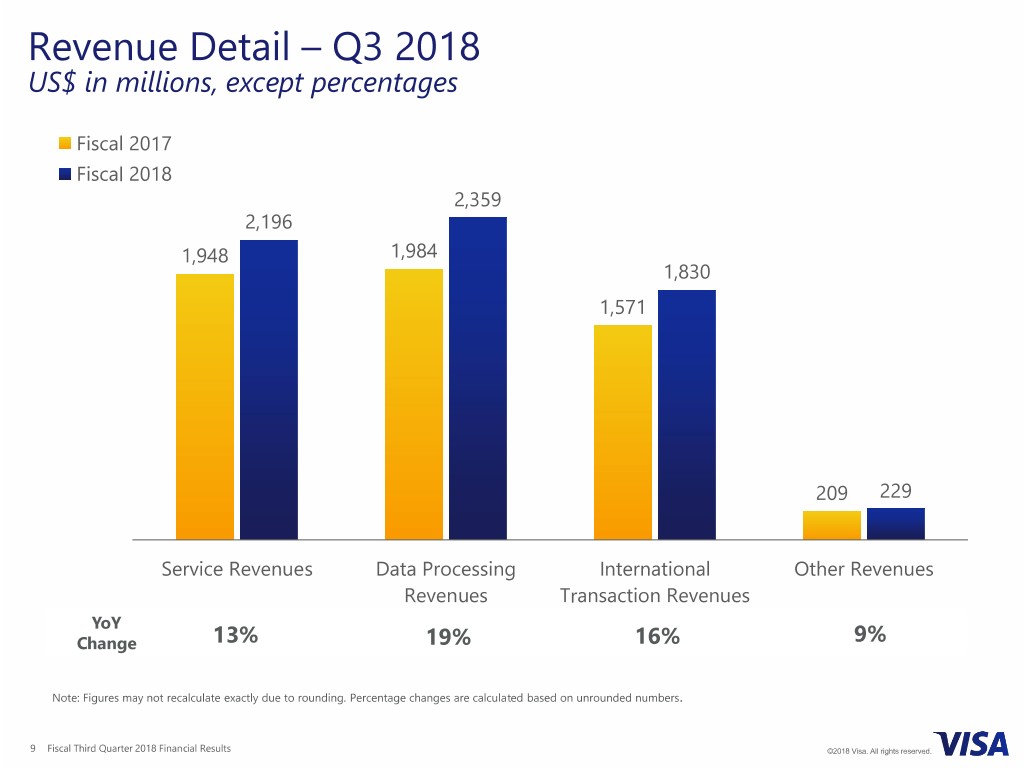
Revenue Detail – Q3 2018 US$ in millions, except percentages Fiscal 2017 Fiscal 2018 2,359 2,196 1,948 1,984 1,830 1,571 209 229 Service Revenues Data Processing International Other Revenues Revenues Transaction Revenues YoY Change 13% 19% 16% 9% Note: Figures may not recalculate exactly due to rounding. Percentage changes are calculated based on unrounded numbers. 9 Fiscal Third Quarter 2018 Financial Results ©2018 Visa. All rights reserved.
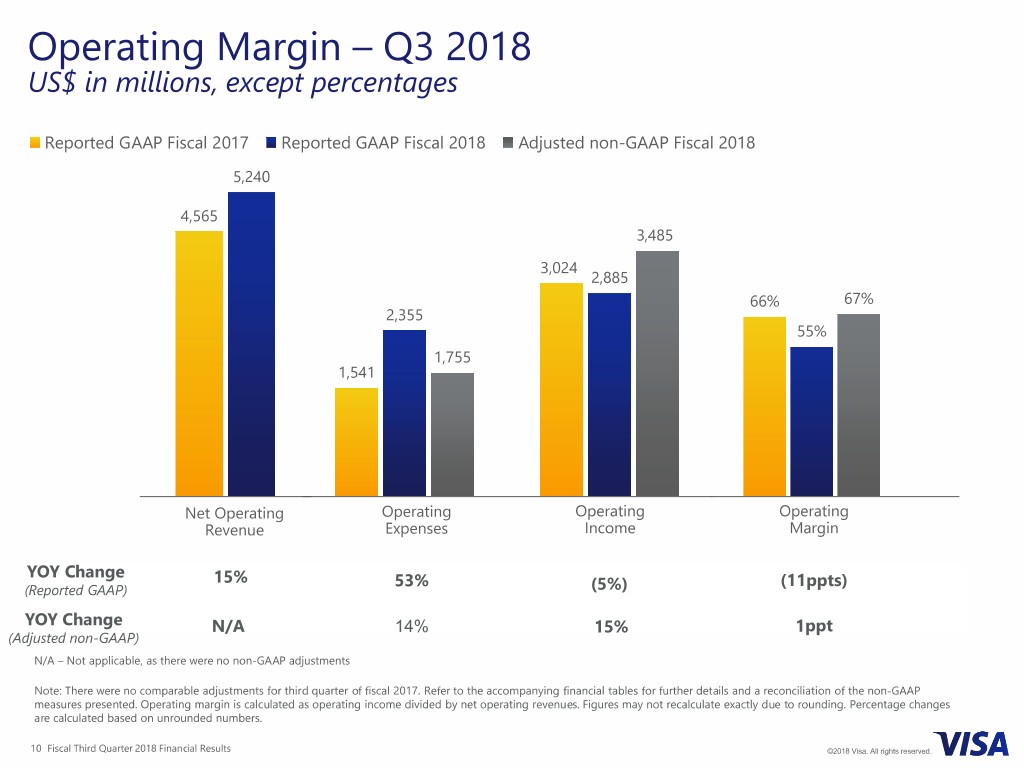
Operating Margin – Q3 2018 US$ in millions, except percentages Reported GAAP Fiscal 2017 Reported GAAP Fiscal 2018 Adjusted non-GAAP Fiscal 2018 5,240 4,565 3,485 3,024 2,885 66% 67% 2,355 55% 1,755 1,541 Net Operating Operating Operating Operating Revenue Expenses Income Margin YOY Change 15% (Reported GAAP) 53% (5%) (11ppts) YOY Change N/A 14% 1ppt (Adjusted non-GAAP) 15% N/A – Not applicable, as there were no non-GAAP adjustments Note: There were no comparable adjustments for third quarter of fiscal 2017. Refer to the accompanying financial tables for further details and a reconciliation of the non-GAAP measures presented. Operating margin is calculated as operating income divided by net operating revenues. Figures may not recalculate exactly due to rounding. Percentage changes are calculated based on unrounded numbers. 10 Fiscal Third Quarter 2018 Financial Results ©2018 Visa. All rights reserved.
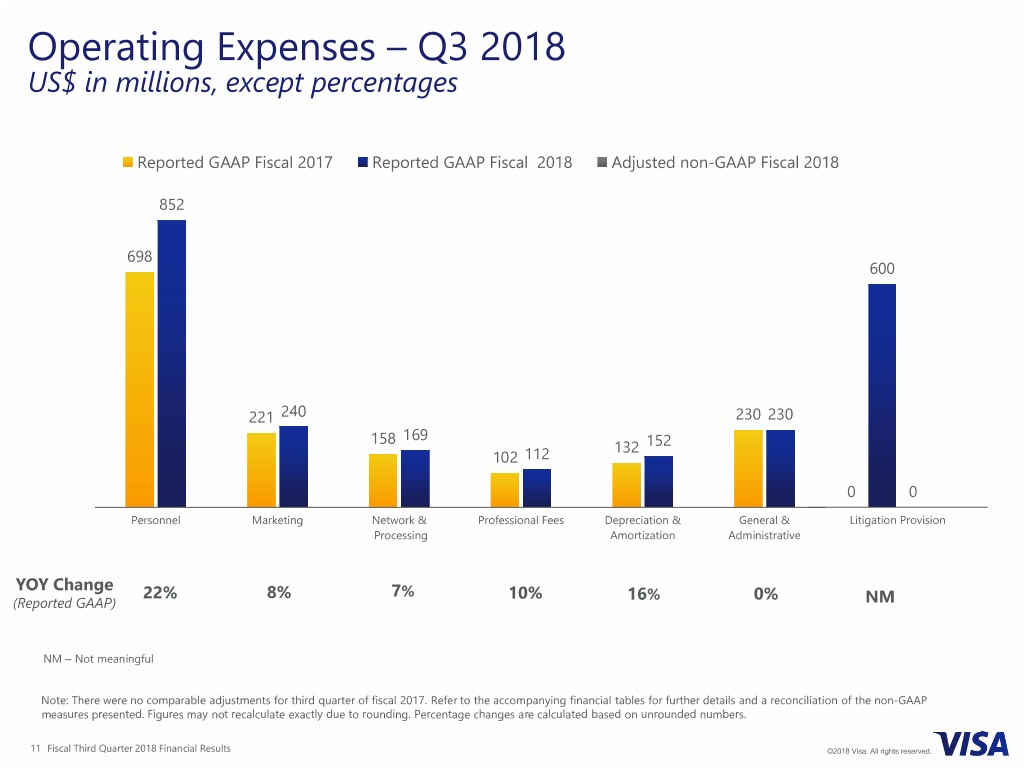
Operating Expenses – Q3 2018 US$ in millions, except percentages Reported GAAP Fiscal 2017 Reported GAAP Fiscal 2018 Adjusted non-GAAP Fiscal 2018 852 698 600 221 240 230 230 158 169 132 152 102 112 0 0 Personnel Marketing Network & Professional Fees Depreciation & General & Litigation Provision Processing Amortization Administrative YOY Change 7% (Reported GAAP) 22% 8% 10% 16% 0% NM NM – Not meaningful Note: There were no comparable adjustments for third quarter of fiscal 2017. Refer to the accompanying financial tables for further details and a reconciliation of the non-GAAP measures presented. Figures may not recalculate exactly due to rounding. Percentage changes are calculated based on unrounded numbers. 11 Fiscal Third Quarter 2018 Financial Results ©2018 Visa. All rights reserved.
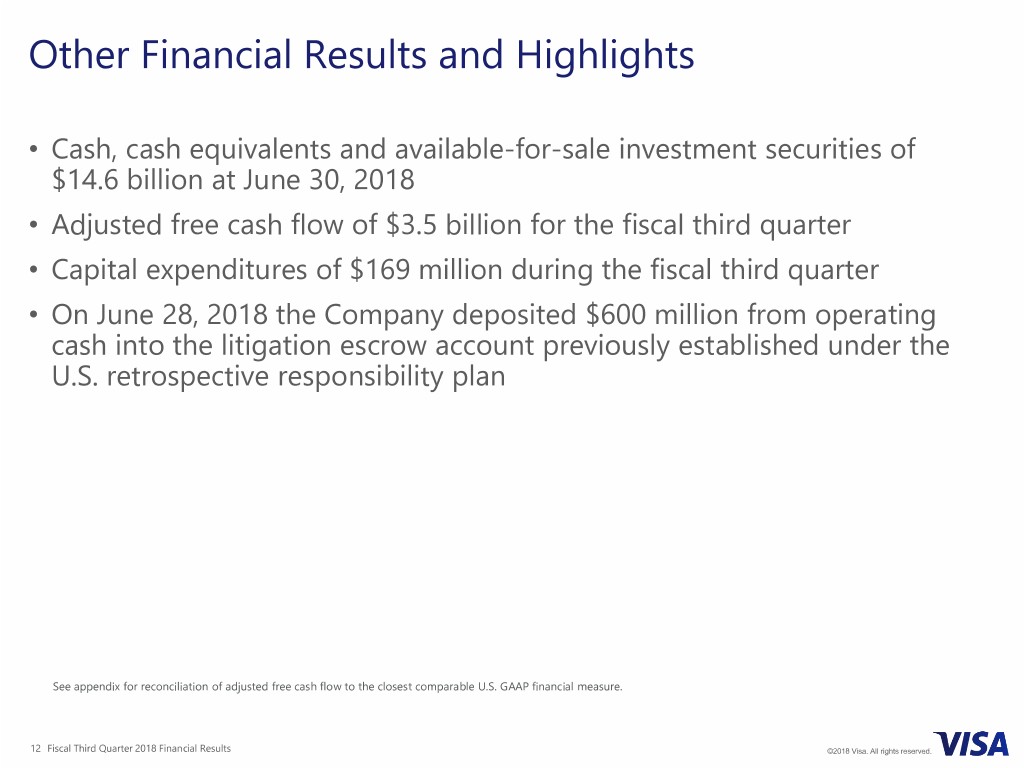
Other Financial Results and Highlights • Cash, cash equivalents and available-for-sale investment securities of $14.6 billion at June 30, 2018 • Adjusted free cash flow of $3.5 billion for the fiscal third quarter • Capital expenditures of $169 million during the fiscal third quarter • On June 28, 2018 the Company deposited $600 million from operating cash into the litigation escrow account previously established under the U.S. retrospective responsibility plan See appendix for reconciliation of adjusted free cash flow to the closest comparable U.S. GAAP financial measure. 12 Fiscal Third Quarter 2018 Financial Results ©2018 Visa. All rights reserved.
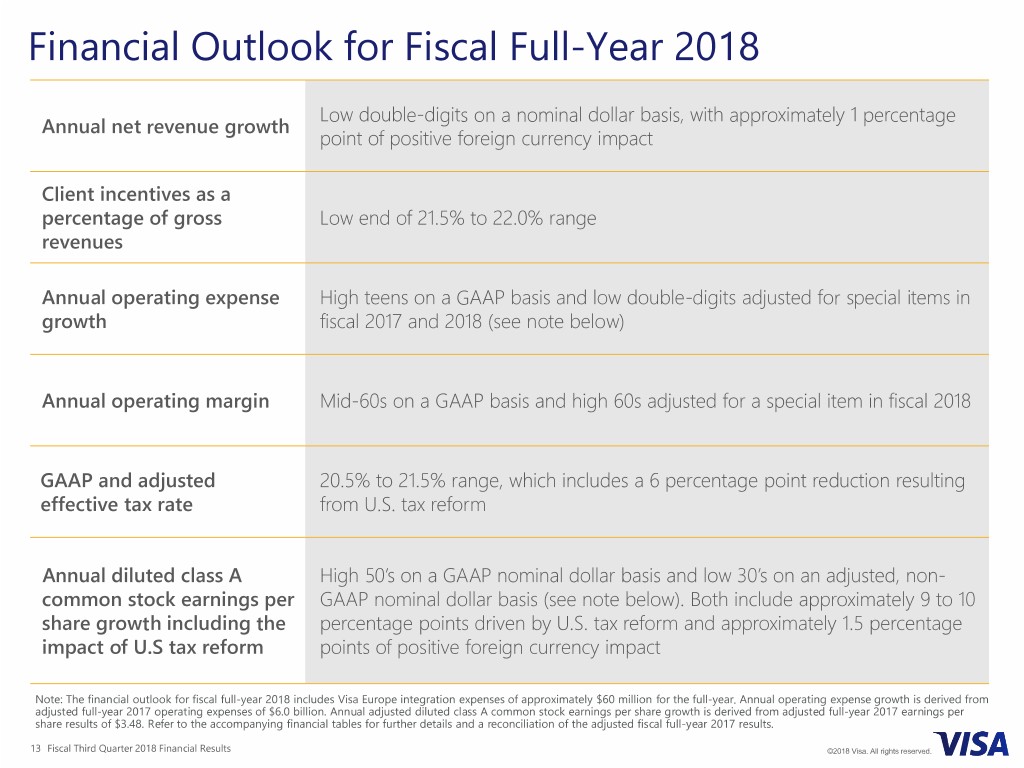
Financial Outlook for Fiscal Full-Year 2018 Low double-digits on a nominal dollar basis, with approximately 1 percentage Annual net revenue growth point of positive foreign currency impact Client incentives as a percentage of gross Low end of 21.5% to 22.0% range revenues Annual operating expense High teens on a GAAP basis and low double-digits adjusted for special items in growth fiscal 2017 and 2018 (see note below) Annual operating margin Mid-60s on a GAAP basis and high 60s adjusted for a special item in fiscal 2018 GAAP and adjusted 20.5% to 21.5% range, which includes a 6 percentage point reduction resulting effective tax rate from U.S. tax reform Annual diluted class A High 50’s on a GAAP nominal dollar basis and low 30’s on an adjusted, non- common stock earnings per GAAP nominal dollar basis (see note below). Both include approximately 9 to 10 share growth including the percentage points driven by U.S. tax reform and approximately 1.5 percentage impact of U.S tax reform points of positive foreign currency impact Note: The financial outlook for fiscal full-year 2018 includes Visa Europe integration expenses of approximately $60 million for the full-year. Annual operating expense growth is derived from adjusted full-year 2017 operating expenses of $6.0 billion. Annual adjusted diluted class A common stock earnings per share growth is derived from adjusted full-year 2017 earnings per share results of $3.48. Refer to the accompanying financial tables for further details and a reconciliation of the adjusted fiscal full-year 2017 results. 13 Fiscal Third Quarter 2018 Financial Results ©2018 Visa. All rights reserved.

Appendix
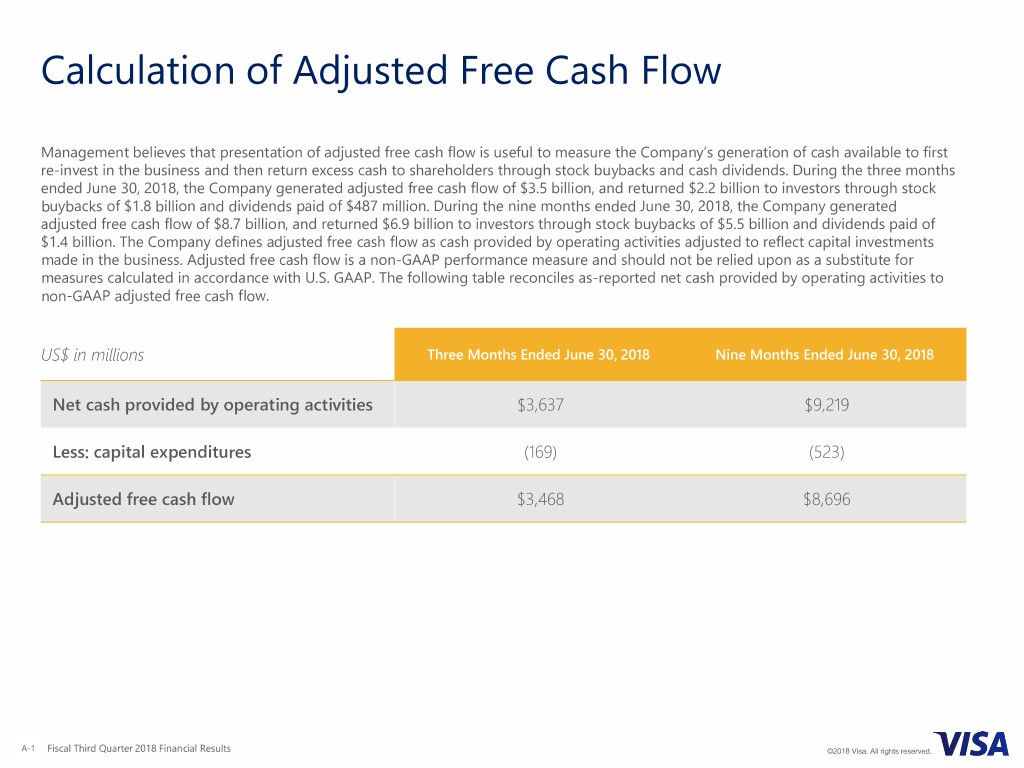
Calculation of Adjusted Free Cash Flow Management believes that presentation of adjusted free cash flow is useful to measure the Company’s generation of cash available to first re-invest in the business and then return excess cash to shareholders through stock buybacks and cash dividends. During the three months ended June 30, 2018, the Company generated adjusted free cash flow of $3.5 billion, and returned $2.2 billion to investors through stock buybacks of $1.8 billion and dividends paid of $487 million. During the nine months ended June 30, 2018, the Company generated adjusted free cash flow of $8.7 billion, and returned $6.9 billion to investors through stock buybacks of $5.5 billion and dividends paid of $1.4 billion. The Company defines adjusted free cash flow as cash provided by operating activities adjusted to reflect capital investments made in the business. Adjusted free cash flow is a non-GAAP performance measure and should not be relied upon as a substitute for measures calculated in accordance with U.S. GAAP. The following table reconciles as-reported net cash provided by operating activities to non-GAAP adjusted free cash flow. US$ in millions Three Months Ended June 30, 2018 Nine Months Ended June 30, 2018 Net cash provided by operating activities $3,637 $9,219 Less: capital expenditures (169) (523) Adjusted free cash flow $3,468 $8,696 A-151 Fiscal Third Quarter 2018 Financial Results ©2018 Visa. All rights reserved.


