 | ||
| Visa Inc. Reports Fiscal Third Quarter 2021 Results | ||
San Francisco, CA, July 27, 2021 – Visa Inc. (NYSE: V) •GAAP net income of $2.6B or $1.18 per share and non-GAAP net income of $3.3B or $1.49 per share •Net revenues of $6.1B, an increase of 27%. Net revenues growth would have been 39% if service revenues were recognized on current quarter's payments volume •Our key business driver growth rates increased significantly from the COVID-19 impacted levels in 2020, making year-over-year comparisons difficult to interpret •Indexed to 2019, fiscal third quarter payments volume, cross-border volume and processed transactions all accelerated from the fiscal second quarter •Returned $2.9B of capital to shareholders in the form of share repurchases and dividends | ||
| Income Statement Summary | ||||||||||||||
| In billions, except percentages and per share data. % change is calculated over the comparable prior-year period. | Q3 2021 | Alfred F. Kelly, Jr., Chairman and Chief Executive Officer, Visa Inc., commented on the results: | ||||||||||||
| USD | % Change | |||||||||||||
| Net Revenues | $6.1 | 27% | ||||||||||||
| GAAP Net Income | $2.6 | 9% | "Visa delivered another strong quarter as many key economies are well into a reopening-driven recovery. This was best demonstrated by credit and face-to-face spending bouncing back while debit and eCommerce volumes remained robust from accelerated cash digitization sparked by the pandemic. Additionally, cross- border travel spending improved as vaccination rates rose and more borders opened. Visa grew net revenues 27% and non-GAAP EPS 41% while continuing to make investments in strategies that will drive future growth." | |||||||||||
| GAAP Earnings Per Share | $1.18 | 10% | ||||||||||||
Non-GAAP Net Income(1) | $3.3 | 39% | ||||||||||||
Non-GAAP Earnings Per Share(1) | $1.49 | 41% | ||||||||||||
(1) Non-GAAP results exclude a special item, equity investment gains and losses, amortization of acquired intangible assets, non-recurring acquisition-related costs and the related tax impacts. | ||||||||||||||
| Key Business Drivers | ||||||||||||||
| YoY increase / (decrease), volume in constant dollars | Q3 2021 | |||||||||||||
| Payments Volume | 34% | |||||||||||||
Cross-Border Volume Excluding Intra-Europe(1) | 53% | |||||||||||||
| Cross-Border Volume Total | 47% | |||||||||||||
| Processed Transactions | 39% | |||||||||||||
(1) Cross-border volume excluding transactions within Europe. | ||||||||||||||
Fiscal Third Quarter 2021 — Financial Highlights

GAAP net income in the fiscal third quarter was $2.6 billion or $1.18 per share, an increase of 9% and 10%, respectively, over prior year’s results. Current year’s results included a $1.0 billion tax charge pertaining to a special item for remeasurement of deferred tax balances, $439 million of net gains from equity investments and $18 million from the amortization of acquired intangible assets and non-recurring acquisition-related costs. Prior year’s results included $51 million of net gains from equity investments and $17 million from the amortization of acquired intangible assets and non-recurring acquisition-related costs. Excluding these items and related tax impacts, non-GAAP net income for the quarter was $3.3 billion or $1.49 per share, increases of 39% and 41%, respectively, over prior year’s results (refer to the accompanying financial tables for further details and a reconciliation of the non-GAAP measures presented). Non-GAAP earnings per share growth was approximately 39% on a constant-dollar basis. All references to earnings per share assume fully-diluted class A share count. Net revenues in the fiscal third quarter were $6.1 billion, an increase of 27%, driven by the year-over-year growth in payments volume, cross-border volume and processed transactions. Net revenues increased approximately 26% on a constant-dollar basis. Had we recognized service revenues on current quarter's payments volume and other revenue components remained unchanged, net revenues would have increased 39%. Payments volume for the three months ended March 31, 2021, on which fiscal third quarter service revenue is recognized, increased 11% over the prior year on a constant-dollar basis. Payments volume for the three months ended June 30, 2021, increased 34% over the prior year on a constant-dollar basis. Cross-border volume excluding transactions within Europe, which drive our international transaction revenues, increased 53% on a constant-dollar basis for the three months ended June 30, 2021. Total cross-border volume on a constant-dollar basis increased 47% in the quarter. Total processed transactions, which represent transactions processed by Visa, for the three months ended June 30, 2021, were 42.6 billion, a 39% increase over the prior year, led by domestic transactions. Fiscal third quarter service revenues were $2.8 billion, an increase of 17% over the prior year, and are recognized based on payments volume in the prior quarter. All other revenue categories are recognized based on current quarter activity. Data processing revenues rose 32% over the prior year to $3.3 billion. International transaction revenues grew 54% over the prior year to $1.7 billion. Other revenues of $409 million rose 31% over the prior year. Client incentives, a contra-revenue item, were $2.1 billion and represented 25.8% of gross revenues. GAAP operating expenses were $2.1 billion for the fiscal third quarter, a 12% increase over the prior year's results, including the amortization of acquired intangible assets and non-recurring acquisition-related costs in the current and prior year. Excluding these operating expense items, non-GAAP operating expenses increased 12% over the prior year, primarily driven by an increase in personnel and marketing expenses. GAAP non-operating income was $325 million for the fiscal third quarter, including $439 million of net equity investment gains. Excluding this item, non-GAAP non-operating expense was $114 million. GAAP effective income tax rate was 41.3% for the quarter ended June 30, 2021, including the special item and the tax impacts from the net equity investment gains, amortization of acquired intangible assets and non-recurring acquisition-related costs. Excluding these items, the non-GAAP effective income tax rate was 17.9% for the quarter ended June 30, 2021. Cash, cash equivalents and investment securities were $20.4 billion at June 30, 2021. The weighted-average number of diluted shares of class A common stock outstanding was 2.18 billion for the quarter ended June 30, 2021. | ||
 | 2 | ||||
Other Notable Items
On June 24, 2021, Visa announced it signed a definitive agreement to acquire Tink, a European open banking platform that enables financial institutions, fintechs and merchants to build tailored financial management tools, products and services for European consumers and businesses based on their financial data. The transaction is subject to regulatory approvals and other customary closing conditions. On July 22, 2021, Visa announced it signed a definitive agreement to acquire Currencycloud, a global platform that enables banks and fintechs to provide innovative foreign exchange solutions for cross-border payments. The transaction is subject to regulatory approvals and other customary closing conditions. During the three months ended June 30, 2021, Visa repurchased 9.5 million shares of class A common stock at an average price of $227.83 per share for $2.2 billion. In the nine months ended June 30, 2021, Visa repurchased a total of 26.5 million shares of class A common stock, at an average price of $213.38 per share, using $5.7 billion of cash on hand. The Company had $7.7 billion of remaining authorized funds for share repurchase as of June 30, 2021. On July 23, 2021, the board of directors declared a quarterly cash dividend of $0.32 per share of class A common stock (determined in the case of class B and C common stock and series A, B and C convertible participating preferred stock on an as-converted basis) payable on September 1, 2021, to all holders of record as of August 13, 2021. | ||
Financial Outlook for Fiscal Full-Year 2021
| Given the continuing impact of COVID-19 and the significant uncertainty in the global economy, it is difficult to reasonably estimate the Company's annual results; therefore we are not providing a fiscal full-year 2021 outlook at this time. | ||
| 3 | ||||
Fiscal Third Quarter 2021 Earnings Results Call Details
Visa’s executive management team will host a live audio webcast beginning at 5:00 p.m. Eastern Time (2:00 p.m. Pacific Time) today to discuss the financial results and business highlights. All interested parties are invited to listen to the live webcast at http://investor.visa.com. A replay of the webcast will be available on the Visa Investor Relations website for 30 days. Investor information, including supplemental financial information, is available on Visa Inc.’s Investor Relations website at http://investor.visa.com. | ||
Forward-Looking Statements
This press release contains forward-looking statements within the meaning of the U.S. Private Securities Litigation Reform Act of 1995 that relate to, among other things, the impact on our underlying business drivers and other volume and transaction trends as a result of COVID-19, our future operations, prospects, developments, strategies, business growth and anticipated timing and benefits of our acquisitions. Forward-looking statements generally are identified by words such as “anticipates,” “estimates,” “expects,” “intends,” “may,” “projects,” “outlook,” “could,” “should,” “will,” “continue” and other similar expressions. All statements other than statements of historical fact could be forward-looking statements, which speak only as of the date they are made, are not guarantees of future performance and are subject to certain risks, uncertainties and other factors, many of which are beyond our control and are difficult to predict. Actual results could differ materially from those expressed in, or implied by, our forward-looking statements due to a variety of factors, including, but not limited to: •impact of global economic, political, market, health and social events or conditions, including the impact of COVID-19, the measures taken in response, as well as the speed and strength of an economic recovery; •increased oversight and regulation of the global payments industry and our business; •impact of government-imposed obligations and/or restrictions on international payment systems; •outcome of tax, litigation and governmental investigation matters; •increasingly intense competition in the payments industry, including competition for our clients and merchants; •proliferation and continuous evolution of new technologies and business models; •our ability to maintain relationships with our clients, acquirers, processors, merchants and other third parties; •brand or reputational damage; •exposure to loss or illiquidity due to settlement guarantees; •the impact of the United Kingdom’s withdrawal from the European Union; •a disruption, failure, breach or cyber-attack of our networks or systems; •risks, uncertainties and the failure to achieve the anticipated benefits with respect to our acquisitions and other strategic investments; and •other factors described in our filings with the U.S. Securities and Exchange Commission, including our Annual Report on Form 10-K for the year ended September 30, 2020, and our subsequent reports on Forms 10-Q and 8-K. Except as required by law, we do not intend to update or revise any forward-looking statements as a result of new information, future events or otherwise. | ||
About Visa Inc.
| Visa Inc. (NYSE: V) is the world’s leader in digital payments. Our mission is to connect the world through the most innovative, reliable and secure payment network – enabling individuals, businesses and economies to thrive. Our advanced global processing network, VisaNet, provides secure and reliable payments around the world, and is capable of handling more than 65,000 transaction messages a second. Our relentless focus on innovation is a catalyst for the rapid growth of digital commerce on any device for everyone, everywhere. As the world moves from analog to digital, Visa is applying our brand, products, people, network and scale to reshape the future of commerce. For more information, visit usa.visa.com/about-visa.html, usa.visa.com/visa-everywhere/blog.html and @VisaNews. | ||
| Contacts | Investor Relations Mike Milotich or Jennifer Como, 650-432-7644 InvestorRelations@visa.com | Media Relations Andy Gerlt, 650-432-2990 Press@visa.com | ||||||
| 4 | ||||
Fiscal Third Quarter 2021 — Financial Summary
| Q3 FISCAL 2021 INCOME STATEMENT SUMMARY | |||||||||||||||||||||||
| (in millions, except percentages and per share data) | Three Months Ended June 30, 2021 | YoY Change | |||||||||||||||||||||
| GAAP | Non-GAAP | GAAP | Non-GAAP | ||||||||||||||||||||
| Revenues | |||||||||||||||||||||||
| Service revenues | $ | 2,828 | $ | 2,828 | 17 | % | 17 | % | |||||||||||||||
| Data processing revenues | 3,327 | 3,327 | 32 | % | 32 | % | |||||||||||||||||
| International transaction revenues | 1,696 | 1,696 | 54 | % | 54 | % | |||||||||||||||||
| Other revenues | 409 | 409 | 31 | % | 31 | % | |||||||||||||||||
| Client incentives | (2,130) | (2,130) | 41 | % | 41 | % | |||||||||||||||||
| Net revenues | 6,130 | 6,130 | 27 | % | 27 | % | |||||||||||||||||
| Operating Expenses | |||||||||||||||||||||||
| Personnel | 1,098 | 1,094 | 17 | % | 17 | % | |||||||||||||||||
| Marketing | 268 | 268 | 54 | % | 54 | % | |||||||||||||||||
| Network and processing | 186 | 185 | 8 | % | 9 | % | |||||||||||||||||
| Professional fees | 108 | 108 | 13 | % | 13 | % | |||||||||||||||||
| Depreciation and amortization | 204 | 191 | 3 | % | 3 | % | |||||||||||||||||
| General and administrative | 204 | 204 | (21 | %) | (21 | %) | |||||||||||||||||
| Litigation provision | (2) | (2) | (309 | %) | (309 | %) | |||||||||||||||||
| Total operating expenses | 2,066 | 2,048 | 12 | % | 12 | % | |||||||||||||||||
| Operating income | 4,064 | 4,082 | 36 | % | 35 | % | |||||||||||||||||
| Non-operating income/(expense) | 325 | (114) | (591 | %) | (3 | %) | |||||||||||||||||
| Effective income tax rate | 41.3 | % | 17.9 | % | 22 ppt | (1 ppt) | |||||||||||||||||
| Net income | $ | 2,575 | $ | 3,256 | 9 | % | 39 | % | |||||||||||||||
| Earnings per share | $ | 1.18 | $ | 1.49 | 10 | % | 41 | % | |||||||||||||||
| Q3 FISCAL 2021 KEY BUSINESS DRIVERS | |||||||||||||||||||||||
| YoY Change | |||||||||||||||||||||||
| Constant | Nominal | ||||||||||||||||||||||
| Payments volume | 34 | % | 39 | % | |||||||||||||||||||
Cross-border volume excluding intra-Europe(1) | 53 | % | 62 | % | |||||||||||||||||||
| Cross-border volume total | 47 | % | 59 | % | |||||||||||||||||||
| Processed transactions | 39 | % | 39 | % | |||||||||||||||||||
(1) Cross-border volume excluding transactions within Europe. | |||||||||||||||||||||||
| 5 | ||||
| Visa Inc. Consolidated Balance Sheets (unaudited) | ||
| ||
| June 30, 2021 | September 30, 2020 | ||||||||||
| (in millions, except per share data) | |||||||||||
| Assets | |||||||||||
| Cash and cash equivalents | $ | 18,034 | $ | 16,289 | |||||||
| Restricted cash equivalents—U.S. litigation escrow | 894 | 901 | |||||||||
| Investment securities | 1,206 | 3,752 | |||||||||
| Settlement receivable | 1,663 | 1,264 | |||||||||
| Accounts receivable | 1,852 | 1,618 | |||||||||
| Customer collateral | 2,221 | 1,850 | |||||||||
| Current portion of client incentives | 1,321 | 1,214 | |||||||||
| Prepaid expenses and other current assets | 851 | 757 | |||||||||
| Total current assets | 28,042 | 27,645 | |||||||||
| Investment securities | 1,111 | 231 | |||||||||
| Client incentives | 3,219 | 3,175 | |||||||||
| Property, equipment and technology, net | 2,707 | 2,737 | |||||||||
| Goodwill | 16,021 | 15,910 | |||||||||
| Intangible assets, net | 28,023 | 27,808 | |||||||||
| Other assets | 3,548 | 3,413 | |||||||||
| Total assets | $ | 82,671 | $ | 80,919 | |||||||
| Liabilities | |||||||||||
| Accounts payable | $ | 172 | $ | 174 | |||||||
| Settlement payable | 2,376 | 1,736 | |||||||||
| Customer collateral | 2,221 | 1,850 | |||||||||
| Accrued compensation and benefits | 1,044 | 821 | |||||||||
| Client incentives | 5,114 | 4,176 | |||||||||
| Accrued liabilities | 2,196 | 1,840 | |||||||||
| Current maturities of debt | — | 2,999 | |||||||||
| Accrued litigation | 900 | 914 | |||||||||
| Total current liabilities | 14,023 | 14,510 | |||||||||
| Long-term debt | 20,996 | 21,071 | |||||||||
| Deferred tax liabilities | 6,240 | 5,237 | |||||||||
| Other liabilities | 3,622 | 3,891 | |||||||||
| Total liabilities | 44,881 | 44,709 | |||||||||
| Equity | |||||||||||
| Preferred stock, $0.0001 par value, 25 shares authorized and 5 shares issued and outstanding as follows: | |||||||||||
| Series A convertible participating preferred stock, less than one shares issued and outstanding at June 30, 2021 and September 30, 2020 | 538 | 2,437 | |||||||||
| Series B convertible participating preferred stock, 2 shares issued and outstanding at June 30, 2021 and September 30, 2020 | 1,071 | 1,106 | |||||||||
| Series C convertible participating preferred stock, 3 shares issued and outstanding at June 30, 2021 and September 30, 2020 | 1,523 | 1,543 | |||||||||
| Class A common stock, $0.0001 par value, 2,001,622 shares authorized, 1,689 and 1,683 shares issued and outstanding at June 30, 2021 and September 30, 2020, respectively | — | — | |||||||||
| Class B common stock, $0.0001 par value, 622 shares authorized, 245 shares issued and outstanding at June 30, 2021 and September 30, 2020 | — | — | |||||||||
| Class C common stock, $0.0001 par value, 1,097 shares authorized, 10 and 11 shares issued and outstanding at June 30, 2021 and September 30, 2020, respectively | — | — | |||||||||
| Right to recover for covered losses | (24) | (39) | |||||||||
| Additional paid-in capital | 18,787 | 16,721 | |||||||||
| Accumulated income | 15,294 | 14,088 | |||||||||
| Accumulated other comprehensive income (loss), net: | |||||||||||
| Investment securities | (1) | 3 | |||||||||
| Defined benefit pension and other postretirement plans | (187) | (196) | |||||||||
| Derivative instruments | (371) | (291) | |||||||||
| Foreign currency translation adjustments | 1,160 | 838 | |||||||||
| Total accumulated other comprehensive income (loss), net | 601 | 354 | |||||||||
| Total equity | 37,790 | 36,210 | |||||||||
| Total liabilities and equity | $ | 82,671 | $ | 80,919 | |||||||
| 6 | ||||
| Visa Inc. Consolidated Statements of Operations (unaudited) | ||
| ||
| Three Months Ended June 30, | Nine Months Ended June 30, | ||||||||||||||||||||||
| 2021 | 2020 | 2021 | 2020 | ||||||||||||||||||||
| (in millions, except per share data) | |||||||||||||||||||||||
| Net revenues | $ | 6,130 | $ | 4,837 | $ | 17,546 | $ | 16,745 | |||||||||||||||
| Operating Expenses | |||||||||||||||||||||||
| Personnel | 1,098 | 941 | 3,193 | 2,863 | |||||||||||||||||||
| Marketing | 268 | 174 | 679 | 683 | |||||||||||||||||||
| Network and processing | 186 | 172 | 538 | 536 | |||||||||||||||||||
| Professional fees | 108 | 95 | 273 | 304 | |||||||||||||||||||
| Depreciation and amortization | 204 | 197 | 602 | 571 | |||||||||||||||||||
| General and administrative | 204 | 258 | 770 | 840 | |||||||||||||||||||
| Litigation provision | (2) | 1 | 2 | 9 | |||||||||||||||||||
| Total operating expenses | 2,066 | 1,838 | 6,057 | 5,806 | |||||||||||||||||||
| Operating income | 4,064 | 2,999 | 11,489 | 10,939 | |||||||||||||||||||
| Non-operating Income (Expense) | |||||||||||||||||||||||
| Interest expense, net | (131) | (142) | (388) | (371) | |||||||||||||||||||
| Investment income and other | 456 | 75 | 664 | 167 | |||||||||||||||||||
| Total non-operating income (expense) | 325 | (67) | 276 | (204) | |||||||||||||||||||
| Income before income taxes | 4,389 | 2,932 | 11,765 | 10,735 | |||||||||||||||||||
| Income tax provision | 1,814 | 559 | 3,038 | 2,006 | |||||||||||||||||||
| Net income | $ | 2,575 | $ | 2,373 | $ | 8,727 | $ | 8,729 | |||||||||||||||
| Basic Earnings Per Share | |||||||||||||||||||||||
| Class A common stock | $ | 1.18 | $ | 1.07 | $ | 3.99 | $ | 3.92 | |||||||||||||||
| Class B common stock | $ | 1.92 | $ | 1.74 | $ | 6.47 | $ | 6.37 | |||||||||||||||
| Class C common stock | $ | 4.72 | $ | 4.29 | $ | 15.94 | $ | 15.70 | |||||||||||||||
| Basic Weighted-average Shares Outstanding | |||||||||||||||||||||||
| Class A common stock | 1,691 | 1,690 | 1,693 | 1,702 | |||||||||||||||||||
| Class B common stock | 245 | 245 | 245 | 245 | |||||||||||||||||||
| Class C common stock | 10 | 11 | 11 | 11 | |||||||||||||||||||
| Diluted Earnings Per Share | |||||||||||||||||||||||
| Class A common stock | $ | 1.18 | $ | 1.07 | $ | 3.98 | $ | 3.92 | |||||||||||||||
| Class B common stock | $ | 1.91 | $ | 1.74 | $ | 6.46 | $ | 6.36 | |||||||||||||||
| Class C common stock | $ | 4.72 | $ | 4.29 | $ | 15.92 | $ | 15.68 | |||||||||||||||
| Diluted Weighted-average Shares Outstanding | |||||||||||||||||||||||
| Class A common stock | 2,184 | 2,214 | 2,192 | 2,227 | |||||||||||||||||||
| Class B common stock | 245 | 245 | 245 | 245 | |||||||||||||||||||
| Class C common stock | 10 | 11 | 11 | 11 | |||||||||||||||||||
| 7 | ||||
Visa Inc. Consolidated Statements of Cash Flows (unaudited)
| Nine Months Ended June 30, | |||||||||||
| 2021 | 2020 | ||||||||||
| (in millions) | |||||||||||
| Operating Activities | |||||||||||
| Net income | $ | 8,727 | $ | 8,729 | |||||||
| Adjustments to reconcile net income to net cash provided by (used in) operating activities: | |||||||||||
| Client incentives | 5,980 | 4,966 | |||||||||
| Share-based compensation | 434 | 322 | |||||||||
| Depreciation and amortization of property, equipment, technology and intangible assets | 602 | 571 | |||||||||
| Deferred income taxes | 981 | (116) | |||||||||
| VE territory covered losses incurred | (38) | (22) | |||||||||
| (Gains) losses on equity investments, net | (611) | (62) | |||||||||
| Other | (82) | (87) | |||||||||
| Change in operating assets and liabilities: | |||||||||||
| Settlement receivable | (351) | 966 | |||||||||
| Accounts receivable | (220) | 108 | |||||||||
| Client incentives | (5,202) | (6,261) | |||||||||
| Other assets | (164) | (464) | |||||||||
| Accounts payable | 1 | 7 | |||||||||
| Settlement payable | 574 | (1,324) | |||||||||
| Accrued and other liabilities | 639 | 1,058 | |||||||||
| Accrued litigation | (14) | (47) | |||||||||
| Net cash provided by (used in) operating activities | 11,256 | 8,344 | |||||||||
| Investing Activities | |||||||||||
| Purchases of property, equipment and technology | (497) | (568) | |||||||||
| Investment securities: | |||||||||||
| Purchases | (3,223) | (549) | |||||||||
| Proceeds from maturities and sales | 5,286 | 3,675 | |||||||||
| Acquisitions, net of cash acquired | (75) | (77) | |||||||||
| Purchases of / contributions to other investments | (50) | (254) | |||||||||
| Other investing activities | 105 | 81 | |||||||||
| Net cash provided by (used in) investing activities | 1,546 | 2,308 | |||||||||
| Financing Activities | |||||||||||
| Repurchase of class A common stock | (5,709) | (6,572) | |||||||||
| Repayments of debt | (3,000) | — | |||||||||
| Dividends paid | (2,102) | (2,002) | |||||||||
| Proceeds from issuance of senior notes | — | 3,985 | |||||||||
| Cash proceeds from issuance of class A common stock under employee equity plans | 162 | 142 | |||||||||
| Restricted stock and performance-based shares settled in cash for taxes | (142) | (158) | |||||||||
| Other financing activities | — | (118) | |||||||||
| Net cash provided by (used in) financing activities | (10,791) | (4,723) | |||||||||
| Effect of exchange rate changes on cash, cash equivalents, restricted cash and restricted cash equivalents | 92 | 173 | |||||||||
| Increase (decrease) in cash, cash equivalents, restricted cash and restricted cash equivalents | 2,103 | 6,102 | |||||||||
| Cash, cash equivalents, restricted cash and restricted cash equivalents at beginning of period | 19,171 | 10,832 | |||||||||
| Cash, cash equivalents, restricted cash and restricted cash equivalents at end of period | $ | 21,274 | $ | 16,934 | |||||||
| Supplemental Disclosure | |||||||||||
| Cash paid for income taxes, net | $ | 2,134 | $ | 1,793 | |||||||
| Interest payments on debt | $ | 583 | $ | 503 | |||||||
| Accruals related to purchases of property, equipment and technology | $ | 52 | $ | 34 | |||||||
| 8 | ||||
| Visa Inc. Fiscal 2021 and 2020 Quarterly Results of Operations (unaudited) | ||
| ||
| Fiscal 2021 Quarter Ended | Fiscal 2020 Quarter Ended | ||||||||||||||||||||||||||||
| June 30, 2021 | March 31, 2021 | December 31, 2020 | September 30, 2020 | June 30, 2020 | |||||||||||||||||||||||||
| (in millions) | |||||||||||||||||||||||||||||
| Net revenues | $ | 6,130 | $ | 5,729 | $ | 5,687 | $ | 5,101 | $ | 4,837 | |||||||||||||||||||
| Operating Expenses | |||||||||||||||||||||||||||||
| Personnel | 1,098 | 1,114 | 981 | 922 | 941 | ||||||||||||||||||||||||
| Marketing | 268 | 206 | 205 | 288 | 174 | ||||||||||||||||||||||||
| Network and processing | 186 | 179 | 173 | 191 | 172 | ||||||||||||||||||||||||
| Professional fees | 108 | 82 | 83 | 104 | 95 | ||||||||||||||||||||||||
| Depreciation and amortization | 204 | 201 | 197 | 196 | 197 | ||||||||||||||||||||||||
| General and administrative | 204 | 363 | 203 | 256 | 258 | ||||||||||||||||||||||||
| Litigation provision | (2) | 3 | 1 | 2 | 1 | ||||||||||||||||||||||||
| Total operating expenses | 2,066 | 2,148 | 1,843 | 1,959 | 1,838 | ||||||||||||||||||||||||
| Operating income | 4,064 | 3,581 | 3,844 | 3,142 | 2,999 | ||||||||||||||||||||||||
| Non-operating Income (Expense) | |||||||||||||||||||||||||||||
| Interest expense, net | (131) | (121) | (136) | (145) | (142) | ||||||||||||||||||||||||
| Investment income and other | 456 | 168 | 40 | 58 | 75 | ||||||||||||||||||||||||
| Total non-operating income (expense) | 325 | 47 | (96) | (87) | (67) | ||||||||||||||||||||||||
| Income before income taxes | 4,389 | 3,628 | 3,748 | 3,055 | 2,932 | ||||||||||||||||||||||||
| Income tax provision | 1,814 | 602 | 622 | 918 | 559 | ||||||||||||||||||||||||
| Net income | $ | 2,575 | $ | 3,026 | $ | 3,126 | $ | 2,137 | $ | 2,373 | |||||||||||||||||||
| 9 | ||||
Visa Inc. Reconciliation of Non-GAAP Financial Results (unaudited)
We use non-GAAP financial measures of our performance which exclude certain items which we believe are not representative of our continuing operations, as they may be non-recurring or have no cash impact, and may distort our longer-term operating trends. We consider non-GAAP measures useful to investors because they provide greater transparency into management’s view and assessment of our ongoing operating performance. •Gains and losses on equity investments. Gains and losses on equity investments include periodic non-cash fair value adjustments and gains and losses upon sale of an investment. These long-term investments are strategic in nature and are primarily private company investments. Gains and losses and the related tax impacts associated with these investments are tied to the performance of the companies that we invest in and therefore do not correlate to the underlying performance of our business. •Amortization of acquired intangible assets. Amortization of acquired intangible assets consists of amortization of intangible assets such as developed technology, customer relationships and brands acquired in connection with business combinations executed beginning in fiscal 2019. Amortization charges for our acquired intangible assets are non-cash and are significantly affected by the timing, frequency and size of our acquisitions, rather than our core operations. As such, we have excluded this amount and the related tax impact to facilitate an evaluation of our current operating performance and comparison to our past operating performance. •Acquisition-related costs. Acquisition-related costs consist primarily of one-time transaction and integration costs associated with our business combinations. These costs include professional fees, technology integration fees, restructuring activities and other direct costs related to the purchase and integration of acquired entities. It also includes retention equity and deferred equity compensation when they are agreed upon as part of the purchase price of the transaction but are required to be recognized as expense post-combination. We have excluded these amounts and the related tax impacts as the expenses are recognized for a limited duration and do not reflect the underlying performance of our business. •Remeasurement of deferred tax balances. During the three and nine months ended June 30, 2021, in connection with the UK enacted legislation on June 10, 2021 that will increase the tax rate from 19% to 25%, effective April 1, 2023, we remeasured our net deferred tax liabilities, resulting in the recognition of a non-recurring, non-cash income tax expense of $1.0 billion. •Indirect taxes. During the nine months ended June 30, 2021, we recognized a one-time charge within general and administrative expense of $152 million, before tax. Net of the related income tax benefit of $40 million, determined by applying applicable tax rates, non-GAAP net income increased by $112 million. This charge is to record our estimate of probable additional indirect taxes, related to prior periods, for which we could be liable as a result of certain changes in applicable law. This one-time charge is not representative of our ongoing operations. Non-GAAP operating expense, non-operating income (expense), income tax provision, effective income tax rate, net income and diluted earnings per share should not be relied upon as substitutes for, or considered in isolation from, measures calculated in accordance with U.S. GAAP. The following tables reconcile our as-reported financial measures, calculated in accordance with U.S. GAAP, to our respective non-GAAP financial measures for the three and nine months ended June 30, 2021 and 2020. | ||
| 10 | ||||
| Visa Inc. Reconciliation of Non-GAAP Financial Results - continued (unaudited) | ||
| ||
| Three Months Ended June 30, 2021 | |||||||||||||||||||||||||||||||||||
| Operating Expenses | Non- operating Income (Expense) | Income Tax Provision | Effective Income Tax Rate(1) | Net Income | Diluted Earnings Per Share(1) | ||||||||||||||||||||||||||||||
| (in millions, except percentages and per share data) | |||||||||||||||||||||||||||||||||||
| As reported | $ | 2,066 | $ | 325 | $ | 1,814 | 41.3 | % | $ | 2,575 | $ | 1.18 | |||||||||||||||||||||||
| (Gains) losses on equity investments, net | — | (439) | (99) | (340) | (0.16) | ||||||||||||||||||||||||||||||
| Amortization of acquired intangible assets | (13) | — | 3 | 10 | — | ||||||||||||||||||||||||||||||
| Acquisition-related costs | (5) | — | 1 | 4 | — | ||||||||||||||||||||||||||||||
| Remeasurement of deferred tax balances | — | — | (1,007) | 1,007 | 0.46 | ||||||||||||||||||||||||||||||
| Non-GAAP | $ | 2,048 | $ | (114) | $ | 712 | 17.9 | % | $ | 3,256 | $ | 1.49 | |||||||||||||||||||||||
| Nine Months Ended June 30, 2021 | |||||||||||||||||||||||||||||||||||||||||||||||
| Operating Expenses | Non- operating Income (Expense) | Income Tax Provision | Effective Income Tax Rate(1) | Net Income | Diluted Earnings Per Share(1) | ||||||||||||||||||||||||||||||||||||||||||
| (in millions, except percentages and per share data) | |||||||||||||||||||||||||||||||||||||||||||||||
| As reported | $ | 6,057 | $ | 276 | $ | 3,038 | 25.8 | % | $ | 8,727 | $ | 3.98 | |||||||||||||||||||||||||||||||||||
| (Gains) losses on equity investments, net | — | (611) | (138) | (473) | (0.22) | ||||||||||||||||||||||||||||||||||||||||||
| Amortization of acquired intangible assets | (38) | — | 9 | 29 | 0.01 | ||||||||||||||||||||||||||||||||||||||||||
| Acquisition-related costs | (13) | — | 3 | 10 | — | ||||||||||||||||||||||||||||||||||||||||||
| Remeasurement of deferred tax balances | — | — | (1,007) | 1,007 | 0.46 | ||||||||||||||||||||||||||||||||||||||||||
| Indirect taxes | (152) | — | 40 | 112 | 0.05 | ||||||||||||||||||||||||||||||||||||||||||
| Non-GAAP | $ | 5,854 | $ | (335) | $ | 1,945 | 17.1 | % | $ | 9,412 | $ | 4.29 | |||||||||||||||||||||||||||||||||||
| Three Months Ended June 30, 2020 | |||||||||||||||||||||||||||||||||||
| Operating Expenses | Non- operating Income (Expense) | Income Tax Provision | Effective Income Tax Rate(1) | Net Income | Diluted Earnings Per Share(1) | ||||||||||||||||||||||||||||||
| (in millions, except percentages and per share data) | |||||||||||||||||||||||||||||||||||
| As reported | $ | 1,838 | $ | (67) | $ | 559 | 19.1 | % | $ | 2,373 | $ | 1.07 | |||||||||||||||||||||||
| (Gains) losses on equity investments, net | — | (51) | (11) | (40) | (0.02) | ||||||||||||||||||||||||||||||
| Amortization of acquired intangible assets | (13) | — | 3 | 10 | — | ||||||||||||||||||||||||||||||
| Acquisition-related costs | (4) | — | — | 4 | — | ||||||||||||||||||||||||||||||
| Non-GAAP | $ | 1,821 | $ | (118) | $ | 551 | 19.0 | % | $ | 2,347 | $ | 1.06 | |||||||||||||||||||||||
| Nine Months Ended June 30, 2020 | |||||||||||||||||||||||||||||||||||||||||||||||
| Operating Expenses | Non- operating Income (Expense) | Income Tax Provision | Effective Income Tax Rate(1) | Net Income | Diluted Earnings Per Share(1) | ||||||||||||||||||||||||||||||||||||||||||
| (in millions, except percentages and per share data) | |||||||||||||||||||||||||||||||||||||||||||||||
| As reported | $ | 5,806 | $ | (204) | $ | 2,006 | 18.7 | % | $ | 8,729 | $ | 3.92 | |||||||||||||||||||||||||||||||||||
| (Gains) losses on equity investments, net | — | (62) | (14) | (48) | (0.02) | ||||||||||||||||||||||||||||||||||||||||||
| Amortization of acquired intangible assets | (35) | — | 8 | 27 | 0.01 | ||||||||||||||||||||||||||||||||||||||||||
| Acquisition-related costs | (11) | — | 2 | 9 | — | ||||||||||||||||||||||||||||||||||||||||||
| Non-GAAP | $ | 5,760 | $ | (266) | $ | 2,002 | 18.7 | % | $ | 8,717 | $ | 3.91 | |||||||||||||||||||||||||||||||||||
(1)Figures in the table may not recalculate exactly due to rounding. Effective income tax rate, diluted earnings per share and their respective totals are calculated based on unrounded numbers. | ||
| 11 | ||||
| Operational Performance Data | ||
| ||
| The tables below provide information regarding the available operational results for the 3 months ended June 30, 2021, as well as the prior four quarterly reporting periods and the 12 months ended June 30, 2021 and 2020, for cards and other form factors carrying the Visa, Visa Electron, V PAY and Interlink brands. | ||
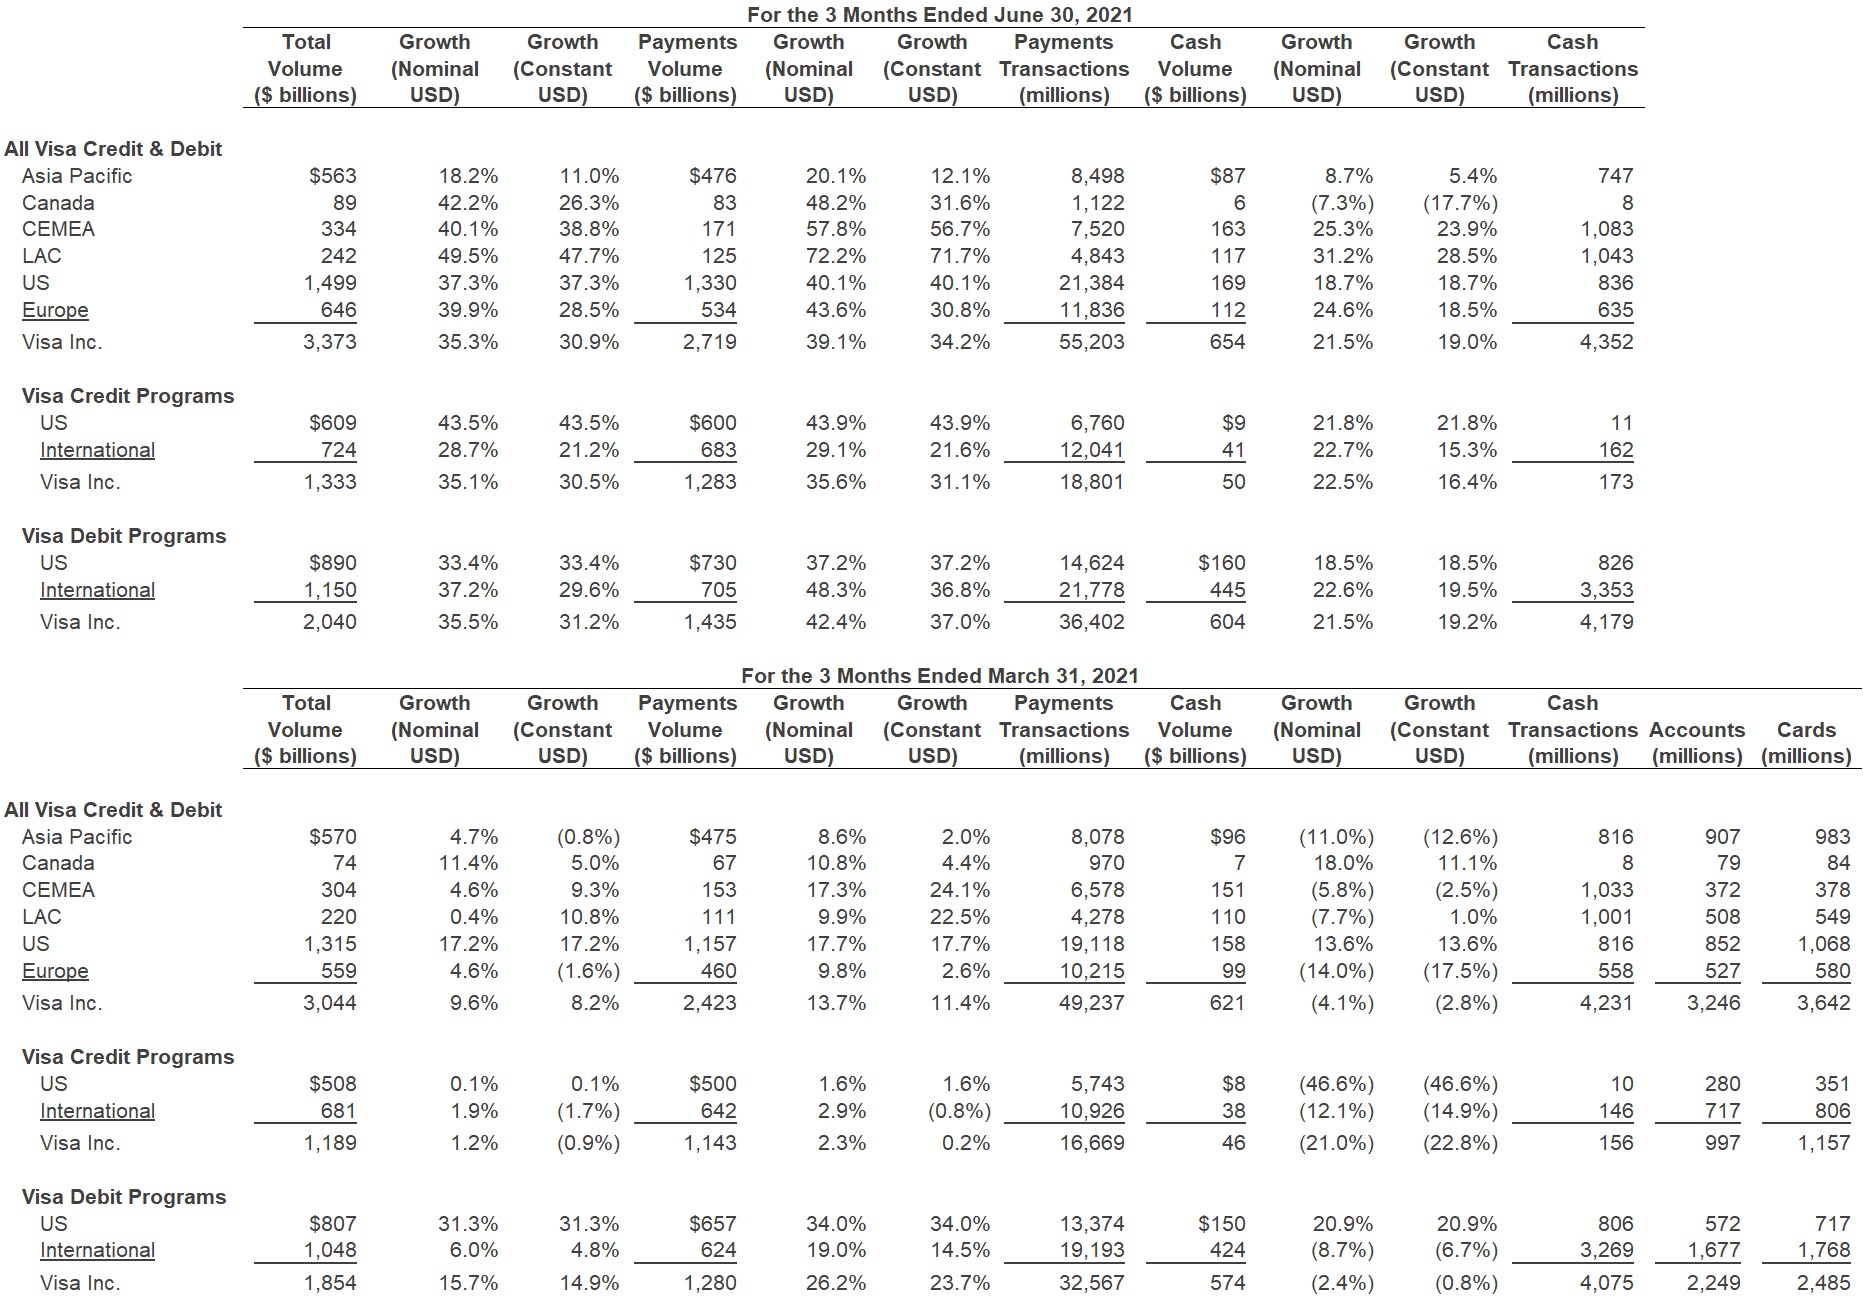
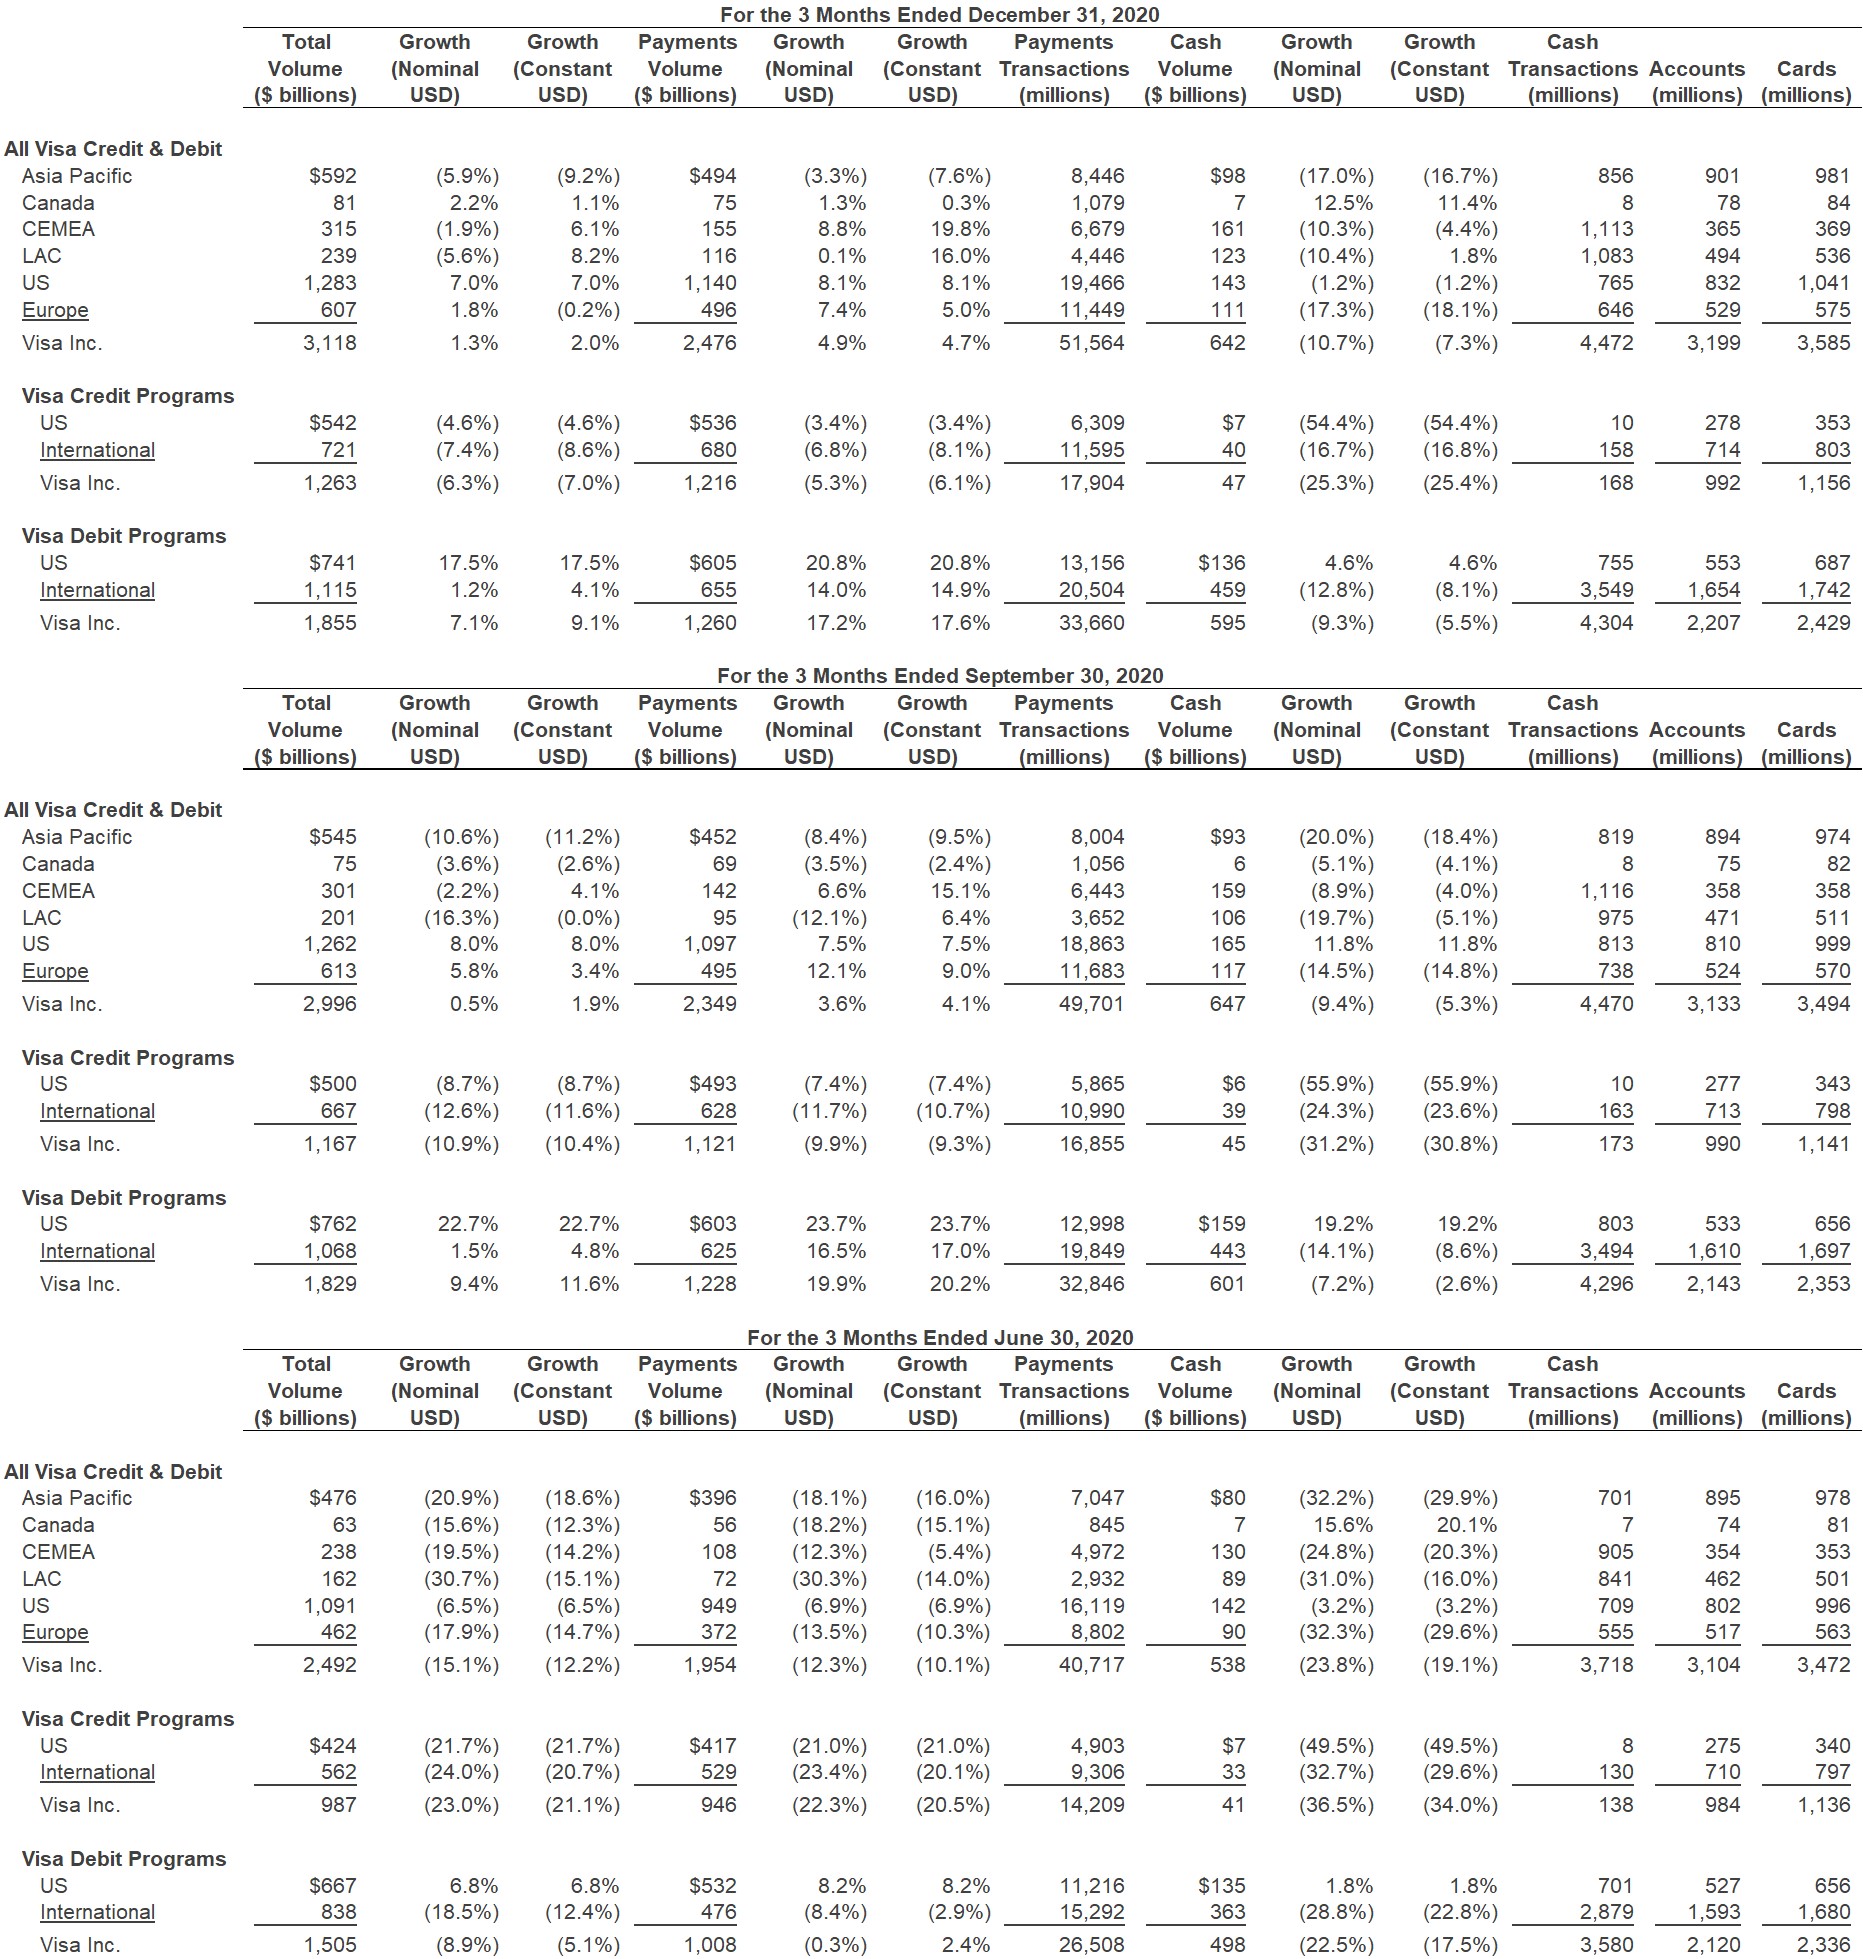
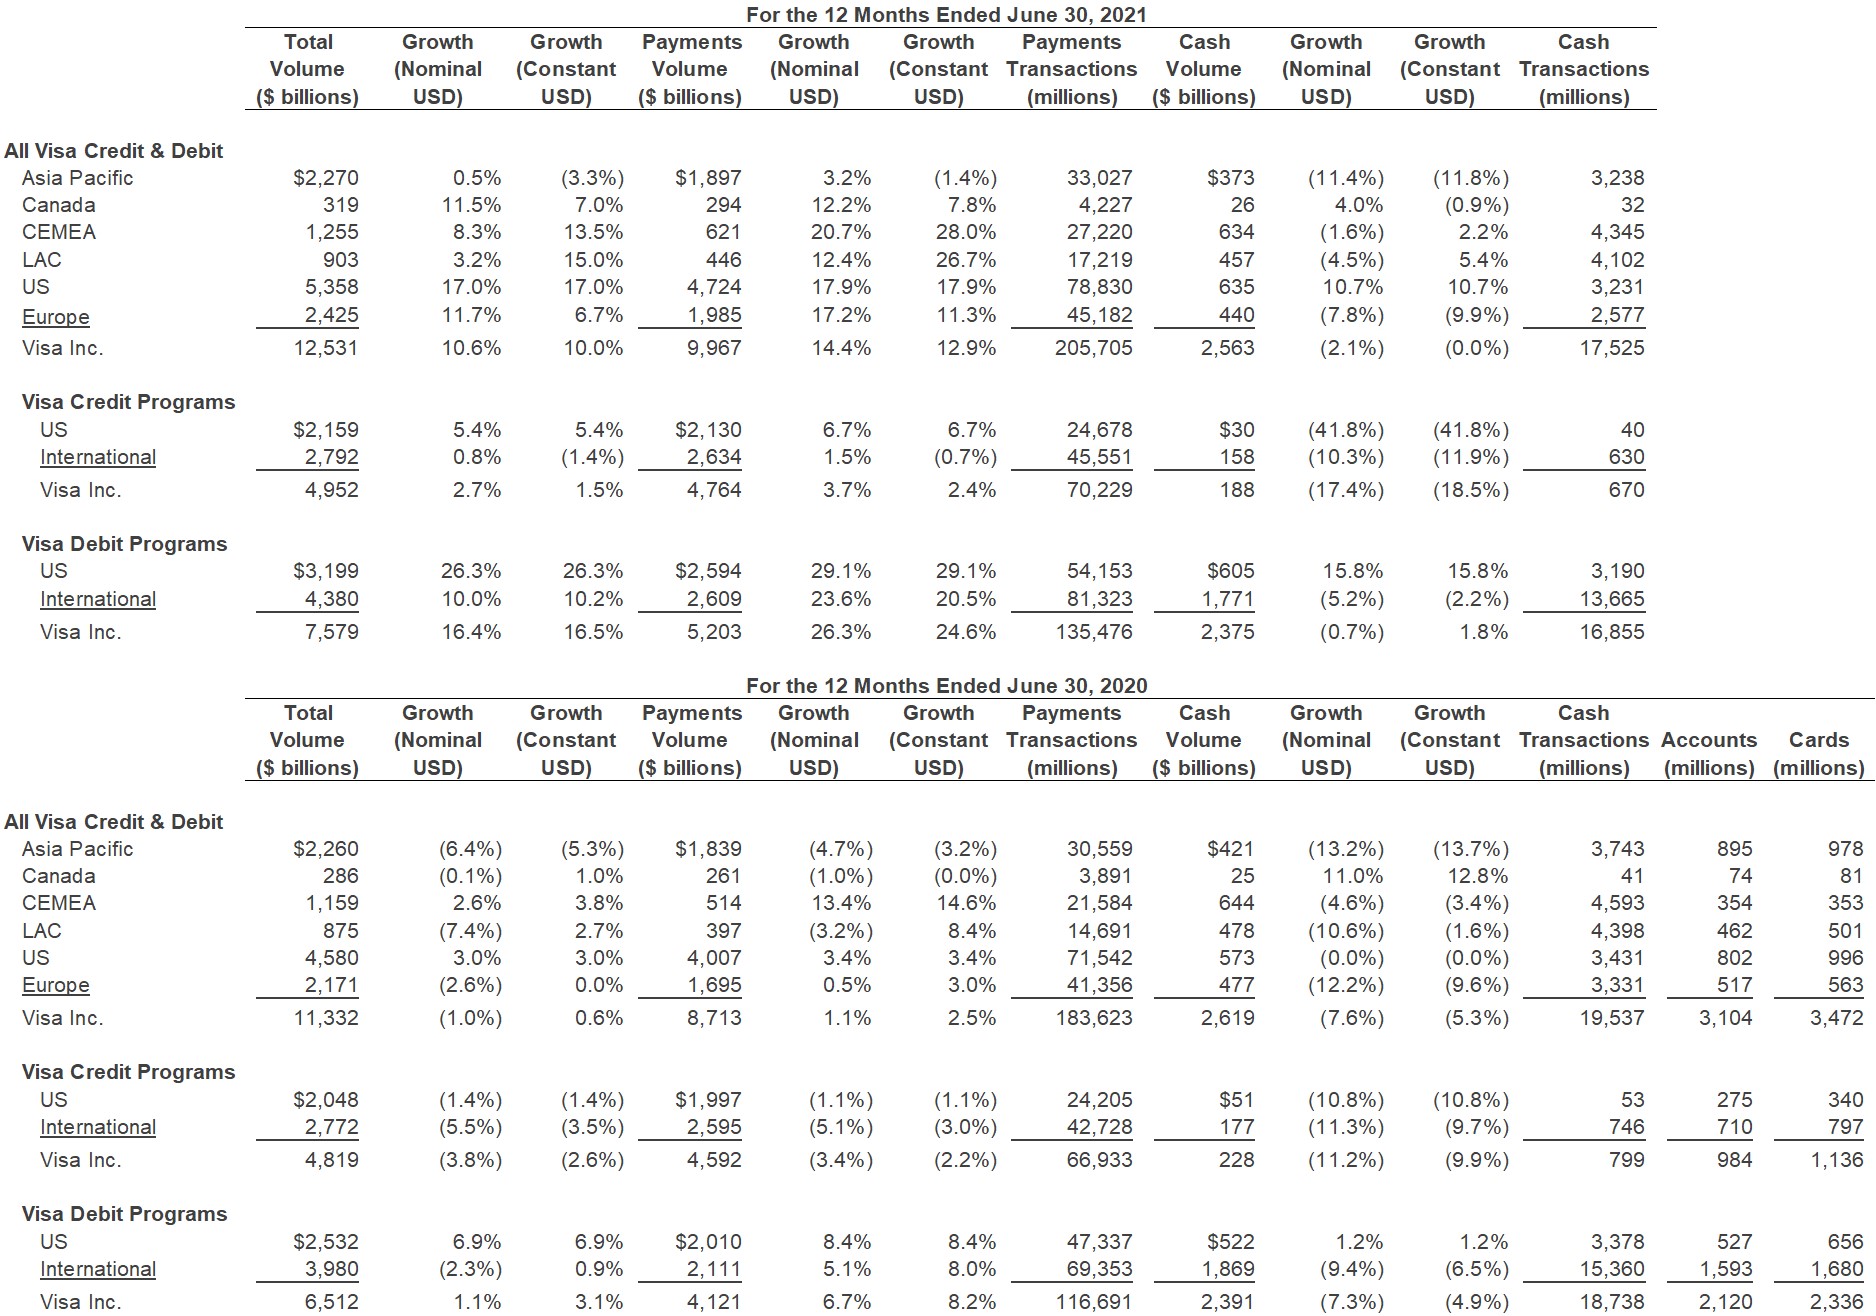
| 1. Branded Volume and Transactions | ||
| The tables present regional total volume, payments volume, and cash volume, and the number of payments transactions, cash transactions, accounts and cards for cards and other form factors carrying the Visa, Visa Electron, V PAY and Interlink brands and excludes Europe co-badged volume and transactions for all periods. Card counts include PLUS proprietary cards. Nominal and constant dollar growth rates over prior years are provided for volume-based data. | ||
| 12 | ||||
| 13 | ||||
| 14 | ||||
| 2. Cross-Border Volume | ||
| The table below represents cross-border volume growth for cards and other form factors carrying the Visa, Visa Electron, V PAY, Interlink and PLUS brands. Cross-border volume refers to payments and cash volume where the issuing country is different from the merchant country. | ||
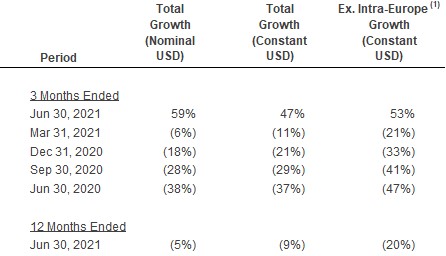
(1) Cross-border volumes excluding transactions within Europe drive our international transaction revenues. | ||
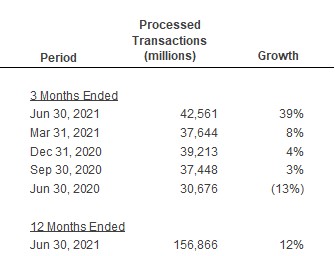
| 3. Visa Processed Transactions | ||
| The table below represents transactions using cards and other form factors carrying the Visa, Visa Electron, V PAY, Interlink and PLUS brands processed on Visa’s networks. | ||
| 15 | ||||
| Footnote | ||
Payments volume, including Visa Direct volume, represents the aggregate dollar amount of purchases made with cards and other form factors carrying the Visa, Visa Electron, V PAY and Interlink brands and excludes Europe co-badged volume for the relevant period, and cash volume represents the aggregate dollar amount of cash disbursements obtained with these cards for the relevant period and includes the impact of balance transfers and convenience checks, but excludes proprietary PLUS volume. Total volume represents payments and cash volume. Visa payment products are comprised of credit and debit programs, and data relating to each program is included in the tables. Debit programs include Visa’s signature based and Interlink (PIN) debit programs. The data presented is based on transactions processed by Visa and reported by Visa’s financial institution clients on their operating certificates. Estimates may be utilized if data is unavailable. Previously presented information may be updated. Prior period updates, if any, are not material. Visa’s CEMEA region is comprised of countries in Central Europe, the Middle East and Africa. Several European Union countries in Central Europe, Israel and Turkey are not included in CEMEA. LAC is comprised of countries in Central and South America and the Caribbean. International includes Asia Pacific, Canada, CEMEA, Europe and LAC. Information denominated in U.S. dollars is calculated by applying an established U.S. dollar/local currency exchange rate for each local currency in which Visa Inc. volumes are reported (“Nominal USD”). These exchange rates are calculated on a quarterly basis using the established exchange rate for each quarter. To eliminate the impact of foreign currency fluctuations against the U.S. dollar in measuring performance, Visa Inc. also reports year-over-year growth in total volume, payments volume and cash volume on the basis of local currency information (“Constant USD”). This presentation represents Visa’s historical methodology which may be subject to review and refinement. Figures in the tables may not recalculate exactly due to rounding. The totals and percentages are calculated based on unrounded numbers. | ||
| 16 | ||||