Exhibit 99.1

Och-Ziff Capital Management Group LLC Reports
First Quarter 2008 Results
First Quarter 2008 Dividend of $0.08 per Class A Share
NEW YORK, April 30, 2008 – Och-Ziff Capital Management Group LLC (NYSE: OZM) (the “Company” or “Och-Ziff”) today reported its results for the first quarter ended March 31, 2008.
First Quarter Highlights
| • | Distributable Earnings of $50.0 million, or $0.13 per Adjusted Class A Share |
| • | Dividend of $0.08 per Class A Share to be paid on May 7, 2008 to holders of record as of the close of business on April 1, 2008 |
| • | Assets under management of $33.3 billion as of March 31, 2008, 30% higher than as of March 31, 2007 |
| • | Economic Income Revenues of $146.5 million, 47% higher than first quarter 2007 Economic Income Revenues |
For the first quarter ended March 31, 2008, Och-Ziff reported a GAAP net loss of $268.1 million, or $3.62 per basic and diluted Class A Share. The first-quarter 2008 GAAP net loss resulted primarily from non-cash expenses of $425.6 million associated with the Company’s reorganization in connection with its initial public offering (“IPO”) in November 2007. These expenses are related to the amortization of Och-Ziff Operating Group A Units (“Group A Units”), which represent equity interests in the Company’s principal operating subsidiaries that were granted to the Company’s pre-IPO owners in exchange for their pre-IPO interests in those subsidiaries. The Group A Units vest annually over five years from the date of the IPO. Accordingly, amortization of these expenses is expected to result in a GAAP net loss each quarter through 2012. Once vested, the Group A Units may be exchanged on a one-to-one basis for Class A Shares. Also contributing to the GAAP net loss was a non-cash expense of $26 million for the amortization of equity-based compensation, primarily related to Class A restricted share units granted to all of the Company’s employees in connection with the IPO. These units vest annually over four years from the date of the IPO.
Och-Ziff’s Distributable Earnings for the first quarter ended March 31, 2008 totaled $50.0 million, or $0.13 per Adjusted Class A Share. Distributable Earnings is a supplemental non-GAAP financial measure used by management to determine the after-tax amount available to distribute as dividends to holders of the Company’s Class A Shares and to the Company’s partners, assuming all Group A Units and Class A restricted share units were converted on a
1
one-to-one basis into Class A Shares (“Adjusted Class A Shares”). Distributable Earnings is equal to Economic Income of the Och-Ziff Funds segment less adjusted income taxes. These adjusted income taxes were calculated assuming all Group A Units and Class A restricted share units were converted on a one-to-one basis into Class A Shares. Distributable Earnings per Share is equal to Distributable Earnings divided by the number of Adjusted Class A Shares. Management believes that Distributable Earnings provides a meaningful basis for comparison of the after-tax operating performance of the Och-Ziff Funds segment, which represents substantially all of the Company’s business. For a reconciliation of the Company’s first-quarter 2008 Economic Income to Distributable Earnings, please see Exhibit 6 of the financial tables that accompany this press release.
Och-Ziff’s assets under management were $33.3 billion as of March 31, 2008, up 30% from $25.7 billion in assets under management as of March 31, 2007, but essentially unchanged from $33.4 billion in assets under management as of December 31, 2007. The $7.6 billion year-over-year increase was driven by net inflows and appreciation, primarily in each of the Company’s most significant master funds. The increase also included the fourth-quarter 2007 reinvestment by the Company’s partners of $1.6 billion in after-tax proceeds from the Company’s IPO and Class A Share sale to Dubai International Capital. These proceeds were principally invested in the OZ Global Special Investments Master Fund. During the 2008 first quarter, net inflows of approximately $263 million were offset by performance-related depreciation of $389 million.
Assets under management by fund are as follows:
| % Change (4) | ||||||||||||
| (dollars in billions) | March 31, 2008 | December 31, 2007 | March 31, 2007 | Mar. 2008 vs. Dec. 2007 | Mar. 2008 vs. Mar. 2007 | |||||||
OZ Master Fund | 19.9 | 19.8 | 17.1 | 1 | % | 17 | % | |||||
OZ Europe Master Fund | 6.2 | 6.4 | 4.5 | -3 | % | 39 | % | |||||
OZ Asia Master Fund (1) | 3.8 | 3.9 | 2.7 | -1 | % | 41 | % | |||||
OZ Global Special Investments Master Fund (2) | 2.1 | 2.1 | 0.2 | 0 | % | 871 | % | |||||
Other (3) (4) | 1.3 | 1.2 | 1.2 | 8 | % | 8 | % | |||||
| (1) | Includes investment of $0.1 billion in after-tax proceeds from the Company’s Class A Share sales |
| (2) | Includes investment of $1.5 billion in after-tax proceeds from the Company’s Class A Share sales |
| (3) | Includes OZ Capital Structure Arbitrage Master Fund, Real Estate Funds and managed accounts |
| (4) | Rounding differences may occur |
The 2008 first quarter net returns of the Company’s most significant master funds are detailed in the table below. These returns were generated with less than half the volatility of the S&P 500 and essentially no leverage.
Summary Performance Statistics (1)
| 2008 | ||||||||||||
| January | February | March | 1Q | |||||||||
OZ Master Fund | -1.12 | % | 1.02 | % | -0.73 | % | -0.84 | % | ||||
OZ Europe Master Fund | -2.00 | % | 0.81 | % | -0.54 | % | -1.74 | % | ||||
OZ Asia Master Fund | -1.95 | % | 1.78 | % | -2.41 | % | -2.61 | % | ||||
OZ Global Special Investments Master Fund | -0.72 | % | 0.57 | % | -0.45 | % | -0.60 | % | ||||
| (1) | Please see important disclosures on Exhibit 9 of the Financial Supplement accompanying this press release. |
2
“Och-Ziff’s differentiated model continued to serve our fund investors well during the difficult market conditions of the first quarter,” said Daniel Och, Chairman and Chief Executive Officer of Och-Ziff. “Our focus on preserving fund capital by actively managing our exposures to reduce risk was evident in our absolute returns. Additionally, our ability to effectively navigate the markets during the first quarter also demonstrates the benefits of our being well-diversified and maintaining low leverage. We remain confident in our ability to grow assets under management, and we are making consistent progress toward achieving our growth objectives for 2008. While we believe market conditions will remain challenging for the balance of this year, we continue to see considerable opportunities in the current environment for our time-tested investment approach.”
SUMMARY RESULTS OF THE OCH-ZIFF FUNDS SEGMENT
The Och-Ziff Funds segment is currently the Company’s only reportable operating segment. This segment provides management and advisory services to the Company’s funds and separately managed accounts, excluding substantially all of its real estate funds.
The Company’s other operations are currently comprised of its real estate business, which manages and provides advisory services to substantially all of its real estate funds, and investments in new businesses. These operations are currently not material to the Company’s overall operations and are not included in the results of the Och-Ziff Funds segment or the performance measure for that segment. Accordingly, these other operations are also excluded from calculations of Distributable Earnings.
The performance measure for the Och-Ziff Funds segment is Economic Income, which management uses to evaluate the financial performance of and make operating decisions for the segment. Management believes that investors should review the same performance measure that it uses to analyze the Company’s segment and overall business performance. Economic Income does not include allocations to the partners and the Ziffs on their pre-IPO interests, reorganization expenses related to the Company’s IPO, taxes, and partners’ and others’ interests in the Company’s consolidated subsidiaries. For a reconciliation of first-quarter 2008 and first-quarter 2007 Economic Income to total Company GAAP net income (loss) for the corresponding periods, please see Exhibits 3 and 4 of the financial tables that accompany this press release.
Economic Income
Economic Income Revenues
First-quarter 2008 Economic Income Revenues were $146.5 million, up 47% compared to first-quarter 2007 Economic Income Revenues of $100.0 million. Management fees were $145.0 million, up 48% from first-quarter 2007 management fees of $98.0 million. The increase in management fees was driven by the year-over-year increase in assets under management.
3
Economic Income Expenses
Compensation and Benefits
First-quarter 2008 compensation and benefit expenses were $25.4 million, up 80% from first-quarter 2007 compensation and benefit expenses of $14.1 million. The year-over-year increase was driven by increased headcount, primarily during the second half of 2007, related to the infrastructure needed to become a public company and to support the expansion of the Company’s business. First-quarter 2008 compensation and benefits also included $9.8 million of compensation expenses primarily related to one-time, non-recurring payments to certain existing personnel and new employees.
Non-Compensation Expenses
First-quarter 2008 non-compensation expenses were $35.1 million, a 219% increase from first-quarter 2007 non-compensation expenses of $11.0 million. The increase was driven primarily by interest expense on the Company’s $750 million term loan, which was entered into during the third quarter of 2007. The increase was also driven by higher professional services fees primarily related to the costs of the Company’s 2007 annual audit, and related tax preparation and consulting services. On a comparative basis, these expenses were primarily incurred during the second and third quarters of 2007 in connection with the Company’s IPO, not in the first quarter of 2007. The remainder of the growth in non-compensation expenses was primarily driven by technology, recruiting, and insurance costs due to the growth in the Company’s business and the associated infrastructure requirements.
Economic Income
First-quarter 2008 Economic Income totaled $85.9 million, a 15% increase from first-quarter 2007 Economic Income of $74.8 million. This result was driven by the year-over-year increase in management fees due to growth in assets under management, which more than offset the increase in operating expenses.
The first-quarter 2008 margin, which is first-quarter Economic Income divided by first-quarter Economic Income Revenues was 59%, which was 16 percentage points lower than the first-quarter 2007 margin of 75%. The margin decrease was primarily attributable to interest expense on the Company’s $750 million term loan, higher compensation expenses due to significant year-over-year headcount growth, and higher professional services fees.
CAPITAL
As of March 31, 2008, Class A Shares outstanding totaled 74,138,572. For purposes of calculating Distributable Earnings, all Group A Units and Class A restricted share units, excluding Class A restricted share units granted and forfeited in the current period, are assumed to have converted at the beginning of the year on a one-to-one basis into Class A Shares, for a total of 399,197,675 Adjusted Class A Shares outstanding.
4
DIVIDEND
The Board of Directors of Och-Ziff Capital Management Group LLC has declared a first-quarter 2008 dividend of $0.08 per Class A Share, to be paid on May 7, 2008 to holders of record at the close of business on April 1, 2008.
For U.S. federal income tax purposes, the dividend will be treated as a partnership distribution. Based on the best information currently available, the Company estimates that when calculating withholding taxes, the entire amount of the first-quarter 2008 dividend will be treated as U.S. source dividend income.
Non-U.S. holders of Class A Shares are generally subject to U.S. federal withholding tax at a rate of 30% (subject to reduction by applicable treaty or other exception) on their share of U.S. source dividends and certain other types of U.S. source income realized by the Company. With respect to interest, however, no withholding is generally required if proper certification (on an IRS Form W-8) of a beneficial owner’s foreign status has been filed with the withholding agent. In addition, non-U.S. holders must generally provide the withholding agent with a properly completed IRS Form W-8 to obtain any reduction in withholding.
* * * *
Och-Ziff will host a conference call today, April 30, 2008, at 10:00 a.m. Eastern Time to discuss the Company’s first-quarter 2008 results. The call will be open to the public and can be accessed by dialing 888-680-0894 (callers inside the U.S.) or 617-213-4860 (callers outside the U.S.). The number should be dialed at least ten minutes prior to the start of the call. The passcode for the call will be 10014826. A simultaneous webcast of the call will be available to the public on a listen-only basis on the Shareholders page of the Company’s website at www.ozcap.com.
For those unable to listen to the live broadcast, a replay will be available by dialing 888-286-8010 (callers inside the U.S.) or 617-801-6888 (callers outside the U.S.), passcode 95657155, beginning approximately two hours after the event for two weeks. A webcast replay of the event will also be available on the Company’s website.
* * * *
Forward-Looking Statements
The information contained in this press release may contain forward-looking statements within the meaning of the Private Securities Litigation Reform Act of 1995 that reflect the current views of the Company with respect to, among other things, its future financial or business performance, events, strategies or expectations, including but not limited to its ability to generate returns and preserve capital and its ability to expand its investment platforms. Such forward-looking statements are generally identified by the use of words such as “outlook,” “believe,” “expect,” “potential,” “continue,” “may,” “will,” “should,” “could,” “seeks,” “approximately,” “predicts,”
5
“intends,” “plans,” “estimates,” “anticipates,” “opportunity,” “assume,” “remain,” “sustain,” “achieve” or the negative version of those words or other comparable words.
Any forward-looking statements contained in this press release are based upon historical performance of the Company and its subsidiaries and on current plans, estimates and expectations of the Company and its subsidiaries. The inclusion of this forward-looking information should not be regarded as a representation by the Company or any other person that the future plans, estimates or expectations contemplated by the Company will be achieved. Such forward-looking statements are subject to various risks and uncertainties, including but not limited to global and domestic market and business conditions, the Company’s ability to successfully compete for fund investors, talent and investment opportunities, successful execution of its business and growth strategies, the Company’s ability to appropriately manage conflicts of interest, and tax and other regulatory factors relevant to the Company’s structure and status as a public company, as well as assumptions relating to the Company’s operations, financial results, financial condition, business prospects, growth strategy and liquidity.
If one or more of these or other risks or uncertainties materialize, or if the Company’s assumptions prove to be incorrect, the Company’s actual results may vary materially from those indicated in these statements. These factors should not be construed as exhaustive and should be read in conjunction with the other cautionary statements and risks that are included in the Company’s filings with the Securities and Exchange Commission, including but not limited to the Company’s Annual Report on Form 10-K for the year ended December 31, 2007. Any forward-looking statements contained in this press release are made only as of the date hereof. The Company does not undertake any obligation to publicly update or review any forward-looking statement, whether as a result of new information, future developments or otherwise.
This press release does not constitute an offer of any Och-Ziff fund.
* * * *
About Och-Ziff Capital Management Group LLC
Och-Ziff Capital Management Group is one of the world’s largest institutional alternative asset managers with offices in New York, London, Hong Kong, Tokyo, Bangalore and Beijing. Och-Ziff’s funds seek to deliver consistent, positive, risk-adjusted returns throughout market cycles, with a strong focus on risk management and capital preservation. Och-Ziff’s multi-strategy approach combines global investment strategies, including merger arbitrage, convertible and derivative arbitrage, equity restructuring, credit and distressed credit investments, private investments and real estate. As of March 31, 2008, Och-Ziff had approximately $33.3 billion in assets under management with over 700 investor relationships. For more information, please visitwww.ozcap.com.
6
Investor Relations Contact:
Tina Madon
Managing Director
Head of Investor Relations
Och-Ziff Capital Management Group LLC
212-719-7381
tina.madon@ozcap.com
Media Relations Contact:
Steve Bruce or Chuck Dohrenwend
The Abernathy MacGregor Group, for Och-Ziff Capital Management Group LLC
212-371-5999
7
Exhibit 1
OCH-ZIFF CAPITAL MANAGEMENT GROUP LLC
Consolidated and Combined Statements of Operations (Unaudited)
(dollars in thousands, except per share amounts)
| Three Months Ended March 31, | ||||||||
| 2008 | 2007 | |||||||
Revenues | ||||||||
Management fees | $ | 146,275 | $ | 23,450 | ||||
Incentive income | 32 | 67 | ||||||
Other revenues | 1,519 | 922 | ||||||
Income of consolidated Och-Ziff funds | 1 | 259,927 | ||||||
Total Revenues | 147,827 | 284,366 | ||||||
Expenses | ||||||||
Compensation and benefits | 52,955 | 21,241 | ||||||
Allocations to non-equity partner interests | (1,850 | ) | 66,560 | |||||
Reorganization expenses | 425,584 | — | ||||||
Profit sharing | (834 | ) | 13,544 | |||||
Interest expense | 10,817 | 329 | ||||||
General, administrative and other | 25,775 | 11,794 | ||||||
Expenses of consolidated Och-Ziff funds | 360 | 150,060 | ||||||
Total Expenses | 512,807 | 263,528 | ||||||
Other Income | ||||||||
Earnings on investments in and deferred income | (5,164 | ) | 19,883 | |||||
Net gains of consolidated Och-Ziff funds | (913 | ) | 1,010,284 | |||||
Total Other Income | (6,077 | ) | 1,030,167 | |||||
Income (Loss) before Income Taxes and Partners’ and Others’ | (371,057 | ) | 1,051,005 | |||||
Income taxes | 3,226 | 3,640 | ||||||
Income (Loss) before Partners’ and Others’ Interests in | (374,283 | ) | 1,047,365 | |||||
Partners’ and others’ interests in income of consolidated subsidiaries | 106,165 | (962,177 | ) | |||||
Net Income (Loss) | $ | (268,118 | ) | $ | 85,188 | |||
Net Loss per Class A Share | ||||||||
Basic and Diluted | $ | (3.62 | ) | |||||
Weighted Average Class A Shares Outstanding | ||||||||
Basic and Diluted | 74,138,572 | |||||||
Exhibit 2
OCH-ZIFF CAPITAL MANAGEMENT GROUP LLC
Och-Ziff Funds Economic Income (Unaudited)
(dollars in thousands)
| Three Months Ended March 31, | % Change | ||||||||
| 2008 | 2007 | 1Q08 vs. 1Q07 | |||||||
Economic Income Revenues | |||||||||
Management fees | $ | 144,964 | $ | 97,965 | 48 | % | |||
Incentive income | 32 | 1,081 | -97 | % | |||||
Other revenues | 1,503 | 904 | 66 | % | |||||
Total Economic Income Revenues | 146,499 | 99,950 | 47 | % | |||||
Economic Income Expenses | |||||||||
Compensation and benefits | 25,446 | 14,123 | 80 | % | |||||
Non-compensation expenses | 35,107 | 11,011 | 219 | % | |||||
Total Economic Income Expenses | 60,553 | 25,134 | 141 | % | |||||
Och-Ziff Funds Economic Income | $ | 85,946 | $ | 74,816 | 15 | % | |||
See Exhibits 3 and 4 for reconciliations of Och-Ziff Funds Economic Income to total Company GAAP Net Income (Loss).
Exhibit 3
OCH-ZIFF CAPITAL MANAGEMENT GROUP LLC
Reconciliation of Och-Ziff Funds Economic Income to GAAP Net Income (Loss) (Unaudited)
(dollars in thousands)
| Three Months Ended March 31, 2008 | |||||||||||||||||||
| Reconciling Adjustments (1) | |||||||||||||||||||
| Och-Ziff Funds Economic Income | Other Operations | Funds Consolidation | Other Adjustments | Total Company | |||||||||||||||
Revenues | |||||||||||||||||||
Management fees | $ | 144,964 | $ | 1,311 | $ | — | $ | — | $ | 146,275 | |||||||||
Incentive income | 32 | — | — | — | 32 | ||||||||||||||
Other revenues | 1,503 | 16 | — | — | 1,519 | ||||||||||||||
Income of consolidated Och-Ziff funds | — | — | 1 | — | 1 | ||||||||||||||
Total Revenues | 146,499 | 1,327 | 1 | — | 147,827 | ||||||||||||||
Expenses | |||||||||||||||||||
Compensation and benefits | 25,446 | 339 | — | 27,170 | (a)(b) | 52,955 | |||||||||||||
Allocations to non-equity partner interests | — | — | — | (1,850 | ) (c) | (1,850 | ) | ||||||||||||
Reorganization expenses | — | — | — | 425,584 | (d) | 425,584 | |||||||||||||
Profit sharing | — | — | — | (834 | ) (e) | (834 | ) | ||||||||||||
Interest expense | 10,817 | — | — | — | 10,817 | ||||||||||||||
General, administrative and other | 24,290 | 334 | — | 1,151 | (f) | 25,775 | |||||||||||||
Expenses of consolidated Och-Ziff funds | — | 360 | — | — | 360 | ||||||||||||||
Total Expenses | 60,553 | 1,033 | — | 451,221 | 512,807 | ||||||||||||||
Other Income | |||||||||||||||||||
Earnings on investments in and deferred income receivable from Och-Ziff funds and other entities | — | (4,069 | ) | — | (1,095 | ) (g) | (5,164 | ) | |||||||||||
Net gains of consolidated Och-Ziff funds | — | (906 | ) | (7 | ) | — | (913 | ) | |||||||||||
Total Other Income | — | (4,975 | ) | (7 | ) | (1,095 | ) | (6,077 | ) | ||||||||||
Income (Loss) Before Income Taxes and Partners’ and Others’ Interests in Income of Consolidated Subsidiaries | 85,946 | (4,681 | ) | (6 | ) | (452,316 | ) | (371,057 | ) | ||||||||||
Income taxes | — | 133 | — | 3,093 | (f) | 3,226 | |||||||||||||
Income (Loss) Before Partners’ and Others’ Interests in Income of Consolidated Subsidiaries | 85,946 | (4,814 | ) | (6 | ) | (455,409 | ) | (374,283 | ) | ||||||||||
Partners’ and others’ interests in income of consolidated subsidiaries | — | 1,004 | 6 | 105,155 | (f) | 106,165 | |||||||||||||
Net Income (Loss) | $ | 85,946 | $ | (3,810 | ) | $ | — | $ | (350,254 | ) | $ | (268,118 | ) | ||||||
| (1) | See Exhibit 5 for a description of the adjustments made to arrive at total Company GAAP Net Income (Loss). |
Exhibit 4
OCH-ZIFF CAPITAL MANAGEMENT GROUP LLC
Reconciliation of Och-Ziff Funds Economic Income to GAAP Net Income (Loss) (Unaudited)
(dollars in thousands)
| Three Months Ended March 31, 2007 | |||||||||||||||||||
| Reconciling Adjustments (1) | |||||||||||||||||||
| Och-Ziff Funds Economic Income | Other Operations | Funds Consolidation | Other Adjustments | Total Company | |||||||||||||||
Revenues | |||||||||||||||||||
Management fees | $ | 97,965 | $ | 1,311 | $ | (75,826 | ) | $ | — | $ | 23,450 | ||||||||
Incentive income | 1,081 | — | (1,014 | ) | — | 67 | |||||||||||||
Other revenues | 904 | 18 | — | — | 922 | ||||||||||||||
Income of consolidated Och-Ziff funds | — | — | 259,927 | — | 259,927 | ||||||||||||||
Total Revenues | 99,950 | 1,329 | 183,087 | — | 284,366 | ||||||||||||||
Expenses | |||||||||||||||||||
Compensation and benefits | 14,123 | 1,321 | — | 5,797 | (a)(b) | 21,241 | |||||||||||||
Allocations to non-equity partner interests | — | (30 | ) | — | 66,590 | (c) | 66,560 | ||||||||||||
Profit sharing | — | (10 | ) | — | 13,554 | (e) | 13,544 | ||||||||||||
Interest expense | 329 | — | — | — | 329 | ||||||||||||||
General, administrative and other | 10,682 | 141 | — | 971 | (f) | 11,794 | |||||||||||||
Expenses of consolidated Och-Ziff funds | — | 224 | 149,836 | — | 150,060 | ||||||||||||||
Total Expenses | 25,134 | 1,646 | 149,836 | 86,912 | 263,528 | ||||||||||||||
Other Income | |||||||||||||||||||
Earnings on investments in and deferred income receivable from Och-Ziff funds and other entities | — | — | (81,046 | ) | 100,929 | (g) | 19,883 | ||||||||||||
Net gains of consolidated Och-Ziff funds | — | — | 1,010,284 | — | 1,010,284 | ||||||||||||||
Total Other Income | — | — | 929,238 | 100,929 | 1,030,167 | ||||||||||||||
Income (Loss) Before Income Taxes and Partners’ and Others’ Interests in Income of Consolidated Subsidiaries | 74,816 | (317 | ) | 962,489 | 14,017 | 1,051,005 | |||||||||||||
Income taxes | — | 35 | — | 3,605 | (f) | 3,640 | |||||||||||||
Income (Loss) Before Partners’ and Others’ Interests in Income of Consolidated Subsidiaries | 74,816 | (352 | ) | 962,489 | 10,412 | 1,047,365 | |||||||||||||
Partners’ and others’ interests in income of consolidated subsidiaries | — | 312 | (962,489 | ) | — | (962,177 | ) | ||||||||||||
Net Income (Loss) | $ | 74,816 | $ | (40 | ) | $ | — | $ | 10,412 | $ | 85,188 | ||||||||
| (1) | See Exhibit 5 for a description of the adjustments made to arrive at total Company GAAP Net Income (Loss). |
Exhibit 5
OCH-ZIFF CAPITAL MANAGEMENT GROUP LLC
Description of Adjustments Made to Reconcile Och-Ziff Funds Economic Income to GAAP Net Income (Loss)
Funds Consolidation
Economic Income reflects incentive income and management fees earned from each of the Company’s funds and managed accounts, excluding substantially all of the real estate funds. The impacts of the consolidation and related eliminations of the Company’s funds are not included in Economic Income. Incentive income and management fees not eliminated in consolidation prior to June 30, 2007, are related to the Company’s domestic funds and managed accounts. The Company deconsolidated all of its offshore funds on June 30, 2007.
Other Adjustments
(a) Economic Income recognizes deferred cash compensation expense in the period in which it is granted, as the Company determines the total amount of the compensation based on the Company’s performance in the year of the grant. Under GAAP, deferred cash compensation expense is recognized over the vesting period.
(b) Economic Income excludes non-cash equity compensation granted to employees at the time of the IPO and grants made to the independent members of the Company’s board of directors. Additionally, the fair value of bonuses paid in non-cash equity is recognized in the period in which they are granted.
(c) Economic Income excludes allocations to non-equity partner interests, as the Company reviews the performance of the Och-Ziff Funds segment before making any allocations to its non-equity partners for periods prior to the reorganization. For such periods, allocations to the Company’s partners, other than Mr. Och, were treated as expenses for GAAP purposes. Following the reorganization, only allocations related to earnings on previously deferred incentive income allocations to non-equity partner interests are incurred.
(d) Economic Income excludes reorganization expenses, which are non-cash expenses directly attributable to the reclassification of interests held by the Company’s owners prior to the IPO into Och-Ziff Operating Group A Units.
(e) Economic Income excludes the profit sharing expense related to the Ziffs’ interest in the Company, as the Company reviews the performance of the Och-Ziff Funds segment before profit sharing allocations for periods prior to the reorganization. Following the reorganization, only profit sharing expense related to the allocation of earnings on previously deferred incentive income allocations to the Ziffs are incurred.
(f) Economic Income excludes depreciation, income taxes and partners’ and others’ interests in income of consolidated subsidiaries, as the Company does not consider these items in determining the performance of the Och-Ziff Funds segment.
(g) Economic Income excludes the earnings on investments in and deferred income receivable from Och-Ziff funds and other, as these amounts relate to earnings on amounts due to partners related to prior income allocations and amounts due to employees under deferred compensation arrangements.
Exhibit 6
OCH-ZIFF CAPITAL MANAGEMENT GROUP LLC
Reconciliation of Och-Ziff Funds Economic Income to Distributable Earnings (Unaudited)
(dollars in thousands, except per share amounts)
| Three Months Ended March 31, 2008 | ||||
Och-Ziff Funds Economic Income | $ | 85,946 | ||
Adjusted income taxes (1) | (35,958 | ) | ||
Distributable Earnings | $ | 49,988 | ||
Distributable earnings | $ | 49,988 | ||
Adjusted Class A shares (1) | 399,197,675 | |||
Distributable Earnings Per Share | $ | 0.13 | ||
| (1) | Assumes the conversion of 311,099,524 Och-Ziff Operating Group A Units held by the Company’s partners and the Ziffs and 13,959,579 restricted share units, which excludes restricted share units granted and forfeited in the current period, into Class A Shares on a one-to-one basis and that all of these shares were outstanding for each period presented. |
Exhibit 7
OCH-ZIFF CAPITAL MANAGEMENT GROUP LLC
Financial Supplement (Unaudited)
(dollars in millions)
| Three Months Ended March 31, | Year Ended December 31, | |||||||||||||||
| 2008 | 2007 | 2006 | 2005 | |||||||||||||
Total Assets Under Management (1) | ||||||||||||||||
Beginning of Period Balance | $ | 33,387 | $ | 22,621 | $ | 15,627 | $ | 11,251 | ||||||||
Net Inflows | 263 | 7,591 | 4,135 | 3,117 | ||||||||||||
Appreciation (Depreciation) (2) | (389 | ) | 3,175 | 2,859 | 1,259 | |||||||||||
End of Period Balance | $ | 33,261 | $ | 33,387 | $ | 22,621 | $ | 15,627 | ||||||||
Total Assets Under Management by Fund | ||||||||||||||||
OZ Master Fund | $ | 19,926 | $ | 19,771 | $ | 15,449 | $ | 12,001 | ||||||||
OZ Europe Master Fund | 6,224 | 6,416 | 3,481 | 1,887 | ||||||||||||
OZ Asia Master Fund | 3,804 | 3,852 | 2,332 | 605 | ||||||||||||
OZ Global Special Investments Master Fund | 2,080 | 2,082 | 195 | 43 | ||||||||||||
Och-Ziff Funds - Net Returns (3) | ||||||||||||||||
OZ Master Fund | -0.8 | % | 11.5 | % | 14.8 | % | 8.8 | % | ||||||||
OZ Europe Master Fund | -1.7 | % | 14.8 | % | 22.3 | % | 15.7 | % | ||||||||
OZ Asia Master Fund | -2.6 | % | 12.2 | % | 14.0 | % | 14.2 | % | ||||||||
OZ Global Special Investments Master Fund | -0.6 | % | 17.2 | % | 13.9 | % | 0.2 | % | ||||||||
| (1) | Includes deferred incentive income receivable from the offshore funds and amounts invested by the Company, its partners and certain other affiliated parties for which the Company charged no management fees and received no incentive income for the periods presented. Amounts presented in this table are not the amounts used to calculate management fees and incentive income for the respective periods. |
| (2) | Appreciation (depreciation) reflects the aggregate net capital appreciation (depreciation) for the entire period and is presented on a total return basis, net of all fees and expenses (except incentive compensation on certain unrealized private investments that could reduce returns on these investments at the time of realization), and includes the reinvestment of all dividends and income. Management and incentive fees vary by product. Past performance is no guarantee of future results. |
| (3) | Fund performance reflects a composite of the monthly return for the feeder funds comprising each of the Company’s most significant master funds and is presented on a total return basis, net of all fees and expenses of the relevant fund (except incentive compensation on certain unrealized special investments that could reduce returns at the time of realization), and includes the reinvestment of all dividends and income. Performance includes realized and unrealized gains and losses attributable to certain private and initial public offering investments that are not allocated to all investors in the funds. Investors that do not participate in such investments or that pay different fees may experience materially different returns. Past performance is no guarantee of future results. |
Exhibit 8
OCH-ZIFF CAPITAL MANAGEMENT GROUP LLC
(Unaudited)
Returns of OZ Master Fund During Negative Return Months of S&P 500 Index |
| Year | Number of Months of Negative Returns of S&P 500 | Total Return of S&P 500 During Negative Return Months | Total Return of OZ Master Fund During Negative Return Months of S&P 500 | |||
| 1994 | 3 | -8.5% | 1.7% | |||
| 1995 | 1 | -0.4% | 0.1% | |||
| 1996 | 2 | -6.4% | 3.9% | |||
| 1997 | 3 | -13.1% | 4.0% | |||
| 1998 | 3 | -17.2% | -2.7% | |||
| 1999 | 5 | -11.8% | 6.2% | |||
| 2000 | 8 | -27.1% | 12.0% | |||
| 2001 | 6 | -33.2% | 0.4% | |||
| 2002 | 8 | -41.9% | -5.0% | |||
| 2003 | 3 | -5.2% | 4.6% | |||
| 2004 | 3 | -6.4% | 1.1% | |||
| 2005 | 5 | -8.7% | 0.7% | |||
| 2006 | 1 | -2.9% | 0.5% | |||
| 2007 | 5 | -11.6% | 1.4% | |||
| 1Q08 | 3 | -9.7% | -0.8% |
| Distribution of Net Monthly Returns since April 1, 1994 |
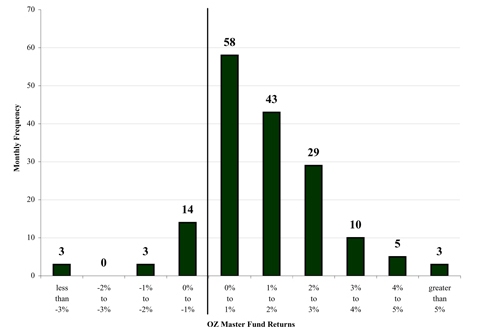
Total net return for the OZ Master Fund, Ltd. (the “Fund”) represents a composite of the average return of the feeder funds that comprise the Fund. Returns are presented on a total return basis, net of all fees and expenses (except incentive compensation on certain unrealized private investments that could reduce returns on these investments at the time of realization), and include the reinvestment of all dividends and income. Performance includes realized and unrealized gains and losses attributable to certain private and initial public offering investments that are not allocated to all investors in the Fund. Investors that do not participate in such investments or that pay different fees may experience materially different returns. Past performance is no guarantee of future results.
For the period from 1994 through 1997, performance represents the performance of Och-Ziff Capital Management, L.P., a Delaware limited partnership that was managed by Daniel S. Och following an investment strategy that is substantially similar to that of the Fund. In addition, during this period performance was calculated by deducting management fees on a quarterly basis and incentive fees on a monthly basis. Beginning January 1998, performance has been calculated by deducting both management fees and incentive fees on a monthly basis from the composite returns of the Fund.
Readers should not assume that there is any material overlap between those securities in the portfolio of the Fund and those that comprise the S&P 500 Index. It is not possible to invest directly in the S&P 500 Index. Returns of the S&P 500 Index have not been reduced by fees and expenses associated with investing in securities and include the reinvestment of dividends. The S&P 500 Index is an equity index owned and maintained by Standard & Poor’s, a division of McGraw-Hill, whose value is calculated as the free float-weighted average of the share prices of 500 large-cap corporations listed on the NYSE and Nasdaq. The comparison of S&P 500 Index performance relative to the Fund’s performance during months in which the S&P 500 Index declined is for the limited purpose of illustrating how the Fund has performed during periods of declines in the broad equity market. It should not be considered an indication of how the Fund will perform relative to the S&P 500 Index in the future.
Please note that the Fund’s investment objective is not to beat the S&P 500 Index. Furthermore, the Fund performance has frequently trailed that of the S&P 500 Index in periods of positive performance.
Exhibit 9
OCH-ZIFF CAPITAL MANAGEMENT GROUP LLC
Fund Performance (Unaudited)
| Monthly Returns (1) | |||||||||||||||||||||||||||||||||||||||
| 2007 | |||||||||||||||||||||||||||||||||||||||
January | February | March | April | May | June | July | August | September | October | November | December | FY2007 | |||||||||||||||||||||||||||
Och-Ziff Funds - Net Returns | |||||||||||||||||||||||||||||||||||||||
OZ Master Fund | 1.97 | % | 1.31 | % | 1.38 | % | 1.81 | % | 2.40 | % | 0.19 | % | -0.49 | % | -0.96 | % | 0.95 | % | 2.07 | % | -0.32 | % | 0.67 | % | 11.48 | % | |||||||||||||
OZ Europe Master Fund | 1.57 | % | 1.35 | % | 1.84 | % | 2.70 | % | 2.85 | % | 0.83 | % | 0.22 | % | -0.64 | % | 1.25 | % | 1.25 | % | -0.58 | % | 1.32 | % | 14.81 | % | |||||||||||||
OZ Asia Master Fund | 2.69 | % | 0.48 | % | 0.37 | % | 2.96 | % | 2.67 | % | 0.09 | % | -1.00 | % | -2.08 | % | 0.43 | % | 2.84 | % | 0.12 | % | 2.12 | % | 12.17 | % | |||||||||||||
OZ Global Special Investments Master Fund | 1.89 | % | 1.42 | % | 1.06 | % | 2.93 | % | 1.44 | % | 0.83 | % | -0.40 | % | -0.54 | % | 1.72 | % | 3.11 | % | 1.97 | % | 0.61 | % | 17.19 | % | |||||||||||||
S&P 500 Index- Total Return | 1.51 | % | -1.96 | % | 1.12 | % | 4.43 | % | 3.49 | % | -1.66 | % | -3.10 | % | 1.50 | % | 3.74 | % | 1.59 | % | -4.18 | % | -0.69 | % | 5.49 | % | |||||||||||||
| Monthly Returns (1) | ||||||||||||
| 2008 | ||||||||||||
| January | February | March | 1Q08 | |||||||||
Och-Ziff Funds - Net Returns | ||||||||||||
OZ Master Fund | -1.12 | % | 1.02 | % | -0.73 | % | -0.84 | % | ||||
OZ Europe Master Fund | -2.00 | % | 0.81 | % | -0.54 | % | -1.74 | % | ||||
OZ Asia Master Fund | -1.95 | % | 1.78 | % | -2.41 | % | -2.61 | % | ||||
OZ Global Special Investments Master Fund | -0.72 | % | 0.57 | % | -0.45 | % | -0.60 | % | ||||
S&P 500 Index - Total Return | -6.00 | % | -3.25 | % | -0.43 | % | -9.45 | % | ||||
| (1) | Fund performance reflects a composite of the monthly return for the feeder funds comprising each of the Company’s most significant master funds and is presented on a total return basis, net of all fees and expenses of the relevant fund (except incentive compensation on certain unrealized private investments that could reduce returns on these investments at the time of realization), and includes the reinvestment of all dividends and income. Performance includes realized and unrealized gains and losses attributable to certain private and initial public offering investments that are not allocated to all investors in the funds. Investors that do not participate in such investments or that pay different fees may experience materially different returns. Past performance is no guarantee of future results. |
Readers should not assume that there is any material overlap between those securities in the portfolio of the funds and those that comprise the S&P 500 Index. It is not possible to invest directly in the S&P 500 Index. Returns of the S&P 500 Index have not been reduced by fees and expenses associated with investing in securities and include the reinvestment of dividends. The S&P 500 Index is an equity index owned and maintained by Standard & Poor’s, a division of McGraw-Hill, whose value is calculated as the free float-weighted average of the share prices of 500 large-cap corporations listed on the NYSE and Nasdaq. The comparison of S&P 500 performance relative to the funds’ performance should not be considered an indication of how the fund will perform relative to the S&P 500 in the future. Please note that the funds’ investment objective is not to beat the S&P 500 Index. Furthermore, the funds performance has frequently trailed that of the S&P 500 Index in periods of positive performance.