Exhibit 99.2
www.energyxxi.com Investor Presentation February 2017
Forward - Looking Statements This presentation contains forward - looking statements within the meaning of the Private Securities Litigation Reform Act of 1995. These statements, including those relating to the intent, beliefs, plans, or expectations of EGC are based upon current expectations and are subject to a number of risks, uncertainties, and assumptions. It is not possible to predict or identify all such factors and the following list should not be considered a complete statement of all potential risks and uncertainties relating to emergence from Chapter 11 or a change in EGC’s senior management team, including, but not limited to: ( i ) the effects of the departure of EGC’s senior leaders on the Company’s employees, suppliers, regulators and business counterparties, (ii) the ability of the Company to hire a permanent CEO, including how long that process may take, (iii) any effects from the same person’s serving, on an interim basis, as both Chairman of the Board and the CEO at the same time, (vi) the increased advisory costs incurred in connection with executing the reorganization, (vii) the uncertainty that any trading market for our common stock will exist or develop in the over - the - counter markets or other national exchange in the future, (viii) the impact of restrictions in the exit financing on EGC’s ability to make capital investments and pursue strategic growth opportunities and (ix) other risks and uncertainties. These risks and uncertainties could cause actual results, including project plans and related expenditures and resource recoveries, to differ materially from those described in the forward - looking statements. For a more detailed discussion of risk factors, please see Part I, Item 1A, “Risk Factors” of the most recent Annual Report on Form 10 - K for the year ended June 30, 2016 filed by Energy XXI Ltd (“EXXI Ltd”) as predecessor to EGC and Part II, Item 1A of EXXI Ltd’s Quarterly Report on Form 10 - Q for the period ended September 30, 2016 for more information. EGC will file reports and other information with the SEC going forward. EGC assumes no obligation and expressly disclaims any duty to update the information contained herein except as required by law. 2
Non - GAAP Measures and Cautionary Language on Hydrocarbon Reserves 3 The Company refers to “PV - 10” as the present value of estimated future net revenues of estimated proved reserves using a discoun t rate of 10%. This amount includes projected revenues less estimated production costs, abandonment costs and development costs but doe s not include effects, if any, of income taxes, as described below. PV - 10 is not a financial measure prescribed under accounting p rinciples generally accepted in the U.S. (“U.S. GAAP”); therefore, the table reconciles this amount to the standardized measure of disc oun ted future net cash flows, which is the most directly comparable U.S. GAAP financial measure. Management believes that the non - U.S. GAAP financial measure of PV - 10 is relevant and useful for evaluating the relative monetary significance of oil and natural gas properties. PV - 10 is used internally when assessing the potential return on investment related to oil and natural gas properties and in eval uating acquisition opportunities. EGC believes the use of this pre - tax measure is valuable because there are unique factors that can im pact an individual company when estimating the amount of future income taxes to be paid. Management believes that the presentation of PV - 10 provides useful information to investors because it is widely used by professional analysts and sophisticated investors in ev alu ating oil and natural gas companies. PV - 10 is not a measure of financial or operating performance under U.S. GAAP, nor is it intended to represent the current market value of our estimated oil and natural gas reserves. PV - 10 should not be considered in isolation or as a substitute for the standardized measure of discounted future net cash flows as defined under U.S. GAAP. EGC has provided internally generated estimates for proved reserves and aggregated proved, probable and possible reserves as of December 31, 2016, in this presentation, with each category of reserves estimated in accordance with SEC guidelines and defin iti ons. The SEC permits the optional disclosure of probable and possible reserves. From time to time, we elect to use “probable or 2P ” r eserves and “possible or 3P” reserves, excluding their valuation. The SEC defines “probable” reserves as “those additional reserves t hat are less certain to be recovered than proved reserves but which, together with proved reserves, are as likely as not to be recovered.” Th e SEC defines “possible” reserves as “those additional reserves that are less certain to be recovered than probable reserves.” Actual quantities that may be ultimately recovered from EGC’s interests may differ substantially from the estimates in this p res entation. Factors affecting ultimate recovery include the scope of EGC’s ongoing drilling program, which will be directly affected by c omm odity prices, the availability of capital, regulatory approvals, drilling and production costs, availability of drilling services a nd equipment, drilling results, lease expirations, transportation constraints and other factors; actual drilling results, including geological and m ech anical factors affecting recovery rates; and budgets based upon our future evaluation of risk, returns and the availability of capital.
The New Energy XXI Gulf Coast (EGC) 4 • Eliminated $3.6 Billion of Debt and ~$330 Million (1) in Annualized Interest Expense – Currently $74 million drawn on revolver (2) and $128 million of liquidity • Simplified Corporate Structure – Delaware incorporation; reduction in corporate entities • Converted to Calendar Year End – Effective December 31, 2016 • Plan to List on NASDAQ Exchange – Early March 2017 • Host Quarterly Conference Calls – Beginning with 1Q 2017 in early May 1) Based on FY 2015 interest expense which includes amortization of debt issuance cost 2) Remaining $228 million of revolver dedicated to maintain letter of credit commitment to ExxonMobil for plug and abandonment obligations
Clear Path Forward 5 • Operating Safely, Efficiently and Effectively – Safely deliver predictable and repeatable results – Base production enhancement • Facility de - bottlenecking and gas - lift optimization – Continue to drive costs down • Optimize operations, minimize LOE and right - size G&A • Fiscally Responsible Approach – Focus on low - cost, low - risk projects • Large inventory of recompletions (historically the highest return on capital) • Development wells (stacked pay, shallow water opportunities from existing platforms) – Fund program with internally generated cash flow and available cash – Drive breakeven lower with emphasis on cash generation – Proactively manage plugging and abandonment responsibilities – Limit downside price exposure through hedging Focused on Financial Discipline and Operational Excellence
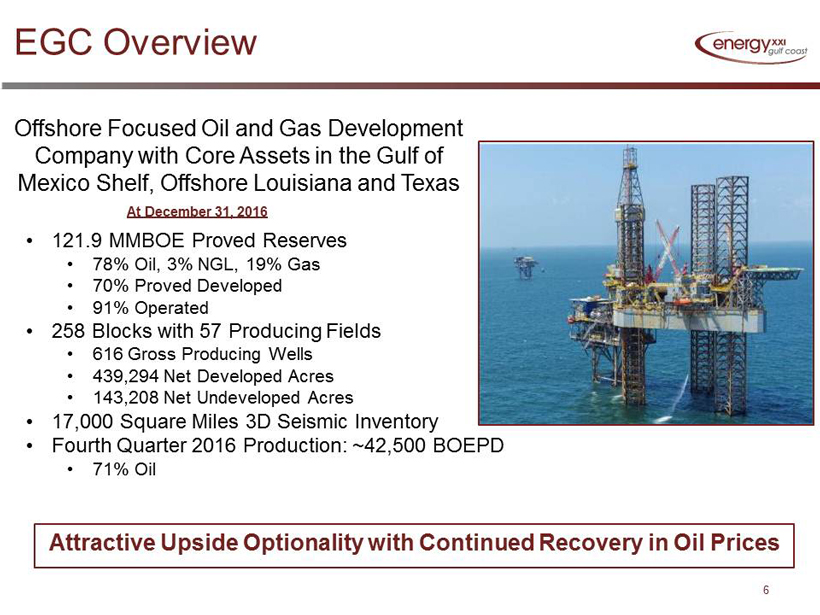
EGC Overview 6 Attractive Upside Optionality with Continued Recovery in Oil Prices Offshore Focused Oil and Gas Development Company with Core Assets in the Gulf of Mexico Shelf, Offshore Louisiana and Texas • 121.9 MMBOE Proved Reserves • 78% Oil, 3% NGL, 19% Gas • 70% Proved Developed • 91% Operated • 258 Blocks with 57 Producing Fields • 616 Gross Producing Wells • 439,294 Net Developed Acres • 143,208 Net Undeveloped Acres • 17,000 Square Miles 3D Seismic Inventory • Fourth Quarter 2016 Production: ~42,500 BOEPD • 71% Oil At December 31, 2016
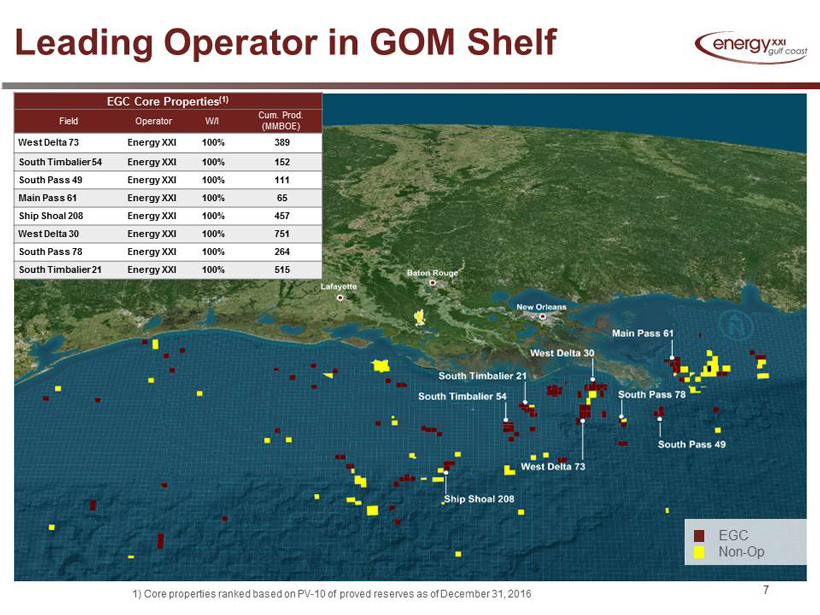
Leading Operator in GOM Shelf 7 EGC Core Properties (1) Field Operator W/I Cum. Prod. (MMBOE) West Delta 73 Energy XXI 100% 389 South Timbalier 54 Energy XXI 100% 152 South Pass 49 Energy XXI 100% 111 Main Pass 61 Energy XXI 100% 65 Ship Shoal 208 Energy XXI 100% 457 West Delta 30 Energy XXI 100% 751 South Pass 78 Energy XXI 100% 264 South Timbalier 21 Energy XXI 100% 515 EGC Non - Op 1) Core properties ranked based on PV - 10 of proved reserves as of December 31, 2016
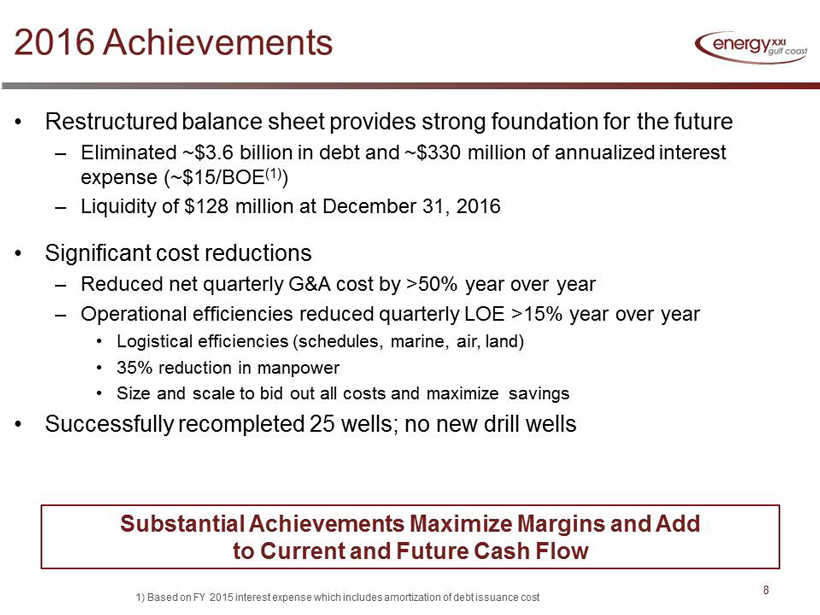
2016 Achievements 8 Substantial Achievements Maximize Margins and Add to Current and Future Cash Flow • Restructured balance sheet provides strong foundation for the future – Eliminated ~$3.6 billion in debt and ~$330 million of annualized interest expense (~$15/BOE (1) ) – Liquidity of $128 million at December 31, 2016 • Significant cost reductions – Reduced net quarterly G&A cost by >50% year over year – Operational efficiencies reduced quarterly LOE >15% year over year • Logistical efficiencies (schedules, marine, air, land) • 35% reduction in manpower • Size and scale to bid out all costs and maximize savings • Successfully recompleted 25 wells; no new drill wells 1) Based on FY 2015 interest expense which includes amortization of debt issuance cost
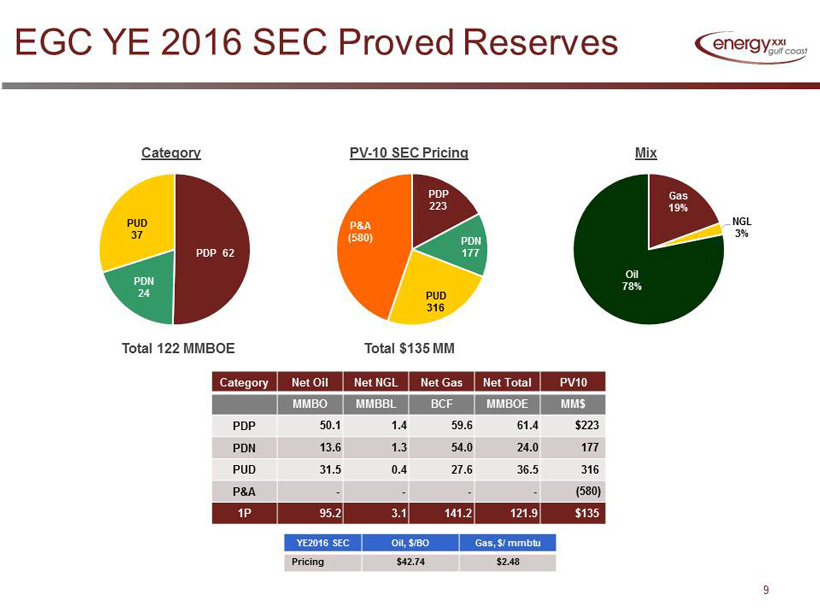
EGC YE 2016 SEC Proved Reserves 9 Category Net Oil Net NGL Net Gas Net Total PV10 MMBO MMBBL BCF MMBOE MM$ PDP 50.1 1.4 59.6 61.4 $223 PDN 13.6 1.3 54.0 24.0 177 PUD 31.5 0.4 27.6 36.5 316 P&A - - - - (580) 1P 95.2 3.1 141.2 121.9 $135 PDP 62 PDN 24 PUD 37 PDP 223 PDN 177 PUD 316 P&A (580) YE2016 SEC Oil, $/BO Gas, $/ mmbtu Pricing $42.74 $2.48 Gas 19% NGL 3% Oil 78% Total 122 MMBOE Total $135 MM PV - 10 SEC Pricing Category Mix
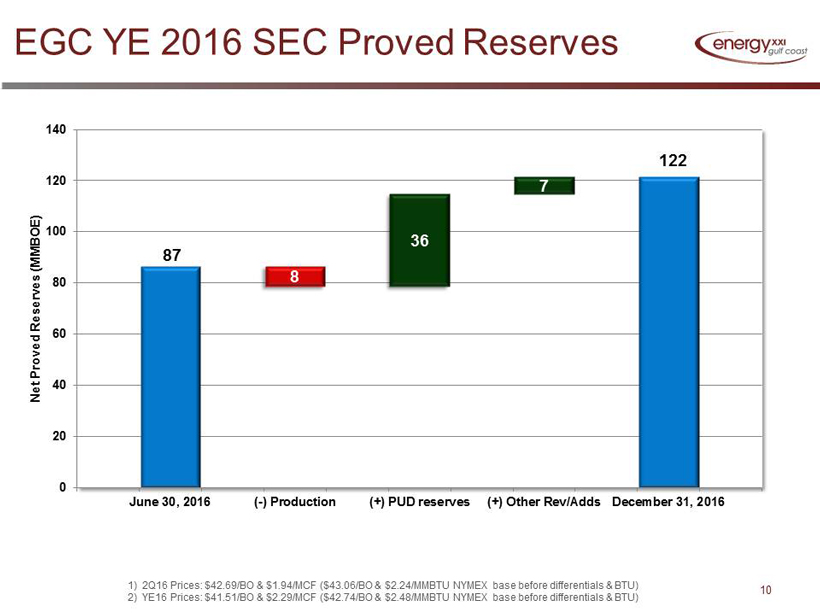
87 122 8 36 7 0 20 40 60 80 100 120 140 June 30, 2016 (-) Production (+) PUD reserves (+) Other Rev/Adds December 31, 2016 Net Proved Reserves (MMBOE) EGC YE 2016 SEC Proved Reserves 10 1) 2Q16 Prices: $42.69/BO & $1.94/MCF ($43.06/BO & $2.24/MMBTU NYMEX base before differentials & BTU) 2) YE16 Prices: $41.51/BO & $2.29/MCF ($42.74/BO & $2.48/MMBTU NYMEX base before differentials & BTU)
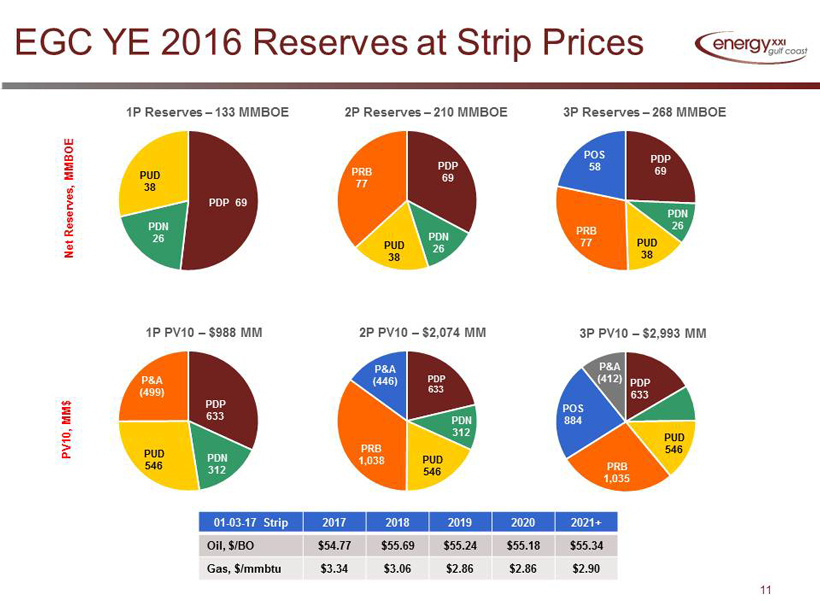
EGC YE 2016 Reserves at Strip Prices 11 PDP 69 PDN 26 PUD 38 1P Reserves – 133 MMBOE PDP 633 PDN 312 PUD 546 P&A (499) 1P PV10 – $988 MM Net Reserves, MMBOE PV10, MM$ PDP 69 PDN 26 PUD 38 PRB 77 2P Reserves – 210 MMBOE PDP 633 PDN 312 PUD 546 PRB 1,038 P&A (446) 2P PV10 – $2,074 MM PDP 69 PDN 26 PUD 38 PRB 77 POS 58 3P Reserves – 268 MMBOE PDP 633 PDN 312 PUD 546 PRB 1,035 POS 884 P&A (412) 3P PV10 – $2,993 MM 01 - 03 - 17 Strip 2017 2018 2019 2020 2021+ Oil, $/BO $54.77 $55.69 $55.24 $55.18 $55.34 Gas, $/ mmbtu $3.34 $3.06 $2.86 $2.86 $2.90
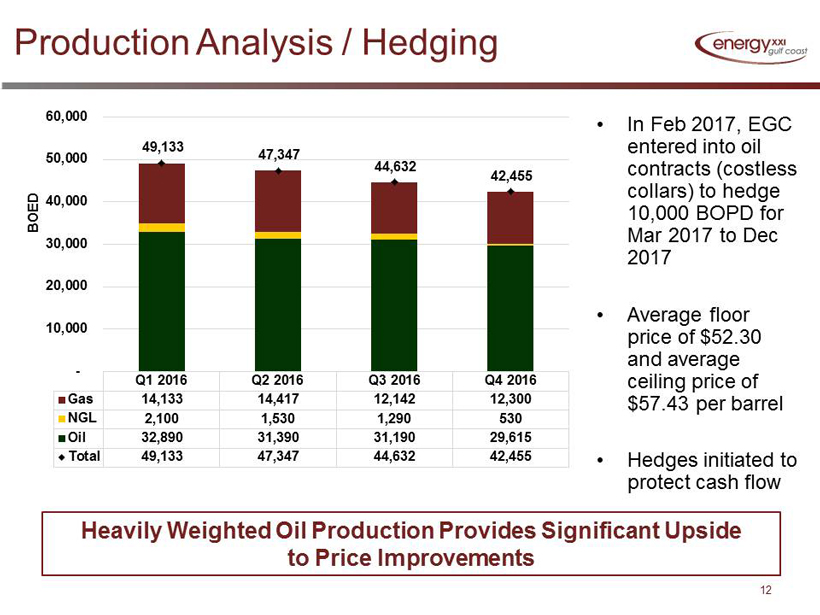
Production Analysis / Hedging 12 Actual BOED Heavily Weighted Oil Production Provides Significant Upside to Price Improvements Q1 2016 Q2 2016 Q3 2016 Q4 2016 Gas 14,133 14,417 12,142 12,300 NGL 2,100 1,530 1,290 530 Oil 32,890 31,390 31,190 29,615 Total 49,133 47,347 44,632 42,455 49,133 47,347 44,632 42,455 - 10,000 20,000 30,000 40,000 50,000 60,000 • In Feb 2017, EGC entered into oil contracts (costless collars) to hedge 10,000 BOPD for Mar 2017 to Dec 2017 • Average floor price of $52.30 and average ceiling price of $57.43 per barrel • Hedges initiated to protect cash flow
FINANCIAL REVIEW 13
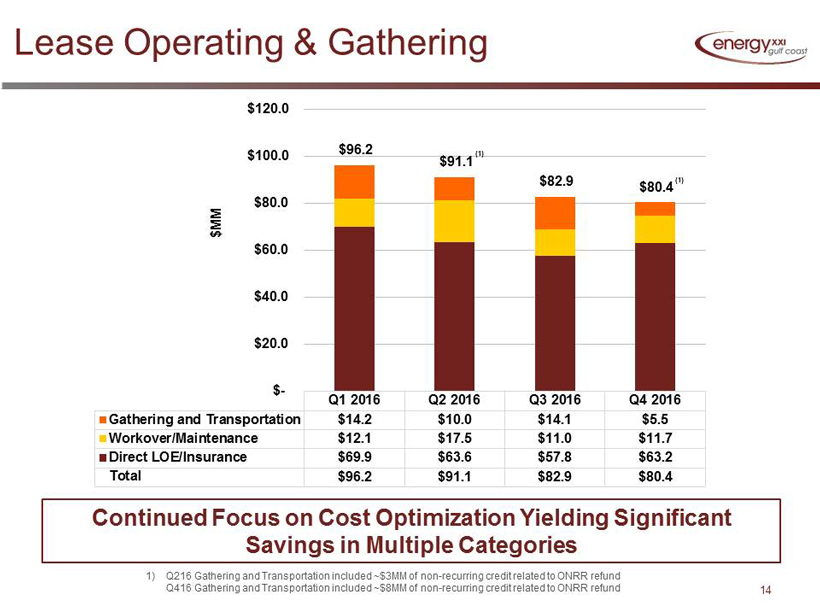
Lease Operating & Gathering 14 Q1 2016 Q2 2016 Q3 2016 Q4 2016 Gathering and Transportation $14.2 $10.0 $14.1 $5.5 Workover/Maintenance $12.1 $17.5 $11.0 $11.7 Direct LOE/Insurance $69.9 $63.6 $57.8 $63.2 Total $96.2 $91.1 $82.9 $80.4 $96.2 $91.1 $82.9 $80.4 $- $20.0 $40.0 $60.0 $80.0 $100.0 $120.0 $MM Continued Focus on Cost Optimization Yielding Significant Savings in Multiple Categories (1) 1) Q216 Gathering and Transportation included ~$3MM of non - recurring credit related to ONRR refund Q416 Gathering and Transportation included ~$8MM of non - recurring credit related to ONRR refund (1)
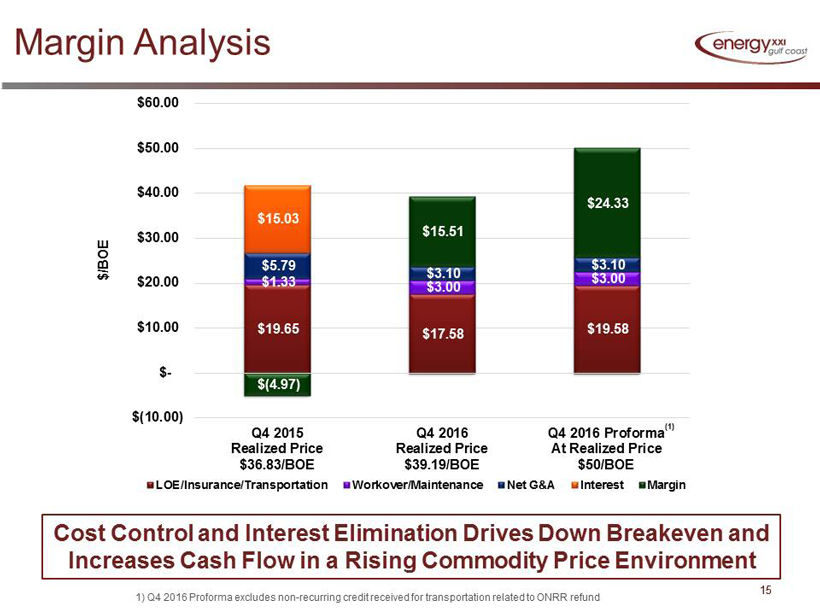
Margin Analysis 15 15 $/BOE $19.65 $17.58 $19.58 $1.33 $3.00 $3.00 $5.79 $3.10 $3.10 $15.03 $(4.97) $15.51 $24.33 $(10.00) $- $10.00 $20.00 $30.00 $40.00 $50.00 $60.00 Q4 2015 Realized Price $36.83/BOE Q4 2016 Realized Price $39.19/BOE Q4 2016 Proforma At Realized Price $50/BOE LOE/Insurance/Transportation Workover/Maintenance Net G&A Interest Margin Cost Control and Interest Elimination Drives Down Breakeven and Increases Cash Flow in a Rising Commodity Price Environment 1) Q4 2016 Proforma excludes non - recurring credit received for transportation related to ONRR refund (1)
BOEM and BSEE Update 16 • Excellent working relationship with BOEM and BSEE • Continue to operate under the terms and proposals of our Tailored Plan with the BOEM • EGC has bonded its sole properties, expired properties and properties without a major oil company in the chain of title Proactively Addressing New Federal P&A Funding Requirements
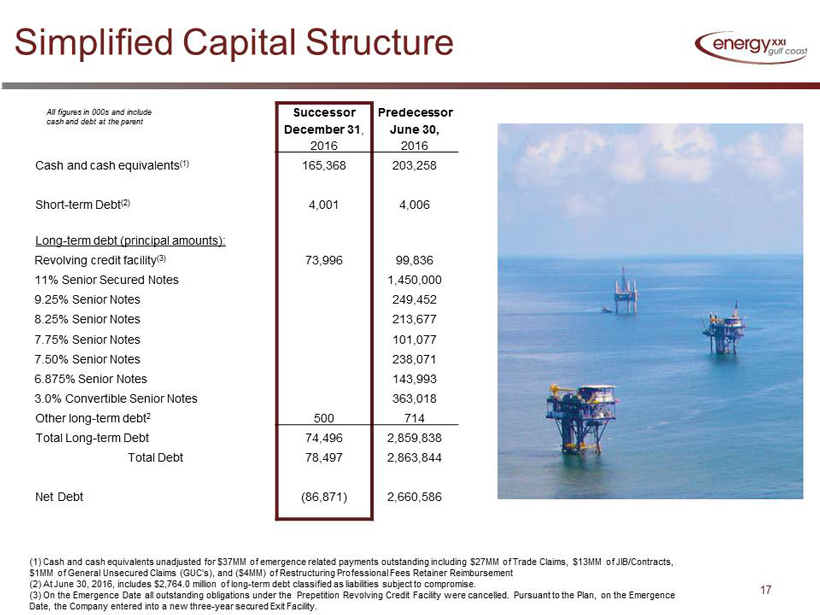
Simplified Capital Structure 17 Successor Predecessor December 31 , June 30, 2016 2016 Cash and cash equivalents (1) 165,368 203,258 Short - term Debt (2) 4,001 4,006 Long - term debt (principal amounts): Revolving credit facility (3) 73,996 99,836 11% Senior Secured Notes 1,450,000 9.25% Senior Notes 249,452 8.25% Senior Notes 213,677 7.75% Senior Notes 101,077 7.50% Senior Notes 238,071 6.875% Senior Notes 143,993 3.0% Convertible Senior Notes 363,018 Other long - term debt 2 500 714 Total Long - term Debt 74,496 2,859,838 Total Debt 78,497 2,863,844 Net Debt (86,871) 2,660,586 (1) Cash and cash equivalents unadjusted for $37MM of emergence related payments outstanding including $27MM of Trade Claims, $1 3MM of JIB/Contracts, $1MM of General Unsecured Claims (GUC’s), and ($4MM) of Restructuring Professional Fees Retainer Reimbursement (2) At June 30, 2016, includes $2,764.0 million of long - term debt classified as liabilities subject to compromise. (3) On the Emergence Date all outstanding obligations under the Prepetition Revolving Credit Facility were cancelled. Pursu ant to the Plan, on the Emergence Date, the Company entered into a new three - year secured Exit Facility. All figures in 000s and include cash and debt at the parent
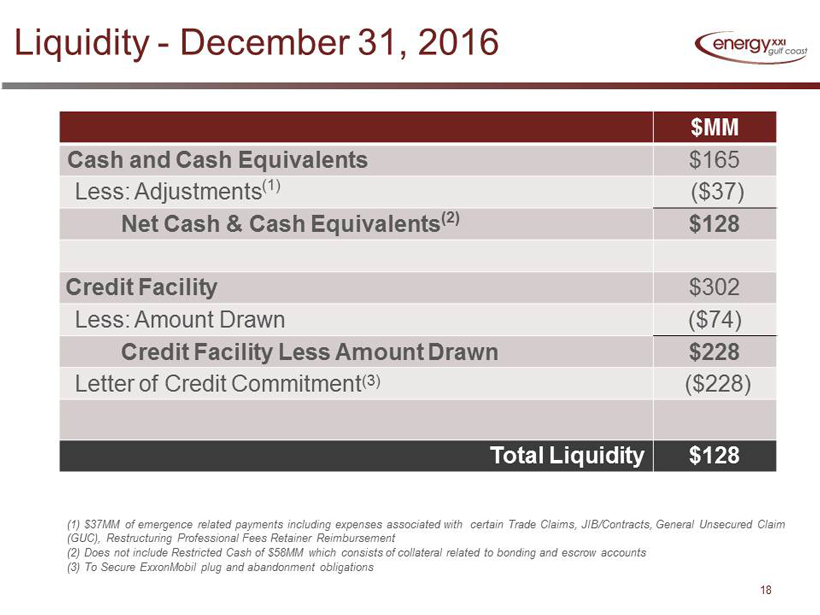
Liquidity - December 31, 2016 18 (1) $37MM of emergence related payments including expenses associated with certain Trade Claims, JIB/Contracts, General Unse cur ed Claim (GUC), Restructuring Professional Fees Retainer Reimbursement (2) Does not include Restricted Cash of $58MM which consists of collateral related to bonding and escrow accounts (3) To Secure ExxonMobil plug and abandonment obligations $MM Cash and Cash Equivalents $165 Less: Adjustments (1) ($37) Net Cash & Cash Equivalents (2) $128 Credit Facility $302 Less: Amount Drawn ($74) Credit Facility Less Amount Drawn $228 Letter of Credit Commitment (3) ($228) Total Liquidity $128
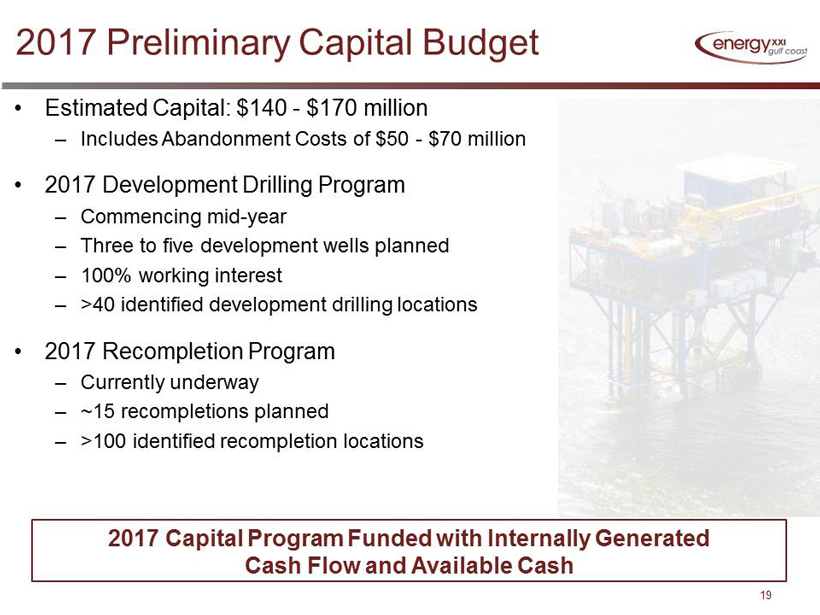
2017 Preliminary Capital Budget 2017 Capital Program Funded with Internally Generated Cash Flow and Available Cash 19 • Estimated Capital: $140 - $170 million – Includes Abandonment Costs of $50 - $70 million • 2017 Development Drilling Program – Commencing mid - year – Three to five development wells planned – 100% working interest – >40 identified development drilling locations • 2017 Recompletion Program – Currently underway – ~15 recompletions planned – >100 identified recompletion locations
Renewed Focus 20 Strong Asset Base with Renewed Focus and Rising Oil Prices Allows EGC to Capture Upside Value • New Management Team – Continued commitment to HSE excellence – Highly experienced technical and financial team – Focused on maximizing value for shareholders • Intense Financial Discipline – Continued reductions in LOE & G&A costs – Maintain liquidity by living within cash flow – Liquidity of $128 million at December 31, 2016 • Near - term Focus on Low - Risk Exploitation – Highly economic recompletions – Continued development from existing platforms • Proactively Addressing Plugging and Abandonment Responsibilities
OVERVIEW OF KEY FIELDS (1) 21 1) Amounts and field data as reported in Form10K for period ending 12/31/16
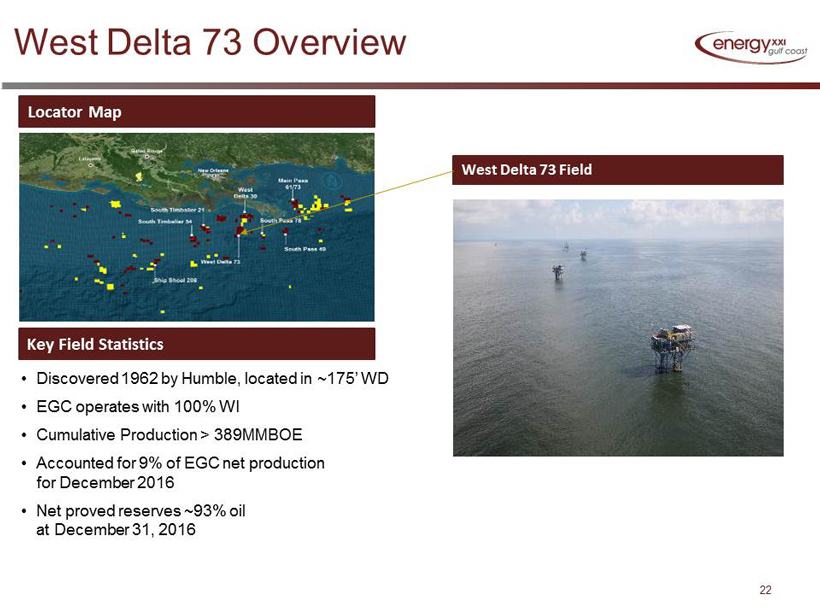
West Delta 73 Overview 22 • Discovered 1962 by Humble, located in ~175’ WD • EGC operates with 100% WI • Cumulative Production > 389MMBOE • Accounted for 9% of EGC net production for December 2016 • Net proved reserves ~93% oil at December 31, 2016 Locator Map Key Field Statistics West Delta 73 Field
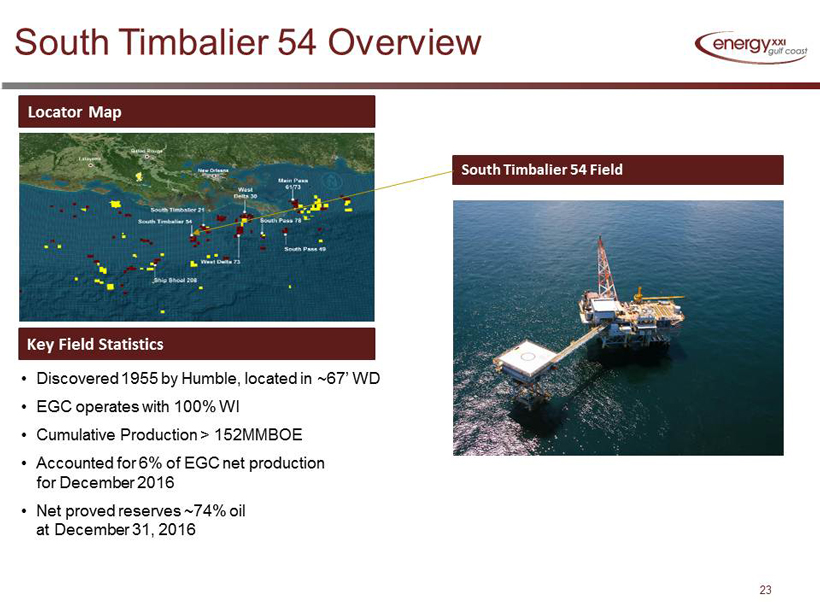
South Timbalier 54 Overview 23 • Discovered 1955 by Humble, located in ~67’ WD • EGC operates with 100% WI • Cumulative Production > 152MMBOE • Accounted for 6% of EGC net production for December 2016 • Net proved reserves ~74% oil at December 31, 2016 Locator Map Key Field Statistics South Timbalier 54 Field
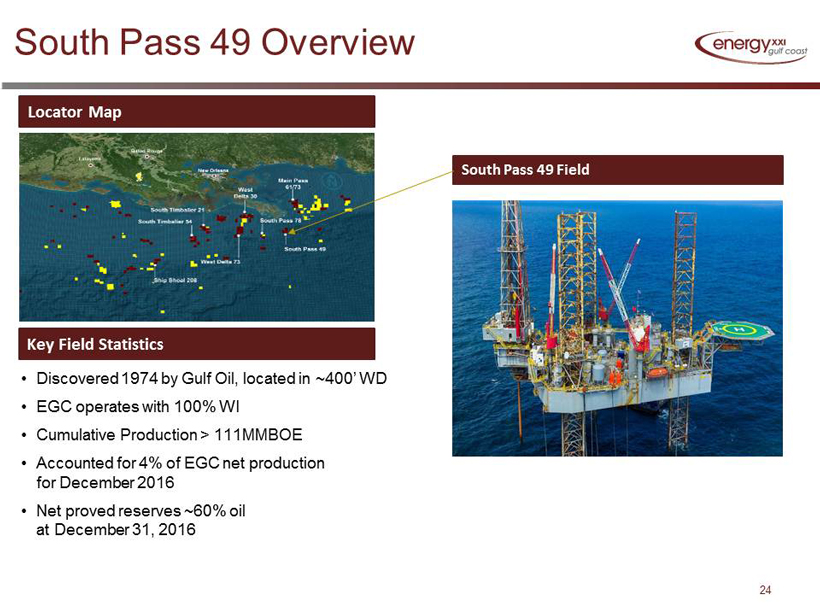
South Pass 49 Overview 24 • Discovered 1974 by Gulf Oil, located in ~400’ WD • EGC operates with 100% WI • Cumulative Production > 111MMBOE • Accounted for 4% of EGC net production for December 2016 • Net proved reserves ~ 60 % oil at December 31, 2016 Locator Map Key Field Statistics South Pass 49 Field
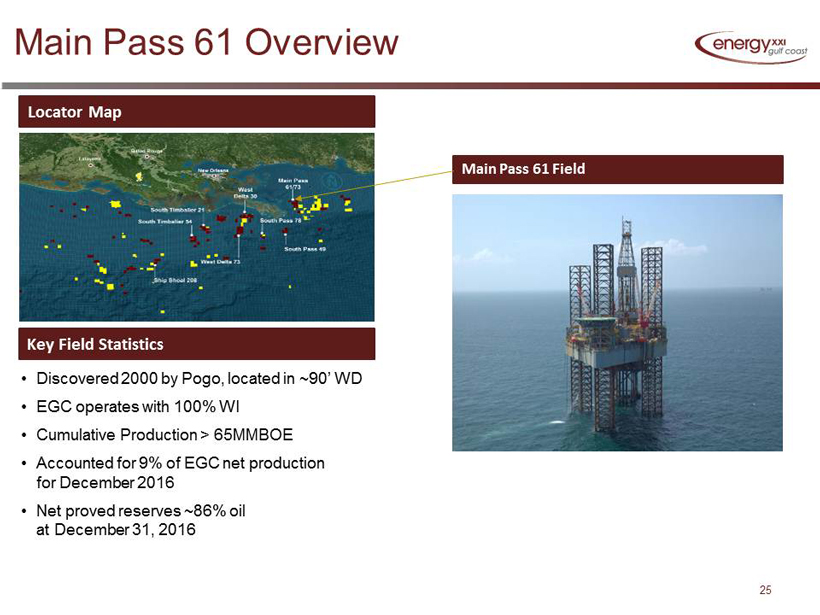
Main Pass 61 Overview 25 • Discovered 2000 by Pogo, located in ~90’ WD • EGC operates with 100% WI • Cumulative Production > 65MMBOE • Accounted for 9 % of EGC net production for December 2016 • Net proved reserves ~86% oil at December 31, 2016 Locator Map Key Field Statistics Main Pass 61 Field
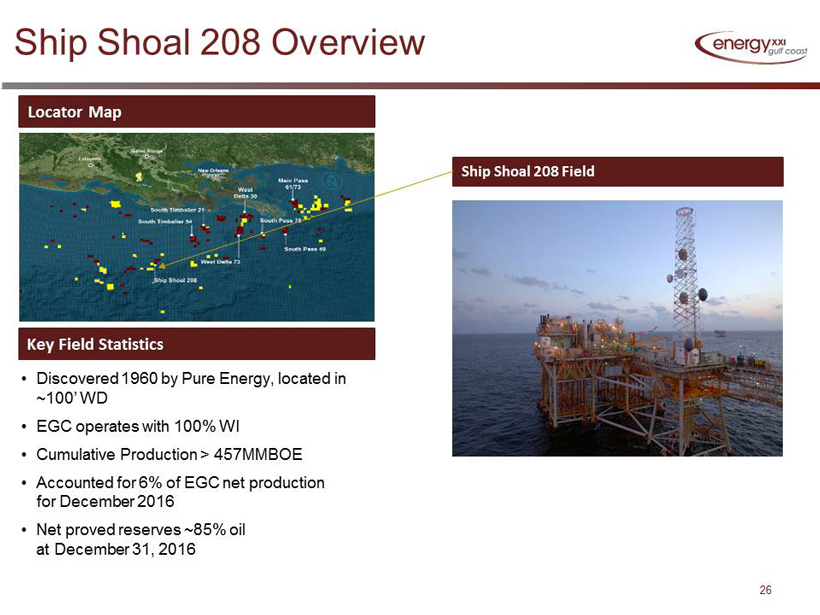
Ship Shoal 208 Overview 26 • Discovered 1960 by Pure Energy, located in ~100’ WD • EGC operates with 100% WI • Cumulative Production > 457MMBOE • Accounted for 6% of EGC net production for December 2016 • Net proved reserves ~85% oil at December 31, 2016 Locator Map Key Field Statistics Ship Shoal 208 Field
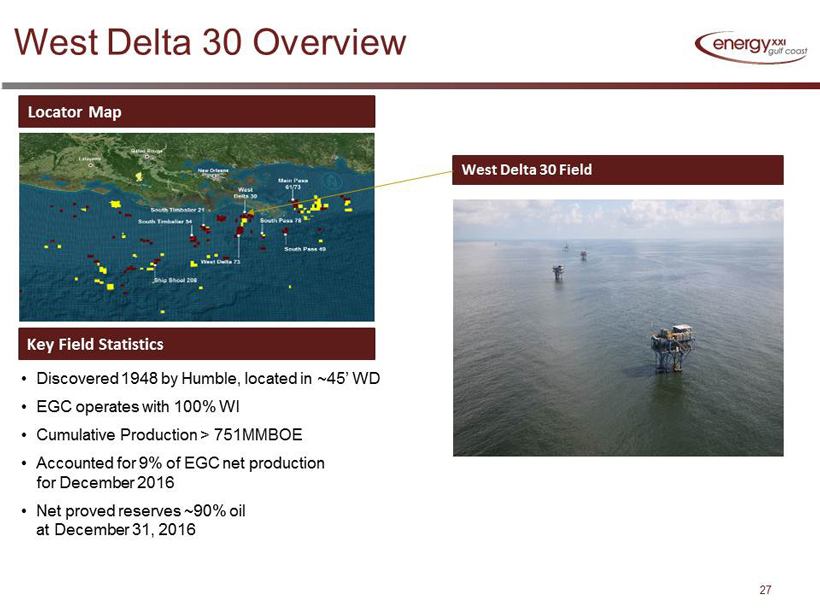
West Delta 30 Overview 27 • Discovered 1948 by Humble, located in ~45’ WD • EGC operates with 100% WI • Cumulative Production > 751MMBOE • Accounted for 9% of EGC net production for December 2016 • Net proved reserves ~90% oil at December 31, 2016 Locator Map Key Field Statistics West Delta 30 Field
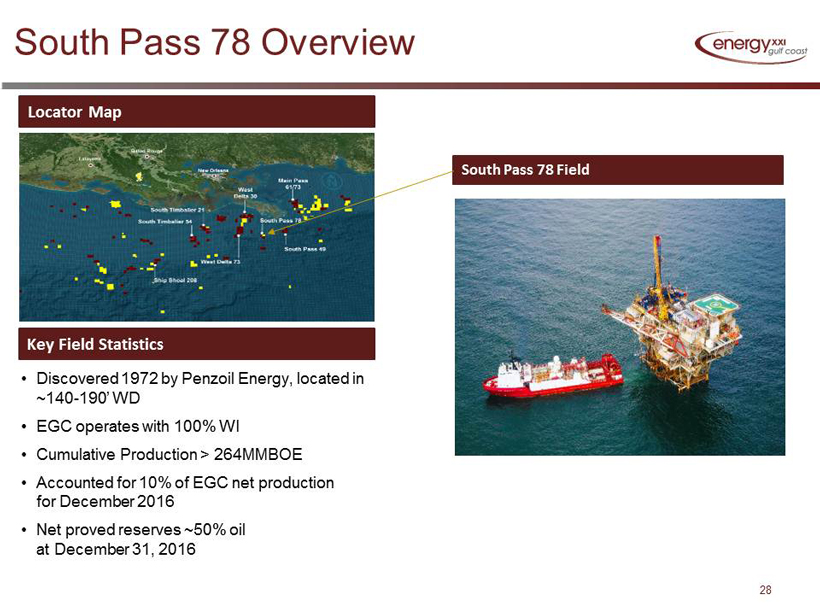
South Pass 78 Overview 28 • Discovered 1972 by Penzoil Energy, located in ~140 - 190’ WD • EGC operates with 100% WI • Cumulative Production > 264 MMBOE • Accounted for 10 % of EGC net production for December 2016 • Net proved reserves ~5 0 % oil at December 31, 2016 Locator Map Key Field Statistics South Pass 78 Field
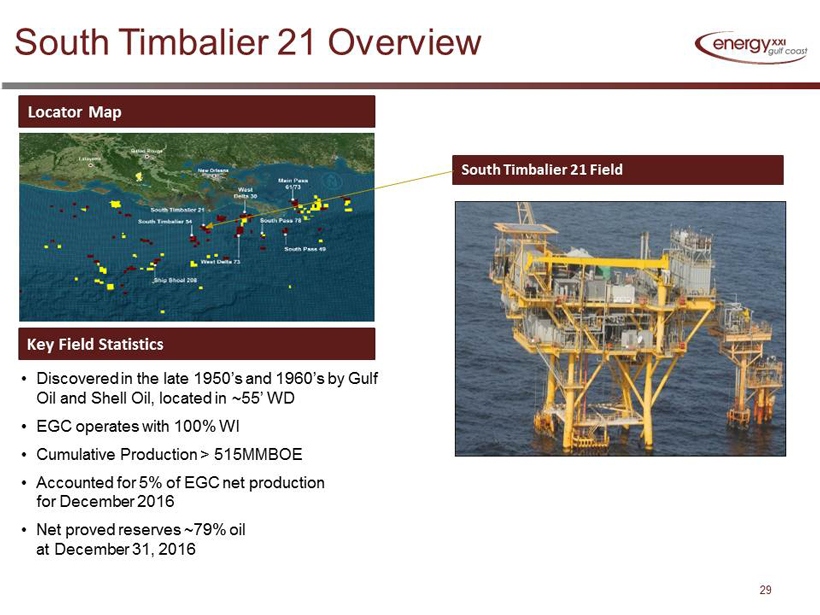
South Timbalier 21 Overview 29 • Discovered in the late 1950’s and 1960’s by Gulf Oil and Shell Oil, located in ~55’ WD • EGC operates with 100% WI • Cumulative Production > 515 MMBOE • Accounted for 5% of EGC net production for December 2016 • Net proved reserves ~79% oil at December 31, 2016 Locator Map Key Field Statistics South Timbalier 21 Field
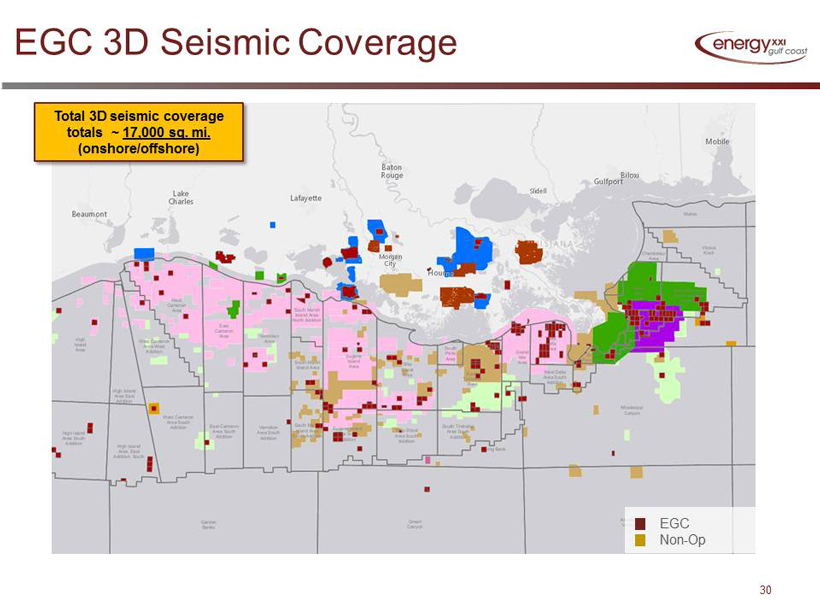
EGC 3D Seismic Coverage 30 Total 3D seismic coverage totals ~ 17,000 sq. mi. (onshore/offshore) EGC Non - Op

www.energyxxi.com apetrie@energyxxi.com 713 - 351 - 0617 Al Petrie – Investor + Media Relations Coordinator