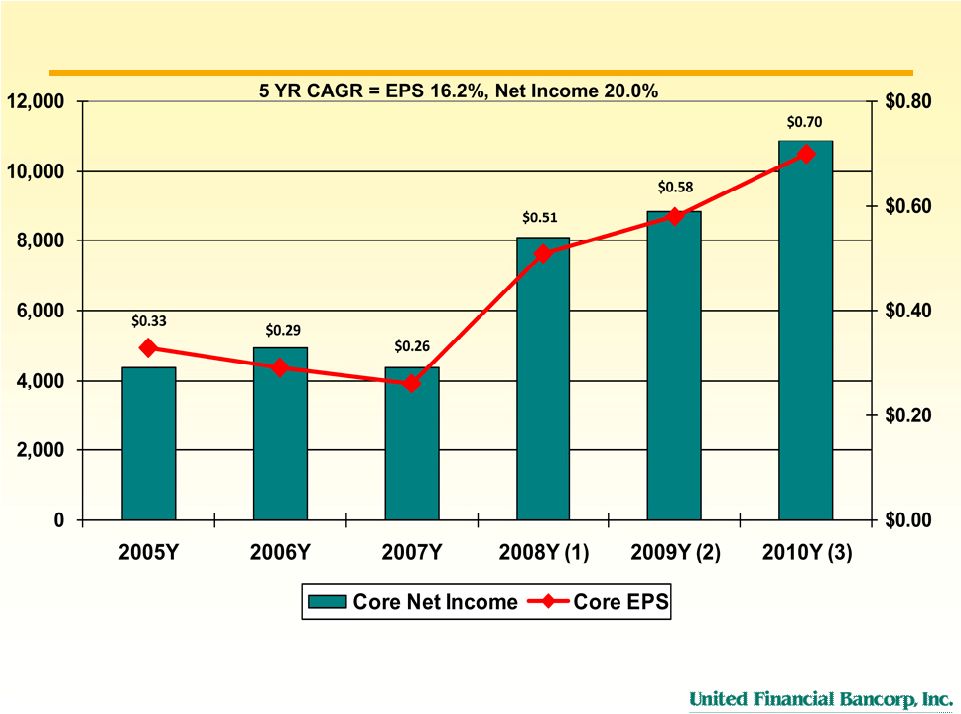
15 15 Financial Performance 2006 2007 2008 (1) 2009 (2) 2010 (3) Q1 2011 Q2 2011 Q3 2011 Earnings Data (in mm except EPS): Core Net Income 4.9 $ 4.4 $ 8.1 $ 8.6 $ 10.9 $ 2.4 $ 2.7 $ 3.1 $ Core Earnings Per Share $0.29 $0.26 $0.51 $0.57 $0.70 $0.16 $0.18 $0.20 Net Interest Income 27.6 $ 29.2 $ 39.8 $ 41.0 $ 52.9 $ 12.8 $ 13.4 $ 13.4 $ Provision for Loan Losses 1.0 1.4 1.8 3.0 2.3 0.8 0.7 0.8 Normalized Non-interest Income 5.4 5.7 6.6 8.7 8.7 2.1 2.2 2.4 Normalized Non-interest Expenses 24.0 26.0 30.7 33.5 42.7 10.9 11.4 11.0 Profitability Data and Ratios: Average Earning Assets (mm) $926 $1,001 $1,147 $1,208 $1,448 $1,494 $1,509 $1,504 Net Interest Margin 2.97% 2.91% 3.47% 3.39% 3.65% 3.42% 3.55% 3.56% Efficiency Ratio 72.95% 74.02% 66.16% 68.49% 69.55% 73.34% 73.09% 69.61% Asset Quality: Non-performing Assets/Total Assets 0.18% 0.25% 0.46% 1.16% 0.69% 0.62% 0.77% 0.85% Allowance for Loan Losses/ Total Loans (excluding purchased loans) 0.95% 0.94% 0.95% 1.07% 1.18% 1.17% 1.16% 1.14% Net Charge-offs/Total Average Loans 0.02% 0.12% 0.15% 0.23% 0.13% 0.12% 0.18% 0.23% Capital: Tangible Equity/Tangible Assets 13.64% 20.95% 18.03% 14.20% 13.60% 13.51% 13.66% 13.63% Tangible Book Value Per Share 8.01 $ 12.73 $ 13.01 $ 12.93 $ 13.32 $ 13.35 $ 13.58 $ 13.79 $ Dividends Per Share 0.20 $ 0.24 $ 0.27 $ 0.28 $ 0.30 $ 0.08 $ 0.08 $ 0.09 $ Period End Stock Price 13.80 $ 11.10 $ 15.14 $ 13.11 $ 15.27 $ 16.51 $ 15.43 $ 13.69 $ (1) Reported net income was $7.3 million, or $0.44 per diluted share. Core net income and core EPS exclude $1.4 million OTTI charge and related tax effect of $550,000. Reported non- interest income of $5.2 million excludes $1.4 million OTTI charge. (2) Reported net income was $5.8 million, or $0.38 per diluted share. Core net income and core EPS exclude $2.5 million (after-tax) in acquisition related expenses and $318,000 (after tax) special FDIC insurance assessment. Reported non-interest expense was $36.9 million. Normalized non-interest expenses exclude $2.9 million in acquisition related expenses and $537,000 in expenses related to special FDIC insurance assessment. (3) Reported net income was $10.0 million or $0.65 per diluted share. Core net income and core EPS exclude $819,000 (after-tax) in acquisition related expenses. Reported non-interest expense was 43.8 million. Normalized non-interest expenses exclude $1.1 million in acquisition related expenses . |