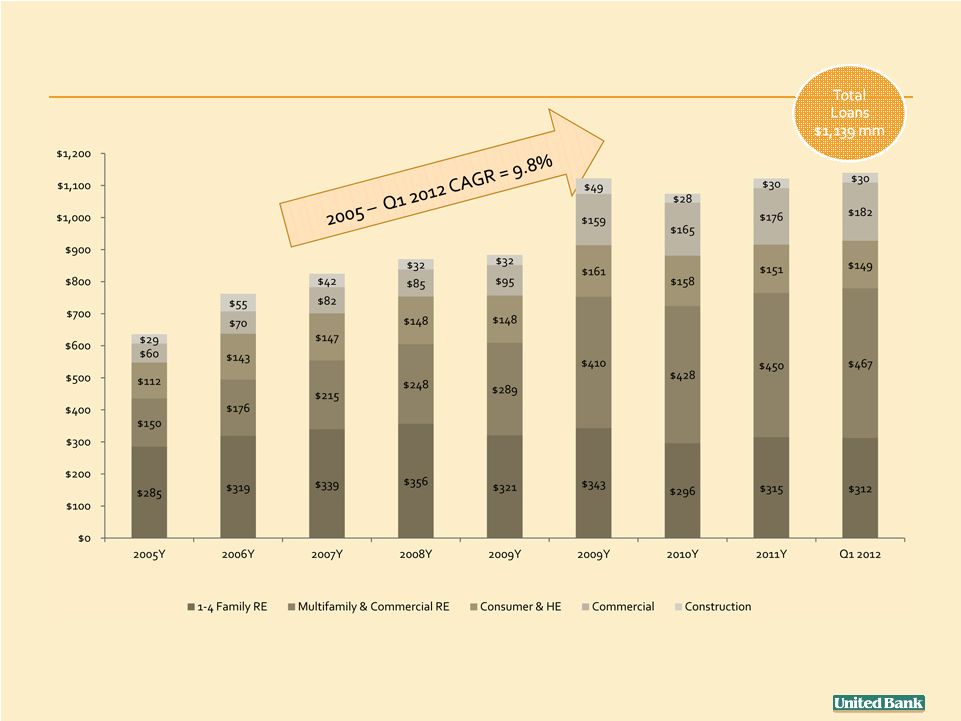
Reconciliation of GAAP and Non-GAAP Results for the Years 2006- Q1 2012 33 March 31 ($ in thousands) 2006 2007 2008 2009 2010 2011 2012 Total Loans (Gross) 762,113 824,695 870,276 1,122,241 1,074,111 1,121,879 1,139,344 CNB Acquired Loans - - - (242,930) (209,785) (148,925) (136,393) Purchased Loans (GE Loans) - - - (22,655) (21,448) (19,066) (18,284) Total Loans (Non-GAAP) 762,113 824,695 870,276 856,656 842,878 953,888 984,667 Total Equity 137,711 226,120 227,714 225,246 222,576 227,361 227,248 Goodwill - - - (7,844) (8,192) (8,192) (8,192) Other Intangible Assets - - - (927) (976) (752) (712) Tangible Equity (Non-GAAP) 137,711 226,120 227,714 216,475 213,408 218,417 218,344 Total Assets 1,009,433 1,079,281 1,263,134 1,541,040 1,584,877 1,623,522 1,660,198 Goodwill - - - (7,844) (8,192) (8,192) (8,192) Other Intangible Assets - - - (927) (976) (752) (712) Tangible Assets (Non-GAAP) 1,009,433 1,079,281 1,263,134 1,532,269 1,576,685 1,614,578 1,651,294 Asset Quality: Allowance for Loan Losses/Total Loans 0.95% 0.94% 0.95% 0.82% 0.93% 0.99% 0.99% Allowance for Loan Losses/Total Loans excl. Purchased Loans 0.95% 0.94% 0.95% 1.07% 1.18% 1.17% 1.15% Capital: Total Equity/Total Assets 13.65% 20.95% 18.03% 14.62% 14.04% 14.00% 13.69% Tangible Equity/Tangible Assets 13.65% 20.95% 18.03% 14.13% 13.54% 13.53% 13.22% Book Value Per Share 8.03 $ 12.73 $ 13.01 $ 13.38 $ 13.82 $ 14.47 $ 14.57 $ Tangible Book Value Per Share 8.03 $ 12.73 $ 13.01 $ 12.91 $ 13.31 $ 13.90 $ 14.00 $ At or For the Years Ended December 31, The following table presents reconciliations of the company's GAAP and Non-GAAP (Normalized) results at and for the years ended December 31, 2006, 2007, 2008, 2009, 2010, 2011 and March 31, 2012 |