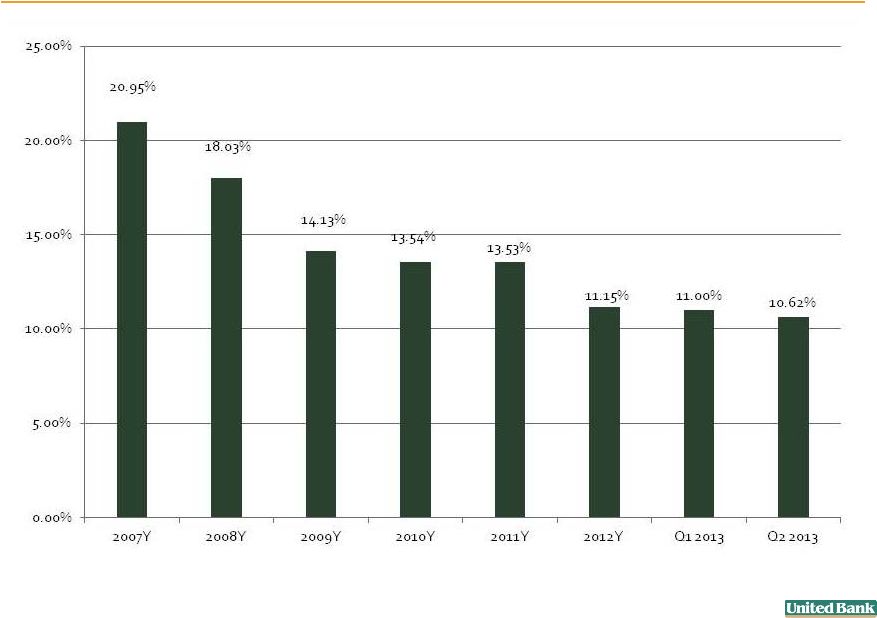
Reconciliation of GAAP and Non-GAAP Results 24 Mar. 31 Jun. 30 Sep. 30 Dec. 31 Mar. 31 Jun. 30 ($ in thousands) 2012 2012 2012 2012 2013 2013 Total Loans (Gross) 1,139,344 $ 1,162,356 $ 1,218,007 $ 1,816,076 $ 1,839,331 $ 1,860,760 $ Acquired Loans (136,393) (126,394) (118,611) (659,614) (611,250) (583,553) Purchased Loans (GE Loans) (18,284) (6,443) (6,348) (5,021) (4,913) (4,837) Total Loans (Non-GAAP) 984,667 1,029,519 1,093,048 1,151,441 1,223,168 1,272,370 Total Equity 227,248 228,129 230,163 307,189 306,355 300,319 Goodwill (8,192) (8,192) (8,192) (39,852) (39,585) (40,663) Other Intangible Assets (712) (741) (699) (4,514) (4,387) (4,304) Tangible Equity (Non-GAAP) 218,344 219,196 221,272 262,823 262,383 255,352 Total Assets 1,660,198 1,653,626 1,683,684 2,402,303 2,429,201 2,448,350 Goodwill (8,192) (8,192) (8,192) (39,852) (39,585) (40,663) Other Intangible Assets (712) (741) (699) (4,514) (4,387) (4,304) Tangible Assets (Non-GAAP) 1,651,294 1,644,693 1,674,793 2,357,937 2,385,229 2,403,383 Asset Quality: Allowance for Loan Losses/Total Loans 0.99% 1.01% 1.03% 0.67% 0.69% 0.70% Allowance for Loan Losses/Total Loans excl. Purchased Loans 1.15% 1.14% 1.15% 1.05% 1.04% 1.03% Capital: Total Equity/Total Assets 13.69% 13.80% 13.67% 12.79% 12.61% 12.27% Tangible Equity/Tangible Assets 13.22% 13.33% 13.21% 11.15% 11.00% 10.62% Book Value Per Share 14.57 $ 14.70 $ 14.88 $ 15.24 $ 15.36 $ 15.28 $ Tangible Book Value Per Share 14.00 $ 14.12 $ 14.31 $ 13.04 $ 13.16 $ 13.00 $ At or For the Quarters Ended |