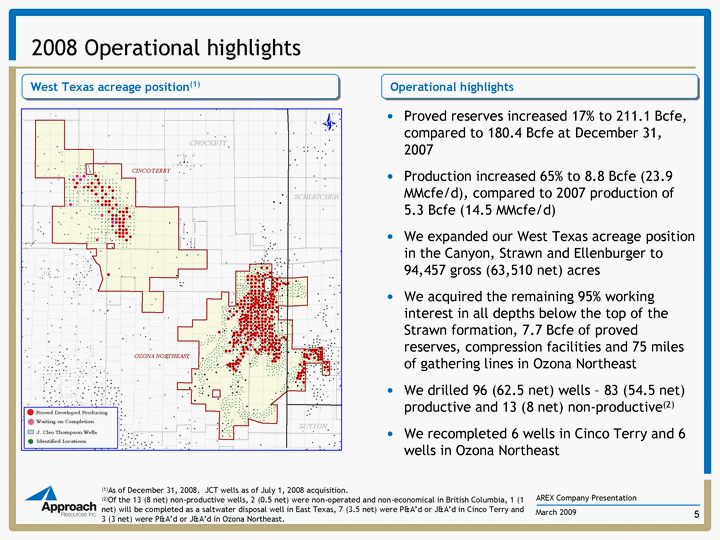
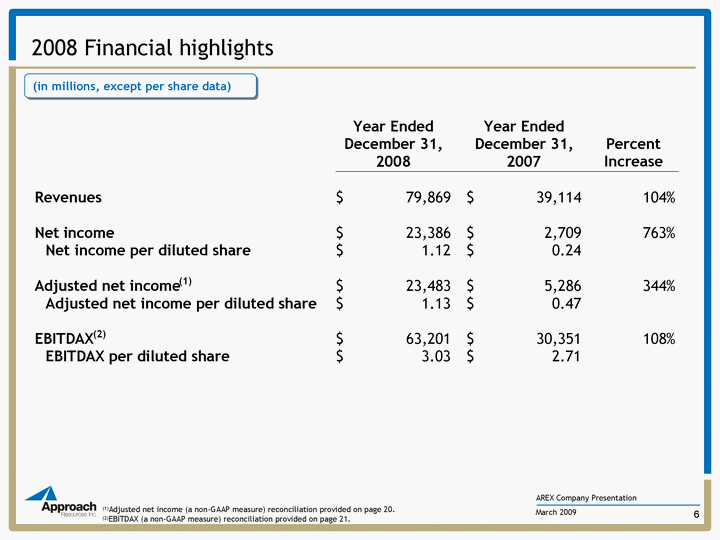
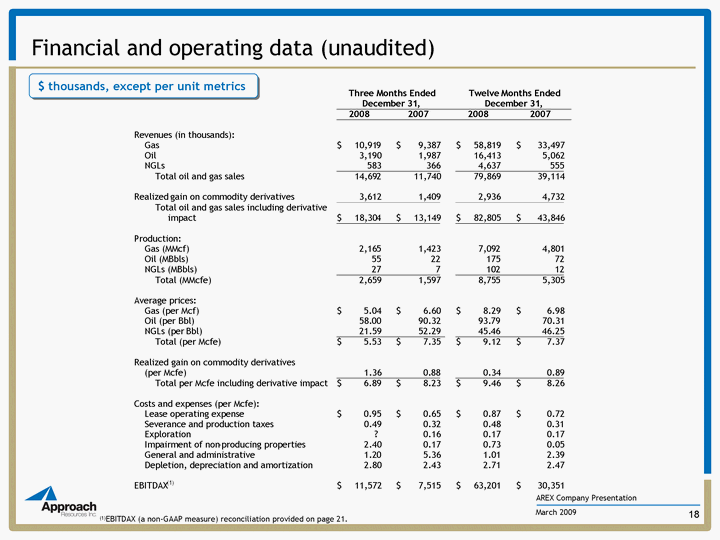
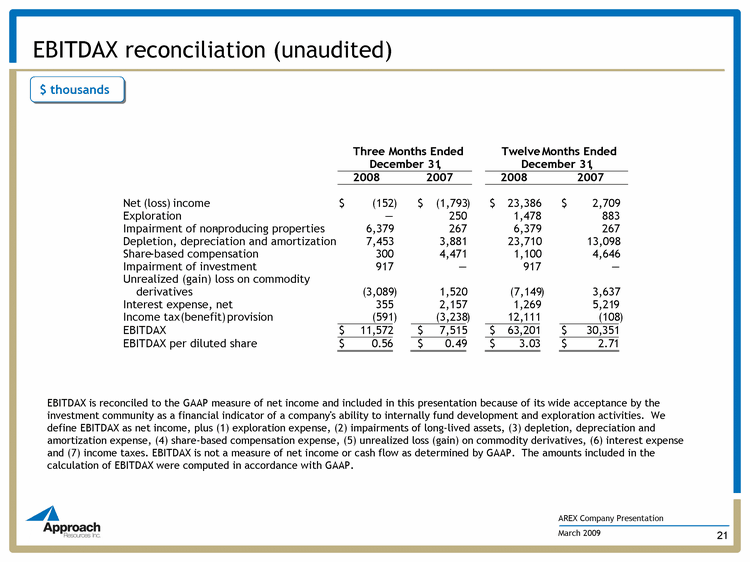
| Financial and operating data (unaudited) $ thousands, except per unit metrics (1)EBITDAX (a non-GAAP measure) reconciliation provided on page 21. AREX Company Presentation March 2009 Three Months Ended December 31 , Twelve Months Ended December 31 , 2008 2007 2008 2007 Revenues (in thousands): Gas $ 10,91 9 $ 9,387 $ 58,819 $ 33,497 Oil 3,190 1,987 16,413 5,062 NGLs 583 366 4,637 555 Total oil and gas sales 14,69 2 11,740 79,869 39,114 Realized gain on commodity derivatives 3,612 1,409 2,936 4,732 Total oil and gas sales including derivative impact $ 18,30 4 $ 13,149 $ 82,805 $ 43,846 Production: Gas (MMcf) 2,16 5 1,423 7,09 2 4,801 Oil (MBbls) 55 22 175 72 NGLs (MBbls) 2 7 7 10 2 12 Total (MMcfe) 2,659 1,597 8,75 5 5,305 Average prices: Gas (per Mcf) $ 5.04 $ 6.60 $ 8.29 $ 6.98 Oil (per Bbl) 58. 00 90.32 93. 7 9 70.31 NGLs (per Bbl) 21.59 52.29 45. 4 6 46.25 Total (per Mcfe) $ 5.53 $ 7.35 $ 9.12 $ 7.37 Realized gain on commodity derivatives (per Mcfe) 1.36 0. 8 8 0.34 0.89 Total per Mcfe including derivative impact $ 6.89 $ 8.23 $ 9.46 $ 8.26 Costs and expenses (per Mcfe): Lease operating expense $ 0.95 $ 0.65 $ 0.87 $ 0.72 Severance and production taxes 0.49 0.32 0.48 0 ..31 Exploration ? 0.16 0.17 0.17 Impairment of non - - producing properties 2.40 0.17 0.73 0.05 General and administrative 1.2 0 5.36 1.01 2.39 Depletion, depreciation and amortization 2.80 2.43 2.71 2.47 EBITDAX (1) $ 11,572 $ 7,515 $ 63,201 $ 30,351 |
