 Approach Resources Inc. Investor Presentation JANUARY 12, 2012 Exhibit 99.1 |
 | 2 | APPROACH RESOURCES Forward-Looking Statements Cautionary Statements Regarding Oil & Gas Quantities This presentation contains forward-looking statements within the meaning of Section 27A of the Securities Act of 1933 and Section 21E of the Securities Exchange Act of 1934. All statements, other than statements of historical facts, included in this presentation that address activities, events or developments that the Company expects, believes or anticipates will or may occur in the future are forward-looking statements. Without limiting the generality of the foregoing, forward-looking statements contained in this presentation specifically include the expectations of management regarding plans, strategies, objectives, anticipated financial and operating results of the Company, including as to the Company’s Wolffork shale resource play, estimated oil and gas in place and recoverability of the oil and gas, estimated reserves and drilling locations, capital expenditures, typical well results and well profiles, and production and operating expenses guidance included in the presentation. These statements are based on certain assumptions made by the Company based on management's experience and technical analyses, current conditions, anticipated future developments and other factors believed to be appropriate and believed to be reasonable by management. When used in this presentation, the words “will,” “potential,” “believe,” “intend,” “expect,” “may,” “should,” “anticipate,” “could,” “estimate,” “plan,” “predict,” “project,” “target,” “profile,” “model” or their negatives, other similar expressions or the statements that include those words, are intended to identify forward-looking statements, although not all forward-looking statements contain such identifying words. Such statements are subject to a number of assumptions, risks and uncertainties, many of which are beyond the control of the Company, which may cause actual results to differ materially from those implied or expressed by the forward-looking statements. In particular, careful consideration should be given to the cautionary statements and risk factors described in the Company's Annual Report on Form 10-K for the year ended December 31, 2010, and the Company’s Quarterly Report on Form 10-Q for the quarterly period ended September 30, 2011. Any forward-looking statement speaks only as of the date on which such statement is made and the Company undertakes no obligation to correct or update any forward-looking statement, whether as a result of new information, future events or otherwise, except as required by applicable law. The Securities and Exchange Commission (“SEC”) permits oil and gas companies, in their filings with the SEC, to disclose only proved, probable and possible reserves that meet the SEC’s definitions for such terms, and price and cost sensitivities for such reserves, and prohibits disclosure of resources that do not constitute such reserves. The Company uses the terms “estimated ultimate recovery” or “EUR,” reserve or resource “potential,” “upside,” “oil and gas in place” or “OGIP,” “OIP” or “GIP,” and other descriptions of volumes of reserves potentially recoverable through additional drilling or recovery techniques that the SEC’s rules may prohibit the Company from including in filings with the SEC. These estimates are by their nature more speculative than estimates of proved, probable and possible reserves and accordingly are subject to substantially greater risk of being actually realized by the Company. EUR estimates, potential drilling locations, resource potential and OGIP estimates have not been risked by the Company. Actual locations drilled and quantities that may be ultimately recovered from the Company’s interest may differ substantially from the Company’s estimates. There is no commitment by the Company to drill all of the drilling locations that have been attributed these quantities. Factors affecting ultimate recovery include the scope of the Company’s ongoing drilling program, which will be directly affected by the availability of capital, drilling and production costs, availability of drilling and completion services and equipment, drilling results, lease expirations, regulatory approval and actual drilling results, including geological and mechanical factors affecting recovery rates. Estimates of unproved reserves, type/decline curves, per well EUR, OGIP and resource potential may change significantly as development of the Company’s oil and gas assets provides additional data. Type/decline curves, estimated EURs, typical well-related oil and gas in place, recovery factors and well costs represent Company estimates based on evaluation of petrophysical analysis, core data and well logs, well performance from limited drilling and recompletion results and seismic data, and have not been reviewed by independent engineers. These are presented as hypothetical recoveries if assumptions and estimates regarding recoverable hydrocarbons, OGIP, recovery factors and costs prove correct. The Company has very limited production experience with these projects, and accordingly, such estimates may change significantly as results from more wells are evaluated. Estimates of resource potential, EURs and OGIP do not constitute reserves, but constitute estimates of contingent resources which the SEC has determined are too speculative to include in SEC filings. Unless otherwise noted, IRR estimates assume NYMEX forward-curve oil and gas pricing and Company-generated EUR and decline curve estimates based on Company drilling and completion cost estimates that do not include land, seismic or G&A costs. |
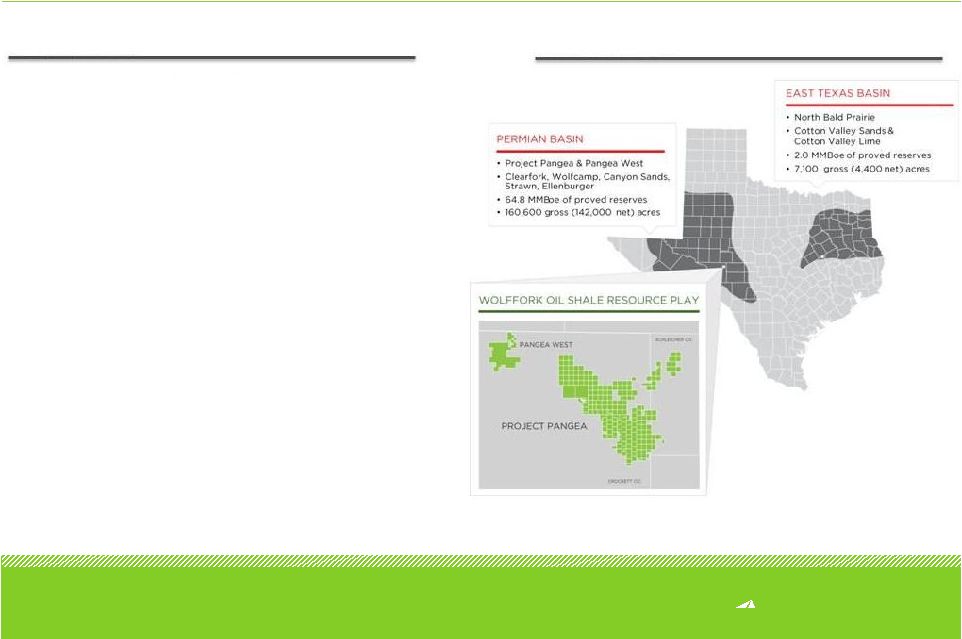 | 3 | APPROACH RESOURCES Company Overview Notes: Proved reserves and acreage as of 6/30/2011 and 9/30/2011, respectively. All Boe and Mcfe calculations are based on a 6 to 1 conversion ratio. Enterprise value is equal to market capitalization using the closing share price of $29.41 per share on 12/30/2011, plus net debt as of 9/30/2011. See liquidity calculation in appendix. AREX OVERVIEW ASSET OVERVIEW • Enterprise value $958 MM • High quality reserve base • Permian core operating area 160,600 gross (142,000 net) acres 500+ MMBoe gross, unrisked resource potential Extensive inventory of drilling and recompletion opportunities • Strong balance sheet to execute plan Borrowing base increased 30% to $260 MM from $200 MM 66.8 MMBoe proved reserves 97% Permian Basin 55% Oil & NGLs Pro forma liquidity of $260 MM at 9/30/2011 |
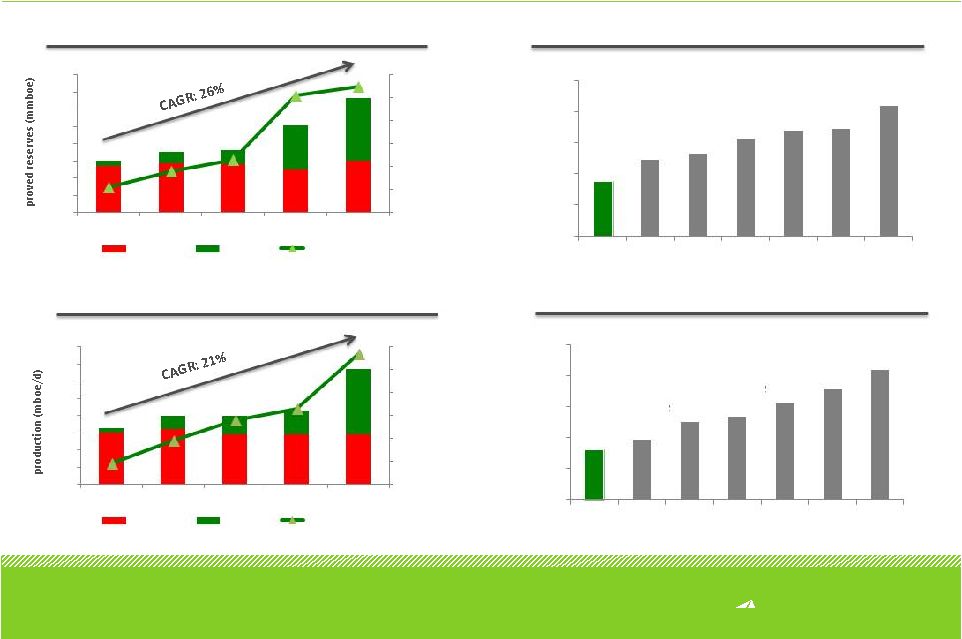 | 4 | APPROACH RESOURCES Notes: Oil weighted peers include BRY, CXO, KOG, NOG, OAS, SD. Data based on SEC filings and J.S. Herold data. Lifting costs defined as lease operating expense plus taxes other than income and gathering and transportation expense. See F&D cost reconciliation page in appendix for reconciliation of 3-year F&D costs. Historical Results and Cost Structure RESERVE GROWTH 3-YEAR AVERAGE F&D COSTS ($/BOE) PRODUCTION GROWTH 3Q’11 LIFTING COSTS ($/BOE) $8.78 $12.21 $13.29 $15.60 $16.95 $17.22 $20.96 AREX Peer 1 Peer 2 Peer 3 Peer 4 Peer 5 Peer 6 $0 $5 $10 $15 $20 $25 $8.14 $9.73 $12.60 $13.32 $15.69 $17.88 $20.95 $0 $5 $10 $15 $20 $25 AREX Peer 1 Peer 2 Peer 3 Peer 4 Peer 5 Peer 6 0% 10% 20% 30% 40% 50% 60% 2007 2008 2009 2010 9/30/2011 0% 10% 20% 30% 40% 50% 60% 2007 2008 2009 2010 6/30/2011 natural gas oil & ngls percent liquids natural gas oil & ngls percent liquids 0 10 20 30 40 50 60 70 80 0.0 1.0 2.0 3.0 4.0 5.0 6.0 7.0 8.0 |
 | 5 | APPROACH RESOURCES • 46.4 MMBoe proved reserves • 4.5 MBoe/d daily production • 98,000 net acres in Permian Basin THEN…NOVEMBER 2010 NOW…2011 ACCOMPLISHMENTS • 66.8 MMBoe proved reserves (+44% YoY) • 6.7 MBoe/d daily production (+46% YoY) • 142,000 net acres in Permian Basin (+45% YoY) • 50% of proved reserves were liquids • 34% of production were liquids • 55% of proved reserves are liquids • 57% of production is liquids • 3 recompletions and 1 vertical well commingled in Wolffork oil shale resource play • 11 recompletions and 10 vertical wells completed through 10/30/11 • 7 horizontal Wolfcamp wells completed with 3 recent IPs ranging 798 – 1,044 Boe/d • Approach’s early view on the play has been validated by the industry • $150 MM borrowing base • $173 MM pro forma liquidity • Q3 2010 EBITDAX of $12 MM • $260 MM borrowing base • $260 MM pro forma liquidity • Q3 2011 EBITDAX of $22 MM (+83% YoY) Note: See EBITDAX reconciliation and liquidity calculation in appendix. 2011 – A Transformational Year for AREX Growth Reserves / production mix Financial strength Derisking Wolffork play |
 APPROACH RESOURCES Wolffork Oil Shale Resource Play PLAY IDENTIFICATION |
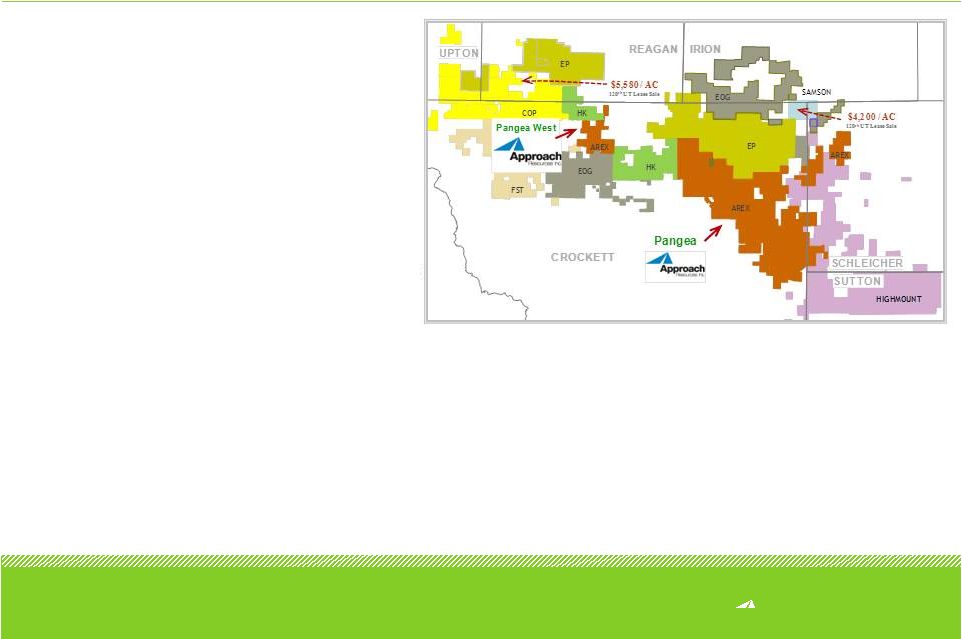
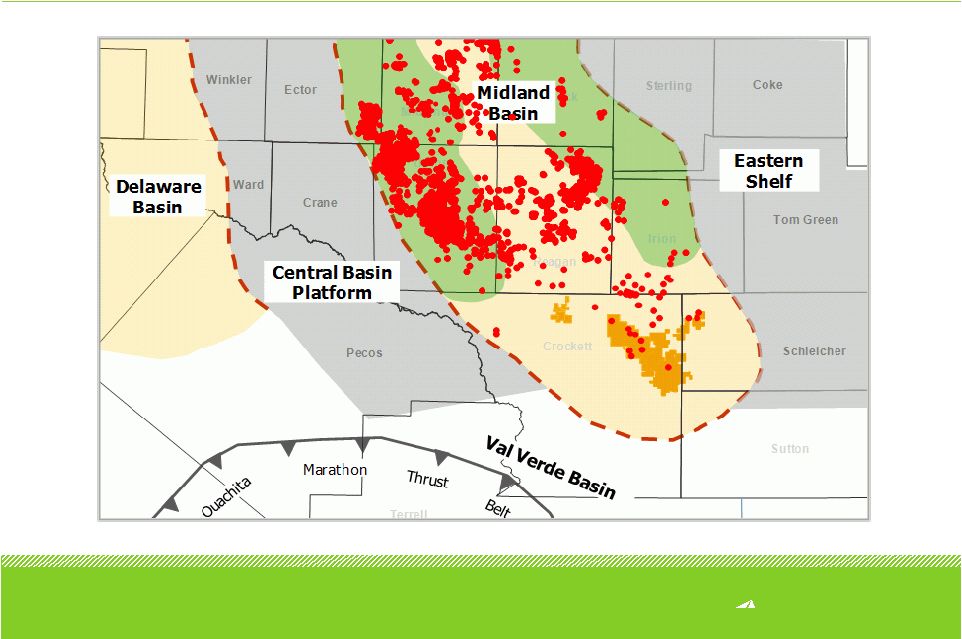 | 7 | APPROACH RESOURCES AREX Acreage Position – Favorably Located in the Midland Basin |
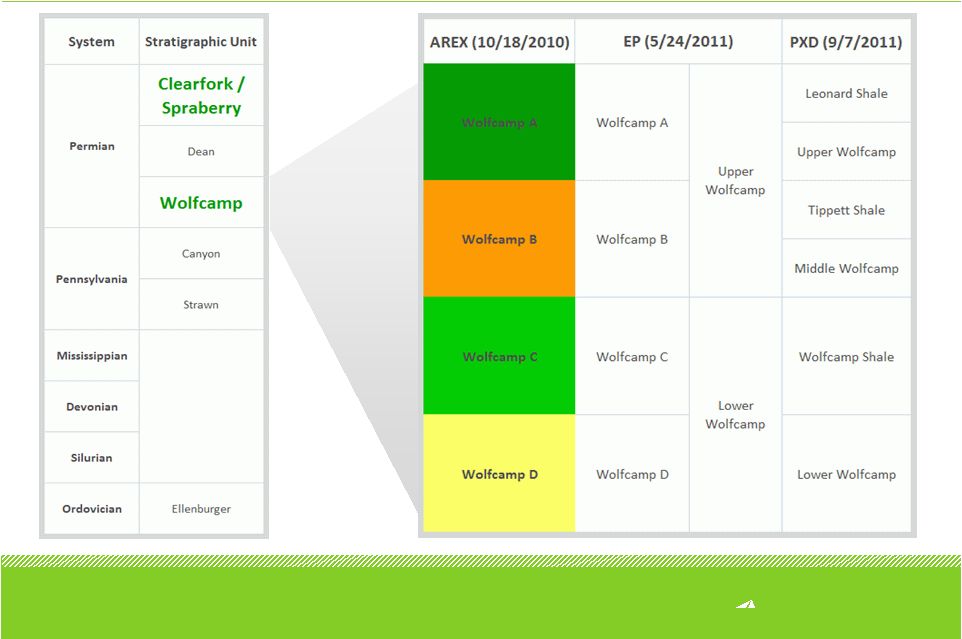 | 8 | APPROACH RESOURCES Wolfcamp Shale Name Convention – Southern Midland Basin Wolfcamp shale name conventions are based on investor presentations of AREX (10/18/2010), EP (5/24/2011) and PXD (9/7/2011). |
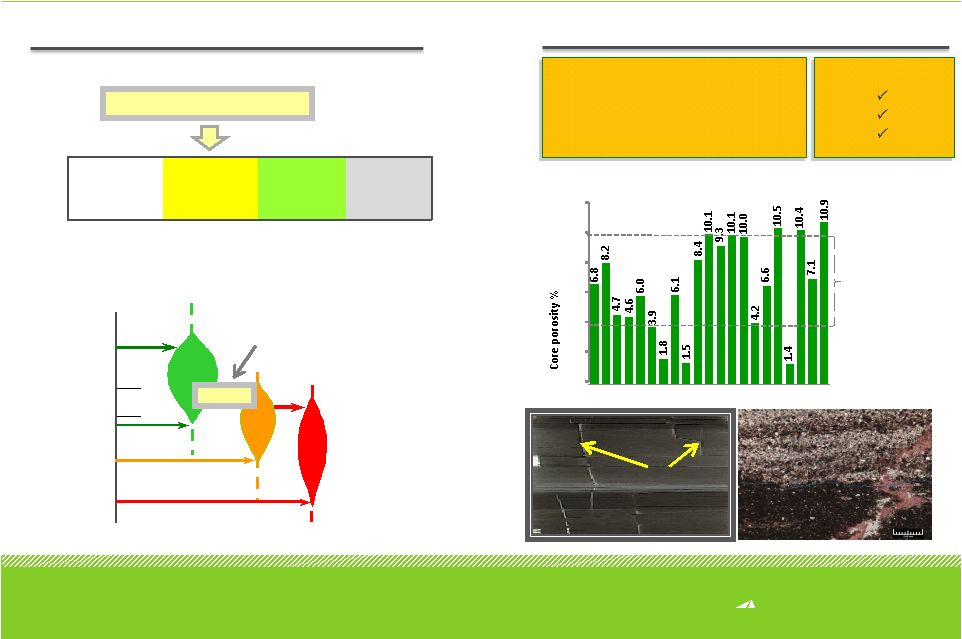 | 9 | APPROACH RESOURCES • Thermal Maturity: Wolfcamp Rock Characteristics OIL .6 .9 1.20 1.35 2.0 3.0 Peak Wet Gas Dry Gas Peak Oil Floor Wet Gas Floor Dry Gas Floor R R 0 0 Baker A112 Wolfcamp R 0 ~0.95-0.97 Richness Good - Excellent Fair TOC (%) 2-10 1-2 <1 Poor 2.24% – 7.24% Natural Fractures Organic material Quartz and carbonate materials Commonly observed core porosity values for established commercial shale plays 0.0 2.0 4.0 6.0 8.0 10.0 12.0 Core porosity for Baker A 112: Fractures Absorption WORLD CLASS SOURCE ROCK IN OIL WINDOW SIGNIFICANT OIL & GAS STORAGE SPACE • TOC for Wolfcamp Shale from whole core of Baker A 112: Oil & gas storage criteria for shales: • Matrix pore space • Fractures • Adsorption Wolfcamp Shale: ------------------------------------------------------------- |
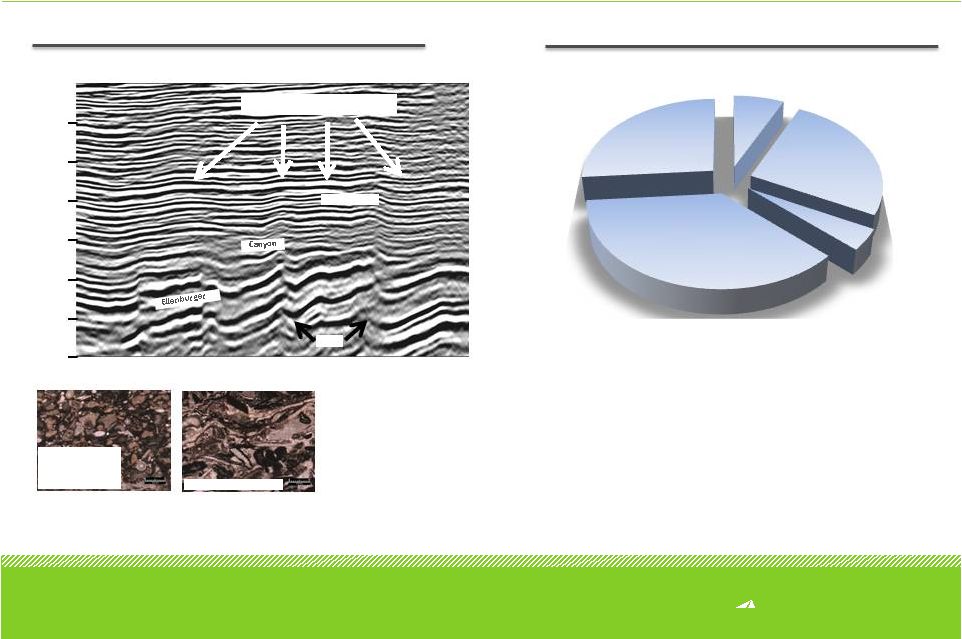 | 10 | APPROACH RESOURCES Wolfcamp Rock Characteristics HYDROCARBON PATHWAY TO WELLBORE WOLFCAMP SHALE COMPONENTS Proximity to Ouachita-Marathon thrust belt and high concentration of carbonate and quartz minerals provide favorable conditions for fracture Fossil fragments Quartz, carbonate, and fossils Average Wolfcamp Shale components based on petrophysical analyses and core data from AREX Baker A 112 W E 4,000’ 5,000’ 6,000’ 7,000’ 8,000’ 9,000’ 10,000’ Depth (feet) Carbonate 26.2% Quartz etc 36.8% Porosity 7.0% Clay 25.8% TOC 4.2% likely high fracture density areas Wolfcamp Faults |
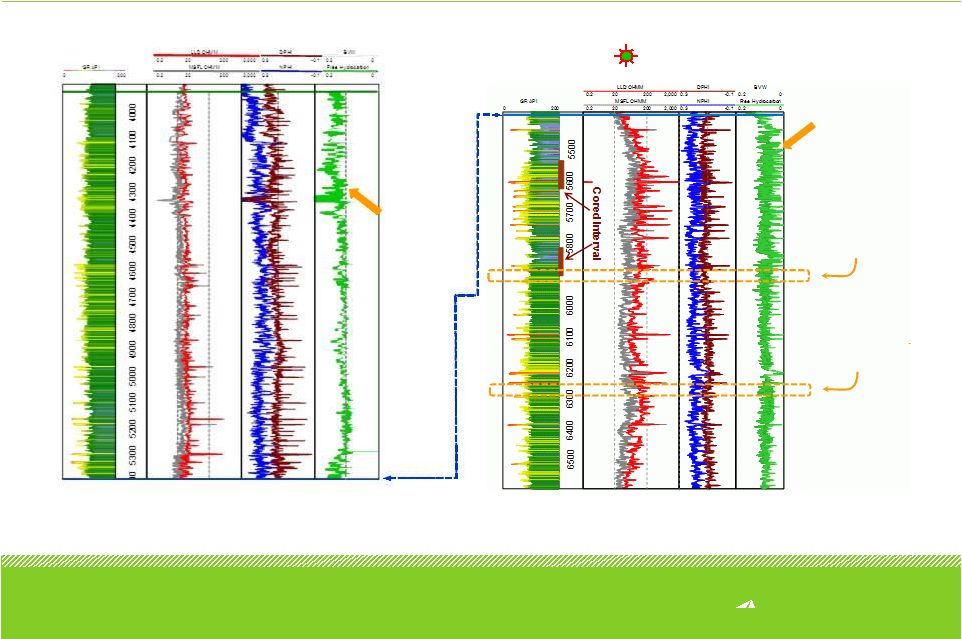 | 11 | APPROACH RESOURCES Clearfork A Clearfork B Clearfork C Hydrocarbon bearing zone Wolffork Hydrocarbon Column – Over 2,500’ Thick AREX Baker A 112 Wolfcamp A Wolfcamp B Wolfcamp C Hydrocarbon bearing zone Current Lateral Placement Current Lateral Placement |
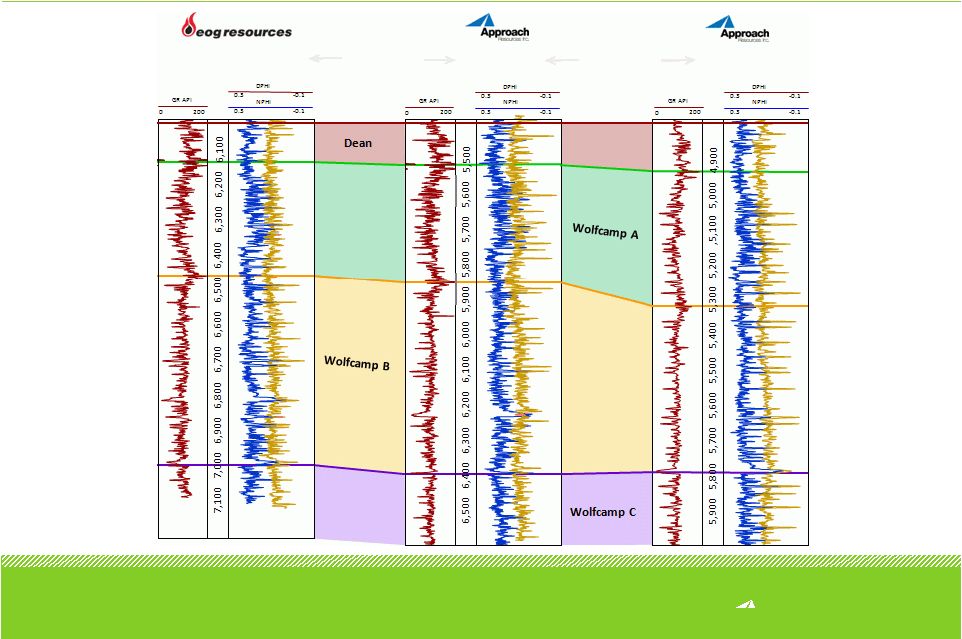 | 12 | APPROACH RESOURCES Wolfcamp Regional Correlation University 40-13 1H Baker A 112 Bailey 310 ~12.5 miles ~12.8 miles SW Irion Co Cinco Terry Ozona NE |
 | 13 | APPROACH RESOURCES *Density porosity ranges from 8% to 15%. Notes: The shale rock property (SRP) data for Bakken, Barnett, Eagle Ford and Niobrara are from industry publications. The SRP data for Wolffork are based on AREX Baker A 112 whole core. SHALE Wolffork Bakken Barnett Oil Combo Eagle Ford Niobrara BASIN Midland Williston Fort Worth South Texas DJ Basin AGE Permian Late Devonian / early Mississipian Mississippian Cretaceous Cretaceous DEPTH (feet) 4,000-8,000 7,000-11,000 6,500-8,500 8,000-12,000 7,000-9,000 THICKNESS (feet) 2,500-3,000 20-140 150-1,500 150-350 270-375 TOC (%) 2.2-7.2 2.0-18.0 4.5 2.0-6.5 4.0-4.5 TOTAL POROSITY (%) 4-11* 3-12 4-5 4-15 10-18 OOIP (MMboe)/640 Acres 119-182 5-10 100-200 27-57 20-30 Oil Shale Play Comparison • How does the Wolffork play stack up against other commercial oil shale plays? |
 APPROACH RESOURCES Wolffork Oil Shale Resource Play PILOT PROGRAM, EVALUATION & FUTURE POTENTIAL |
 | 15 | APPROACH RESOURCES AREX Wolffork Oil Shale Resource Play • Large, primarily contiguous acreage position 160,600 gross (142,000 net) acres (~76% NRI) Low acreage cost ~$350 per acre • Low-risk, long-life reserve base 64.8 MMBoe proved reserves 8.4 MMBoe proved reserves booked to Wolffork oil shale resource play 57% liquids (51% proved developed) Note: other large independents with Wolffork / Wolfberry activities nearby include PXD, DVN and CXO • 3 operated drilling rigs 2 vertical rigs, 1 horizontal rig • Vertical pilot program shifting to development stage 152 BOEPD average IP for 9 recent Wolffork recompletions (75% liquids) 140 BOEPD average IP for 7 recent vertical Wolffork wells (72% liquids) |
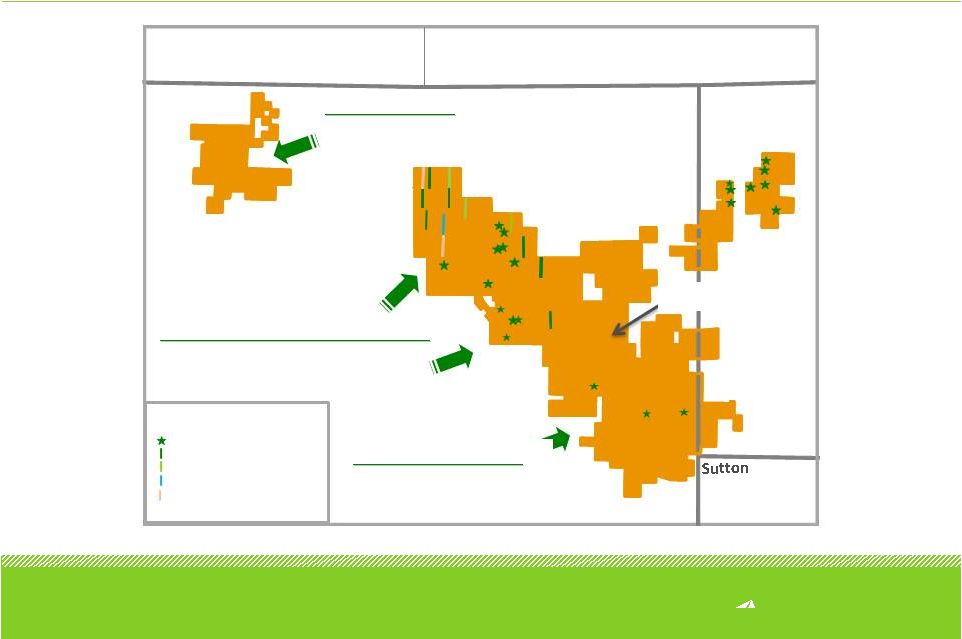 | 16 | APPROACH RESOURCES AREX Wolffork Oil Shale Resource Play – Activity Map Crockett Irion Reagan Schleicher • 59,000 gross acres • Continue pilot program • Encouraging results from pilot wells • 85,000 gross acres • Begin vertical development • Establish horizontal development • 18,000 gross acres • 3-D seismic acquisition completed • Begin horizontal drilling 1Q 2012 BAKER C 1201 CT B 1601 CT G 701H CT M 901H 54-13 1 45 D 901H 42-21 1H 45 E 1101H 45 B 2401H 45 A 701H Baker B 203 45 D 902H Chandler 4403 CT B 1303 Childress 603 Childress G 1008 42 B 1001H 45 C 803H ST 54-12 1 54-15 1 42-11 2R 42-23 9 Vertical Pilot – 2 phase Horizontal Pilot Horizontal Drilling in Progress Legend Horizontal Waiting on Completion 54-9 1 54-19 3 54-2 1 54-15 2 54-16 3 CT B 1308 Baker A 114 West 2308 42-23 11 42-14 10 45 F 2301H 45 F 2302H 45 A 702H Horizontal Permitted Location 3-D seismic early-1Q 2012 nd Pangea West Pangea West Northern & Central Pangea Northern & Central Pangea Southern Pangea Southern Pangea |
 | 17 | APPROACH RESOURCES AREX’s Wolffork Drilling Targets & Resource Potential Notes: Potential locations based on 20-acre spacing for Vertical Wolffork, 20 to 40-acre spacing for Vertical Wolffork Recompletions, 40-acre spacing for Vertical Canyon Wolffork, and 1,000-foot spacing between each horizontal well for Horizontal Wolfcamp. PLAY TYPE Vertical Wolffork Vertical Wolffork Recompletion Vertical Canyon Wolffork Horizontal Wolfcamp EUR (MBoe) 110 93 193 450 24-hr. IP (Boe/d) 80 72 170 325 Well cost ($ MM) $1.2 $0.75 $1.5 $5.5 F&D ($ MM) $10.91 $8.06 $7.77 $12.22 Potential locations 1,825 190 440 500 GROSS RESOURCE POTENTIAL (MMBoe) 200+ 17+ 85 225 Target Clearfork, Wolfcamp Clearfork, Wolfcamp Canyon, Clearfork, Wolfcamp Wolfcamp Drilling depth (ft.) < 7,500 < 7,500 < 8,500 7,000+ (lateral length) Activity (# of rigs) 1 2 - 4 recompl. / month 1 1 500+ MMBoe Total Gross Resource Potential |
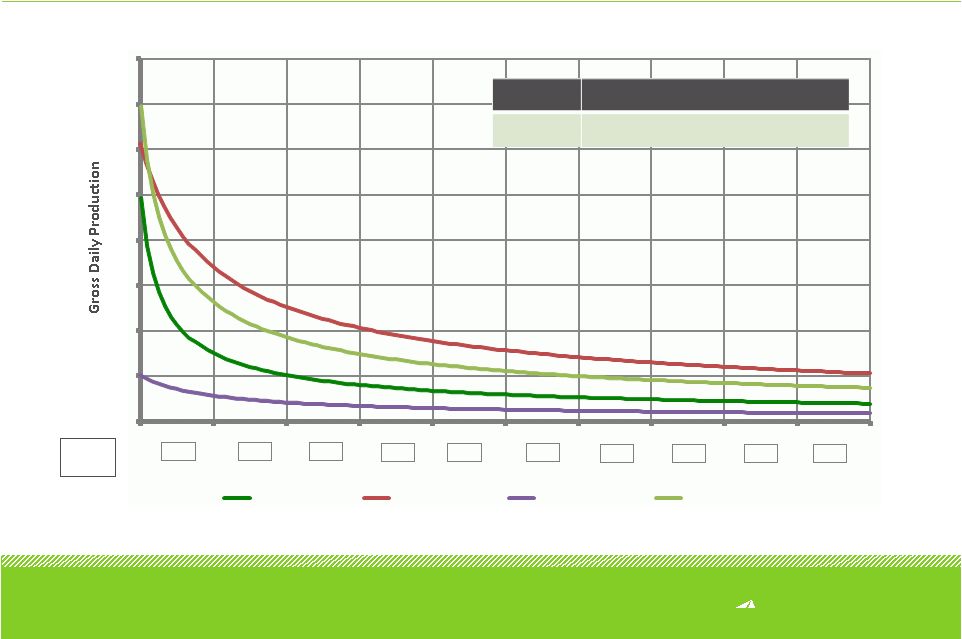 | 18 | APPROACH RESOURCES Vertical Wolffork Well Profile Annual Decline 62% 29% 20% 15% 12% 10% 9% 8% 7% 6% 0 10 20 30 40 50 60 70 80 0 1 2 3 4 5 6 7 8 9 10 Year Gross Oil (bbl/d) Sales Gas (mcf/d) Gross NGL (bbl/d) BOE (bbl/d) IP Profile Avg. EUR 58 BO, 11 Bbls NGLs, 64 Mcf gas 110 MBoe |
 | 19 | APPROACH RESOURCES Vertical Canyon Wolffork Well Profile Annual Decline 68% 32% 21% 16% 12% 10% 9% 8% 7% 6% 0 50 100 150 200 250 300 0 1 2 3 4 5 6 7 8 9 10 Year Gross Oil (bbl/d) Sales Gas (mcf/d) Gross NGL (bbl/d) BOE (bbl/d) IP Profile 66 BO, 52 Bbls NGLs, 315 Mcf gas Avg. EUR 193 MBoe |
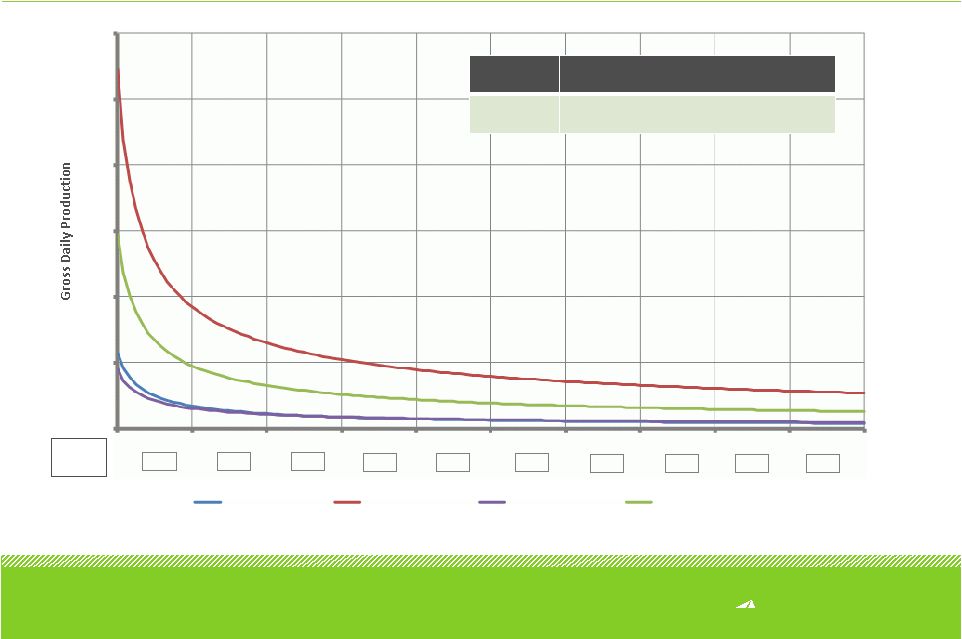
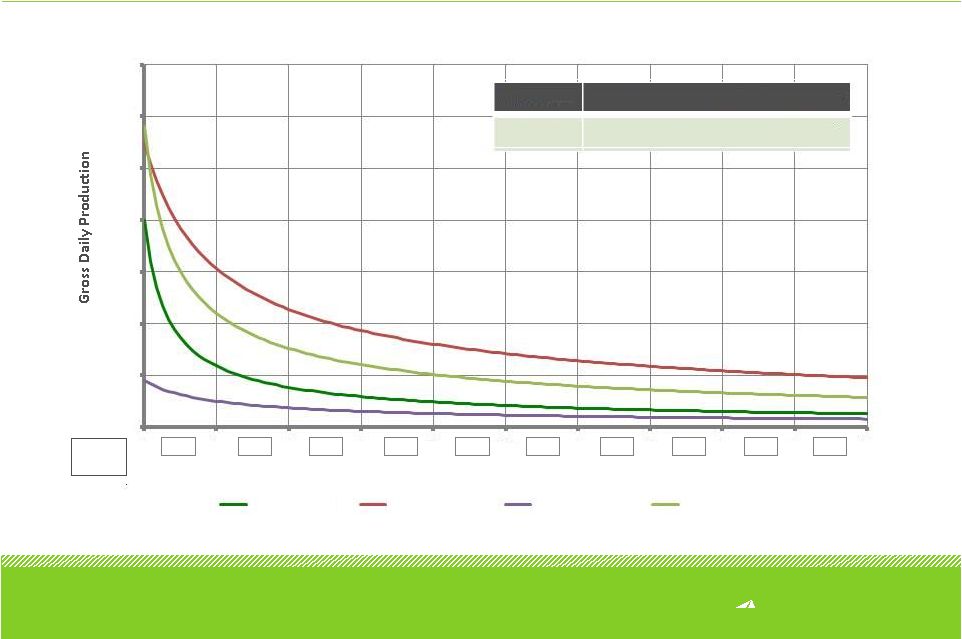 | 20 | APPROACH RESOURCES Horizontal Wolfcamp Well Profile Annual Decline 62% 31% 21% 16% 13% 11% 9% 8% 7% 6% IP Profile 230 BO, 47 Bbls NGLs, 285 Mcf gas Avg. EUR 450 MBoe 0 50 100 150 200 250 300 350 Year Gross Oil (bbl/d) Sales Gas (mcf/d) Gross NGL (bbl/d) BOE (bbl/d) 0 1 2 3 4 5 6 7 8 9 10 |
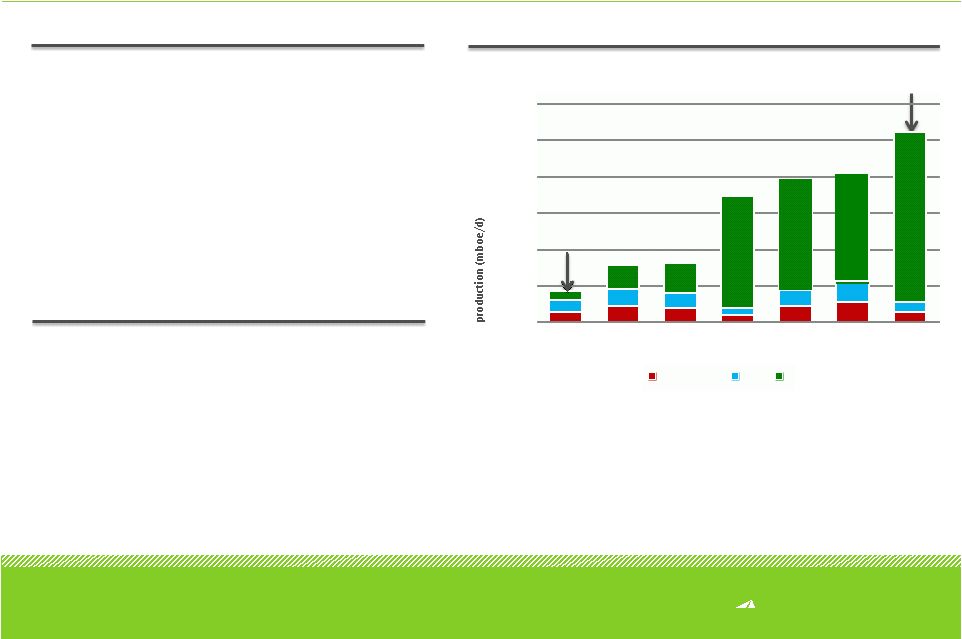   | 21 | APPROACH RESOURCES Horizontal Wolfcamp Well Performance RECENT HORIZONTAL WOLFCAMP RESULTS University 45 C 803H – 7,358’ lateral, 23 frac stages University 45 B 2401H – 7,613’ lateral, 23 frac stages University 45 D 902H – 7,770’ lateral, 23 frac stages UPCOMING HORIZONTAL WOLFCAMP WELLS University 42 B 1001H – 7,769’ lateral Targeting the Wolfcamp “C” zone University 45 E 1101H – 7,712’ lateral University 45 F 2301H – 7,749’ lateral University 45 F 2302H – 7,698’ lateral CONSISTENTLY IMPROVING WELL RESULTS 200 400 600 800 1,000 1,200 CT M 901H University 42 CT G 701H University 45 University 45 University 45 natural gas ngls oil Early 2011 9/2011 21 1H A 701H D 902H B 2401H C 803H University 45 Initial 24-hour flow rate 1,044 BOEPD, 95% liquids (931 BO, 57 Bbls NGLs, 335 MCFG) Initial 24-hour flow rate 811 BOEPD, 86% liquids (582 BO, 116 Bbls NGLs, 677 MCFG) Initial 24-hour flow rate 798 BOEPD, 88% liquids (611 BO, 95 Bbls NGLs, 552 MCFG) - |
 | 22 | APPROACH RESOURCES Key Investor Highlights • Concentrated geographic footprint focused on West Texas Midland Basin oil/liquids-rich play 142,000+ net, primarily contiguous acres, 100% operated More than 575 wells drilled since 2004, with a 93%+ success rate • Strong growth track record at competitive costs Reserve and production CAGR since 2007 of 26% and 21%, respectively Low-cost operator with best-in-class F&D and lifting costs • Significant growth potential from Wolfcamp / Wolffork oil shale drilling inventory 2,900+ potential drilling and recompletion locations Gross, unrisked resource potential totals more than 500+ MMBoe • Meaningful upside catalysts in near future Wolffork oil shale resource play transitioning into development stage by Approach and other operators Pioneer, El Paso and EOG allocating more capital to the play Strong flow of new well result data should further derisk the play • Strong balance sheet to execute development plan $260 MM borrowing base $260 MM pro forma liquidity at 9/30/2011 Note: See liquidity calculation in appendix. |
 APPROACH RESOURCES Financial Framework & Non-GAAP Reconciliations |
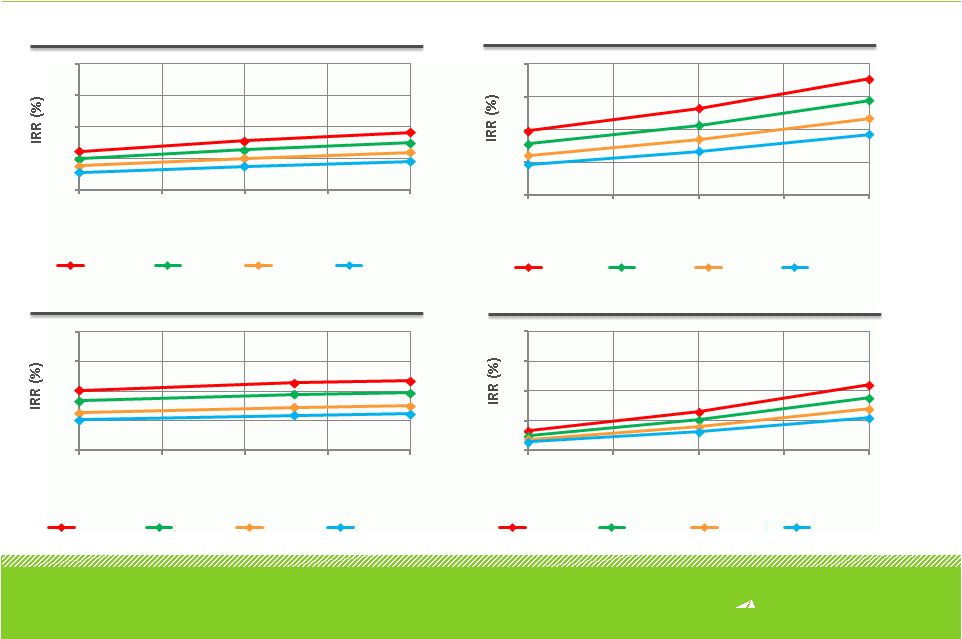 | 24 | APPROACH RESOURCES Pre-Tax IRR Sensitivities of AREX’s Wolffork Drilling Targets VERTICAL WOLFFORK VERTICAL WOLFFORK RECOMPLETIONS VERTICAL CANYON WOLFFORK HORIZONTAL WOLFCAMP 0 20 40 60 80 100 105 110 115 120 Well EUR (MBoe) $100 / bbl $90 / bbl $80 / bbl $70 / bbl 0 20 40 60 80 180 185 190 195 200 Well EUR (MBoe) $100 / bbl $90 / bbl $80 / bbl $70 / bbl 0 20 40 60 80 350 400 450 500 550 Well EUR (MBoe) $100 / bbl $90 / bbl $80 / bbl $70 / bbl 0 20 40 60 80 76 85 93 102 110 Well EUR (MBoe) $100 / bbl $90 / bbl $80 / bbl $70 / bbl |
 | 25 | APPROACH RESOURCES 2012 Capital Budget 2012 PROGRAM 2012 Capital budget $160 MM 2 Vertical rigs, 1 horizontal rig and 2 to 4 recompletions per month targeting the Wolffork oil shale Substantially same rig program as 2011 Targeting 20%+ production growth 2012 production guidance 2,800 MBoe – 3,000 MBoe Key takeaways: Initial 2012 capital program provides flexibility to develop Wolffork oil shale and monitor commodity prices and service costs Increase in liquids production drives expected increase in cash flow Increase in borrowing base strengthens liquidity Notes: Our 2012 capital budget is subject to change depending upon a number of factors, including economic and industry conditions at the time of drilling, prevailing and anticipated prices for oil, NGLs and natural gas, the availability sufficient capital resources for drilling prospects, our financial results, the availability of drilling and completion services and materials on reasonable terms, and lease extensions and renewals. Additionally, we may increase our 2012 capital budget if we acquire acreage or accelerate our drilling program. |
 2012 Operating and Financial Guidance Guidance is forward-looking information that is subject to a number of risks and uncertainties, many of which are beyond the Company’s control. See slide 2, “Forward-looking statements,” for additional information. 2012 Guidance Production Total (MBoe) 2,800- 3,000 Percent Oil & NGLs 65% Operating costs and expenses ($/per Boe) Lease operating $ $ $ $ $ 4.50 – 5.50 Severance and production taxes 2.50 – 4.00 Exploration 4.00 – 5.00 General and administrative 5.25 – 6.25 Depletion, depreciation and amortization 12.00 – 15.00 Capital expenditures ($MM) Approximately $160 | 26 | |
 | 27 | APPROACH RESOURCES • Oil (NYMEX – West Texas Intermediate) – 2012 Collars contracted for 1,200 Bbls/d at weighted average floor $87.08 – ceiling $101.08 – 2013 Collars contracted for 650 Bbls/d – Floor $90.00 – Ceiling $105.80 Hedge Position CURRENT HEDGE POSITION |
 | 28 | APPROACH RESOURCES Liquidity (unaudited) Note: Liquidity as further adjusted is based on issuance of 4,600,000 shares at $28.00 per share. (in thousands) Liquidity at September 30, 2011 Liquidity with Borrowing Base increase at September 30, 2011 Liquidity as further adjusted for follow-on equity offering at September 30, 2011 Borrowing base $ 200,000 $ 260,000 $ 260,000 Cash and cash equivalents 736 736 736 Outstanding letters of credit (350) (350) (350) Long-term debt (122,000) (122,000) — Liquidity $ 78,386 $ 138,386 $ 260,386 Liquidity is calculated by adding the net funds available under our revolving credit facility and cash and cash equivalents. We use liquidity as an indicator of the Company’s ability to fund development and exploration activities. However, this measurement has limitations. This measurement can vary from year to year for the Company and can vary among companies based on what is or is not included in the measurement on a company’s financial statements. This measurement is provided in addition to, and not as an alternative for, and should be read in conjunction with, the information contained in our financial statements prepared in accordance with GAAP (including the notes), included in our SEC filings and posted on our website. The table below summarizes our liquidity at September 30, 2011, and our liquidity position at September 30, 2011, reflecting the October 2011 borrowing base increase to $260 million from $200 million, and our liquidity at September 30, 2011, as further adjusted for our November 2011 follow-on equity offering of 4,600,000 shares. |
 | 29 | APPROACH RESOURCES We believe that providing measures of finding and development, or F&D, cost is useful to assist an evaluation of how much it costs the Company, on a per Boe basis, to add proved reserves. However, these measures are provided in addition to, and not as an alternative for, and should be read in conjunction with, the information contained in our financial statements prepared in accordance with GAAP (including the notes), included in our SEC filings and posted on our website. Due to various factors, including timing differences, F&D costs do not necessarily reflect precisely the costs associated with particular reserves. For example, exploration costs may be recorded in periods before the periods in which related increases in reserves are recorded and development costs may be recorded in periods after the periods in which related increases in reserves are recorded. In addition, changes in commodity prices can affect the magnitude of recorded increases (or decreases) in reserves independent of the related costs of such increases. As a result of the above factors and various factors that could materially affect the timing and amounts of future increases in reserves and the timing and amounts of future costs, including factors disclosed in our filings with the SEC, we cannot assure you that the Company’s future F&D costs will not differ materially from those set forth above. Further, the methods we use to calculate F&D costs may differ significantly from methods used by other companies to compute similar measures. As a result, our F&D costs may not be comparable to similar measures provided by other companies. The following tables reflect the reconciliation of our estimated finding and development costs to the information required by paragraphs 11 and 21 of ASC 932-235. F&D Costs Reconciliation (unaudited) Note: F&D costs exclude asset retirement obligations of $6.3 million at 6/30/2011 and $5.4 million at 12/31/2010. 1H 2011 Reserve summary (Mboe) Balance – 12/31/2010 Extensions & discoveries Purchases Revisions Production 50,715 8,910 10,497 (2,197) (1,077) 66,848 Cost summary ($M) Acquisitions Exploration costs Development costs Total 85,714 $ 4,914 72,061 162,689 Finding & development costs ($/Boe) All-in F&D costs Drill-bit F&D cost 9.45 8.64 $ $ Reserve replacement ratio (%) Net reserve adds (Mboe) 1H’11 Production (Mboe) Reserve replacement 17,210 (1,077) 1,598% 3-Year reserve summary (Mboe) Balance – 12/31/2007 Balance – 12/31/2010 Extensions & discoveries Purchases Revisions Production 30,067 15,880 3,244 6,008 (4,484) 50,715 Cost summary ($M) Acquisitions Exploration costs Development costs Total Finding & development costs ($/Boe) 3-year All-in F&D costs 3-year Drill-bit F&D cost 8.78 11.96 Reserve replacement ratio (%) Net reserve adds (Mboe) 3-year Production (Mboe) Reserve replacement 25,132 (4,484) 561% $ $ Balance – 6/30/2011 30,605 9,364 180,568 220,537 $ |
 | 30 | APPROACH RESOURCES We define EBITDAX as net income, plus (1) exploration expense, (2) depletion, depreciation and amortization expense, (3) share-based compensation expense, (4) unrealized (gain) loss on commodity derivatives, (5) gain on sale of oil and gas properties, (6) interest expense, and (7) income taxes. EBITDAX is not a measure of net income or cash flow as determined by GAAP. The amounts included in the calculation of EBITDAX were computed in accordance with GAAP. EBITDAX is presented herein and reconciled to the GAAP measure of net income because of its wide acceptance by the investment community as a financial indicator of a company's ability to internally fund development and exploration activities. This measure is provided in addition to, and not as an alternative for, and should be read in conjunction with, the information contained in our financial statements prepared in accordance with GAAP (including the notes), included in our SEC filings and posted on our website. EBITDAX Reconciliation (unaudited) (in thousands, except per-share amounts) Three Months Ended September 30, 2011 2010 Net income $ 7,073 $ 2,087 Exploration 1,969 568 Depletion, depreciation and amortization 8,355 5,832 Share-based compensation 1,089 1,047 Unrealized (gain) loss on commodity derivatives (1,739) 312 Interest expense, net 1,016 615 Income tax provision 3,908 1,167 EBITDAX $ 21,671 $ 11,628 EBITDAX per diluted share $ 0.76 $ 0.54 |
 APPROACH RESOURCES Contact Information MEGAN P. HAYS MANAGER, IR & CORPORATE COMMUNICATIONS 817.989.9000 X 2108 MHAYS@APPROACHRESOURCES.COM |