 MARCH 2012 INVESTOR PRESENTATION APPROACH RESOURCES INC. Exhibit 99.2 |
 Forward Looking-Statements 2 Cautionary Statements Regarding Oil & Gas Quantities This presentation contains forward-looking statements within the meaning of Section 27A of the Securities Act of 1933 and Section 21E of the Securities Exchange Act of 1934. All statements, other than statements of historical facts, included in this presentation that address activities, events or developments that the Company expects, believes or anticipates will or may occur in the future are forward-looking statements. Without limiting the generality of the foregoing, forward-looking statements contained in this presentation specifically include the expectations of management regarding plans, strategies, objectives, anticipated financial and operating results of the Company, including as to the Company’s Wolffork shale resource play, estimated oil and gas in place and recoverability of the oil and gas, estimated reserves and drilling locations, capital expenditures, typical well results and well profiles, and production and operating expenses guidance included in the presentation. These statements are based on certain assumptions made by the Company based on management's experience and technical analyses, current conditions, anticipated future developments and other factors believed to be appropriate and believed to be reasonable by management. When used in this presentation, the words “will,” “potential,” “believe,” “intend,” “expect,” “may,” “should,” “anticipate,” “could,” “estimate,” “plan,” “predict,” “project,” “target,” “profile,” “model” or their negatives, other similar expressions or the statements that include those words, are intended to identify forward-looking statements, although not all forward-looking statements contain such identifying words. Such statements are subject to a number of assumptions, risks and uncertainties, many of which are beyond the control of the Company, which may cause actual results to differ materially from those implied or expressed by the forward-looking statements. In particular, careful consideration should be given to the cautionary statements and risk factors described in the Company's most recent Annual Report on Form 10-K and Quarterly Report on Form 10-Q. Any forward-looking statement speaks only as of the date on which such statement is made and the Company undertakes no obligation to correct or update any forward-looking statement, whether as a result of new information, future events or otherwise, except as required by applicable law. The Securities and Exchange Commission (“SEC”) permits oil and gas companies, in their filings with the SEC, to disclose only proved, probable and possible reserves that meet the SEC’s definitions for such terms, and price and cost sensitivities for such reserves, and prohibits disclosure of resources that do not constitute such reserves. The Company uses the terms “estimated ultimate recovery” or “EUR,” reserve or resource “potential,” “upside,” “oil and gas in place” or “OGIP,” “OIP” or “GIP,” and other descriptions of volumes of reserves potentially recoverable through additional drilling or recovery techniques that the SEC’s rules may prohibit the Company from including in filings with the SEC. These estimates are by their nature more speculative than estimates of proved, probable and possible reserves and accordingly are subject to substantially greater risk of being actually realized by the Company. EUR estimates, potential drilling locations, resource potential and OGIP estimates have not been risked by the Company. Actual locations drilled and quantities that may be ultimately recovered from the Company’s interest may differ substantially from the Company’s estimates. There is no commitment by the Company to drill all of the drilling locations that have been attributed these quantities. Factors affecting ultimate recovery include the scope of the Company’s ongoing drilling program, which will be directly affected by the availability of capital, drilling and production costs, availability of drilling and completion services and equipment, drilling results, lease expirations, regulatory approval and actual drilling results, including geological and mechanical factors affecting recovery rates. Estimates of unproved reserves, type/decline curves, per well EUR, OGIP and resource potential may change significantly as development of the Company’s oil and gas assets provides additional data. Type/decline curves, estimated EURs, typical well-related oil and gas in place, recovery factors and well costs represent Company estimates based on evaluation of petrophysical analysis, core data and well logs, well performance from limited drilling and recompletion results and seismic data, and have not been reviewed by independent engineers. These are presented as hypothetical recoveries if assumptions and estimates regarding recoverable hydrocarbons, OGIP, recovery factors and costs prove correct. The Company has very limited production experience with these projects, and accordingly, such estimates may change significantly as results from more wells are evaluated. Estimates of resource potential, EURs and OGIP do not constitute reserves, but constitute estimates of contingent resources which the SEC has determined are too speculative to include in SEC filings. Unless otherwise noted, IRR estimates assume NYMEX forward-curve oil and gas pricing and Company-generated EUR and decline curve estimates based on Company drilling and completion cost estimates that do not include land, seismic or G&A costs. |
 Company Overview 3 AREX OVERVIEW ASSET OVERVIEW Notes: Proved reserves and acreage as of 12/31/2011. All Boe and Mcfe calculations are based on a 6 to 1 conversion ratio. Enterprise value is equal to market capitalization using the closing share price of $34.07 per share on 3/2/2012, plus net debt as of 12/31/2011. See liquidity calculation in appendix. • Enterprise value $1.2 BN • High quality reserve base 77 MMBoe proved reserves • Permian core operating area • Strong balance sheet to execute plan 99% Permian Basin 61% Oil & NGLs 165,700 gross (145,000 net) acres 7.1 MBoe/d Q4 2011 production 500+ MMBoe gross, unrisked resource potential 2,900+ drilling and recompletion opportunities Borrowing base $260 MM Liquidity of $216 MM at 12/31/2011 |
 2011 – A Transformational Year for AREX • 50.7 MMBoe proved reserves • 4.3 MBoe/d daily production • 101,900 net acres in Permian Basin • 77 MMBoe proved reserves (+52% YoY) • 6.4 MBoe/d daily production (+50% YoY) • 145,000 net acres in Permian Basin (+42% YoY) • 51% of proved reserves were liquids • 33% of production were liquids • 61% of proved reserves are liquids • 55% of production is liquids • 3 recompletions and 1 vertical well commingled in Wolffork oil shale resource play • Vertical program transitioned to development mode • 9 horizontal Wolfcamp pilot wells completed in 2011; transitioning Wolfcamp “B” zone to development mode • Approach’s early view on the play has been validated by the industry • $150 MM borrowing base • $173 MM liquidity • 2010 EBITDAX of $43 MM • $260 MM borrowing base • $216 MM liquidity • 2011 EBITDAX of $79 MM (+85% YoY) THEN…2010 NOW…2011 ACCOMPLISHMENTS 4 Note: See “Liquidity” and “EBITDAX” reconciliation slides in appendix. Growth Reserves / production mix Derisking Wolffork play Financial strength |
 2011 Financial Highlights 5 REVENUES, EARNINGS & CASH FLOW • Revenues of $108.4 MM in 2011 vs. $57.6 MM in 2010 • Net income of $7.2 MM or $0.25 per diluted share Adjusted net income of $19.5 MM or $0.67 per diluted share EBITDAX of $79.4 MM or $2.72 per diluted share • Cash flow from operating activities of $95.8 MM in 2011 vs. $42.4 MM in 2010 BALANCE SHEET & LIQUIDITY • Borrowing base of $260 MM • YE 2011 Debt of $43.8 MM • YE Liquidity of $216.2 MM Long-term debt-to-capital of 8.6% Note: See “Adjusted Net Income,” “EBITDAX” and “Liquidity” reconciliation slides in appendix. |
 Track Record of Reserve and Production Growth • YE’11 reserves increased 52% YoY Oil and NGL reserves up 84% to 47.2 MMBbls • Replaced 1,093% of reserves at an all-in F&D cost of $9.99/Boe • 24.2 MMBoe proved reserves booked to Wolffork oil shale resource play 6 RESERVE GROWTH PRODUCTION GROWTH • 2011 production increased 50% YoY • Oil and NGL production up 152% to 1.3 MMBbls 2011 production 55% liquids 2012E production 65% liquids Note: See “F&D Costs Reconciliation” slide in appendix. |
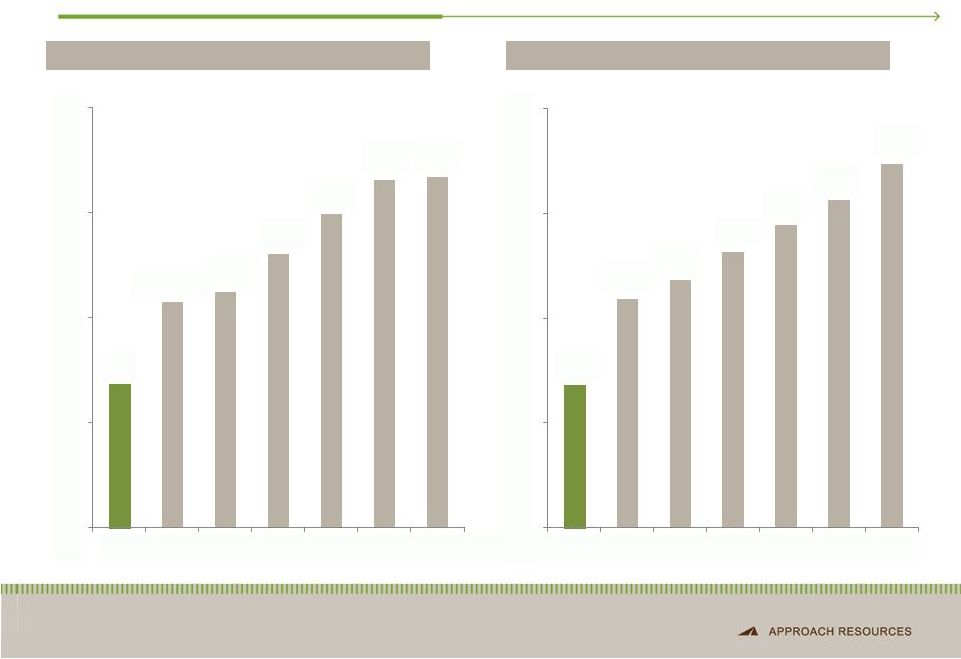 Low-Cost Operator 7 3-YR AVERAGE F&D COSTS ($/BOE) 2011 LIFTING COSTS ($/BOE) Notes: Oil weighted peers include BRY, CXO, KOG, NOG, OAS, SD. Data based on SEC filings and J.S. Herold data. Lifting costs defined as lease operating expense plus taxes other than income and gathering and transportation expense. See “F&D Costs Reconciliation” slide in appendix for reconciliation of 3-YR F&D costs. $8.20 $12.90 $13.47 $15.64 $17.91 $19.89 $20.06 $0 $6 $12 $18 $24 AREX Peer 1 Peer 2 Peer 3 Peer 4 Peer 5 Peer 6 $8.18 $13.10 $14.20 $15.78 $17.35 $18.78 $20.81 $0 $6 $12 $18 $24 AREX Peer 1 Peer 2 Peer 3 Peer 4 Peer 5 Peer 6 |
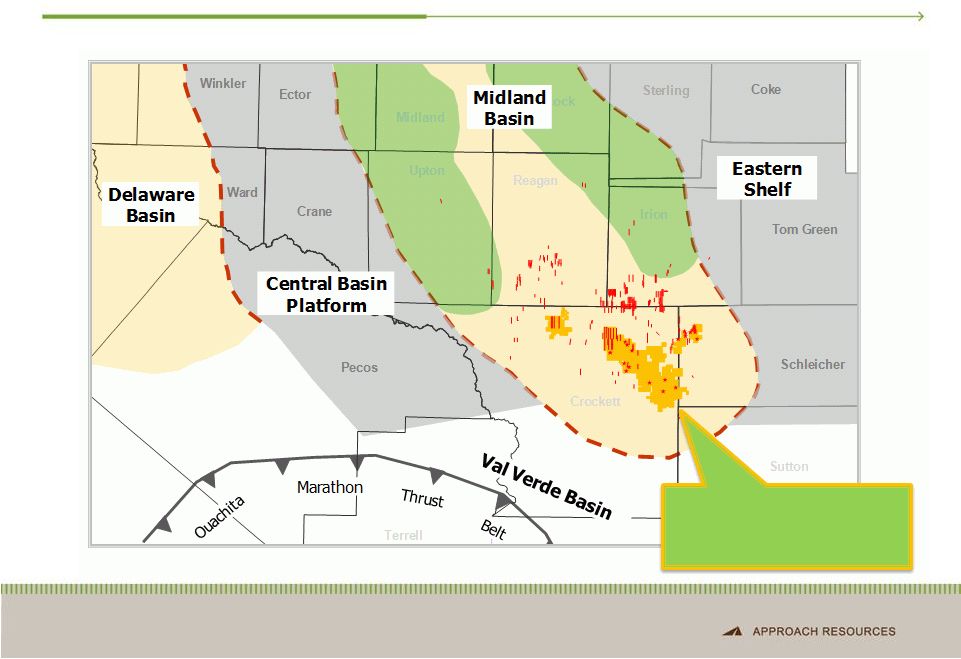 AREX Wolffork Play Favorably Located in the S. Midland Basin 8 Wolfcamp / Wolffork Oil Shale Resource Play |
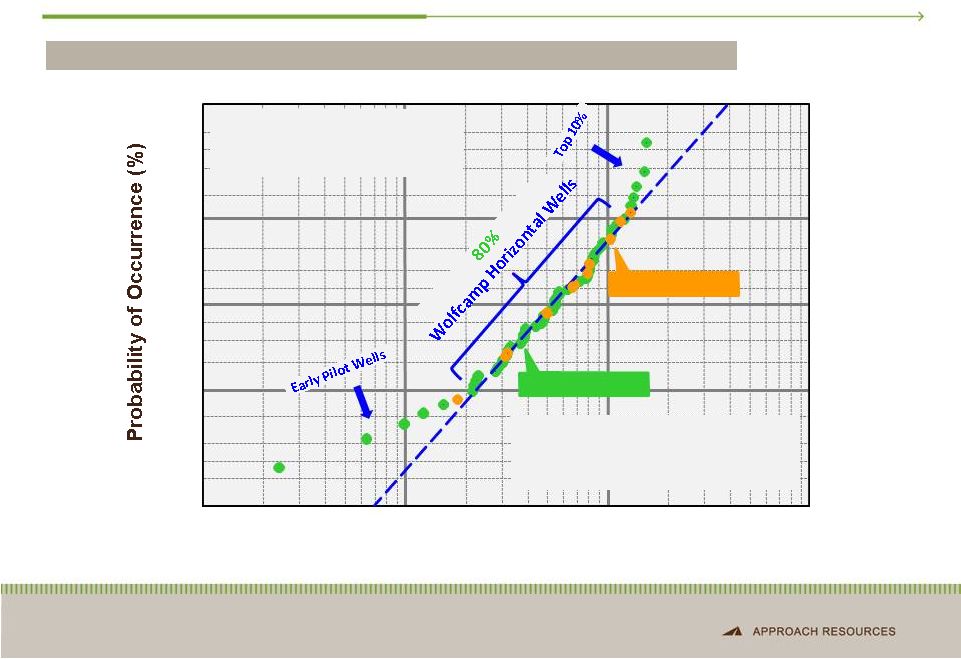 Distribution of IP Rates – Horizontal Wolfcamp Wells WOLFCAMP OIL SHALE RESOURCE PLAY – SOUTHERN MIDLAND BASIN 9 10% 50% 90% 10.0 100 1,000 10,000 Initial Daily Production Rate (BOEPD) Industry Wells AREX Wells 99% 1% Available Data = 65 HZ Wells P50 ~ 504 BOEPD Majority Completed Last 12 Months Many factors affect IPs, including learning curve, number of frac stages, fluid type and amount, proppant amount, pumping rate, lateral landing point and fracture density Data from public domain and company IR presentations |
 AREX Wolffork Oil Shale Resource Play 10 Large, primarily contiguous acreage position Liquids-rich, multiple pay zones 165,700 gross (145,000 net) acres Low acreage cost ~$500 per acre 24.2 MMBoe proved reserves booked to Wolffork oil shale resource play 61% liquids (51% proved developed) 2,900+ drilling and recompletion opportunities $190 MM capital budget 2 horizontal rigs, 1 vertical rig and 2 to 4 recompletions per month 76.8 MMBoe proved reserves 500+ MMBoe gross, unrisked resource potential 3 operated drilling rigs |
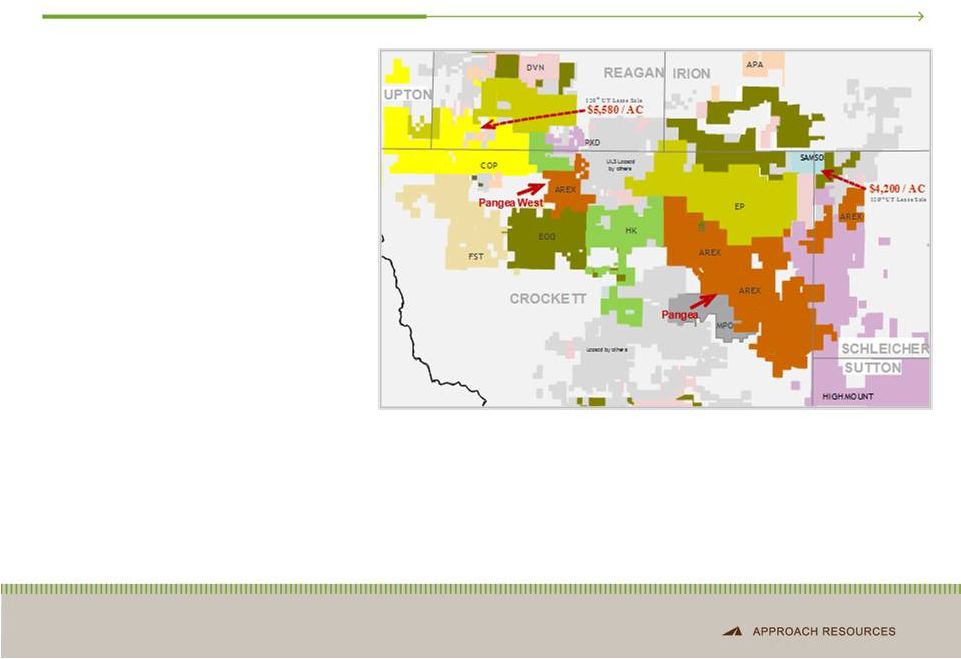
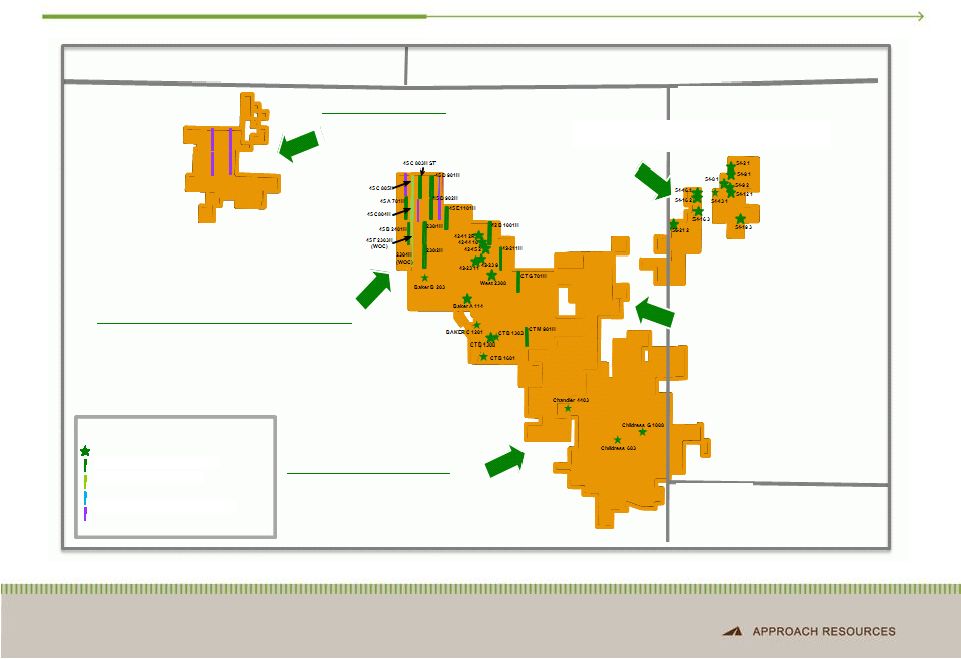 AREX Wolffork Play – Activity Map 11 Pangea West Sutton Schleicher Crockett Irion Reagan Vertical Producer Horizontal Producer Horizontal Drilling in Progress Horizontal Permit Legend Horizontal Waiting on Completion Northern & Central Pangea Southern Pangea • 17,000 gross acres • 3-D seismic completed • Expect to drill horizontal well in 1Q’12 • 59,000 gross acres • Continuing Wolffork pilot program • Encouraging results from Childress G 1008 • 3-D seismic underway • Expect to drill horizontal pilot well in 3Q’12 • 3-D seismic planning underway • Continuing vertical Wolffork development • 89,000 gross acres • Beginning Wolfcamp horizontal development • Beginning Wolffork vertical development |
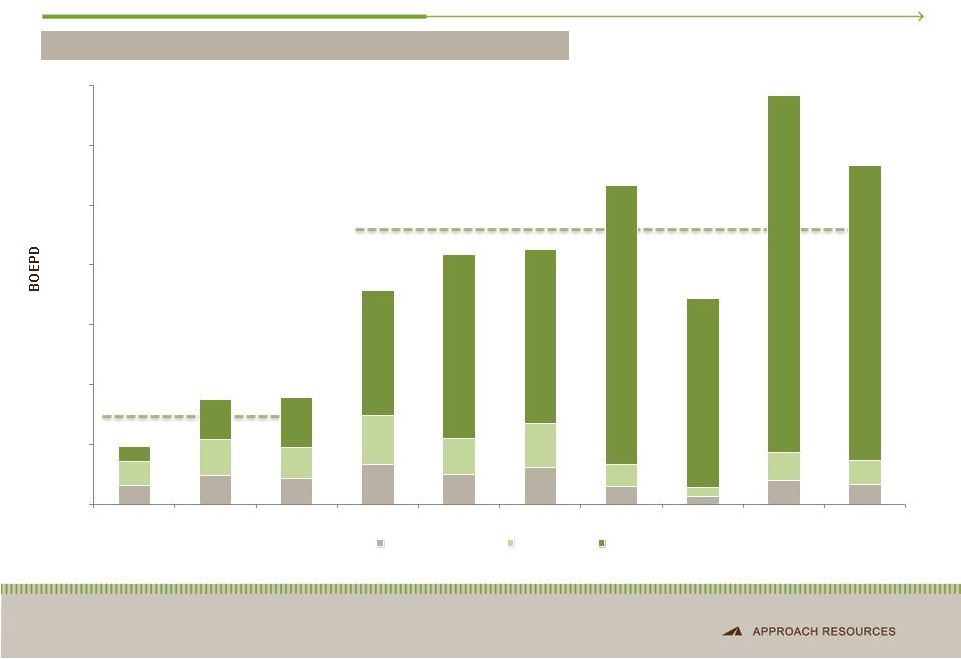 Horizontal Wolfcamp Well Performance 24-HOUR INITIAL PRODUCING RATES – “B” ZONE Avg. IP ~926 BOEPD Avg. IP ~299 BOEPD 0 200 400 600 800 1,000 1,200 1,400 CT M 901H U 42 21 1H CT G 701H U 45 A 701H U 45 D 902H U 45 B 2401H U 45 C 803H U 45 E 1101H U 45 F 2301H U 45 F 2302H Natural Gas NGLs Oil 12 |
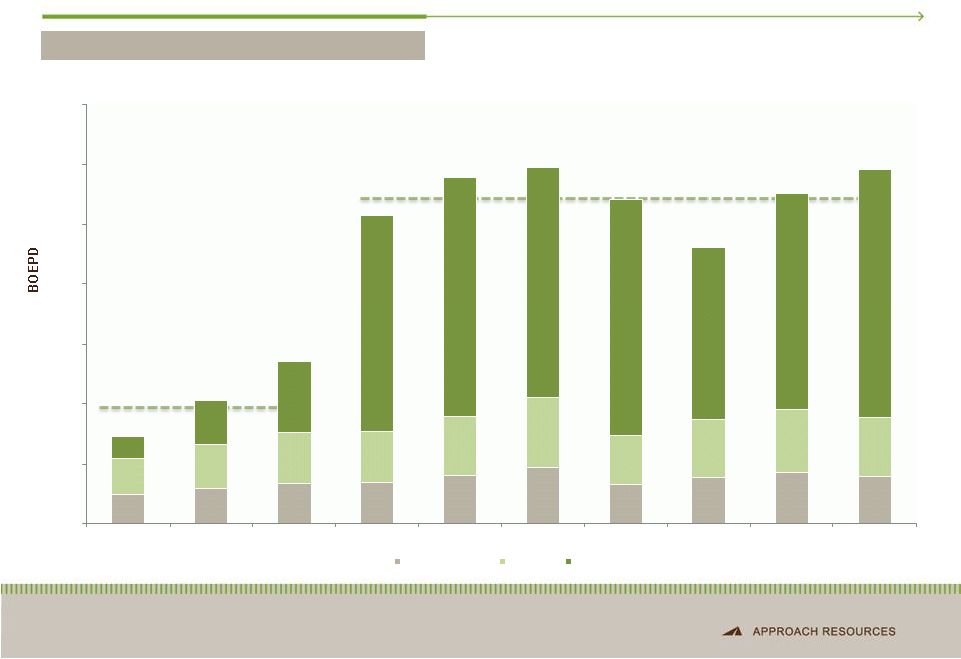 Horizontal Wolfcamp Well Performance 13 AVG. 30 DAY RATES – “B” ZONE Avg. 30-Day Rate ~548 BOEPD Avg. 30-Day Rate ~207 BOEPD 0 100 200 300 400 500 600 700 CT M 901H U 42 21 1H CT G 701H U 45 A 701H U 45 D 902H U 45 B 2401H U 45 C 803H U 45 E 1101H U 45 F 2301H U 45 F 2302H Natural Gas NGLs Oil |
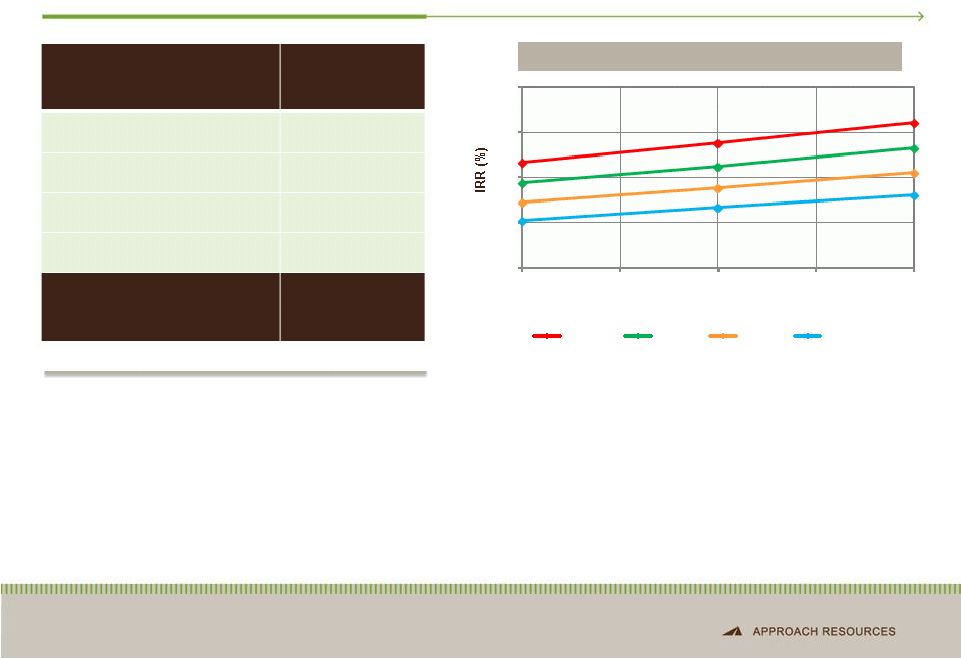
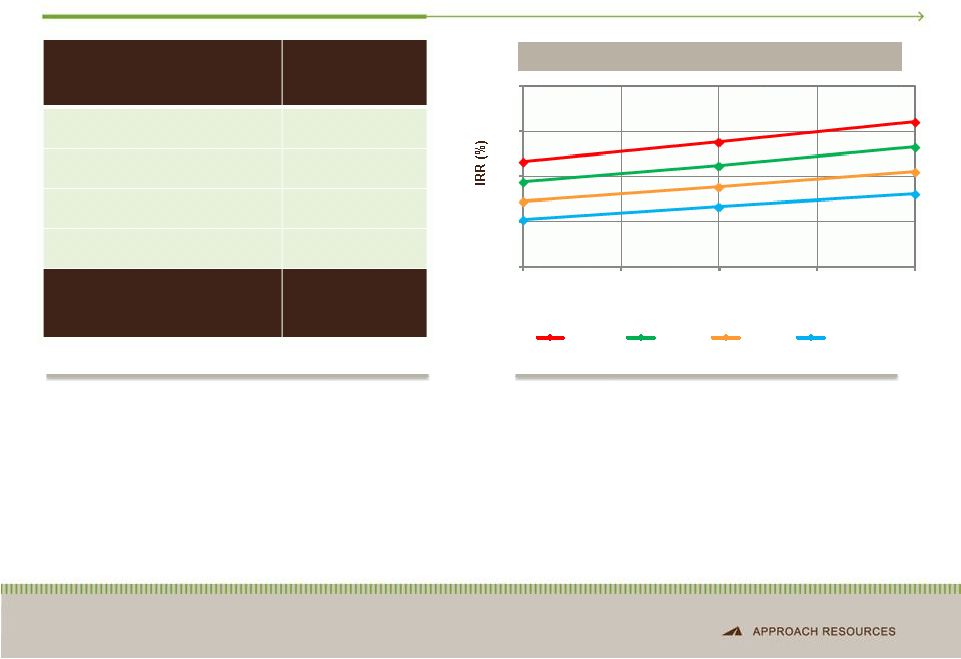 Horizontal Wolfcamp Economics 14 Play Type Horizontal Wolfcamp Avg. EUR 450 MBoe Targeted Well Cost $5.5 MM F&D $12.22/Boe Potential Locations 500 Gross Resource Potential 225 MMBoe BTAX IRR SENSITIVITIES • Horizontal drilling improves recoveries and returns • Multiple, stacked horizontal targets • 7,000’+ lateral length • ~80% of EUR made up of oil and NGLs • 2 horizontal rigs running in Project Pangea / Pangea West • Improving IPs and liquids ratio driving higher returns 0 10 20 30 40 50 60 350 400 450 500 550 Well EUR (MBoe) $100 / bbl $90 / bbl $80 / bbl $70 / bbl Note: Potential locations based on 1,000-feet spacing between each horizontal well. Economics assume NYMEX gas strip 7/2011 and NGL price based on 50% WTI oil price. |
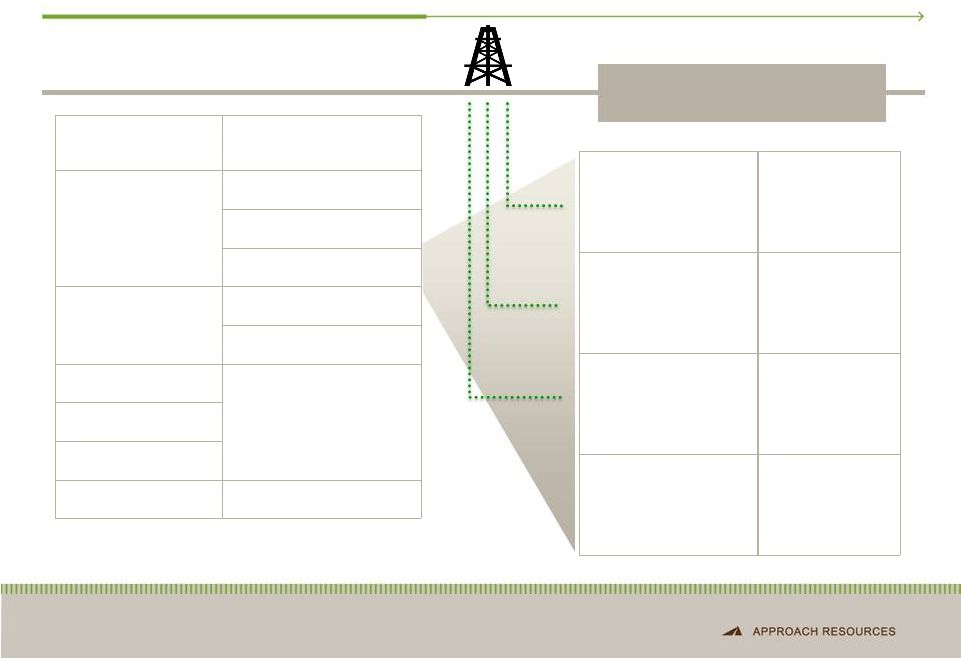 Horizontal Wolfcamp Targets 15 SYSTEM STRATIGRAPHIC UNIT Permian Clearfork/Spraberry Dean Wolfcamp Pennsylvanian Canyon Strawn Mississippian Devonian Silurian Ordovician Ellenburger WOLFCAMP A WOLFCAMP B WOLFCAMP C WOLFCAMP D Pilot Transitioning to Development Pilot – Recent Results Encouraging Under Evaluation POTENTIAL HORIZONTAL WOLFCAMP TARGETS |
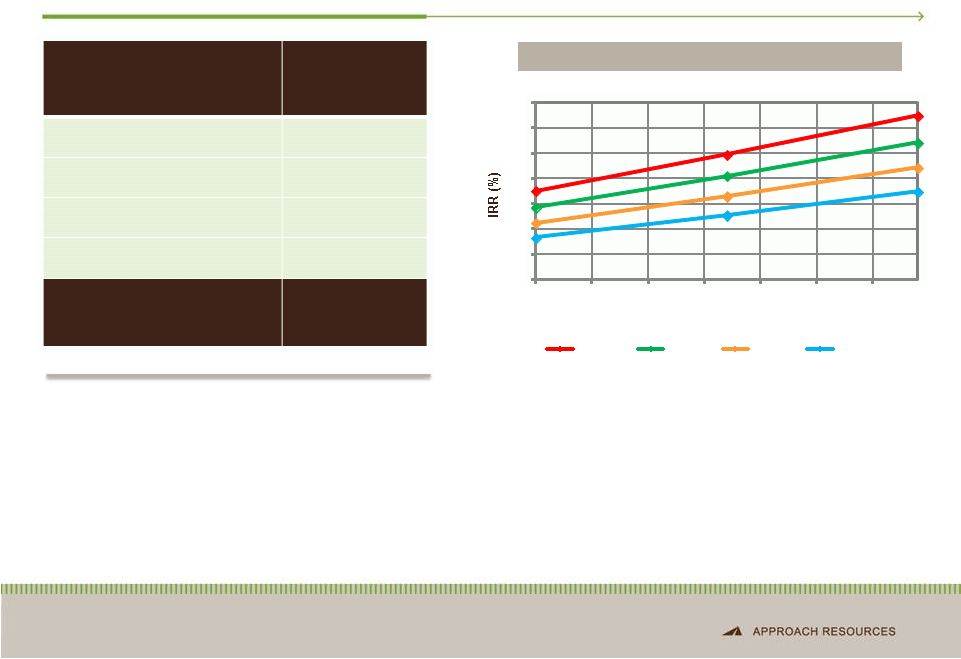
 Vertical Wolffork Economics 16 Play Type Vertical Wolffork Avg. EUR 110 MBoe Targeted Well Cost $1.2 MM F&D $10.91/Boe Potential Locations 1,825 Gross Resource Potential 200+ MMBoe BTAX IRR SENSITIVITIES • Vertical pilot program in development mode • 292 BOEPD average IP for 6 recent vertical Wolffork wells (78% liquids) • Recent vertical well IPs include 786 BOEPD IP from one well 0 10 20 30 40 100 105 110 115 120 Well EUR (MBoe) $100 / bbl $90 / bbl $80 / bbl $70 / bbl Note: Potential locations based on 20 acre spacing. Economics assume NYMEX gas strip 7/2011 and NGL price based on 50% of WTI oil price. |
 Vertical Wolffork Recompletion Economics 17 Play Type Vertical Wolffork Recompletion Avg. EUR 93 MBoe Targeted Well Cost $0.75 MM F&D $8.06/Boe Potential Locations 190 Gross Resource Potential 17+ MMBoe BTAX IRR SENSITIVITIES • 225 BOEPD average IP for 5 recent vertical Wolffork recompletions (79% liquids) • Recent recompletion IPs include 535 BOEPD IP from one recompletion 0 10 20 30 40 50 60 70 76 81 86 91 96 101 106 Well EUR (MBoe) $100 / bbl $90 / bbl $80 / bbl $70 / bbl Note: Potential locations based on 20 to 40 acre spacing. Economics assume NYMEX gas strip 7/2011 and NGL price based on 50% of WTI oil price. |
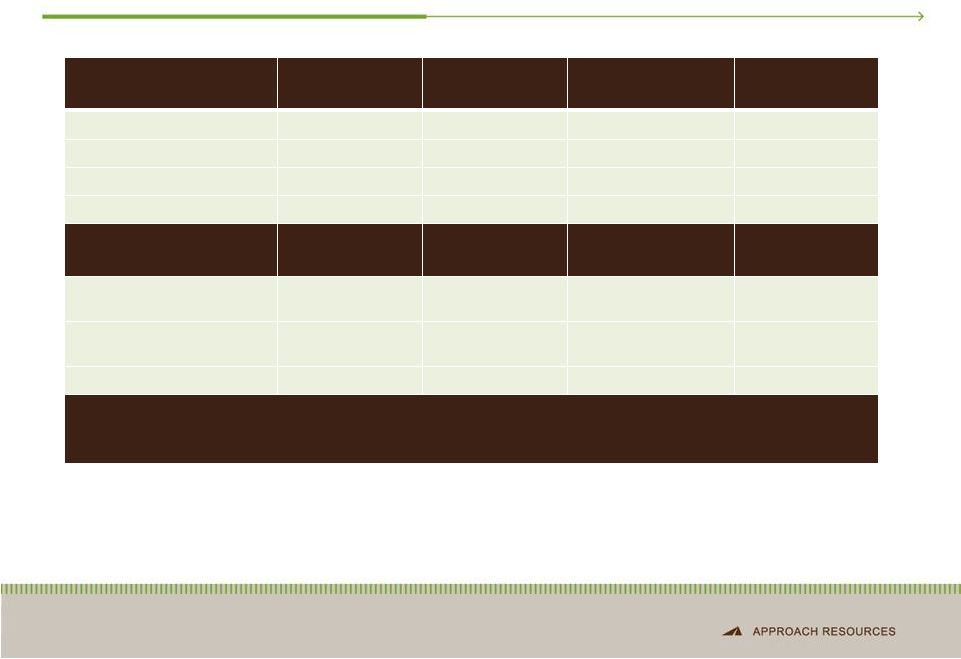 AREX Wolffork Drilling Targets & Resource Potential 18 PLAY TYPE Horizontal Wolfcamp Vertical Wolffork Vertical Wolffork Recompletion Vertical Canyon Wolffork EUR (MBoe) 450 110 93 193 Targeted well cost ($ MM) $5.5 $1.2 $0.75 $1.5 F&D ($ MM) $12.22 $10.91 $8.06 $7.77 Potential locations 500 1,825 190 440 GROSS RESOURCE POTENTIAL (MMBoe) 225 200+ 17+ 85 Target Wolfcamp Clearfork, Wolfcamp Clearfork, Wolfcamp Canyon, Clearfork, Wolfcamp Drilling depth (ft.) 7,000+ (lateral length) < 7,500 < 7,500 < 8,500 Activity (# of rigs) 2 1 2 - 4 recompl. / month — 500+ MMBoe Total Gross Resource Potential Notes: Potential locations based on 1,000-feet spacing between each horizontal well for Horizontal Wolfcamp, 20-acre spacing for Vertical Wolffork, 20 to 40 acre spacing for Vertical Wolffork Recompletions and 40-acre spacing for Vertical Canyon Wolffork. |
 Key Investor Highlights 19 • Concentrated geographic footprint focused on West Texas Midland Basin oil/liquids-rich play 145,000 net, primarily contiguous acres, 100% operated More than 595 wells drilled since 2004, with a 93%+ success rate • Strong growth track record at competitive costs Reserve and production CAGR of 41% and 46%, respectively Low-cost operator with best-in-class F&D and lifting costs • Significant growth potential from Wolfcamp / Wolffork oil shale drilling inventory 2,900+ potential drilling and recompletion locations Multiple, stacked horizontal targets Gross, unrisked resource potential totals more than 500+ MMBoe • Strong balance sheet to execute development plan $260 MM borrowing base $216 MM liquidity at 12/31/2011 Note: See “Liquidity” slide in appendix. |
 Financial Framework NON-GAAP RECONCILIATIONS |
 2012 Capital Budget 21 2012 PROGRAM 2012 Capital budget $190 MM 2 horizontal rigs, 1 vertical rig and 2 to 4 recompletions per month targeting the Wolffork oil shale Targeting 20%+ production growth 2012 production guidance 2,800 MBoe – 3,000 MBoe Key takeaways: 2012 capital program provides flexibility to develop Wolffork oil shale and monitor commodity prices and service costs Increase in liquids production drives expected increase in cash flow $260 MM borrowing base strengthens liquidity |
 2012 Operating and Financial Guidance 22 2012 GUIDANCE 2012 Guidance Production Total (MBoe) 2,800- 3,000 Percent Oil & NGLs 65% Operating costs and expenses ($/per Boe) Lease operating $ 4.50 – 5.50 Severance and production taxes $ 2.50 – 4.00 Exploration $ 4.00 – 5.00 General and administrative $ 5.25 – 6.25 Depletion, depreciation and amortization $ 12.00 – 15.00 Capital expenditures ($MM) Approximately $190 |
 Hedge Position 23 CURRENT HEDGE POSITION Commodity and Time Period Type Volume Price Crude Oil 2012 Collar 700 Bbls/d $85.00/Bbl - $97.50/Bbl 2012 Collar 500 Bbls/d $90.00/Bbl - $106.10/Bbl 2013 Collar 650 Bbls/d $90.00/Bbl - $105.80/Bbl 2014 Collar 550 Bbls/d $90.00/Bbl - $105.50/Bbl Natural Gas Liquids Natural Gasoline – February 2012 – December 2012 Swap 225 Bbls/d $95.55/Bbl Normal Butane – March 2012 – December 2012 Swap 225 Bbls/d $73.92/Bbl Natural Gas 2012 Call 230,000 MMBtu/month $6.00/MMBtu |
 Adjusted Net Income Reconciliation (unaudited) 24 The amounts included in the calculation of adjusted net income and adjusted net income per diluted share below were computed in accordance with GAAP. We believe adjusted net income and adjusted net income per diluted share are useful to investors because they provide readers with a more meaningful measure of our profitability before recording certain items whose timing or amount cannot be reasonably determined. However, these measures are provided in addition to, and not as an alternative for, and should be read in conjunction with, the information contained in our financial statements prepared in accordance with GAAP (including the notes), included in our SEC filings and posted on our website. The following table provides a reconciliation of adjusted net income to net income for the three months and year ended December 31, 2011 and 2010, respectively (in thousands, except per-share amounts). (in thousands, except per-share amounts) Year Ended December 31, 2011 2010 Net income $ 7,242 $ 7,462 Adjustments for certain items: Impairment 18,476 2,622 Unrealized loss (gain) on commodity derivatives 347 (788) Loss (gain) on sale of oil & gas properties, net of foreign currency transaction loss (248) — Related income tax effect (6,316) (623) Adjusted net income $ 19,501 $ 8,673 Adjusted net income per diluted share $ 0.67 $ 0.39 |
 EBITDAX Reconciliation (unaudited) 25 We define EBITDAX as net income, plus (1) exploration expense, (2) impairment expense, (3) depletion, depreciation and amortization expense, (4) share-based compensation expense, (5) unrealized loss (gain) on commodity derivatives, (6) loss (gain) on sale of oil and gas properties, (7) interest expense and (8) income taxes. EBITDAX is not a measure of net income or cash flow as determined by GAAP. The amounts included in the calculation of EBITDAX were computed in accordance with GAAP. EBITDAX is presented herein and reconciled to the GAAP measure of net income because of its wide acceptance by the investment community as a financial indicator of a company's ability to internally fund development and exploration activities. This measure is provided in addition to, and not as an alternative for, and should be read in conjunction with, the information contained in our financial statements prepared in accordance with GAAP (including the notes), included in our SEC filings and posted on our website. The following table provides a reconciliation of EBITDAX to net income for the three months and year ended December 31, 2011 and 2010, respectively (in thousands, except per-share amounts). (in thousands, except per-share amounts) Year Ended December 31, 2011 2010 Net income $ 7,242 $ 7,462 Exploration 9,546 2,589 Impairment 18,476 2,622 Depletion, depreciation and amortization 32,475 22,224 Share-based compensation 4,683 2,628 Unrealized loss (gain) on commodity derivatives 347 (788) Loss (gain) on sale of oil & gas properties, net of foreign currency transaction loss (248) — Interest expense, net 3,402 2,189 Income tax provision 3,488 4,100 EBITDAX $ 79,411 $ 43,026 EBITDAX per diluted share $ 2.72 $ 1.94 |
 Liquidity (unaudited) 26 (in thousands) December 31, 2011 December 31, 2010 Borrowing base $ 260,000 $ 150,000 Cash and cash equivalents 301 23,465 Long-term debt (43,800) — Unused letters of credit (350) (350) Liquidity $ 216,151 $ 173,115 Long-term debt $ 43,800 $ — Total stockholders’ equity 467,449 332,946 Total capital $ 511,249 $ 332,946 Long-term debt-to-capital 8.6% —% Liquidity is calculated by adding the net funds available under our revolving credit facility and cash and cash equivalents. We use liquidity as an indicator of the Company’s ability to fund development and exploration activities. Long-term debt-to-capital ratio is calculated as of December 31, 2011, and by dividing long-term debt (GAAP) by the sum of total stockholders’ equity (GAAP) and long-term debt (GAAP). We use the long-term debt-to-capital ratio as a measurement of our overall financial leverage. Liquidity and long-term debt-to-capital have limitations. These measurements can vary from year to year for the Company and can vary among companies based on what is or is not included in the ratio on a company’s financial statements. Both measurements are provided in addition to, and not as an alternative for, and should be read in conjunction with, the information contained in our financial statements prepared in accordance with GAAP (including the notes), included in our SEC filings and posted on our website. The table below summarizes our liquidity and long-term debt-to-capital at December 31, 2011 and 2010 (in thousands). |
 F&D Costs Reconciliation (unaudited) 27 We believe that providing measures of finding and development, or F&D, cost is useful to assist an evaluation of how much it costs the Company, on a per Boe basis, to add proved reserves. However, these measures are provided in addition to, and not as an alternative for, and should be read in conjunction with, the information contained in our financial statements prepared in accordance with GAAP (including the notes), included in our SEC filings and posted on our website. Due to various factors, including timing differences, F&D costs do not necessarily reflect precisely the costs associated with particular reserves. For example, exploration costs may be recorded in periods before the periods in which related increases in reserves are recorded and development costs may be recorded in periods after the periods in which related increases in reserves are recorded. In addition, changes in commodity prices can affect the magnitude of recorded increases (or decreases) in reserves independent of the related costs of such increases. As a result of the above factors and various factors that could materially affect the timing and amounts of future increases in reserves and the timing and amounts of future costs, including factors disclosed in our filings with the SEC, we cannot assure you that the Company’s future F&D costs will not differ materially from those set forth above. Further, the methods we use to calculate F&D costs may differ significantly from methods used by other companies to compute similar measures. As a result, our F&D costs may not be comparable to similar measures provided by other companies. The following tables reflect the reconciliation of our estimated finding and development costs to the information required by paragraphs 11 and 21 of ASC 932-235. 2011 Reserve summary (MBoe) Balance – 12/31/2010 50,715 Extensions & discoveries 25,548 Purchases 10,498 Revisions (7,448) Production (2,338) Balance – 12/31/2011 76,975 Cost summary ($M) Acquisitions $ 93,251 Exploration costs 9,991 Development costs 182,522 Total 285,764 Finding & development costs ($/Boe) All-in F&D costs $ 9.99 Drill-bit F&D cost $ 7.54 Reserve replacement ratio (%) Extensions & discoveries (MBoe) 25,548 2011 Production (MBoe) (2,338) Reserve replacement 1,093% 3-Year reserve summary (MBoe) Balance – 12/31/2008 35,178 Extensions & discoveries 34,386 Purchases 12,456 Revisions 318 Production (5,363) Balance – 12/31/2010 76,975 Finding & development costs ($/Boe) 3-year All-in F&D costs $ 10.15 3-year Drill-bit F&D cost $ 8.20 Reserve replacement ratio (%) Extensions & discoveries (MBoe) 34,386 3-year Production (MBoe) (5,363) Reserve replacement 641% Cost summary ($M) Acquisitions $ 124,584 Exploration costs 14,348 Development costs 267,559 Total $ 406,491 |
 Contact Information MEGAN P. HAYS Manager, Investor Relations & Corporate Communications 817.989.9000 x 2108 mhays@approachresources.com www.approachresources.com |