 INVESTOR PRESENTATION NOVEMBER 2012 Exhibit 99.2 |
 Forward Looking-Statements This presentation contains forward-looking statements within the meaning of Section 27A of the Securities Act of 1933 and Section 21E of the Securities Exchange Act of 1934. All statements, other than statements of historical facts, included in this presentation that address activities, events or developments that the Company expects, believes or anticipates will or may occur in the future are forward-looking statements. Without limiting the generality of the foregoing, forward-looking statements contained in this presentation specifically include the expectations of management regarding plans, strategies, objectives, anticipated financial and operating results of the Company, including as to the Company’s Wolffork shale resource play, estimated resource potential and recoverability of the oil and gas, estimated reserves and drilling locations, capital expenditures, typical well results, and well profiles, type curve, and production and operating expenses guidance included in the presentation. These statements are based on certain assumptions made by the Company based on management's experience and technical analyses, current conditions, anticipated future developments and other factors believed to be appropriate and believed to be reasonable by management. When used in this presentation, the words “will,” “potential,” “believe,” “intend,” “expect,” “may,” “should,” “anticipate,” “could,” “estimate,” “plan,” “predict,” “project,” “target,” “profile,” “model” or their negatives, other similar expressions or the statements that include those words, are intended to identify forward-looking statements, although not all forward-looking statements contain such identifying words. Such statements are subject to a number of assumptions, risks and uncertainties, many of which are beyond the control of the Company, which may cause actual results to differ materially from those implied or expressed by the forward-looking statements. In particular, careful consideration should be given to the cautionary statements and risk factors described in the Company's most recent Annual Report on Form 10-K and Quarterly Reports on Form 10-Q. Any forward-looking statement speaks only as of the date on which such statement is made and the Company undertakes no obligation to correct or update any forward-looking statement, whether as a result of new information, future events or otherwise, except as required by applicable law. 2 Cautionary Statements Regarding Oil & Gas Quantities The Securities and Exchange Commission (“SEC”) permits oil and gas companies, in their filings with the SEC, to disclose only proved, probable and possible reserves that meet the SEC’s definitions for such terms, and price and cost sensitivities for such reserves, and prohibits disclosure of resources that do not constitute such reserves. The Company uses the terms “estimated ultimate recovery” or “EUR,” reserve or resource “potential,” and other descriptions of volumes of reserves potentially recoverable through additional drilling or recovery techniques that the SEC’s rules may prohibit the Company from including in filings with the SEC. These estimates are by their nature more speculative than estimates of proved, probable and possible reserves and accordingly are subject to substantially greater risk of being actually realized by the Company. EUR estimates, potential drilling locations and resource potential estimates have not been risked by the Company. Actual locations drilled and quantities that may be ultimately recovered from the Company’s interest may differ substantially from the Company’s estimates. There is no commitment by the Company to drill all of the drilling locations that have been attributed these quantities. Factors affecting ultimate recovery include the scope of the Company’s ongoing drilling program, which will be directly affected by the availability of capital, drilling and production costs, availability of drilling and completion services and equipment, drilling results, lease expirations, regulatory approval and actual drilling results, as well as geological and mechanical factors Estimates of unproved reserves, type/decline curves, per well EUR and resource potential may change significantly as development of the Company’s oil and gas assets provides additional data. Type/decline curves, estimated EURs, resource potential, recovery factors and well costs represent Company estimates based on evaluation of petrophysical analysis, core data and well logs, well performance from limited drilling and recompletion results and seismic data, and have not been reviewed by independent engineers. These are presented as hypothetical recoveries if assumptions and estimates regarding recoverable hydrocarbons, recovery factors and costs prove correct. The Company has very limited production experience with these projects, and accordingly, such estimates may change significantly as results from more wells are evaluated. Estimates of resource potential and EURs do not constitute reserves, but constitute estimates of contingent resources which the SEC has determined are too speculative to include in SEC filings. Unless otherwise noted, IRR estimates are before taxes and assume NYMEX forward-curve oil and gas pricing and Company-generated EUR and decline curve estimates based on Company drilling and completion cost estimates that do not include land, seismic or G&A costs. |
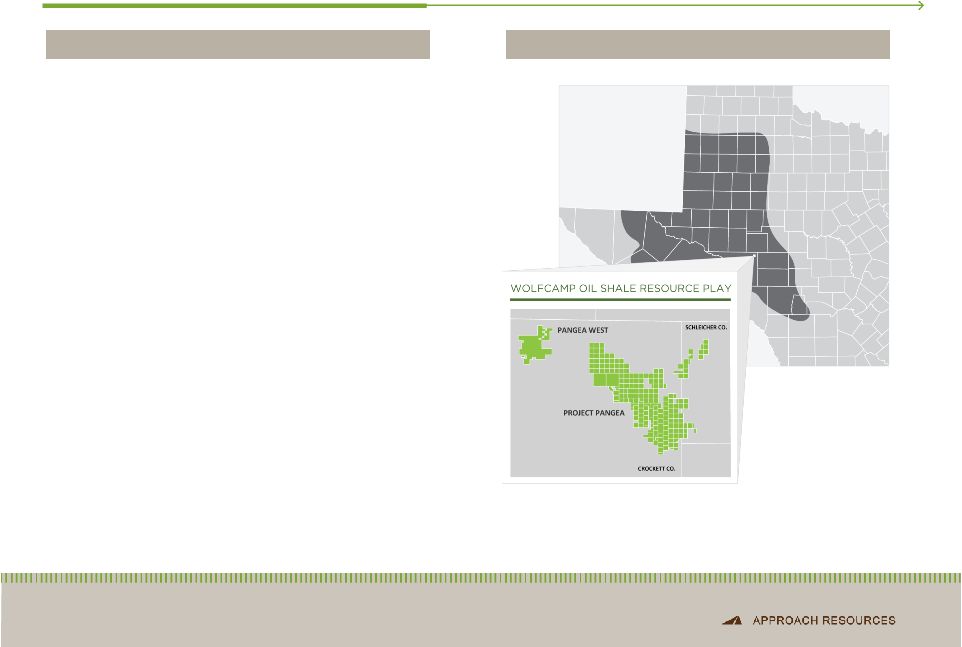 Notes: Proved reserves and acreage as of 6/30/2012 and 9/30/2012, respectively. All Boe and Mcfe calculations are based on a 6 to 1 conversion ratio. Enterprise value is equal to market capitalization using the closing share price of $25.83 per share on 11/1/2012, plus net debt as of 9/30/2012. Company Overview • Enterprise value $1.2 BN • High quality reserve base • Permian core operating area 167,000 gross (148,000 net) acres 500+ MMBoe gross, unrisked resource potential 2,900+ drilling and recompletion opportunities • Oil-driven growth in 3Q 2012 3Q’12 Production 8.1 MBoe/d, 65% oil & NGLs 3Q’12 Revenue mix 65% oil, 22% NGLs and 13% natural gas 3 AREX OVERVIEW ASSET OVERVIEW 83.7 MMBoe proved reserves, 37% PD 99% Permian Basin |
 Oil-Focused, Pure-Play • Transitioning Wolfcamp B to development mode and preparing for full-scale exploitation • Pilot program evaluating additional Wolfcamp zones (A and C benches) • Adding 3 horizontal rig in January 2013 • Concentrated geographic footprint in the southern Midland Basin • 148,000 net, primarily contiguous acres, 100% operated • 64% of proved reserves are oil and NGLs Track Record of Growth at Low Costs Accelerating Horizontal Wolfcamp Development • Reserve and production CAGR since 2004 of 33% and 37%, respectively • Low-cost operator with best-in-class F&D and low lifting costs • $280 MM borrowing base • $222.9 MM liquidity at 9/30/12 Strong Balance Sheet Multi-Year Drilling Inventory and Significant Resource Potential • 2,900+ identified drilling and recompletion locations • 500+ MMBoe of gross, unrisked resource potential • Rigorous pilot program has de-risked ~100,000 gross acres • Additional upside potential from tighter well spacing and multi-zone development Key Investor Highlights 4 STRENGTHS HIGHLIGHTS Note: See liquidity calculation in appendix. rd |
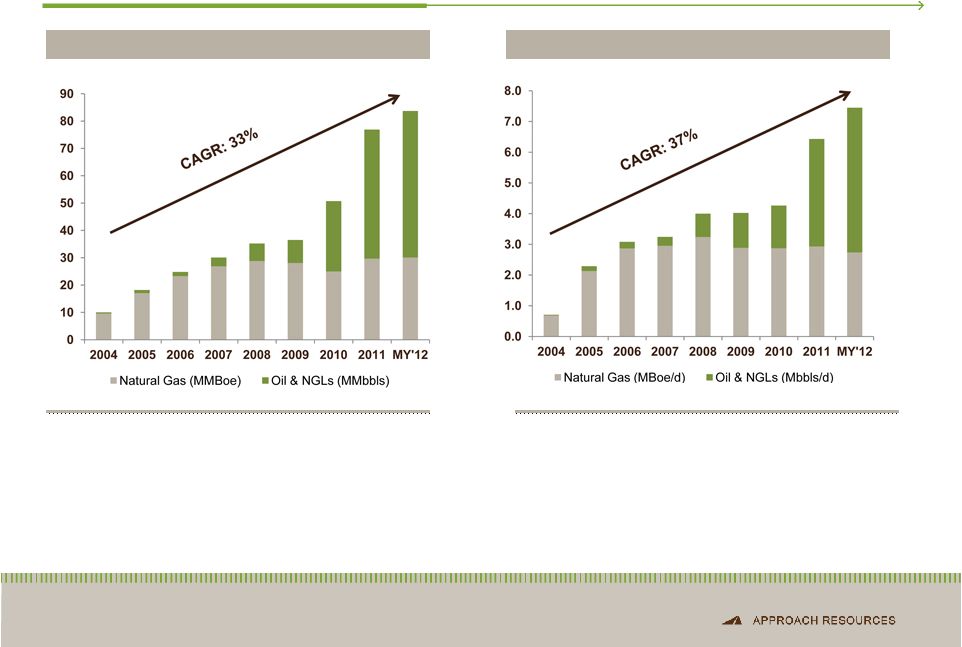 Track Record of Reserve and Production Growth • MY’12 reserves up 25% YoY and 9% over YE’11 Oil reserves up 30% to 23.5 MMbbls • Wolfcamp Shale key contributor to reserve growth 500+ MMBoe gross, unrisked resource potential 5 RESERVE GROWTH PRODUCTION GROWTH • 2011 production increased 50% YoY • Targeting 20% to 24% production growth in 2012 • Strong liquids production growth 2012E production 65% liquids |
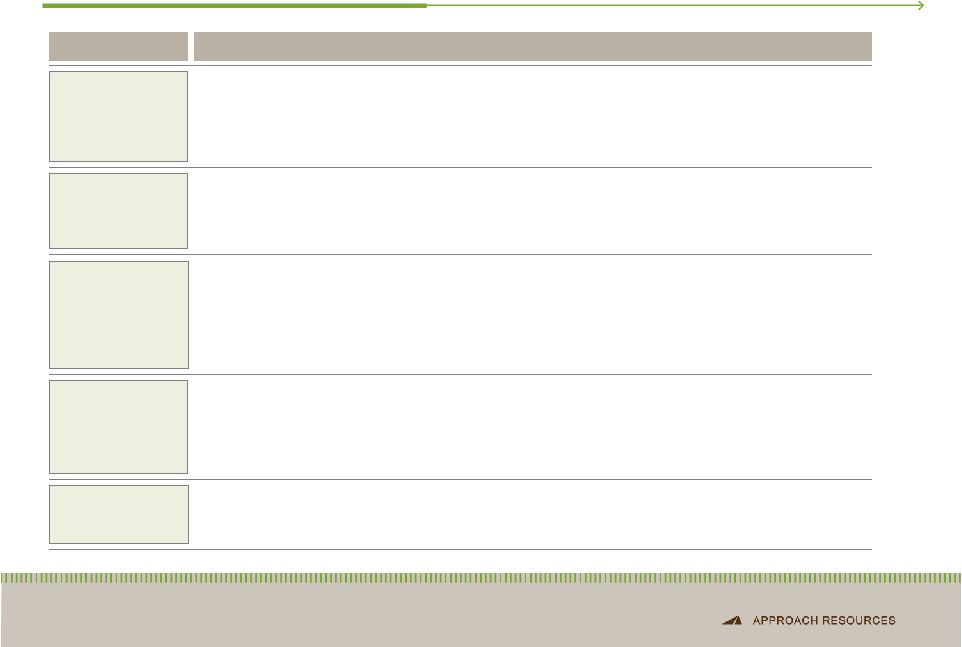
 Extensive Inventory of Future Drilling Locations 6 POTENTIAL DRILLING LOCATIONS Gross Resource Potential (MMBoe): 225 200+ 17+ 85 500+ 500+ MMBoe Total Gross Resource Potential |
 2012 & 2013 Capital Programs 7 • Horizontal Wolfcamp 2 horizontal rigs Beginning development program of B zone Testing A & C zones • Vertical Clearfork & Wolfcamp 2012 PROGRAM OVERVIEW 2012 Capital Program $295 MM • Horizontal Wolfcamp 3 horizontal rigs to drill 35 to 40 wells • Vertical Clearfork & Wolfcamp 2013 PROGRAM OVERVIEW 2013 Capital Program $260 MM 1 vertical rig and recompletion program 1 vertical rig to drill 12 wells Recompletion program |
 Infrastructure & Equipment Projects 8 • Safely and securely transport water across Project Pangea and Pangea West • Reduce time and money spent on water hauling and disposal and truck traffic • Expected savings from water transfer equipment ~$0.1 MM/HZ well • Expected savings from SWD system ~$0.45 MM/HZ well • Expected company-wide LOE savings ±$0.4 MM per month • Replace rental equipment and contractors with Company-owned and operated equipment and personnel; reduce money spent on flowback operations • Expected savings from flowback equipment ~$0.1 MM/HZ well • Expected LOE savings from gas lift system $6,300/HZ per month • Facilitate large-scale field development • Reduce fresh water use and water costs • Expected savings from non-potable water source ~$0.45 MM/HZ well • Efficiently transport crude oil to market and reduce inventory • Reduce oil transportation differential to an estimated $2.50/Bbl – $4.00/Bbl Purchasing and installing water transfer equipment Drilling and/or converting SWD wells Purchasing and installing flowback equipment Securing water supply Testing non-potable water and recycling flowback water Installing crude takeaway lines Purchased oil hauling trucks PROJECTS BENEFITS Infrastructure and equipment projects are key to large-scale field development and to reducing D&C costs as well as LOE cost |
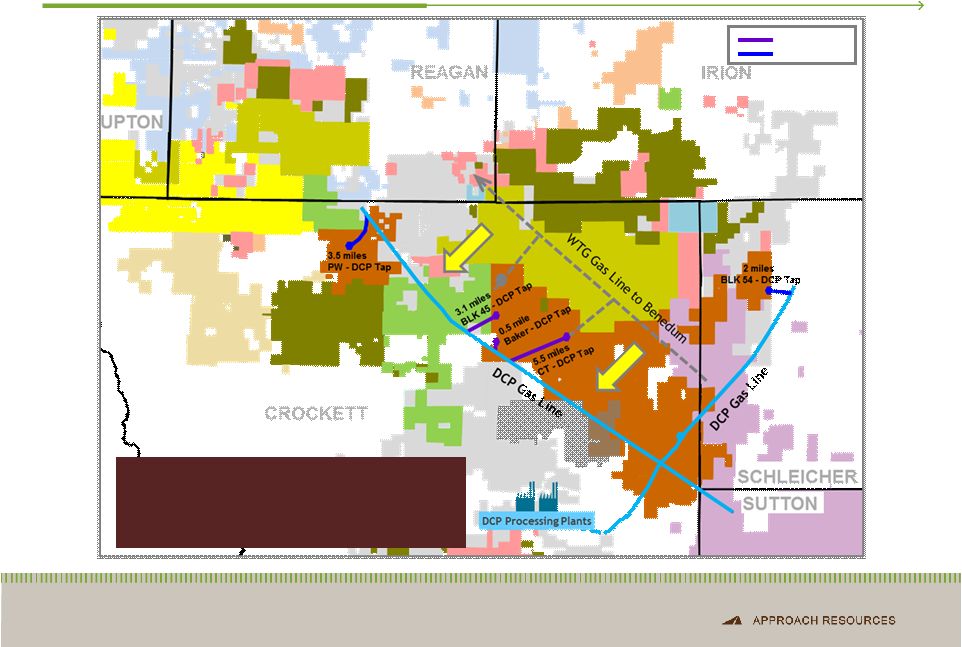 Infrastructure Projects – Gathering Lines & Facilities 9 Existing Line New Line • Building new gathering lines • New lines to transport AREX gas to DCP Gas Line • Market gas/NGLs to DCP • Improved economics • Increased capacity |
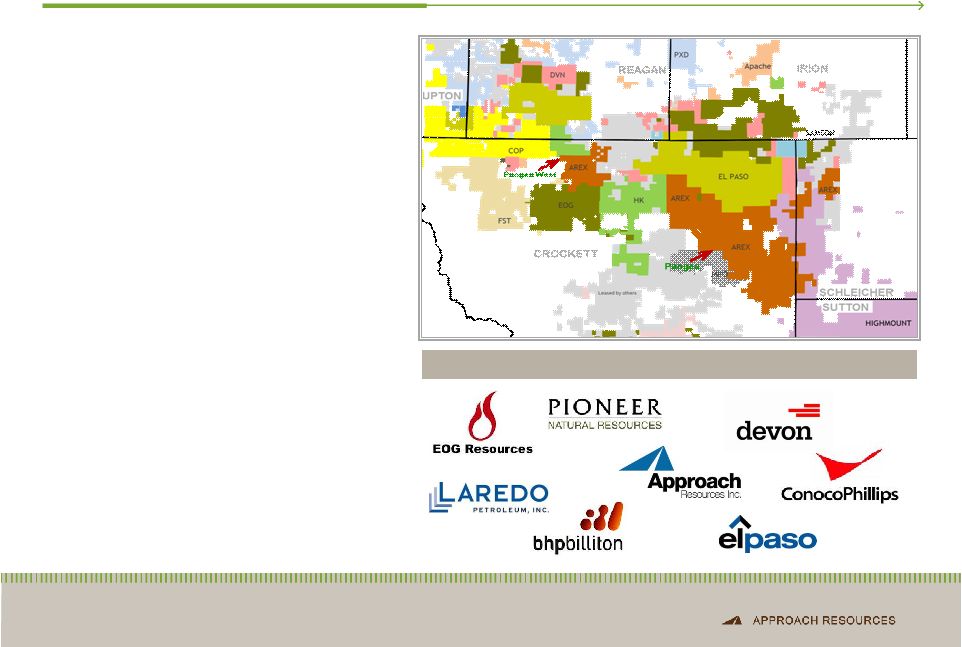 AREX Wolfcamp Oil Shale Resource Play 10 Large, primarily contiguous acreage position Liquids-rich, multiple pay zones 167,000 gross (148,000 net) acres Low acreage cost ~$500 per acre 2,900+ drilling and recompletion opportunities Transitioning Wolfcamp B to development mode Testing Wolfcamp A and C Testing tighter well spacing Preparing field for large-scale development Broad industry participation de-risking play ACTIVE PARTICIPANTS IN THE PLAY 500+ MMBoe gross, unrisked resource potential Early-stage play development |
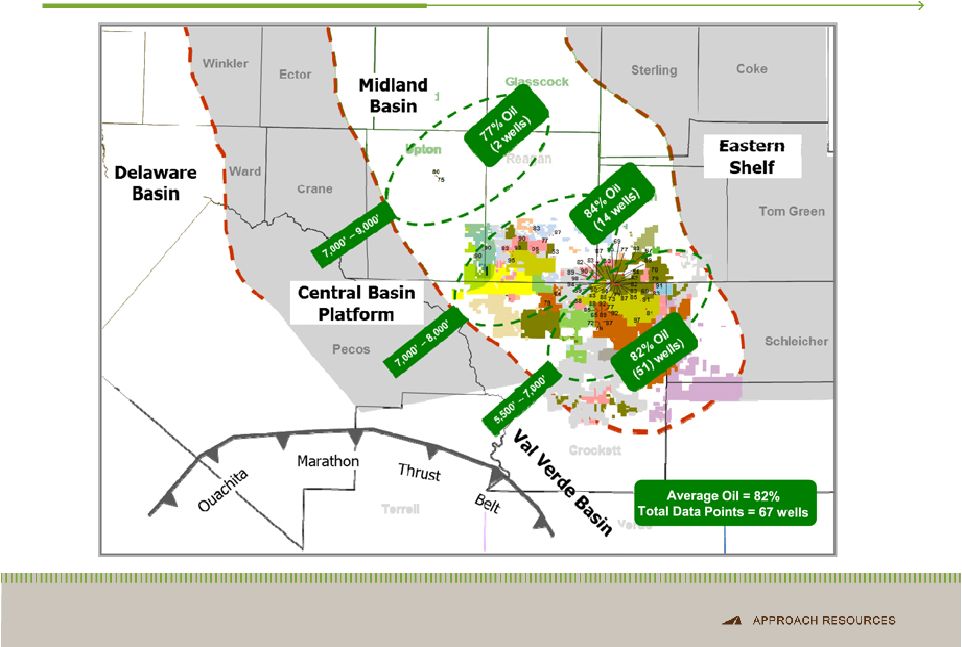
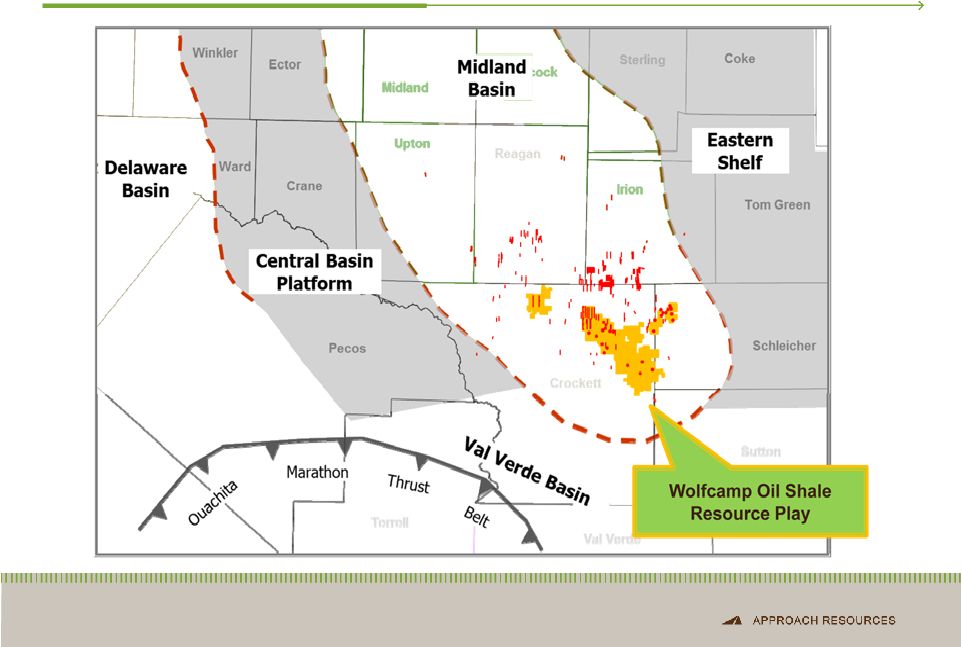 AREX Wolfcamp Play Favorably Located in the S. Midland Basin 11 |
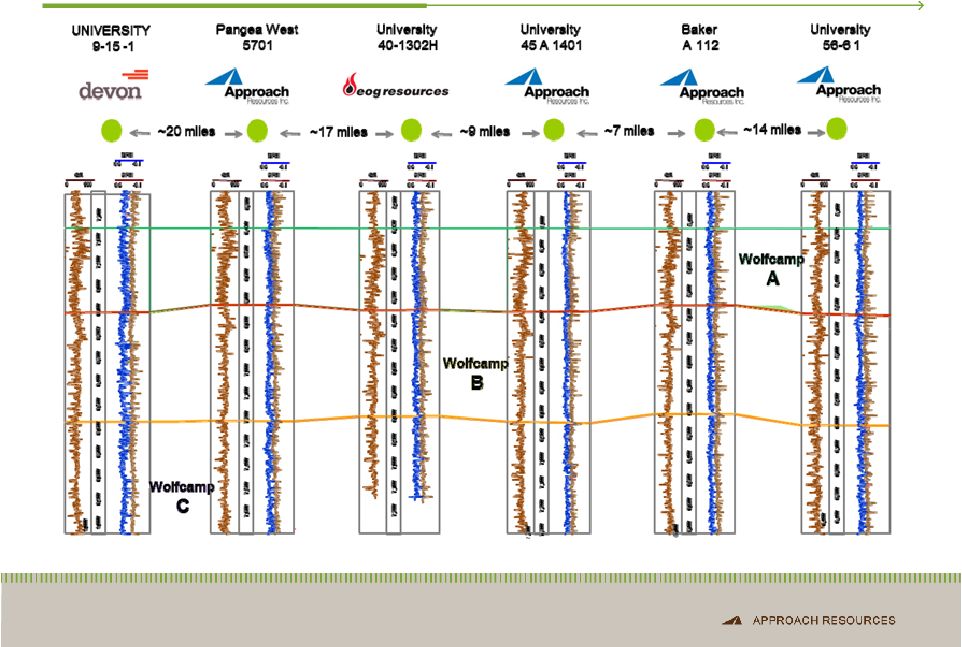 12 Wolfcamp Oil Shale Play – Widespread, Thick, Consistent & Repeatable |
 Horizontal Wolfcamp Targets 13 SYSTEM STRATIGRAPHIC UNIT Permian Clearfork/Spraberry Dean Wolfcamp Pennsylvanian Canyon Strawn Mississippian Devonian Silurian Ordovician Ellenburger WOLFCAMP A WOLFCAMP B WOLFCAMP C WOLFCAMP D Pilot Transitioning to Development Pilot – Recent Results Encouraging Under Evaluation POTENTIAL HORIZONTAL WOLFCAMP TARGETS |
 14 Horizontal Wolfcamp Play - 82% of IP is Oil Source: Publicly available regulatory filings, company presentations. |
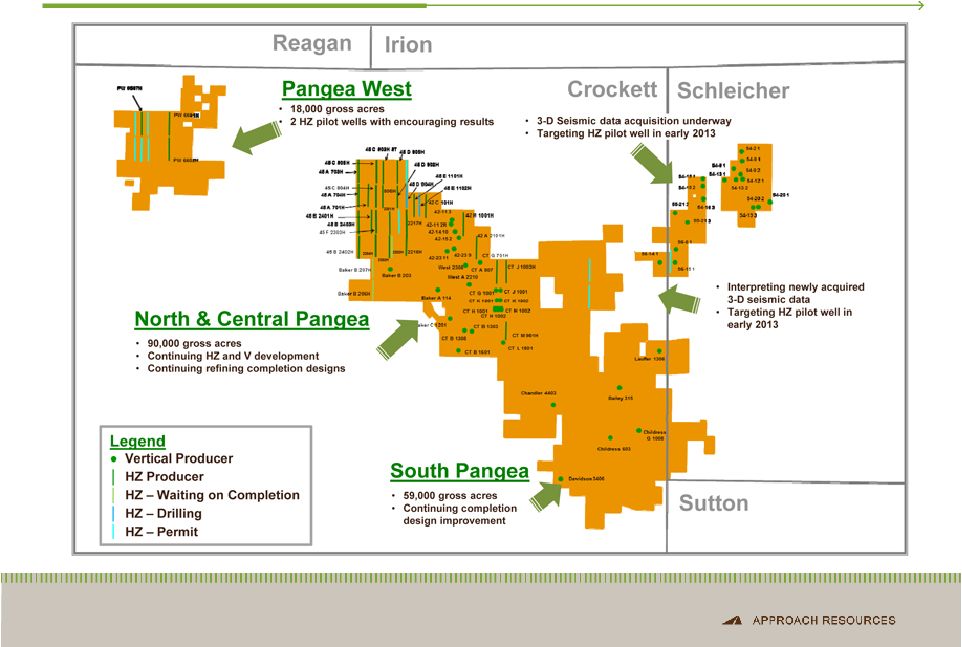 AREX Wolfcamp Play – Activity Map 15 Note: Acreage as of 9/30/2012. |
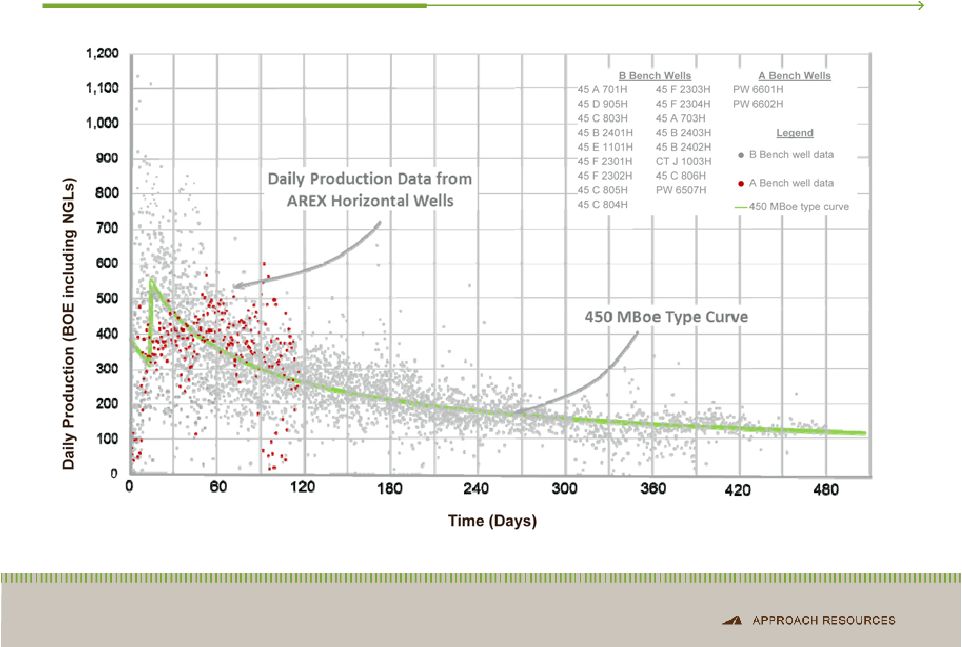 Horizontal Wolfcamp Type Curve 16 |
 Horizontal Wolfcamp Economics 17 Play Type Horizontal Wolfcamp Avg. EUR 450 MBoe Targeted Well Cost $5.5 MM Potential Locations 500 Gross Resource Potential 225 MMBoe BTAX IRR SENSITIVITIES Notes: IP’s based on 24-hr. rates. Potential locations are based on 1,000-feet spacing between each horizontal well. Economics assume NYMEX gas strip and NGL price based on 40% of WTI oil price. • Horizontal drilling improves recoveries and returns • Multiple, stacked horizontal targets • 7,000’+ lateral length • ~80% of EUR made up of oil and NGLs • 2 HZ rigs running in Project Pangea / Pangea West • Adding 3 rd HZ rig in January 2013 • Recent Wolfcamp B bench well results in Project Pangea • 922 BOEPD IP for U 45 C 806H (93% oil) • Recent Wolfcamp A bench well result in Project Pangea • 689 BOEPD IP for U 45 D 905H (90% oil) |
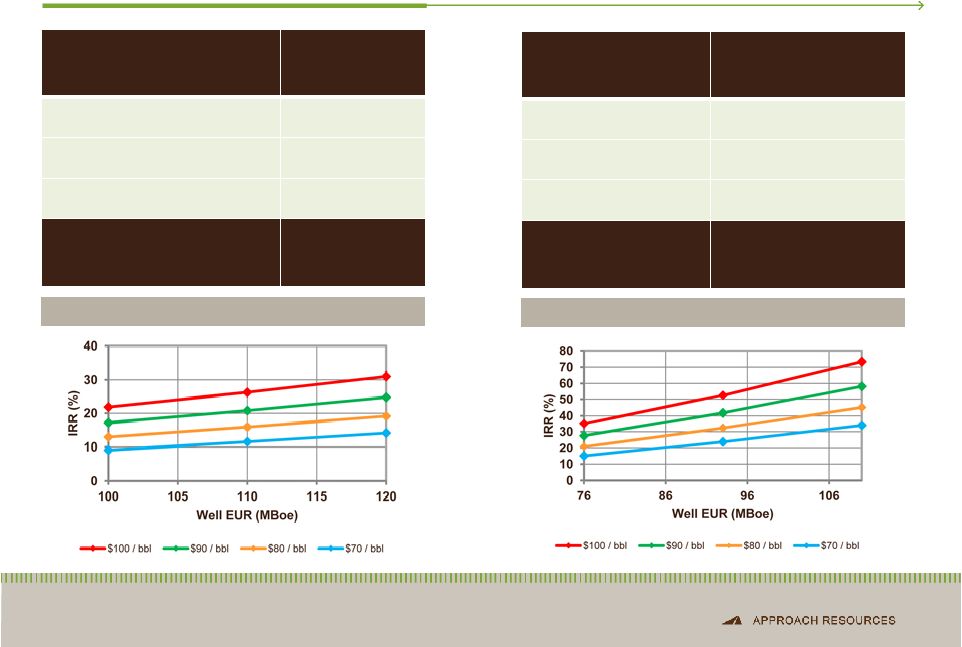 Clearfork & Wolfcamp (“Wolffork”) Economics 18 Play Type Vertical Wolffork Avg. EUR 110 MBoe Targeted Well Cost $1.2 MM Potential Locations 1,825 Gross Resource Potential 200+ MMBoe BTAX IRR SENSITIVITIES Notes: Vertical Wolffork potential locations based on 20-acre spacing. Vertical Wolffork recompletion potential locations based on 20 to 40-acre spacing. Economics assume NYMEX gas strip and NGL price based on 40% of WTI oil price. Play Type Vertical Wolffork Recompletion Avg. EUR 93 MBoe Targeted Well Cost $0.75 MM Potential Locations 190 Gross Resource Potential 17+ MMBoe BTAX IRR SENSITIVITIES |
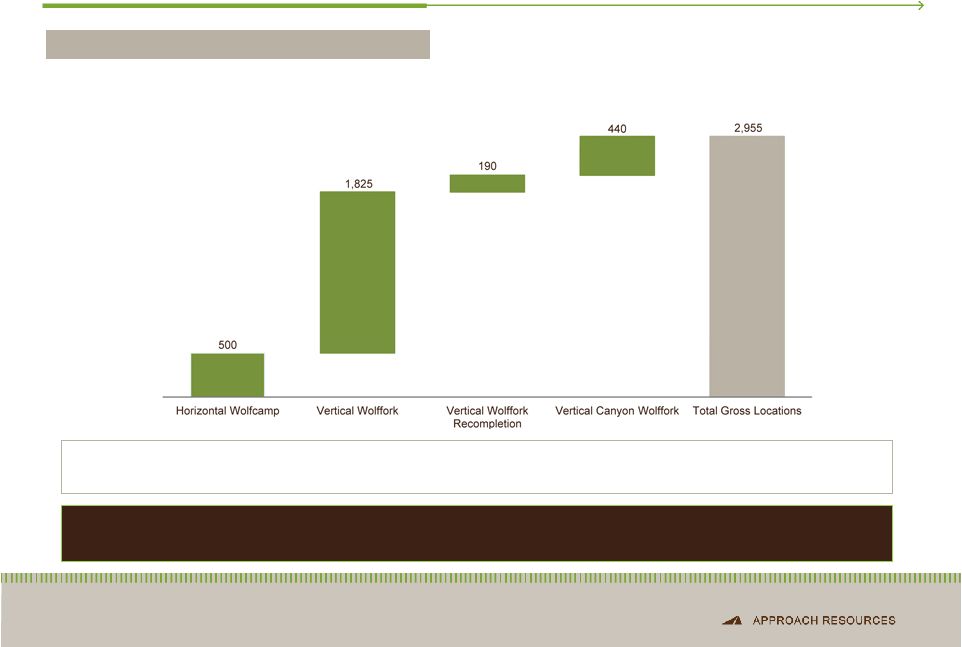
 AREX Drilling Targets & Resource Potential 19 PLAY TYPE Horizontal Wolfcamp Vertical Wolffork Vertical Wolffork Recompletion Vertical Canyon Wolffork EUR (MBoe) 450 110 93 193 Targeted well cost ($MM) $5.5 $1.2 $0.75 $1.5 Potential locations 500 1,825 190 440 GROSS RESOURCE POTENTIAL (MMBoe) 225 200+ 17+ 85 Target Wolfcamp Clearfork, Wolfcamp Clearfork, Wolfcamp Canyon, Clearfork, Wolfcamp Drilling depth (ft.) 7,000+ (lateral length) < 7,500 < 7,500 < 8,500 500+ MMBoe Total Gross Resource Potential Notes: Potential locations based on 1,000-feet spacing between each horizontal well for Horizontal Wolfcamp, 20-acre spacing for Vertical Wolffork, 20 to 40- acre spacing for Vertical Wolffork Recompletion and 40-acre spacing for Vertical Canyon Wolffork. |
 Creating Value Through Growth 20 • Concentrated geographic footprint in the southern Midland Basin • Strong growth track record at competitive costs • Detailed technical evaluation led to discovery of significant growth potential in the Wolfcamp / Wolffork oil shale resource play • Rigorous pilot program de-risked ~100,000 gross acres • Capital discipline for Wolfcamp / Wolffork program acceleration |
 Financial Framework NON-GAAP RECONCILIATIONS |
 2012 Operating and Financial Guidance 22 2012 GUIDANCE 2012 Guidance Production Total (MBoe) 2,800 - 3,000 Percent Oil & NGLs 65% Operating costs and expenses ($/per Boe) Lease operating $ 6.50 – 7.50 Severance and production taxes $ 2.50 – 4.00 Exploration $ 4.00 – 5.00 General and administrative $ 7.00 – 8.00 Depletion, depreciation and amortization $ 18.00 – 22.00 Capital expenditures ($MM) Approximately $295 |
 Hedge Position 23 CURRENT HEDGE POSITION Commodity and Time Period Type Volume Price Crude Oil 2012 Collar 700 Bbls/d $85.00/Bbl - $97.50/Bbl 2012 Collar 500 Bbls/d $90.00/Bbl - $106.10/Bbl September 2012 – December 2012 Collar 350 Bbls/d $90.00/Bbl - $102.30/Bbl 2013 Collar 650 Bbls/d $90.00/Bbl - $105.80/Bbl 2013 Collar 450 Bbls/d $90.00/Bbl - $101.45/Bbl 2014 Collar 550 Bbls/d $90.00/Bbl - $105.50/Bbl Natural Gas Liquids Natural Gasoline – February 2012 – December 2012 Swap 225 Bbls/d $95.55/Bbl Normal Butane – March 2012 – December 2012 Swap 225 Bbls/d $73.92/Bbl Natural Gas 2012 Call 230,000 MMBtu/month $6.00/MMBtu July 2012 – December 2012 Swap 360,000 MMBtu/month $2.70/MMBtu 2013 Swap 200,000 MMBtu/month $3.54/MMBtu 2013 Swap 190,000 MMBtu/month $3.80/MMBtu |
 Financial Strength 24 Liquidity (unaudited) is calculated by adding the net funds available under our revolving credit facility and cash and cash equivalents. We use liquidity as an indicator of the Company’s ability to fund development and exploration activities. Liquidity has limitations, and can vary from year to year for the Company and can vary among companies based on what is or is not included in the measurement on a company’s financial statements. Liquidity is provided in addition to, and not as an alternative for, and should be read in conjunction with, the information contained in our financial statements prepared in accordance with GAAP (including the notes), included in our SEC filings and posted on our website. The table below summarizes our liquidity at September 30, 2012. (in thousands) Liquidity at September 30, 2012 Borrowing base $ 270,000 Cash and cash equivalents 841 Long-term debt (47,600) Unused letters of credit (350) Liquidity $ 222,891 Long-term debt-to-capital ratio (unaudited) is calculated as of September 30, 2012, and by dividing long-term debt (GAAP) by the sum of total stockholders’ equity (GAAP) and long-term debt (GAAP). We use the long-term debt-to-capital ratio as a measurement of our overall financial leverage. However, this ratio has limitations. This ratio can vary from year-to-year for the Company and can vary among companies based on what is or is not included in the ratio on a company’s financial statements. This ratio is provided in addition to, and not as an alternative for, and should be read in conjunction with, the information contained in our financial statements prepared in accordance with GAAP (including the notes), included in our SEC filings and posted on our website. The table below summarizes our long-term debt-to-capital ratio at September 30, 2012. (in thousands) September 30, 2012 Long-term debt $ 47,600 Total stockholders’ equity 624,341 671,941 Long-term debt-to-capital 7.1% |
 Contact Information MEGAN P. HAYS Manager, Investor Relations & Corporate Communications 817.989.9000 x 2108 mhays@approachresources.com www.approachresources.com |