 Approach Resources Inc. FULL YEAR & FOURTH QUARTER 2012 RESULTS FEBRUARY 21, 2013 Exhibit 99.2 |
 Forward-Looking Statements 2 Cautionary Statements Regarding Oil & Gas Quantities This presentation contains forward-looking statements within the meaning of Section 27A of the Securities Act of 1933 and Section 21E of the Securities Exchange Act of 1934. All statements, other than statements of historical facts, included in this presentation that address activities, events or developments that the Company expects, believes or anticipates will or may occur in the future are forward-looking statements. Without limiting the generality of the foregoing, forward-looking statements contained in this presentation specifically include the expectations of management regarding plans, strategies, objectives, anticipated financial and operating results of the Company, including as to the Company’s Wolfcamp shale resource play, estimated resource potential and recoverability of the oil and gas, estimated reserves and drilling locations, capital expenditures, typical well results and well profiles, type curve, and production and operating expenses guidance included in the presentation. These statements are based on certain assumptions made by the Company based on management's experience and technical analyses, current conditions, anticipated future developments and other factors believed to be appropriate and believed to be reasonable by management. When used in this presentation, the words “will,” “potential,” “believe,” “intend,” “expect,” “may,” “should,” “anticipate,” “could,” “estimate,” “plan,” “predict,” “project,” “target,” “profile,” “model” or their negatives, other similar expressions or the statements that include those words, are intended to identify forward-looking statements, although not all forward-looking statements contain such identifying words. Such statements are subject to a number of assumptions, risks and uncertainties, many of which are beyond the control of the Company, which may cause actual results to differ materially from those implied or expressed by the forward-looking statements. In particular, careful consideration should be given to the cautionary statements and risk factors described in the Company's most recent Annual Report on Form 10-K and Quarterly Reports on Form 10-Q. Any forward-looking statement speaks only as of the date on which such statement is made and the Company undertakes no obligation to correct or update any forward-looking statement, whether as a result of new information, future events or otherwise, except as required by applicable law. The Securities and Exchange Commission (“SEC”) permits oil and gas companies, in their filings with the SEC, to disclose only proved, probable and possible reserves that meet the SEC’s definitions for such terms, and price and cost sensitivities for such reserves, and prohibits disclosure of resources that do not constitute such reserves. The Company uses the terms “estimated ultimate recovery” or “EUR,” reserve or resource “potential,” and other descriptions of volumes of reserves potentially recoverable through additional drilling or recovery techniques that the SEC’s rules may prohibit the Company from including in filings with the SEC. These estimates are by their nature more speculative than estimates of proved, probable and possible reserves and accordingly are subject to substantially greater risk of being actually realized by the Company. EUR estimates, identified drilling locations and resource potential estimates have not been risked by the Company. Actual locations drilled and quantities that may be ultimately recovered from the Company’s interest may differ substantially from the Company’s estimates. There is no commitment by the Company to drill all of the drilling locations that have been attributed these quantities. Factors affecting ultimate recovery include the scope of the Company’s ongoing drilling program, which will be directly affected by the availability of capital, drilling and production costs, availability of drilling and completion services and equipment, drilling results, lease expirations, regulatory approval and actual drilling results, as well as geological and mechanical factors Estimates of unproved reserves, type/decline curves, per well EUR and resource potential may change significantly as development of the Company’s oil and gas assets provides additional data. Type/decline curves, estimated EURs, resource potential, recovery factors and well costs represent Company estimates based on evaluation of petrophysical analysis, core data and well logs, well performance from limited drilling and recompletion results and seismic data, and have not been reviewed by independent engineers. These are presented as hypothetical recoveries if assumptions and estimates regarding recoverable hydrocarbons, recovery factors and costs prove correct. The Company has very limited production experience with these projects, and accordingly, such estimates may change significantly as results from more wells are evaluated. Estimates of resource potential and EURs do not constitute reserves, but constitute estimates of contingent resources which the SEC has determined are too speculative to include in SEC filings. Unless otherwise noted, IRR estimates are before taxes and assume NYMEX forward-curve oil and gas pricing and Company-generated EUR and decline curve estimates based on Company drilling and completion cost estimates that do not include land, seismic or G&A costs. |
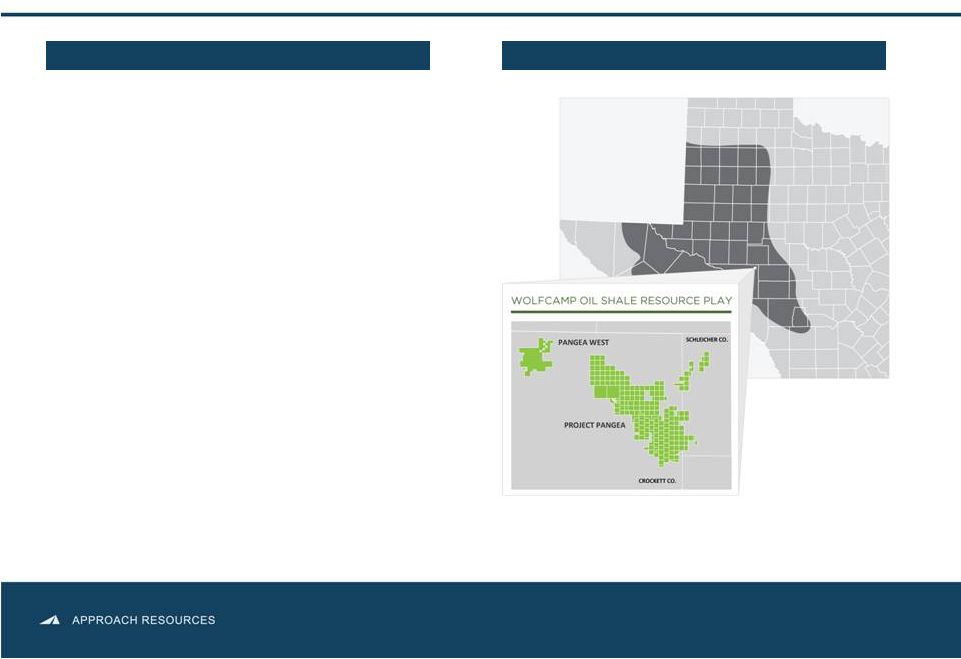 Company Overview 3 AREX OVERVIEW ASSET OVERVIEW Notes: Proved reserves and acreage as of 12/31/2012. All Boe and Mcfe calculations are based on a 6 to 1 conversion ratio. Enterprise value is equal to market capitalization using the closing share price of $24.47 per share on 2/15/2013, plus net debt as of 12/31/2012. • Enterprise value $1.1 BN • High quality reserve base • Permian core operating area • 2013 capital program of $260 MM Running 3 HZ rigs in the Wolfcamp shale play Targeting 30%+ production growth 167,000 gross (148,000 net) acres 1+ BnBoe gross, unrisked resource potential 2,000+ Identified HZ drilling locations targeting the Wolfcamp oil shale play 95.5 MMBoe proved reserves 99% Permian Basin |
 2012 Financial Highlights 4 REVENUES, EARNINGS & CASH FLOW BALANCE SHEET & LIQUIDITY • Revenues of $128.9 MM in 2012 vs. $108.4 MM in 2011 • Net income of $6.4 MM or $0.18 per diluted share • Cash flow from operating activities of $90.6 MM • Borrowing base of $280.0 MM • YE’12 debt of $106.0 MM • YE’12 liquidity of $174.4 MM Long-term debt-to-capital of 14.3% Adjusted net income (non-GAAP) of $3.8 MM or $0.11 per diluted share EBITDAX (non-GAAP) of $83.0 MM or $2.37 per diluted share Notes: See “Adjusted Net Income,” “EBITDAX” and “Liquidity” slides in appendix. |
 2012 Highlights • Oil-driven reserves growth • Oil-driven production growth • Competitive reserve replacement and finding costs • Horizontal Wolfcamp delivering strong results, well costs coming down 5 • Delineated 107,000 gross acres • Transitioned Wolfcamp “B” to development mode • 2H’12 average D&C cost approx. $6.4 MM • Expect to achieve target D&C cost of $5.5 MM in 2Q’13 • Drill-bit reserve replacement of 1,346% • Drill-bit finding and development cost of $7.45/Boe • Production totaled 7.9 MBoe/d, up 24% over 2011 and hit the mid-point of guidance range • Oil production doubled from 2011 to 969 MBbls • Oil production has tripled since 2009 • YE’12 proved reserves total 95.5 MMBoe, up 24% over YE’11 • Oil proved reserves total 37.3 MMBbls, up 106% over YE’11 Notes: See “F&D Costs Reconciliation” slide in appendix. |
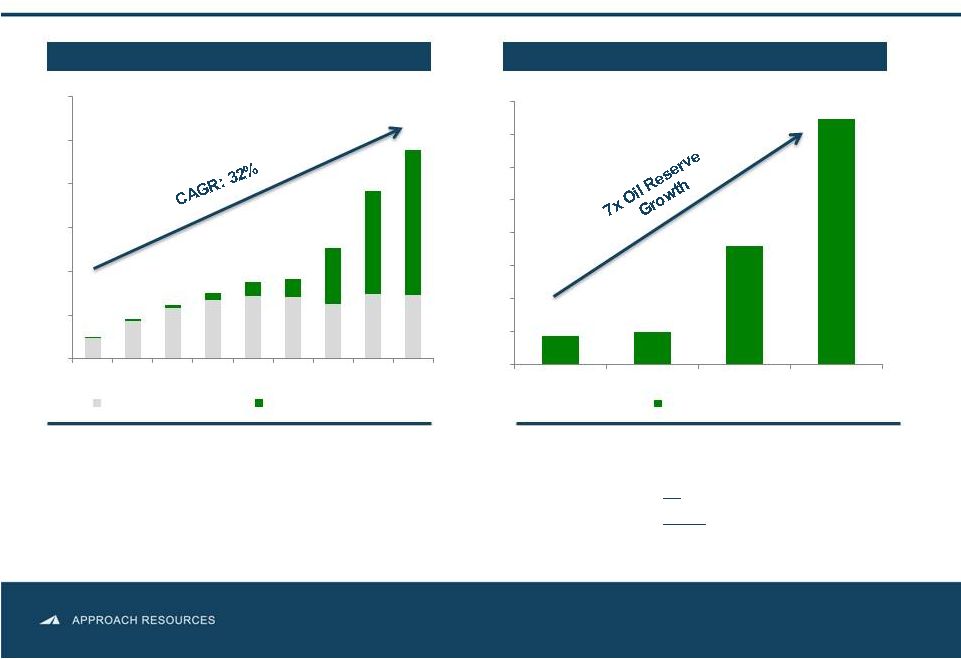 Reserve Growth 6 RESERVE GROWTH OIL RESERVE GROWTH • YE’12 reserves up 24% YoY • Replaced 1,346% of reserves at a drill-bit F&D cost of $7.45/Boe • 60.1 MMBoe proved reserves booked to Wolffork/Wolfcamp oil shale play • Strong organic reserve growth driven by oil from horizontal Wolfcamp shale • Oil reserves up 7x since YE’09 • Oil reserves up 106% YoY Launched Wolfcamp Study Announced Vertical Wolfcamp Pilot Results Began HZ Wolfcamp Pilot Program Strong HZ Wolfcamp Results; Prepare for Large-Scale Development Notes: See “F&D Costs Reconciliation” slide in appendix. 0 20 40 60 80 100 120 2004 2005 2006 2007 2008 2009 2010 2011 2012 Natural Gas (MMBoe) Oil & NGLs (MMbbls) 0 5 10 15 20 25 30 35 40 2009 2010 2011 2012 Oil (MBbls) |
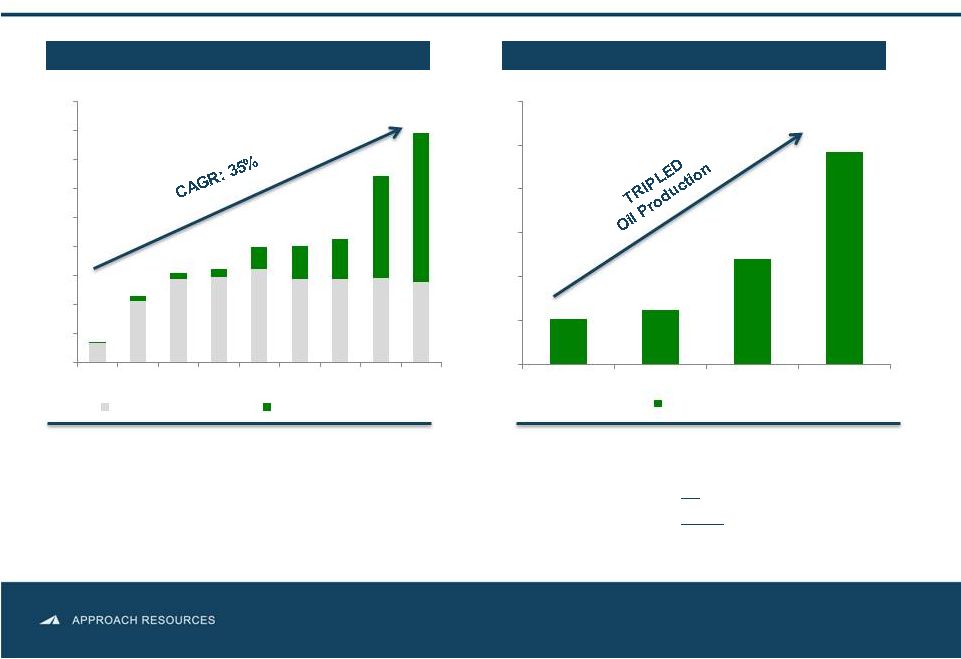 Production Growth 7 PRODUCTION GROWTH OIL PRODUCTION GROWTH • 2012 production increased 24% YoY • Targeting 30%+ production growth in 2013 3.6 MMBoe – 3.9 MMBoe in 2013 2013E Production mix ~70% liquids • Strong organic production growth driven by oil from horizontal Wolfcamp shale • Oil production up 3x since 2009 • Oil production up 101% over 2011 0.0 1.0 2.0 3.0 4.0 5.0 6.0 7.0 8.0 9.0 2004 2005 2006 2007 2008 2009 2010 2011 2012 Natural Gas (MBoe/d) Oil & NGLs (Mbbls/d) 0 200 400 600 800 1000 1200 2009 2010 2011 2012 Oil (MBbls) |
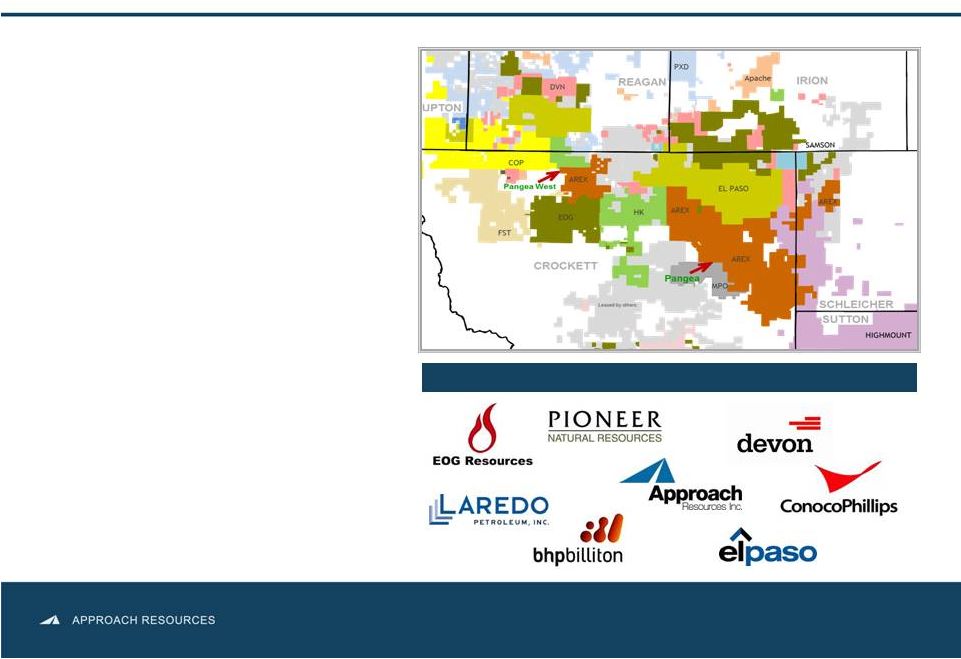 AREX Wolfcamp Oil Shale Resource Play 8 ACTIVE PARTICIPANTS IN THE PLAY Large, primarily contiguous acreage position Oil-rich, multiple pay zones 167,000 gross (148,000 net) acres Low acreage cost ~$500 per acre Source: Rig data from Scotia Waterous. HZ Wolfcamp resource potential up 300%+ 940+ MMBoe gross, unrisked resource potential 2,096 Identified HZ Wolfcamp locations targeting 2013 Operations Plan to drill ~ 35 to 40 HZ wells with 3 rigs Testing “stacked-lateral” development and tighter well spacing Decrease well costs and increase efficiencies when field infrastructure projects are completed 42 HZ Wolfcamp shale rigs as of September 2012 Broad industry participation de-risking play the Wolfcamp A, B & C |
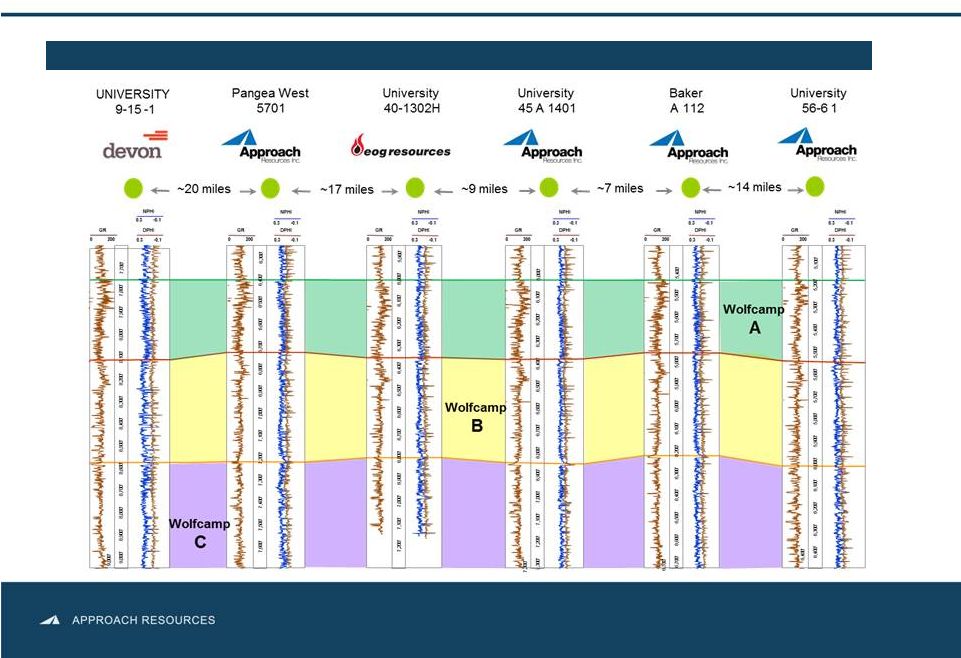 Wolfcamp Oil Shale Play 9 WOLFCAMP SHALE – WIDESPREAD, THICK, CONSISTENT & REPEATABLE |
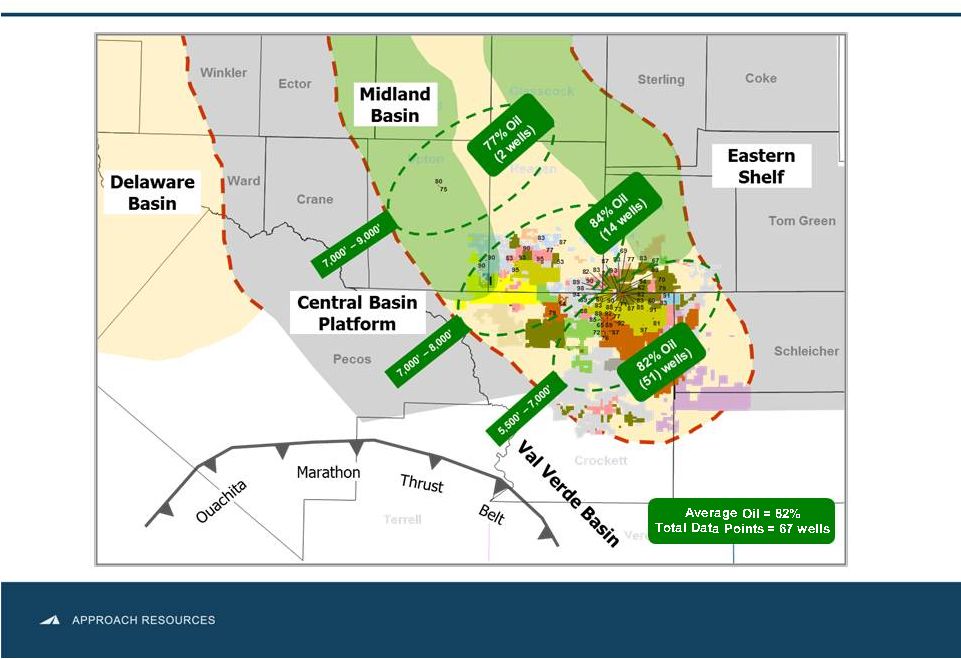 Horizontal Wolfcamp – 82% of IP is Oil 10 Source: Publicly available regulatory filings, company presentations. |
 AREX HZ Wolfcamp Activity 11 Notes: Acreage as of 12/31/2012. Pangea West North & Central Pangea South Pangea • 18,000 gross acres • Pad drilling with A/B and A/C “stacked” laterals Schleicher Crockett Irion Reagan • 59,000 gross acres • Continuing completion design improvement • 90,000 gross acres • Pad drilling with A/B and A/C “stacked” laterals • North Pangea infrastructure in place in 2Q’13 Sutton • 3-D Seismic acquisition completed. Data processing in progress • Targeting HZ pilot well in 2Q’13 • 3-D seismic interpretation completed • Drilling HZ pilot well HZ – Permit Legend Vertical Producer HZ Producer HZ – Waiting on Completion HZ – Drilling |
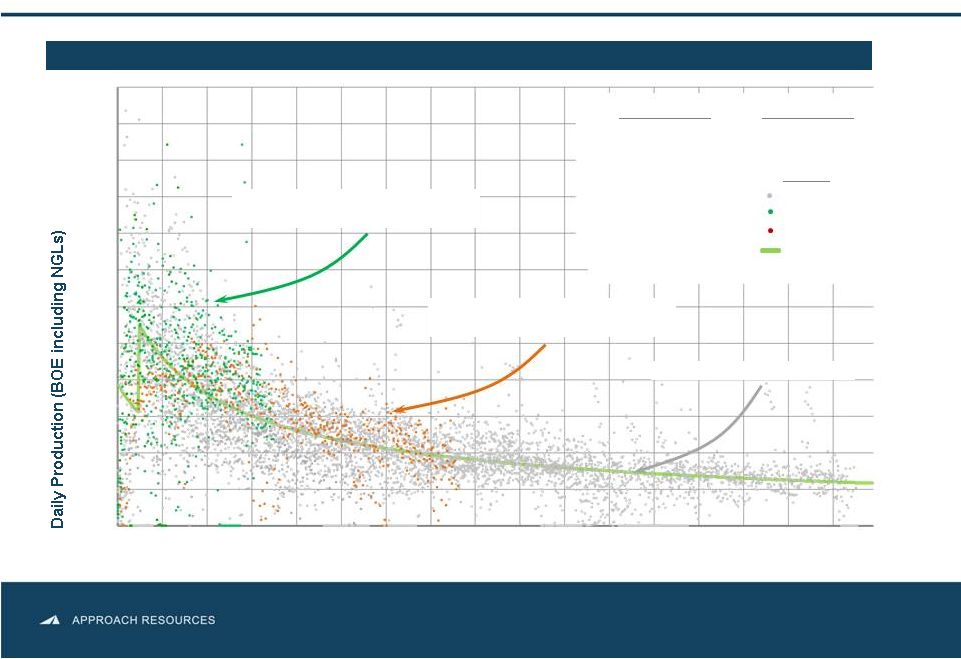 Horizontal Wolfcamp Well Performance 12 0 100 200 300 400 500 600 700 800 900 1,000 1,100 1,200 0 60 120 180 240 300 360 420 480 Daily Production Data from AREX Recent 7 Horizontal Wells 450 MBoe Type Curve B Bench well data 45 A 701H 45 D 902H 45 C 803H 45 B 2401H 45 E 1101H 45 F 2301H 45 F 2302H 45 C 805H 45 C 804H 45 F 2303H 45 F 2304H 45 A 703H 45 B 2403H 45 B 2402H CT J 1003H 45 C 806H PW 6507H PW 6601H PW 6602H B Bench Wells A Bench Wells Legend A Bench well data 450 MBoe Type Curve Daily Production Data from AREX A Bench Wells 45 E 1102H 45 G 2208H 45 G 2209H 45 G 2216H 45 G 2217H Baker B 206H Baker B 207H Recent B bench well data from 7 wells Time (Days) CONTINUED STRONG WELLS RESULTS – TRACKING ABOVE THE TYPE CURVE |
 13 Notes: Identified locations based on multi-bench development and 120-acre spacing. No locations assigned to south Project Pangea. Wolfcamp Stacked Pay Zones |
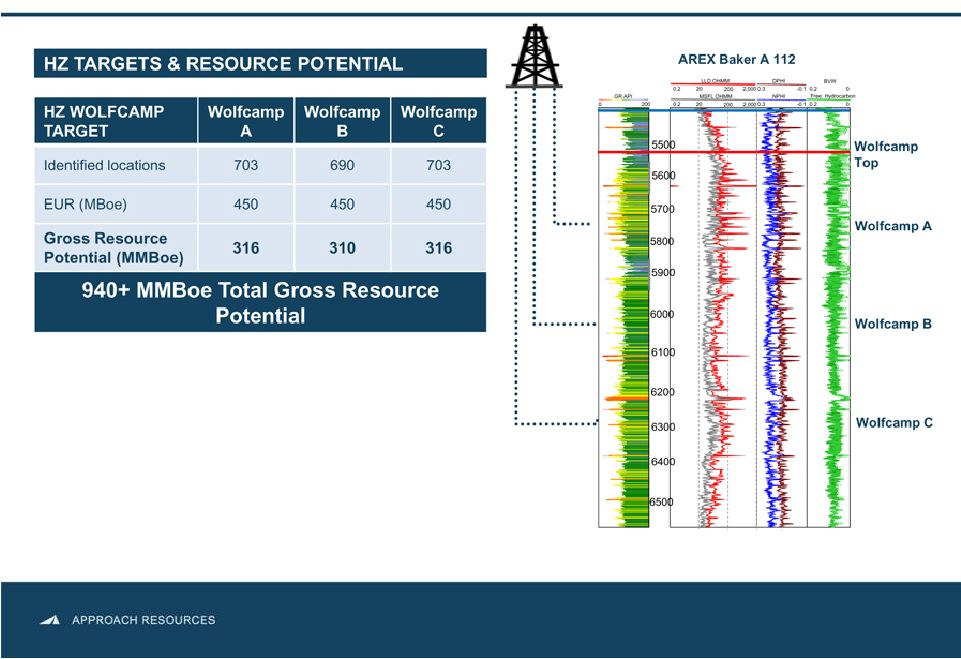
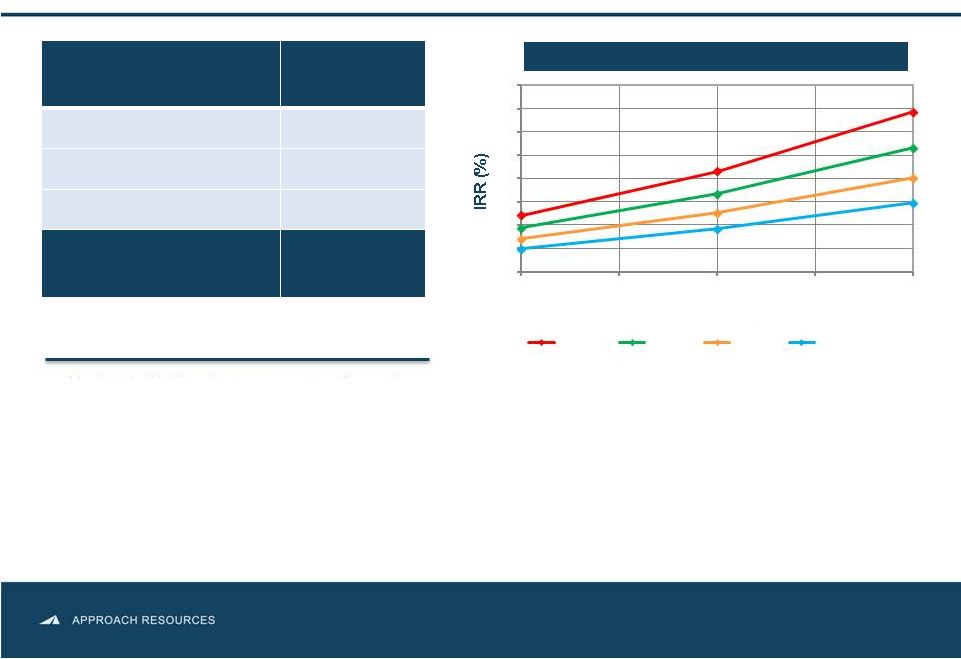 AREX Wolfcamp Targets & Resource Potential 14 Notes: Identified locations based on multi-bench development and 120-acre spacing for HZ Wolfcamp. No locations assigned to south Project Pangea. Play Type Horizontal Wolfcamp Avg. EUR (gross) 450 MBoe Targeted Well Cost $5.5 MM Potential Locations 2,096 Gross Resource Potential 940+ MMBoe BTAX IRR SENSITIVITIES • Horizontal drilling improves recoveries and returns • Multiple, stacked horizontal targets • 7,000’+ lateral length • ~80% of EUR made up of oil and NGLs • 3 HZ rigs running in Project Pangea / Pangea West 0 10 20 30 40 50 60 70 80 350 400 450 500 550 Well EUR (MBoe) $100 / bbl $90 / bbl $80 / bbl $70 / bbl |
 Creating Value Through Growth • Concentrated geographic footprint in the Midland Basin • Strong growth track record at competitive costs • Detailed technical evaluation led to discovery of growth potential in the Wolfcamp oil shale resource play • Rigorous pilot program de-risked ~107,000 gross acres • 2013 Focus Hitting $5.5 MM HZ well cost target in 2Q’13 Testing multi-bench “stacked” laterals and tighter well spacing Transition to full-field development 15 |
 Financial Information NON-GAAP RECONCILIATIONS |
 2013 Capital Budget • 2013 Capital budget $260 MM, approx. 90% for HZ Wolfcamp • 3 HZ rigs in the Wolfcamp shale • Targeting 30%+ production growth Key takeaways: 17 2013 capital program provides flexibility to develop Wolfcamp oil shale and monitor commodity prices and service costs Increase in oil production drives expected increase in cash flow $280.0 MM borrowing base strengthens liquidity • 2013 Production guidance 3.6 MMBoe – 3.9 MMBoe • 2013E Production mix 70% liquids • Targeting Wolfcamp A, B and C • Testing “stacked” lateral development concept |
 2013 Operating and Financial Guidance 18 2013 GUIDANCE 2013 Guidance Production Total (MBoe) 3,600 – 3,900 Percent Oil & NGLs 70% Operating costs and expenses ($/per Boe) Lease operating $ 7.00 – 8.00 Production and ad valorem taxes $ 3.00 – 4.50 Exploration $ 2.00 – 3.00 General and administrative $ 7.00 – 8.50 Depletion, depreciation and amortization $ 20.00 – 24.00 Capital expenditures ($MM) Approximately $260 |
 Hedge Position 19 CURRENT HEDGE POSITION Commodity and Time Period Type Volume Price Crude Oil 2013 Collar 650 Bbls/d $90.00/Bbl - $105.80/Bbl 2013 Collar 450 Bbls/d $90.00/Bbl - $101.45/Bbl February 2013 – December 2013 Collar 1,200 Bbls/d $90.35/Bbl - $100.35/Bbl 2014 Collar 550 Bbls/d $90.00/Bbl - $105.50/Bbl Crude Oil Basis Differential (Midland/Cushing) March 2013 – December 2013 Swap 2,300 Bbls/d $1.10/Bbl Natural Gas 2013 Swap 200,000 MMBtu/month $3.54/MMBtu 2013 Swap 190,000 MMBtu/month $3.80/MMBtu |
 Adjusted Net Income (unaudited) 20 The amounts included in the calculation of adjusted net income and adjusted net income per diluted share below were computed in accordance with GAAP. We believe adjusted net income and adjusted net income per diluted share are useful to investors because they provide readers with a more meaningful measure of our profitability before recording certain items whose timing or amount cannot be reasonably determined. However, these measures are provided in addition to, and not as an alternative for, and should be read in conjunction with, the information contained in our financial statements prepared in accordance with GAAP (including the notes), included in our SEC filings and posted on our website. The following table provides a reconciliation of adjusted net income to net income for the three months and year ended December 31, 2012 and 2011, respectively (in thousands, except per-share amounts). (in thousands, except per-share amounts) Year Ended December 31, 2012 2011 Net income $ 6,384 $ 7,242 Adjustments for certain items: Impairment — 18,476 Unrealized (gain) loss on commodity derivatives (3,874) 347 Gain on sale of oil & gas properties — (248) Related income tax effect 1,317 (6,316) Adjusted net income $ 3,827 $ 19,501 Adjusted net income per diluted share $ 0.11 $ 0.67 |
 EBITDAX (unaudited) 21 We define EBITDAX as net income, plus (1) exploration expense, (2) impairment expense, (3) depletion, depreciation and amortization expense, (4) share- based compensation expense, (5) unrealized (gain) loss on commodity derivatives, (6) gain on sale of oil and gas properties, (7) interest expense and (8) income taxes. EBITDAX is not a measure of net income or cash flow as determined by GAAP. The amounts included in the calculation of EBITDAX were computed in accordance with GAAP. EBITDAX is presented herein and reconciled to the GAAP measure of net income because of its wide acceptance by the investment community as a financial indicator of a company's ability to internally fund development and exploration activities. This measure is provided in addition to, and not as an alternative for, and should be read in conjunction with, the information contained in our financial statements prepared in accordance with GAAP (including the notes), included in our SEC filings and posted on our website. The following table provides a reconciliation of EBITDAX to net income for the three months and year ended December 31, 2012 and 2011, respectively (in thousands, except per-share amounts). (in thousands, except per-share amounts) Year Ended December 31, 2012 2011 Net income $ 6,384 $ 7,242 Exploration 4,550 9,546 Impairment — 18,476 Depletion, depreciation and amortization 60,381 32,475 Share-based compensation 7,465 4,683 Unrealized (gain) loss on commodity derivatives (3,874) 347 Gain on sale of oil & gas properties — (248) Interest expense, net 4,737 3,402 Income tax provision 3,338 3,488 EBITDAX $ 82,981 $ 79,411 EBITDAX per diluted share $ 2.37 $ 2.72 |
 Liquidity 22 Liquidity (unaudited) is calculated by adding the net funds available under our revolving credit facility and cash and cash equivalents. We use liquidity as an indicator of the Company’s ability to fund development and exploration activities. Liquidity has limitations, and can vary from year to year for the Company and can vary among companies based on what is or is not included in the measurement on a company’s financial statements. Liquidity is provided in addition to, and not as an alternative for, and should be read in conjunction with, the information contained in our financial statements prepared in accordance with GAAP (including the notes), included in our SEC filings and posted on our website. The table below summarizes our liquidity at December 31, 2012. Long-term debt-to-capital ratio (unaudited) is calculated as of September 30, 2012, and by dividing long-term debt (GAAP) by the sum of total stockholders’ equity (GAAP) and long-term debt (GAAP). We use the long-term debt-to-capital ratio as a measurement of our overall financial leverage. However, this ratio has limitations. This ratio can vary from year-to-year for the Company and can vary among companies based on what is or is not included in the ratio on a company’s financial statements. This ratio is provided in addition to, and not as an alternative for, and should be read in conjunction with, the information contained in our financial statements prepared in accordance with GAAP (including the notes), included in our SEC filings and posted on our website. The table below summarizes our long-term debt-to-capital ratio at December 31, 2012. (in thousands) December 31, 2012 Long-term debt $ 106,000 Total stockholders’ equity 633,468 739,468 Long-term debt-to-capital 14.3% (in thousands) December 31, 2012 Borrowing base $ 280,000 Cash and cash equivalents 767 Long-term debt (106,000) Unused letters of credit (325) Liquidity $ 174,442 |
 F&D Costs Reconciliation (unaudited) 23 We believe that providing measures of finding and development, or F&D, cost is useful to assist an evaluation of how much it costs the Company, on a per Boe basis, to add proved reserves. However, these measures are provided in addition to, and not as an alternative for, and should be read in conjunction with, the information contained in our financial statements prepared in accordance with GAAP (including the notes), included in our SEC filings and posted on our website. Due to various factors, including timing differences, F&D costs do not necessarily reflect precisely the costs associated with particular reserves. For example, exploration costs may be recorded in periods before the periods in which related increases in reserves are recorded and development costs may be recorded in periods after the periods in which related increases in reserves are recorded. In addition, changes in commodity prices can affect the magnitude of recorded increases (or decreases) in reserves independent of the related costs of such increases. As a result of the above factors and various factors that could materially affect the timing and amounts of future increases in reserves and the timing and amounts of future costs, including factors disclosed in our filings with the SEC, we cannot assure you that the Company’s future F&D costs will not differ materially from those set forth above. Further, the methods we use to calculate F&D costs may differ significantly from methods used by other companies to compute similar measures. As a result, our F&D costs may not be comparable to similar measures provided by other companies. The following tables reflect the reconciliation of our estimated finding and development costs to the information required by paragraphs 11 and 21 of ASC 932-235. 2012 Reserve summary (MBoe) Balance – 12/31/2011 76,975 Extensions & discoveries 38,861 Revisions (17,469) Production (2,888) Balance – 12/31/2012 95,479 Cost summary ($M) Property acquisition costs $ 7,742 Exploration costs 4,550 Development costs 285,039 Total 297,331 Finding & development costs ($/Boe) All-in F&D costs $ 13.90 Drill-bit F&D cost $ 7.45 Reserve replacement ratio (%) Extensions & discoveries (MBoe) 38,861 2012 Production (MBoe) (2,888) Reserve replacement 1,346% |
 Contact Information MEGAN P. HAYS Manager, Investor Relations & Corporate Communications 817.989.9000 x2108 mhays@approachresources.com www.approachresources.com |