Approach Resources Inc. IPAA’S OIL & GAS INVESTMENT SYMPOSIUM NEW YORK APRIL 15, 2013 Exhibit 99.2 |
2 |
Company Overview • Enterprise value $1.1 BN • High quality reserve base 95.5 MMBoe proved reserves 99% Permian Basin • Permian core operating area • 2013 Capital program of $260 MM 3 AREX OVERVIEW ASSET OVERVIEW Notes: Proved reserves and acreage as of 12/31/2012. All Boe and Mcfe calculations are based on a 6 to 1 conversion ratio. Enterprise value is equal to market capitalization using the closing share price of $24.75 per share on 4/8/2013, plus net debt as of 12/31/2012. 167,000 gross (148,000 net) acres 1+ BnBoe gross, unrisked resource potential 2,000+ Identified HZ drilling locations targeting the Wolfcamp oil shale play Running 3 HZ rigs in the Wolfcamp shale play Targeting 30%+ production growth |
Reserve Growth 4 RESERVE GROWTH OIL RESERVE GROWTH • YE’12 reserves up 24% YoY • Replaced 1,346% of reserves at a drill-bit F&D cost of $7.45/Boe • 60.1 MMBoe proved reserves booked to Wolffork/Wolfcamp oil shale play • Strong organic reserve growth driven by oil from HZ Wolfcamp shale • Oil reserves up 7x since YE’09 • Oil reserves up 106% YoY PD Oil reserves up 60% YoY Notes: See “F&D Costs Reconciliation” slide in appendix. |
Production Growth 5 PRODUCTION GROWTH OIL PRODUCTION GROWTH 3.6 MMBoe – 3.9 MMBoe in 2013 2013E Production mix ~70% liquids • Strong organic production growth driven by oil from horizontal Wolfcamp shale • Oil production up 3x since 2009 • Oil production up 101% over 2011 • 2012 production increased 24% YoY • Targeting 30%+ production growth in 2013 |
Low-Cost Operator Notes: Peers include CXO, FANG, KOG, LPI, OAS, PXD, ROSE and SM. Data based on SEC filings for twelve months ending December 31, 2012. 3-YR AVERAGE F&D COSTS ($/Boe) LEASE OPERATING EXPENSE ($/Boe) 6 |
AREX Wolfcamp Oil Shale Resource Play 7 ACTIVE PARTICIPANTS IN THE PLAY Large, primarily contiguous acreage position Oil-rich, multiple pay zones 167,000 gross (148,000 net) acres Low acreage cost ~$500 per acre 940+ MMBoe gross, unrisked resource potential 2,096 Identified HZ Wolfcamp locations targeting the Wolfcamp A, B & C Plan to drill ~ 35 to 40 HZ wells with 3 rigs Testing “stacked-wellbore” development and tighter well spacing Decrease well costs and increase efficiencies when field infrastructure projects are completed Source: Rig data from Schlumberger and Iberia. HZ Wolfcamp resource potential up 300%+ 2013 Operations Broad industry participation de-risking play 50+ HZ Wolfcamp rigs as of April 2013 |
AREX Drilling Locations, Targets & Resource Potential 8 Notes: Potential locations based on 120-acre spacing for HZ Wolfcamp, 20-acre spacing for Vertical Wolffork, 20 to 40-acre spacing for Vertical Wolffork Recompletions and 40-acre spacing for Vertical Canyon Wolffork. No Wolfcamp or Wolffork locations assigned to south Project Pangea. TARGET DRLLING DEPTH (FT.) EUR (MBoe) IDENTIFIED LOCATIONS GROSS RESOURCE POTENTIAL (MBoe) Horizontal Wolfcamp Wolfcamp A 7,000+ (lateral length) 450 703 316,350 Wolfcamp B 7,000+ (lateral length) 450 690 310,500 Wolfcamp C 7,000+ (lateral length) 450 703 316,350 Total HZ 2,096 943,200 Vertical Wolffork Recompletions, Wolffork & Canyon Wolffork < 7,500 to < 8,500 93 to 193 887 124,594 1.1 BnBoe Total Gross Resource Potential Multiple Decades of HZ Drilling Inventory |
Wolfcamp Oil Shale Play 9 WOLFCAMP SHALE – WIDESPREAD, THICK, CONSISTENT & REPEATABLE |
Horizontal Wolfcamp – 82% of IP is Oil 10 Sutton Source: Publicly available regulatory filings, company presentations. |
Misconception vs. Facts 11 Misconception: Wells are gassier as the play moves southward • Gassier wells are historical Canyon, Strawn and Ellenburger wells • The Wolfcamp Shale is located in peak oil and early wet gas window. Wolfcamp wells are expected to produce approximately 58% oil and ~80% liquids over the production life, supported by core data, initial production data and EUR forecast |
AREX HZ Wolfcamp Activity 12 Notes: Acreage as of 12/31/2012. Pangea West North & Central Pangea South Pangea • 18,000 gross acres • Pad drilling with A/B and A/C “stacked” laterals Schleicher Crockett Irion Reagan • 3-D seismic interpretation completed • Drilling HZ pilot well • 59,000 gross acres • Continuing completion design improvement • 90,000 gross acres • Pad drilling with A/B and A/C “stacked” laterals • North Pangea infrastructure in place in 2Q’13 Sutton 54-9 1 54-2 1 54-9 2 54-12 1 54-15 1 54-15 2 54-16 3 55-21 2 54-19 3 54-8 1 54-13 1 56-6 1 56-15 1 PW 6601H PW 6602H CT L 1801 54-13 2 54-20 2 54-20 1 55-21 3 56-14 1 PW 6507H Chandler 4403 Childress 603 Childress G 1008 Lauffer 1306 Davidson 3406 Bailey 315 CT B 1601 CT M 901H Baker B 203 CT B 1303 45 C 803H ST 42-11 2R 45 E 1101H Baker C 1201 45 A 701H 45 B 2401H 45 F 2303H CT B 1308 42-23 9 Baker A 114 West 2308 42-23 11 42-14 10 42 A 2101H 42-15 2 42 B 1001H 45 D 902H CT A 807 45 A 703H 45 B 2402H CT J 1001 CT G 1001 CT H 1001 West A 2210 42-11 3 CT J 1003H 42 C 101H CT H 1002 CT G 701H 45 B 2403H 45 D 905H 45 A 704H CT K 1901 CT K 1902 45 D 904H 45 E 1102H Baker B 207H Baker B 206H CT H 1004H U 50 A 601HC PW 6533H PW 6535H 45 F 2304H 45 A 706H 45A 708H 45A 710H 45A 712H Elliott 2002HB CT M 902 • 3-D Seismic acquisition completed. Data processing in progress • Targeting HZ pilot well in 2Q’13 U 50 A 603HA |
HZ Wolfcamp Well Performance 13 Time (Days) CONTINUED STRONG WELLS RESULTS – TRACKING ABOVE THE TYPE CURVE |
Microseismic Data – Wolfcamp A & B 15 MAP VIEW X-SECTION VIEW (LOOKING WEST) |
16 Microseismic Data – Wolfcamp C MAP VIEW X-SECTION VIEW (LOOKING WEST) |
17 Multiple Lateral Stacking – Effective Frac Volumes CHEVRON STACKING DEVELOPMENT PATTERN |
AREX HZ Wolfcamp Economics 18 Notes: Identified locations based on multi-bench development and 120-acre spacing for HZ Wolfcamp. No locations assigned to south Project Pangea. HZ Wolfcamp Economics assume NYMEX-Henry Hub strip and NGL price based on 40% of WTI. Play Type Horizontal Wolfcamp Avg. EUR (gross) 450 MBoe Targeted Well Cost $5.5 MM Potential Locations 2,096 Gross Resource Potential 940+ MMBoe BTAX IRR SENSITIVITIES • Horizontal drilling improves recoveries and returns • Multiple, stacked horizontal targets • 7,000’+ lateral length • ~80% of EUR made up of oil and NGLs (58% OIL) • 3 HZ rigs running in Project Pangea / Pangea West |
Infrastructure for Large-Scale Development 19 • Reducing D&C Cost to $5.5 MM or lower • Reducing LOE • Minimizing truck traffic and surface disturbance • Increasing project profit margin Pangea West South Pangea Schleicher Crockett Irion Reagan Sutton North & Central Pangea |
Infrastructure & Equipment Projects 20 • Safely and securely transport water across Project Pangea and Pangea West • Reduce time and money spent on water hauling and disposal and truck traffic • Expected savings from water transfer equipment ~$0.1 MM/HZ well • Expected savings from SWD system ~$0.45 MM/HZ well • Expected company-wide LOE savings ±$0.4 MM per month • Replace rental equipment and contractors with Company-owned and operated equipment and personnel; reduce money spent on flowback operations • Expected savings from flowback equipment ~$0.1 MM/HZ well • Expected LOE savings from gas lift system $6,300/HZ per month • Facilitate large-scale field development • Reduce fresh water use and water costs • Expected savings from non-potable water source ~$0.45 MM/HZ well • Efficiently transport crude oil to market and reduce inventory • Reduce oil transportation differential to an estimated $2.50/Bbl – $4.00/Bbl Purchasing and installing water transfer equipment Drilling and/or converting SWD wells Purchasing and installing flowback equipment Securing water supply Testing non-potable water and recycling flowback water Installing crude takeaway lines Purchased oil hauling trucks BENEFITS Infrastructure and equipment projects are key to large-scale field development and to reducing D&C costs as well as LOE cost PROJECTS |
Creating Value Through Growth • Concentrated geographic footprint in the Midland Basin • Strong growth track record at competitive costs • Detailed technical evaluation led to discovery of growth potential in the Wolfcamp oil shale resource play • Rigorous pilot program de-risked ~107,000 gross acres • 2013 Focus 21 Hitting $5.5 MM HZ well cost target in 2Q’13 Testing multi-bench “stacked” laterals and tighter well spacing Transition to full-field development |
Financial Information NON-GAAP RECONCILIATIONS |
2013 Capital Budget • 2013 Capital budget $260 MM, approx. 90% for HZ Wolfcamp • 3 HZ rigs in the Wolfcamp shale • Targeting 30%+ production growth Key takeaways: 23 • Targeting Wolfcamp A, B and C • Testing “stacked” lateral development concept • 2013 Production guidance 3.6 MMBoe – 3.9 MMBoe • 2013E Production mix 70% liquids 2013 capital program provides flexibility to develop Wolfcamp oil shale and monitor commodity prices and service costs Increase in oil production drives expected increase in cash flow $280 MM borrowing base strengthens liquidity |
2013 Operating and Financial Guidance 24 2013 GUIDANCE 2013 Guidance Production Total (MBoe) 3,600 – 3,900 Percent Oil & NGLs 70% Operating costs and expenses ($/per Boe) Lease operating $ 7.00 – 8.00 Production and ad valorem taxes $ 3.00 – 4.50 Exploration $ 2.00 – 3.00 General and administrative $ 7.00 – 8.50 Depletion, depreciation and amortization $ 20.00 – 24.00 Capital expenditures ($MM) Approximately $260 |
Hedge Position 25 CURRENT HEDGE POSITION Commodity and Time Period Type Volume Price Crude Oil 2013 Collar 650 Bbls/d $90.00/Bbl - $105.80/Bbl 2013 Collar 450 Bbls/d $90.00/Bbl - $101.45/Bbl February 2013 – December 2013 Collar 1,200 Bbls/d $90.35/Bbl - $100.35/Bbl 2014 Collar 550 Bbls/d $90.00/Bbl - $105.50/Bbl Crude Oil Basis Differential (Midland/Cushing) March 2013 – December 2013 Swap 2,300 Bbls/d $1.10/Bbl Natural Gas 2013 Swap 200,000 MMBtu/month $3.54/MMBtu 2013 Swap 190,000 MMBtu/month $3.80/MMBtu May 2013 – December 2013 Collar 100,000 MMBtu/month $4.00/MMBtu - $4.36/MMBtu 2014 Swap 360,000 MMBtu/month $4.18/MMBtu 53% of FY’13 oil hedged at $90.17/Bbl x $102.19/Bbl 81% of FY’13 gas hedged at weighted average floor of $3.72/MMBtu • Prudent hedging program protects cash flow and returns as well as capital budget activities |
Conservative Financial Strategy & Capitalization 26 CAPITALIZATION & PERFORMANCE METRICS (1) Liquidity calculated as the sum of current borrowing base and cash and cash equivalents less long-term debt and unused letters of credit. Unused letters of credit currently total $325,000. |
EBITDAX (unaudited) 27 We define EBITDAX as net income, plus (1) exploration expense, (2) impairment expense, (3) depletion, depreciation and amortization expense, (4) share- based compensation expense, (5) unrealized (gain) loss on commodity derivatives, (6) gain on sale of oil and gas properties, (7) interest expense and (8) income taxes. EBITDAX is not a measure of net income or cash flow as determined by GAAP. The amounts included in the calculation of EBITDAX were computed in accordance with GAAP. EBITDAX is presented herein and reconciled to the GAAP measure of net income because of its wide acceptance by the investment community as a financial indicator of a company's ability to internally fund development and exploration activities. This measure is provided in addition to, and not as an alternative for, and should be read in conjunction with, the information contained in our financial statements prepared in accordance with GAAP (including the notes), included in our SEC filings and posted on our website. The following table provides a reconciliation of EBITDAX to net income for the three months and year ended December 31, 2012 and 2011, respectively (in thousands, except per-share amounts). (in thousands, except per-share amounts) Year Ended December 31, 2012 2011 Net income $ 6,384 $ 7,242 Exploration 4,550 9,546 Impairment — 18,476 Depletion, depreciation and amortization 60,381 32,475 Share-based compensation 7,465 4,683 Unrealized (gain) loss on commodity derivatives (3,874) 347 Gain on sale of oil & gas properties — (248) Interest expense, net 4,737 3,402 Income tax provision 3,338 3,488 EBITDAX $ 82,981 $ 79,411 EBITDAX per diluted share $ 2.37 $ 2.72 |
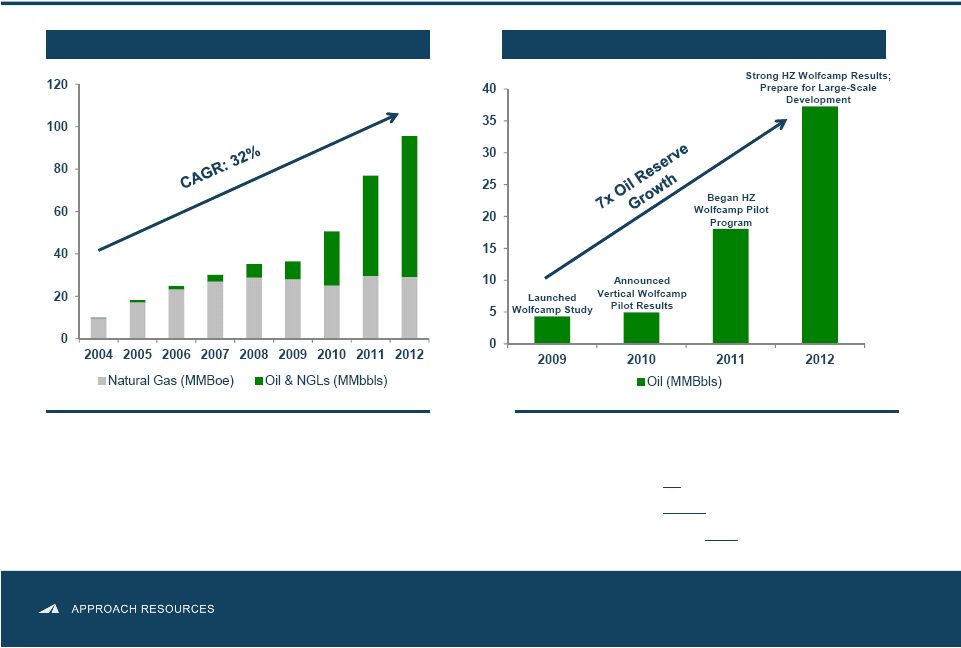
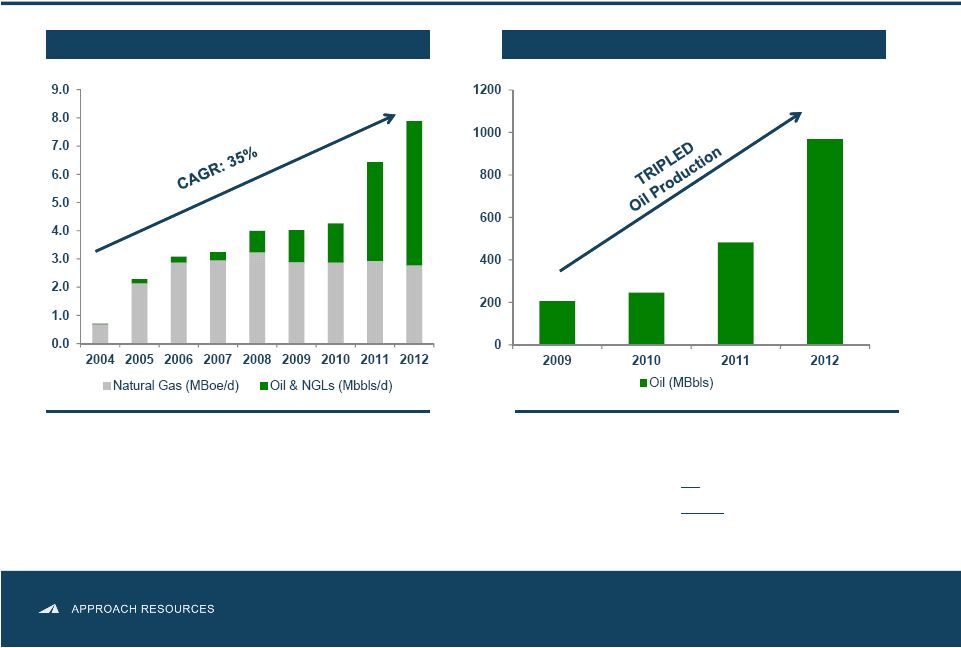
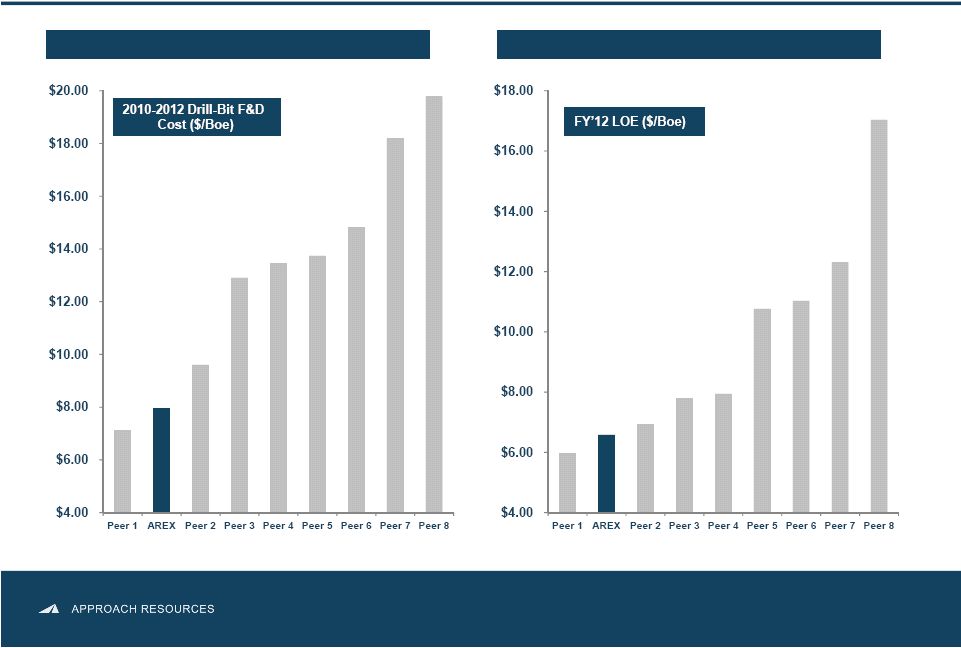
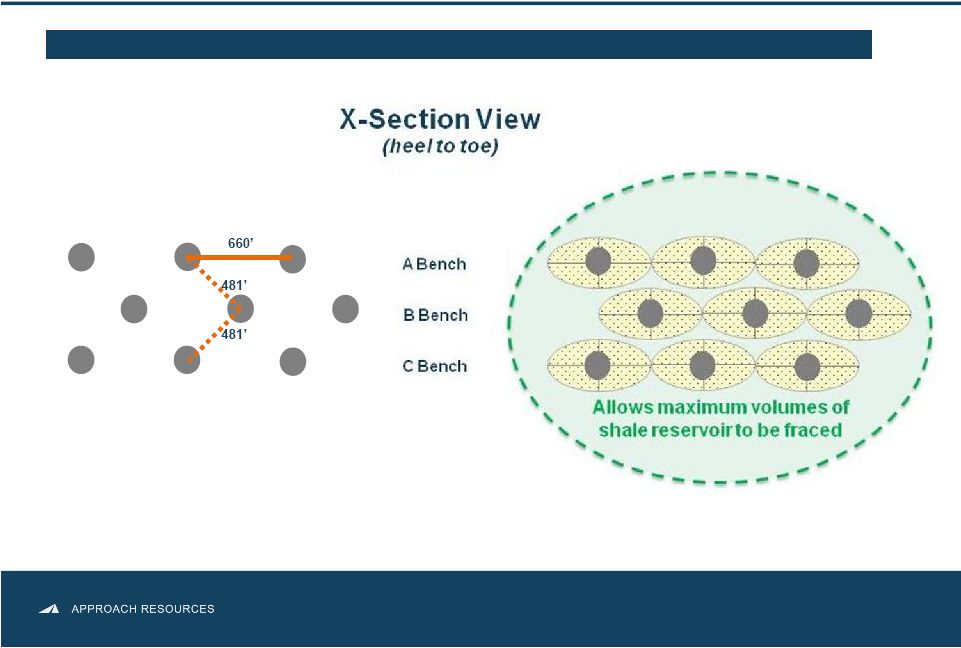
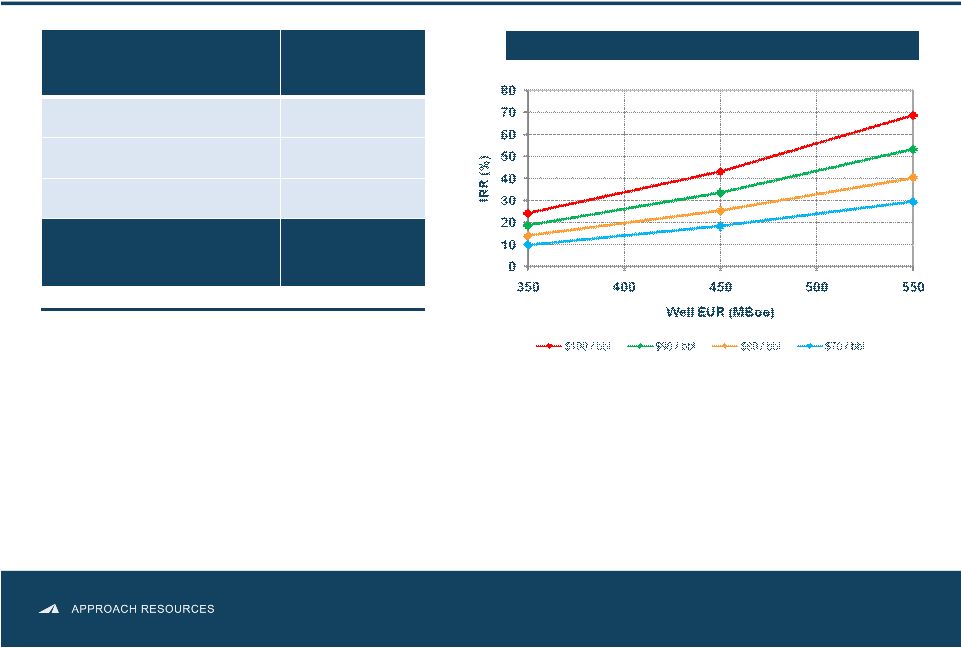
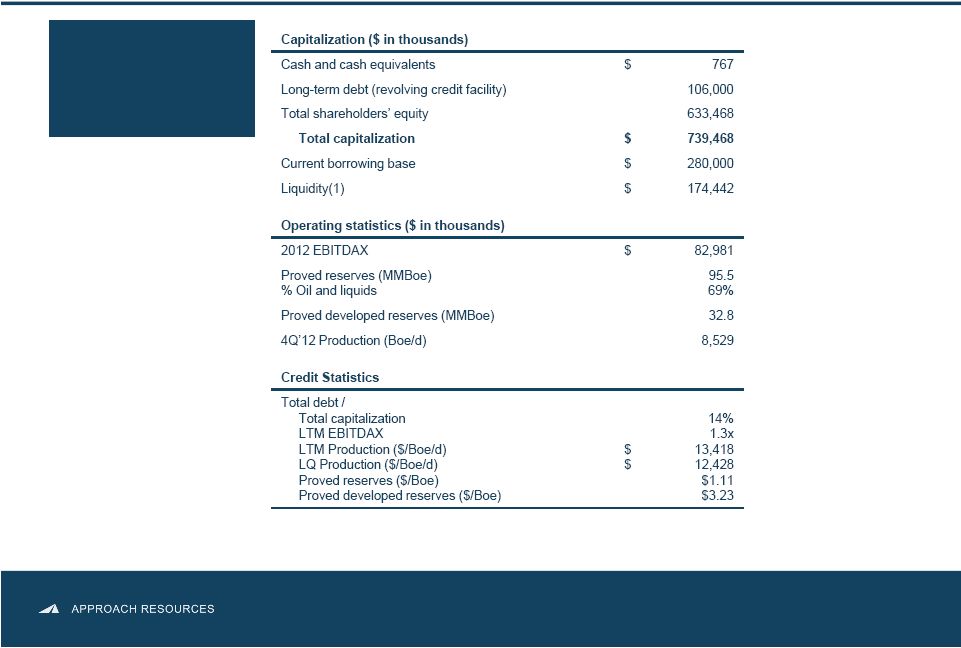
F&D Costs Reconciliation (unaudited) 28 We believe that providing measures of finding and development, or F&D, cost is useful to assist an evaluation of how much it costs the Company, on a per Boe basis, to add proved reserves. However, these measures are provided in addition to, and not as an alternative for, and should be read in conjunction with, the information contained in our financial statements prepared in accordance with GAAP (including the notes), included in our SEC filings and posted on our website. Due to various factors, including timing differences, F&D costs do not necessarily reflect precisely the costs associated with particular reserves. For example, exploration costs may be recorded in periods before the periods in which related increases in reserves are recorded and development costs may be recorded in periods after the periods in which related increases in reserves are recorded. In addition, changes in commodity prices can affect the magnitude of recorded increases (or decreases) in reserves independent of the related costs of such increases. As a result of the above factors and various factors that could materially affect the timing and amounts of future increases in reserves and the timing and amounts of future costs, including factors disclosed in our filings with the SEC, we cannot assure you that the Company’s future F&D costs will not differ materially from those set forth above. Further, the methods we use to calculate F&D costs may differ significantly from methods used by other companies to compute similar measures. As a result, our F&D costs may not be comparable to similar measures provided by other companies. The following tables reflect the reconciliation of our estimated finding and development costs to the information required by paragraphs 11 and 21 of ASC 932-235. 2012 Reserve summary (MBoe) Balance – 12/31/2011 76,975 Extensions & discoveries 38,861 Revisions (17,469) Production (2,888) Balance – 12/31/2012 95,479 Cost summary ($M) Acquisition costs $ 7,742 Exploration costs 4,550 Development costs 285,039 Total 297,331 Finding & development costs ($/Boe) All-in F&D costs $ 13.90 Drill-bit F&D cost $ 7.45 Reserve replacement ratio (%) Extensions & discoveries (MBoe) 38,861 2012 Production (MBoe) (2,888) Reserve replacement 1,346% 3-Year Reserve summary (MBoe) Balance – 12/31/2009 36,488 Extensions & discoveries 68,182 Purchases 12,456 Revisions (14,866) Production (6,781) Balance – 12/31/2012 95,479 Cost summary ($M) Acquisition costs $ 131,189 Exploration costs 17,415 Development costs 524,476 Total 673,080 Finding & development costs ($/Boe) 3-YR All-in F&D costs $ 10.23 3-YR Drill-bit F&D cost $ 7.95 Reserve replacement ratio (%) Extensions & discoveries (MBoe) 68,182 3-YR Production (MBoe) (6,781) Reserve replacement 1,005% |
Contact Information MEGAN P. HAYS Manager, Investor Relations & Corporate Communications 817.989.9000 x2108 mhays@approachresources.com www.approachresources.com |