 Approach Resources Inc. FIRST QUARTER 2013 RESULTS MAY 2, 2013 Exhibit 99.2 |
 Forward-Looking Statements 2 This presentation contains forward-looking statements within the meaning of Section 27A of the Securities Act of 1933 and Section 21E of the Securities Exchange Act of 1934. All statements, other than statements of historical facts, included in this presentation that address activities, events or developments that the Company expects, believes or anticipates will or may occur in the future are forward-looking statements. Without limiting the generality of the foregoing, forward-looking statements contained in this presentation specifically include the expectations of management regarding plans, strategies, objectives, anticipated financial and operating results of the Company, including as to the Company’s Wolfcamp shale resource play, estimated resource potential and recoverability of the oil and gas, estimated reserves and drilling locations, capital expenditures, typical well results and well profiles, type curve, and production and operating expenses guidance included in the presentation. These statements are based on certain assumptions made by the Company based on management's experience and technical analyses, current conditions, anticipated future developments and other factors believed to be appropriate and believed to be reasonable by management. When used in this presentation, the words “will,” “potential,” “believe,” “intend,” “expect,” “may,” “should,” “anticipate,” “could,” “estimate,” “plan,” “predict,” “project,” “target,” “profile,” “model” or their negatives, other similar expressions or the statements that include those words, are intended to identify forward-looking statements, although not all forward-looking statements contain such identifying words. Such statements are subject to a number of assumptions, risks and uncertainties, many of which are beyond the control of the Company, which may cause actual results to differ materially from those implied or expressed by the forward-looking statements. In particular, careful consideration should be given to the cautionary statements and risk factors described in the Company's most recent Annual Report on Form 10-K and Quarterly Reports on Form 10-Q. Any forward-looking statement speaks only as of the date on which such statement is made and the Company undertakes no obligation to correct or update any forward-looking statement, whether as a result of new information, future events or otherwise, except as required by applicable law. Cautionary Statements Regarding Oil & Gas Quantities The Securities and Exchange Commission (“SEC”) permits oil and gas companies, in their filings with the SEC, to disclose only proved, probable and possible reserves that meet the SEC’s definitions for such terms, and price and cost sensitivities for such reserves, and prohibits disclosure of resources that do not constitute such reserves. The Company uses the terms “estimated ultimate recovery” or “EUR,” reserve or resource “potential,” and other descriptions of volumes of reserves potentially recoverable through additional drilling or recovery techniques that the SEC’s rules may prohibit the Company from including in filings with the SEC. These estimates are by their nature more speculative than estimates of proved, probable and possible reserves and accordingly are subject to substantially greater risk of being actually realized by the Company. EUR estimates, identified drilling locations and resource potential estimates have not been risked by the Company. Actual locations drilled and quantities that may be ultimately recovered from the Company’s interest may differ substantially from the Company’s estimates. There is no commitment by the Company to drill all of the drilling locations that have been attributed these quantities. Factors affecting ultimate recovery include the scope of the Company’s ongoing drilling program, which will be directly affected by the availability of capital, drilling and production costs, availability of drilling and completion services and equipment, drilling results, lease expirations, regulatory approval and actual drilling results, as well as geological and mechanical factors Estimates of unproved reserves, type/decline curves, per well EUR and resource potential may change significantly as development of the Company’s oil and gas assets provides additional data. Type/decline curves, estimated EURs, resource potential, recovery factors and well costs represent Company estimates based on evaluation of petrophysical analysis, core data and well logs, well performance from limited drilling and recompletion results and seismic data, and have not been reviewed by independent engineers. These are presented as hypothetical recoveries if assumptions and estimates regarding recoverable hydrocarbons, recovery factors and costs prove correct. The Company has very limited production experience with these projects, and accordingly, such estimates may change significantly as results from more wells are evaluated. Estimates of resource potential and EURs do not constitute reserves, but constitute estimates of contingent resources which the SEC has determined are too speculative to include in SEC filings. Unless otherwise noted, IRR estimates are before taxes and assume NYMEX forward-curve oil and gas pricing and Company-generated EUR and decline curve estimates based on Company drilling and completion cost estimates that do not include land, seismic or G&A costs. |
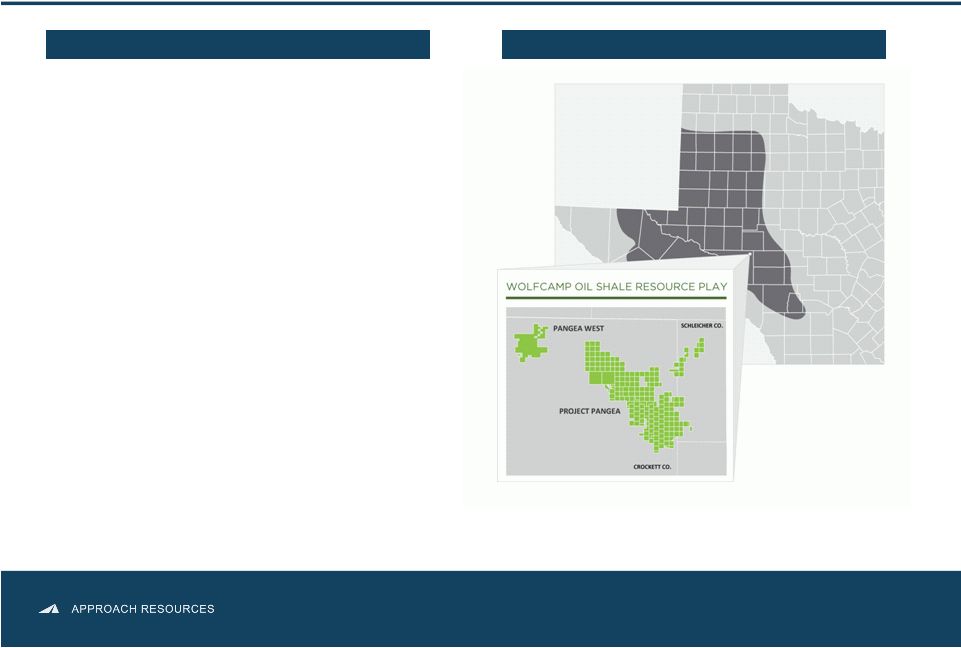 Company Overview • Enterprise value $1 BN • High quality reserve base • Permian core operating area • 2013 capital program of $260 MM AREX OVERVIEW ASSET OVERVIEW Notes: Proved reserves and acreage as of 12/31/2012 and 3/31/2013, respectively. All Boe and Mcfe calculations are based on a 6 to 1 conversion ratio. Enterprise value is equal to market capitalization using the closing share price of $22.83 per share on 4/26/2013, plus net debt as of 3/31/2013. 95.5 MMBoe proved reserves 99% Permian Basin 167,000 gross (148,000 net) acres 1+ BnBoe gross, unrisked resource potential 2,000+ Identified HZ drilling locations targeting the Wolfcamp A/B/C Running 3 HZ rigs in the Wolfcamp shale play Targeting 30%+ production growth 3 |
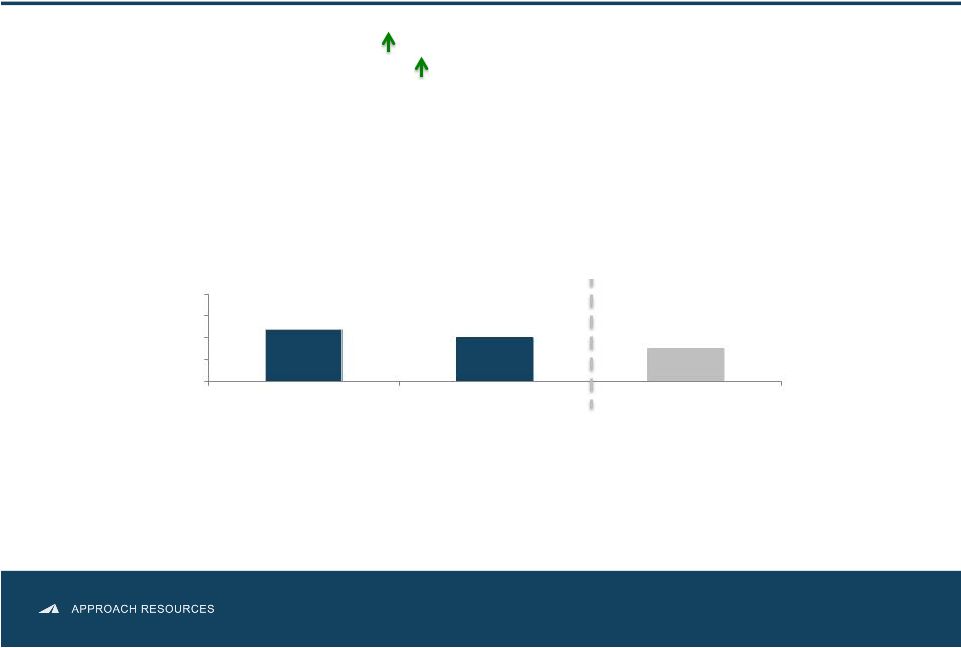 1Q13 Operational Highlights • Total production increase to 8.4 MBoe/d ( 15% since 1Q12) • Drilled 10 wells and completed 5 HZ wells during 1Q13; completed additional 5 HZ wells shortly after 1Q13 • Testing stacked laterals in A/B benches in Pangea West and north Pangea • Field infrastructure projects in north Project Pangea near completion. Infrastructure projects and completion optimization driving well costs lower ($MM) • Began flowing oil down 38-mile JV pipeline in early April 2013. Anticipated benefits include efficient transportation of growing oil production, reducing transportation differential and optionality to access markets with higher price realizations • Optimizing completion design and testing reduced number of frac stages $6.40 $6.10 - $6.00 $6.00 - $5.50 $4.00 $5.00 $6.00 $7.00 $8.00 2H'12 1Q'13 2Q'13E 4 Oil growing as a percentage of production ( 63% since 1Q12) |
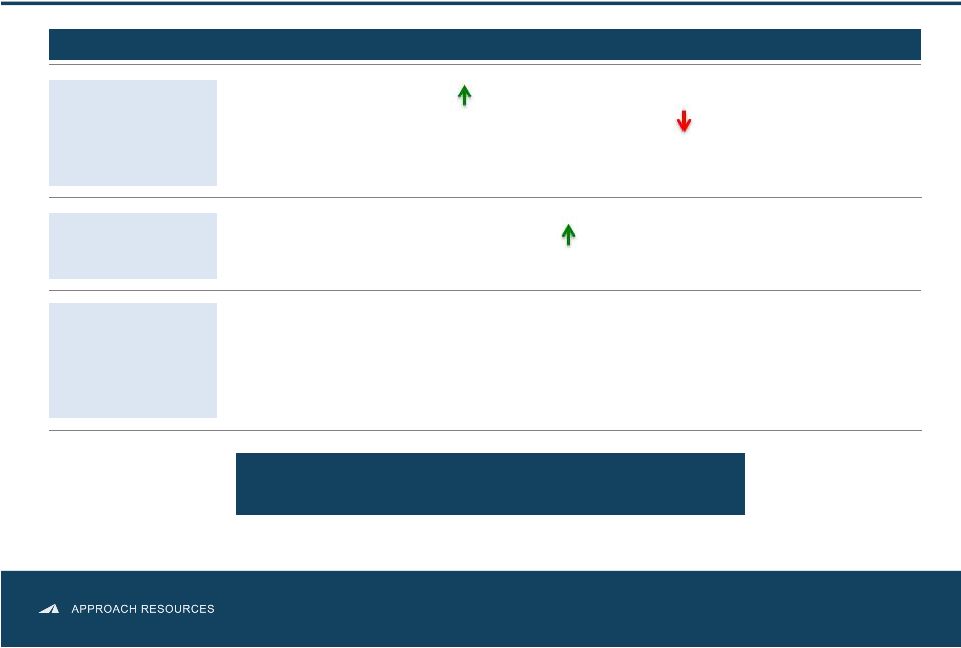 1Q13 Financial Highlights Growing Revenues and Lower Costs • Revenues of $36.3 MM ( 19% since 1Q12) • Total operating costs and expenses of $41.99/Boe ( 11% since 4Q12) • Net loss of $0.3 MM or $0.01 per diluted share • Adjusted net income (non-GAAP) of $2.4 MM or $0.06 per diluted share Significant Cash Flow • EBITDAX (non-GAAP) of $24.4 MM ( 17% since 1Q12) • Cash flow from operations of $29.6 MM Strong Balance Sheet and Liquidity to Develop HZ Wolfcamp Shale • Borrowing base increased to $315 MM from $280 MM as of May 1 • Liquidity of $163 MM pro forma for borrowing base increase • Debt-to-capital of 19% (1Q13) HIGHLIGHTS Strong Balance Sheet and Liquidity to Develop HZ Wolfcamp Shale Notes: See “Adjusted Net Income,” “EBITDAX” and “Liquidity” slides in appendix. st 5 |
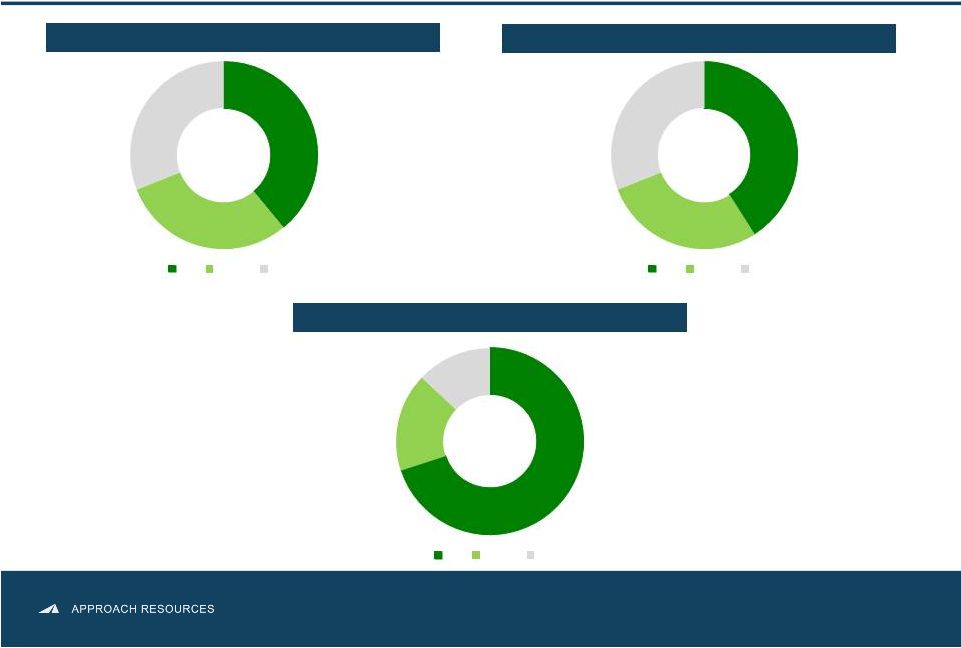 Oil & Liquids-Weighted Reserves, Production & Revenue YE12 RESERVE MIX BY COMMODITY 1Q13 PRODUCTION MIX BY COMMODITY 1Q13 REVENUE MIX BY COMMODITY 95.3 MMBoe $36.3 MM 8.4 MBoe/d 70% 17% 12% Oil NGLs Gas 39% 30% 31% Oil NGLs Gas 41% 28% 31% Oil NGLs Gas 6 |
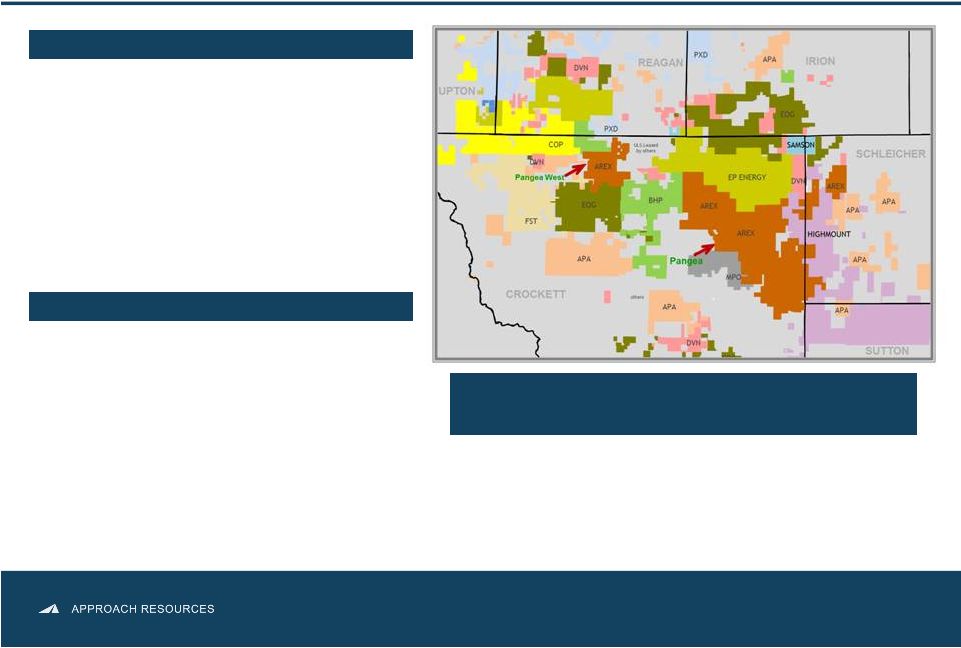 AREX Wolfcamp Oil Shale Resource Play Plan to drill ~ 35 to 40 HZ wells with 3 rigs Testing “stacked-wellbore” development and optimizing well spacing and completion design Decrease well costs and increase efficiencies when field infrastructure projects are completed PERMAIN CORE OPERATING AREA 2013 OPERATIONS Large, primarily contiguous acreage position with oil-rich, multiple pay zones Large, primarily contiguous acreage position Oil-rich, multiple pay zones 167,000 gross (148,000 net) acres Low acreage cost ~$500 per acre 2,096 Identified HZ Wolfcamp locations targeting the Wolfcamp A, B & C 7 940+ MMBoe gross, unrisked HZ Wolfcamp resource potential |
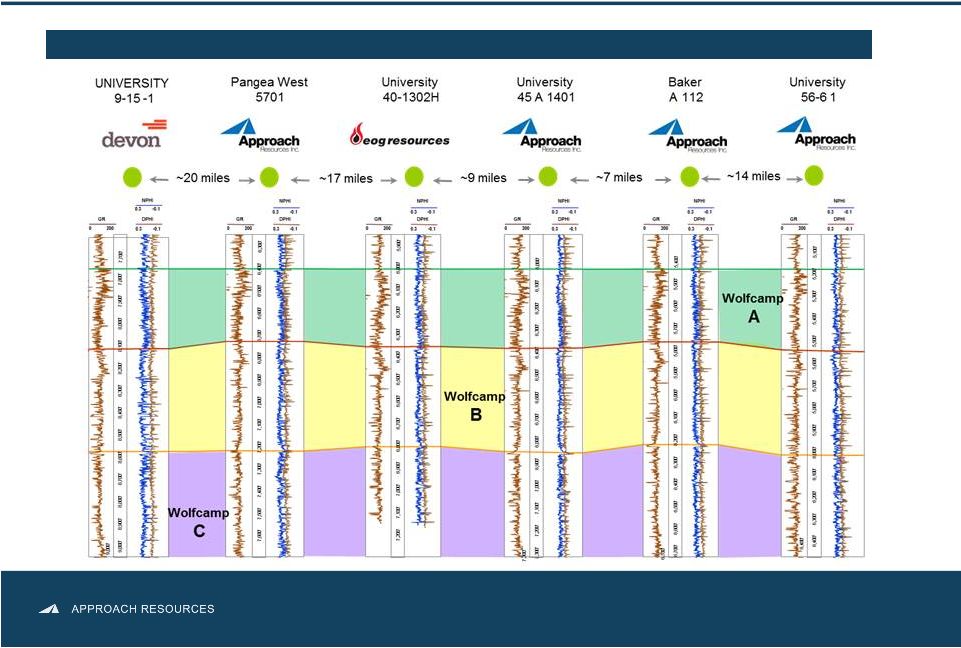 Wolfcamp Oil Shale Play WOLFCAMP SHALE – WIDESPREAD, THICK, CONSISTENT & REPEATABLE 8 |
 HZ Wolfcamp – 79% of IP is Oil Source: Publicly available regulatory filings, company presentations. 9 |
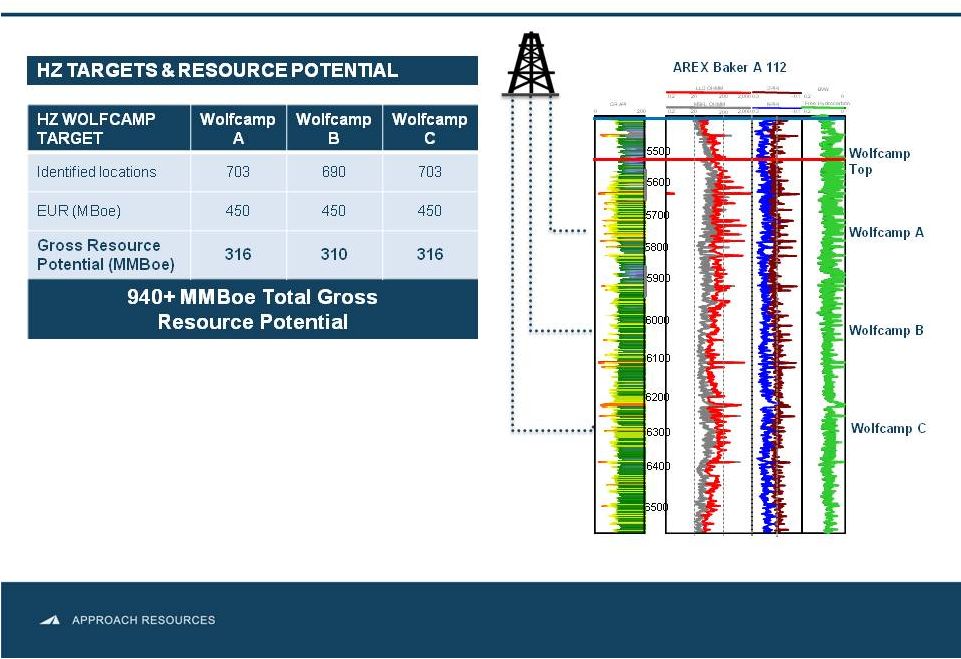 Exhibit 99.2 Wolfcamp Stacked Pay Zones Notes: Identified locations based on multi-bench development and 120-acre spacing. No locations assigned to south Project Pangea. 10 |
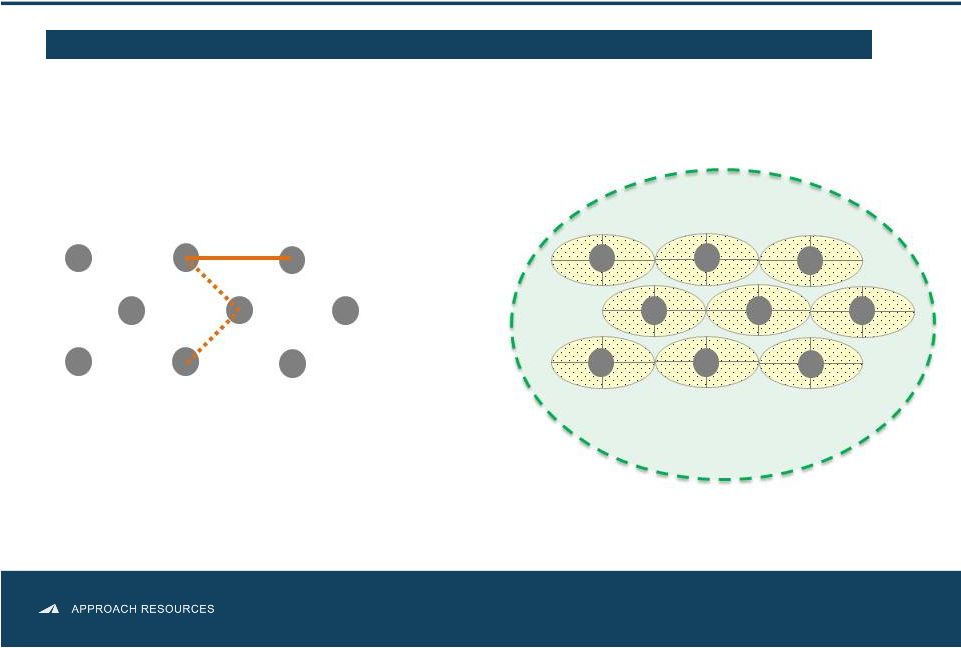 X-Section View (heel to toe) Allows maximum volumes of shale reservoir to be fraced Multiple Lateral Stacking – Effective Frac Volumes A Bench B Bench C Bench 660’ 481’ 481’ CHEVRON STACKING DEVELOPMENT PATTERN 11 |
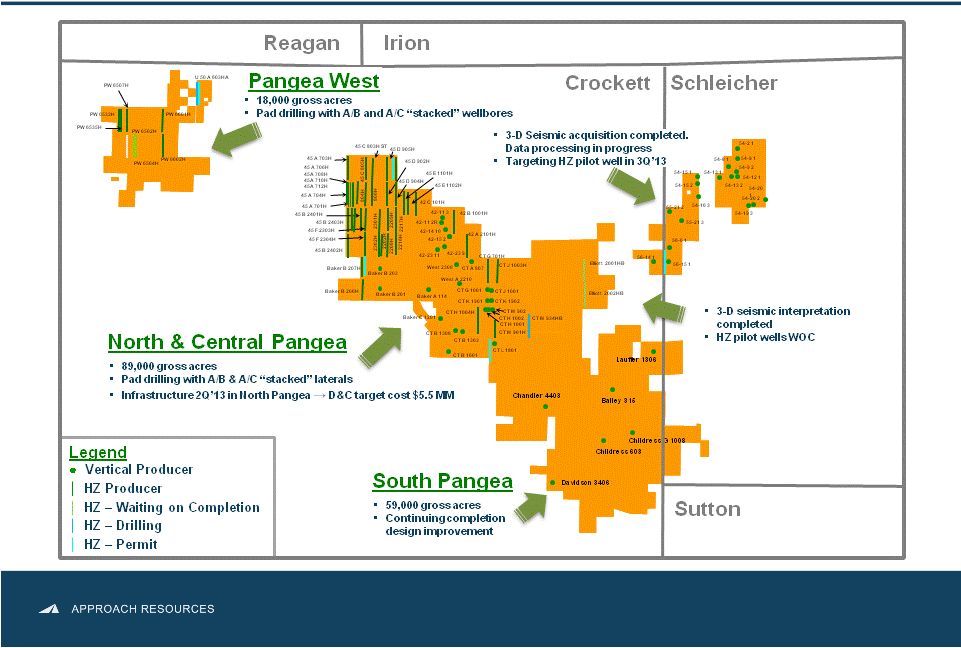 AREX HZ Wolfcamp Activity 12 Notes: Acreage as of 3/31/2013. |
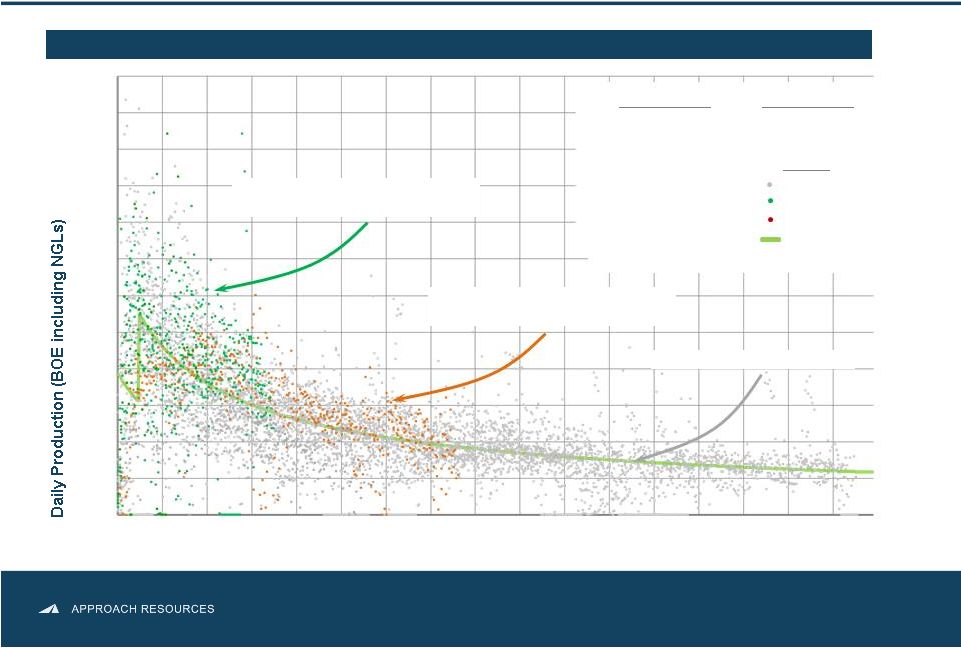 HZ Wolfcamp Well Performance 13 0 100 200 300 400 500 600 700 800 900 1,000 1,100 1,200 0 60 120 180 240 300 360 420 480 Daily Production Data from AREX Recent 7 Horizontal Wells 450 MBoe Type Curve Daily Production Data from AREX A Bench Wells Time (Days) CONTINUED STRONG WELLS RESULTS – TRACKING ABOVE THE TYPE CURVE B Bench well data 45 A 701H 45 D 902H 45 C 803H 45 B 2401H 45 E 1101H 45 F 2301H 45 F 2302H 45 C 805H 45 C 804H 45 F 2303H 45 F 2304H 45 A 703H 45 B 2403H 45 B 2402H CT J 1003H 45 C 806H PW 6507H PW 6601H PW 6602H B Bench Wells A Bench Wells Legend A Bench well data 450 MBoe Type Curve 45 E 1102H 45 G 2208H 45 G 2209H 45 G 2216H 45 G 2217H Baker B 206H Baker B 207H Recent B bench well data from 7 wells |
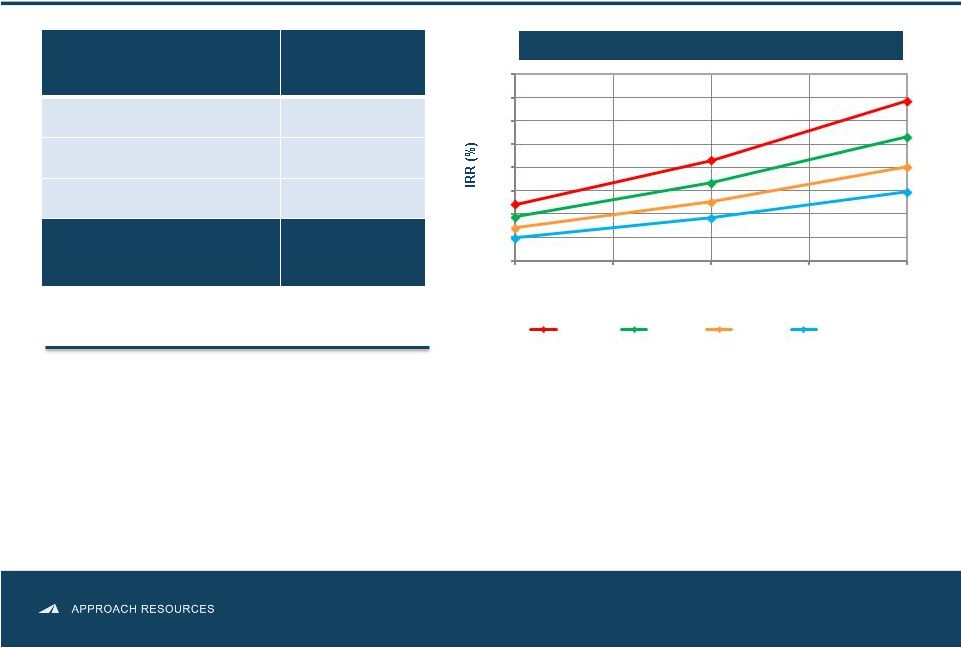 AREX HZ Wolfcamp Economics 14 Notes: Identified locations based on multi-bench development and 120-acre spacing for HZ Wolfcamp. No locations assigned to south Project Pangea. Play Type Horizontal Wolfcamp Avg. EUR (gross) 450 MBoe Targeted Well Cost $5.5 MM Potential Locations 2,096 Gross Resource Potential 940+ MMBoe BTAX IRR SENSITIVITIES • Horizontal drilling improves recoveries and returns • Multiple, stacked horizontal targets • 7,000’+ lateral length • ~80% of EUR made up of oil and NGLs • 3 HZ rigs running in Project Pangea / Pangea West 0 10 40 50 60 70 80 350 400 450 500 550 $100 / bbl $90 / bbl $80 / bbl $70 / bbl 20 30 Well EUR (MBoe) |
 AREX Drilling Locations, Targets & Resource Potential 15 Notes: Potential locations based on 120-acre spacing for HZ Wolfcamp, 20-acre spacing for Vertical Wolffork, 20 to 40-acre spacing for Vertical Wolffork Recompletions and 40-acre spacing for Vertical Canyon Wolffork. No Wolfcamp or Wolffork locations assigned to south Project Pangea. TARGET DRLLING DEPTH (FT.) EUR (MBoe) IDENTIFIED LOCATIONS GROSS RESOURCE POTENTIAL Horizontal Wolfcamp Wolfcamp A 7,000+ (lateral length) 450 703 316,350 Wolfcamp B 7,000+ (lateral length) 450 690 310,500 Wolfcamp C 7,000+ (lateral length) 450 703 316,350 Total HZ 2,096 943,200 Vertical Wolffork Recompletions, Wolffork & Canyon Wolffork < 7,500 to < 8,500 93 to 193 887 124,594 1.1 BnBoe Total Gross Resource Potential Multiple Decades of HZ Drilling Inventory |
 Infrastructure for Large-Scale Development 16 • Reducing D&C Cost to $5.5 MM or lower • Reducing LOE • Minimizing truck traffic and surface disturbance • Increasing project profit margin Pangea West North & Central Pangea South Pangea Schleicher Crockett Irion Reagan Sutton |
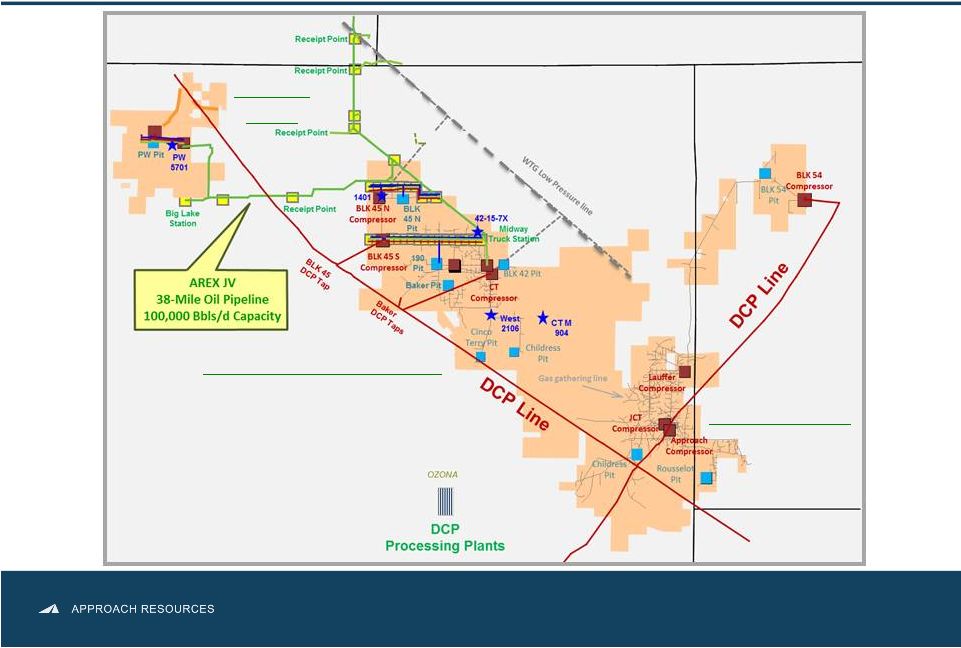
 Infrastructure & Equipment Projects 17 • Safely and securely transport water across Project Pangea and Pangea West • Reduce time and money spent on water hauling and disposal and truck traffic • Expected savings from water transfer equipment ~$0.1 MM/HZ well • Expected savings from SWD system ~$0.45 MM/HZ well • Expected company-wide LOE savings ±$0.4 MM per month • Replace rental equipment and contractors with Company-owned and operated equipment and personnel; reduce money spent on flowback operations • Expected savings from flowback equipment ~$0.1 MM/HZ well • Expected LOE savings from gas lift system $6,300/HZ per month • Facilitate large-scale field development • Reduce fresh water use and water costs • Expected savings from non-potable water source ~$0.45 MM/HZ well • Efficiently transport crude oil to market and reduce inventory • Reduce oil transportation differential to an estimated $2.50/Bbl – $4.00/Bbl Purchasing and installing water transfer equipment Drilling and/or converting SWD wells Purchasing and installing flowback equipment Securing water supply Testing non-potable water and recycling flowback water Installing crude takeaway lines Purchased oil hauling trucks BENEFITS Infrastructure and equipment projects are key to large-scale field development and to reducing D&C costs as well as LOE cost PROJECTS |
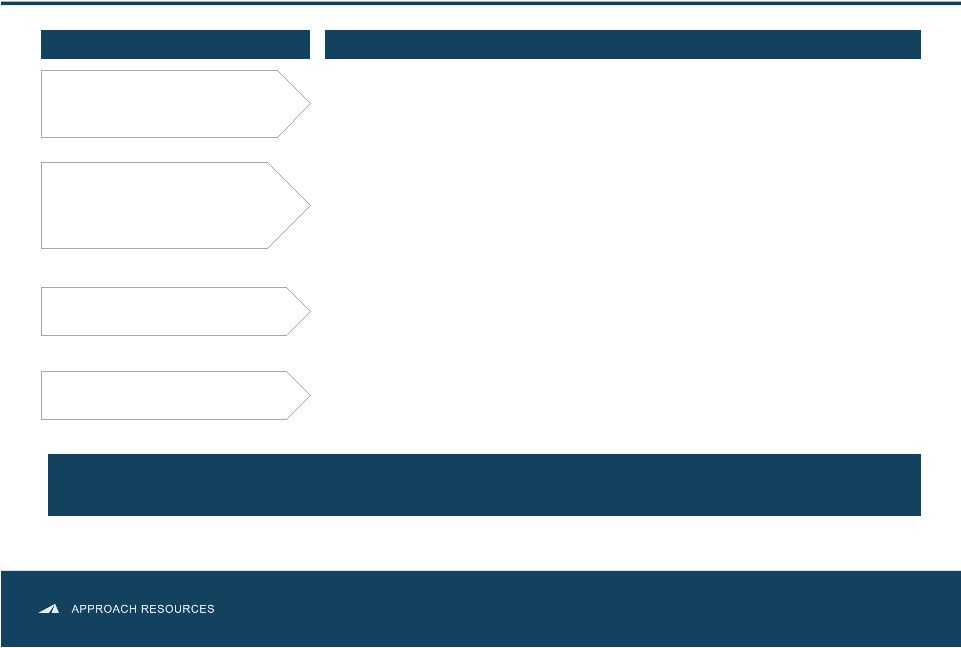
 Creating Value Through Growth • Concentrated geographic footprint in the Midland Basin • Strong growth track record at competitive costs • Detailed technical evaluation led to discovery of growth potential in the Wolfcamp oil shale resource play • Rigorous pilot program de-risked ~107,000 gross acres • 2013 Focus 18 Hitting $5.5 MM HZ well cost target in 2Q’13 Testing multi-bench “stacked” laterals and closer well spacing Transition to full-field development |
 Financial Information NON-GAAP RECONCILIATIONS |
 2013 Capital Budget • 2013 Capital budget $260 MM, approx. 90% for HZ Wolfcamp • 3 HZ rigs in the Wolfcamp shale • Targeting 30%+ production growth Key takeaways: • 2013 Production guidance 3.6 MMBoe – 3.9 MMBoe • 2013E Production mix 70% liquids • Targeting Wolfcamp A, B and C • Optimizing well spacing and completion design 2013 capital program provides flexibility to develop Wolfcamp oil shale and monitor commodity prices and service costs Increase in oil production drives expected increase in cash flow Borrowing base increase to $315 MM strengthens liquidity 20 • Testing “stacked-wellbore” development |
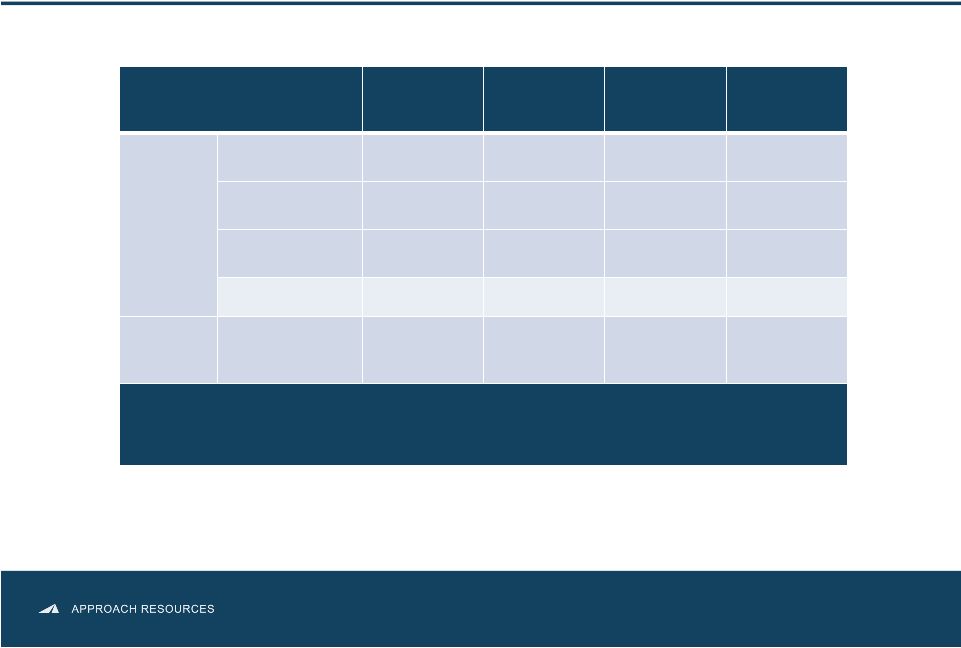
 2013 Operating and Financial Guidance 2013 GUIDANCE 2013 Guidance Production Total (MBoe) 3,600 – 3,900 Percent Oil & NGLs 70% Operating costs and expenses ($/per Boe) Lease operating $ 7.00 – 8.00 Production and ad valorem taxes $ 3.00 – 4.50 Exploration $ 2.00 – 3.00 General and administrative $ 7.00 – 8.50 Depletion, depreciation and amortization $ 20.00 – 24.00 Capital expenditures ($MM) Approximately $260 • 2Q13 Production guidance 9.3 MBoe/d – 9.6 MBoe/d 21 |
 Hedge Position CURRENT HEDGE POSITION Commodity and Time Period Type Volume Price Crude Oil 2013 Collar 650 Bbls/d $90.00/Bbl - $105.80/Bbl 2013 Collar 450 Bbls/d $90.00/Bbl - $101.45/Bbl 2013 (1) Collar 1,200 Bbls/d $90.35/Bbl - $100.35/Bbl 2014 Collar 550 Bbls/d $90.00/Bbl - $105.50/Bbl Crude Oil Basis Differential (Midland/Cushing) 2013 (2) Swap 2,300 Bbls/d $1.10/Bbl Natural Gas 2013 Swap 200,000 MMBtu/month $3.54/MMBtu 2013 Swap 190,000 MMBtu/month $3.80/MMBtu 2013 (3) Collar 100,000 MMBtu/month $4.00/MMBtu - $4.36/MMBtu 2014 Swap 360,000 MMBtu/month $4.18/MMBtu (1) February 2013 – December 2013 (2) March 2013 – December 2013 (3) May 2013 – December 2013 • Prudent hedging program protects cash flow and returns as well as capital budget activities 53% of FY’13 oil hedged at $90.17/Bbl x $102.19/Bbl 81% of FY’13 gas hedged at weighted average floor of $3.72/MMBtu 22 |
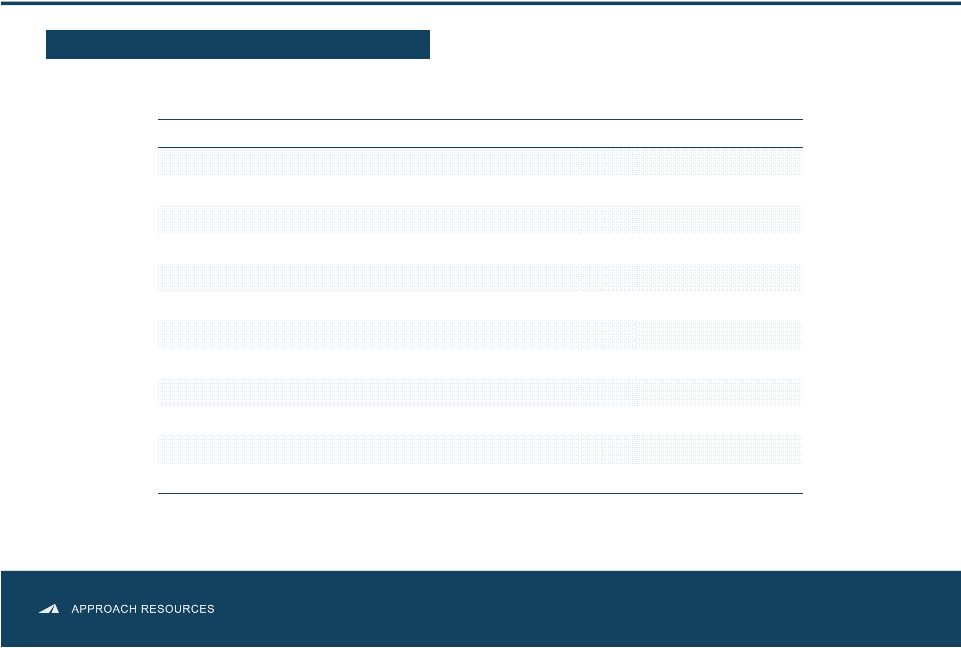
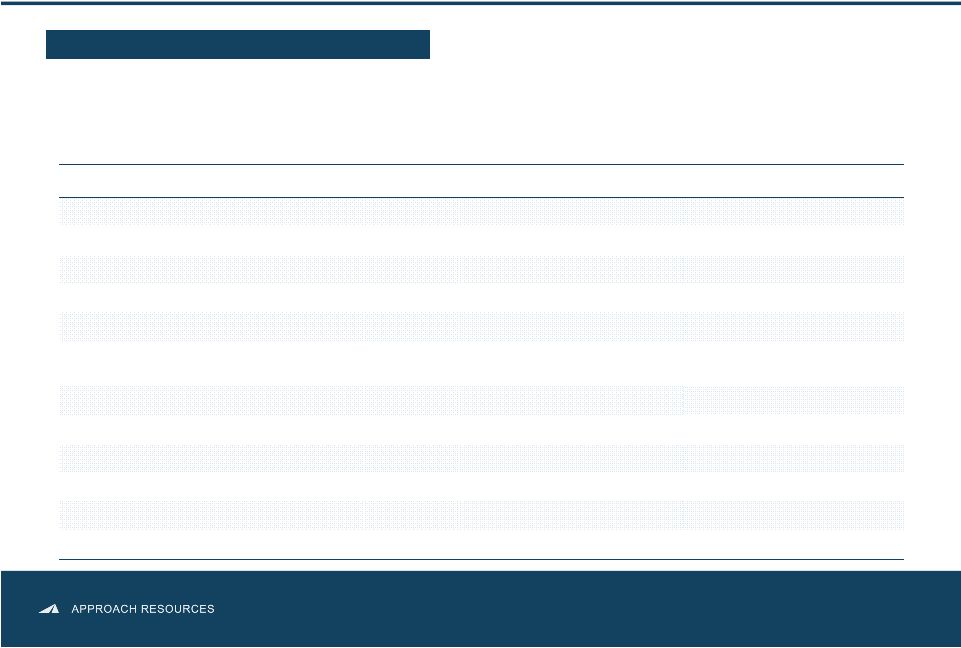
 Adjusted Net Income (unaudited) 23 The amounts included in the calculation of adjusted net income and adjusted net income per diluted share below were computed in accordance with GAAP. We believe adjusted net income and adjusted net income per diluted share are useful to investors because they provide readers with a more meaningful measure of our profitability before recording certain items whose timing or amount cannot be reasonably determined. However, these measures are provided in addition to, and not as an alternative for, and should be read in conjunction with, the information contained in our financial statements prepared in accordance with GAAP (including the notes), included in our SEC filings and posted on our website. The following table provides a reconciliation of adjusted net income to net (loss) income for the three months ended March 31, 2013 and 2012, respectively. (in thousands, except per-share amounts) Three Ended March 31, 2013 2012 Net (loss) income $ (347) $ 1,714 Adjustments for certain items: Unrealized loss on commodity derivatives 4,100 2,672 Related income tax effect (1,394) (908) Adjusted net income $ 2,359 $ 3,478 Adjusted net income per diluted share $ 0.06 $ 0.10 |
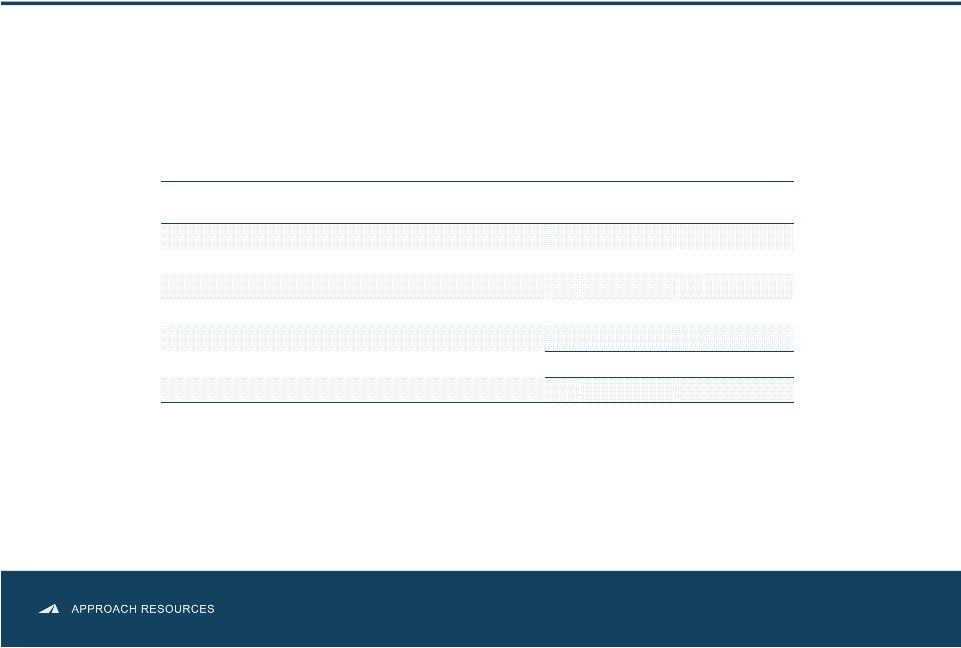
 EBITDAX (unaudited) The following table provides a reconciliation of EBITDAX to net (loss) income for the three months ended March 31, 2013 and 2012, respectively. (in thousands, except per-share amounts) Three Months Ended March 31, 2013 2012 Net (loss) income $ (347) $ 1,171 Exploration 260 1,287 Depletion, depreciation and amortization 17,056 11,030 Share-based compensation 2,257 2,232 Unrealized loss on commodity derivatives 4,100 2,672 Interest expense, net 1,229 887 Income tax (benefit) provision (187) 982 EBITDAX $ 24,368 $ 20,804 EBITDAX per diluted share $ 0.63 $ 0.62 We define EBITDAX as net income, plus (1) exploration expense, (2) depletion, depreciation and amortization expense, (3) share-based compensation expense, (4) unrealized loss on commodity derivatives, (5) interest expense and (6) income taxes. EBITDAX is not a measure of net income or cash flow as determined by GAAP. The amounts included in the calculation of EBITDAX were computed in accordance with GAAP. EBITDAX is presented herein and reconciled to the GAAP measure of net income because of its wide acceptance by the investment community as a financial indicator of a company's ability to internally fund development and exploration activities. This measure is provided in addition to, and not as an alternative for, and should be read in conjunction with, the information contained in our financial statements prepared in accordance with GAAP (including the notes), included in our SEC filings and posted on our website. 24 |
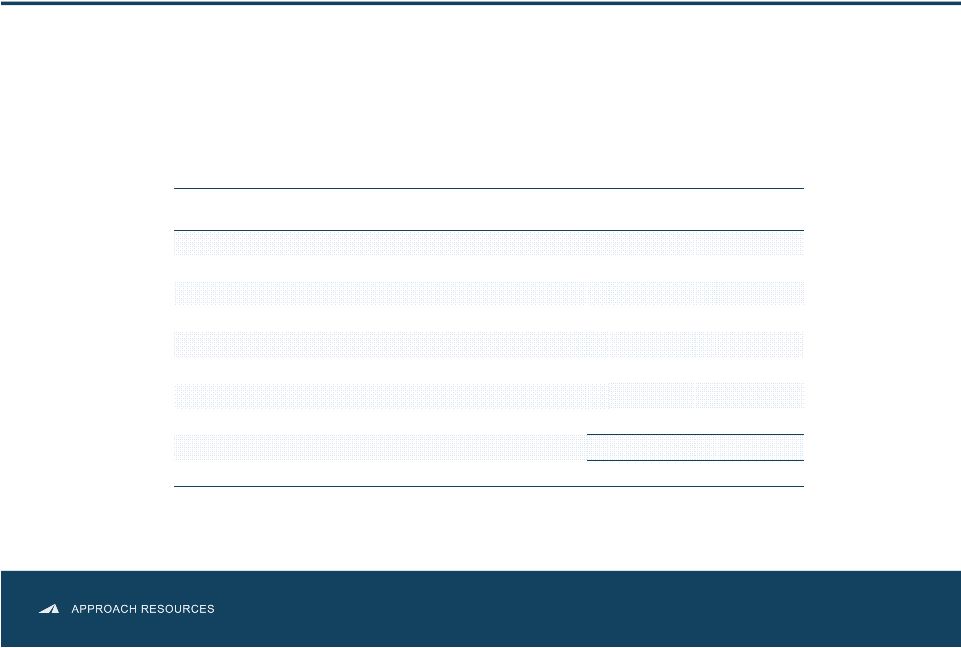
 Liquidity (in thousands) March 31, 2013 Pro Forma March 31, 2013 Borrowing base $ 280,000 $ 315,000 Cash and cash equivalents 594 594 Long-term debt (152,250) (152,250) Unused letters of credit (325) (325) Liquidity $ 128,019 $ 163,019 (in thousands) March 31, 2013 December 31, 2012 Long-term debt $ 152,250 $ 106,000 Total stockholders’ equity 635,211 633,468 $ 787,461 $ 739,468 Long-term debt-to- capital 19.3% 14.3% indicator of the Company’s ability to fund development and exploration activities. Liquidity has limitations, and can vary from year to year for the Company and can vary among companies based on what is or is not included in the measurement on a company’s financial statements. Liquidity is provided in addition to, and not as an alternative for, and should be read in conjunction with, the information contained in our financial statements prepared in accordance with GAAP (including the notes), included in our SEC filings and posted on our website. The table below summarizes our liquidity at March 31, 2013, and our liquidity at March 31, 2013, on a pro forma basis to give effect to our May 1, 2013, borrowing base increase. (GAAP). We use the long-term debt-to-capital ratio as a measurement of our overall financial leverage. However, this ratio has limitations. This ratio can vary from year-to-year for the Company and can vary among companies based on what is or is not included in the ratio on a company’s financial statements. This ratio is provided in addition to, and not as an alternative for, and should be read in conjunction with, the information contained in our financial statements prepared in accordance with GAAP (including the notes), included in our SEC filings and posted on our website. The table below summarizes our long-term debt-to-capital ratio at March 31, 2013, and December 31, 2012. Liquidity (unaudited) is calculated by adding the net funds available under our revolving credit facility and cash and cash equivalents. We use liquidity as an Long-term debt-to-capital ratio (unaudited) is calculated by dividing long-term debt (GAAP) by the sum of total stockholders’ equity (GAAP) and long-term debt 25 |
 Contact Information MEGAN P. HAYS Manager, Investor Relations & Corporate Communications 817.989.9000 x2108 mhays@approachresources.com www.approachresources.com |