Exhibit 99.3
Approach Resources Inc.
THIRD QUARTER 2013 RESULTS
NOVEMBER 7, 2013
Forward-Looking Statements
This presentation contains forward-looking statements within the meaning of Section 27A of the Securities Act of 1933 and Section 21E of the Securities Exchange Act of 1934. All statements, other than statements of historical facts, included in this presentation that address activities, events or developments that the Company expects, believes or anticipates will or may occur in the future are forward-looking statements. Without limiting the generality of the foregoing, forward-looking statements contained in this presentation specifically include the expectations of management regarding plans, strategies, objectives, anticipated financial and operating results of the Company, including as to the Company’s Wolfcamp shale resource play, estimated resource potential and recoverability of the oil and gas, estimated reserves and drilling locations, capital expenditures, typical well results and well profiles, type curve, and production and operating expenses guidance included in the presentation. These statements are based on certain assumptions made by the Company based on management’s experience and technical analyses, current conditions, anticipated future developments and other factors believed to be appropriate and believed to be reasonable by management. When used in this presentation, the words “will,” “potential,” “believe,” “intend,” “expect,” “may,” “should,” “anticipate,” “could,” “estimate,” “plan,” “predict,” “project,” “target,” “profile,” “model” or their negatives, other similar expressions or the statements that include those words, are intended to identify forward-looking statements, although not all forward-looking statements contain such identifying words. Such statements are subject to a number of assumptions, risks and uncertainties, many of which are beyond the control of the Company, which may cause actual results to differ materially from those implied or expressed by the forward-looking statements. In particular, careful consideration should be given to the cautionary statements and risk factors described in the Company’s most recent Annual Report on Form 10-K and Quarterly Reports on Form 10-Q. Any forward-looking statement speaks only as of the date on which such statement is made and the Company undertakes no obligation to correct or update any forward-looking statement, whether as a result of new information, future events or otherwise, except as required by applicable law.
Cautionary Statements Regarding Oil & Gas Quantities
The Securities and Exchange Commission (“SEC”) permits oil and gas companies, in their filings with the SEC, to disclose only proved, probable and possible reserves that meet the SEC’s definitions for such terms, and price and cost sensitivities for such reserves, and prohibits disclosure of resources that do not constitute such reserves. The Company uses the terms “estimated ultimate recovery” or “EUR,” reserve or resource “potential,” and other descriptions of volumes of reserves potentially recoverable through additional drilling or recovery techniques that the SEC’s rules may prohibit the Company from including in filings with the SEC. These estimates are by their nature more speculative than estimates of proved, probable and possible reserves and accordingly are subject to substantially greater risk of being actually realized by the Company.
EUR estimates, identified drilling locations and resource potential estimates have not been risked by the Company. Actual locations drilled and quantities that may be ultimately recovered from the Company’s interest may differ substantially from the Company’s estimates. There is no commitment by the Company to drill all of the drilling locations that have been attributed these quantities. Factors affecting ultimate recovery include the scope of the Company’s ongoing drilling program, which will be directly affected by the availability of capital, drilling and production costs, availability of drilling and completion services and equipment, drilling results, lease expirations, regulatory approval and actual drilling results, as well as geological and mechanical factors Estimates of unproved reserves, type/decline curves, per well EUR and resource potential may change significantly as development of the Company’s oil and gas assets provides additional data.
Type/decline curves, estimated EURs, resource potential, recovery factors and well costs represent Company estimates based on evaluation of petrophysical analysis, core data and well logs, well performance from limited drilling and recompletion results and seismic data, and have not been reviewed by independent engineers. These are presented as hypothetical recoveries if assumptions and estimates regarding recoverable hydrocarbons, recovery factors and costs prove correct. The Company has very limited production experience with these projects, and accordingly, such estimates may change significantly as results from more wells are evaluated. Estimates of resource potential and EURs do not constitute reserves, but constitute estimates of contingent resources which the SEC has determined are too speculative to include in SEC filings. Unless otherwise noted, IRR estimates are before taxes and assume NYMEX forward-curve oil and gas pricing and Company-generated EUR and decline curve estimates based on Company drilling and completion cost estimates that do not include land, seismic or G&A costs.
2
Company Overview
AREX OVERVIEW
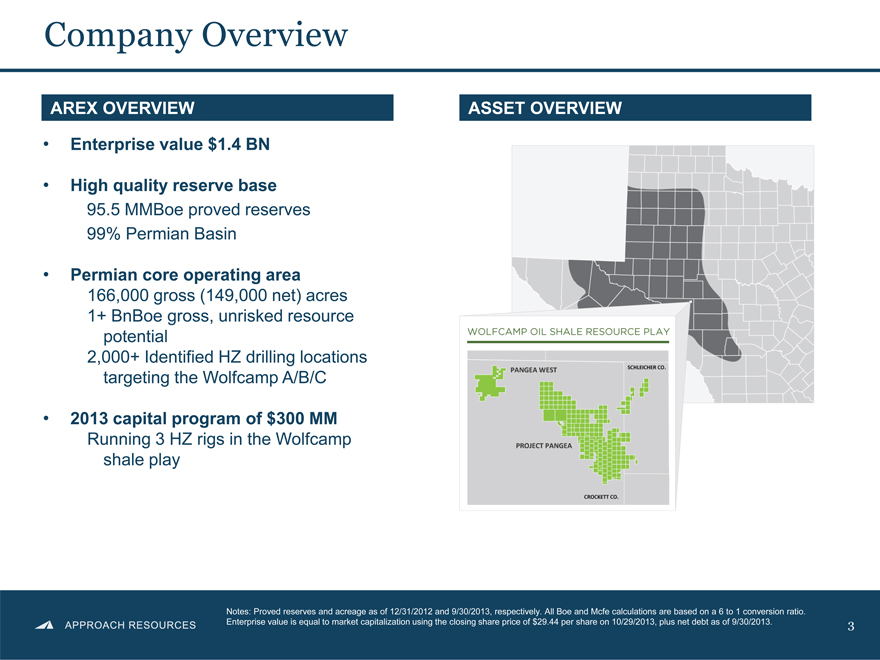
Enterprise value $1.4 BN
High quality reserve base
95.5 MMBoe proved reserves 99% Permian Basin
Permian core operating area
166,000 gross (149,000 net) acres
1+ BnBoe gross, unrisked resource potential 2,000+ Identified HZ drilling locations targeting the Wolfcamp A/B/C
2013 capital program of $300 MM
Running 3 HZ rigs in the Wolfcamp shale play
ASSET OVERVIEW
Notes: Proved reserves and acreage as of 12/31/2012 and 9/30/2013, respectively. All Boe and Mcfe calculations are based on a 6 to 1 conversion ratio.
Enterprise value is equal to market capitalization using the closing share price of $29.44 per share on 10/29/2013, plus net debt as of 9/30/2013.
3
Strong Track Record of Reserve Growth…
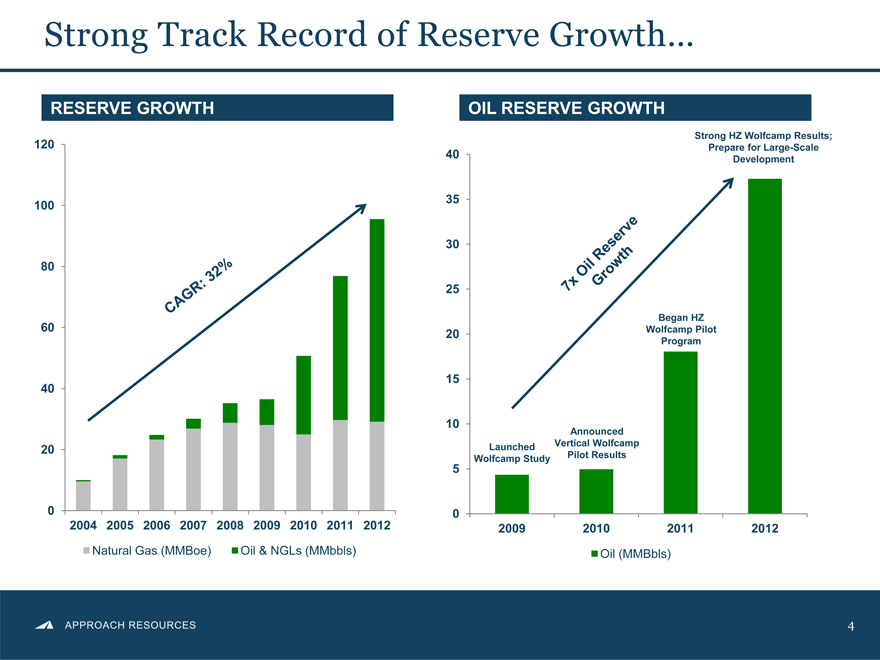
RESERVE GROWTH
0 20 40 60 80 100 120
CAGR : 32%
2004 2005 2006 2007 2008 2009 2010 2011 2012
Natural Gas (MMBoe)
Oil & NGLs (MMbbls)
OIL RESERVE GROWTH
0 5 10 15 20 25 30 35 40
2009 2010 2011 2012
Oil (MMBbls)
7x oil Reserve Growth
Launched Wolfcamp Study
Announced Vertical wolfcamp pilot Results
Began HZ Wolfcamp pilot program
Strong HZ wolfcamp Results; prepare for Largescale Development
Oil(MMBbls)
4
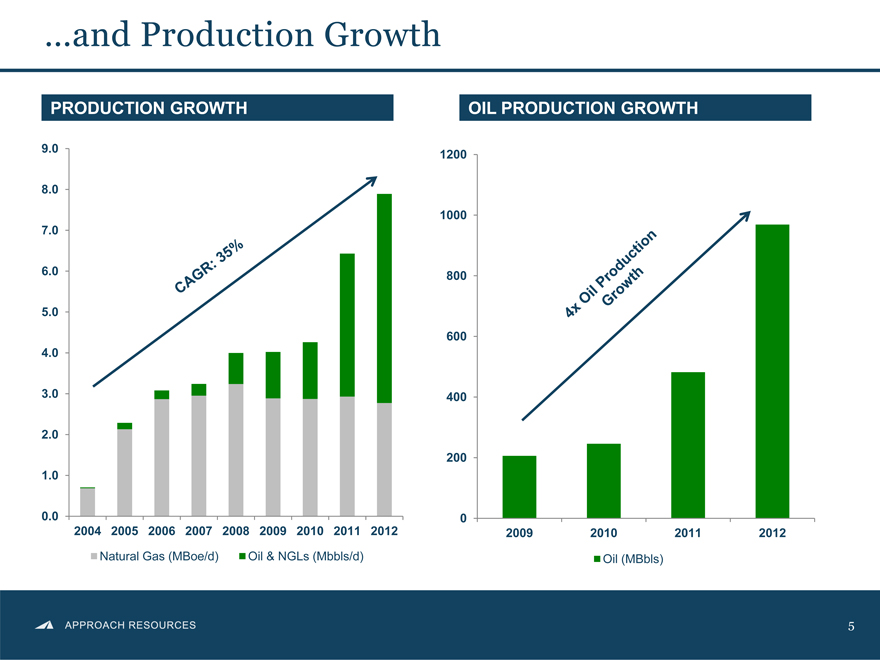
…and Production Growth
PRODUCTION GROWTH OIL PRODUCTION GROWTH
CARG:35%
1.0 2.0 3.0 4.0 5.0 6.0 7.0 8.0 9.0
2004 2005 2006 2007 2006 2008 2009 2010 2011 2012 2013 2014
Natural Gas (MBoe/d) Oil NGLs (Mbbls/d)
0 200 400 600 800 1000 1200
4x oil Production Growth
Oil (MBbls)
5
3Q13 Key Highlights
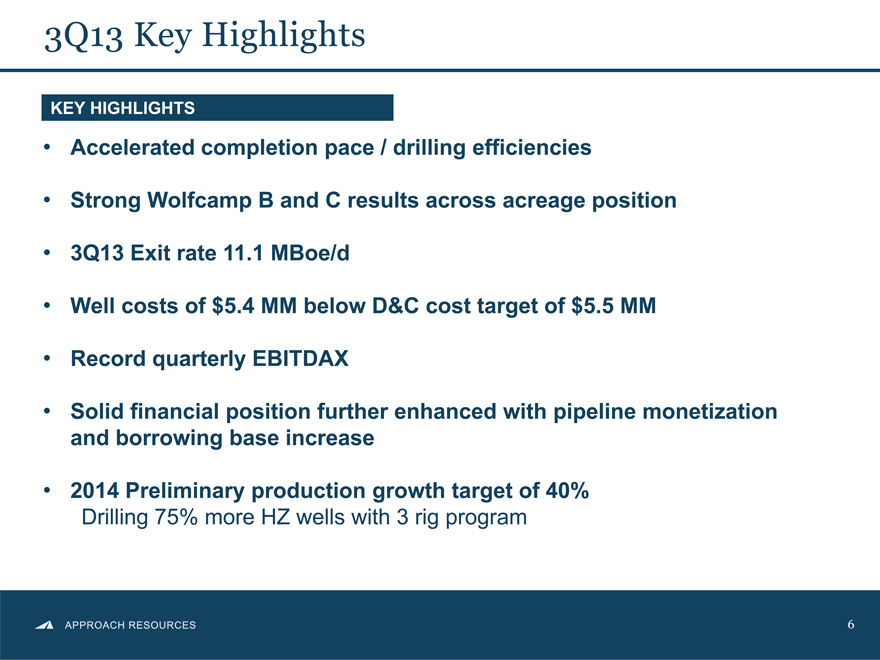
KEY HIGHLIGHTS
Accelerated completion pace / drilling efficiencies
Strong Wolfcamp B and C results across acreage position
3Q13 Exit rate 11.1 MBoe/d
Well costs of $5.4 MM below D&C cost target of $5.5 MM
Record quarterly EBITDAX
Solid financial position further enhanced with pipeline monetization and borrowing base increase
2014 Preliminary production growth target of 40%
Drilling 75% more HZ wells with 3 rig program
6
3Q13 Operational Update
3Q13 Operating Highlights
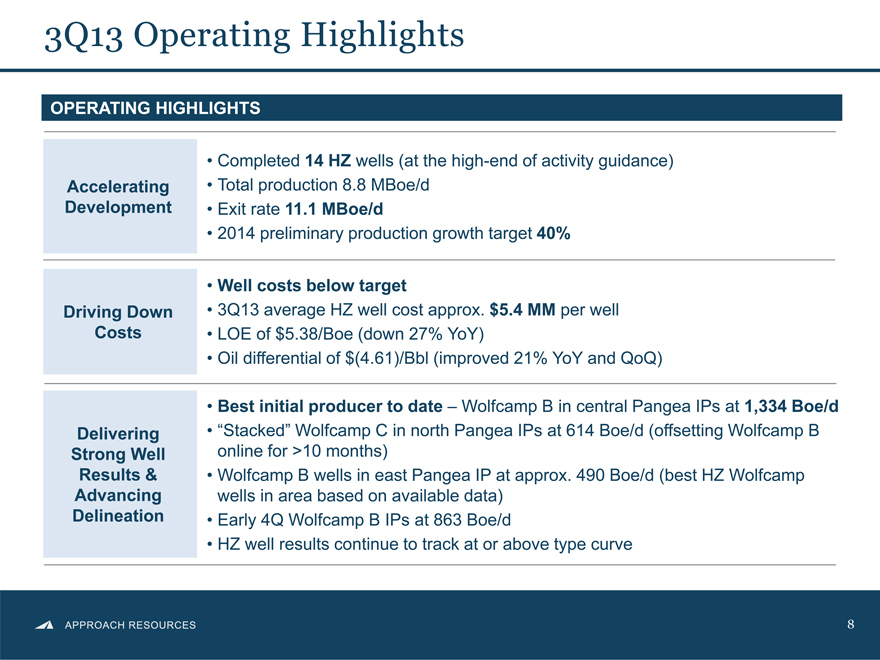
OPERATING HIGHLIGHTS
Completed 14 HZ wells (at the high-end of activity guidance) Accelerating Total production 8.8 MBoe/d
Development Exit rate 11.1 MBoe/d
2014 preliminary production growth target 40%
Well costs below target
Driving Down 3Q13 average HZ well cost approx. $5.4 MM per well Costs LOE of $5.38/Boe (down 27% YoY)
Oil differential of $(4.61)/Bbl (improved 21% YoY and QoQ)
Best initial producer to date – Wolfcamp B in central Pangea IPs at 1,334 Boe/d Delivering “Stacked” Wolfcamp C in north Pangea IPs at 614 Boe/d (offsetting Wolfcamp B Strong Well online for >10 months) Results & Wolfcamp B wells in east Pangea IP at approx. 490 Boe/d (best HZ Wolfcamp Advancing wells in area based on available data) Delineation Early 4Q Wolfcamp B IPs at 863 Boe/d
HZ well results continue to track at or above type curve
8
AREX Wolfcamp Shale Oil Resource Play
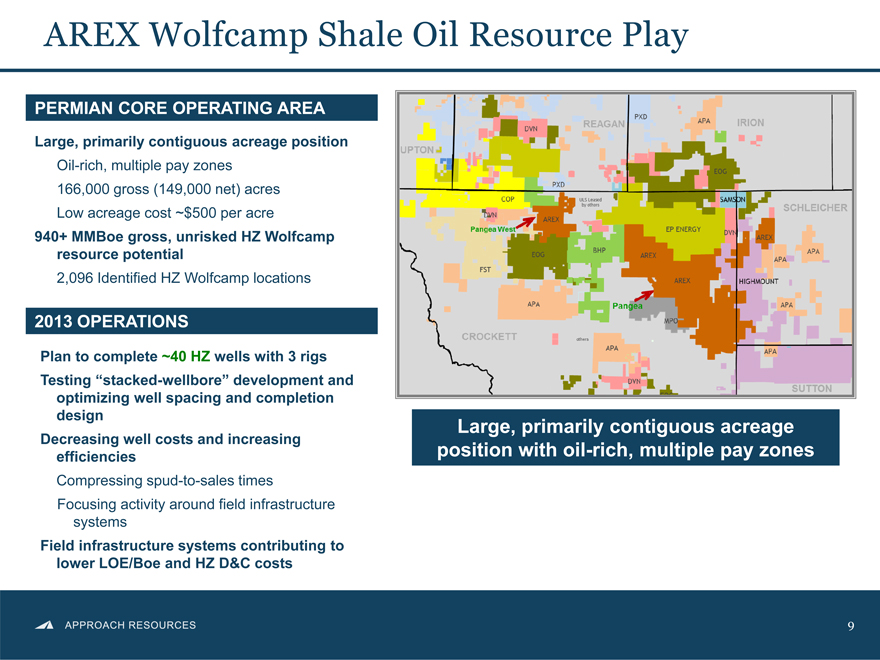
PERMIAN CORE OPERATING AREA
Large, primarily contiguous acreage position
Oil-rich, multiple pay zones 166,000 gross (149,000 net) acres Low acreage cost ~$500 per acre
940+ MMBoe gross, unrisked HZ Wolfcamp resource potential
2,096 Identified HZ Wolfcamp locations
2013 OPERATIONS
Plan to complete ~40 HZ wells with 3 rigs Testing “stacked-wellbore” development and optimizing well spacing and completion design Decreasing well costs and increasing efficiencies
Compressing spud-to-sales times
Focusing activity around field infrastructure systems
Field infrastructure systems contributing to lower LOE/Boe and HZ D&C costs
Large, primarily contiguous acreage position with oil-rich, multiple pay zones
9
Wolfcamp Shale Oil Play
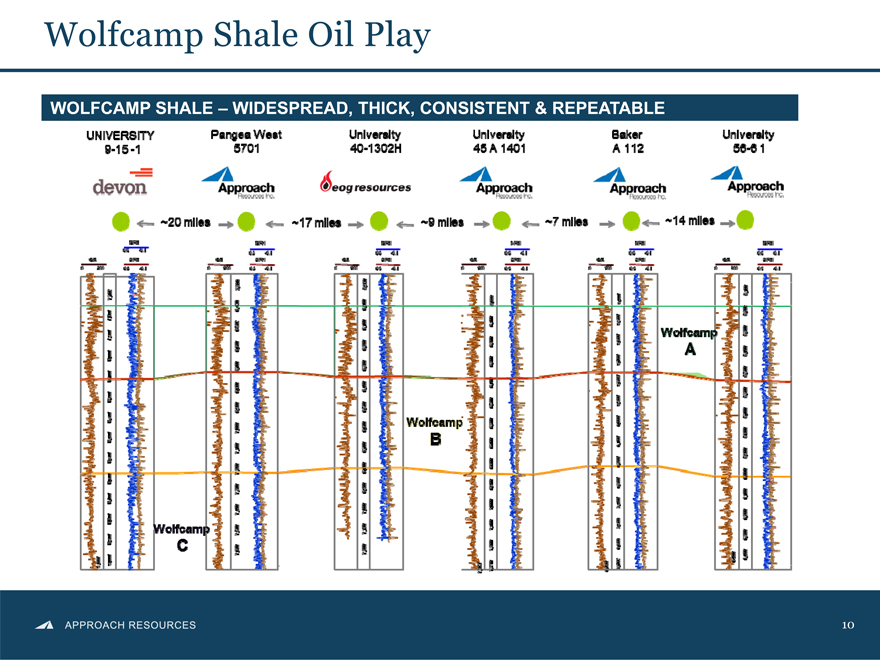
WOLFCAMP SHALE – WIDESPREAD, THICK, CONSISTENT & REPEATABLE
10
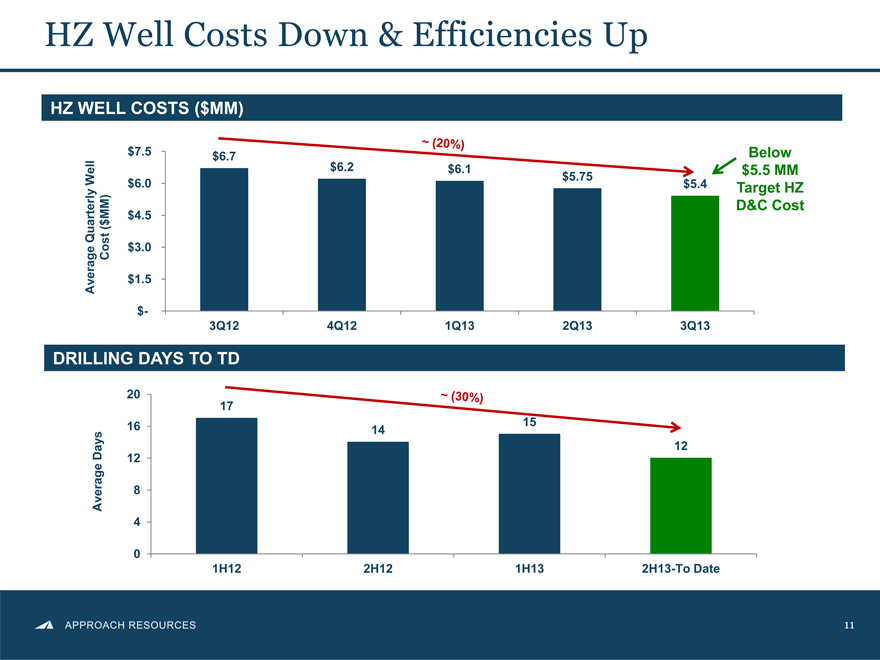
HZ Well Costs Down & Efficiencies Up
HZ WELL COSTS ($MM)
Average Quarterly Well Cost ($MM)
~ (20%)
Below $5.5 MM Target HZ D&C Cost
$7.5
$6
$4.5
$3
$1.5
$-
3Q12 4Q12 1Q13 2Q13 3Q13
$6.7 $6.2 $6.1 $5.75 $5.4
DRILLING DAYS TO TD
~ (30%)
Average Days
20 16 12 8 4 0
17 14 15 12
1H12 2H12 1H13 2H13-To Date
11
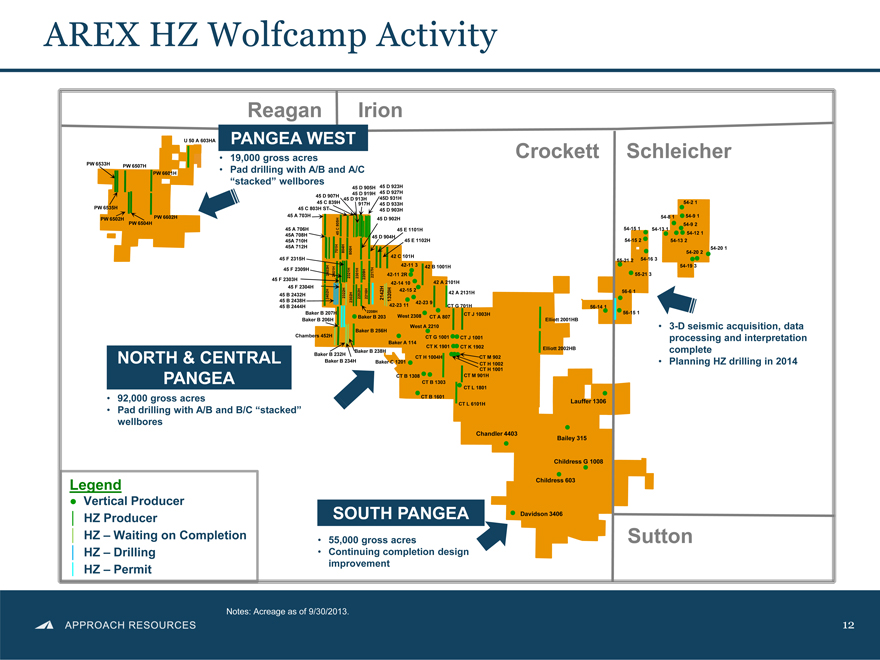
AREX HZ Wolfcamp Activity
Reagan
Irion
PANGEA WEST
19,000 gross acres
Pad drilling with A/B and A/C “stacked” wellbores
Crockett
Schleicher
3-D seismic acquisition, data processing and interpretation complete
Planning HZ drilling in 2014
92,000 gross acres
Pad drilling with A/B and B/C “stacked” wellbores
NORTH & CENTRAL PANGEA
Legend
Vertical Producer
HZ Producer
HZ – Waiting on Completion
HZ – Drilling
HZ – Permit
SOUTH PANGEA
55,000 gross acres
Continuing completion design improvement
Sutton
Notes: Acreage as of 9/30/2013.
12
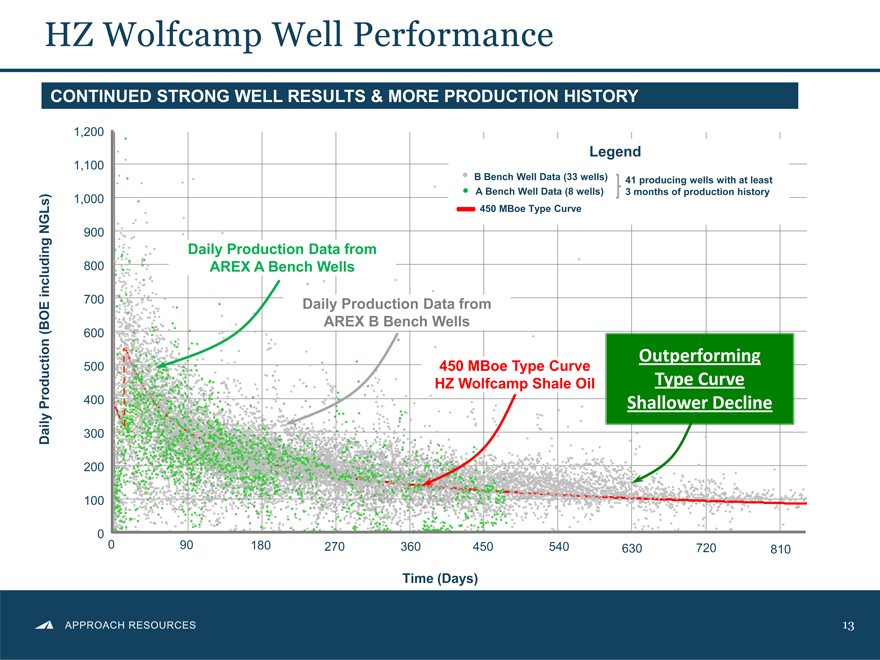
HZ Wolfcamp Well Performance
CONTINUED STRONG WELL RESULTS & MORE PRODUCTION HISTORY
1,200 1,100 1,000 900 800 700 600 500 400 300 200 100 0
Daily Production Data from AREX A Bench Wells
Daily Production Data from AREX B Bench Wells
450 MBoe Type Curve HZ Wolfcamp Shale Oil
Legend
B Bench Well Data (33 wells) 41 producing wells with at least A Bench Well Data (8 wells) 3 months of production history 450 MBoe Type Curve
Outperforming Type Curve Shallower Decline
Daily Production (BOE including NGLs)
0 90 180 270 360 450 540 630 720 810
Time (Days)
13
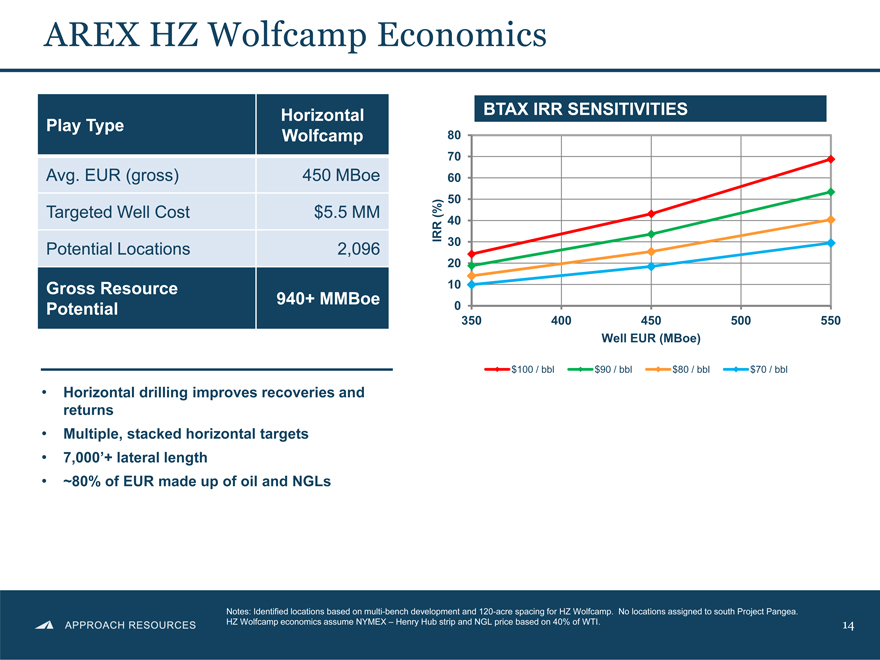
AREX HZ Wolfcamp Economics
Horizontal
Play Type Wolfcamp
Avg. EUR (gross) 450 MBoe
Targeted Well Cost $5.5 MM
Potential Locations 2,096
Gross Resource 940+ MMBoe
Potential
Horizontal drilling improves recoveries and returns Multiple, stacked horizontal targets 7,000’+ lateral length ~80% of EUR made up of oil and NGLs
BTAX IRR SENSITIVITIES
IRR (%)
80 70 60 50 40 30 20 10 0
350 400 450 500 550
Well EUR (MBoe)
$100 / bbl $90 / bbl $80 / bbl $70 / bbl
Notes: Identified locations based on multi-bench development and 120-acre spacing for HZ Wolfcamp. No locations assigned to south Project Pangea.
HZ Wolfcamp economics assume NYMEX – Henry Hub strip and NGL price based on 40% of WTI.
14
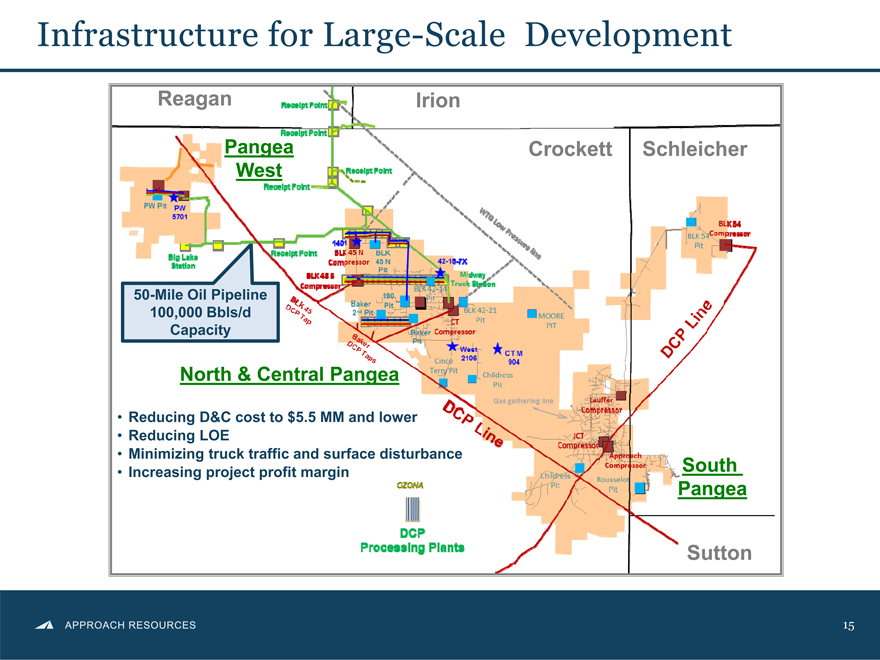
Infrastructure for Large-Scale Development
Reagan
Irion
Crockett
Schleicher
Pangea West
50-Mile Oil Pipeline
100,000 Bbls/d Capacity
North & Central Pangea
Reducing D&C cost to $5.5 MM and lower
Reducing LOE
Minimizing truck traffic and surface disturbance
Increasing project profit margin
South
Pangea
Sutton
15
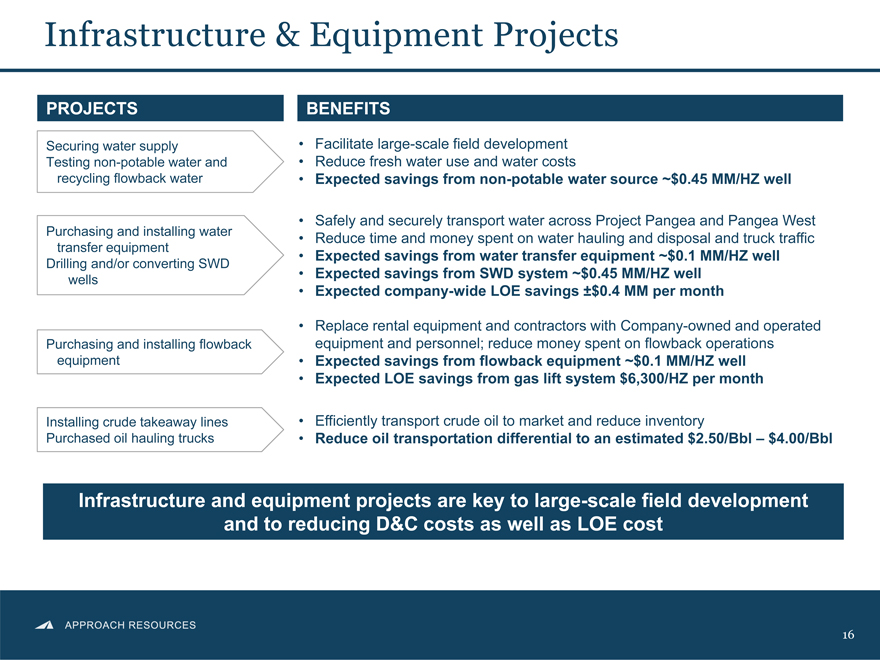
Infrastructure & Equipment Projects
PROJECTS
Securing water supply
Testing non-potable water and recycling flowback water
Facilitate large-scale field development
Reduce fresh water use and water costs
Expected savings from non-potable water source ~$0.45 MM/HZ well
Purchasing and installing water transfer equipment Drilling and/or converting SWD wells
Safely and securely transport water across Project Pangea and Pangea West
Reduce time and money spent on water hauling and disposal and truck traffic
Expected savings from water transfer equipment ~$0.1 MM/HZ well
Expected savings from SWD system ~$0.45 MM/HZ well
Expected company-wide LOE savings ±$0.4 MM per month
Purchasing and installing flowback equipment
Replace rental equipment and contractors with Company-owned and operated equipment and personnel; reduce money spent on flowback operations
Expected savings from flowback equipment ~$0.1 MM/HZ well
Expected LOE savings from gas lift system $6,300/HZ per month
Installing crude takeaway lines Purchased oil hauling trucks
Efficiently transport crude oil to market and reduce inventory
Reduce oil transportation differential to an estimated $2.50/Bbl – $4.00/Bbl
Infrastructure and equipment projects are key to large-scale field development and to reducing D&C costs as well as LOE cost
APPROACH RESOURCES
16
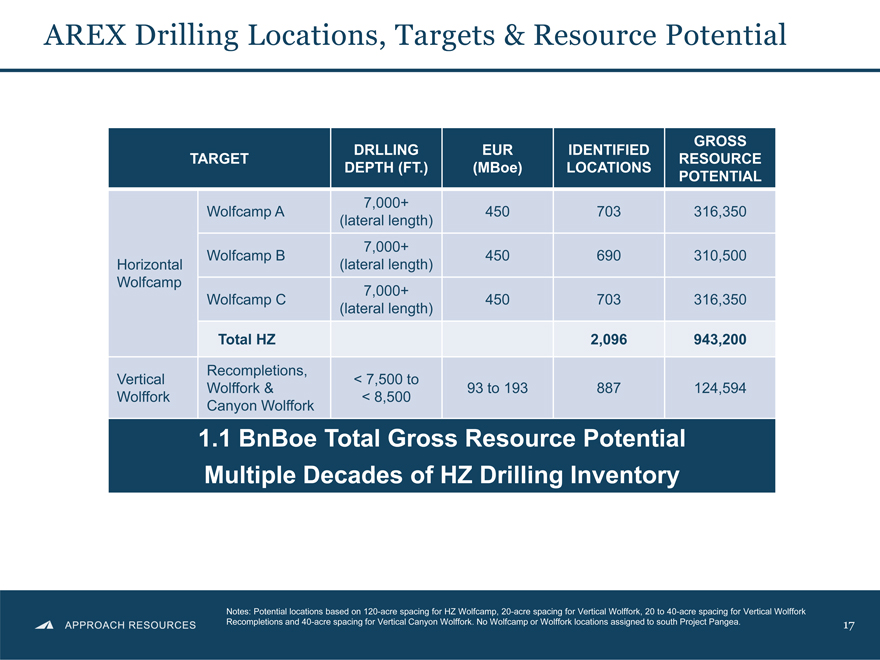
AREX Drilling Locations, Targets & Resource Potential
DRLLING EUR IDENTIFIED GROSS
TARGET RESOURCE
DEPTH (FT.) (MBoe) LOCATIONS POTENTIAL
7,000+
Wolfcamp A 450 703 316,350
(lateral length)
7,000+
Wolfcamp B 450 690 310,500
Horizontal (lateral length)
Wolfcamp 7,000+
Wolfcamp C 450 703 316,350
(lateral length)
Total HZ 2,096 943,200
Recompletions,
Vertical < 7,500 to
Wolffork & 93 to 193 887 124,594
Wolffork < 8,500
Canyon Wolffork
1.1 BnBoe Total Gross Resource Potential
Multiple Decades of HZ Drilling Inventory
APPROACH RESOURCES
Notes: Potential locations based on 120-acre spacing for HZ Wolfcamp, 20-acre spacing for Vertical Wolffork, 20 to 40-acre spacing for Vertical Wolffork
Recompletions and 40-acre spacing for Vertical Canyon Wolffork. No Wolfcamp or Wolffork locations assigned to south Project Pangea. 17

APPROACH RESOURCES
3Q13 Financial Update
3Q13 Financial Highlights
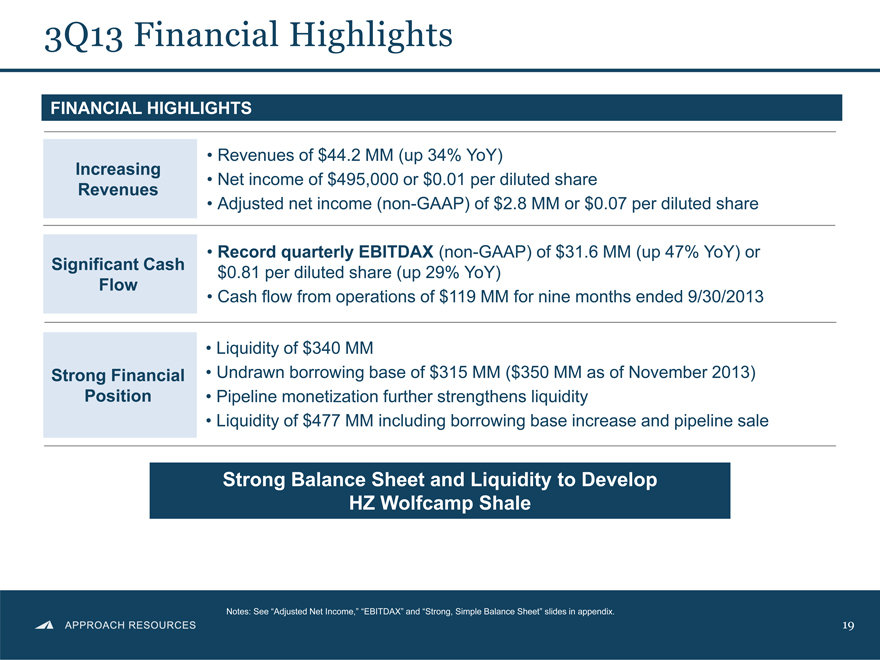
FINANCIAL HIGHLIGHTS
Increasing
Revenues
Revenues of $44.2 MM (up 34% YoY)
Net income of $495,000 or $0.01 per diluted share
Adjusted net income (non-GAAP) of $2.8 MM or $0.07 per diluted share
Record quarterly EBITDAX (non-GAAP) of $31.6 MM (up 47% YoY) or
Significant Cash Flow
$0.81 per diluted share (up 29% YoY)
Cash flow from operations of $119 MM for nine months ended 9/30/2013
Liquidity of $340 MM
Strong Financial Position
Undrawn borrowing base of $315 MM ($350 MM as of November 2013)
Pipeline monetization further strengthens liquidity
Liquidity of $477 MM including borrowing base increase and pipeline sale
Strong Balance Sheet and Liquidity to Develop HZ Wolfcamp Shale
APPROACH RESOURCES
Notes: See “Adjusted Net Income,” “EBITDAX” and “Strong, Simple Balance Sheet” slides in appendix.
19
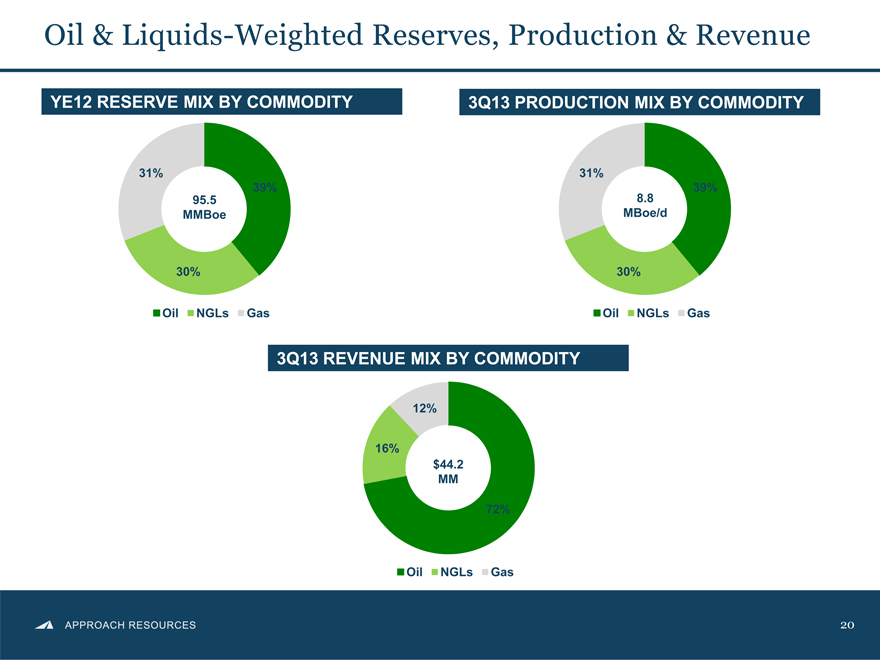
Oil & Liquids-Weighted Reserves, Production & Revenue
YE12 RESERVE MIX BY COMMODITY
31%
39%
30%
Oil NGLs Gas
95.5 MMBoe
3Q13 PRODUCTION MIX BY COMMODITY
31%
39%
30%
8.8 MBoe/d
Oil NGLs Gas
3Q13 REVENUE MIX BY COMMODITY
12%
16%
72%
$44.2 MM
Oil NGLs Gas
APPROACH RESOURCES
20
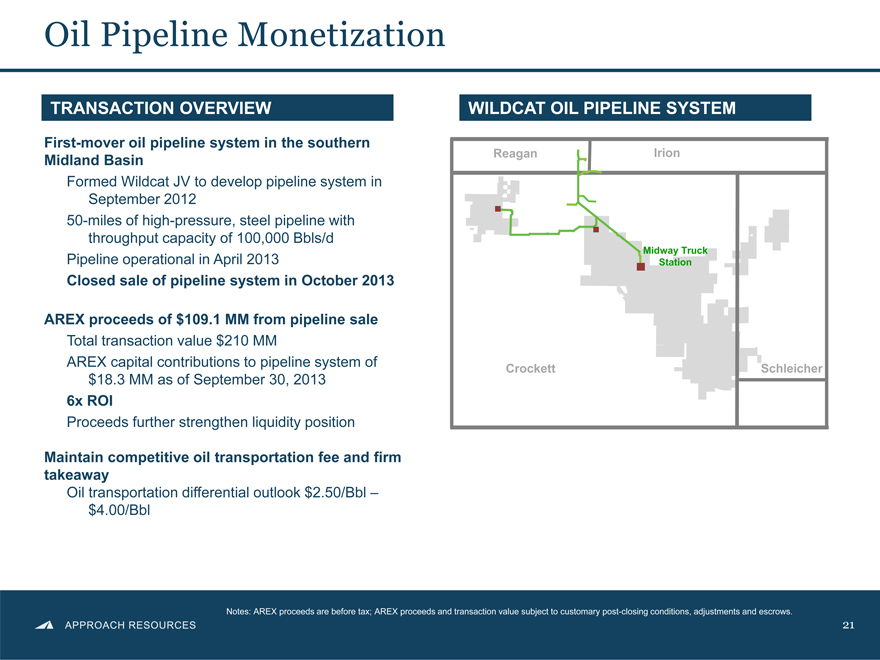
Oil Pipeline Monetization
TRANSACTION OVERVIEW
First-mover oil pipeline system in the southern Midland Basin
Formed Wildcat JV to develop pipeline system in September 2012
50-miles of high-pressure, steel pipeline with throughput capacity of 100,000 Bbls/d Pipeline operational in April 2013
Closed sale of pipeline system in October 2013
AREX proceeds of $109.1 MM from pipeline sale
Total transaction value $210 MM
AREX capital contributions to pipeline system of $18.3 MM as of September 30, 2013
6x ROI
Proceeds further strengthen liquidity position
Maintain competitive oil transportation fee and firm takeaway
Oil transportation differential outlook $2.50/Bbl –$4.00/Bbl
WILDCAT OIL PIPELINE SYSTEM
Reagan Irion
Midway Truck Station
Crockett Schleicher
APPROACH RESOURCES
Notes: AREX proceeds are before tax; AREX proceeds and transaction value subject to customary post-closing conditions, adjustments and escrows.
21
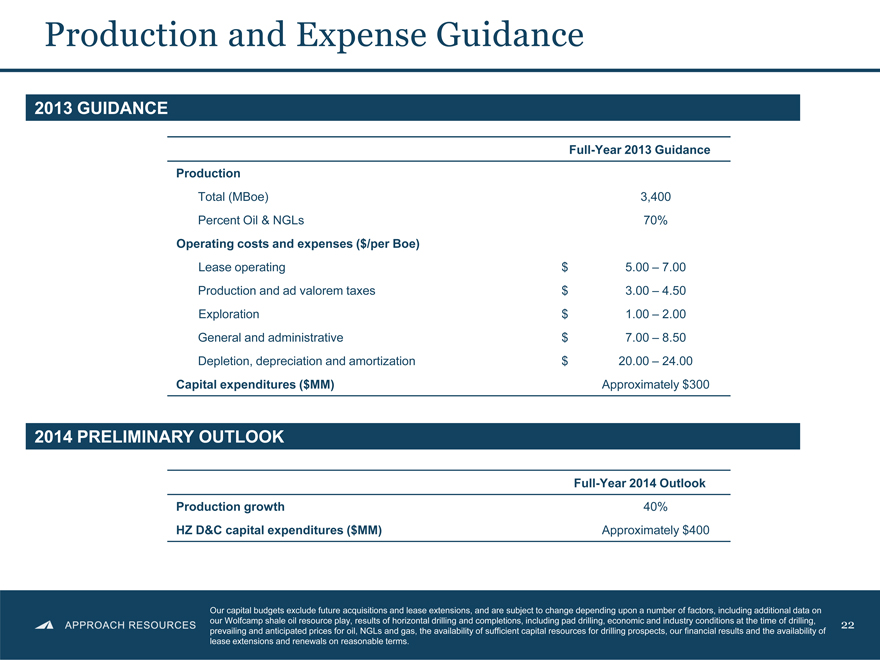
Production and Expense Guidance
2013 GUIDANCE
Full Year 2013 Guidance
Production
Total (MBoe) 3,400
Percent Oil & NGLs 70%
Operating costs and expenses ($/per Boe)
Lease operating $ 5.00 7.00
Production and ad valorem taxes $ 3.00 4.50
Exploration $ 1.00 2.00
General and administrative $ 7.00 8.50
Depletion, depreciation and amortization $ 20.00 24.00
Capital expenditures ($MM) Approximately $300
2014 PRELIMINARY OUTLOOK
APPROACH RESOURCES
Our capital budgets exclude future acquisitions and lease extensions, and are subject to change depending upon a number of factors, including additional data on our Wolfcamp shale oil resource play, results of horizontal drilling and completions, including pad drilling, economic and industry conditions at the time of drilling, prevailing and anticipated prices for oil, NGLs and gas, the availability of sufficient capital resources for drilling prospects, our financial results and the availability of lease extensions and renewals on reasonable terms.
22
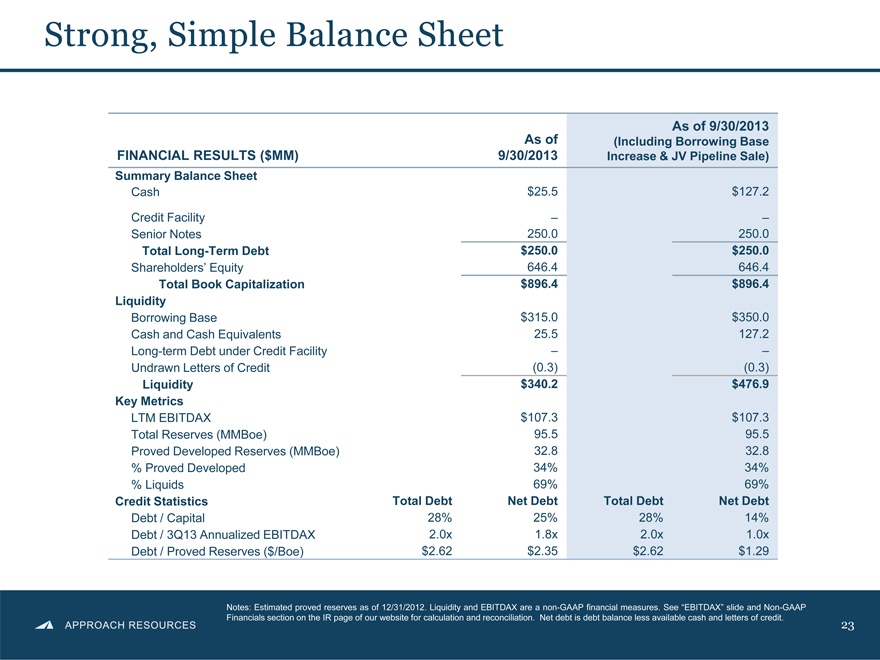
Strong, Simple Balance Sheet
As of 9/30/2013
As of (Including Borrowing Base
FINANCIAL RESULTS ($MM) 9/30/2013 Increase & JV Pipeline Sale)
Summary Balance Sheet
Cash $25.5 $127.2
Credit Facility
Senior Notes 250.0 250.0
Total LongTerm Debt $250.0 $250.0
Shareholders’ Equity 646.4 646.4
Total Book Capitalization $896.4 $896.4
Liquidity
Borrowing Base $315.0 $350.0
Cash and Cash Equivalents 25.5 127.2
Long term Debt under Credit Facility
Undrawn Letters of Credit (0.3) (0.3)
Liquidity $340.2 $476.9
Key Metrics
LTM EBITDAX $107.3 $107.3
Total Reserves (MMBoe) 95.5 95.5
Proved Developed Reserves (MMBoe) 32.8 32.8
% Proved Developed 34% 34%
% Liquids 69% 69%
Credit Statistics Total Debt Net Debt Total Debt Net Debt
Debt / Capital 28% 25% 28% 14%
Debt / 3Q13 Annualized EBITDAX 2.0x 1.8x 2.0x 1.0x
Debt / Proved Reserves ($/Boe) $2.62 $2.35 $2.62 $1.29
APPROACH RESOURCES
Notes: Estimated proved reserves as of 12/31/2012. Liquidity and EBITDAX are a non-GAAP financial measures. See “EBITDAX” slide and Non-GAAP Financials section on the IR page of our website for calculation and reconciliation. Net debt is debt balance less available cash and letters of credit.
23
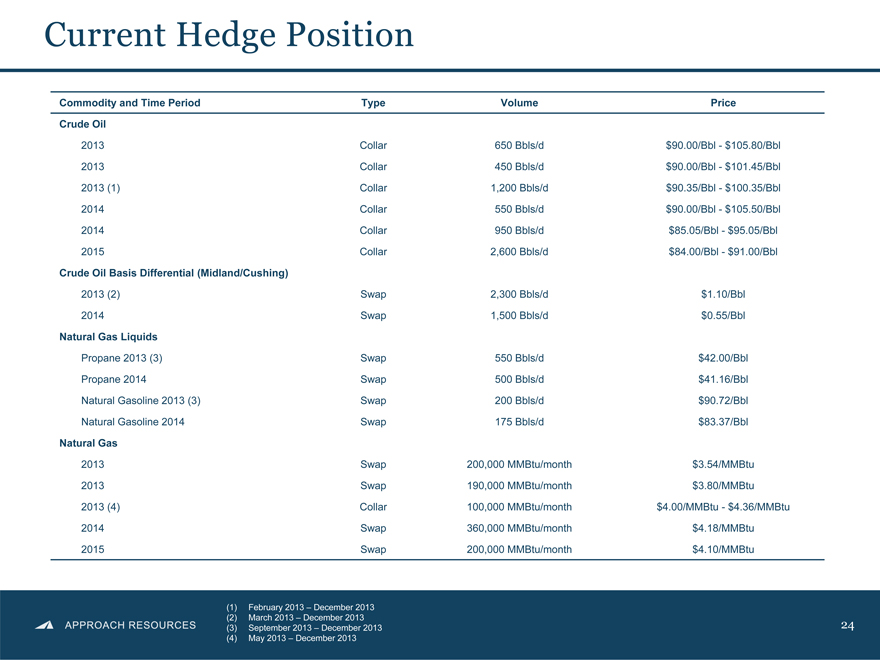
Current Hedge Position
Commodity and Time Period Type Volume Price
Crude Oil
2013 Collar 650 Bbls/d $90.00/Bbl $105.80/Bbl
2013 Collar 450 Bbls/d $90.00/Bbl - $101.45/Bbl
2013 (1) Collar 1,200 Bbls/d $90.35/Bbl - $100.35/Bbl
2014 Collar 550 Bbls/d $90.00/Bbl - $105.50/Bbl
2014 Collar 950 Bbls/d $85.05/Bbl - $95.05/Bbl
2015 Collar 2,600 Bbls/d $84.00/Bbl - $91.00/Bbl
Crude Oil Basis Differential (Midland/Cushing)
2013 (2) Swap 2,300 Bbls/d $1.10/Bbl
2014 Swap 1,500 Bbls/d $0.55/Bbl
Natural Gas Liquids
Propane 2013 (3) Swap 550 Bbls/d $42.00/Bbl
Propane 2014 Swap 500 Bbls/d $41.16/Bbl
Natural Gasoline 2013 (3) Swap 200 Bbls/d $90.72/Bbl
Natural Gasoline 2014 Swap 175 Bbls/d $83.37/Bbl
Natural Gas
2013 Swap 200,000 MMBtu/month $3.54/MMBtu
2013 Swap 190,000 MMBtu/month $3.80/MMBtu
2013 (4) Collar 100,000 MMBtu/month $4.00/MMBtu - $4.36/MMBtu
2014 Swap 360,000 MMBtu/month $4.18/MMBtu
2015 Swap 200,000 MMBtu/month $4.10/MMBtu
APPROACH RESOURCES
(1) February 2013 December 2013 (2) March 2013 December 2013
(3) September 2013 December 2013 (4) May 2013 December 2013
24
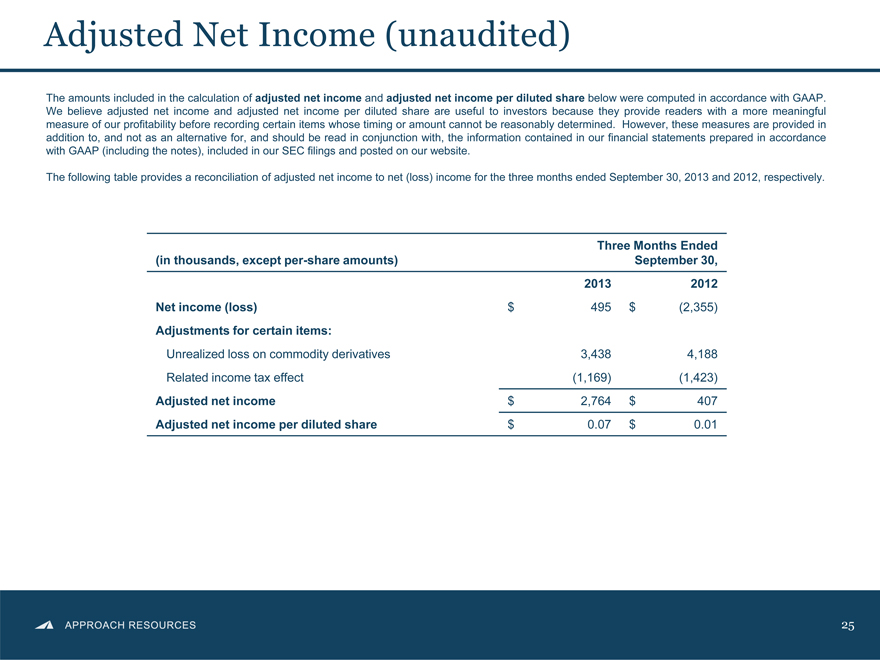
Adjusted Net Income (unaudited)
The amounts included in the calculation of adjusted net income and adjusted net income per diluted share below were computed in accordance with GAAP. We believe adjusted net income and adjusted net income per diluted share are useful to investors because they provide readers with a more meaningful measure of our profitability before recording certain items whose timing or amount cannot be reasonably determined. However, these measures are provided in addition to, and not as an alternative for, and should be read in conjunction with, the information contained in our financial statements prepared in accordance with GAAP (including the notes), included in our SEC filings and posted on our website.
The following table provides a reconciliation of adjusted net income to net (loss) income for the three months ended September 30, 2013 and 2012, respectively.
Three Months Ended
(in thousands, except per-share amounts) September 30,
2013 2012
Net income (loss) $ 495 $ (2,355)
Adjustments for certain items:
Unrealized loss on commodity derivatives 3,438 4,188
Related income tax effect (1,169) (1,423)
Adjusted net income $ 2,764 $ 407
Adjusted net income per diluted share $ 0.07 $ 0.01
APPROACH RESOURCES
25
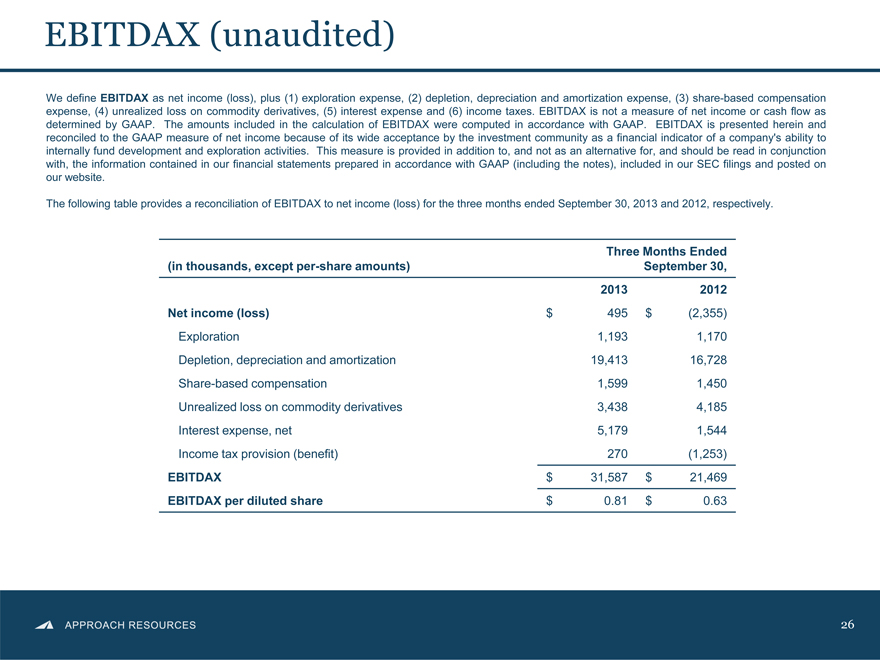
EBITDAX (unaudited)
We define EBITDAX as net income (loss), plus (1) exploration expense, (2) depletion, depreciation and amortization expense, (3) share-based compensation expense, (4) unrealized loss on commodity derivatives, (5) interest expense and (6) income taxes. EBITDAX is not a measure of net income or cash flow as determined by GAAP. The amounts included in the calculation of EBITDAX were computed in accordance with GAAP. EBITDAX is presented herein and reconciled to the GAAP measure of net income because of its wide acceptance by the investment community as a financial indicator of a company’s ability to internally fund development and exploration activities. This measure is provided in addition to, and not as an alternative for, and should be read in conjunction with, the information contained in our financial statements prepared in accordance with GAAP (including the notes), included in our SEC filings and posted on our website.
The following table provides a reconciliation of EBITDAX to net income (loss) for the three months ended September 30, 2013 and 2012, respectively.
Three Months Ended
(in thousands, except per-share amounts) September 30,
2013 2012
Net income (loss) $ 495 $ (2,355)
Exploration 1,193 1,170
Depletion, depreciation and amortization 19,413 16,728
Share-based compensation 1,599 1,450
Unrealized loss on commodity derivatives 3,438 4,185
Interest expense, net 5,179 1,544
Income tax provision (benefit) 270 (1,253)
EBITDAX $ 31,587 $ 21,469
EBITDAX per diluted share $ 0.81 $ 0.63
APPROACH RESOURCES
26

APPROACH RESOURCES
Contact Information
MEGAN P. HAYS
Manager, Investor Relations & Corporate Communications 817.989.9000 x2108 mhays@approachresources.com www.approachresources.com