Table of Contents
UNITED STATES SECURITIES AND EXCHANGE COMMISSION
Washington, D.C. 20549
FORM 10-K
(Mark one)
þ | ANNUAL REPORT PURSUANT TO SECTION 13 OR 15(d) OF THE SECURITIES EXCHANGE ACT OF 1934 |
For the fiscal year ended December 31, 2013
or
¨ | TRANSITION REPORT PURSUANT TO SECTION 13 OR 15(d) OF THE SECURITIES EXCHANGE ACT OF 1934 |
For the transition period from to
Commission file number: 001-33801
APPROACH RESOURCES INC.
(Exact name of registrant as specified in its charter)
| Delaware | 51-0424817 | |
(State or other jurisdiction of incorporation or organization) | (I.R.S. Employer Identification Number) | |
One Ridgmar Centre 6500 West Freeway, Suite 800 Fort Worth, Texas | 76116 | |
| (Address of principal executive offices) | (Zip Code) | |
Registrant’s telephone number, including area code
(817) 989-9000
Securities registered pursuant to Section 12(b) of the Act:
Title of each class | Name of each exchange on which registered | |
| Common stock, par value $0.01 per share | NASDAQ Global Select Market |
Securities registered pursuant to Section 12(g) of the Act: None
Indicate by check mark if the registrant is a well-known seasoned issuer, as defined in Rule 405 of the Securities Act. Yes þ No ¨
Indicate by check mark if the registrant is not required to file reports pursuant to Section 13 or Section 15(d) of the Act. Yes ¨ No þ
Indicate by check mark whether the registrant (1) has filed all reports required to be filed by Section 13 or 15(d) of the Securities Exchange Act of 1934 during the preceding 12 months (or for such shorter period that the registrant was required to file such reports), and (2) has been subject to such filing requirements for the past 90 days. Yes þ No ¨
Indicate by check mark whether the registrant has submitted electronically and posted on its corporate Web site, if any, every Interactive Data File required to be submitted and posted pursuant to Rule 405 of Regulation S-T during the preceding 12 months (or for such shorter period that the registrant was required to submit and post such files). Yes þ No ¨
Indicate by check mark if disclosure of delinquent filers pursuant to Item 405 of Regulation S-K is not contained herein, and will not be contained, to the best of registrant’s knowledge, in definitive proxy or information statements incorporated by reference in Part III of this Form 10-K or any amendment to this Form 10-K. ¨
Indicate by check mark whether the registrant is a large accelerated filer, an accelerated filer, a non-accelerated filer, or a smaller reporting company. See the definitions of “large accelerated filer,” “accelerated filer” and “smaller reporting company” in Rule 12b-2 of the Exchange Act.
| Large accelerated filer þ | Accelerated filer ¨ | Non-accelerated filer ¨ | Smaller reporting company ¨ |
Indicate by check mark whether the registrant is a shell company (as defined in Exchange Act Rule 12b-2). Yes ¨ No þ
The aggregate market value of the voting and non-voting common equity held by non-affiliates (excluding voting shares held by officers and directors) as of June 28, 2013 was $856.5 million. This amount is based on the closing price of the registrant’s common stock on the NASDAQ Global Select Market on that date.
The number of shares of the registrant’s common stock, par value $0.01, outstanding as of February 24, 2014 was 39,398,090.
DOCUMENTS INCORPORATED BY REFERENCE
Portions of the registrant’s proxy statement for its 2014 annual meeting of stockholders are incorporated by reference in Part III, Items 10-14 of this report.
Certain exhibits previously filed with the Securities and Exchange Commission are incorporated by reference into Part IV of this report.
Table of Contents
APPROACH RESOURCES INC.
Unless the context otherwise indicates, all references in this report to “Approach,” the “Company,” “we,” “us,” “our” or “ours” are to Approach Resources Inc. and its subsidiaries. Unless otherwise noted, (i) all information in this report relating to oil, NGLs and natural gas reserves and the estimated future net cash flows attributable to reserves is based on estimates and is net to our interest, and (ii) all information in this report relating to oil, NGLs and natural gas production is net to our interest. Natural gas is converted throughout this report at a rate of six Mcf of gas to one barrel of oil equivalent (“Boe”). NGLs are converted throughout this report at a rate of one barrel of NGLs to one Boe. The ratios of six Mcf of gas to one Boe and one barrel of NGLs to one Boe do not assume price equivalency and, given price differentials, the price for a Boe of natural gas or NGLs may differ significantly from the price of a barrel of oil. If you are not familiar with the oil and gas terms or abbreviations used in this report, please refer to the definitions of these terms and abbreviations under the caption “Glossary” at the end of Item 15 of this report.
ii
Table of Contents
Cautionary Statement Regarding Forward-Looking Statements
Various statements in this report, including those that express a belief, expectation or intention, as well as those that are not statements of historical fact, are forward-looking statements within the meaning of Section 27A of the Securities Act of 1933, as amended (the “Securities Act”), and Section 21E of the Securities Exchange Act of 1934, as amended (the “Exchange Act”). The forward-looking statements may include projections and estimates concerning the timing and success of specific projects, typical well economics and our future reserves, production, revenues, costs, income, capital spending, 3-D seismic operations, interpretation and results and obtaining permits and regulatory approvals. When used in this report, the words “will,” “believe,” “intend,” “expect,” “may,” “should,” “anticipate,” “could,” “estimate,” “plan,” “predict,” “project,” “potential” or their negatives, other similar expressions or the statements that include those words, are intended to identify forward-looking statements, although not all forward-looking statements contain such identifying words.
These forward-looking statements are largely based on our expectations, which reflect estimates and assumptions made by our management. These estimates and assumptions reflect our best judgment based on currently known market conditions and other factors. Although we believe such estimates and assumptions to be reasonable, they are inherently uncertain and involve a number of risks and uncertainties that are beyond our control. In addition, management’s assumptions about future events may prove to be inaccurate. We caution all readers that the forward-looking statements contained in this report are not guarantees of future performance, and we cannot assure any reader that such statements will be realized or the forward-looking events and circumstances will occur. Actual results may differ materially from those anticipated or implied in the forward-looking statements due to the factors listed in the “Risk Factors” section and elsewhere in this report. All forward-looking statements speak only as of the date of this report. We disclaim any obligation to publicly update or revise any forward-looking statements as a result of new information, future events or otherwise, unless required by law. These cautionary statements qualify all forward-looking statements attributable to us, or persons acting on our behalf. The risks, contingencies and uncertainties relate to, among other matters, the following:
| • | uncertainties in drilling, exploring for and producing oil and gas; |
| • | oil, NGL and gas prices; |
| • | overall United States and global economic and financial market conditions; |
| • | domestic and foreign demand and supply for oil, NGLs, gas and the products derived from such hydrocarbons; |
| • | our ability to obtain additional financing necessary to fund our operations and capital expenditures and to meet our other obligations; |
| • | the effects of government regulation and permitting and other legal requirements, including laws or regulations that could restrict or prohibit hydraulic fracturing; |
| • | disruption of credit and capital markets; |
| • | our financial position; |
| • | our cash flows and liquidity; |
| • | disruptions to, capacity constraints in or other limitations on the pipeline systems that deliver our oil, NGLs and gas and other processing and transportation considerations; |
| • | marketing of oil, NGLs and gas; |
| • | high costs, shortages, delivery delays or unavailability of drilling and completion equipment, materials, labor or other services; |
| • | competition in the oil and gas industry; |
| • | uncertainty regarding our future operating results; |
iii
Table of Contents
| • | interpretation of 3-D seismic data; |
| • | replacing our oil, NGL and gas reserves; |
| • | our ability to retain and attract key personnel; |
| • | our business strategy, including our ability to recover oil, NGLs and gas in place associated with our Wolfcamp shale oil resource play in the Permian Basin; |
| • | development of our current asset base or property acquisitions; |
| • | estimated quantities of oil, NGL and gas reserves and present value thereof; |
| • | plans, objectives, expectations and intentions contained in this report that are not historical; and |
| • | other factors discussed under Item 1A. “Risk Factors” in this report. |
iv
Table of Contents
PART I
General
Approach Resources Inc. is an independent energy company focused on the exploration, development, production and acquisition of unconventional oil and gas reserves in the Midland Basin of the greater Permian Basin in West Texas, where we lease approximately 146,000 net acres as of December 31, 2013. We believe our concentrated acreage position provides us an opportunity to achieve cost, operating and recovery efficiencies in the development of our drilling inventory. We are currently developing significant resource potential from the Wolfcamp shale oil formation. Additional drilling targets could include the Clearfork, Canyon Sands, Strawn and Ellenburger zones. We sometimes refer to our development project in the Permian Basin as “Project Pangea,” which includes “Pangea West.” Our management and technical team have a proven track record of finding and developing reserves through advanced drilling and completion techniques. As the operator of all of our estimated proved reserves and production, we have a high degree of control over capital expenditures and other operating matters.
At December 31, 2013, our estimated proved reserves were 114.7 million barrels of oil equivalent (“MMBoe”). Substantially all of our proved reserves are located in Crockett and Schleicher Counties, Texas. Important characteristics of our proved reserves at December 31, 2013, include:
| • | 40% oil, 29% NGLs and 31% natural gas; |
| • | 39% proved developed; |
| • | 100% operated; |
| • | Reserve life of more than 30 years based on 2013 production of 3.4 MMBoe; |
| • | Standardized measure of discounted future net cash flows of (“Standardized Measure”) of $676.3 million; and |
| • | PV-10 (non-GAAP) of $1.1 billion. |
PV-10 is our estimate of the present value of future net revenues from proved oil, NGL and gas reserves after deducting estimated production and ad valorem taxes, future capital costs and operating expenses, but before deducting any estimates for future income taxes. Estimated future net revenues are discounted at an annual rate of 10% to determine their present value. PV-10 is a financial measure that is not determined in accordance with accounting principles generally accepted in the United States (“GAAP”), and generally differs from the Standardized Measure, the most directly comparable GAAP financial measure, because it does not include the effects of income taxes on future cash flows. PV-10 should not be considered as an alternative to the Standardized Measure, as computed under GAAP. See Item 2. “Properties — Proved Oil and Gas Reserves” for a reconciliation of PV-10 to the Standardized Measure.
At December 31, 2013, we owned and operated 679 producing oil and gas wells in the Permian Basin. During 2013, we produced 3.4 MMBoe, or 9.4 MBoe/d. Production for 2013 was 42% oil, 28% NGLs and 30% natural gas.
Our History
Approach Resources Inc. was incorporated in September 2002. Our common stock began trading on the NASDAQ Global Market in the United States under the symbol “AREX” on November 8, 2007, and is now listed on the NASDAQ Global Select Market (“NASDAQ”). Our principal executive offices are located at One Ridgmar Centre, 6500 West Freeway, Suite 800, Fort Worth, Texas 76116. Our telephone number is (817) 989-9000.
1
Table of Contents
Our Business Strategy
We intend to increase the value of the Company by growing reserves and production in a cost-efficient manner and at attractive rates of return by pursuing the following strategies:
| • | Develop our Wolfcamp shale oil resource play. We believe our current acreage position provides us the ability to continue to increase reserves and production at competitive costs and at attractive rates of return. During 2013, we drilled 45 horizontal Wolfcamp wells. With our 2014 drilling plan, we plan to drill approximately 70 horizontal Wolfcamp wells in Project Pangea. Focusing on the Wolfcamp shale oil play allows us to use our operating, technical and regional expertise important to interpreting geological and operating trends, enhancing production rates and maximizing well recovery. |
| • | Operate our properties as a low-cost producer. We believe our concentrated acreage position in the Midland Basin enables us to capture economies of scale and operating efficiencies. Through our investment in field infrastructure systems, including centralized water, recycling and production facilities, water transportation lines, gas lift lines and salt water disposal systems, we have reduced drilling and completion costs, per-unit lease operating expense and our fresh water use. We also drill multiple wells from a single pad, which reduces facilities costs and surface impact. In addition, we operate 100% of our reserve base and plan to continue to operate a substantial portion of our producing properties in the future. Operating control allows us to better manage timing and risk as well as the cost of infrastructure, drilling and ongoing operations. |
| • | Acquire strategic and complementary assets. We continually review opportunities to acquire producing properties, undeveloped acreage and drilling prospects in our existing core area in the Midland Basin. We focus particularly on opportunities where we believe our operational efficiency, reservoir management and geological expertise in unconventional oil and gas properties will enhance value and performance. We remain focused on unconventional resource opportunities, but will also look at conventional opportunities based on individual project economics. |
| • | Maintain financial flexibility. We believe that our strong balance sheet and liquidity provide us with significant financial flexibility to pursue our strategic and financial objectives. Also, we enter into commodity derivative contracts to partially mitigate the risk of commodity price volatility. Furthermore, during times of severe price declines, we may reduce capital expenditures and curtail drilling to preserve our financial flexibility and the net asset value of our existing proved reserves. |
Our Competitive Strengths
We have a number of competitive strengths, which we believe will help us to successfully execute our business strategies:
| • | Lower-risk, oil-rich asset base. We believe we have assembled a strong asset base within the Midland Basin, where we have a long history of operating. We have drilled more than 690 wells in the area since 2004 with an average success rate of 94%. Our proved reserves are 40% oil, and our production for 2013 was 42% oil. Our acreage position of 163,000 gross, primarily contiguous acres in the Midland Basin provides us with a multi-year inventory of repeatable, horizontal and vertical drilling locations that we believe create the opportunity for us to deliver long-term reserve, production and cash flow growth. |
| • | High degree of operational control. We operate 100% of our estimated proved reserves, and we have approximately 100% working interest in Project Pangea and Pangea West. This allows us to more effectively manage and control the timing of capital spending on our development activities, as well as maximize benefits from operating cost efficiencies and field infrastructure systems. |
| • | Prudent financial management. We believe we are well capitalized with 74% equity capitalization and liquidity of $408.4 million as of December 31, 2013. We are committed to maintaining a strong balance sheet and disciplined capital program. We also enter into commodity derivative contracts to manage our exposure to commodity price fluctuations. |
2
Table of Contents
| • | Experienced executive management team with track record of growth. Our executive management team has approximately 140 years of combined industry experience, including significant technical and exploration expertise. Our executive team has specific expertise in the Permian Basin and in successfully executing multi-year development drilling programs creating stockholder value. |
2013 Activity
Our 2013 activity focused on horizontal drilling in the Wolfcamp shale oil resource play in the Midland Basin. We drilled 45 horizontal wells in 2013, compared to 26 horizontal wells in 2012. We also continued to invest in building our field infrastructure system, which we believe reduces drilling and completion costs, improves drilling and completion efficiencies and reduces fresh water use. We plan to continue to develop the Wolfcamp shale in Project Pangea in 2014. Focusing on the Wolfcamp shale allows us to use our operating, technical and regional expertise that is important to interpreting geological and operating trends, enhancing production rates and maximizing well recovery. Our accomplishments in 2013 include:
| • | Production Growth. Production for 2013 totaled 3.4 MMBoe (9.4 MBoe/d), compared to 2.9 MMBoe (7.9 MBoe/d) in 2012, a 19% increase. Production for 2013 was 42% oil, 28% NGLs and 30% natural gas. Our continued development of Project Pangea increased oil production 49% in 2013, compared to 2012. On average, we operated three horizontal rigs in 2013, and drilled a total of 45 wells, of which nine wells were waiting on completion at December 31, 2013. |
| • | Reserve Growth. In 2013, our estimated proved reserves increased 20%, or 19.2 MMBoe, to 114.7 MMBoe from 95.5 MMBoe. Our proved reserves at year-end 2013 were 40% oil, 29% NGLs and 31% natural gas, compared to 39% oil, 30% NGLs and 31% natural gas at year-end 2012. During 2013, our proved oil reserves increased 8.8 MMBbls, or 24%, to 46.1 MMBbls from 37.3 MMBbls in 2012. Reserve growth, and especially our oil reserve growth, in 2013 was driven by results in our Wolfcamp shale oil resource play. |
| • | Delineation of the Multi-Zone Potential of the Wolfcamp Shale. The Wolfcamp shale has a gross pay thickness of approximately 1,000 to 1,200 feet, which allows for stacked wellbores targeting varied zones that we call “benches.” We believe effectively developing the Wolfcamp shale may involve up to three lateral wellbores, each targeting a different bench, which we refer to as the Wolfcamp A, B and C. As of December 31, 2013, we had drilled a total of eight wells targeting the Wolfcamp A bench, 69 wells targeting the Wolfcamp B bench and four wells targeting the Wolfcamp C bench. With successful wells targeting each of the Wolfcamp benches, in 2013 we began full-scale development, including pad drilling and stacked wellbores. |
| • | Installation of Field Infrastructure and Recycling Systems. Our large, mostly contiguous acreage position and our success in the Wolfcamp shale oil play led us to invest over $80 million in building field infrastructure beginning in 2012. We continued the infrastructure build out in 2013, and now have an extensive network of centralized water, recycling and production facilities, water transportation lines, gas lift lines and salt water disposal systems. In addition, we believe the infrastructure reduces the need for trucks, reduces fresh water usage, improves drilling and completion efficiencies and drives down drilling and completion and operating costs. |
| • | Completed Sale of Southern Midland Basin Oil Pipeline. In October 2013, Approach, together with our partner in Wildcat Permian Services LLC (“Wildcat”), completed the sale of all of the equity interests of Wildcat to an affiliate of JP Energy Development, LP (“JP Energy”) for a purchase price of $210 million. Wildcat owned and operated an oil pipeline system in Crockett and Reagan Counties, Texas. Our net proceeds totaled approximately $109.1 million, after deducting our share of transactional costs paid at closing. We recognized a pre-tax gain of $90.7 million related to this transaction, subject to normal post-closing adjustments. |
| • | Secured Marketing and Transportation Agreements. In connection with the closing of the Wildcat sale, in October 2013, we entered into an amendment to our crude oil purchase agreement with JP Energy. The amendment, among other things, amends the dedicated area to include certain portions of Crockett and |
3
Table of Contents
Schleicher Counties, Texas; amends the transportation and marketing fee; provides for the construction of future gathering lines and connection facilities; provides us with priority and preference rights for crude oil capacity on the pipeline system; and provides for trucking of crude oil during construction of gathering lines and connection facilities. We currently pay published Midland and Cushing tariffs for our nominated oil volumes in lieu of a Midland-Cushing differential, which we believe reduces our exposure to Midland-Cushing differential volatility. |
| • | Consolidated Drilling and Development Unit Agreement. In July 2013, we entered into a Consolidated Drilling and Development Unit Agreement (“Unit Agreement”) with the Board for Lease of University Lands (“University Lands”). The Unit Agreement extended 60 of our leases with University Lands to September 2017 for a total cost of $5 million. As a result, we can retain all of our University Lands leases by drilling two wells per year to September 2017. |
| • | 2013 Senior Notes Offering. In June 2013, we completed our public offering of $250 million principal amount of 7% Senior Notes due 2021 (the “Senior Notes”). We received net proceeds from the issuance of the Senior Notes of approximately $243 million, after deducting fees and expenses. We used a portion of the net proceeds from the offering to repay all outstanding borrowings under our credit facility, and the remainder to fund our development project and for general corporate purposes. |
| • | Financial Position.During 2013, our lender group increased the borrowing base of our revolving credit facility to $350 million from $280 million at year-end 2012. At December 31, 2013, we had $58.8 million of cash and cash equivalents and had no outstanding borrowings under our revolving credit facility. |
Plans for 2014
Our total 2014 capital expenditure budget is $400 million, which includes approximately $385 million for drilling and completion activity and $15 million for constructing infrastructure to support our drilling, completion and production operations. We plan to operate three rigs to drill approximately 70 horizontal wells targeting the Wolfcamp A, B and C zones.
Our 2014 capital budget excludes acquisitions and lease extensions and renewals and is subject to change depending upon a number of factors, including additional data on our Wolfcamp shale oil resource play, results of horizontal drilling and completions, including pad drilling, economic and industry conditions at the time of drilling, prevailing and anticipated prices for oil, NGLs and gas, the availability of sufficient capital resources for drilling prospects, our financial results and the availability of lease extensions and renewals on reasonable terms.
Markets and Customers
The revenues generated by our operations are highly dependent upon the prices of, and supply and demand for, oil, NGLs and natural gas. The price we receive for our oil, NGL and gas production depends on numerous factors beyond our control, including seasonality, the condition of the domestic and global economies, particularly in the manufacturing sectors, political conditions in other oil and gas producing countries, the extent of domestic production and imports of oil, NGLs and gas, the proximity and capacity of gas pipelines and other transportation facilities, supply and demand for oil, NGLs and gas, the marketing of competitive fuels and the effects of federal, state and local regulation. The oil and gas industry also competes with other industries in supplying the energy and fuel requirements of industrial, commercial and individual consumers.
For the year ended December 31, 2013, sales to Wildcat, DCP Midstream, LLC (“DCP”) and JP Energy Permian, LLC (“JPE”) accounted for approximately 30%, 27% and 23%, respectively, of our total sales. As of December 31, 2013, we had dedicated all of our oil production from northern Project Pangea and Pangea West through 2022 to JP Energy. In addition, as of December 31, 2013, we had contracted to sell all of our NGLs and natural gas production from Project Pangea to DCP through January 2016.
4
Table of Contents
Commodity Derivative Activity
We enter into commodity swap and collar contracts to mitigate portions of the risk of market price fluctuations related to future oil and gas production. Our derivative contracts are recorded as derivative assets and liabilities at fair value on our balance sheet, and the change in a derivative contract’s fair value is recognized as current income or expense on our consolidated statement of operations.
Title to Properties
Our properties are subject to customary royalty interests, liens incident to operating agreements, liens for current taxes and other burdens, including other mineral encumbrances and restrictions. We do not believe that any of these burdens materially interfere with our use of the properties in the operation of our business.
We believe that we have generally satisfactory title to or rights in all of our producing properties. As is customary in the oil and gas industry, we make a general investigation of title at the time we acquire undeveloped properties. We receive title opinions of counsel before we commence drilling operations. We believe that we have satisfactory title to all of our other assets. Although title to our properties is subject to encumbrances in certain cases, we believe that none of these burdens will materially detract from the value of our properties or from our interest therein or will materially interfere with our use of the properties in the operation of our business.
Oil and Gas Leases
The typical oil and natural gas lease agreement covering our properties provides for the payment of royalties to the mineral owner for all oil, NGLs and natural gas produced from any wells drilled on the leased premises. The lessor royalties and other leasehold burdens on our properties generally range from 20% to 25%, resulting in a net revenue interest to us generally ranging from 80% to 75%.
Seasonality
Demand for oil, NGLs and natural gas generally decreases during the spring and fall months and increases during the summer and winter months. However, seasonal anomalies such as mild winters or mild summers sometimes lessen this fluctuation. In addition, certain natural gas users utilize storage facilities and purchase some of their anticipated winter requirements during the summer. This can also lessen seasonal demand fluctuations. These seasonal anomalies can increase competition for equipment, supplies and personnel during the spring and summer months, which could lead to shortages and increase costs or delay our operations.
Competition
The oil and gas industry is highly competitive, and we compete for personnel, prospective properties, producing properties and services with a substantial number of other companies that have greater resources. Many of these companies explore for, produce and market oil and gas, carry on refining operations and market the end products on a worldwide basis. We also face competition from alternative fuel sources, including coal, heating oil, imported LNG, nuclear and other nonrenewable fuel sources, and renewable fuel sources such as wind, solar, geothermal, hydropower and biomass. Competitive conditions may also be substantially affected by various forms of energy legislation and/or regulation considered from time-to-time by the United States government. It is not possible to predict whether such legislation or regulation may ultimately be adopted or its precise effects upon our future operations. Such laws and regulations may, however, substantially increase the costs of exploring for, developing or producing oil, NGLs and gas and may prevent or delay the commencement or continuation of our operations.
5
Table of Contents
Hydraulic Fracturing
Hydraulic fracturing is an important process in oil and gas production and has been commonly used in the completion of unconventional oil and gas wells in shale and tight sand formations since the 1950s. Hydraulic fracturing involves the injection of water, sand and chemical additives under pressure into rock formations to stimulate oil and gas production. It is important to us because it provides access to oil and gas reserves that previously were uneconomical to produce.
We have used hydraulic fracturing to complete both horizontal and vertical wells in the Permian Basin. We engage third parties to provide hydraulic fracturing services to us for completion of these wells. While hydraulic fracturing is not required to maintain our leasehold acreage that is currently held by production from existing wells, it will be required in the future to develop the proved non-producing and proved undeveloped reserves associated with this acreage. All of our proved non-producing and proved undeveloped reserves associated with future drilling will require hydraulic fracturing.
We believe we have followed, and intend to continue to follow, applicable industry standard practices and legal requirements for groundwater protection in our operations that are subject to supervision by state regulators. These protective measures include setting surface casing at a depth sufficient to protect fresh water zones as determined by applicable state regulatory agencies and cementing the well to create a permanent isolating barrier between the casing pipe and surrounding geological formations. This aspect of well design is intended to prevent contact between the fracturing fluid and any aquifers during the hydraulic fracturing operations. For recompletions of existing wells, the production casing is pressure-tested before perforating the new completion interval.
Injection rates and pressures are monitored at the surface during our hydraulic fracturing operations. Pressure is monitored on both the injection string and the immediate annulus to the injection string. We believe we have adequate procedures in place to address abrupt changes to the injection pressure or annular pressure.
Texas regulations currently require disclosure of the components in the solutions used in hydraulic fracturing operations. More than 99% (by mass) of the ingredients we use in hydraulic fracturing are water and sand. The remainder of the ingredients are chemical additives that are managed and used in accordance with applicable requirements.
Hydraulic fracturing requires the use of a significant amount of water. Upon flowback of the water, we dispose of it in a way that we believe minimizes the impact to nearby surface water by disposing into approved disposal facilities or injection wells. Currently our primary sources of water in Project Pangea are the nonpotable Santa Rosa and potable Edwards-Trinity (Plateau) aquifers. We use water from on-lease water wells that we have drilled, and we purchase water from off-lease water wells. We also plan to reuse and recycle flowback and produced water in 2014.
For information regarding existing and proposed governmental regulations regarding hydraulic fracturing and related environmental matters, please read “Business — Regulation — Environmental Laws and Regulation” and “Business — Regulation — Hydraulic Fracturing.” For related risks to our stockholders, please read “Risk Factors — Federal and state legislation and regulatory initiatives and private litigation relating to hydraulic fracturing could stop or delay our development project and result in materially increased costs and additional operating restrictions.”
Regulation
The oil and gas industry in the United States is subject to extensive regulation by federal, state and local authorities. At the federal level, various federal rules, regulations and procedures apply, including those issued by the U.S. Department of Interior, the U.S. Department of Transportation (the “DOT”) (Office of Pipeline Safety) and the U.S. Environmental Protection Agency (the “EPA”). At the state and local level, various agencies and commissions regulate drilling, production and midstream activities. These federal, state and local authorities have
6
Table of Contents
various permitting, licensing and bonding requirements. Various remedies are available for enforcement of these federal, state and local rules, regulations and procedures, including fines, penalties, revocation of permits and licenses, actions affecting the value of leases, wells or other assets, suspension of production, and, in certain cases, criminal prosecution. As a result, there can be no assurance that we will not incur liability for fines, penalties or other remedies that are available to these federal, state and local authorities. However, we believe that we are currently in material compliance with federal, state and local rules, regulations and procedures, and that continued substantial compliance with existing requirements will not have a material adverse effect on our financial position, cash flows or results of operations.
Transportation and Sale of Oil
Sales of crude oil and condensate are not currently regulated and are made at negotiated prices. Our sales of crude oil are affected by the availability, terms and cost of transportation. Interstate transportation of oil by pipeline is regulated by the Federal Energy Regulation Commission (“FERC”) pursuant to the Interstate Commerce Act (“ICA”), Energy Policy Act of 1992 (“EPAct 1992”), and the rules and regulations promulgated under those laws. The ICA and its regulations require that tariff rates for interstate service on oil pipelines, including interstate pipelines that transport crude oil and refined products, be just and reasonable and non-discriminatory and that such rates, terms and conditions of service be filed with FERC.
Intrastate oil pipeline transportation rates are also subject to regulation by state regulatory commissions. The basis for intrastate oil pipeline regulation, and the degree of regulatory oversight and scrutiny given to intrastate oil pipeline rates, varies from state to state. As effective interstate and intrastate rates apply equally to all comparable shippers, we believe that the regulation of oil transportation rates will not affect our operations in any way that is of material difference from those of our competitors who are similarly situated.
Further, interstate and intrastate common carrier oil pipelines must provide service on a non-discriminatory basis. Under this open access standard, common carriers must offer service to all similarly situated shippers requesting service on the same terms and under the same rates. When oil pipelines operate at full capacity, access is governed by prorationing provisions set forth in the pipelines’ published tariffs. Accordingly, we believe that access to oil pipeline transportation services generally will be available to us to the same extent as to our similarly situated competitors.
The transportation of oil by truck is also subject to federal, state and local rules and regulations, including the Federal Motor Carrier Safety Act and the Homeland Security Act of 2002. Regulations under these statutes cover the security and transportation of hazardous materials and are administered by the DOT.
Transportation and Sale of Natural Gas and NGLs
FERC regulates interstate gas pipeline transportation rates and service conditions under the Natural Gas Act of 1938, the Natural Gas Policy Act of 1978 and regulations issued under those statutes. FERC also regulates interstate NGL pipelines under various federal laws and regulations. Although FERC does not regulate oil and gas producers such as Approach, FERC’s actions are intended to facilitate increased competition within all phases of the oil and gas industry and its regulation of third-party pipelines and facilities could indirectly affect our ability to transport or market our production. To date, FERC’s policies have not materially affected our business or operations.
Regulation of Production
Oil, NGL and gas production is regulated under a wide range of federal and state statutes, rules, orders and regulations. State and federal statutes and regulations require permits for drilling operations, drilling bonds and reports concerning operations. The state in which we operate, Texas, has regulations governing conservation matters, including provisions for the unitization or pooling of oil and gas properties, the establishment of maximum rates of production from oil and gas wells, the regulation of spacing, and requirements for plugging
7
Table of Contents
and abandonment of wells. Also, Texas imposes a severance tax on production and sales of oil, NGLs and gas within its jurisdiction. The failure to comply with these rules and regulations can result in substantial penalties. Our competitors in the oil and gas industry are subject to the same regulatory requirements and restrictions that affect our operations.
Environmental Laws and Regulations
In the United States, the exploration for and development of oil and gas and the drilling and operation of wells, fields and gathering systems are subject to extensive federal, state and local laws and regulations governing environmental protection as well as discharge of materials into the environment. These laws and regulations may, among other things:
| • | require the acquisition of various permits before drilling begins; |
| • | require the installation of expensive pollution controls or emissions monitoring equipment; |
| • | restrict the types, quantities and concentration of various substances that can be released into the environment in connection with oil and gas drilling, completion, production, transportation and processing activities; |
| • | suspend, limit or prohibit construction, drilling and other activities in certain lands lying within wilderness, wetlands, endangered species habitat, and other protected areas; and |
| • | require remedial measures to mitigate and remediate pollution from historical and ongoing operations, such as the closure of waste pits and plugging of abandoned wells. |
These laws, rules and regulations may also restrict the rate of oil and gas production below the rate that would otherwise be possible. The regulatory burden on the oil and gas industry increases the cost of doing business in the industry and consequently affects profitability.
Governmental authorities have the power to enforce compliance with environmental laws, regulations and permits, and violations are subject to injunction, as well as administrative, civil and criminal penalties. The effects of existing and future laws and regulations could have a material adverse impact on our business, financial condition and results of operations. The clear trend in environmental regulation is to place more restrictions and limitations on activities that may affect the environment. Any changes in environmental laws and regulations or re-interpretations of enforcement policies that result in more stringent and costly waste handling, storage, transport, disposal or remediation requirements could have a material adverse effect on our business, financial condition or results of operations. Moreover, accidental releases or spills and ground water contamination may occur in the course of our operations, and we may incur significant costs and liabilities as a result of such releases, spills or contamination, including any third-party claims for damage to property, natural resources or persons. We maintain insurance against costs of clean-up operations, but we are not fully insured against all such risks. While we believe that we are in substantial compliance with existing environmental laws and regulations and that continued compliance with current requirements would not have a material adverse effect on us, there is no assurance that this will continue in the future.
The following is a summary of some of the existing environmental laws, rules and regulations that apply to our business operations.
Hazardous Substance Release
The Comprehensive Environmental Response, Compensation and Liability Act of 1980 (“CERCLA”), also known as the Superfund law, and comparable state statutes impose strict liability, and under certain circumstances, joint and several liability, on classes of persons who are considered to be responsible for the release of a hazardous substance into the environment. These persons include the owner or operator of the site where the release occurred, and anyone who disposed or arranged for the disposal of a hazardous substance released at the site. Under CERCLA, such persons may be subject to strict, joint and several liabilities for the
8
Table of Contents
costs of investigating releases of hazardous substances, cleaning up the hazardous substances that have been released into the environment, for damages to natural resources and for the costs of certain health studies. In addition, it is not uncommon for neighboring landowners and other third-parties to file claims for personal injury and property damage allegedly caused by the hazardous substances released into the environment. Crude oil and fractions of crude oil are excluded from regulation under CERCLA. Nevertheless, many chemicals commonly used at oil and gas production facilities fall outside of the CERCLA petroleum exclusion. While we generate materials in the course of our operations that may be regulated as hazardous substances, we have not received notification that we may be potentially responsible for cleanup costs under CERCLA.
Waste Handling
The Resource Conservation and Recovery Act (“RCRA”) and comparable state statutes regulate the generation, transportation, treatment, storage, disposal and cleanup of hazardous and non-hazardous wastes. Under the auspices of the EPA, the individual states administer some or all of the provisions of RCRA, sometimes in conjunction with their own, more stringent requirements. Drilling fluids, produced water and most of the other wastes associated with the exploration, development and production of oil or gas are currently regulated under RCRA’s non-hazardous waste provisions. However, it is possible that certain oil and gas exploration and production wastes now classified as non-hazardous could be classified as hazardous wastes in the future. Any such change could increase our operating expenses, which could have a material adverse effect on our business, financial condition and results of operations.
We currently own or lease properties that for many years have been used for oil and gas exploration, production and development activities. Although we used operating and disposal practices that were standard in the industry at the time, petroleum hydrocarbons or wastes may have been disposed of or released on, under or from the properties owned or leased by us or on, under or from other locations where such wastes have been taken for disposal. In addition, some of these properties have been operated by third parties whose treatment and disposal or release of petroleum hydrocarbons and wastes was not under our control. These properties and the materials disposed or released on, at, under or from them may be subject to CERCLA, RCRA and analogous state laws. Under such laws, we could be required to remove or remediate previously disposed wastes or contamination, or to perform remedial activities to prevent future contamination.
Air Emissions
The federal Clean Air Act and comparable state laws regulate emissions of various air pollutants through air emissions permitting programs and other requirements. In addition, the EPA has developed, and continues to develop, stringent regulations governing emissions at specified sources. In particular, on April 18, 2012, the EPA issued new regulations under the New Source Performance Standards (“NSPS”) and National Emission Standards for Hazardous Air Pollutants (“NESHAP”). The new regulations are designed to reduce volatile organic compound (“VOC”) emissions from hydraulically fractured natural gas wells, storage tanks and other equipment. The regulations established a phase-in period that extends until January 2015. During the phase-in period, owners and operators of hydraulically fractured natural gas wells (wells drilled principally for the production of natural gas) must either flare their emissions or use so-called “green completion” technology. Green completions allow for the recovery of natural gas that formerly would have been vented or flared. Beginning January 1, 2015, all newly fractured natural gas wells must use green completion technology. We do not expect that the NSPS or NESHAP will have a material adverse effect on our business, financial condition or results of operations. However, any future laws and their implementing regulations, may require us to obtain pre-approval for the expansion or modification of existing facilities or the construction of new facilities expected to produce air emissions, impose stringent air permit requirements or use specific equipment or technologies to control emissions. Our failure to comply with these requirements could subject us to monetary penalties, injunctions, conditions or restrictions on operations and, potentially, criminal enforcement actions. We believe that we currently are in substantial compliance with all air emissions regulations and that we hold all necessary and valid construction and operating permits for our current operations.
9
Table of Contents
Greenhouse Gas Emissions
While Congress has, from time-to-time, considered legislation to reduce emissions of GHGs, there has not been significant activity in the form of adopted legislation to reduce GHG emissions at the federal level in recent years. In the absence of such federal legislation, a number of states have taken legal measures to reduce emissions of GHGs through the planned development of GHG emission inventories and/or regional GHG cap-and-trade programs or other mechanisms. Most cap-and-trade programs work by requiring major sources of emissions, such as electric power plants, or major producers of fuels such as refineries and gas processing plants, to acquire and surrender emission allowances corresponding with their annual emissions of GHGs. The number of allowances available for purchase is reduced each year until the overall GHG emission reduction goal is achieved. As the number of GHG emission allowances declines each year, the cost or value of allowances is expected to escalate significantly. Many states have enacted renewable portfolio standards, which require utilities to purchase a certain percentage of their energy from renewable fuel sources.
In response to findings that emissions of carbon dioxide, methane and other GHGs present an endangerment to human health and the environment, the EPA has adopted regulations under existing provisions of the federal Clean Air Act. The EPA has adopted two sets of rules regarding possible future regulation of GHG emissions under the Clean Air Act, one of which purports to regulate emissions of GHGs from motor vehicles and the other of which would regulate emissions of GHGs from large stationary sources of emissions, such as power plants or industrial facilities. The motor vehicle rule was finalized in April 2010 and became effective in January 2011, but it does not require immediate reductions in GHG emissions. In March 2012, the EPA proposed GHG emissions standards for fossil fuel-powered electric utility generating units that would require new plants to meet an output-based standard of 1,000 pounds of carbon dioxide equivalent per megawatt-hour. The EPA issued a new proposed rule in September 2013, which retained the 1,000 pounds of carbon dioxide equivalent per megawatt-hour standard for large gas-fired power plants. The new proposal includes a standard of 1,100 pounds of carbon dioxide equivalent per megawatt-hour for small, gas-fired turbines and coal-fired turbines. If the proposed regulation is adopted, it could have a significant impact on the electrical generation industry and may favor the use of natural gas over other fossil fuels such as coal in new plants. The EPA has also indicated that it will propose new GHG emissions standards for refineries, but we do not know when the agency will issue specific regulations.
In December 2010, the EPA enacted final rules on mandatory reporting of GHGs. In 2011, the EPA published amendments to the rule containing technical and clarifying changes to certain GHG reporting requirements and a six-month extension for reporting GHG emissions from petroleum and natural gas industry sources. Under the amended rule, certain onshore oil and natural gas production, processing, transmission, storage and distribution facilities are required to report their GHG emissions on an annual basis. Our operations in the Permian Basin are subject to the EPA’s mandatory reporting rules, and we believe that we are in substantial compliance with such rules. We do not expect that the EPA’s mandatory GHG reporting requirements will have a material adverse effect on our business, financial condition or results of operations.
The adoption of additional legislation or regulatory programs to monitor or reduce GHG emissions could require us to incur increased operating costs, such as costs to purchase and operate emissions control systems, acquire emissions allowances or comply with new regulatory requirements. In addition, the EPA has stated that the data collected from GHG emissions reporting programs may be the basis for future regulatory action to establish substantive GHG emissions factors. Any GHG emissions legislation or regulatory programs applicable to power plants or refineries could increase the cost of consuming, and thereby reduce demand for, the oil and natural gas we produce. Consequently, legislation and regulatory programs to reduce GHG emissions could have an adverse effect on our future business, financial condition and results of operations.
Water Discharges
The Federal Water Pollution Control Act (the “Clean Water Act”) and analogous state laws, impose restrictions and strict controls on the discharge of pollutants and fill material, including spills and leaks of oil and
10
Table of Contents
other substances into regulated waters, including wetlands. The discharge of pollutants into regulated waters is prohibited, except in accordance with the terms of a permit issued by the EPA, an analogous state agency, or, in the case of fill material, the United States Army Corps of Engineers. Federal and state regulatory agencies can impose administrative, civil and criminal penalties for non-compliance with discharge permits or other requirements of the Clean Water Act and analogous state laws and regulations.
In October 2011, the EPA announced its intent to develop national standards for wastewater discharges produced by natural gas extraction from shale and coalbed methane formations. The EPA is expected to issue proposed regulations establishing wastewater discharge standards for coalbed methane wastewater and shale gas wastewater in 2014. For shale gas wastewater, the EPA will consider imposing pre-treatment standards for discharges to a wastewater treatment facility. Produced and other flowback water from our current operations in the Permian Basin is typically re-injected into underground formations that do not contain potable water. To the extent that re-injection is not available for our operations and discharge to wastewater treatment facilities is required, new standards from the EPA could increase the cost of disposing wastewater in connection with our operations.
The Safe Drinking Water Act, Groundwater Protection and the Underground Injection Control Program
The federal Safe Drinking Water Act (“SDWA”) and the Underground Injection Control program (the “UIC program”) promulgated under the SDWA and state programs regulate the drilling and operation of salt water disposal wells. The EPA has delegated administration of the UIC program in Texas to the Railroad Commission of Texas (“RRC”). Permits must be obtained before drilling salt water disposal wells, and casing integrity monitoring must be conducted periodically to ensure the casing is not leaking saltwater to groundwater. Contamination of groundwater by oil and gas drilling, production and related operations may result in fines, penalties and remediation costs, among other sanctions and liabilities under the SDWA and state laws. In addition, third-party claims may be filed by landowners and other parties claiming damages for alternative water supplies, property damages and bodily injury.
Hydraulic Fracturing
Hydraulic fracturing is the subject of significant focus among some environmentalists, regulators and the general public. Concerns over potential hazards associated with the use of hydraulic fracturing and its impact on the environment have been raised at all levels, including federal, state and local, as well as internationally. There have been claims that hydraulic fracturing may contaminate groundwater, reduce air quality or cause earthquakes. Hydraulic fracturing requires the use and disposal of water, and public concern has been growing over the adequacy of water supply.
The Energy Policy Act of 2005, which exempts hydraulic fracturing from regulation under the SDWA, prohibits the use of diesel fuel in the fracturing process without a UIC permit. In the past, legislation has been introduced in, but not passed by, Congress that would amend the SDWA to repeal this exemption. Specifically, the FRAC Act has been introduced in each Congress since 2008 to accomplish these purposes, and on May 9, 2013, the FRAC Act was again re-introduced. If this or similar legislation were enacted, it could require hydraulic fracturing operations to meet permitting and financial assurance requirements, adhere to certain construction specifications, fulfill monitoring, reporting and recordkeeping obligations and meet plugging and abandonment requirements. Future federal legislation could also require the reporting and public disclosure of chemical additives used in the fracturing process, which could make it easier for third parties opposing the hydraulic fracturing process to initiate legal proceedings based on allegations that specific chemical additives used in the fracturing process could adversely affect groundwater. If federal legislation regulating hydraulic fracturing is adopted in the future, it could lead to operational delays or increased operating costs and could result in additional regulatory burdens that could make it more difficult to perform hydraulic fracturing and increase our costs of compliance and doing business.
11
Table of Contents
In 2010, the EPA asserted federal regulatory authority over hydraulic fracturing involving diesel additives under the UIC program by posting a requirement on its website that requires facilities to obtain permits to use diesel fuel in hydraulic fracturing operations. Industry groups filed suit challenging the EPA’s decision as a “final agency action” and, therefore, a violation of the notice-and-comment rulemaking procedures of the Administrative Procedures Act. In February 2012, the EPA and industry reached a settlement under which the EPA will modify the informal policy posted on its website concerning the need for permits under the UIC program. However, the settlement does not reflect agreement on the issue of hydraulic fracturing regulation under the SDWA, and the EPA’s continued assertion of its regulatory authority under the SDWA could result in extensive requirements that could cause additional costs and delays in the hydraulic fracturing process.
In addition to the above actions of the EPA, certain members of the Congress have called upon (i) the Government Accountability Office to investigate how hydraulic fracturing might adversely affect water resources; (ii) the Securities and Exchange Commission (the “SEC”) to investigate the natural gas industry and any possible misleading of investors or the public regarding the economic feasibility of pursuing natural gas deposits in shale by means of hydraulic fracturing; and (iii) the Energy Information Administration to provide a better understanding of that agency’s estimates regarding natural gas reserves, including reserves from shale formations, as well as uncertainties associated with those estimates. The SEC has issued subpoenas to certain shale gas producers requesting information on proved reserve estimates from shale gas wells and the actual productivity of producing shale gas wells. The media has also reported that the New York attorney general has issued subpoenas to certain oil and gas companies seeking information regarding shale gas wells.
There are also certain governmental reviews either underway or being proposed that focus on environmental aspects of hydraulic fracturing. The White House Council on Environmental Quality is coordinating an administration-wide review of hydraulic fracturing, and a committee of the United States House of Representatives has conducted an investigation of hydraulic fracturing. Furthermore, a number of federal agencies are analyzing, or have been requested to review, a variety of environmental issues associated with hydraulic fracturing. The EPA has also begun a study of the potential environmental impacts of hydraulic fracturing. The EPA issued a progress report in December 2012, and final results are expected in late 2014. In addition, the U.S. Department of Energy conducted an investigation into practices the agency could recommend to better protect the environment from using hydraulic fracturing. The Shale Gas Subcommittee of the Secretary of Energy Advisory Board released its “90-day” report on August 18, 2011, and its final report on November 18, 2011, proposing recommendations to reduce the potential environmental impacts from shale gas production. Also, the U.S. Department of the Interior published a revised proposed rule in May 2013 that would implement updated requirements for hydraulic fracturing activities on federal lands, including new requirements relating to public disclosure, well bore integrity and handling of flowback water. Other governmental agencies, including the U.S. Department of Energy, have evaluated or are evaluating various other aspects of hydraulic fracturing. These ongoing or proposed investigations and studies, depending on their degree of pursuit and any meaningful results obtained, could facilitate initiatives to further regulate hydraulic fracturing.
Some states have adopted, and other states are considering adopting, regulations that could restrict hydraulic fracturing in certain circumstances or otherwise require the public disclosure of chemicals used in hydraulic fracturing. For example, pursuant to legislation adopted by the State of Texas in June 2011, the RRC enacted a rule in December 2011, requiring disclosure to the RRC and the public of certain information regarding additives, chemical ingredients, concentrations and water volumes used in hydraulic fracturing. In addition to state law, local land use restrictions, such as city ordinances, may restrict or prohibit drilling, in general. and hydraulic fracturing, in particular.
If these or any other new laws or regulations that significantly restrict hydraulic fracturing are adopted, it could become more difficult or costly for Approach to drill and produce oil and gas from shale and tight sands formations and become easier for third parties opposing hydraulic fracturing to initiate legal proceedings. In addition, if hydraulic fracturing is regulated at the federal level, fracturing activities could become subject to delays, additional permitting and financial assurance requirements, more stringent construction specifications,
12
Table of Contents
increased monitoring, reporting and recordkeeping obligations, plugging and abandonment requirements and higher costs. These new laws or regulations could cause us to incur substantial delays or suspensions of operations and compliance costs and could have a material adverse effect on our business, financial condition and results of operations.
Compliance
We believe that we are in substantial compliance with all existing environmental laws and regulations that apply to our current operations and that our ongoing compliance with existing requirements will not have a material adverse effect on our business, financial condition or results of operations. We did not incur any material capital expenditures for remediation or pollution control activities for the year ended December 31, 2013. In addition, as of the date of this report, we are not aware of any environmental issues or claims that will require material capital or operating expenditures during 2014. However, the passage of additional or more stringent laws or regulations in the future could have a negative effect on our business, financial condition and results of operations, including our ability to develop our undeveloped acreage.
Threatened and Endangered Species, Migratory Birds and Natural Resources
Various state and federal statutes prohibit certain actions that adversely affect endangered or threatened species and their habitat, migratory birds, wetlands and natural resources. These statutes include the Endangered Species Act, the Migratory Bird Treaty Act, the Clean Water Act and CERCLA. The United States Fish and Wildlife Service may designate critical habitat and suitable habitat areas that it believes are necessary for survival of threatened or endangered species. A critical habitat or suitable habitat designation could result in further material restrictions to federal land use and private land use and could delay or prohibit land access or development. Where takings of, or harm to, species or damages to wetlands, habitat or natural resources occur or may occur, government entities or at times private parties may act to prevent oil and gas exploration activities or seek damages for harm to species, habitat or natural resources resulting from drilling or construction or releases of oil, wastes, hazardous substances or other regulated materials, and may seek natural resources damages and, in some cases, criminal penalties.
OSHA and Other Laws and Regulations
We are subject to the requirements of the federal Occupational Safety and Health Act (“OSHA”) and comparable state statutes. The OSHA hazard communication standard, the EPA community right-to-know regulations under Title III of CERCLA and similar state statutes require that we organize and/or disclose information about hazardous materials used or produced in our operations. These laws also require the development of risk management plans for certain facilities to prevent accidental releases of pollutants. We believe that we are in substantial compliance with these applicable requirements and with other OSHA and comparable requirements.
Employees
As of February 14, 2014, we had 135 full-time employees, 87 of whom are field personnel. We regularly use independent contractors and consultants to perform various field and other services. None of our employees are represented by a labor union or covered by any collective bargaining agreement. We believe that our relations with our employees are excellent.
Insurance Matters
As is common in the oil and gas industry, we will not insure fully against all risks associated with our business either because such insurance is not available or because premium costs are considered prohibitive. A loss not fully covered by insurance could have a material adverse effect on our business, financial condition and results of operations.
13
Table of Contents
Available Information
We maintain an internet website under the namewww.approachresources.com. The information on our website is not a part of this report. We make available, free of charge, on our website, our annual report on Form 10-K, quarterly reports on Form 10-Q, current reports on Form 8-K and amendments to those reports, as soon as reasonably practical after providing such reports to the SEC. Also, the charters of our Audit Committee and Compensation and Nominating Committee, and our Code of Conduct, are available on our website and in print to any stockholder who provides a written request to the Corporate Secretary at One Ridgmar Centre, 6500 West Freeway, Suite 800, Fort Worth, Texas 76116.
We file annual reports on Form 10-K, quarterly reports on Form 10-Q and current reports on Form 8-K, proxy statements and other documents with the SEC under the Exchange Act. The public may read and copy any materials that we file with the SEC at the SEC’s Public Reference Room at 100 F Street, NE, Washington DC 20549. The public may obtain information on the operation of the Public Reference Room by calling the SEC at 1-800-SEC-0330. Also, the SEC maintains an internet website that contains reports, proxy and information statements, and other information regarding issuers, including Approach, that file electronically with the SEC. The public can obtain any document we file with the SEC atwww.sec.gov. Information contained on or connected to our website is not incorporated by reference into this Form 10-K and should not be considered part of this report or any other filing that we make with the SEC.
You should carefully consider the risk factors set forth below as well as the other information contained in this report before investing in our common stock. Any of the following risks could materially and adversely affect our business, financial condition and results of operations. In such a case, you may lose all or part of your investment. The risks described below are not the only ones we face. Additional risks and uncertainties not currently known to us, or those we currently view as immaterial, may also materially adversely affect our business, financial condition and results of operations.
Risks Related to the Oil and Gas Industry and Our Business
Drilling, exploring for and producing oil and gas are high-risk activities with many uncertainties that could adversely affect our business, financial condition and results of operations.
Our future financial condition and results of operations will depend on the success of our drilling, exploration and production activities. These activities are subject to numerous risks beyond our control, including the risk that drilling will not result in economic oil and gas production or increases in reserves. Many factors may curtail, delay or cancel our scheduled development projects, including:
| • | decline in oil, NGL and gas prices; |
| • | compliance with governmental regulations, which may include limitations on hydraulic fracturing, access to water or the discharge of greenhouse gases; |
| • | inadequate capital resources; |
| • | limited transportation services and infrastructure to deliver the oil and gas we produce to market; |
| • | inability to attract and retain qualified personnel; |
| • | unavailability or high cost of drilling and completion equipment, services or materials; |
| • | unexpected drilling conditions, pressure or irregularities in formations, equipment failures or accidents; |
| • | lack of acceptable prospective acreage; |
14
Table of Contents
| • | adverse weather conditions; |
| • | surface access restrictions; |
| • | title problems; and |
| • | mechanical difficulties. |
Oil, NGL and gas prices are volatile, and a significant decline in oil, NGL or gas prices could adversely affect our business, financial condition and results of operations and our ability to meet our capital expenditure requirements and financial commitments.
Our revenues, profitability and cash flow depend substantially upon the prices and demand for oil, NGLs and gas. The markets for these commodities are volatile, and even relatively modest drops in prices can affect significantly our financial results and impede our growth. Prices for oil, NGLs and gas fluctuate widely in response to relatively minor changes in the supply and demand for these commodities, market uncertainty and a variety of additional factors beyond our control, such as:
| • | domestic and foreign supply of oil, NGLs and gas; |
| • | domestic and foreign consumer demand for oil, NGLs and gas; |
| • | overall United States and global economic conditions impacting the global supply of and demand for oil, NGLs and gas; |
| • | commodity processing, gathering and transportation availability, and the availability of refining capacity, and other factors that result in differentials to benchmark prices; |
| • | price and availability of alternative fuels; |
| • | price and quantity of foreign imports; |
| • | domestic and foreign governmental regulations; |
| • | political conditions in or affecting other oil and natural gas producing countries; |
| • | weather conditions, including unseasonably warm winter weather and tropical storms; and |
| • | technological advances affecting oil, NGL and gas consumption. |
In addition, substantially all of our production is sold to purchasers at prices that reflect a discount to other relevant benchmark prices, such as WTI NYMEX. The difference between a benchmark price and the price we reference in our sales contracts is called a basis differential. Basis differentials result from variances in regional prices compared to benchmark prices as a result of regional supply and demand factors. We may experience differentials to benchmark prices in the future, which may be material.
Advanced drilling and completion technologies, such as horizontal drilling and hydraulic fracturing, have resulted in increased investment by oil and gas producers in developing U.S. shale gas and, more recently, tight oil projects. The results of higher investment in the exploration for and production of oil and gas and other factors, such as global economic and financial conditions, may cause the price of oil and gas to fall. Lower oil and gas prices may not only cause our revenues to decrease but also may reduce the amount of oil and gas that we can produce economically. Substantial decreases in oil and gas prices would render uneconomic some or all of our drilling locations. This may result in our having to impair our estimated proved reserves and could have a material adverse effect on our business, financial condition and results of operations. Further, if oil, NGL or gas prices significantly decline for an extended period of time or negative differentials increase, we may, among other things, be unable to maintain or increase our borrowing capacity, repay current or future debt or obtain additional capital on attractive terms, all of which can affect the value of our common stock.
15
Table of Contents
If commodity prices decline to a level such that our future undiscounted cash flows from our properties are less than their carrying value for a significant period of time, we may be required to write down the carrying values of our properties. Additionally, current SEC rules also could require us to write down our proved undeveloped reserves in the future.
Accounting rules require that we periodically review the carrying value of our properties for possible impairment. Based on prevailing commodity prices and specific market factors and circumstances at the time of impairment reviews, and the continuing evaluation of development plans, production data, economics and other factors, we may be required to write down the carrying value of our properties. A write-down is a non-cash charge to earnings. We may incur impairment charges in the future, which could have a material adverse effect on our results of operations for the periods in which such charges are taken.
In addition, current SEC rules require that proved undeveloped reserves may only be booked if they relate to wells scheduled to be drilled within five years, unless specific circumstances justify a longer time. This rule may limit our potential to book additional proved undeveloped reserves as we pursue our development projects. Moreover, we may be required to write down our proved undeveloped reserves if we do not drill those wells within the required timeframe. For example, for the year ended December 31, 2013, we reclassified 7.8 MMBoe of proved undeveloped reserves as probable undeveloped. These reserves were attributable to vertical Canyon locations in Project Pangea. We postponed development of these deeper locations beyond five years from initial booking to integrate their development with the shallower Clearfork and Wolfcamp target zones.
Conservation measures and technological advances could reduce demand for oil and gas.
Fuel conservation measures, alternative fuel requirements, increasing interest in alternatives to oil and natural gas, technological advances in fuel economy and energy generation devices could reduce demand for oil and gas. The impact of the changing demand for oil and gas may have a material adverse effect on our business, financial condition, results of operations and cash flows.
We engage in commodity derivative transactions which involve risks that can harm our business.
To manage our exposure to price risks in the marketing of our production, we enter into commodity derivative agreements. While intended to reduce the effects of volatile commodity prices, such transactions may limit our potential gains and increase our potential losses if commodity prices were to rise substantially over the price established by the commodity derivative. In addition, such transactions may expose us to the risk of loss in certain circumstances, including instances in which our production is lower than expected or the counterparties to the commodity derivative agreements fail to perform under the contracts.
We are subject to complex governmental laws and regulations that may adversely affect the cost, manner and feasibility of doing business.
Our oil and gas drilling, production and gathering operations are subject to complex and stringent laws and regulations. To operate in compliance with these laws and regulations, we must obtain and maintain numerous permits and approvals from various federal, state and local governmental authorities. We may incur substantial costs to comply with these existing laws and regulations. In addition, our costs of compliance may increase if existing laws and regulations are revised or reinterpreted, or if new laws and regulations apply to our operations. Such costs could have a material adverse effect on our business, financial condition and results of operations. Failure to comply with laws and regulations applicable to our operations, including any evolving interpretation and enforcement by government authorities, could have a material adverse effect on our business, financial condition and results of operations. See “Business — Regulation” for a further description of the laws and regulations that affect us.
16
Table of Contents
Federal and state legislation and regulatory initiatives and private litigation relating to hydraulic fracturing could stop or delay our development project and result in materially increased costs and additional operating restrictions.
All of our proved non-producing and proved undeveloped reserves associated with future drilling and completion projects will require hydraulic fracturing. See Item 1. “Business — Hydraulic Fracturing” for a discussion of the importance of hydraulic fracturing to our business, and Item 1. “Business — Regulation — Hydraulic Fracturing” for a discussion of regulatory developments regarding hydraulic fracturing. If these or any other new laws or regulations that significantly restrict hydraulic fracturing are adopted, such laws could make it more difficult or costly for us to drill and produce from, as well as make it easier for third parties opposing hydraulic fracturing to initiate legal proceedings. In addition, if hydraulic fracturing is regulated at the federal level, fracturing activities could become subject to additional permitting and financial assurance requirements, more stringent construction specifications, increased monitoring, reporting and recordkeeping obligations, plugging and abandonment requirements and also to permitting delays and increases in costs. These developments, as well as new laws or regulations, could cause us to incur substantial compliance costs, and compliance or the consequences of our failure to comply could have a material adverse effect on our financial condition and results of operations. In addition, if we are unable to use hydraulic fracturing in completing our wells or hydraulic fracturing becomes prohibited or significantly regulated or restricted, we could lose the ability to drill and complete the projects for our proved reserves and maintain our current leasehold acreage, which would have a material adverse effect on our future business, financial condition and results of operations.
Our operations substantially depend on the availability of water. Restrictions on our ability to obtain, dispose of or recycle water may impact our ability to execute our drilling and development plans in a timely or cost-effective manner.
Water is an essential component of our drilling and hydraulic fracturing processes. Historically, we have been able to secure water from local landowners and other sources for use in our operations. During the last three years, West Texas has experienced extreme drought conditions. As a result of the severe drought, governmental authorities have restricted the use of water subject to their jurisdiction for drilling and hydraulic fracturing to protect the local water supply. If we are unable to obtain water to use in our operations, we may be unable to economically produce oil, NGLs and gas, which could have an adverse effect on our business, financial condition and results of operations.
Moreover, new environmental initiatives and regulations could include restrictions on disposal of waste, including, but not limited to, produced water, drilling fluids and other wastes associated with the exploration, development or production of oil and gas. Compliance with environmental regulations and permit requirements for the withdrawal, storage and use of surface water or ground water necessary for hydraulic fracturing may increase our operating costs and cause delays, interruptions or cessation of our operations, the extent of which cannot be predicted, and all of which would have an adverse effect on our business, financial condition, results of operations and cash flows.
Climate change legislation or regulations regulating emissions of GHGs and VOCs could result in increased operating costs and reduced demand for the oil and gas we produce.
In response to findings that emissions of carbon dioxide, methane and other GHGs present an endangerment to human health and the environment, the EPA adopted regulations that restrict emissions of GHGs under existing provisions of the federal Clean Air Act. The EPA also issued final regulations under the NSPS and NESHAP designed to reduce VOCs. See Item 1. “Business — Regulation — Environmental Laws and Regulations — Greenhouse Gas Emissions” and “ — Air Emissions” for a discussion of regulatory developments regarding GHG and VOC emissions.
While Congress has from time-to-time considered legislation to reduce emissions of GHGs, no significant legislation has been adopted to reduce GHG emissions at the federal level in recent years. In the absence of such federal climate legislation, a number of state and regional efforts have emerged that are aimed at tracking and/or
17
Table of Contents
reducing GHG emissions by means of GHG cap-and-trade programs. Most of these cap-and-trade programs require either major sources of emissions or major producers of fuels to acquire and surrender emission allowances, with the number of allowances available for purchase reduced each year until the overall GHG emission reduction goal is achieved. These allowances are expected to escalate significantly in cost over time.
If Congress undertakes comprehensive tax reform in the coming year, it is possible that such reform may include a carbon tax, which could impose additional direct costs on operations and reduce demand for refined products. In any event, the Obama administration recently announced its Climate Action Plan, which, among other things, directs federal agencies to develop a strategy for the reduction of methane emissions, including emissions from the oil and gas industry. As part of the Climate Action Plan, the Obama administration also announced that it intends to adopt additional regulations to reduce emissions of GHGs and to encourage greater use of low-carbon technologies in the coming years.
The adoption of legislation or regulatory programs to reduce GHG or VOC emissions could require us to incur increased operating costs, such as costs to purchase and operate emissions control systems, to acquire emissions allowances or comply with new regulatory requirements. Any GHG emissions legislation or regulatory programs applicable to power plants or refineries could also increase the cost of consuming, and thereby reduce demand for, the oil and natural gas we produce. Consequently, legislation and regulatory programs to reduce GHG or VOC emissions could have a material adverse effect on our business, financial condition and results of operations.
Environmental laws and regulations may expose us to significant costs and liabilities.
There is inherent risk of incurring significant environmental costs and liabilities in our oil and gas operations due to the handling of petroleum hydrocarbons and generated wastes, the occurrence of air emissions and water discharges from work-related activities and the legacy of pollution from historical industry operations and waste disposal practices. We may incur joint and several or strict liability under these environmental laws and regulations in connection with spills, leaks or releases of petroleum hydrocarbons and wastes on, under or from our properties and facilities, some of which have been used for exploration, production or development activities for many years and by third parties not under our control. In particular, the number of private, civil lawsuits involving hydraulic fracturing has risen in recent years. Since late 2009, multiple private lawsuits alleging ground water contamination have been filed in the U.S. against oil and gas companies, primarily by landowners who leased oil and gas rights to defendants, or by landowners who live close to areas where hydraulic fracturing has taken place. In addition, changes in environmental laws and regulations occur frequently, and any such changes that result in more stringent and costly waste handling, storage, transport, disposal or remediation requirements could have a material adverse effect on our business, financial condition and results of operations. We may not be able to recover some or any of these costs from insurance.
Changes in tax laws may adversely affect our results of operations and cash flows.
The administration of President Obama has made budget proposals which, if enacted into law by Congress, would potentially increase and accelerate the payment of U.S. federal income taxes by independent oil and gas producers. Proposals have included, but have not been limited to, repealing the enhanced oil recovery credit, repealing the credit for oil and gas produced from marginal wells, repealing the expensing of intangible drilling costs (“IDCs”), repealing the deduction for the cost of qualified tertiary expenses, repealing the exception to the passive loss limitation for working interests in oil and gas properties, repealing the percentage depletion allowance, repealing the manufacturing tax deduction for oil and gas companies, and increasing the amortization period of geological and geophysical expenses. Legislation that would have implemented the proposed changes has been introduced but not enacted. It is unclear whether legislation supporting any of the above described proposals, or designed to accomplish similar objectives, will be introduced or, if introduced, would be enacted into law or, if enacted, how soon resulting changes would become effective. However, the passage of any legislation designed to implement changes in the U.S. federal income tax laws similar to the changes included in the budget proposals offered by the Obama administration could eliminate certain tax deductions currently
18
Table of Contents
available with respect to oil and gas exploration and development, and any such changes could make it more costly for us to explore for and develop our oil and gas resources, and could negatively affect our financial condition and results of operations.
Our business requires significant capital expenditures, and we may not be able to obtain needed capital or financing on satisfactory terms or at all.
Our exploration, development and acquisition activities require substantial capital expenditures. For example, according to our year-end 2013 reserve report, the estimated capital required to develop our current proved oil and gas reserves is $1.2 billion. Historically, we have funded our capital expenditures through a combination of cash flows from operations, borrowings under our credit facility and public equity financings. Future cash flows are subject to a number of variables, including the production from existing wells, prices of oil, NGLs and gas and our success in developing and producing new reserves. We do not expect our cash flow from operations to be sufficient to cover our current expected capital expenditure budget, and we may have limited ability to obtain the additional capital necessary to sustain our operations at current levels. We may not be able to obtain debt or equity financing on favorable terms or at all. The failure to obtain additional financing could cause us to scale back our exploration and development operations, which in turn could lead to a decline in our oil and gas production and reserves, and in some areas a loss of properties.
We may not be able to generate enough cash flow to meet our debt obligations.
We expect our earnings and cash flow to vary significantly from year to year due to the nature of our industry. As a result, the amount of debt that we can manage in some periods may not be appropriate for us in other periods. Additionally, our future cash flow may be insufficient to meet our debt obligations and other commitments, including our obligations under our $250 million principal amount of 7% Senior Notes. A range of economic, competitive, business and industry factors will affect our future financial performance, and, as a result, our ability to generate cash flow from operations and to pay our debt, including our obligations under the Senior Notes. Many of these factors, such as oil and gas prices, economic and financial conditions in our industry and the global economy and initiatives of our competitors, are beyond our control. If we do not generate enough cash flow from operations to satisfy our debt obligations, we may have to undertake alternative financing plans, such as:
| • | selling assets; |
| • | reducing or delaying capital investments; |
| • | seeking to raise additional capital; or |
| • | refinancing or restructuring our debt. |
If, for any reason, we are unable to meet our debt service and repayment obligations, we would be in default under the terms of the agreements governing our debt, which would allow our creditors at that time to declare all outstanding indebtedness to be due and payable, which would in turn trigger cross-acceleration or cross-default rights between the relevant agreements. In addition, our lenders could compel us to apply all of our available cash to repay our borrowings or they could prevent us from making payments on the Senior Notes. If amounts outstanding under our revolving credit facility or the Senior Notes were to be accelerated, we cannot be certain that our assets would be sufficient to repay in full the money owed to the lenders or to our other debt holders.
Our lenders can limit our borrowing capabilities, which may materially impact our operations.
At December 31, 2013, we had no borrowings under our revolving credit facility, and our borrowing base was $350 million. The borrowing base under our revolving credit facility is redetermined semi-annually based upon a number of factors, including commodity prices and reserve levels. In addition to such semi-annual redeterminations, our lenders may request one additional redetermination during any 12-month period. Upon a redetermination, our borrowing base could be substantially reduced, and if the amount outstanding under our credit facility at any time exceeds the borrowing base at such time, we may be required to repay a portion of our
19
Table of Contents
outstanding borrowings. We use cash flow from operations and bank borrowings to fund our exploration, development and acquisition activities. A reduction in our borrowing base could limit those activities. In addition, we may significantly change our capital structure to make future acquisitions or develop our properties. Changes in capital structure may significantly increase our debt. If we incur additional debt for these or other purposes, the related risks that we now face could intensify. A higher level of debt also increases the risk that we may default on our debt obligations. Our ability to meet our debt obligations and to reduce our level of debt depends on our future performance, which is affected by general economic conditions and financial, business and other factors, many of which are beyond our control.
Our revolving credit facility and the indenture governing our Senior Notes contain operating and financial restrictions that may restrict our business and financing activities.
Our revolving credit facility and the indenture governing our Senior Notes (the “Indenture”) contain, and any future indebtedness we incur may contain, a number of restrictive covenants that will impose significant operating and financial restrictions on us, including restrictions on our ability to, among other things:
| • | sell assets, including equity interests in our subsidiaries; |
| • | pay distributions on, redeem or repurchase our common stock or redeem or repurchase our subordinated debt; |
| • | make investments; |
| • | incur or guarantee additional indebtedness or issue preferred stock; |
| • | create or incur certain liens; |
| • | make certain acquisitions and investments; |
| • | redeem or prepay other debt; |
| • | enter into agreements that restrict distributions or other payments from our restricted subsidiaries to us; |
| • | consolidate, merge or transfer all or substantially all of our assets; |
| • | engage in transactions with affiliates; |
| • | create unrestricted subsidiaries; |
| • | enter into sale and leaseback transactions; and |
| • | engage in certain business activities. |
As a result of these covenants, we will be limited in the manner in which we conduct our business, and we may be unable to engage in favorable business activities or finance future operations or capital needs.
Our ability to comply with some of the covenants and restrictions contained in our revolving credit facility and the Indenture may be affected by events beyond our control. If market or other economic conditions deteriorate, our ability to comply with these covenants may be impaired. A failure to comply with the covenants, ratios or tests in our revolving credit facility, the Indenture or any future indebtedness could result in an event of default, which, if not cured or waived, could have a material adverse effect on our business, financial condition and results of operations. If an event of default under our revolving credit facility occurs and remains uncured, the lenders:
| • | would not be required to lend any additional amounts to us; |
| • | could elect to declare all borrowings outstanding, together with accrued and unpaid interest and fees, to be due and payable; |
| • | may have the ability to require us to apply all of our available cash to repay these borrowings; or |
| • | may prevent us from making debt service payments under our other agreements. |
20
Table of Contents
A payment default or an acceleration under our credit facility could result in an event of default and acceleration of indebtedness under the Senior Notes.
If the indebtedness under the Senior Notes were to be accelerated, there can be no assurance that we would have, or be able to obtain, sufficient funds to repay such indebtedness in full. In addition, our obligations under our revolving credit facility are collateralized by perfected first-priority liens and security interests on substantially all of our Permian Basin assets in West Texas and a pledge of equity interests of certain subsidiaries, and if we are unable to repay our indebtedness under the revolving credit facility, the lenders could seek to foreclose on our assets.
Because all of our operations are conducted through our subsidiaries, our ability to service our debt is largely dependent on our receipt of distributions or other payments from our subsidiaries.
We are a holding company, and all of our operations are conducted through our subsidiaries. As a result, our ability to service our debt largely depends on the earnings of our subsidiaries and the payment of those earnings to us in the form of dividends, loans or advances and through repayment of loans or advances from us. Our subsidiaries are legally distinct from us and, except for our subsidiaries that have guaranteed our debt, have no obligation to pay amounts due on our debt or to make funds available to us for such payment. The ability of our subsidiaries to pay dividends, repay intercompany notes or make other advances to us is subject to restrictions imposed by applicable laws, tax considerations and the agreements governing our subsidiaries. In addition, such payment may be restricted by claims against our subsidiaries by their creditors, including suppliers, vendors, lessors and employees.
Our future reserve and production growth depends on the success of our Wolfcamp oil shale resource play, which has a limited operational history and is subject to change.
We began drilling wells in the Wolfcamp play relatively recently. The wells that have been drilled or recompleted in these areas represent a small sample of our large acreage position, and we cannot assure you that our new wells will be successful. We continue to gather data about our prospects in the Wolfcamp play, and it is possible that additional information may cause us to change our drilling schedule or determine that prospects in some portion of our acreage position should not be developed at all.
Part of our strategy involves using some of the latest available horizontal drilling and completion techniques, which involve risks and uncertainties in their application.
Our operations involve using some of the latest drilling and completion techniques as developed by us and our service providers. Risks that we face while drilling horizontal wells include, but are not limited to:
| • | landing our wellbore in the desired drilling zone; |
| • | staying in the desired drilling zone while drilling horizontally through the formation; |
| • | running our casing the entire length of the wellbore; and |
| • | being able to run tools and other equipment consistently through the horizontal wellbore. |
Risks that we face while completing our wells include, but are not limited to:
| • | the ability to fracture stimulate the planned number of stages; |
| • | the ability to run tools the entire length of the wellbore during completion operations; and |
| • | the ability to successfully clean out the wellbore after completion of the final fracture stimulation stage. |
The results of our drilling in new or emerging formations are more uncertain initially than drilling results in areas that are more developed and have a longer history of established production. Newer or emerging formations and areas have limited or no production history and, consequently, we are more limited in assessing future
21
Table of Contents
drilling results in these areas. If our drilling results are less than anticipated, the return on our investment for a particular project may not be as attractive as we anticipated, and we could incur material write-downs of unevaluated properties and the value of our undeveloped acreage could decline in the future.
Failure to effectively execute and manage our single major development project, Project Pangea, could result in significant delays, cost overruns, limitation of our growth, damage to our reputation and a material adverse effect on our business, financial condition and results of operations.
We believe we have an extensive inventory of identified drilling locations in our development project (Project Pangea) in the Wolfcamp shale oil resource play; however, Project Pangea is our core asset and our only development project. As we achieve more results in Project Pangea, we have expanded our horizontal development project there. This level of development activity requires significant effort from our management and technical personnel and places additional requirements on our financial resources and internal operating and financial controls. Our ability to successfully develop and manage this project will depend on, among other things:
| • | the extent of our success in drilling and completing horizontal Wolfcamp wells; |
| • | our ability to control costs and manage drilling and completion risks; |
| • | our ability to finance development of the project; |
| • | our ability to attract, retain and train qualified personnel with the skills required to develop the project in a timely and cost-effective manner; and |
| • | our ability to implement and maintain effective operating and financial controls and reporting systems necessary to develop and operate the project. |
We may not be able to compensate for, or fully mitigate, these risks.
Currently, substantially all of our producing properties are located in two counties in Texas, making us vulnerable to risks associated with operating in one primary area.
Substantially all of our producing properties and estimated proved reserves are concentrated in Crockett and Schleicher Counties, Texas. As a result of this concentration, we are disproportionately exposed to the natural decline of production from these fields as well as the impact of delays or interruptions of production from these wells caused by significant governmental regulation, transportation capacity constraints, curtailments of production, service delays, natural disasters or other events that impact this area.
Because of our geographic concentration, our purchaser base is limited, and the loss of one of our key purchasers or their inability to take our oil, NGLs or gas could adversely affect our financial results.
In 2013, Wildcat, DCP and JPE collectively accounted for 80% of our total oil, NGL and gas sales, excluding realized commodity derivative settlements. As of December 31, 2013, we had dedicated all of our oil production from northern Project Pangea and Pangea West through 2022 to JP Energy. In addition, as of December 31, 2013, we had contracted to sell all of our NGL and natural gas production from Project Pangea to DCP through January 2016. To the extent that any of our major purchasers reduces their purchases of oil, NGLs or gas, is unable to take our oil, NGLs or gas due to infrastructure or capacity limitations or defaults on their obligations to us, we would be adversely affected unless we were able to make comparably favorable arrangements with other purchasers. These purchasers’ default or non-performance could be caused by factors beyond our control. A default could occur as a result of circumstances relating directly to one or more of these customers or due to circumstances related to other market participants with which the customer has a direct or indirect relationship.
22
Table of Contents
We depend on our management team and other key personnel. The loss of any of these individuals, or the inability to attract, train and retain additional qualified personnel, could adversely affect our business, financial condition and the results of operations and future growth.
Our success largely depends on the skills, experience and efforts of our management team and other key personnel and the ability to attract, train and retain additional qualified personnel. The loss of the services of one or more members of our senior management team or of our other employees with critical skills needed to operate our business could have a negative effect on our business, financial condition, results of operations and future growth. In January 2011, we entered into an amended and restated employment agreement with J. Ross Craft, P.E., our President and Chief Executive Officer; and new employment agreements with Qingming Yang, our Chief Operating Officer; J. Curtis Henderson, our Chief Administrative Officer; and Ralph P. Manoushagian, our Executive Vice President, Land. On January 3, 2014, we entered into an employment agreement with Sergei Krylov as the Company’s Executive Vice President and Chief Financial Officer. If any of these officers or other key personnel resign or become unable to continue in their present roles and are not adequately replaced, our business operations could be materially adversely affected. In addition, our ability to manage our growth, if any, will require us to effectively train, motivate and manage our existing employees and to attract, motivate and retain additional qualified personnel. Competition for these types of personnel is intense, and we may not be successful in attracting, assimilating and retaining the personnel required to grow and operate our business profitably.
Market conditions or transportation and infrastructure impediments may hinder our access to oil, NGL and gas markets or delay our production or sales.
Market conditions or the unavailability of satisfactory oil, NGL and gas processing and transportation services and infrastructure may hinder our access to oil, NGL and gas markets or delay our production or sales. Although currently we control the gathering systems for our operations in the Permian Basin, we do not have such control over the regional or downstream pipelines in and out of the Permian Basin. The availability of a ready market for our oil, NGL and gas production depends on a number of factors, including market demand and the proximity of our reserves to pipelines or trucking and rail terminal facilities.
In addition, the amount of oil, NGLs and gas that can be produced and sold is subject to curtailment in certain circumstances, such as pipeline interruptions due to maintenance, excessive pressure, ability of downstream processing facilities to accept unprocessed gas or NGLs, physical damage or operational interruptions to the gathering or transportation system or downstream processing and fractionation facilities or lack of contracted capacity on such systems or facilities. For example, in March 2013, our production was curtailed as a result of third-party NGL fractionation facility repair and maintenance, and in May 2013, production was curtailed as the result of a power outage at the same facility. We have no assurance that such curtailments will not occur again in the future.
The curtailments arising from these and similar circumstances may last from a few days to several months, and in many cases, we are provided with limited, if any, notice as to when these circumstances will arise and their duration. As a result, we may not be able to sell, or may have to transport by more expensive means, the oil, NGL and gas that we produce, or we may be required to shut in oil or gas wells or delay initial production until the necessary gathering and transportation systems are available. Any significant curtailment in gathering systems, transportation, pipeline capacity or significant delay in construction of necessary gathering and transportation facilities, could adversely affect our business, financial condition and results of operations.
Loss of our information and computer systems could adversely affect our business, financial condition and results of operations.
We heavily depend on our information systems and computer-based programs, including drilling, completion and production data, seismic data, electronic data processing and accounting data. If any of these programs or systems were to fail or create erroneous information in our hardware or software network infrastructure, possible consequences include our loss of communication links, inability to find, produce, process
23
Table of Contents
and sell oil, NGLs and gas and inability to automatically process commercial transactions or engage in similar automated or computerized business activities. In addition, a cyber incident involving our information systems and related infrastructure could disrupt our business plans and result in information theft, data corruption, operational disruption and/or financial loss. Any such consequence could have a material adverse effect on our business, financial condition and results of operations.
The unavailability or high cost of drilling rigs, equipment, materials, personnel and oilfield services could adversely affect our ability to execute our drilling and development plans on a timely basis and within our budget.
Our industry is cyclical and, from time-to-time, there is a shortage of drilling rigs, equipment, supplies or qualified personnel. During these periods, the costs and delivery times of equipment, oilfield services and supplies are substantially greater. In addition, the demand for, and wage rates of, qualified drilling and completion crews rise as the number of active rigs in service increases. Increasing levels of exploration and production will increase the demand for oilfield services, and the costs of these services may increase, while the quality of these services may suffer. If the availability of equipment, crews, materials and services in the Permian Basin is particularly severe, our business, results of operations and financial condition could be materially and adversely affected because our operations and properties are concentrated in the Permian Basin.
Competition in the oil and gas industry is intense, and many of our competitors have resources that are greater than ours.
We operate in a highly competitive environment for acquiring prospects and productive properties, marketing oil and gas and securing equipment and skilled personnel. Many of our competitors are major and large independent oil and gas companies that have financial, technical and personnel resources substantially greater than ours. Those companies may be able to develop and acquire more prospects and productive properties than our financial or personnel resources permit. Our ability to develop and operate our current project, acquire additional prospects and discover reserves in the future will depend on our ability to hire and retain qualified personnel, evaluate and select suitable properties and consummate transactions in a highly competitive environment. Also, there is substantial competition for capital available for investment in the oil and gas industry. Larger competitors may be better able to withstand sustained periods of unsuccessful drilling and absorb the burden of changes in laws and regulations more easily than we can, which would adversely affect our competitive position. We may not be able to compete successfully in the future in attracting and retaining qualified personnel, acquiring prospective reserves, developing reserves, marketing oil, NGLs and gas and raising additional capital.
Our identified drilling locations are scheduled to be drilled over many years, making them susceptible to uncertainties that could prevent them from being drilled or delay their drilling. In certain instances, this could prevent drilling and production before the expiration date of leases for such locations.
Our management team has identified drilling locations as an estimation of our future development activities on our existing acreage. These identified drilling locations represent a significant part of our growth strategy. Our ability to drill and develop these identified drilling locations depends on a number of uncertainties, including oil, NGL and gas prices, the availability and cost of capital, drilling and production costs, availability of drilling services and equipment, drilling results, lease expirations, gathering system, marketing and transportation constraints, regulatory approvals and other factors. Because of these uncertain factors, we do not know if the drilling locations we have identified will ever be drilled or if we will be able to produce oil or gas from these or any other identified drilling locations. In addition, unless production is established within the spacing units covering the undeveloped acres on which some of the identified locations are obtained, the leases for such acreage will expire. Therefore, our actual drilling activities may materially differ from those presently identified.
24
Table of Contents
The use of geoscientific, petrophysical and engineering analyses and other technical or operating data to evaluate drilling prospects is uncertain and does not guarantee drilling success or recovery of economically producible reserves.
Our decisions to explore, develop and acquire prospects or properties targeting Wolfcamp and other zones in the Permian Basin and other areas depend on data obtained through geoscientific, petrophysical and engineering analyses, the results of which can be uncertain. Even when properly used and interpreted, data from whole cores, regional well log analyses, 3-D seismic and micro-seismic only assist our technical team in identifying hydrocarbon indicators and subsurface structures and estimating hydrocarbons in place. They do not allow us to know conclusively the amount of hydrocarbons in place and if those hydrocarbons are producible economically. In addition, the use of advanced drilling and completion technologies for our Wolfcamp development, such as horizontal drilling and multi-stage fracture stimulations, requires greater expenditures than our traditional development drilling strategies. Our ability to commercially recover and produce the hydrocarbons that we believe are in place and attributable to the Wolfcamp and other zones will depend on the effective use of advanced drilling and completion techniques, the scope of our development project (which will be directly affected by the availability of capital), drilling and production costs, availability of drilling and completion services and equipment, drilling results, lease expirations, regulatory approval and geological and mechanical factors affecting recovery rates. Our estimates of unproved reserves, estimated ultimate recoveries per well, hydrocarbons in place and resource potential may change significantly as development of our oil and gas assets provides additional data.
Unless we replace our oil and gas reserves, our reserves and production will decline.
Our future oil and gas production depends on our success in finding or acquiring additional reserves. If we fail to replace reserves through drilling or acquisitions, our production, revenues and cash flows will be adversely affected. In general, production from oil and gas properties declines as reserves are depleted, with the rate of decline depending on reservoir characteristics. Our total proved reserves will decline as reserves are produced, unless we conduct other successful exploration and development activities or acquire properties containing proved reserves, or both. Our ability to make the necessary capital investment to maintain or expand our asset base of oil and gas reserves would be limited to the extent cash flow from operations is reduced and external sources of capital become limited or unavailable. We may not be successful in exploring for, developing or acquiring additional reserves.
We have leases and options for undeveloped acreage that may expire in the near future.
As of December 31, 2013, we held mineral leases or options in each of our areas of operations that are still within their original lease term and are not currently held by production. Unless we establish commercial production on the properties subject to these leases, most of these leases will expire between 2014 and 2016. If these leases or options expire, we will lose our right to develop the related properties, unless we renew such leases. The cost to renew such leases may increase significantly, and we may not be able to renew such leases on commercially reasonable terms or at all. See Item 2. “Properties — Undeveloped Acreage Expirations” for a table summarizing the expiration schedule of our undeveloped acreage over the next three years. Acreage set to expire over the next three years accounts for 70% of our net undeveloped acreage, 6% of our proved undeveloped reserves and 3.7% of our total proved reserves.
Our actual production, revenues and expenditures related to our reserves are likely to differ from our estimates of our proved reserves. We may experience production that is less than estimated and drilling costs that are greater than estimated in our reserve reports. These differences may be material.
The proved oil, NGL and gas reserves data included in this report are estimates. Petroleum engineering is a subjective process of estimating underground accumulations of oil and gas that cannot be measured in an exact
25
Table of Contents
manner. Estimates of economically recoverable oil, NGL and gas reserves and of future net cash flows necessarily depend upon a number of variable factors and assumptions, including:
| • | historical production from the area compared with production from other similar producing areas; |
| • | the assumed effects of regulations by governmental agencies; |
| • | assumptions concerning future oil, NGL and gas prices; and |
| • | assumptions concerning future operating costs, severance and excise taxes, development costs and workover and remedial costs. |
Because all reserves estimates are to some degree subjective, each of the following items may differ materially from those assumed in estimating proved reserves:
| • | the quantities of oil, NGL and gas that are ultimately recovered; |
| • | the production and operating costs incurred; |
| • | the amount and timing of future development expenditures; and |
| • | future oil, NGL and gas prices. |
As of December 31, 2013, approximately 61% of our proved reserves were proved undeveloped. Estimates of proved undeveloped reserves are even less reliable than estimates of proved developed reserves. Furthermore, different reserve engineers may make different estimates of reserves and future net revenues based on the same available data. Our actual production, revenues and expenditures with respect to reserves will likely be different from estimates and the differences may be material.
The Standardized Measure of our estimated reserves and PV-10 included in this report should not be considered as the current market value of the estimated oil and gas reserves attributable to our properties.
Standardized Measure is a reporting convention that provides a common basis for comparing oil and gas companies subject to the rules and regulations of the SEC. Standardized Measure requires the use of specific pricing as required by the SEC as well as operating and development costs prevailing as of the date of computation. The non-GAAP financial measure, PV-10, is based on the average of the closing price on the first day of the month for the 12-month period prior to fiscal year end, while actual future prices and costs may be materially higher or lower.
Consequently, these measures may not reflect the prices ordinarily received or that will be received for oil and gas production because of varying market conditions, nor may they reflect the actual costs that will be required to produce or develop the oil and gas properties. Accordingly, estimates included herein of future net cash flow may be materially different from the future net cash flows that are ultimately received. Therefore, the Standardized Measure of our estimated reserves and PV-10 included in this report should not be construed as accurate estimates of the current fair value of our proved reserves.
If oil, NGL and gas prices decline by 10% from $97.28 per Bbl of oil, $30.16 per Bbl of NGLs and $3.66 per MMBtu of gas, to $87.55 per Bbl of oil, $27.14 per Bbl of NGLs and $3.29 per MMBtu of gas, then our PV-10 as of December 31, 2013, would decrease from $1.1 billion to approximately $885 million. The average market price received for our production for the month of December 2013 was $90.49 per Bbl of oil, $32.85 per Bbl of NGLs and $4.27 per Mcf of gas (after basis differential and Btu adjustments). Actual future net revenues also will be affected by factors such as the amount and timing of actual production, prevailing operating and development costs, supply and demand for oil and gas, increases or decreases in consumption and changes in governmental regulations or taxation.
26
Table of Contents
We may be unable to make attractive acquisitions or successfully integrate acquired businesses, and any inability to do so may disrupt our business and hinder our ability to grow.
In the future we may make acquisitions of businesses that complement or expand our current business. We may not be able to identify attractive acquisition opportunities. Even if we do identify attractive acquisition opportunities, we may not be able to complete the acquisition or do so on commercially acceptable terms. Competition for acquisitions may also increase the cost of, or cause us to refrain from, completing acquisitions.
The success of any completed acquisition will depend on our ability to integrate effectively the acquired business into our existing operations. The process of integrating acquired businesses may involve unforeseen difficulties and may require a disproportionate amount of our managerial and financial resources. No assurance can be given that we will be able to identify suitable acquisition opportunities, negotiate acceptable terms, obtain financing for acquisitions on acceptable terms or successfully acquire identified targets. Our failure to achieve consolidation savings, to integrate the acquired businesses and assets into our existing operations successfully or to minimize any unforeseen operational difficulties could have a material adverse effect on our financial condition and results of operations.
Severe weather could have a material adverse impact on our business.
Our business could be materially and adversely affected by severe weather. Repercussions of severe weather conditions may include:
| • | curtailment of services, including oil, NGL and gas pipelines, processing plants and trucking services; |
| • | weather-related damage to drilling rigs, resulting in a temporary suspension of operations; |
| • | weather-related damage to our producing wells or facilities; |
| • | inability to deliver materials to jobsites in accordance with contract schedules; and |
| • | loss of production. |
Operating hazards or other interruptions of our operations could result in potential liabilities, which may not be fully covered by our insurance.
The oil and gas business involves certain operating hazards such as well blowouts, cratering, explosions, uncontrollable flows of gas, oil or well fluids, fires, surface and subsurface pollution and contamination, and releases of toxic gas. The occurrence of one of the above may result in injury, loss of life, suspension of operations, environmental damage and remediation and/or governmental investigations and penalties. Consistent with insurance coverage generally available to the industry, our insurance policies provide limited coverage for losses or liabilities relating to pollution, with broader coverage for sudden and accidental occurrences. Our insurance might be inadequate to cover our liabilities. The insurance market, in general, and the energy insurance market, in particular, have been difficult markets over the past several years. Insurance costs are expected to continue to increase over the next few years, and we may decrease coverage and retain more risk to mitigate future cost increases. If we incur substantial liability and the damages are not covered by insurance or are in excess of policy limits, or if we incur liability at a time when we are not able to obtain liability insurance, then our business, results of operations and financial condition could be materially adversely affected.
Our results are subject to quarterly and seasonal fluctuations.
Our quarterly operating results have fluctuated in the past and could be negatively impacted in the future as a result of a number of factors, including seasonal variations in oil, NGL and gas prices, variations in levels of production and the completion of development projects.
27
Table of Contents
We have renounced any interest in specified business opportunities, and certain members of our board of directors and certain of our stockholders generally have no obligation to offer us those opportunities.
In accordance with Delaware law, we have renounced any interest or expectancy in any business opportunity, transaction or other matter in which our outside directors and certain of our stockholders, each referred to as a Designated Party, participates or desires to participate in, that involves any aspect of the exploration and production business in the oil and gas industry. If any such business opportunity is presented to a Designated Party who also serves as a member of our board of directors, the Designated Party has no obligation to communicate or offer that opportunity to us, and the Designated Party may pursue the opportunity as he sees fit, unless:
| • | it was presented to the Designated Party solely in that person’s capacity as a director of our Company and with respect to which, at the time of such presentment, no other Designated Party has independently received notice of, or otherwise identified the business opportunity; or |
| • | the opportunity was identified by the Designated Party solely through the disclosure of information by or on behalf of us. |
As a result of this renunciation, our outside directors should not be deemed to have breached any fiduciary duty to us if they or their affiliates or associates pursue opportunities as described above and our future competitive position and growth potential could be adversely affected.
ITEM 1B. UNRESOLVED STAFF COMMENTS
As of the date of this filing, we have no unresolved comments from the staff of the SEC.
28
Table of Contents
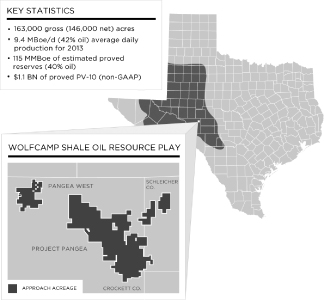
Permian Basin — Project Pangea
Our properties in the Permian Basin are located in Crockett and Schleicher Counties, Texas. We began operations in the Permian Basin through a farm-in agreement for 27,000 net acres in 2004 and have since increased our total acreage position to approximately 163,000 gross (146,000 net) acres as of year-end 2013. At December 31, 2013, we owned interests in approximately 679 gross (668 net) wells, all of which we operate. As of December 31, 2013, we had working and net revenue interests of approximately 100% and 76%, respectively, across Project Pangea.
Our acreage position in the Permian Basin is characterized by several commercial hydrocarbon zones, including the Clearfork, Dean, Wolfcamp shale, Canyon Sands, Strawn and Ellenburger zones. When we began drilling our Permian Basin properties in 2004, we targeted the Canyon Sands, Strawn and Ellenburger zones at depths ranging from 7,250 feet to 8,900 feet with vertical wells.
In 2010, we performed a detailed geological and petrophysical evaluation of the Clearfork, Dean and Wolfcamp shale formations above the Canyon Sands, Strawn and Ellenburger, and in 2011, we began drilling horizontal wells targeting the Wolfcamp shale. The Wolfcamp shale is a source rock that we believe has significant potential for hydrocarbons. The Wolfcamp shale is located in the oil-to-wet gas window across our Permian acreage position and is naturally fractured due to its proximity to the Ouachita-Marathon thrust belt and mineralogy, specifically the carbonate and quartz minerals.
The Wolfcamp shale has gross pay thickness of approximately 1,000 to 1,200 feet across our acreage position, which allows for horizontal drilling and stacked horizontal wellbores targeting varied zones that we call “benches.” We believe effectively developing the Wolfcamp shale may involve up to three lateral wellbores, each targeting a different bench, which we refer to as the Wolfcamp A, B and C. Since we began drilling horizontal Wolfcamp wells in 2011 through December 31, 2013, we had drilled and completed a total of eight wells targeting the Wolfcamp A bench, 60 wells targeting the Wolfcamp B bench and four wells targeting the Wolfcamp C bench; and, as a result, our proved reserves attributable to the horizontal Wolfcamp play have increased.
29
Table of Contents
The following table summarizes our estimated proved reserves attributable to the horizontal Wolfcamp shale oil play, compared to our estimated proved reserves attributable to vertical development for the years ended December 31, 2013, 2012 and 2011.
| Proved Reserves (MBoe) | ||||||||||||
| 2013 | 2012 | 2011 | ||||||||||
Horizontal Wolfcamp | ||||||||||||
Proved developed | 23,520 | 10,439 | 3,362 | |||||||||
Proved undeveloped | 58,073 | 43,342 | 13,337 | |||||||||
|
|
|
|
|
| |||||||
Total | 81,593 | 53,781 | 16,699 | |||||||||
Percent of total proved reserves | 71 | % | 56 | % | 22 | % | ||||||
Other Vertical | ||||||||||||
Proved developed | 21,669 | 22,336 | 30,249 | |||||||||
Proved undeveloped | 11,399 | 19,362 | 30,027 | |||||||||
|
|
|
|
|
| |||||||
Total | 33,068 | 41,698 | 60,276 | |||||||||
Percent of total proved reserves | 29 | % | 44 | % | 78 | % | ||||||
|
|
|
|
|
| |||||||
Total proved reserves | 114,661 | 95,479 | 76,975 | |||||||||
|
|
|
|
|
| |||||||
During 2013, we incurred costs of approximately $250 million to drill 45 horizontal Wolfcamp wells, of which nine horizontal Wolfcamp wells were waiting on completion at December 31, 2013. We currently have three rigs operating in Project Pangea, all of which are drilling horizontal Wolfcamp wells. During 2014, we plan to drill approximately 70 horizontal Wolfcamp wells.
East Texas Basin — North Bald Prairie
In July 2007, we entered into a joint venture with EnCana Oil & Gas (USA) Inc. (“EnCana”) in Limestone and Robertson Counties, Texas, in the East Texas Cotton Valley trend. We began drilling operations in August 2007. We have drilled and completed 11 gross wells, including one well completed as a saltwater disposal well. We have a 50% working interest and approximately 40% net revenue interest in the approximately 6,200 gross (3,400 net) acre project. In 2012, EnCana assigned its interest in the project to a third party. As of December 31, 2013, we had estimated proved reserves of 807 MMcf in North Bald Prairie. Our primary targets in North Bald Prairie are the Cotton Valley Sands and Cotton Valley Lime. We currently have no rigs running in North Bald Prairie.
30
Table of Contents
Proved Oil and Gas Reserves
The following table sets forth summary information regarding our estimated proved reserves as of December 31, 2013. See Note 10 to our consolidated financial statements in this report for additional information. Our reserve estimates and our calculation of Standardized Measure and PV-10 are based on the 12-month average of the first-day-of-the-month pricing of $97.28 per Bbl West Texas Intermediate posted oil price, $30.16 per Bbl received for NGLs and $3.66 per MMBtu Henry Hub spot natural gas price during 2013. All prices were adjusted for energy content, quality and basis differentials by area and were held constant through the lives of the properties. Natural gas is converted at a rate of six Mcf of gas to one barrel of oil equivalent (“Boe”). NGLs are converted at a rate of one barrel of NGLs to one Boe. The ratios of six Mcf of gas to one Boe and one barrel of NGLs to one Boe do not assume price equivalency and, given price differentials, the price for a Boe of natural gas or NGLs may differ significantly from the price of a barrel of oil.
Summary of Oil and Gas Reserves as of Fiscal-Year End
Based on Average Fiscal-Year Prices
| Proved Reserves | ||||||||||||||||||||||||
Reserves Category | Oil (MBbls) | NGLs (MBbls) | Natural Gas (MMcf)(1) | Total (MBoe) | Percent (%) | PV-10 (in millions)(2) | ||||||||||||||||||
Proved Developed |
| |||||||||||||||||||||||
Permian Basin | 13,646 | 14,919 | 98,935 | 45,054 | 39.3 | % | $ | 638 | ||||||||||||||||
East Texas Basin | — | — | 807 | 135 | 0.1 | 1 | ||||||||||||||||||
Proved Undeveloped | ||||||||||||||||||||||||
Permian Basin | 32,421 | 17,674 | 116,260 | 69,472 | 60.6 | 493 | ||||||||||||||||||
|
|
|
|
|
|
|
|
|
|
|
| |||||||||||||
Total Proved Reserves | 46,067 | 32,593 | 216,002 | 114,661 | 100.0 | % | $ | 1,132 | ||||||||||||||||
|
|
|
|
|
|
|
|
|
|
|
| |||||||||||||
| (1) | The gas reserves contain 18,267 MMcf of gas that will be produced and used as field fuel (primarily for compressors and artificial lifts). |
| (2) | See “— Reconciliation of PV-10 to Standardized Measure” below for a reconciliation of PV-10 to the Standardized Measure. |
Our estimated total proved reserves of oil, NGLs and natural gas as of December 31, 2013, were 114.7 MMBoe, made up of 40% oil, 29% NGLs and 31% natural gas. The proved developed portion of total proved reserves at year-end 2013 was 39%.
Extensions and discoveries for 2013 were 27.3 MMBoe, primarily attributable to our development project in the Wolfcamp shale oil resource play in the Permian Basin. During 2013, we recorded downward revisions totaling 4.7 MMBoe. Revisions included the reclassification of 7.8 MMBoe of proved undeveloped reserves to probable undeveloped, partially offset by 3.1 MMBoe of positive revisions attributable to gas that will be produced and used as field fuel. The reserves reclassified from proved undeveloped to probable undeveloped were attributable to vertical Canyon locations in Project Pangea. Due to our horizontal Wolfcamp development project, including pad drilling, postponement of these deeper locations beyond five years from initial booking is necessary to integrate their development with the shallower Clearfork and Wolfcamp target zones. We expect this integrated development to minimize surface impact and maximize reservoir recoveries. We produced 3.5 MMBoe during 2013. This production included 560 MMcf of gas that was produced and used as field fuel (primarily for compressors and artificial lifts) before the gas was delivered to a sales point.
Reconciliation of PV-10 to Standardized Measure
PV-10 is our estimate of the present value of future net revenues from proved oil and gas reserves after deducting estimated production and ad valorem taxes, future capital costs and operating expenses, but before deducting any estimates of future income taxes. PV-10 is a non-GAAP, financial measure and generally differs
31
Table of Contents
from the Standardized Measure, the most directly comparable GAAP financial measure, because it does not include the effects of income taxes on future cash flows. PV-10 should not be considered as an alternative to the Standardized Measure as computed under GAAP.
We believe PV-10 to be an important measure for evaluating the relative significance of our oil and gas properties and that the presentation of PV-10 provides useful information to investors because it is widely used by professional analysts and sophisticated investors in evaluating oil and gas companies. Because there are many unique factors that can impact an individual company when estimating the amount of future income taxes to be paid, we believe the use of a pre-tax measure is valuable for evaluating our company. We believe that most other companies in the oil and gas industry calculate PV-10 on the same basis.
The following table provides a reconciliation of PV-10 to the Standardized Measure of discounted future net cash flows at December 31, 2013:
| December 31, 2013 (in millions) | ||||
PV-10 | $ | 1,132 | ||
Present value of future income tax discounted at 10% | (456 | ) | ||
|
| |||
Standardized Measure of discounted future net cash flows | $ | 676 | ||
|
| |||
Proved Undeveloped Reserves
As of December 31, 2013, we had 69.5 MMBoe of proved undeveloped (“PUD”) reserves, which is an increase of 6.8 MMBoe, or 11%, compared with 62.7 MMBoe of PUD reserves at December 31, 2012. All of our PUD reserves at December 31, 2013, were associated with our core development project, Project Pangea.
The following table summarizes the changes in our PUD reserves during 2013.
| Oil (MBbls) | NGLs (MBbls) | Natural Gas (MMcf) | Total (MBoe) | |||||||||||||
Balance — December 31, 2012 | 28,436 | 17,339 | 101,582 | 62,705 | ||||||||||||
Extensions and discoveries | 11,341 | 5,387 | 32,130 | 22,084 | ||||||||||||
Revisions to previous estimates | (2,525 | ) | (3,287 | ) | (6,883 | ) | (6,960 | ) | ||||||||
Conversion to proved developed reserves | (4,831 | ) | (1,765 | ) | (10,569 | ) | (8,357 | ) | ||||||||
|
|
|
|
|
|
|
| |||||||||
Balance — December 31, 2013 | 32,421 | 17,674 | 116,260 | 69,472 | ||||||||||||
|
|
|
|
|
|
|
| |||||||||
The following table sets forth our PUD reserves converted to proved developed reserves during 2013, 2012 and 2011 and the net investment required to convert PUD reserves to proved developed reserves during the year.
| Proved Undeveloped Reserves Converted to Proved Developed Reserves | Investment in Conversion of Proved Undeveloped Reserves to Proved Developed Reserves | |||||||||||||||||||
Year Ended December 31, | Oil (MBbls) | NGLs (MBbls) | Natural Gas (MMcf) | Total (MBoe) | (in thousands) | |||||||||||||||
2011 | 263 | 660 | 3,583 | 1,520 | 33,783 | |||||||||||||||
2012 | 1,286 | 668 | 3,682 | 2,568 | 52,008 | |||||||||||||||
2013 | 4,831 | 1,765 | 10,569 | 8,357 | 108,811 | |||||||||||||||
|
|
|
|
|
|
|
|
|
| |||||||||||
Total | 6,380 | 3,093 | 17,834 | 12,445 | $ | 194,602 | ||||||||||||||
|
|
|
|
|
|
|
|
|
| |||||||||||
32
Table of Contents
Estimated future development costs relating to the development of PUD reserves are projected to be approximately $325.7 million in 2014, $459.8 million in 2015 and $319.3 million in 2016. We monitor fluctuations in commodity prices, drilling and completion costs, operating expenses and drilling success to determine adjustments to our drilling and development project.
Preparation of Proved Reserves Estimates
Internal Controls Over Preparation of Proved Reserves Estimates
Our policies regarding internal controls over the recording of reserve estimates require reserve estimates to be in compliance with SEC rules, regulations and guidance and prepared in accordance with “Standards Pertaining to the Estimating and Auditing of Oil and Gas Reserves Information (Revision as of February 19, 2007)” promulgated by the Society of Petroleum Engineers (“SPE standards”). Our proved reserves are estimated at the property level and compiled for reporting purposes by our corporate reservoir engineering staff, all of whom are independent of our operations team. We maintain our internal evaluations of our reserves in a secure reserve engineering database. The corporate reservoir engineering staff interacts with our internal staff of operations engineers and geoscience professionals and with accounting employees to obtain the necessary data for the reserves estimation process. Our internal professional staff works closely with our external engineers to ensure the integrity, accuracy and timeliness of data that is furnished to them for their reserve estimation process. All of the reserve information maintained in our secure reserve engineering database is provided to the external engineers. In addition, other pertinent data is provided such as seismic information, geologic maps, well logs, production tests, material balance calculations, well performance data, operating procedures and relevant economic criteria. We make available all information requested, including our pertinent personnel, to the external engineers as part of their evaluation of our reserves.
Our Vice President of Reservoir Engineering, Troy Hoefer, is the individual responsible for overseeing the preparation of our reserve estimates and for internal compliance of our reserve estimates with SEC rules, regulations and SPE standards. Mr. Hoefer has a Bachelor of Science degree in Petroleum Engineering from the Colorado School of Mines and more than 25 years of industry experience. Mr. Hoefer reports to our Chief Operating Officer. Our executive management, including our Chief Executive Officer and Chief Operating Officer, reviews and approves our reserves estimates, including future development costs, before these estimates are finalized and disclosed in a public filing or presentation. Our Chief Executive Officer, J. Ross Craft, P.E., is a licensed Professional Engineer with a Bachelor of Science Degree in Petroleum Engineering from Texas A&M University and more than 30 years of industry experience. Our Chief Operating Officer, Qingming Yang, earned his B.S. in Petroleum Geology from Chengdu University of Technology in the People’s Republic of China, his M.A. in Geology from George Washington University and his Ph.D. in Structural Geology from the University of Texas at Dallas. Dr. Yang has more than 25 years of industry experience.
For the years ended December 31, 2013, 2012, and 2011, we engaged DeGolyer and MacNaughton, independent petroleum engineers, to prepare independent estimates of the extent and value of the proved reserves associated with certain of our oil and gas properties. In 2013, DeGolyer and MacNaughton reported to the Audit Committee of our Board of Directors and to our Vice President of Reservoir Engineering. The Audit Committee meets with the independent engineering firm to, among other things, review and consider the processes used by the engineers in the preparation of the report and any matters of importance that arose in the preparation of the report, including whether the independent engineering firm encountered any material problems or difficulties in the preparation of their report. The Audit Committee’s review specifically includes difficulties with the scope or timeliness of the information furnished to them by the Company or any restrictions on access to information placed upon them by any Company personnel, any other difficulties in dealing with any Company personnel in the preparation of the report and any other matters of concern relating to the preparation of the report. The Audit Committee also determines whether the Company or its management or senior engineering personnel had similar or other problems or concerns regarding the independent engineering firm and the preparation of their report. SeeThird-Party Reports below for further information regarding DeGolyer and MacNaughton’s report.
33
Table of Contents
Technologies Used in Preparation of Proved Reserves Estimates
Estimates of reserves were prepared in compliance with SEC rules, regulations and guidance and SPE standards. The method or combination of methods used in the analysis of each reservoir was tempered by experience with similar reservoirs, stage of development, quality and completeness of basic data and production history. For our properties, structure and isopach maps were constructed to delineate each reservoir. Electrical logs, radioactivity logs, seismic data and other available data were used to prepare these maps. Parameters of area, porosity and water saturation were estimated and applied to the isopach maps to obtain estimates of original oil in place or original gas in place. For developed producing wells whose performance disclosed a reliable decline in producing-rate trends or other diagnostic characteristics, reserves were determined using decline curve analysis. Reserves for producing wells whose performance was not yet established and for undeveloped locations were estimated using type curves. The parameters needed to develop these type curves such as initial decline rate, “b” factor and final decline rate were based on nearby wells producing from the same reservoir and with a similar completion for which more data were available.
Reporting of NGLs
We produce NGLs as part of the processing of our natural gas. The extraction of NGLs in the processing of natural gas reduces the volume of natural gas available for sale. At December 31, 2013, NGLs represented approximately 29% of our total proved reserves on a Boe basis. NGLs are products sold by the gallon. In reporting proved reserves and production of NGLs, we include these volumes and production as Boe. The prices we received for a standard barrel of NGLs in 2013 averaged approximately 67% lower than the average prices for equivalent volumes of oil. We report all production information related to natural gas net of the effect of any reduction in natural gas volumes resulting from the processing of NGLs.
Third-Party Reports
For the years ended December 31, 2013, 2012, and 2011, we engaged DeGolyer and MacNaughton, independent, third-party reserves engineers, to prepare estimates of the extent and value of the proved reserves of certain of our oil and gas properties, including 100% of our total reported proved reserves. DeGolyer and MacNaughton’s report for 2013 is included as Exhibit 99.1 to this annual report on Form 10-K.
34
Table of Contents
Oil and Gas Production, Production Prices and Production Costs
The following table sets forth summary information regarding oil, NGL and gas production, average sales prices and average production costs for the last three years. We determined the Boe using the ratio of six Mcf of natural gas to one Boe, and one barrel of NGLs to one Boe. The ratios of six Mcf of natural gas to one Boe and one barrel of NGLs to one Boe do not assume price equivalency and, given price differentials, the price for a Boe for natural gas or NGLs may differ significantly from the price for a barrel of oil.
| Years Ended December 31, | ||||||||||||
| 2013 | 2012 | 2011 | ||||||||||
Production | ||||||||||||
Oil (MBbls) | 1,444 | 969 | 482 | |||||||||
NGLs (MBbls) | 951 | 904 | 798 | |||||||||
Gas (MMcf)(1) | 6,177 | 6,089 | 6,345 | |||||||||
|
|
|
|
|
| |||||||
Total (MBoe) | 3,424 | 2,888 | 2,338 | |||||||||
Total (MBoe/d) | 9.4 | 7.9 | 6.4 | |||||||||
Average prices | ||||||||||||
Oil (per Bbl) | $ | 90.70 | $ | 84.70 | $ | 88.18 | ||||||
NGLs (per Bbl) | 29.57 | 34.09 | 51.39 | |||||||||
Gas (per Mcf) | 3.60 | 2.63 | 3.92 | |||||||||
|
|
|
|
|
| |||||||
Total (per Boe) | 52.95 | 44.63 | 46.37 | |||||||||
Realized (loss) gain on commodity derivatives (per Boe) | (0.31 | ) | (0.03 | ) | 1.44 | |||||||
|
|
|
|
|
| |||||||
Total including derivative impact (per Boe) | $ | 52.64 | $ | 44.60 | $ | 47.81 | ||||||
|
|
|
|
|
| |||||||
Production costs (per Boe)(2) | $ | 5.59 | $ | 6.58 | $ | 4.57 | ||||||
|
|
|
|
|
| |||||||
| (1) | Gas production excludes gas produced and used as field fuel. |
| (2) | Production cost per Boe is made up of lease operating expenses and excludes production and ad valorem taxes. |
Drilling Activity — Prior Three Years
The following table sets forth information on our drilling activity for the last three years. The information should not be considered indicative of future performance, nor should it be assumed that there is necessarily any correlation between the number of productive wells drilled, quantities of reserves found or economic value.
| Years Ended December 31, | ||||||||||||||||||||||||
| 2013 | 2012 | 2011 | ||||||||||||||||||||||
| Gross | Net | Gross | Net | Gross | Net | |||||||||||||||||||
Development wells: | ||||||||||||||||||||||||
Productive | 45.0 | 45.0 | 46.0 | 45.8 | 69.0 | 64.2 | ||||||||||||||||||
Dry(1) | 5.0 | 5.0 | — | — | 2.0 | 2.0 | ||||||||||||||||||
Exploratory wells: | ||||||||||||||||||||||||
Productive | — | — | — | — | — | — | ||||||||||||||||||
Dry | — | — | — | — | — | — | ||||||||||||||||||
Total wells: | ||||||||||||||||||||||||
Productive | 45.0 | 45.0 | 46.0 | 45.8 | 69.0 | 64.2 | ||||||||||||||||||
Dry | 5.0 | 5.0 | — | — | 2.0 | 2.0 | ||||||||||||||||||
| (1) | The Company encountered mechanical issues while drilling the five wells classified as dry in 2013. |
Of the 45 productive wells drilled in 2013, nine wells were waiting on completion at December 31, 2013. The Company encountered mechanical issues while drilling five wells in 2013; and these wells cost $12.4 million.
35
Table of Contents
Although a well may be classified as productive upon completion, future changes in oil, NGL and gas prices, operating costs and production may result in the well becoming uneconomical.
Drilling Activity — Current
As of the date of this report, we had three horizontal rigs running in the Permian Basin and targeting the Wolfcamp shale oil resource play.
Delivery Commitments
We are not committed to provide a fixed and determinable quantity of oil, NGLs or gas in the near future under existing agreements. However, as of December 31, 2013, we had dedicated all of our oil production from northern Project Pangea and Pangea West through 2022 to JP Energy, and contracted to sell all of our NGLs and natural gas production from Project Pangea to DCP through January 2016.
Producing Wells
The following table sets forth the number of producing wells in which we owned a working interest at December 31, 2013. Wells are classified as natural gas or oil according to their predominant production stream.
| Natural Gas Wells | Oil Wells | Total Wells | Average Working Interest | |||||||||||||||||||||||||
| Gross | Net | Gross | Net | Gross | Net | |||||||||||||||||||||||
Permian Basin | 565.0 | 555.0 | 114.0 | 114.0 | 679.0 | 669.0 | 98.5 | % | ||||||||||||||||||||
East Texas Basin | 9.0 | 4.5 | 0.0 | 0.0 | 9.0 | 4.5 | 50.0 | % | ||||||||||||||||||||
|
|
|
|
|
|
|
|
|
|
|
|
|
| |||||||||||||||
Total | 574.0 | 559.5 | 114.0 | 114.0 | 688.0 | 673.5 | 98.0 | % | ||||||||||||||||||||
Acreage
The following table summarizes our developed and undeveloped acreage as of December 31, 2013.
| Developed Acres | Undeveloped Acres | Total Acres | ||||||||||||||||||||||
| Gross | Net | Gross | Net | Gross | Net | |||||||||||||||||||
Permian Basin | 85,594 | 77,300 | 77,873 | 69,124 | 163,467 | 146,424 | ||||||||||||||||||
East Texas Basin | 3,504 | 1,682 | 2,612 | 1,692 | 6,116 | 3,374 | ||||||||||||||||||
|
|
|
|
|
|
|
|
|
|
|
| |||||||||||||
Total | 89,098 | 78,982 | 80,485 | 70,816 | 169,583 | 149,798 | ||||||||||||||||||
Undeveloped Acreage Expirations
The following table sets forth the number of gross and net undeveloped acres as of December 31, 2013, which will expire over the next three years by project area, unless production is established before lease expiration dates. Net amounts may be more than gross amounts in a particular year due to timing of expirations.
| 2014 | 2015 | 2016 | ||||||||||||||||||||||
| Gross | Net | Gross | Net | Gross | Net | |||||||||||||||||||
Permian Basin | 27,327 | 27,502 | 20,406 | 17,741 | 4,275 | 2,407 | ||||||||||||||||||
East Texas Basin | 2,298 | 1,428 | 315 | 263 | — | — | ||||||||||||||||||
|
|
|
|
|
|
|
|
|
|
|
| |||||||||||||
Total | 29,625 | 28,930 | 20,721 | 18,004 | 4,275 | 2,407 | ||||||||||||||||||
The expiring acreage set forth in the table above accounts for 70% of our net undeveloped acreage, 6% of our PUD reserves and 3.7% of our total proved reserves. We are continually engaged in a combination of drilling and development and discussions with mineral lessors for lease extensions, renewals, new drilling and development units and new leases to address the expiration of undeveloped acreage that occurs in the normal course of our business.
36
Table of Contents
We are involved in various legal and regulatory proceedings arising in the normal course of business. While we cannot predict the outcome of these proceedings with certainty, we do not believe that an adverse result in any pending legal or regulatory proceeding, individually or in the aggregate, would be material to our business, financial condition or cash flows.
ITEM 4. MINE SAFETY DISCLOSURES
Not applicable.
37
Table of Contents
PART II
| ITEM 5. | MARKET FOR REGISTRANT’S COMMON EQUITY, RELATED STOCKHOLDER MATTERS AND ISSUER PURCHASES OF EQUITY SECURITIES |
Market Information
Our common stock is traded on NASDAQ in the United States under the symbol “AREX.” During 2013, trading volume averaged 676,391 shares per day. The following table shows the quarterly high and low sale prices of our common stock as reported on NASDAQ for the past two years.
| Price Per Share | ||||||||
| High | Low | |||||||
2013 | ||||||||
First quarter | $ | 27.59 | $ | 23.03 | ||||
Second quarter | 27.71 | 22.24 | ||||||
Third quarter | 28.87 | 22.64 | ||||||
Fourth quarter | 31.67 | 18.25 | ||||||
2012 | ||||||||
First quarter | $ | 38.92 | $ | 29.77 | ||||
Second quarter | 39.18 | 22.36 | ||||||
Third quarter | 34.84 | 24.08 | ||||||
Fourth quarter | 30.76 | 22.50 | ||||||
Holders
As of February 17, 2014, there were 148 record holders of our common stock. In many instances, a record holder is a broker or other entity holding shares in street name for one or more customers who beneficially own the shares.
Dividends
We have not paid any cash dividends on our common stock. We do not expect to pay any cash or other dividends in the foreseeable future on our common stock, as we intend to reinvest cash flow generated by operations into our business. Our revolving credit facility and the Indenture governing our Senior Notes currently restrict our ability to pay cash dividends on our common stock, and we may also enter into credit agreements or other borrowing arrangements in the future that restrict or limit our ability to pay cash dividends on our common stock.
Securities Authorized for Issuance under Equity Compensation Plans
The following table sets forth information regarding securities authorized for issuance under equity compensation plans and individual compensation arrangements as of December 31, 2013.
Plan Category | Number of Securities to be Issued Upon Exercise of Outstanding Options, Warrants and Rights (a) | Weighted-Average Exercise Price of Outstanding Options, Warrants and Rights (b) | Number of Securities Remaining Available for Future Issuance under Equity Compensation Plans (Excluding Securities Reflected in Column (a))(1) (c) | |||||||||
Equity compensation plans approved by stockholders | 39,525 | $ | 12.09 | 1,783,339 | ||||||||
Equity compensation plans not approved by stockholders | — | — | — | |||||||||
38
Table of Contents
Performance Graph
The following graph compares the cumulative return on a $100 investment in our common stock from December 31, 2007, through December 31, 2013, to that of the cumulative return on a $100 investment in the Standard & Poor’s 500 (“S&P 500”) index and the Dow Jones U.S. Exploration & Production Total Stock Market (“TSM”) index for the same period. In calculating the cumulative return, reinvestment of dividends, if any, is assumed. This graph is not “soliciting material,” is not deemed filed with the SEC and is not to be incorporated by reference in any of our filings under the Securities Act or the Exchange Act, whether made before or after the date hereof and irrespective of any general incorporation language in any such filing. This graph is included in accordance with the SEC’s disclosure rules. This historic stock performance is not indicative of future stock performance.
COMPARISON OF FIVE-YEAR CUMULATIVE TOTAL RETURN
Among Approach Resources Inc., the S&P 500 Index and the Dow Jones U.S. Exploration &
Production Total Stock Market Index
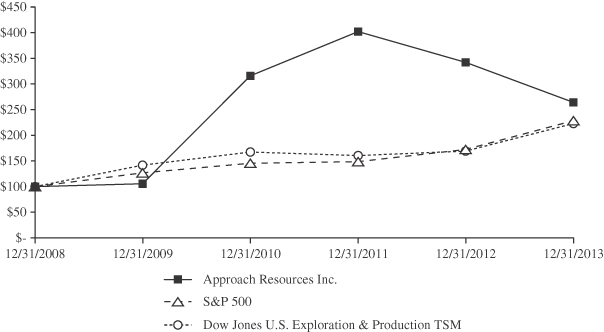
| 12/31/2008 | 12/31/2009 | 12/31/2010 | 12/31/2011 | 12/31/2012 | 12/31/2013 | |||||||||||||||||||
Approach Resources Inc. | $ | 100.00 | $ | 105.61 | $ | 316.01 | $ | 402.33 | $ | 342.13 | $ | 264.02 | ||||||||||||
S&P 500 | 100.00 | 126.46 | 145.51 | 148.59 | 172.37 | 228.19 | ||||||||||||||||||
Dow Jones U.S. Exploration & Production TSM | 100.00 | 141.52 | 167.56 | 160.69 | 169.01 | 222.56 | ||||||||||||||||||
39
Table of Contents
Issuer Repurchases of Equity Securities
Our 2007 Plan allows us to withhold shares of common stock to pay withholding taxes payable upon vesting of a restricted stock grant. The following table shows the number of shares of common stock withheld to satisfy the income tax withholding obligations arising upon the vesting of restricted shares issued to employees under the 2007 Plan.
Period | (a) Total Number of Shares Purchased | (b) Average Price Paid per Share | (c) Total Number of Shares Purchased as Part of Publicly Announced Plans or Programs | (d) Maximum Number (or Approximate Dollar Value) of Shares that May Yet Be Purchased Under the Plans or Programs | ||||||||||||
October 1, 2013 — October 31, 2013 | — | $ | — | — | — | |||||||||||
November 1, 2013 — November 30, 2013 | 269 | 28.44 | — | — | ||||||||||||
December 1, 2013 — December 31, 2013 | 36,638 | 19.39 | — | — | ||||||||||||
|
|
|
|
|
|
|
| |||||||||
Total | 36,907 | $ | 19.45 | — | — | |||||||||||
40
Table of Contents
| ITEM 6. | SELECTED FINANCIAL DATA |
The following table sets forth selected financial information for the five years ended December 31, 2013. This information should be read in conjunction with Item 7 of this report, “Management’s Discussion and Analysis of Financial Condition and Results of Operations,” and our consolidated financial statements, related notes and other financial information included in this report.
| Years Ended December 31, | ||||||||||||||||||||
| 2013 | 2012 | 2011 | 2010 | 2009 | ||||||||||||||||
| (in thousands, except per-share data) | ||||||||||||||||||||
Operating Results Data | ||||||||||||||||||||
Revenues | ||||||||||||||||||||
Oil, NGL and gas sales | $ | 181,302 | $ | 128,892 | $ | 108,387 | $ | 57,581 | $ | 40,648 | ||||||||||
Expenses | ||||||||||||||||||||
Lease operating | 19,152 | 19,002 | 10,687 | 6,620 | 6,018 | |||||||||||||||
Production and ad valorem taxes | 12,840 | 9,255 | 8,447 | 4,925 | 3,755 | |||||||||||||||
Exploration | 2,238 | 4,550 | 9,546 | 2,589 | 1,621 | |||||||||||||||
Impairment | — | — | 18,476 | 2,622 | 2,964 | |||||||||||||||
General and administrative | 26,524 | 24,903 | 17,900 | 11,422 | 10,617 | |||||||||||||||
Depletion, depreciation and amortization | 76,956 | 60,381 | 32,475 | 22,224 | 24,660 | |||||||||||||||
|
|
|
|
|
|
|
|
|
| |||||||||||
Total expenses | 137,710 | 118,091 | 97,531 | 50,402 | 49,635 | |||||||||||||||
|
|
|
|
|
|
|
|
|
| |||||||||||
Operating income (loss) | 43,592 | 10,801 | 10,856 | 7,179 | (8,987 | ) | ||||||||||||||
Other | ||||||||||||||||||||
Interest expense, net | (14,084 | ) | (4,737 | ) | (3,402 | ) | (2,189 | ) | (1,787 | ) | ||||||||||
Equity in earnings (losses) of investee | 156 | (108 | ) | — | — | — | ||||||||||||||
Gain on sale of equity method investment | 90,743 | — | — | — | — | |||||||||||||||
Realized (loss) gain on commodity derivatives | (1,048 | ) | (108 | ) | 3,375 | 5,784 | 14,659 | |||||||||||||
Unrealized (loss) gain on commodity derivatives | (4,596 | ) | 3,874 | (347 | ) | 788 | (9,899 | ) | ||||||||||||
Gain on sale of oil and gas properties, net of foreign currency transaction loss | — | — | 248 | — | — | |||||||||||||||
|
|
|
|
|
|
|
|
|
| |||||||||||
Income (loss) before provision (benefit) for income taxes | 114,763 | 9,722 | 10,730 | 11,562 | (6,014 | ) | ||||||||||||||
Provision (benefit) for income taxes | 42,507 | 3,338 | 3,488 | 4,100 | (785 | ) | ||||||||||||||
|
|
|
|
|
|
|
|
|
| |||||||||||
Net income (loss) | $ | 72,256 | $ | 6,384 | $ | 7,242 | $ | 7,462 | $ | (5,229 | ) | |||||||||
|
|
|
|
|
|
|
|
|
| |||||||||||
Earnings (loss) per share | ||||||||||||||||||||
Basic | $ | 1.85 | $ | 0.18 | $ | 0.25 | $ | 0.34 | $ | (0.25 | ) | |||||||||
|
|
|
|
|
|
|
|
|
| |||||||||||
Diluted | $ | 1.85 | $ | 0.18 | $ | 0.25 | $ | 0.34 | $ | (0.25 | ) | |||||||||
|
|
|
|
|
|
|
|
|
| |||||||||||
Statement of Cash Flows Data | ||||||||||||||||||||
Net cash provided by (used in) | ||||||||||||||||||||
Operating activities | $ | 125,580 | $ | 90,585 | $ | 95,770 | $ | 42,377 | $ | 39,761 | ||||||||||
Investing activities | (203,397 | ) | (307,414 | ) | (284,758 | ) | (91,346 | ) | (29,553 | ) | ||||||||||
Financing activities | 135,811 | 217,295 | 165,843 | 69,748 | (11,618 | ) | ||||||||||||||
Effect of Canadian exchange rate | — | — | (19 | ) | 1 | 18 | ||||||||||||||
Balance Sheet Data | ||||||||||||||||||||
Cash and cash equivalents | $ | 58,761 | $ | 767 | $ | 301 | $ | 23,465 | $ | 2,685 | ||||||||||
Restricted cash | 7,350 | — | — | — | — | |||||||||||||||
Other current assets | 24,302 | 14,889 | 11,085 | 17,865 | 9,318 | |||||||||||||||
Property, equipment, net, successful efforts method | 1,047,030 | 828,467 | 595,284 | 369,210 | 304,483 | |||||||||||||||
Equity method investment | — | 9,892 | — | — | — | |||||||||||||||
Other assets | 8,041 | 1,724 | 1,224 | 2,549 | 2,440 | |||||||||||||||
|
|
|
|
|
|
|
|
|
| |||||||||||
Total assets | $ | 1,145,484 | $ | 855,739 | $ | 607,894 | $ | 413,089 | $ | 318,926 | ||||||||||
|
|
|
|
|
|
|
|
|
| |||||||||||
Current liabilities | $ | 84,441 | $ | 60,247 | $ | 43,625 | $ | 29,240 | $ | 21,996 | ||||||||||
Long-term debt | 250,000 | 106,000 | 43,800 | — | 32,319 | |||||||||||||||
Other long-term liabilities | 100,548 | 56,024 | 53,020 | 50,903 | 44,115 | |||||||||||||||
Stockholders’ equity | 710,495 | 633,468 | 467,449 | 332,946 | 220,496 | |||||||||||||||
|
|
|
|
|
|
|
|
|
| |||||||||||
Total liabilities and stockholders’ equity | $ | 1,145,484 | $ | 855,739 | $ | 607,894 | $ | 413,089 | $ | 318,926 | ||||||||||
|
|
|
|
|
|
|
|
|
| |||||||||||
41
Table of Contents
| ITEM 7. | MANAGEMENT’S DISCUSSION AND ANALYSIS OF FINANCIAL CONDITION AND RESULTS OF OPERATIONS |
The following discussion is intended to assist in understanding our results of operations and our financial condition. Our consolidated financial statements and the accompanying notes included elsewhere in this report contain additional information that should be referred to when reviewing this material. Statements in this discussion may be forward-looking. These forward-looking statements involve risks and uncertainties, which could cause actual results to differ from those expressed. See “Cautionary Statement Regarding Forward-Looking Statements” at the beginning of this report and “Risk Factors” in Item 1A. for additional discussion of some of these factors and risks.
Overview
Approach Resources Inc. is an independent energy company focused on the exploration, development, production and acquisition of unconventional oil and gas reserves in the Midland Basin of the greater Permian Basin in West Texas, where we lease approximately 146,000 net acres as of December 31, 2013. We believe our concentrated acreage position provides us an opportunity to achieve cost, operating and recovery efficiencies in the development of our drilling inventory. We are currently developing significant resource potential from the Wolfcamp shale oil formation. Additional drilling targets could include the Clearfork, Canyon Sands, Strawn and Ellenburger zones. We sometimes refer to our development project in the Permian Basin as “Project Pangea,” which includes “Pangea West.” Our management and technical team have a proven track record of finding and developing reserves through advanced drilling and completion techniques. As the operator of all of our estimated proved reserves and production, we have a high degree of control over capital expenditures and other operating matters.
At December 31, 2013, our estimated proved reserves were 114.7 MMBoe. Substantially all of our proved reserves are located in Crockett and Schleicher Counties, Texas. Important characteristics of our proved reserves at December 31, 2013, include:
| • | 40% oil, 29% NGLs and 31% natural gas; |
| • | 39% proved developed; |
| • | 100% operated; |
| • | Reserve life of more than 30 years based on 2013 production of 3.4 MMBoe; |
| • | Standardized Measure of $676.3 million; and |
| • | PV-10 (non-GAAP) of $1.1 billion. |
PV-10 is our estimate of the present value of future net revenues from proved oil, NGL and gas reserves after deducting estimated production and ad valorem taxes, future capital costs and operating expenses, but before deducting any estimates for future income taxes. Estimated future net revenues are discounted at an annual rate of 10% to determine their present value. PV-10 is a financial measure that is not determined in accordance with GAAP, and generally differs from the Standardized Measure, the most directly comparable GAAP financial measure, because it does not include the effects of income taxes on future cash flows. PV-10 should not be considered as an alternative to the Standardized Measure, as computed under GAAP. See Item 2. “Properties — Proved Oil and Gas Reserves” for a reconciliation of PV-10 to the Standardized Measure.
At December 31, 2013, we owned and operated 679 producing oil and gas wells in the Permian Basin. During 2013, we produced 3.4 MMBoe, or 9.4 MBoe/d. Production for 2013 was 42% oil, 28% NGLs and 30% natural gas.
Our financial results depend upon many factors, particularly the price of oil, NGLs and gas. Commodity prices are affected by changes in market demand, which is impacted by domestic and foreign supply of oil, NGLs and gas, overall domestic and global economic conditions, commodity processing, gathering and transportation
42
Table of Contents
availability and the availability of refining capacity, price and availability of alternative fuels, price and quantity of foreign imports, domestic and foreign governmental regulations, political conditions in or affecting other oil and gas producing countries, weather and technological advances affecting oil, NGL and gas consumption. As a result, we cannot accurately predict future oil, NGL and gas prices, and therefore, we cannot determine what effect increases or decreases will have on our capital program, production volumes and future revenues. A substantial or extended decline in oil, NGL and gas prices could have a material adverse effect on our business, financial condition, results of operations, quantities of oil and gas reserves that may be economically produced and liquidity that may be accessed through our borrowing base under our revolving credit facility and through capital markets.
In addition to production volumes and commodity prices, finding and developing sufficient amounts of oil and gas reserves at economical costs is critical to our long-term success. Future finding and development costs are subject to changes in the industry, including the costs of acquiring, drilling and completing our projects. We focus our efforts on increasing oil and gas reserves and production while controlling costs at a level that is appropriate for long-term operations. Our future cash flow from operations will depend on our ability to manage our overall cost structure.
Like all oil and gas production companies, we face the challenge of natural production declines. Oil and gas production from a given well naturally decreases over time. Additionally, our reserves have a rapid initial decline. We attempt to overcome this natural decline by drilling to develop and identify additional reserves, farm-ins or other joint drilling ventures, and by acquisitions. However, during times of severe price declines, we may from time-to-time reduce current capital expenditures and curtail drilling operations in order to preserve liquidity. A material reduction in capital expenditures and drilling activities could materially reduce our production volumes and revenues and increase future expected costs necessary to develop existing reserves.
We also face the challenge of financing exploration, development and future acquisitions. We believe we have adequate liquidity from cash generated from operations and unused borrowing capacity under our revolving credit facility for current working capital needs and maintenance of our current development project. However, we may determine to access the public or private equity or debt markets for future development of reserves, acquisitions, additional working capital or other liquidity needs, if such financing is available on acceptable terms. We cannot guarantee that such financing will be available on acceptable terms or at all.
2013 Activity
Our 2013 activity focused on horizontal drilling in the Wolfcamp shale oil resource play in the Midland Basin. We drilled 45 horizontal wells in 2013, compared to 26 horizontal wells in 2012. We also continued to invest in building our field infrastructure system, which we believe reduces drilling and completion costs, improves drilling and completion efficiencies and reduces fresh water use. We plan to continue to develop the Wolfcamp shale in Project Pangea in 2014. Focusing on the Wolfcamp shale allows us to use our operating, technical and regional expertise that is important to interpreting geological and operating trends, enhancing production rates and maximizing well recovery. Our accomplishments in 2013 include:
| • | Production Growth. Production for 2013 totaled 3.4 MMBoe (9.4 MBoe/d), compared to 2.9 MMBoe (7.9 MBoe/d) in 2012, a 19% increase. Production for 2013 was 42% oil, 28% NGLs and 30% natural gas. Our continued development of Project Pangea increased oil production 49% in 2013, compared to 2012. On average, we operated three horizontal rigs in 2013, and drilled a total of 45 wells, of which nine wells were waiting on completion at December 31, 2013. |
| • | Reserve Growth. In 2013, our estimated proved reserves increased 20%, or 19.2 MMBoe, to 114.7 MMBoe from 95.5 MMBoe. Our proved reserves at year-end 2013 were 40% oil, 29% NGLs and 31% natural gas, compared to 39% oil, 30% NGLs and 31% natural gas at year-end 2012. During 2013, our proved oil reserves increased 8.8 MMBbls, or 24%, to 46.1 MMBbls from 37.3 MMBbls in 2012. Reserve growth, and especially our oil reserve growth, in 2013 was driven by results in our Wolfcamp shale oil resource play. |
43
Table of Contents
| • | Delineation of the Multi-Zone Potential of the Wolfcamp Shale. The Wolfcamp shale has a gross pay thickness of approximately 1,000 to 1,200 feet, which allows for stacked wellbores targeting varied zones that we call “benches.” We believe effectively developing the Wolfcamp shale may involve up to three lateral wellbores, each targeting a different bench, which we refer to as the Wolfcamp A, B and C. As of December 31, 2013, we have drilled a total of eight wells targeting the Wolfcamp A bench, 69 wells targeting the Wolfcamp B bench and four wells targeting the Wolfcamp C bench. With successful wells targeting each of the Wolfcamp benches, in 2013 we began full-scale development, including pad drilling and stacked wellbores. |
| • | Installation of Field Infrastructure and Recycling Systems. Our large, mostly contiguous acreage position and our success in the Wolfcamp shale oil play led us to invest over $80 million in building field infrastructure beginning in 2012. We continued the infrastructure build out in 2013, and now have an extensive network of centralized water, recycling and production facilities, water transportation lines, gas lift lines and salt water disposal systems. In addition, we believe the infrastructure reduces the need for trucks, reduces fresh water usage, improves drilling and completion efficiencies and drives down drilling and completion and operating costs. |
| • | Completed Sale of Southern Midland Basin Oil Pipeline. In October 2013, Approach, together with our partner in Wildcat, completed the sale of all of the equity interests of Wildcat to an affiliate of JP Energy for a purchase price of $210 million. Wildcat owned and operated an oil pipeline system in Crockett and Reagan Counties, Texas. Our net proceeds totaled approximately $109.1 million, after deducting our share of transactional costs paid at closing. We recognized a pre-tax gain of $90.7 million related to this transaction, subject to normal post-closing adjustments. |
| • | Secured Marketing and Transportation Agreements. In connection with the closing of the Wildcat sale, in October 2013, we entered into an amendment to our crude oil purchase agreement with JP Energy. The amendment, among other things, amends the dedicated area to include certain portions of Crockett and Schleicher Counties, Texas; amends the transportation and marketing fee; provides the construction of future gathering lines and connection facilities; provides us with priority and preference rights for crude oil capacity on the pipeline system; and provides for trucking of crude oil during construction of gathering lines and connection facilities. We currently pay published Midland and Cushing tariffs for our nominated oil volumes in lieu of a Midland-Cushing differential, which we believe reduces our exposure to Midland-Cushing differential volatility. |
| • | Consolidated Drilling and Development Unit Agreement. In July 2013, we entered into the Unit Agreement with University Lands. The Unit Agreement extended 60 of our leases with University Lands to September 2017 for a total cost of $5 million. As a result, we can retain all of our University Lands leases by drilling two wells per year to September 2017. |
| • | 2013 Senior Notes Offering. In June 2013, we completed our public offering of $250 million principal amount of 7% Senior Notes due 2021. We received net proceeds from the issuance of the Senior Notes of approximately $243 million, after deducting fees and expenses. We used a portion of the net proceeds from the offering to repay all outstanding borrowings under our credit facility, and the remainder to fund our development project and for general corporate purposes. |
| • | Financial Position. During 2013, our lender group increased the borrowing base of our revolving credit facility to $350 million from $280 million at year-end 2012. At December 31, 2013, we had $58.8 million of cash and cash equivalents and had no outstanding borrowings under our revolving credit facility. |
Plans for 2014
Our total 2014 capital expenditure budget is $400 million, which includes approximately $385 million for drilling and completion activity and $15 million for constructing infrastructure to support our drilling, completion and production operations. We plan to operate three rigs to drill approximately 70 horizontal wells targeting the Wolfcamp A, B and C zones.
44
Table of Contents
Our 2014 capital budget excludes acquisitions and lease extensions and renewals and is subject to change depending upon a number of factors, including additional data on our Wolfcamp shale oil resource play, results of horizontal drilling and completions, economic and industry conditions at the time of drilling, prevailing and anticipated prices for oil, NGLs and gas, the availability of sufficient capital resources for drilling prospects, our financial results and the availability of lease extensions and renewals on reasonable terms.
Results of Operations
The following table sets forth summary information regarding oil, NGL and gas revenues, production, average product prices and average production costs and expenses for the last three years. We determined the Boe using the ratio of six Mcf of natural gas to one Boe, and one barrel of NGLs to one Boe. The ratios of six Mcf of natural gas to one Boe and one barrel of NGLs to one Boe do not assume price equivalency and, given price differentials, the price for a Boe for natural gas or NGLs may differ significantly from the price for a barrel of oil.
| Years Ended December 31, | ||||||||||||
| 2013 | 2012 | 2011 | ||||||||||
Revenues (in thousands) | ||||||||||||
Oil | $ | 130,971 | $ | 82,087 | $ | 42,463 | ||||||
NGLs | 28,103 | 30,811 | 41,029 | |||||||||
Gas | 22,228 | 15,994 | 24,895 | |||||||||
|
|
|
|
|
| |||||||
Total oil, NGL and gas sales | 181,302 | 128,892 | 108,387 | |||||||||
Realized (loss) gain on commodity derivatives | (1,048 | ) | (108 | ) | 3,375 | |||||||
|
|
|
|
|
| |||||||
Total oil, NGL and gas sales including derivative impact | $ | 180,254 | $ | 128,784 | $ | 111,762 | ||||||
|
|
|
|
|
| |||||||
Production | ||||||||||||
Oil (MBbls) | 1,444 | 969 | 482 | |||||||||
NGLs (MBbls) | 951 | 904 | 798 | |||||||||
Gas (MMcf) | 6,177 | 6,089 | 6,345 | |||||||||
|
|
|
|
|
| |||||||
Total (MBoe) | 3,424 | 2,888 | 2,338 | |||||||||
Total (MBoe/d) | 9.4 | 7.9 | 6.4 | |||||||||
Average prices | ||||||||||||
Oil (per Bbl) | $ | 90.70 | $ | 84.70 | $ | 88.18 | ||||||
NGLs (per Bbl) | 29.57 | 34.09 | 51.39 | |||||||||
Gas (per Mcf) | 3.60 | 2.63 | 3.92 | |||||||||
|
|
|
|
|
| |||||||
Total (per Boe) | $ | 52.95 | $ | 44.63 | $ | 46.37 | ||||||
Realized (loss) gain on commodity derivatives (per Boe) | (0.31 | ) | (0.03 | ) | 1.44 | |||||||
|
|
|
|
|
| |||||||
Total including derivative impact (per Boe) | $ | 52.64 | $ | 44.60 | $ | 47.81 | ||||||
|
|
|
|
|
| |||||||
Costs and expenses (per Boe) | ||||||||||||
Lease operating | $ | 5.59 | $ | 6.58 | $ | 4.57 | ||||||
Production and ad valorem taxes | 3.75 | 3.20 | 3.61 | |||||||||
Exploration | 0.65 | 1.58 | 4.08 | |||||||||
Impairment | — | — | 7.90 | |||||||||
General and administrative | 7.75 | 8.62 | 7.66 | |||||||||
Depletion, depreciation and amortization | 22.48 | 20.91 | 13.89 | |||||||||
Oil, NGL and gas sales. Oil, NGL and gas sales increased $52.4 million, or 41%, to $181.3 million from $128.9 million in 2012. The increase in oil, NGL and gas sales was due to an increase in production volumes ($44.8 million) and an increase in our average realized price ($7.6 million). Production volumes increased as a result of our development of Project Pangea in the Permian Basin. In 2013, the average price we received for our production, before the effect of commodity derivatives, increased to $52.95 per Boe from $44.63 per Boe, or a
45
Table of Contents
19% increase. Subject to commodity prices, we expect oil, NGL and gas sales to increase in 2014 due to increased production volumes from our development project in the Permian Basin.
Oil, NGL and gas sales increased $20.5 million, or 19%, to $128.9 million from $108.4 million in 2011. The increase in oil, NGL and gas sales was due to an increase in production volumes, partially offset by a decrease in average prices received. Production volumes increased as a result of our development of Project Pangea in the Permian Basin. In 2012, the average price we received for our production, before the effect of commodity derivatives, decreased to $44.63 per Boe from $46.37 per Boe, or a 4% decrease.
Net income. Net income for 2013 was $72.3 million, or $1.85 per diluted share, compared to net income of $6.4 million, or $0.18 per diluted share, for 2012 and net income of $7.2 million, or $0.25 per diluted share, for 2011. Net income for 2013 increased due to the pre-tax gain from the sale our interest in the Wildcat oil pipeline ($90.7 million), as well as higher revenues, partially offset by higher interest expense and losses on both our realized and unrealized commodity derivatives.
Net income for 2012 was $6.4 million, or $0.18 per diluted share, compared to net income of $7.2 million, or $0.25 per diluted share, for 2011. Net income for 2012 decreased due to higher lease operating expense and general operating expenses, partially offset by higher revenues and unrealized gains on commodity derivatives.
Oil, NGL and gas production. Production for 2013 totaled 3,424 MBoe (9.4 MBoe/d), compared to 2,888 MBoe (7.9 MBoe/d) produced in 2012, an increase of 19%. Production for 2013 was 42% oil, 28% NGLs and 30% natural gas, compared to 34% oil, 31% NGLs and 35% natural gas in 2012. The increase in production in 2013 was the result of our continued development of our Permian Basin properties. We expect 2014 production to increase over 2013 due to our planned drilling and development activities in the Permian Basin.
Production for 2012 totaled 2,888 MBoe (7.9 MBoe/d), compared to 2,338 MBoe (6.4 MBoe/d) produced in 2011, an increase of 24%. Production for 2011 was 21% oil, 34% NGLs and 45% natural gas. The increase in production in 2012 was the result of our continued development of our Permian Basin properties.
Commodity derivative activities. Realized losses from our commodity derivative activity decreased our earnings by $1 million and $0.1 million for 2013 and 2012, respectively. This is compared to a realized gain in 2011 that increased our earnings by $3.4 million. Realized gains and losses are derived from the relative movement of commodity prices in relation to the fixed notional pricing of our commodity swap contracts or the range of prices in our commodity collar contracts for the respective years. The unrealized loss on commodity derivatives was $4.6 million and $0.3 million for 2013 and 2011, respectively. The unrealized gain on commodity derivatives was $3.9 million for the 2012 period. As commodity prices increase or decrease, the fair value of the open portion of those positions decreases or increases.
Historically, we have not designated our derivative instruments as cash-flow hedges. We record our open derivative instruments at fair value on our consolidated balance sheets as either unrealized gains or losses on commodity derivatives. We record changes in such fair value in earnings on our consolidated statements of operations under the caption entitled “unrealized (loss) gain on commodity derivatives.”
Lease operating expense. Our lease operating expenses (“LOE”) increased $150,000, or 1%, for 2013, to $19.2 million ($5.59 per Boe) from $19 million ($6.58 per Boe) for 2012. LOE per Boe in 2013 decreased $0.99, or 15%, from 2012. The decrease in LOE per Boe in 2013 over 2012 was primarily due to higher production volumes combined with a decrease in compressor rental and repair, water hauling and insurance, well repairs, workovers and maintenance, partially offset by an increase in pumpers and supervision.
Our LOE increased $8.3 million, or 78%, for 2012, to $19 million ($6.58 per Boe) from $10.7 million ($4.57 per Boe) for 2011. The increase in LOE per Boe in 2012 over 2011 was primarily due to an increase in workover, compression, water hauling and well repair and maintenance expenses.
46
Table of Contents
The following table summarizes LOE per Boe.
| Year Ended December 31, | Year Ended December 31, | |||||||||||||||||||||||||||||||
| 2013 | 2012 | Change | % Change | 2012 | 2011 | Change | % Change | |||||||||||||||||||||||||
Well repairs, workovers and maintenance | $ | 1.61 | $ | 2.06 | $ | (0.45 | ) | (21.8 | )% | $ | 2.06 | $ | 1.08 | $ | 0.98 | 90.7 | % | |||||||||||||||
Compressor rental and repair | 1.52 | 1.91 | (0.39 | ) | (20.4 | ) | 1.91 | 1.36 | 0.55 | 40.4 | ||||||||||||||||||||||
Water hauling, insurance and other | 1.42 | 1.61 | (0.19 | ) | (11.8 | ) | 1.61 | 1.08 | 0.53 | 49.1 | ||||||||||||||||||||||
Pumpers and supervision | 1.04 | 1.00 | 0.04 | 4.0 | 1.00 | 1.05 | (0.05 | ) | (4.8 | ) | ||||||||||||||||||||||
|
|
|
|
|
|
|
|
|
|
|
|
|
|
|
| |||||||||||||||||
Total | $ | 5.59 | $ | 6.58 | $ | (0.99 | ) | (15.0 | )% | $ | 6.58 | $ | 4.57 | $ | 2.01 | 44.0 | % | |||||||||||||||
|
|
|
|
|
|
|
|
|
|
|
|
|
|
|
| |||||||||||||||||
Production and ad valorem taxes. Our 2013 production and ad valorem taxes increased approximately $3.6 million, or 39%, to $12.8 million from $9.3 million for 2012. The increase in production and ad valorem taxes was primarily the result of an increase in oil, NGL and gas sales over 2012. Production and ad valorem taxes were approximately 7.1% and 7.2% of oil, NGL and gas sales for the respective periods.
Our 2012 production and ad valorem taxes increased approximately $808,000, or 9.6%, to $9.3 million from $8.4 million for 2011. The increase in production and ad valorem taxes was primarily the result of an increase in oil, NGL and gas sales over 2011. Production and ad valorem taxes were approximately 7.2% and 7.8% of oil, NGL and gas sales for the respective periods.
Exploration expense. We recorded $2.2 million, $4.6 million and $9.5 million of exploration expense for 2013, 2012 and 2011, respectively. Exploration expense for 2013 resulted primarily from lease expirations and 3-D seismic data. Exploration expense for 2012 resulted primarily from the acquisition of 3-D seismic data and lease extensions in the Permian Basin. Exploration expense for 2011 resulted primarily from lease extensions and expirations in the Permian Basin and the acquisition of 3-D seismic data in Pangea West.
Impairment. We review our long-lived assets, including proved and unproved oil and gas properties, accounted for under the successful efforts method of accounting. We recorded no impairment expense during the years ended December 31, 2013 and 2012. We recorded an impairment of oil and gas properties of $18.5 million in 2011. Due to low natural gas prices and to the further decline in natural gas prices during the year ended December 31, 2011, we recorded an impairment expense to our oil and gas properties in the East Texas Basin of $15.2 million in 2011. At December 31, 2011, we had $2.7 million recorded for our properties in the East Texas Basin, which is the estimated fair value at December 31, 2011. We also recorded an impairment expense of $3.3 million, which was all of our remaining carrying costs associated with our unproved properties in northern New Mexico.
General and administrative expenses. Our general and administrative expenses (“G&A”) increased $1.6 million, or 6%, to $26.5 million ($7.75 per Boe) for 2013 from $24.9 million ($8.62 per Boe) for 2012. The increase in G&A in 2013 over 2012 was primarily due to higher salaries and benefits. This was partially offset by lower share-based compensation and professional fees. The decrease in share-based compensation in 2013 versus 2012 is primarily due to the benefit of forfeited stock awards related to the retirement of one of our executive officers during the three months ended December 31, 2013.
Our G&A increased $7 million, or 39%, to $24.9 million ($8.62 per Boe) for 2012 from $17.9 million ($7.66 per Boe) for 2011. The increase in G&A in 2012 over 2011 was primarily due to higher share-based compensation, professional fees and salaries and benefits.
47
Table of Contents
The following table summarizes G&A (in millions).
| Year Ended December 31, | Year Ended December 31, | |||||||||||||||||||||||||||||||
| 2013 | 2012 | Change | % Change | 2012 | 2011 | Change | % Change | |||||||||||||||||||||||||
Salaries and benefits | $ | 13.2 | $ | 10.5 | $ | 2.7 | 25.7 | % | $ | 10.5 | $ | 8.1 | $ | 2.4 | 29.6 | % | ||||||||||||||||
Share-based compensation | 5.9 | 7.5 | (1.6 | ) | (21.3 | ) | 7.5 | 4.7 | 2.8 | 59.6 | ||||||||||||||||||||||
Professional fees | 1.7 | 2.1 | (0.4 | ) | (19.0 | ) | 2.1 | 1.4 | 0.7 | 50.0 | ||||||||||||||||||||||
Other | 5.7 | 4.8 | 0.9 | 18.8 | 4.8 | 3.7 | 1.1 | 29.7 | ||||||||||||||||||||||||
|
|
|
|
|
|
|
|
|
|
|
|
|
|
|
| |||||||||||||||||
Total | $ | 26.5 | $ | 24.9 | $ | 1.6 | 6.4 | % | $ | 24.9 | $ | 17.9 | $ | 7.0 | 39.1 | % | ||||||||||||||||
|
|
|
|
|
|
|
|
|
|
|
|
|
|
|
| |||||||||||||||||
Depletion, depreciation and amortization expense. Our depletion, depreciation and amortization expense (“DD&A”) increased $16.6 million, or 27%, to $77 million for 2013, from $60.4 million for 2012. Our DD&A per Boe increased by $1.57, or 8%, to $22.48 per Boe for 2013, compared to $20.91 per Boe for 2012. The increase in DD&A and DD&A per Boe in 2013 over 2012 was primarily attributable to increases in production and oil and gas property carrying costs, relative to estimated proved developed reserves. The increase in oil and gas property carrying costs reflects our drilling and development project of the Wolfcamp shale oil resource play.
DD&A increased $27.9 million, or 86%, to $60.4 million for 2012, from $32.5 million for 2011. Our DD&A per Boe increased by $7.02, or 51%, to $20.91 per Boe for 2012, compared to $13.89 per Boe for 2011. The increase in DD&A and DD&A per Boe in 2012 over 2011 was primarily attributable to increases in production and oil and gas property carrying costs, relative to estimated proved developed reserves.
Interest expense, net. The following table sets forth interest expense, weighted average interest rates and weighted average debt balances for the years ended December 31, 2013, 2012 and 2011 (dollars in thousands). Interest expense below for 2013 includes amortization of loan origination fees and deferred offering costs of $1 million from the issuance of the Senior Notes in 2013. The increase in interest expense in 2013 over 2012 was primarily due to higher interest expense from the issuance of Senior Notes in June 2013, partially offset by decreased borrowings under our credit facility. We expect our interest expense to remain higher than the prior-year period as a result of our issuance of the Senior Notes.
| Year Ended December 31, | ||||||||||||
| 2013 | 2012 | 2011 | ||||||||||
Interest expense | $ | 14,084 | $ | 4,737 | $ | 3,402 | ||||||
Weighted average interest rate | 5.7 | % | �� | 3.2 | % | 3.1 | % | |||||
Weighted average debt balance | $ | 190,444 | $ | 108,296 | $ | 78,810 | ||||||
Gain on sale of equity method investment. In October 2013, Approach, together with our partner in Wildcat, completed the sale of all of the equity interests of Wildcat for a purchase price of $210 million. We recognized a pre-tax gain of $90.7 million related to this transaction, subject to normal post-closing adjustments.
Income taxes. Our effective income tax rate for 2013, 2012 and 2011 was 37%, 34.3% and 32.5%, respectively. The higher income tax rate in 2013, compared to 2012, was a result of an increase in state taxes. The higher income tax rate in 2012, compared to 2011, was a result of a decrease in permanent differences from book and taxable income.
Liquidity and Capital Resources
We generally will rely on cash generated from operations, borrowings under our revolving credit facility and, to the extent that credit and capital market conditions will allow, future public equity and debt offerings to satisfy our liquidity needs. Our ability to fund planned capital expenditures and to make acquisitions depends upon our future operating performance, availability of borrowings under our revolving credit facility, and more
48
Table of Contents
broadly, on the availability of equity and debt financing, which is affected by prevailing economic conditions in our industry and financial, business and other factors, some of which are beyond our control. We cannot predict whether additional liquidity from equity or debt financings beyond our revolving credit facility will be available on acceptable terms, or at all, in the foreseeable future.
Our cash flow from operations is driven by commodity prices, production volumes and the effect of commodity derivatives. Prices for oil and gas are affected by national and international economic and political environments, national and global supply and demand for hydrocarbons, seasonal influences of weather and other factors beyond our control. Cash flows from operations are primarily used to fund exploration and development of our oil and gas properties.
We believe we have adequate liquidity from cash on hand, cash generated from operations and unused borrowing capacity under our revolving credit facility for current working capital needs and maintenance of our current development project. However, we may determine to use various financing sources, including the issuance of common stock, preferred stock, debt, convertible securities and other securities for future development of reserves, acquisitions, additional working capital or other liquidity needs, if such financing is available on acceptable terms. We cannot guarantee that such financing will be available on acceptable terms or at all. Using some of these financing sources may require approval from the lenders under our revolving credit facility.
Liquidity
We define liquidity as funds available under our revolving credit facility plus year-end net cash and cash equivalents. At December 31, 2013, we had no borrowings outstanding under our credit facility and $58.8 million in cash and cash equivalents, compared to $106 million and $43.8 million in long-term debt outstanding under our credit facility and $0.8 million and $0.3 million in cash and cash equivalents at December 31, 2012, and 2011, respectively. Our liquidity position at December 31, 2013, was substantially higher than prior years due to our public offering of $250 million of 7% Senior Notes, cash proceeds from the sale of our interest in the Wildcat oil pipeline of $100.8 million, net of our contributions, and an increase in our borrowing base to $350 million.
The following table summarizes our liquidity position at December 31, 2013, 2012 and 2011 (in thousands).
| Year Ended December 31, | ||||||||||||
| 2013 | 2012 | 2011 | ||||||||||
Borrowing base | $ | 350,000 | $ | 280,000 | $ | 260,000 | ||||||
Cash and cash equivalents | 58,761 | 767 | 301 | |||||||||
Long-term debt — credit facility | — | (106,000 | ) | (43,800 | ) | |||||||
Undrawn letters of credit | (325 | ) | (325 | ) | (350 | ) | ||||||
|
|
|
|
|
| |||||||
Liquidity | $ | 408,436 | $ | 174,442 | $ | 216,151 | ||||||
|
|
|
|
|
| |||||||
Working Capital
Our working capital is affected primarily by our cash and cash equivalents balance and our capital spending program. At December 31, 2013, we had a working capital surplus of $6 million, compared to a working capital deficit of $44.6 million and $32.2 million at December 31, 2012 and 2011, respectively. The change in working capital during 2013 is primarily attributable to proceeds from Senior Notes offering, sale of our interest in the Wildcat oil pipeline and an increase in oil, NGL and gas sales, partially offset by increases in accounts payable and accrued liabilities to fund capital expended on our development project. The change in working capital during 2012 and 2011 is primarily attributable to increases in accounts payable and accrued liabilities to fund capital expended on our development project. To the extent we operate or end 2014 with a working capital deficit, we expect such deficit to be more than offset by liquidity available under our revolving credit facility.
49
Table of Contents
Cash Flows
The following table summarizes our sources and uses of funds for the periods noted (in thousands).
| Year Ended December 31, | ||||||||||||
| 2013 | 2012 | 2011 | ||||||||||
Cash flows provided by operating activities | $ | 125,580 | $ | 90,585 | $ | 95,770 | ||||||
Cash flows used in investing activities | (203,397 | ) | (307,414 | ) | (284,758 | ) | ||||||
Cash flows provided by financing activities | 135,811 | 217,295 | 165,843 | |||||||||
Effect of Canadian exchange rate | — | — | (19 | ) | ||||||||
|
|
|
|
|
| |||||||
Net increase (decrease) in cash and cash equivalents | $ | 57,994 | $ | 466 | $ | (23,164 | ) | |||||
|
|
|
|
|
| |||||||
For 2013, our primary sources of cash were from operating activities, investing activities and financing activities. Approximately $125.6 million of cash from operations and $135.8 million of cash from financing activities were used to fund our development project in the Permian Basin. Cash flows used in investing activities were lower in 2013 compared to 2012, primarily due to proceeds from the sale of the Wildcat pipeline joint venture of $100.8 million, net of our contributions. In June, we completed our public offering of $250 million principal amount of 7% Senior Notes due 2021. We received net proceeds from the issuance of the Senior Notes of approximately $243 million, and used a portion of the net proceeds from the offering to repay all outstanding borrowings under our credit facility, fund our capital expenditures for the development of our Wolfcamp shale oil resource play and for general working capital needs.
For 2012, our primary sources of cash were from operating activities and financing activities. Approximately $90.6 million of cash from operations and $217.3 million of cash from financing activities were used to fund our development project in the Permian Basin. In September, we sold 5 million shares of common stock, and in October 2012, the underwriters exercised their option and purchased an additional 325,000 shares. After deducting underwriting discounts and estimated transaction costs of approximately $8 million, we received net proceeds of approximately $154.4 million. We used the proceeds of the offering to repay outstanding borrowings under our revolving credit facility, fund our capital expenditures for the development of our Wolfcamp shale oil resource play and for general working capital needs.
For 2011, our primary sources of cash were from operating activities and financing activities. Approximately $95.8 million of cash from operations and $165.8 million of cash from financing activities were used to fund a portion of our development project and the acquisition of 38% working interest in north Project Pangea from two non-operating partners. In November 2011, we sold 4.6 million shares of common stock. After deducting underwriting discounts and estimated transaction costs of approximately $6.6 million, we received net proceeds of approximately $122.2 million. We used the proceeds of the offering to repay outstanding borrowings under our revolving credit facility, fund our capital expenditures for the Wolfcamp shale oil resource play, fund working interest and leasehold acquisitions in the Permian Basin and for general working capital needs.
Operating Activities
For 2013, our cash flows from operations and available cash were used primarily for drilling and development activities in the Permian Basin. Cash flows from operating activities increased by $35 million, or 39%, to $125.6 million in 2013 from $90.6 million in 2012. The increase in cash flows from operating activities in 2013 versus 2012 was primarily due to an increase in oil, NGL and gas sales due to our development project in the Wolfcamp shale oil resource play and the timing of receipts and payments of working capital components, partially offset by an increase in total expenses.
For 2012, our cash flows from operations, borrowings under our revolving credit facility and available cash were used primarily for drilling and development activities and leasehold acquisitions in the Permian Basin. Cash flows from operating activities decreased by $5.2 million, or 5%, to $90.6 million in 2012 from $95.8 million in
50
Table of Contents
2011. The decrease in cash flows from operating activities in 2012 versus 2011 was primarily due to a decrease in cash flows provided by working capital, lower average realized NGL and gas prices, partially offset by higher production volumes in 2012 due to our development project in the Wolfcamp shale oil resource play.
For 2011, our cash flows from operations, borrowings under our revolving credit facility and available cash were used primarily for drilling and development activities and leasehold acquisitions in the Permian Basin and the acquisition of 38% working interest in Project Pangea from non-operating partners for $70.8 million, after post-closing adjustments (the “Working Interest Acquisition”). Cash flows from operating activities increased by $53.4 million, or 126%, to $95.8 million from $42.4 million in 2010, primarily due to an 88% increase in oil, NGL and gas sales in 2011.
Investing Activities
During the years ended December 31, 2013, 2012 and 2011, we invested $296.4 million, $296.9 million and $284.6 million, respectively, for capital expenditures on oil and natural gas properties. Cash flows used in investing activities were lower in 2013 compared to 2012, primarily due to cash proceeds from the sale of our interest in the Wildcat oil pipeline of $100.8 million, net of our contributions, which offset cash used for drilling and development ($251.4 million), infrastructure projects, equipment and 3-D seismic data acquisition ($38.2 million) and lease acquisitions and extensions ($6.8 million). Cash flows used in investing activities were higher in 2012 compared to 2011, primarily due to drilling and development ($240.4 million), infrastructure projects, equipment and 3-D seismic data acquisition ($47.5 million) and lease acquisitions and extensions ($9 million), all in Project Pangea.
The following table is a summary of capital expenditures related to our oil and gas properties (in thousands).
| Years Ended December 31, | ||||||||||||
| 2013 | 2012 | 2011 | ||||||||||
Permian Basin | $ | 249,905 | $ | 240,357 | $ | 172,077 | ||||||
Permian Basin acquisitions | 1,500 | — | 70,827 | |||||||||
|
|
|
|
|
| |||||||
Subtotal | 251,406 | 240,357 | 242,904 | |||||||||
East Texas Basin | — | — | 560 | |||||||||
Exploratory projects | — | — | 445 | |||||||||
Infrastructure projects, equipment and 3-D seismic | 38,157 | 44,278 | 8,695 | |||||||||
Lease acquisitions and extensions | 6,847 | 12,292 | 31,970 | |||||||||
|
|
|
|
|
| |||||||
Total | $ | 296,409 | $ | 296,927 | $ | 284,574 | ||||||
|
|
|
|
|
| |||||||
Financing Activities
The following is a description of our financing activities. During 2013, 2012 and 2011 we completed the following capital markets activities:
| • | In June 2013, we completed our public offering of $250 million principal amount of 7% Senior Notes due 2021. Interest on the Senior Notes is payable semi-annually on June 15 and December 15, beginning December 15, 2013. We received net proceeds from the issuance of the Senior Notes of approximately $243 million, and used a portion of the net proceeds from the offering to repay all outstanding borrowings under our credit facility, fund our capital expenditures for the development of our Wolfcamp shale oil resource play and for general working capital needs. |
| • | In September 2012, we completed a public offering of 5 million shares of our common stock at $30.50 per share, and in October 2012, the underwriters exercised their option and purchased an additional 325,000 shares. We received net proceeds of approximately $154.4 million, and used the proceeds to repay outstanding borrowings under our revolving credit facility, fund our capital expenditures for the development of our Wolfcamp shale oil resource play and for general working capital needs. |
51
Table of Contents
| • | In November 2011, we completed an equity offering and issued an aggregate of 4.6 million shares of our common stock at $28 per share, and we received net proceeds of approximately $122.2 million. We used the proceeds of the 2011 equity offering to repay outstanding borrowings under our revolving credit facility, fund our capital expenditures for the Wolfcamp shale oil resource play, fund working interest and leasehold acquisitions in the Permian Basin and for general working capital needs. |
We borrowed $129.9 million under our revolving credit facility in 2013, compared to $304.6 million and $246.8 million in 2012 and 2011, respectively. We repaid a total of $235.9 million, $242.4 million and $203 million of amounts outstanding under our revolving credit facility for 2013, 2012 and 2011, respectively.
Revolving Credit Facility
We have a $500 million revolving credit facility with a borrowing base set at $350 million. The borrowing base is redetermined semi-annually on or before each April 1 and October 1 based on our oil and gas reserves. We or the lenders can each request one additional borrowing base redetermination each calendar year.
The maturity date under our revolving credit facility is July 31, 2016. Borrowings bear interest based on the agent bank’s prime rate plus an applicable margin ranging from 0.75% to 1.75%, or the sum of the Eurodollar rate plus an applicable margin ranging from 1.75% to 2.75%. Margins vary based on the borrowings outstanding compared to the borrowing base. In addition, we pay an annual commitment of 0.50% of unused borrowings available under our revolving credit facility.
On May 1, 2013, we entered into a fifteenth amendment to the credit facility, which (i) increased the borrowing base to $315 million from $280 million, (ii) increased the lenders’ aggregate maximum commitment to $500 million from $300 million, and (iii) extended the maturity date by two years, to July 31, 2016. Loans under our credit facility are secured by first-priority liens on substantially all of our West Texas assets and are guaranteed by certain of our subsidiaries.
On November 6, 2013, we entered into a sixteenth amendment to the credit facility, which, among other things, increased the borrowing base to $350 million from $315 million.
On January 23, 2014, we entered into a seventeenth amendment to the credit facility. This amendment provides the Company with more hedging flexibility by allowing the Company to enter into commodity derivative contracts on a rolling basis for (i) up to 85% of projected production from proved oil and gas properties for the two years following a commodities derivative contract, (ii) up to 100% of projected production from proved producing oil and gas properties during year three of such contract and (iii) up to 85% of projected production from proved producing oil and gas properties during years four and five of such contract.
We had no outstanding borrowings under our credit facility at December 31, 2013, compared to outstanding borrowings of $106 million at December 31, 2012. The weighted average interest rate applicable to borrowings under our credit facility at December 31, 2012, was 2.7%. We also had outstanding unused letters of credit under our revolving credit facility totaling $0.3 million at December 31, 2013, which reduce amounts available for borrowing under our revolving credit facility.
Loans under our revolving credit facility are secured by first-priority liens on substantially all of our West Texas assets, a pledge of our equity interests in our subsidiaries and are guaranteed by our subsidiaries.
Covenants
Our credit agreement contains two principal financial covenants:
| • | a consolidated modified current ratio covenant that requires us to maintain a ratio of not less than 1.0 to 1.0 at all times. The consolidated modified current ratio is calculated by dividing Consolidated Current Assets (as defined in the credit agreement) by Consolidated Current Liabilities (as defined in the credit |
52
Table of Contents
agreement). As defined more specifically in the credit agreement, the consolidated modified current ratio is calculated as current assets less current unrealized gains on commodity derivatives plus the available borrowing base at the respective balance sheet date, divided by current liabilities less current unrealized losses on commodity derivatives at the respective balance sheet date. |
| • | a consolidated funded debt-to-consolidated EBITDAX ratio covenant that requires us to maintain a ratio of not more than 4.0 to 1.0 at the end of each fiscal quarter. The consolidated funded debt-to-consolidated EBITDAX ratio is calculated by dividing Consolidated Funded Debt (as defined in the credit agreement) by Consolidated EBITDAX (as defined in the credit agreement). As defined more specifically in the credit agreement, consolidated EBITDAX is calculated as net income (loss), plus (1) exploration expense, (2) depletion, depreciation and amortization expense, (3) share-based compensation expense, (4) unrealized loss on commodity derivatives, (5) interest expense, (6) income and franchise taxes and (7) certain other noncash expenses, less (1) gains or losses from sales or dispositions of assets, (2) unrealized gain on commodity derivatives and (3) extraordinary or nonrecurring gains. For purposes of calculating this ratio, consolidated EBITDAX for a fiscal quarter is annualized pursuant to the credit agreement. |
Our credit agreement also restricts cash dividends and other restricted payments, transactions with affiliates, incurrence of other debt, consolidations and mergers, the level of operating leases, asset sales, investments in other entities and liens on properties.
In addition, our credit agreement contains customary events of default that would permit our lenders to accelerate the debt under our credit agreement if not cured within applicable grace periods, including, among others, failure to make payments of principal or interest when due, materially incorrect representations and warranties, failure to make mandatory prepayments in the event of borrowing base deficiencies, breach of covenants, defaults upon other obligations in excess of $500,000, events of bankruptcy, the occurrence of one or more unstayed judgments in excess of $500,000 not covered by an acceptable policy of insurance, failure to pay any obligation in excess of $500,000 owed under any derivatives transaction or in any amount if the obligation under the derivatives transaction is secured by collateral under the credit agreement, any event of default by the Company occurs under any agreement entered into in connection with a derivatives transaction, liens securing the loans under the credit agreement cease to be in place, a Change in Control (as defined in the credit agreement) of the Company occurs and dissolution of the Company.
At December 31, 2013, we were in compliance with all of our covenants and had not committed any acts of default under the credit agreement.
To date we have experienced no disruptions in our ability to access our revolving credit facility. However, our lenders have substantial ability to reduce our borrowing base on the basis of subjective factors, including the loan collateral value that each lender, in its discretion and using the methodology, assumptions and discount rates as such lender customarily uses in evaluating oil and gas properties, assigns to our properties.
Senior Notes
In June 2013, we completed our public offering of $250 million principal amount of 7% Senior Notes due 2021. Interest on the Senior Notes is payable semi-annually on June 15 and December 15, beginning December 15, 2013. We received net proceeds from the issuance of the Senior Notes of approximately $243 million, after deducting fees and expenses. We used a portion of the net proceeds from the offering to repay all outstanding borrowings under our credit facility. We will use the remaining net proceeds to fund our capital expenditures and for general working capital needs.
We issued the Senior Notes under a senior indenture dated June 11, 2013, among the Company, our subsidiary guarantors and Wells Fargo Bank, National Association, as trustee. The senior indenture, as supplemented by a supplemental indenture dated June 11, 2013, is referred to as the “Indenture.”
53
Table of Contents
On and after June 15, 2016, we may redeem some or all of the Senior Notes at specified redemption prices, plus accrued and unpaid interest to the redemption date. Before June 15, 2016, we may redeem up to 35% of the Senior Notes at a redemption price of 107% of the principal amount, plus accrued and unpaid interest to the redemption date, with the proceeds of certain equity offerings. In addition, before June 15, 2016, we may redeem some or all of the Notes for cash at a redemption price equal to 100% of their principal amount plus an applicable make-whole premium and accrued and unpaid interest to the redemption date. If we sell certain of our assets or experience specific kinds of changes of control, we may be required to offer to purchase the Senior Notes from holders. The Senior Notes are fully and unconditionally guaranteed on a senior unsecured basis by each of our subsidiaries, subject to certain customary release provisions. A subsidiary guarantor may be released from its obligations under the guarantee:
| • | in connection with any sale or other disposition of all or substantially all of the assets of that guarantor (including by way of merger or consolidation) to a person that is not (either before or after giving effect to such transaction) the Company or a subsidiary guarantor, if the sale or other disposition otherwise complies with the indenture; |
| • | in connection with any sale or other disposition of the capital stock of that guarantor to a person that is not (either before or after giving effect to such transaction) the Company or a subsidiary guarantor, if that guarantor no longer qualifies as a subsidiary of the Company as a result of such disposition and the sale or other disposition otherwise complies with the indenture; |
| • | if the Company designates any restricted subsidiary that is a guarantor to be an unrestricted subsidiary in accordance with the indenture; |
| • | upon defeasance or covenant defeasance of the notes or satisfaction and discharge of the indenture, in each case, in accordance with the indenture; |
| • | upon the liquidation or dissolution of that guarantor, provided that no default or event of default occurs under the indenture as a result thereof or shall have occurred and is continuing; or |
| • | in the case of any restricted subsidiary that, after the issue date of the notes is required under the indenture to guarantee the notes because it becomes a guarantor of indebtedness issued or an obligor under a credit facility with respect to the Company and/or its subsidiaries, upon the release or discharge in full from its (x) guarantee of such indebtedness or (y) obligation under such credit facility, in each case, which resulted in such restricted subsidiary’s obligation to guarantee the notes. |
The Indenture restricts our ability, among other things, to (i) sell certain assets, (ii) pay distributions on, redeem or repurchase, equity interests, (iii) incur additional debt, (iv) make certain investments, (v) enter into transactions with affiliates, (v) incur liens and (vi) merge or consolidate with another company. These restrictions are subject to a number of important exceptions and qualifications. If at any time the Senior Notes are rated investment grade by both Moody’s Investors Service and Standard & Poor’s Ratings Services and no default (as defined in the Indenture) has occurred and is continuing, many of these restrictions will terminate. The Indenture contains customary events of default.
At December 31, 2013, we were in compliance with all of our covenants, and there were no existing defaults or events of default, under our debt instruments. On December 15, 2013, we made a semi-annual interest payment of $8.9 million.
Contractual Obligations
As of December 31, 2013, our contractual obligations include long-term debt, daywork drilling contracts, operating lease obligations, asset retirement obligations and employment agreements with our executive officers.
We periodically enter into contractual arrangements under which we are committed to expend funds to drill wells in the future, including agreements to secure drilling rig services, which require us to make future
54
Table of Contents
minimum payments to the rig operators. We record drilling commitments in the periods in which well capital expenditures are incurred or rig services are provided. Our commitment under daywork drilling contracts was $1.9 million at December 31, 2013.
In April 2007, we signed a five-year lease for approximately 13,000 square feet of office space in Fort Worth, Texas. In August 2008, we expanded our office space under an amendment to the lease to approximately 18,000 square feet. In December 2010, we expanded our office space under an amendment to the lease to approximately 23,400 square feet. In August 2012, we further expanded our office space under a third amendment to the lease to approximately 27,000 square feet and extended the term of the lease to December 31, 2017. In December 2012, we began rent payments under the third amendment, bringing our total office lease payment to approximately $51,000 per month.
Our asset retirement obligation primarily represents the estimated present value of the amount we will incur to plug, abandon and remediate our producing properties at the end of their productive lives, in accordance with applicable federal, state and local laws. We determine our asset retirement obligation by calculating the present value of estimated cash flows related to the liability. The retirement obligation is recorded as a liability at its estimated present value as of the asset’s inception, with an offsetting increase to proved properties. Periodic accretion of discount of the estimated liability is recorded as an expense in the income statement.
At December 31, 2013, we had outstanding employment agreements with four of our five executive officers that contained automatic renewal provisions providing that such agreements may be automatically renewed for successive terms of one year unless the employment is terminated at the end of the term by written notice given to the employee not less than 60 days prior to the end of such term. On January 3, 2014, we entered into an employment agreement with Sergei Krylov as the Company’s Executive Vice President and Chief Financial Officer. Our maximum commitment under the employment agreements, which would apply if the employees covered by these agreements were each terminated without cause, was approximately $4.5 million at December 31, 2013. The commitment under the employment agreement entered into with the Company’s Executive Vice President and Chief Financial Officer on January 3, 2014 is $1.3 million.
The following table summarizes these commitments as of December 31, 2013 (in thousands).
| Payments Due By Period | ||||||||||||||||||||
Contractual Obligations | Total | Less than 1 year | 1-3 years | 3-5 years | More than 5 years | |||||||||||||||
Credit agreement | $ | — | $ | — | $ | — | $ | — | $ | — | ||||||||||
Senior Notes(1) | 250,000 | — | — | — | 250,000 | |||||||||||||||
Daywork drilling contracts(2) | 1,890 | 1,890 | — | — | — | |||||||||||||||
Operating lease obligations(3) | 2,682 | 668 | 1,344 | 670 | — | |||||||||||||||
Asset retirement obligations(4) | 8,350 | — | — | — | 8,350 | |||||||||||||||
Employment agreements with executive officers | 4,501 | 4,501 | — | — | — | |||||||||||||||
|
|
|
|
|
|
|
|
|
| |||||||||||
Total | $ | 267,423 | $ | 7,059 | $ | 1,344 | $ | 670 | $ | 258,350 | ||||||||||
|
|
|
|
|
|
|
|
|
| |||||||||||
| (1) | 7% Senior Notes due 2021. |
| (2) | At December 31, 2013, one drilling rig was contracted through March 31, 2014, and two drilling rigs were contracted on a well-to-well basis. |
| (3) | Operating lease obligations are for office space and equipment. |
| (4) | See Note 1 to our consolidated financial statements for a discussion of our asset retirement obligations. |
Critical Accounting Policies and Estimates
The discussion and analysis of our financial condition and results of operations are based upon our consolidated financial statements, which have been prepared in accordance with GAAP. The preparation of our consolidated financial statements requires us to make estimates and assumptions that affect our reported results
55
Table of Contents
of operations and the amount of reported assets, liabilities and proved oil and gas reserves. Some accounting policies involve judgments and uncertainties to such an extent that there is reasonable likelihood that materially different amounts could have been reported under different conditions, or if different assumptions had been used. Actual results may differ from the estimates and assumptions used in the preparation of our consolidated financial statements. Described below are the most significant policies we apply in preparing our consolidated financial statements, some of which are subject to alternative treatments under GAAP. We also describe the most significant estimates and assumptions we make in applying these policies. See Note 1 to our consolidated financial statements.
Segment reporting is not applicable to us as we have a single, company-wide management team that administers all significant properties as a whole, rather than by discrete operating segments. We track only basic operational data by area. We do not maintain complete separate financial statement information by area. We measure financial performance as a single enterprise and not on an area-by-area basis. We use the successful efforts method of accounting for our oil and gas activities.
Successful Efforts Method of Accounting
Accounting for oil and gas activities is subject to special, unique rules. We use the successful efforts method of accounting for our oil and gas activities. The significant principles for this method are:
| • | costs to acquire mineral interests in oil and gas properties and to drill and equip development wells and related asset retirement costs are capitalized. Costs to drill exploratory wells are capitalized pending determination of whether the wells have proved reserves; |
| • | dry holes for exploratory wells are expensed and dry holes for development wells are capitalized; |
| • | geological and geophysical evaluation costs are expensed as incurred; and |
| • | capitalized costs related to proved oil and gas properties, including wells and related equipment and facilities, are evaluated for impairment based on an analysis of undiscounted future net cash flows in accordance with ASC 360. If undiscounted cash flows are insufficient to recover the net capitalized costs related to proved properties, then we recognize an impairment charge in income from operations equal to the difference between the net capitalized costs related to proved properties and their estimated fair values based on the present value of the related future net cash flows. |
Proved Reserves
For the year ended December 31, 2013, we engaged DeGolyer and MacNaughton, independent petroleum engineers, to prepare independent estimates of the extent and value of 100% of our reported proved reserves, in accordance with rules and guidelines established by the SEC.
Estimates of proved oil and gas reserves directly impact financial accounting estimates including depletion, depreciation and amortization expense, evaluation of impairment of properties and the calculation of plugging and abandonment liabilities. Proved oil and gas reserves are those quantities of oil and gas, which, by analysis of geoscience and engineering data, can be estimated with reasonable certainty to be economically producible from a given date forward, from known reservoirs, and under existing economic conditions, operating methods and government regulations. The process of estimating quantities of proved reserves is very complex, requiring significant subjective decisions in the evaluation of all geological, engineering and economic data for each reservoir. The data for any reservoir may change substantially over time due to results from operational activity. Proved reserve volumes at December 31, 2013, were estimated based on the average of the closing price on the first day of each month for the 12-month period prior to December 31, 2013, for oil, NGLs and gas in accordance with SEC rules. Changes in commodity prices and operations costs may increase or decrease estimates of proved oil, NGL and natural gas reserves. Depletion expense for our oil and gas properties is determined using our estimates of proved oil, NGL and gas reserves. A hypothetical 10% decline in our December 31, 2013, estimated proved reserves would have increased our depletion expense by approximately $2.4 million for the year ended December 31, 2013.
56
Table of Contents
See also Item 2. “Properties — Proved Oil and Gas Reserves” and Note 10 to our consolidated financial statements in this report for additional information regarding our estimated proved reserves.
Derivative Instruments and Commodity Derivative Activities
Unrealized gains and losses, at fair value, are included on our consolidated balance sheets as current or non-current assets or liabilities based on the anticipated timing of cash settlements under the related contracts. Changes in the fair value of our commodity derivative contracts are recorded in earnings as they occur and included in other income (expense) on our consolidated statements of operations. We estimate the fair values of swap contracts based on the present value of the difference in exchange-quoted forward price curves and contractual settlement prices multiplied by notional quantities. We internally valued the option contracts using industry-standard option pricing models and observable market inputs. We use our internal valuations to determine the fair values of the contracts that are reflected on our consolidated balance sheets. Realized gains and losses are also included in other income (expense) on our consolidated statements of operations.
We are exposed to credit losses in the event of nonperformance by the counterparties on our commodity derivatives positions and have considered the exposure in our internal valuations. However, we do not anticipate nonperformance by the counterparties over the term of the commodity derivatives positions.
We enter into financial swaps and collars to mitigate portions of the risk of market price fluctuations related to future oil and gas production. All derivative instruments are recorded as derivative assets and liabilities at fair value in the balance sheet, and the changes in derivative’s fair value are recognized as current income or expense in the consolidated statement of operations.
We use derivative instruments to reduce our exposure to fluctuations in commodity prices related to our oil and gas production. Accordingly, we record realized gains and losses under those instruments in other revenues on our consolidated statements of operations. For the years ended December 31, 2013, 2012 and 2011, we recognized an unrealized loss of $4.6 million, an unrealized gain of $3.9 million and an unrealized loss of $0.3 million from the change in the fair value of commodity derivatives, respectively. A hypothetical 10% increase in the NYMEX floating prices would have resulted in a $21.6 million decrease in the December 31, 2013, fair value recorded on our balance sheet and a corresponding increase to the loss on commodity derivatives in our statement of operations.
Asset Retirement Obligation
Our asset retirement obligation primarily represents the estimated present value of the amount we will incur to plug, abandon and remediate our producing properties at the end of their productive lives, in accordance with applicable federal, state and local laws. We determine our asset retirement obligation by calculating the present value of estimated cash flows related to the liability. The retirement obligation is recorded as a liability at its estimated present value as of the asset’s inception, with an offsetting increase to proved properties. Periodic accretion of discount of the estimated liability is recorded as an expense in the income statement.
Our liability is determined using significant assumptions, including current estimates of plugging and abandonment costs, annual inflation of these costs, the productive lives of wells and our risk-adjusted interest rate. Changes in any of these assumptions can result in significant revisions to the estimated asset retirement obligation.
Impairment of Long-Lived Assets
All of our long-lived assets are monitored for potential impairment when circumstances indicate that the carrying value of an asset may be greater than its future net cash flows. The evaluations involve a significant amount of judgment since the results are based on estimated future events, such as future sales prices for oil, NGLs and gas, future costs to produce these products, estimates of future oil and gas reserves to be recovered and
57
Table of Contents
the timing thereof, the economic and regulatory climates and other factors. The need to test an asset for impairment may result from significant declines in commodity prices or downward revisions to estimated quantities of oil and gas reserves. Any assets held for sale are reviewed for impairment when we approve the plan to sell. Estimates of anticipated sales prices are highly judgmental and subject to material revision in future periods. Because of the uncertainty inherent in these factors, we cannot predict when or if future impairment charges will be recorded.
Provision for Income Taxes
We estimate our provision for income taxes using historical tax basis information from prior years’ income tax returns, along with the estimated changes to such bases from current-period activity and enacted tax rates. Additionally, we compare liabilities to actual settlements of such assets or liabilities during the current period to identify considerations that might affect the current period’s estimate.
Valuation of Share-Based Compensation
Our 2007 Plan allows grants of stock and options to employees and outside directors. Granting of awards may increase our general and administrative expenses, subject to the size and timing of the grants. See Note 5 to our consolidated financial statements.
In accordance with GAAP, we calculate the fair value of share-based compensation using various valuation methods. The valuation methods require the use of estimates to derive the inputs necessary to determine fair value. We use (i) the Black-Scholes option price model to measure the fair value of stock options, (ii) the closing stock price on the date of grant for the fair value of restricted stock awards, including performance-based awards, and (iii) the Monte Carlo simulation method for the fair value of market-based awards.
Equity Method Investments
For investments in which we have the ability to exercise significant influence but do not have control, we follow the equity method of accounting. In September 2012, we entered into a joint venture to build an oil pipeline in Crockett and Reagan Counties, Texas, which is used to transport our oil to market. In October 2012, we made an initial contribution of $10 million to the joint venture for pipeline and facilities construction. In 2013, we contributed $8.3 million to the equity joint venture for pipeline and facilities construction prior to its sale in October 2013. Our contributions are recorded at cost and are included in noncurrent assets, “Equity method investment,” on our consolidated balance sheets and in investing activities, “Contribution to equity method investment,” on our consolidated statements of cash flows.
Effects of Inflation
Inflation in the United States has been relatively low in recent years and did not have a material impact on our results of operations for the years ended December 31, 2013, 2012 or 2011. Although the impact of inflation has been insignificant in recent years, it is still a factor in the United States economy and may increase the cost to acquire or replace property and equipment. It may also increase the cost of labor or supplies.
Off-Balance Sheet Arrangements
From time-to-time, we enter into off-balance sheet arrangements and transactions that can give rise to off-balance sheet obligations. As of December 31, 2013, the off-balance sheet arrangements and transactions that we have entered into include undrawn letters of credit, operating lease agreements and gas transportation commitments. We do not believe that these arrangements are reasonably likely to materially affect our liquidity or availability of, or requirements for, capital resources.
58
Table of Contents
| ITEM 7A. | QUANTITATIVE AND QUALITATIVE DISCLOSURES ABOUT MARKET RISK |
Some of the information below contains forward-looking statements. The primary objective of the following information is to provide forward-looking quantitative and qualitative information about our potential exposure to market risks. The term “market risk” refers to the risk of loss arising from adverse changes in oil and gas prices, and other related factors. The disclosure is not meant to be a precise indicator of expected future losses, but rather an indicator of reasonably possible losses. This forward-looking information provides an indicator of how we view and manage our ongoing market risk exposures. Our market risk sensitive instruments were entered into for commodity derivative and investment purposes, not for trading purposes.
Proved Reserves
Estimates of proved oil and gas reserves directly impact financial accounting estimates including depletion, depreciation and amortization expense, evaluation of impairment of properties and the calculation of plugging and abandonment liabilities. Proved oil and gas reserves are those quantities of oil and gas, which, by analysis of geoscience and engineering data, can be estimated with reasonable certainty to be economically producible from a given date forward, from known reservoirs, and under existing economic conditions, operating methods and government regulations. The process of estimating quantities of proved reserves is very complex, requiring significant subjective decisions in the evaluation of all geological, engineering and economic data for each reservoir. The data for any reservoir may change substantially over time due to results from operational activity. Proved reserve volumes at December 31, 2013, were estimated based on the average of the closing price on the first day of each month for the 12-month period prior to December 31, 2013, for oil, NGLs and natural gas in accordance with SEC rules. Changes in commodity prices and operations costs may increase or decrease estimates of proved oil, NGL and natural gas reserves. Depletion expense for our oil and gas properties is determined using our estimates of proved oil, NGL and natural gas reserves. A hypothetical 10% decline in our December 31, 2013, estimated proved reserves would have increased our depletion expense by approximately $2.4 million for the year ended December 31, 2013.
Commodity Price Risk
Given the current economic outlook, we expect commodity prices to remain volatile. Even modest decreases in commodity prices can materially affect our revenues and cash flow. In addition, if commodity prices remain suppressed for a significant amount of time, we could be required under successful efforts accounting rules to write down our oil and gas properties.
We enter into financial swaps and options to reduce the risk of commodity price fluctuations. We do not designate such instruments as cash flow hedges. Accordingly, we record open commodity derivative positions on our consolidated balance sheets at fair value and recognize changes in such fair values as income (expense) on our consolidated statements of operations as they occur.
59
Table of Contents
The table below summarizes our commodity derivatives positions outstanding at December 31, 2013.
Commodity and Period | Contract Type | Volume Transacted | Contract Price | |||
Crude Oil | ||||||
2014 | Collar | 550 Bbls/d | $90.00/Bbl – $105.50/Bbl | |||
2014 | Collar | 950 Bbls/d | $85.05/Bbl – $95.05/Bbl | |||
2014 | Collar | 2,000 Bbls/d | $89.00/Bbl – $98.85/Bbl | |||
2015 | Collar | 2,600 Bbls/d | $84.00/Bbl – $91.00/Bbl | |||
Crude Oil Basis Differential (Midland/Cushing) | ||||||
2014 | Swap | 1,500 Bbls/d | $0.55/Bbl | |||
Natural Gas Liquids | ||||||
Propane 2014 | Swap | 500 Bbls/d | $41.16/Bbl | |||
Natural Gasoline 2014 | Swap | 175 Bbls/d | $83.37/Bbl | |||
Natural Gas | ||||||
2014 | Swap | 360,000 MMBtu/month | $4.18/MMBtu | |||
2014(1) | Swap | 35,000 MMBtu/month | $4.29/MMBtu | |||
2015 | Swap | 200,000 MMBtu/month | $4.10/MMBtu | |||
2015 | Collar | 130,000 MMBtu/month | $4.00/MMBtu – $4.25/MMBtu | |||
| (1) | February 2014 — December 2014. |
Subsequent to December 31, 2013, we entered into a natural gas swap covering 160,000 MMBtu per month for March through December 2014 at a contract price of $4.40/MMBtu. We also entered into a natural gas collar covering 80,000 MMBtu per month for September 2014 through June 2015 at a floor price of $4.00/MMBtu and a ceiling price of $4.74/MMBtu, and a crude oil collar covering 1,500 Bbls per day for April 2014 through March 2015 at a floor price of $85.00/Bbl and a ceiling price of $95.30/Bbl. In January 2014, we early settled the crude oil basis differential swap for $0.7 million.
At December 31, 2013 and December 31, 2012, the fair value of our open derivative contracts was a liability of approximately $2.2 million and an asset of approximately $2.4 million, respectively.
JPMorgan Chase Bank, N.A. and KeyBank National Association are currently the only counterparties to our commodity derivatives positions. We are exposed to credit losses in the event of nonperformance by counterparties on our commodity derivatives positions. However, we do not anticipate nonperformance by the counterparties over the term of the commodity derivatives positions. JPMorgan is the administrative agent and a participant, and KeyBank is the documentation agent and a participant, in our revolving credit facility. The collateral for the outstanding borrowings under our revolving credit facility is used as collateral for our commodity derivatives.
Unrealized gains and losses, at fair value, are included on our consolidated balance sheets as current or non-current assets or liabilities based on the anticipated timing of cash settlements under the related contracts. Changes in the fair value of our commodity derivative contracts are recorded in earnings as they occur and included in other income (expense) on our consolidated statements of operations. We estimate the fair values of swap contracts based on the present value of the difference in exchange-quoted forward price curves and contractual settlement prices multiplied by notional quantities. We internally valued the option contracts using industry-standard option pricing models and observable market inputs. We use our internal valuations to determine the fair values of the contracts that are reflected on our consolidated balance sheets. Realized gains and losses are also included in other income (expense) on our consolidated statements of operations.
60
Table of Contents
For the years ended December 31, 2013, 2012 and 2011, we recognized an unrealized loss of $4.6 million, an unrealized gain of $3.9 million and an unrealized loss of $0.3 million from the change in the fair value of commodity derivatives, respectively. A hypothetical 10% increase in the NYMEX floating prices would have resulted in a $21.6 million decrease in the December 31, 2013, fair value recorded on our balance sheet and a corresponding increase to the loss on commodity derivatives in our statement of operations.
To estimate the fair value of our commodity derivatives positions, we use market data or assumptions that market participants would use in pricing the asset or liability, including assumptions about risk and the risks inherent in the inputs to the valuation technique. These inputs can be readily observable, market corroborated or generally unobservable. We primarily apply the market approach for recurring fair value measurements and attempt to use the best available information. We determine the fair value based upon the hierarchy that prioritizes the inputs used to measure fair value. The hierarchy gives the highest priority to unadjusted quoted prices in active markets for identical assets or liabilities (Level 1 measurement) and lowest priority to unobservable inputs (Level 3 measurement). The three levels of fair value hierarchy are as follows:
| • | Level 1 — Quoted prices are available in active markets for identical assets or liabilities as of the reporting date. At December 31, 2013, we had no Level 1 measurements. |
| • | Level 2 — Pricing inputs are other than quoted prices in active markets included in Level 1, which are either directly or indirectly observable as of the reporting date. Level 2 includes those financial instruments that are valued using models or other valuation methodologies. These models are primarily industry-standard models that consider various assumptions, including quoted forward prices for commodities, time value, volatility factors and current market and contractual prices for the underlying instruments, as well as other relevant economic measures. Our derivatives, which consist primarily of commodity swaps and collars, are valued using commodity market data which is derived by combining raw inputs and quantitative models and processes to generate forward curves. Where observable inputs are available, directly or indirectly, for substantially the full term of the asset or liability, the instrument is categorized in Level 2. At December 31, 2013, all of our commodity derivatives were valued using Level 2 measurements. |
| • | Level 3 — Pricing inputs include significant inputs that are generally less observable from objective sources. These inputs may be used with internally developed methodologies that result in management’s best estimate of fair value. At December 31, 2013, we had no Level 3 measurements. |
| ITEM 8. | FINANCIAL STATEMENTS AND SUPPLEMENTARY DATA |
Our consolidated financial statements and supplemental data are included in this report beginning on page F-1.
61
Table of Contents
| ITEM 9. | CHANGES IN AND DISAGREEMENTS WITH ACCOUNTANTS ON ACCOUNTING AND FINANCIAL DISCLOSURE |
We had no changes in, and no disagreements with, our accountants on accounting and financial disclosure.
| ITEM 9A. | CONTROLS AND PROCEDURES |
Disclosure Controls and Procedures
Our management, with the participation of our President and Chief Executive Officer and Chief Financial Officer, has evaluated the effectiveness of our disclosure controls and procedures (as defined in Rules 13a-15(e) and 15d-15(e) under the Exchange Act) as of December 31, 2013. Based on this evaluation, our President and Chief Executive Officer and Chief Financial Officer have concluded that, as of December 31, 2013, our disclosure controls and procedures were effective, in that they ensure that information required to be disclosed by us in the reports that we file or submit under the Exchange Act is (1) recorded, processed, summarized and reported within the time periods specified in the SEC’s rules and forms, and (2) accumulated and communicated to our management, including our President and Chief Executive Officer and Chief Financial Officer, as appropriate to allow timely decisions regarding required disclosure.
Internal Control over Financial Reporting
Management’s Annual Report on Internal Control Over Financial Reporting and Attestation Report of Registered Public Accounting Firm
Pursuant to Section 404 of the Sarbanes-Oxley Act of 2002, we have included a report of management’s assessment of the design and effectiveness of our internal controls as part of this annual report on Form 10-K for the fiscal year ended December 31, 2013. Hein & Associates LLP (“Hein”), our independent registered public accounting firm, also attested to, and reported on, our internal control over financial reporting. Management’s report and Hein’s attestation report are referenced on page F-1 under the captions “Management’s Report on Internal Control over Financial Reporting” and “Report of Independent Registered Public Accounting Firm — Internal Control over Financial Reporting” and are incorporated herein by reference.
Changes in Internal Control over Financial Reporting
No changes to our internal control over financial reporting occurred during the quarter ended December 31, 2013, that have materially affected, or are reasonably likely to materially affect, our internal control over financial reporting (as defined in Rules 13a-15(f) and 15d-15(f) under the Exchange Act).
| ITEM 9B. | OTHER INFORMATION |
None.
62
Table of Contents
PART III
| ITEM 10. | DIRECTORS, EXECUTIVE OFFICERS AND CORPORATE GOVERNANCE |
Information required under Item 10 of this report will be contained under the captions “Election of Directors — Directors,” “Executive Officers” and “Corporate Governance” to be provided in our proxy statement for our 2014 annual meeting of stockholders to be filed with the SEC on or before April 30, 2014, which are incorporated herein by reference. Additional information regarding our corporate governance guidelines as well as the complete texts of our Code of Conduct and the charters of our Audit Committee and our Compensation and Nominating Committee may be found on our website atwww.approachresources.com.
| ITEM 11. | EXECUTIVE COMPENSATION |
Information required by Item 11 of this report will be contained under the caption “Executive Compensation” in our definitive proxy statement for our 2014 annual meeting of stockholders to be filed with the SEC on or before April 30, 2014, which is incorporated herein by reference.
| ITEM 12. | SECURITY OWNERSHIP OF CERTAIN BENEFICIAL OWNERS AND MANAGEMENT AND RELATED STOCKHOLDER MATTERS |
Information required by Item 12 of this report will be contained under the caption “Stock Ownership Matters” in our definitive proxy statement for our 2014 annual meeting of stockholders to be filed with the SEC on or before April 30, 2014, which is incorporated herein by reference.
| ITEM 13. | CERTAIN RELATIONSHIPS AND RELATED TRANSACTIONS, AND DIRECTOR INDEPENDENCE |
Information required by Item 13 of this report will be contained under the captions “Certain Relationships and Related-Party Transactions” and “Corporate Governance — Board Independence” in our definitive proxy statement for our 2014 annual meeting of stockholders to be filed with the SEC on or before April 30, 2014, which are incorporated herein by reference.
| ITEM 14. | PRINCIPAL ACCOUNTING FEES AND SERVICES |
Information required by Item 14 of this report will be contained under the caption “Independent Registered Public Accountants” in our definitive proxy statement for our 2014 annual meeting of stockholders to be filed with the SEC on or before April 30, 2014, which is incorporated herein by reference.
63
Table of Contents
PART IV
| ITEM 15. | EXHIBITS, FINANCIAL STATEMENT SCHEDULES |
| (a) | Documents filed as part of this report |
(1) and (2) Financial Statements and Financial Statement Schedules.
See “Index to Consolidated Financial Statements” on page F-1.
(3) Exhibits.
See “Index to Exhibits” on page 72 for a description of the exhibits filed as part of this report.
64
Table of Contents
GLOSSARY AND SELECTED ABBREVIATIONS
The following is a description of the meanings of some of the oil and gas industry terms used in this report.
3-D seismic | (Three Dimensional Seismic Data) Geophysical data that depicts the subsurface strata in three dimensions. 3-D seismic data typically provides a more detailed and accurate interpretation of the subsurface strata than two dimensional seismic data. |
Basin | A large natural depression on the earth’s surface in which sediments generally brought by water accumulate. |
Bbl | One stock tank barrel, of 42 U.S. gallons liquid volume, used to reference oil, condensate or NGLs. |
Boe | Barrel of oil equivalent, determined using the ratio of six Mcf of gas to one Boe, and one Bbl of NGLs to one Boe. |
Btu or British Thermal Unit | The quantity of heat required to raise the temperature of one pound of water by one degree Fahrenheit. |
Completion | The installation of permanent equipment for production of oil or gas, or, in the case of a dry well, for reporting to the appropriate authority that the well has been abandoned. |
Developed acreage | The number of acres that are allocated or assignable to productive wells or wells that are capable of production. |
Developed oil and gas reserves | Has the meaning given to such term in Rule 4-10(a)(6) of Regulation S-X, as follows: |
| Developed oil and gas reserves are reserves of any category that can be expected to be recovered: |
| (i) | Through existing wells with existing equipment and operating methods or in which the cost of the required equipment is relatively minor compared to the cost of a new well; and |
| (ii) | Through installed extraction equipment and infrastructure operational at the time of the reserves estimate if the extraction is by means not involving a well. |
Development project | The means by which petroleum resources are brought to the status of economically producible. As examples, the development of a single reservoir or field, an incremental development in a producing field or the integrated development of a group of several fields and associated facilities with a common ownership may constitute a development project. |
Development well | A well drilled within the proved area of an oil or gas reservoir to the depth of a stratigraphic horizon known to be productive. |
Dry hole or well | An exploratory, development or extension well that proved to be incapable of producing either oil or gas in sufficient quantities to justify completion as an oil or gas well. |
65
Table of Contents
Dry hole costs | Costs incurred in drilling a well, assuming a well is not successful, including plugging and abandonment costs. |
Exploratory well | A well drilled to find a new field or to find a new reservoir in a field previously found to be productive of oil or gas in another reservoir. |
Extension well | A well drilled to extend the limits of a known reservoir. |
Farm-in | An arrangement in which the owner or lessee of mineral rights (the first party) assigns a working interest to an operator (the second party), the consideration for which is specified exploration and/or development activities. The first party retains an overriding royalty, working interest or other type of economic interest in the mineral production. The arrangement from the viewpoint of the second party is termed a “farm-in” arrangement. |
Field | An area consisting of either a single reservoir or multiple reservoirs, all grouped on or related to the same individual geological structural feature and/or stratigraphic condition. |
Field fuel | Gas consumed to operate field equipment (primarily for compressors and artificial lifts). |
Hydraulic fracturing | The technique designed to improve a well’s production rates by pumping a mixture of water and sand (in our case, over 99% by mass) and chemical additives (in our case, less than 1% by mass) into the formation and rupturing the rock, creating an artificial channel. |
Gross acres or gross wells | The total acres or wells, as the case may be, in which a working interest is owned. |
Lease operating expenses | The expenses of lifting oil or gas from a producing formation to the surface, and the transportation and marketing thereof, constituting part of the current operating expenses of a working interest, and also including labor, superintendence, supplies, repairs, short-lived assets, maintenance, allocated overhead costs and other expenses incidental to production, but excluding lease acquisition or drilling or completion expenses. |
LNG | Liquefied natural gas. |
MBbls | Thousand barrels of oil or other liquid hydrocarbons. |
MBoe | Thousand barrels of oil equivalent, determined using the ratio of six Mcf of gas to one Boe, and one Bbl of NGLs to one Boe. |
Mcf | Thousand cubic feet of natural gas. |
MMBoe | Million barrels of oil equivalent, determined using the ratio of six Mcf of gas to one Boe, and one Bbl of NGLs to one Boe. |
MMBtu | Million British thermal units. |
MMcf | Million cubic feet of gas. |
66
Table of Contents
Net acres or net wells | The sum of the fractional working interests owned in gross acres or wells, as the case may be. |
NGLs | Natural gas liquids. The portions of gas from a reservoir that are liquefied at the surface in separators, field facilities or gas processing plants. |
NYMEX | New York Mercantile Exchange. |
Play | A set of known or postulated oil and/or gas accumulations sharing similar geologic, geographic and temporal properties, such as source rock, migration pathways, timing, trapping mechanism and hydrocarbon type. |
Productive well | An exploratory, development or extension well that is not a dry well. |
Prospect | A specific geographic area which, based on supporting geological, geophysical or other data and also preliminary economic analysis using reasonably anticipated prices and costs, is deemed to have potential for the discovery of commercial hydrocarbons. |
Proved developed producing reserves | Proved developed oil and gas reserves that are expected to be recovered: |
| (i) | Through existing wells with existing equipment and operating methods or in which the cost of the required equipment is relatively minor compared to the cost of a new well; and |
| (ii) | Through installed extraction equipment and infrastructure operational at the time of the reserves estimate if the extraction is by means not involving a well. |
Proved oil and gas reserves | Has the meaning given to such term in Rule 4-10(a)(22) of Regulation S-X, as follows: |
| Proved oil and gas reserves are those quantities of oil and gas, which, by analysis of geoscience and engineering data, can be estimated with reasonable certainty to be economically producible — from a given date forward, from known reservoirs, and under existing economic conditions, operating methods, and government regulations — prior to the time at which contracts providing the right to operate expire, unless evidence indicates that renewal is reasonably certain, regardless of whether deterministic or probabilistic methods are used for the estimation. The project to extract the hydrocarbons must have commenced or the operator must be reasonably certain that it will commence the project within a reasonable time. |
| (i) | The area of the reservoir considered as proved includes: |
| (A) | The area identified by drilling and limited by fluid contacts, if any, and |
| (B) | Adjacent undrilled portions of the reservoir that can, with reasonable certainty, be judged to be continuous with it and to contain economically producible oil or gas on the basis of available geoscience and engineering data. |
67
Table of Contents
| (ii) | In the absence of data on fluid contacts, proved quantities in a reservoir are limited by the lowest known hydrocarbons (LKH) as seen in a well penetration unless geoscience, engineering, or performance data and reliable technology establishes a lower contact with reasonable certainty. |
| (iii) | Where direct observation from well penetrations has defined a highest known oil (HKO) elevation and the potential exists for an associated gas cap, proved oil reserves may be assigned in the structurally higher portions of the reservoir only if geoscience, engineering, or performance data and reliable technology establish the higher contact with reasonable certainty. |
| (iv) | Reserves which can be produced economically through application of improved recovery techniques (including, but not limited to, fluid injection) are included in the proved classification when: |
| (A) | Successful testing by a pilot project in an area of the reservoir with properties no more favorable than in the reservoir as a whole, the operation of an installed program in the reservoir or an analogous reservoir, or other evidence using reliable technology establishes the reasonable certainty of the engineering analysis on which the project or program was based; and |
| (B) | The project has been approved for development by all necessary parties and entities, including governmental entities. |
| (v) | Existing economic conditions include prices and costs at which economic producibility from a reservoir is to be determined. The price shall be the average price during the 12-month period prior to the ending date of the period covered by the report, determined as an unweighted arithmetic average of the first-day-of-the-month price for each month within such period, unless prices are defined by contractual arrangements, excluding escalations based upon future conditions. |
PV-10 | An estimate of the present value of the future net revenues from proved oil and gas reserves after deducting estimated production and ad valorem taxes, future capital costs and operating expenses, but before deducting any estimates of federal income taxes. The estimated future net revenues are discounted at an annual rate of 10% to determine their “present value.” The present value is shown to indicate the effect of time on the value of the revenue stream and should not be construed as being the fair market value of the properties. Estimates of PV-10 are made using oil and gas prices and operating costs at the date indicated and held constant for the life of the reserves. |
“Recompletion” or to “recomplete” a well | The addition of production from another interval or formation in anexisting wellbore. |
68
Table of Contents
Reserve life | This index is calculated by dividing year-end 2013 estimated proved reserves by 2013 production of 3.4 MBoe to estimate the number of years of remaining production. |
Reservoir | A porous and permeable underground formation containing a natural accumulation of producible oil and/or gas that is confined by impermeable rock or water barriers and is individual and separate from other reservoirs. |
Spacing | The distance between wells producing from the same reservoir. Spacing is expressed in terms of acres (e.g., 40-acre spacing) and is established by regulatory agencies. |
Standardized measure | The present value of estimated future net revenues to be generated from the production of proved reserves, determined in accordance with the rules and regulations of the SEC (using prices and costs in effect as of the period end date) without giving effect to non-property related expenses such as general and administrative expenses, debt service and future income tax expenses or to depletion, depreciation and amortization and discounted using an annual discount rate of 10%. Standardized measure does not give effect to derivative transactions. |
Tight gas sands | A sandstone formation with low permeability that produces natural gas with low flow rates for long periods of time. |
Unconventional resources or reserves | Natural gas or oil resources or reserves from (i) low-permeability sandstone and shale formations and (ii) coalbed methane. |
Undeveloped acreage | Lease acreage on which wells have not been drilled or completed to a point that would permit the production of commercial quantities of oil or gas regardless of whether such acreage contains proved reserves. |
Undeveloped oil and gas reserves | Has the meaning given to such term in Rule 4-10(a)(31) of Regulation S-X, which defines proved undeveloped reserves as follows: |
| Undeveloped oil and gas reserves are reserves of any category that are expected to be recovered from new wells on undrilled acreage, or from existing wells where a relatively major expenditure is required for recompletion. |
| (i) | Reserves on undrilled acreage shall be limited to those directly offsetting development spacing areas that are reasonably certain of production when drilled, unless evidence using reliable technology exists that establishes reasonable certainty of economic producibility at greater distances. |
| (ii) | Undrilled locations can be classified as having undeveloped reserves only if a development plan has been adopted indicating that they are scheduled to be drilled within five years, unless the specific circumstances justify a longer time. |
69
Table of Contents
| (iii) | Under no circumstances shall estimates for undeveloped reserves be attributable to any acreage for which an application of fluid injection or other improved recovery technique is contemplated, unless such techniques have been proved effective by actual projects in the same reservoir, an analogous reservoir or by other evidence using reliable technology establishing reasonable certainty. |
Working interest | The operating interest that gives the owner the right to drill, produce and conduct operating activities on the property and receive a share of production. |
Workover | Operations on a producing well to restore or increase production. |
/d | “Per day” when used with volumetric units or dollars. |
70
Table of Contents
Pursuant to the requirements of Section 13 or 15(d) of the Securities Exchange Act of 1934, the registrant has duly caused this report to be signed on its behalf by the undersigned, thereunto duly authorized.
| APPROACH RESOURCES INC. | ||
| By: | /s/ J. Ross Craft | |
| J. Ross Craft | ||
| President and Chief Executive Officer | ||
Date: February 25, 2014
Pursuant to the requirements of the Securities Exchange Act of 1934, this report has been signed below by the following persons on behalf of the registrant and in the capacities indicated and on February 25, 2014.
Signature | Title | |
/s/ J. Ross Craft | President, Chief Executive Officer and Director (Principal Executive Officer) | |
J. Ross Craft | ||
/s/ Sergei Krylov | Executive Vice President and Chief Financial Officer (Principal Financial Officer) | |
Sergei Krylov | ||
/s/ Uma L. Datla | Director of Financial Reporting (Principal Accounting Officer) | |
Uma L. Datla | ||
/s/ Bryan H. Lawrence | Director and Chairman of the Board of Directors | |
Bryan H. Lawrence | ||
/s/ Alan D. Bell | Director | |
Alan D. Bell | ||
/s/ James H. Brandi | Director | |
James H. Brandi | ||
/s/ James C. Crain | Director | |
James C. Crain | ||
/s/ Vean J. Gregg III | Director | |
Vean J. Gregg III | ||
/s/ Sheldon B. Lubar | Director | |
Sheldon B. Lubar | ||
/s/ Christopher J. Whyte | Director | |
Christopher J. Whyte | ||
71
Table of Contents
INDEX TO CONSOLIDATED FINANCIAL STATEMENTS OF APPROACH RESOURCES INC.
F-1
Table of Contents
MANAGEMENT’S REPORT ON INTERNAL CONTROL OVER FINANCIAL REPORTING
Management is responsible for establishing and maintaining adequate internal control over financial reporting (as defined in Rule 13a-15(f) under the Securities Exchange Act of 1934). Our internal control over financial reporting is designed to provide reasonable assurance to management and our board of directors regarding the preparation and fair presentation of published financial statements. Because of its inherent limitations, internal control over financial reporting may not prevent or detect misstatements. Therefore, even those systems determined to be effective can provide only reasonable assurance with respect to financial statement preparation and presentation. Management assessed the effectiveness of our internal control over financial reporting as of December 31, 2013. In making this assessment, management used the criteria set forth by the Committee of Sponsoring Organizations of the Treadway Commission (COSO) inInternal Control — Integrated Frameworkin 1992. Based on our assessment, we believe that, as of December 31, 2013, our internal control over financial reporting is effective based on those criteria.
| By: | /s/ J. Ross Craft | By: | /s/ Sergei Krylov | |||||
| J. Ross Craft | Sergei Krylov | |||||||
| President and Chief Executive Officer | Executive Vice President and Chief Financial Officer | |||||||
Fort Worth, Texas
February 25, 2014
F-2
Table of Contents
REPORT OF INDEPENDENT REGISTERED PUBLIC ACCOUNTING FIRM
To the Board of Directors and Stockholders
Approach Resources Inc.
We have audited Approach Resources Inc. and subsidiaries’ (collectively, the “Company”) internal control over financial reporting as of December 31, 2013, based on criteria established in Internal Control — Integrated Framework issued by the Committee of Sponsoring Organizations of the Treadway Commission in 1992. The Company’s management is responsible for maintaining effective internal control over financial reporting and for its assessment of the effectiveness of internal control over financial reporting included in the accompanying Management’s Report on Internal Control over Financial Reporting. Our responsibility is to express an opinion on the Company’s internal control over financial reporting based on our audit.
We conducted our audit in accordance with the standards of the Public Company Accounting Oversight Board (United States). Those standards require that we plan and perform the audit to obtain reasonable assurance about whether effective internal control over financial reporting was maintained in all material respects. Our audit included obtaining an understanding of internal control over financial reporting, assessing the risk that a material weakness exists, and testing and evaluating the design and operating effectiveness of internal control based on the assessed risk. Our audit also included performing such other procedures as we considered necessary in the circumstances. We believe that our audit provides a reasonable basis for our opinion.
A company’s internal control over financial reporting is a process designed to provide reasonable assurance regarding the reliability of financial reporting and the preparation of financial statements for external purposes in accordance with generally accepted accounting principles. A company’s internal control over financial reporting includes those policies and procedures that (a) pertain to the maintenance of records that, in reasonable detail, accurately and fairly reflect the transactions and dispositions of the assets of the company; (b) provide reasonable assurance that transactions are recorded as necessary to permit preparation of financial statements in accordance with generally accepted accounting principles, and that receipts and expenditures of the company are being made only in accordance with authorizations of management and directors of the company; and (c) provide reasonable assurance regarding prevention or timely detection of unauthorized acquisition, use, or disposition of the company’s assets that could have a material effect on the financial statements.
Because of its inherent limitations, internal control over financial reporting may not prevent or detect misstatements. Also, projections of any evaluation of effectiveness to future periods are subject to the risk that controls may become inadequate because of changes in conditions, or that the degree of compliance with the policies or procedures may deteriorate.
In our opinion, the Company maintained, in all material respects, effective internal control over financial reporting as of December 31, 2013, based on criteria established in Internal Control — Integrated Framework issued by the Committee of Sponsoring Organizations of the Treadway Commission in 1992.
We have also audited, in accordance with the standards of the Public Company Accounting Oversight Board (United States), the consolidated balance sheets of Approach Resources Inc. and subsidiaries as of December 31, 2013 and 2012, and the related consolidated statements of operations, changes in stockholders’ equity, and cash flows for each of the three years in the period ended December 31, 2013 and our report dated February 25, 2014 expressed an unqualified opinion.
| /s/HEIN & ASSOCIATES LLP |
| Dallas, Texas |
| February 25, 2014 |
F-3
Table of Contents
REPORT OF INDEPENDENT REGISTERED PUBLIC ACCOUNTING FIRM
To the Board of Directors and Stockholders
Approach Resources Inc.
We have audited the accompanying consolidated balance sheets of Approach Resources Inc. and subsidiaries (collectively, the “Company”) as of December 31, 2013 and 2012, and the related consolidated statements of operations, changes in stockholders’ equity, and cash flows for each of the three years in the period ended December 31, 2013. These financial statements are the responsibility of the Company’s management. Our responsibility is to express an opinion on these financial statements based on our audits.
We conducted our audits in accordance with the standards of the Public Company Accounting Oversight Board (United States). Those standards require that we plan and perform the audit to obtain reasonable assurance about whether the financial statements are free of material misstatement. An audit includes examining, on a test basis, evidence supporting the amounts and disclosures in the financial statements. An audit also includes assessing the accounting principles used and significant estimates made by management, as well as evaluating the overall financial statement presentation. We believe that our audits provide a reasonable basis for our opinion.
In our opinion, the consolidated financial statements referred to above present fairly, in all material respects, the financial position of Approach Resources Inc. and subsidiaries as of December 31, 2013 and 2012, and the results of their operations and their cash flows for each of the three years in the period ended December 31, 2013, in conformity with accounting principles generally accepted in the United States of America.
We have also audited, in accordance with standards of the Public Company Accounting Oversight Board (United States), the Company’s internal control over financial reporting as of December 31, 2013, based on criteria established in Internal Control — Integrated Framework issued by the Committee of Sponsoring Organizations of the Treadway Commission in 1992, and our report dated February 25, 2014 expressed an unqualified opinion on the effectiveness of the Company’s internal control over financial reporting.
| /s/HEIN & ASSOCIATES LLP |
| Dallas, Texas |
| February 25, 2014 |
F-4
Table of Contents
Approach Resources Inc. and Subsidiaries
(In thousands, except shares and per-share amounts)
| December 31, | ||||||||
| 2013 | 2012 | |||||||
| ASSETS | ||||||||
CURRENT ASSETS: | ||||||||
Cash and cash equivalents | $ | 58,761 | $ | 767 | ||||
Restricted cash | 7,350 | — | ||||||
Accounts receivable: | ||||||||
Joint interest owners | 158 | 215 | ||||||
Oil, NGL and gas sales | 22,871 | 12,575 | ||||||
Unrealized gain on commodity derivatives | — | 1,552 | ||||||
Prepaid expenses and other current assets | 592 | 547 | ||||||
Deferred income taxes — current | 681 | — | ||||||
|
|
|
| |||||
Total current assets | 90,413 | 15,656 | ||||||
PROPERTIES AND EQUIPMENT: | ||||||||
Oil and gas properties, at cost, using the successful efforts method of accounting | 1,320,195 | 1,025,440 | ||||||
Furniture, fixtures and equipment | 2,537 | 2,108 | ||||||
|
|
|
| |||||
| 1,322,732 | 1,027,548 | |||||||
Less accumulated depletion, depreciation and amortization | (275,702 | ) | (199,081 | ) | ||||
|
|
|
| |||||
Net properties and equipment | 1,047,030 | 828,467 | ||||||
Equity method investment | — | 9,892 | ||||||
Unrealized gain on commodity derivatives | — | 881 | ||||||
Other assets | 8,041 | 843 | ||||||
|
|
|
| |||||
Total assets | $ | 1,145,484 | $ | 855,739 | ||||
|
|
|
| |||||
| LIABILITIES AND STOCKHOLDERS’ EQUITY | ||||||||
CURRENT LIABILITIES: | ||||||||
Accounts payable | $ | 38,575 | $ | 24,916 | ||||
Oil, NGL and gas sales payable | 6,101 | 4,960 | ||||||
Deferred income taxes — current | — | 531 | ||||||
Accrued liabilities | 37,918 | 29,840 | ||||||
Unrealized loss on commodity derivatives | 1,847 | — | ||||||
|
|
|
| |||||
Total current liabilities | 84,441 | 60,247 | ||||||
NON-CURRENT LIABILITIES: | ||||||||
Senior secured credit facility | — | 106,000 | ||||||
Senior notes | 250,000 | — | ||||||
Deferred income taxes | 91,883 | 48,593 | ||||||
Unrealized loss on commodity derivatives | 315 | — | ||||||
Asset retirement obligations | 8,350 | 7,431 | ||||||
|
|
|
| |||||
Total liabilities | 434,989 | 222,271 | ||||||
COMMITMENTS AND CONTINGENCIES(Note 8) | ||||||||
STOCKHOLDERS’ EQUITY : | ||||||||
Preferred stock, $0.01 par value, 10,000,000 shares authorized none outstanding | — | — | ||||||
Common stock, $0.01 par value, 90,000,000 shares authorized, 39,047,699 and 38,829,368 issued and outstanding, respectively | 390 | 388 | ||||||
Additional paid-in capital | 565,237 | 560,468 | ||||||
Retained earnings | 144,868 | 72,612 | ||||||
|
|
|
| |||||
Total stockholders’ equity | 710,495 | 633,468 | ||||||
|
|
|
| |||||
Total liabilities and stockholders’ equity | $ | 1,145,484 | $ | 855,739 | ||||
|
|
|
| |||||
See accompanying notes to these consolidated financial statements.
F-5
Table of Contents
Approach Resources Inc. and Subsidiaries
Consolidated Statements of Operations
(In thousands, except shares and per-share amounts)
| Years Ended December 31, | ||||||||||||
| 2013 | 2012 | 2011 | ||||||||||
REVENUES: | ||||||||||||
Oil, NGL and gas sales | $ | 181,302 | $ | 128,892 | $ | 108,387 | ||||||
EXPENSES: | ||||||||||||
Lease operating | 19,152 | 19,002 | 10,687 | |||||||||
Production and ad valorem taxes | 12,840 | 9,255 | 8,447 | |||||||||
Exploration | 2,238 | 4,550 | 9,546 | |||||||||
Impairment | — | — | 18,476 | |||||||||
General and administrative | 26,524 | 24,903 | 17,900 | |||||||||
Depletion, depreciation and amortization | 76,956 | 60,381 | 32,475 | |||||||||
|
|
|
|
|
| |||||||
Total expenses | 137,710 | 118,091 | 97,531 | |||||||||
|
|
|
|
|
| |||||||
OPERATING INCOME | 43,592 | 10,801 | 10,856 | |||||||||
OTHER: | ||||||||||||
Interest expense, net | (14,084 | ) | (4,737 | ) | (3,402 | ) | ||||||
Equity in earnings (losses) of investee | 156 | (108 | ) | — | ||||||||
Gain on sale of equity method investment | 90,743 | — | — | |||||||||
Realized (loss) gain on commodity derivatives | (1,048 | ) | (108 | ) | 3,375 | |||||||
Unrealized (loss) gain on commodity derivatives | (4,596 | ) | 3,874 | (347 | ) | |||||||
Gain on sale of oil and gas properties, net of foreign currency transaction loss | — | — | 248 | |||||||||
|
|
|
|
|
| |||||||
INCOME BEFORE INCOME TAX PROVISION | 114,763 | 9,722 | 10,730 | |||||||||
INCOME TAX PROVISION: | ||||||||||||
Current | 429 | — | — | |||||||||
Deferred | 42,078 | 3,338 | 3,488 | |||||||||
|
|
|
|
|
| |||||||
NET INCOME | $ | 72,256 | $ | 6,384 | $ | 7,242 | ||||||
|
|
|
|
|
| |||||||
EARNINGS PER SHARE: | ||||||||||||
Basic | $ | 1.85 | $ | 0.18 | $ | 0.25 | ||||||
|
|
|
|
|
| |||||||
Diluted | $ | 1.85 | $ | 0.18 | $ | 0.25 | ||||||
|
|
|
|
|
| |||||||
WEIGHTED AVERAGE SHARES OUTSTANDING: | ||||||||||||
Basic | 38,997,815 | 34,965,182 | 28,930,792 | |||||||||
Diluted | 39,019,149 | 35,030,323 | 29,158,598 | |||||||||
See accompanying notes to these consolidated financial statements.
F-6
Table of Contents
Approach Resources Inc. and Subsidiaries
Consolidated Statements of Changes in Stockholders’ Equity
for the Years Ended December 31, 2011, 2012 and 2013
(In thousands, except shares and per-share amounts)
| Additional Paid-in Capital | Retained Earnings | Accumulated Other Comprehensive | Total | |||||||||||||||||||||
| Common Stock | ||||||||||||||||||||||||
| Shares | Amount | Income (Loss) | ||||||||||||||||||||||
BALANCES, January 1, 2011 | 28,226,890 | 282 | 273,912 | 58,986 | (234 | ) | $ | 332,946 | ||||||||||||||||
Issuance of common stock upon exercise of options | 74,241 | 1 | 1,008 | — | — | 1,009 | ||||||||||||||||||
Issuance of common stock, net of issuance costs | 4,600,000 | 46 | 122,104 | — | — | 122,150 | ||||||||||||||||||
Issuance of common shares to directors for compensation | 18,446 | — | 420 | — | — | 420 | ||||||||||||||||||
Restricted stock issuance, net of cancellations | 205,475 | 2 | (2 | ) | — | — | — | |||||||||||||||||
Share-based compensation expense | — | — | 4,263 | — | — | 4,263 | ||||||||||||||||||
Surrender of restricted shares for payment of income taxes | (31,458 | ) | — | (815 | ) | — | — | (815 | ) | |||||||||||||||
Net income | — | — | — | 7,242 | — | 7,242 | ||||||||||||||||||
Foreign currency transaction and translation adjustments, net of related income tax of $85 | — | — | — | — | 234 | 234 | ||||||||||||||||||
|
|
|
|
|
|
|
|
|
|
|
| |||||||||||||
BALANCES, December 31, 2011 | 33,093,594 | $ | 331 | $ | 400,890 | $ | 66,228 | $ | — | $ | 467,449 | |||||||||||||
|
|
|
|
|
|
|
|
|
|
|
| |||||||||||||
Issuance of common stock upon exercise of options | 216,822 | 2 | 796 | — | — | 798 | ||||||||||||||||||
Issuance of common stock, net of issuance costs | 5,325,000 | 53 | 154,364 | — | — | 154,417 | ||||||||||||||||||
Issuance of common shares to directors for compensation | 16,935 | — | 535 | — | — | 535 | ||||||||||||||||||
Restricted stock issuance, net of cancellations | 293,382 | 2 | (2 | ) | — | — | — | |||||||||||||||||
Share-based compensation expense | — | — | 6,930 | — | — | 6,930 | ||||||||||||||||||
Surrender of restricted shares for payment of income taxes | (116,365 | ) | — | (3,045 | ) | — | — | (3,045 | ) | |||||||||||||||
Net income | — | — | — | 6,384 | — | 6,384 | ||||||||||||||||||
|
|
|
|
|
|
|
|
|
|
|
| |||||||||||||
BALANCES, December 31, 2012 | 38,829,368 | $ | 388 | $ | 560,468 | $ | 72,612 | $ | — | $ | 633,468 | |||||||||||||
|
|
|
|
|
|
|
|
|
|
|
| |||||||||||||
Issuance of common stock upon exercise of options | 3,750 | — | 58 | — | — | 58 | ||||||||||||||||||
Issuance of common shares to directors for compensation | 24,317 | — | 630 | — | — | 630 | ||||||||||||||||||
Restricted stock issuance, net of cancellations | 245,262 | 2 | (2 | ) | — | — | — | |||||||||||||||||
Share-based compensation expense | — | — | 5,271 | — | — | 5,271 | ||||||||||||||||||
Surrender of restricted shares for payment of income taxes | (54,998 | ) | — | (1,188 | ) | — | — | (1,188 | ) | |||||||||||||||
Net income | — | — | — | 72,256 | — | 72,256 | ||||||||||||||||||
|
|
|
|
|
|
|
|
|
|
|
| |||||||||||||
BALANCES, December 31, 2013 | 39,047,699 | $ | 390 | $ | 565,237 | $ | 144,868 | $ | — | $ | 710,495 | |||||||||||||
|
|
|
|
|
|
|
|
|
|
|
| |||||||||||||
See accompanying notes to these consolidated financial statements.
F-7
Table of Contents
Approach Resources Inc. and Subsidiaries
Consolidated Statements of Cash Flows
(In thousands, except shares and per-share amounts)
| For the Years Ended December 31, | ||||||||||||
| 2013 | 2012 | 2011 | ||||||||||
OPERATING ACTIVITIES: | ||||||||||||
Net income | $ | 72,256 | $ | 6,384 | $ | 7,242 | ||||||
Adjustments to reconcile net income to net cash provided by operating activities: | ||||||||||||
Depletion, depreciation and amortization | 76,956 | 60,381 | 32,475 | |||||||||
Amortization of loan origination fees | 1,048 | — | — | |||||||||
Unrealized loss (gain) on commodity derivatives | 4,596 | (3,874 | ) | 347 | ||||||||
Impairment | — | — | 18,476 | |||||||||
Gain on sale of oil and gas properties, net of foreign currency transaction loss | — | — | (248 | ) | ||||||||
Gain on sale of equity method investment | (90,743 | ) | — | — | ||||||||
Exploration expense | 2,238 | 4,550 | 9,546 | |||||||||
Share-based compensation expense | 5,901 | 7,465 | 4,683 | |||||||||
Deferred income taxes | 42,078 | 3,338 | 3,488 | |||||||||
Equity in (earnings) losses of investee | (156 | ) | 108 | — | ||||||||
Changes in operating assets and liabilities: | ||||||||||||
Accounts receivable | (10,239 | ) | (2,550 | ) | 6,168 | |||||||
Prepaid expenses and other current assets | (45 | ) | 296 | 378 | ||||||||
Accounts payable | 12,471 | 9,271 | (151 | ) | ||||||||
Oil, NGL and gas sales payable | 1,141 | 212 | (786 | ) | ||||||||
Accrued liabilities | 8,078 | 5,004 | 14,152 | |||||||||
|
|
|
|
|
| |||||||
Cash provided by operating activities | 125,580 | 90,585 | 95,770 | |||||||||
INVESTING ACTIVITIES: | ||||||||||||
Additions to oil and gas properties | (296,409 | ) | (296,927 | ) | (284,574 | ) | ||||||
Proceeds from sale of equity method investment, net of contributions | 100,791 | (10,000 | ) | — | ||||||||
Proceeds from gain on sale of oil and gas properties, net | — | — | 360 | |||||||||
Change in restricted cash | (7,350 | ) | — | — | ||||||||
Additions to furniture, fixtures and equipment, net | (429 | ) | (487 | ) | (544 | ) | ||||||
|
|
|
|
|
| |||||||
Cash used in investing activities | (203,397 | ) | (307,414 | ) | (284,758 | ) | ||||||
FINANCING ACTIVITIES: | ||||||||||||
Borrowings under credit facility | 129,950 | 304,600 | 246,800 | |||||||||
Repayment of amounts outstanding under credit facility | (235,950 | ) | (242,400 | ) | (203,000 | ) | ||||||
Proceeds from issuance of senior notes | 242,824 | — | — | |||||||||
Proceeds from issuance of common stock, net offering costs | — | 154,417 | 122,150 | |||||||||
Proceeds from issuance of common stock upon exercise of stock options | 58 | 798 | 1,009 | |||||||||
Loan origination fees | (1,071 | ) | (120 | ) | (1,116 | ) | ||||||
|
|
|
|
|
| |||||||
Cash provided by financing activities | 135,811 | 217,295 | 165,843 | |||||||||
|
|
|
|
|
| |||||||
CHANGE IN CASH AND CASH EQUIVALENTS | 57,994 | 466 | (23,145 | ) | ||||||||
EFFECT OF FOREIGN CURRENCY TRANSLATION ON CASH AND CASH EQUIVALENTS | — | — | (19 | ) | ||||||||
CASH AND CASH EQUIVALENTS, beginning of year | 767 | 301 | 23,465 | |||||||||
|
|
|
|
|
| |||||||
CASH AND CASH EQUIVALENTS, end of year | $ | 58,761 | $ | 767 | $ | 301 | ||||||
|
|
|
|
|
| |||||||
SUPPLEMENTAL DISCLOSURE OF CASH FLOW INFORMATION: | ||||||||||||
Cash paid for interest | $ | 12,392 | $ | 4,192 | $ | 2,856 | ||||||
|
|
|
|
|
| |||||||
SUPPLEMENTAL DISCLOSURE OF NON-CASH TRANSACTION: | ||||||||||||
Acquisition of oil and gas properties | $ | 132 | $ | — | $ | 547 | ||||||
|
|
|
|
|
| |||||||
Asset retirement obligations capitalized | $ | 584 | $ | 409 | $ | 1,190 | ||||||
|
|
|
|
|
| |||||||
See accompanying notes to these consolidated financial statements.
F-8
Table of Contents
Approach Resources Inc. and Subsidiaries
Notes to Consolidated Financial Statements
| 1. | Summary of Significant Accounting Policies |
Organization and Nature of Operations
Approach Resources Inc. (“Approach,” the “Company,” “we,” “us” or “our”) is an independent energy company engaged in the exploration, development, production and acquisition of oil and gas properties. We focus on finding and developing oil and natural gas reserves in oil shale and tight gas sands. Our properties are primarily located in the Permian Basin in West Texas. We also own interests in the East Texas Basin.
Consolidation, Basis of Presentation and Significant Estimates
The accompanying consolidated financial statements have been prepared in accordance with accounting principles generally accepted in the United States of America and include the accounts of the Company and its wholly owned subsidiaries. Intercompany accounts and transactions are eliminated. In preparing the accompanying financial statements, management has made certain estimates and assumptions that affect reported amounts in the financial statements and disclosures of contingencies. Actual results may differ from those estimates. Significant assumptions are required in the valuation of proved oil and natural gas reserves, which affect our estimate of depletion expense as well as our impairment analyses. Significant assumptions also are required in our estimation of accrued liabilities, commodity derivatives, income tax provision, share-based compensation and asset retirement obligations. It is at least reasonably possible these estimates could be revised in the near term, and these revisions could be material. Certain prior-year amounts have been reclassified to conform to current-year presentation. These classifications have no impact on the net income or loss reported.
Cash and Cash Equivalents
We consider all highly liquid debt instruments purchased with an original maturity of three months or less to be cash equivalents. At times, the amount of cash and cash equivalents on deposit in financial institutions exceeds federally insured limits. We monitor the soundness of the financial institutions and believe the Company’s risk is negligible.
Restricted Cash
The restricted cash on our balance sheet consists of $7.4 million in proceeds from the sale of our equity method investment that are restricted pursuant to an escrow agreement. The escrow termination date is June 1, 2014.
Oil and Gas Properties
Capitalized Costs. Our oil and gas properties comprised the following (in thousands):
| December 31, | ||||||||
| 2013 | 2012 | |||||||
Mineral interests in properties: | ||||||||
Unproved leasehold costs | $ | 47,096 | $ | 49,148 | ||||
Proved leasehold costs | 40,620 | 32,252 | ||||||
Wells and related equipment and facilities | 1,195,556 | 908,456 | ||||||
Support equipment | 10,773 | 6,753 | ||||||
Uncompleted wells, equipment and facilities | 26,150 | 28,831 | ||||||
|
|
|
| |||||
Total costs | 1,320,195 | 1,025,440 | ||||||
Less accumulated depreciation, depletion and amortization | (273,915 | ) | (197,751 | ) | ||||
|
|
|
| |||||
Net capitalized costs | $ | 1,046,280 | $ | 827,689 | ||||
|
|
|
| |||||
F-9
Table of Contents
Approach Resources Inc. and Subsidiaries
Notes to Consolidated Financial Statements — (continued)
We follow the successful efforts method of accounting for our oil and gas producing activities. Costs to acquire mineral interests in oil and gas properties and to drill and equip development wells and related asset retirement costs are capitalized. Costs to drill exploratory wells are capitalized pending determination of whether the wells have proved reserves. If we determine that the wells do not have proved reserves, the costs are charged to expense. There were no exploratory wells capitalized, pending determination of whether the wells have proved reserves, at December 31, 2013 or 2012. Geological and geophysical costs, including seismic studies are charged to exploration expense as incurred. We capitalize interest on expenditures for significant exploration and development projects that last more than six months while activities are in progress to bring the assets to their intended use and while these expenditures are excluded from our depletable base. Through December 31, 2013, we have capitalized no interest costs because our individual wells and infrastructure projects are generally developed in less than six months. Costs incurred to maintain wells and related equipment are charged to expense as incurred.
On the sale or retirement of a complete unit of a proved property, the cost and related accumulated depreciation, depletion and amortization are eliminated from the property accounts, and the resulting gain or loss is recognized. On the retirement or sale of a partial unit of proved property, the cost is charged to accumulated depreciation, depletion and amortization with no gain or loss recognized in income.
Capitalized amounts attributable to proved oil and gas properties are depleted by the unit-of-production method over proved reserves using the unit conversion ratio of six Mcf of gas to one barrel of oil equivalent (“Boe”), and one barrel of NGLs to one Boe. The ratios of six Mcf of natural gas to one Boe and one barrel of NGLs to one Boe do not assume price equivalency and, given price differentials, the price for a Boe for natural gas may differ significantly from the price for a barrel of oil. Depreciation, depletion and amortization expense for oil and gas producing property and related equipment was $76.5 million, $60 million and $32.1 million for the years ended December 31, 2013, 2012 and 2011, respectively.
Capitalized costs related to proved oil and gas properties, including wells and related equipment and facilities, are evaluated for impairment based on an analysis of undiscounted future net cash flows in accordance with ASC 360,Accounting for the Impairment or Disposal of Long-Lived Assets. If undiscounted cash flows are insufficient to recover the net capitalized costs related to proved properties, then we recognize an impairment charge in income from operations equal to the difference between the net capitalized costs related to proved properties and their estimated fair values based on the present value of the related future net cash flows. For 2011, we recorded an impairment expense of $15.2 million, which was attributable to our oil and gas properties in the East Texas Basin. At December 31, 2011, we had $2.7 million recorded for the East Texas Basin, which was the estimated fair value at December 31, 2011. We noted no impairment of our proved properties based on our analysis for the years ended December 31, 2013 and 2012.
Unproved oil and gas properties that are individually significant are periodically assessed for impairment of value, and a loss is recognized at the time of impairment by providing an impairment allowance. For 2011, we recorded an impairment expense of $3.3 million, related to all of our remaining carrying costs associated with our unproved properties in Northern New Mexico.
On the sale of an entire interest in an unproved property for cash or cash equivalent, gain or loss on the sale is recognized, taking into consideration the amount of any recorded impairment if the property had been assessed individually. If a partial interest in an unproved property is sold, the amount received is treated as a reduction of the cost of the interest retained. During 2011, we sold our working interest in Northeast British Columbia for net proceeds of $360,000. The gain on the sale of this interest, net of foreign currency, was $248,000 and is included under “Other” on the consolidated statement of operations for the year ended December 31, 2011.
F-10
Table of Contents
Approach Resources Inc. and Subsidiaries
Notes to Consolidated Financial Statements — (continued)
Other Property
Furniture, fixtures and equipment are carried at cost. Depreciation of furniture, fixtures and equipment is provided using the straight-line method over estimated useful lives ranging from three to ten years. Gain or loss on retirement or sale or other disposition of assets is included in income in the period of disposition. Depreciation expense for other property and equipment was $502,000, $333,000 and $372,000 for the years ended December 31, 2013, 2012 and 2011, respectively.
Equity Method Investment
For investments in which we have the ability to exercise significant influence but do not have control, we follow the equity method of accounting. In September 2012, we entered into a joint venture to build an oil pipeline in Crockett and Reagan Counties, Texas, which is used to transport our oil to market. In 2013, we contributed $8.3 million to the equity joint venture for pipeline and facilities construction prior to its sale in October 2013.
Other Assets
Other assets consist of deferred costs associated with the issuance of the $250 million principal amount of 7% Senior Notes due 2021 (the “Senior Notes”) and the revolving credit facility. These costs are amortized over the life of the Senior Notes and the life of the revolving credit facility on a straight-line basis, which approximates the amortization that would be calculated using an effective interest rate method.
Financial Instruments
The carrying amounts of financial instruments including cash and cash equivalents, accounts receivable, accounts payable and accrued liabilities approximate fair value, as of December 31, 2013 and 2012. See Note 7 for commodity derivative and Senior Notes fair value disclosures.
Income Taxes
We are subject to U.S. federal income taxes along with state income taxes in Texas. When tax returns are filed, it is highly certain that some positions taken would be sustained upon examination by the taxing authorities, while others are subject to uncertainty about the merits of the position taken or the amount of the position that would be ultimately sustained. The benefit of a tax position is recognized in the financial statements in the period during which, based on all available evidence, management believes it is more likely than not that the position will be sustained upon examination, including the resolution of appeals or litigation processes, if any. Tax positions taken are not offset or aggregated with other positions. Tax positions that meet the more-likely-than-not recognition threshold are measured as the largest amount of tax benefit that is more than 50% likely of being realized upon settlement with the applicable taxing authority. The portion of the benefits associated with tax positions taken that exceeds the amount measured as described above is reflected as a liability for unrecognized tax benefits in the accompanying balance sheet along with any associated interest and penalties that would be payable to the taxing authorities upon examination. Interest and penalties associated with unrecognized tax benefits are classified as additional income taxes in the consolidated statement of income.
Based on our analysis, we did not have any uncertain tax positions as of December 31, 2013 or 2012. The Company’s income tax returns are subject to examination by the relevant taxing authorities as follows: U.S. Federal income tax returns for tax years 2010 and forward, Texas income and margin tax returns for tax years
F-11
Table of Contents
Approach Resources Inc. and Subsidiaries
Notes to Consolidated Financial Statements — (continued)
2010 and forward, New Mexico income tax returns for years 2010 and forward, and Kentucky income tax returns for the years 2010 and forward. There are currently no income tax examinations underway for these jurisdictions.
Deferred tax assets and liabilities are recognized for the estimated future tax consequences attributable to the differences between the financial statement carrying amounts of existing assets and liabilities and their respective tax bases. Deferred tax assets and liabilities are measured using the tax rate in effect for the year in which those temporary differences are expected to be recovered or settled. The effect of a change in tax rates on deferred tax assets and liabilities is recognized in income in the year of the enacted tax rate change.
Derivative Activity
We record our open derivative instruments at fair value on our consolidated balance sheets as either unrealized gains or losses on commodity derivatives. We record changes in such fair value in earnings on our consolidated statements of operations under the caption entitled “unrealized (loss) gain on commodity derivatives.”
Although we have not designated our derivative instruments as cash-flow hedges, we use those instruments to reduce our exposure to fluctuations in commodity prices related to our natural gas and oil production. Unrealized gains and losses, at fair value, are included on our consolidated balance sheets as current or non-current assets or liabilities based on the anticipated timing of cash settlements under the related contracts. Changes in the fair value of our commodity derivative contracts are recorded in earnings as they occur and included in other income (expense) on our consolidated statements of operations. Realized gains and losses are also included in other income (expense) on our consolidated statements of operations.
Accrued Liabilities
The following is a summary of our accrued liabilities at December 31, 2013 and 2012 (in thousands):
| 2013 | 2012 | |||||||
Capital expenditures accrual | $ | 30,606 | $ | 25,526 | ||||
Operating expenses and other | 7,312 | 4,314 | ||||||
|
|
|
| |||||
Total | $ | 37,918 | $ | 29,840 | ||||
|
|
|
| |||||
Asset Retirement Obligations
Our asset retirement obligations relate to future plugging and abandonment expenses on oil and gas properties. Based on the expected timing of payments, the full asset retirement obligation is classified as non-current. There were no significant changes to the asset retirement obligations for the years ended December 31, 2013, 2012 and 2011.
Foreign Currency Translation
The functional currency of the country in which we currently operate is the U.S. dollar in the United States. For the year ended December 31, 2011, the functional currency of our Canadian subsidiary was the Canadian dollar. Assets and liabilities of our Canadian subsidiary that are denominated in currencies other than the Canadian dollar are translated at current exchange rates. Gains and losses resulting from such translations, along with gains or losses realized from transactions denominated in currencies other than the Canadian dollar are included in operating results on our statements of operations. For purposes of consolidation, we translate the assets and liabilities of our Canadian subsidiary into U.S. dollars at current exchange rates while revenues and
F-12
Table of Contents
Approach Resources Inc. and Subsidiaries
Notes to Consolidated Financial Statements — (continued)
expenses are translated at the average rates in effect for the period. The related translation gains and losses are included in accumulated other comprehensive income within stockholders’ equity on our consolidated balance sheets. We recognized no translation gains or losses during the year ended December 31, 2012, since we sold our working interest in northeast British Columbia in 2011. During the year ended December 31, 2011, we recognized a translation loss of $20,000, net of the related income taxes.
Share-Based Compensation
We measure and record compensation expense for all share-based payment awards to employees and outside directors based on estimated grant date fair values. We recognize compensation costs for awards granted over the requisite service period based on the grant date fair value.
Earnings Per Common Share
We report basic earnings per common share, which excludes the effect of potentially dilutive securities, and diluted earnings per common share, which includes the effect of all potentially dilutive securities unless their impact is anti-dilutive. The following are reconciliations of the numerators and denominators of our basic and diluted earnings per share, (dollars in thousands, except per-share amounts):
| For the Years Ended December 31, | ||||||||||||
| 2013 | 2012 | 2011 | ||||||||||
Income (numerator): | ||||||||||||
Net income — basic | $ | 72,256 | $ | 6,384 | $ | 7,242 | ||||||
|
|
|
|
|
| |||||||
Weighted average shares (denominator): | ||||||||||||
Weighted average shares — basic | 38,997,815 | 34,965,182 | 28,930,792 | |||||||||
Dilution effect of share-based compensation, treasury method | 21,334 | 65,141 | 227,806 | |||||||||
|
|
|
|
|
| |||||||
Weighted average shares — diluted | 39,019,149 | 35,030,323 | 29,158,598 | |||||||||
|
|
|
|
|
| |||||||
Earnings per share: | ||||||||||||
Basic | $ | 1.85 | $ | 0.18 | $ | 0.25 | ||||||
|
|
|
|
|
| |||||||
Diluted | $ | 1.85 | $ | 0.18 | $ | 0.25 | ||||||
|
|
|
|
|
| |||||||
Oil and Gas Operations
Revenue and Accounts Receivable. We recognize revenue for our production when the quantities are delivered to or collected by the respective purchaser. Prices for such production are defined in sales contracts and are readily determinable based on certain publicly available indices.
Accounts receivable, joint interest owners, consist of uncollateralized joint interest owner obligations due within 30 days of the invoice date. Accounts receivable, oil, NGL and gas sales, consist of uncollateralized accrued revenues due under normal trade terms, generally requiring payment within 30 to 60 days of production. No interest is charged on past-due balances. Payments made on all accounts receivable are applied to the earliest unpaid items. We review accounts receivable periodically and reduce the carrying amount by a valuation allowance that reflects our best estimate of the amount that may not be collectible. No such allowance was considered necessary at December 31, 2013 or 2012.
F-13
Table of Contents
Approach Resources Inc. and Subsidiaries
Notes to Consolidated Financial Statements — (continued)
Oil, NGL and Gas Sales Payable. Oil, NGL and gas sales payable represents amounts collected from purchasers for oil, NGL and gas sales which are either revenues due to other revenue interest owners or severance taxes due to the respective state or local tax authorities. Generally, we are required to remit amounts due under these liabilities within 30 days of the end of the month in which the related production occurred.
Production Costs. Production costs, including compressor rental and repair, pumpers’ and supervisors’ salaries, saltwater disposal, insurance, repairs and maintenance, expensed workovers and other operating expenses are expensed as incurred and included in lease operating expense on our consolidated statements of operations.
Exploration expenses. Exploration expenses include dry hole costs, delay rentals and geological and geophysical costs.
Dependence on Major Customers. For the year ended December 31, 2013, sales to Wildcat Permian Services, LLC (“Wildcat”), DCP Midstream, LLC (“DCP”) and JP Energy Permian, LLC (“JPE”) accounted for approximately 30%, 27% and 23%, respectively, of our total sales. Additionally, substantially all of our accounts receivable related to oil and gas sales were due from JPE and DCP at December 31, 2013. As of December 31, 2013, we had dedicated all of our oil production from northern Project Pangea and Pangea West through 2022 to JP Energy Development, LP (“JP Energy”). In addition, as of December 31, 2013, we had contracted to sell all of our NGLs and natural gas production from Project Pangea to DCP through January 2016. For the years ended December 31, 2012 and 2011, we sold substantially all of our oil and gas produced to seven purchasers. We believe that there are potential alternative purchasers and that it may be necessary to establish relationships with new purchasers. However, there can be no assurance that we can establish such relationships and that those relationships will result in increased purchasers. Although we are exposed to a concentration of credit risk, we believe that all of our purchasers are credit worthy.
Dependence on Suppliers. Our industry is cyclical, and from time-to-time there is a shortage of drilling rigs, equipment, services, supplies and qualified personnel. During these periods, the costs and delivery times of rigs, equipment, services and supplies are substantially greater. If the unavailability or high cost of drilling rigs, equipment, services, supplies or qualified personnel were particularly severe in the area where we operate, we could be materially and adversely affected. We believe that there are potential alternative providers of drilling and completion services and that it may be necessary to establish relationships with new contractors. However, there can be no assurance that we can establish such relationships and that those relationships will result in increased availability of drilling rigs or other services.
Segment Reporting
The Company presently operates in one business segment, the exploration and production of oil, NGLs and natural gas.
| 2. | Equity Method Investment |
In September 2012, we entered into a joint venture to build an oil pipeline in Crockett and Reagan Counties, Texas, which is used to transport our oil to market. In October 2012, we made an initial contribution of $10 million to the joint venture for pipeline and facilities construction. In 2013, we contributed $8.3 million to the equity joint venture for pipeline and facilities construction prior to its sale in October 2013. Our contributions are recorded at cost and are included in noncurrent assets, “Equity method investment,” on our consolidated balance sheets and in investing activities, “Contribution to equity method investment,” on our consolidated statements of cash flows. Our share of the investee earnings was recorded on our consolidated statement of operations for the year ended December 31, 2013. In October 2013, we completed the sale of the joint venture,
F-14
Table of Contents
Approach Resources Inc. and Subsidiaries
Notes to Consolidated Financial Statements — (continued)
and net proceeds to Approach at closing totaled approximately $109.1 million, after deducting our share of transactional costs paid at closing. Of the $109.1 million in proceeds, $7.4 million is restricted pursuant to an escrow agreement and recorded as restricted cash at December 31, 2013. The escrow termination date is June 1, 2014. We recognized a pre-tax gain of $90.7 million related to this transaction, subject to normal post-closing adjustments.
| 3. | Public Equity Offerings |
On September 19, 2012, we completed a public offering of 5 million shares of our common stock. The underwriters exercised their option and purchased an additional 325,000 shares on October 3, 2012. After deducting underwriting discounts and transaction costs of approximately $8 million, we received net proceeds of approximately $154.4 million. We used the proceeds of the 2012 equity offering to repay outstanding borrowings under our revolving credit facility, fund our capital expenditures for the Wolfcamp oil shale resource play and for general working capital needs.
On November 15, 2011, we completed a public offering of 4 million shares of our common stock. The underwriters were granted an option to purchase up to 600,000 additional shares of our common stock. The underwriters fully exercised this option and purchased the additional shares on November 16, 2011. After deducting underwriting discounts and transaction costs of approximately $6.6 million, we received net proceeds of approximately $122.2 million. We used the proceeds of the 2011 equity offering to repay outstanding borrowings under our revolving credit facility, fund our capital expenditures for the Wolfcamp oil shale resource play, fund working interest and leasehold acquisitions in the Permian Basin and for general working capital needs.
| 4. | Long-Term Debt |
The following table provides a summary of our long-term debt at December 31, 2013, and December 31, 2012 (in thousands).
| December 31, | December 31, | |||||||
| 2013 | 2012 | |||||||
Senior secured credit facility | $ | — | $ | 106,000 | ||||
Senior Notes | 250,000 | — | ||||||
|
|
|
| |||||
Total long-term debt | $ | 250,000 | $ | 106,000 | ||||
|
|
|
| |||||
Credit Facility
Our credit facility has a maturity date of July 31, 2016. At December 31, 2013, our borrowing base was $350 million, with maximum commitments from the lenders in the credit facility of $500 million. The borrowing base is redetermined semi-annually on or before each April 1 and October 1 based on our oil, NGL and gas reserves. We, or the lenders, can each request one additional borrowing base redetermination each calendar year.
Borrowings bear interest based on the agent bank’s prime rate plus an applicable margin ranging from 0.75% to 1.75%, or the sum of the Eurodollar rate plus an applicable margin ranging from 1.75% to 2.75%. Margins vary based on the borrowings outstanding compared to the borrowing base. In addition, we pay an annual commitment of 0.50% of unused borrowings available under our credit facility.
On May 1, 2013, we entered into a fifteenth amendment to the credit facility, which (i) increased the borrowing base to $315 million from $280 million, (ii) increased the lenders’ aggregate maximum commitment
F-15
Table of Contents
Approach Resources Inc. and Subsidiaries
Notes to Consolidated Financial Statements — (continued)
to $500 million from $300 million, and (iii) extended the maturity date by two years, to July 31, 2016. Loans under our credit facility are secured by first-priority liens on substantially all of our West Texas assets and are guaranteed by certain of our subsidiaries.
On November 6, 2013, we entered into a sixteenth amendment to the credit facility, which, among other things, increased the borrowing base to $350 million from $315 million.
On January 23, 2014, we entered into a seventeenth amendment to the credit facility. This amendment provides the Company with more hedging flexibility by allowing the Company to enter into commodity derivative contracts on a rolling basis for (i) up to 85% of projected production from proved oil and gas properties for the two years following a commodities derivative contract, (ii) up to 100% of projected production from proved producing oil and gas properties during year three of such contract and (iii) up to 85% of projected production from proved producing oil and gas properties during years four and five of such contract.
We had no outstanding borrowings under our credit facility at December 31, 2013, compared to outstanding borrowings of $106 million at December 31, 2012. The weighted average interest rate applicable to borrowings under our credit facility at December 31, 2012, was 2.7%. We also had outstanding unused letters of credit under our credit facility totaling $0.3 million at December 31, 2013 and 2012, which reduce amounts available for borrowing under our credit facility.
Loans under our revolving credit facility are secured by first-priority liens on substantially all of our West Texas assets, a pledge of our equity interests in our subsidiaries and are guaranteed by our subsidiaries.
Covenants
Our credit agreement contains two principal financial covenants:
| • | a consolidated modified current ratio covenant that requires us to maintain a ratio of not less than 1.0 to 1.0 at all times. The consolidated modified current ratio is calculated by dividing Consolidated Current Assets (as defined in the credit agreement) by Consolidated Current Liabilities (as defined in the credit agreement). As defined more specifically in the credit agreement, the consolidated modified current ratio is calculated as current assets less current unrealized gains on commodity derivatives plus the available borrowing base at the respective balance sheet date, divided by current liabilities less current unrealized losses on commodity derivatives at the respective balance sheet date. |
| • | a consolidated funded debt-to-consolidated EBITDAX ratio covenant that requires us to maintain a ratio of not more than 4.0 to 1.0 at the end of each fiscal quarter. The consolidated funded debt-to-consolidated EBITDAX ratio is calculated by dividing Consolidated Funded Debt (as defined in the credit agreement) by Consolidated EBITDAX (as defined in the credit agreement). As defined more specifically in the credit agreement, consolidated EBITDAX is calculated as net income (loss), plus (1) exploration expense, (2) depletion, depreciation and amortization expense, (3) share-based compensation expense, (4) unrealized loss on commodity derivatives, (5) interest expense, (6) income and franchise taxes and (7) certain other noncash expenses, less (1) gains or losses from sales or dispositions of assets, (2) unrealized gain on commodity derivatives and (3) extraordinary or nonrecurring gains. For purposes of calculating this ratio, consolidated EBITDAX for a fiscal quarter is annualized pursuant to the credit agreement. |
Our credit agreement also restricts cash dividends and other restricted payments, transactions with affiliates, incurrence of other debt, consolidations and mergers, the level of operating leases, asset sales, investments in other entities and liens on properties.
F-16
Table of Contents
Approach Resources Inc. and Subsidiaries
Notes to Consolidated Financial Statements — (continued)
In addition, our credit agreement contains customary events of default that would permit our lenders to accelerate the debt under our credit agreement if not cured within applicable grace periods, including, among others, failure to make payments of principal or interest when due, materially incorrect representations and warranties, failure to make mandatory prepayments in the event of borrowing base deficiencies, breach of covenants, defaults upon other obligations in excess of $500,000, events of bankruptcy, the occurrence of one or more unstayed judgments in excess of $500,000 not covered by an acceptable policy of insurance, failure to pay any obligation in excess of $500,000 owed under any derivatives transaction or in any amount if the obligation under the derivatives transaction is secured by collateral under the credit agreement, any event of default by the Company occurs under any agreement entered into in connection with a derivatives transaction, liens securing the loans under the credit agreement cease to be in place, a Change in Control (as defined in the credit agreement) of the Company occurs and dissolution of the Company.
At December 31, 2013, we were in compliance with all of our covenants and had not committed any acts of default under the credit agreement.
Senior Notes
In June 2013, we completed our public offering of $250 million principal amount of 7% Senior Notes due 2021. Interest on the Senior Notes is payable semi-annually on June 15 and December 15, beginning December 15, 2013. We received net proceeds from the issuance of the Senior Notes of approximately $243 million, after deducting fees and expenses. We used a portion of the net proceeds from the offering to repay all outstanding borrowings under our credit facility.
We issued the Senior Notes under a senior indenture dated June 11, 2013, among the Company, our subsidiary guarantors and Wells Fargo Bank, National Association, as trustee. The senior indenture, as supplemented by a supplemental indenture dated June 11, 2013, is referred to as the “Indenture.”
On and after June 15, 2016, we may redeem some or all of the Senior Notes at specified redemption prices, plus accrued and unpaid interest to the redemption date. Before June 15, 2016, we may redeem up to 35% of the Senior Notes at a redemption price of 107% of the principal amount, plus accrued and unpaid interest to the redemption date, with the proceeds of certain equity offerings. In addition, before June 15, 2016, we may redeem some or all of the Notes for cash at a redemption price equal to 100% of their principal amount plus an applicable make-whole premium and accrued and unpaid interest to the redemption date. If we sell certain of our assets or experience specific kinds of changes of control, we may be required to offer to purchase the Senior Notes from holders. The Senior Notes are fully and unconditionally guaranteed on a senior unsecured basis by each of our subsidiaries, subject to certain customary release provisions. A subsidiary guarantor may be released from its obligations under the guarantee:
| • | in connection with any sale or other disposition of all or substantially all of the assets of that guarantor (including by way of merger or consolidation) to a person that is not (either before or after giving effect to such transaction) the Company or a subsidiary guarantor, if the sale or other disposition otherwise complies with the indenture; |
| • | in connection with any sale or other disposition of the capital stock of that guarantor to a person that is not (either before or after giving effect to such transaction) the Company or a subsidiary guarantor, if that guarantor no longer qualifies as a subsidiary of the Company as a result of such disposition and the sale or other disposition otherwise complies with the indenture; |
| • | if the Company designates any restricted subsidiary that is a guarantor to be an unrestricted subsidiary in accordance with the indenture; |
F-17
Table of Contents
Approach Resources Inc. and Subsidiaries
Notes to Consolidated Financial Statements — (continued)
| • | upon defeasance or covenant defeasance of the notes or satisfaction and discharge of the indenture, in each case, in accordance with the indenture; |
| • | upon the liquidation or dissolution of that guarantor, provided that no default or event of default occurs under the indenture as a result thereof or shall have occurred and is continuing; or |
| • | in the case of any restricted subsidiary that, after the issue date of the notes is required under the indenture to guarantee the notes because it becomes a guarantor of indebtedness issued or an obligor under a credit facility with respect to the Company and/or its subsidiaries, upon the release or discharge in full from its (x) guarantee of such indebtedness or (y) obligation under such credit facility, in each case, which resulted in such restricted subsidiary’s obligation to guarantee the notes. |
The Indenture restricts our ability, among other things, to (i) sell certain assets, (ii) pay distributions on, redeem or repurchase, equity interests, (iii) incur additional debt, (iv) make certain investments, (v) enter into transactions with affiliates, (vi) incur liens and (vii) merge or consolidate with another company. These restrictions are subject to a number of important exceptions and qualifications. If at any time the Senior Notes are rated investment grade by both Moody’s Investors Service and Standard & Poor’s Ratings Services and no default (as defined in the Indenture) has occurred and is continuing, many of these restrictions will terminate. The Indenture contains customary events of default.
At December 31, 2013, we were in compliance with all of our covenants, and there were no existing defaults or events of default, under our debt instruments. On December 15, 2013, we made a semi-annual interest payment of $8.9 million.
Subsidiary Guarantors
The Senior Notes are guaranteed on a senior unsecured basis by each of our consolidated subsidiaries. Approach Resources Inc. is a holding company with no independent assets or operations. The subsidiary guarantees are full and unconditional and joint and several, and any subsidiaries of the Company other than the subsidiary guarantors are minor. There are no significant restrictions on the Company’s ability, or the ability of any subsidiary guarantor, to obtain funds from its subsidiaries through dividends, loans, advances or otherwise.
| 5. | Share-Based Compensation |
In June 2007, the board of directors and stockholders approved the 2007 Stock Incentive Plan (“the 2007 Plan”). Under the 2007 Plan, we may grant restricted stock, stock options, stock appreciation rights, restricted stock units, performance awards, unrestricted stock awards and other incentive awards. Under a Second Amendment to the 2007 Plan effective May 31, 2012, the maximum number of shares of common stock available for the grant of awards under the 2007 Plan after May 31, 2012, is 2,100,000. Awards of any stock options are to be priced at not less than the fair market value at the date of the grant. The vesting period of any stock award is to be determined by the board or an authorized committee at the time of the grant. The term of each stock option is to be fixed at the time of grant and may not exceed 10 years. Shares issued upon stock options exercised are issued as new shares.
Share-based compensation expense amounted to $5.9 million, $7.5 million and $4.7 million for the years ended December 31, 2013, 2012 and 2011, respectively. Such amounts represent the estimated fair value of stock awards for which the requisite service period elapsed during those periods. Included in share-based compensation expense in 2013 is a benefit of $1 million for forfeited stock awards related to the retirement of one of our executive officers effective December 31, 2013. Share-based compensation expense for the years ended December 31, 2013, 2012 and 2011, included $630,000, $535,000 and $420,000, respectively, related to grants to nonemployee directors.
F-18
Table of Contents
Approach Resources Inc. and Subsidiaries
Notes to Consolidated Financial Statements — (continued)
Stock Options
There were no stock option grants during the years ended December 31, 2013, 2012 and 2011. As of December 31, 2013, all stock options are fully vested.
The following table summarizes stock options outstanding and activity as of and for the years ended December 31, 2013, 2012 and 2011, (dollars in thousands):
| Shares Subject to Stock Options | Weighted Average Exercise Price | Weighted Average Remaining Contractual Term (in years) | Aggregate Intrinsic Value | |||||||||||||
Outstanding at January 1, 2011 | 334,338 | $ | 7.01 | 3.85 | $ | 4,567 | ||||||||||
Granted | — | — | ||||||||||||||
Exercised | (74,241 | ) | 13.59 | |||||||||||||
Canceled | — | — | ||||||||||||||
|
|
|
|
|
|
|
| |||||||||
Outstanding at December 31, 2011 | 260,097 | $ | 5.13 | 1.94 | $ | 6,315 | ||||||||||
|
|
|
|
|
|
|
| |||||||||
Granted | — | — | ||||||||||||||
Exercised | (216,822 | ) | 3.68 | |||||||||||||
Canceled | — | — | ||||||||||||||
|
|
|
|
|
|
|
| |||||||||
Outstanding at December 31, 2012 | 43,275 | $ | 12.38 | 4.88 | $ | 547 | ||||||||||
|
|
|
|
|
|
|
| |||||||||
Granted | — | — | ||||||||||||||
Exercised | (3,750 | ) | 15.42 | |||||||||||||
Canceled | — | — | ||||||||||||||
|
|
|
|
|
|
|
| |||||||||
Outstanding at December 31, 2013 | 39,525 | $ | 12.09 | 3.84 | $ | 285 | ||||||||||
|
|
|
|
|
|
|
| |||||||||
Exercisable (fully vested) at December 31, 2013 | 39,525 | $ | 12.09 | 3.84 | $ | 285 | ||||||||||
|
|
|
|
|
|
|
| |||||||||
The intrinsic value of the options exercised during the years ended December 31, 2013, 2012 and 2011, was $35,000, $7 million and $1.1 million, respectively. There was no tax benefit recognized related to the stock option exercises in the years ended December 31, 2013 and 2012.
Nonvested Shares
Share grants totaling 377,379 shares, 316,279 shares and 256,317 shares with an approximate aggregate fair market value of $8.6 million, $10.4 million and $8.1 million at the time of grant were granted to employees during the years ended December 31, 2013, 2012 and 2011, respectively. Included in the share grants for 2013, 2012 and 2011, are 183,672 shares, 129,890 shares and 204,000 shares, respectively, awarded to our executive officers. The aggregate fair market value of these shares on the grant date was $4.4 million, $4.8 million and $6.5 million, respectively, to be expensed over a remaining service period of approximately three years, subject to certain performance restrictions.
F-19
Table of Contents
Approach Resources Inc. and Subsidiaries
Notes to Consolidated Financial Statements — (continued)
A summary of the status of nonvested shares for the years ended December 31, 2013, 2012 and 2011, is presented below:
| Shares | Weighted Average Grant-Date Fair Value | |||||||
Nonvested at January 1, 2011 | 708,781 | $ | 8.04 | |||||
Granted | 256,317 | 31.54 | ||||||
Vested | (124,134 | ) | 9.93 | |||||
Canceled | (50,842 | ) | 12.03 | |||||
|
|
|
| |||||
Nonvested at December 31, 2011 | 790,122 | 15.06 | ||||||
Granted | 316,279 | 32.94 | ||||||
Vested | (333,957 | ) | 14.57 | |||||
Canceled | (19,365 | ) | 23.74 | |||||
|
|
|
| |||||
Nonvested at December 31, 2012 | 753,079 | 22.35 | ||||||
Granted | 377,379 | 22.77 | ||||||
Vested | (299,110 | ) | 18.79 | |||||
Canceled | (132,117 | ) | 24.47 | |||||
|
|
|
| |||||
Nonvested at December 31, 2013 | 699,231 | $ | 23.70 | |||||
|
|
|
| |||||
As of December 31, 2013, unrecognized compensation expense related to the nonvested shares amounted to $16.6 million, which will be recognized over a remaining service period of three years.
Subsequent Restricted Share Award
Subsequent to December 31, 2013, 245,157 restricted shares were awarded to our executive officers, of which 163,438 shares are subject to certain performance conditions and 81,719 shares are subject to three-year total shareholder return (“TSR”) conditions, assuming maximum TSR. The aggregate fair market value of the shares subject to performance conditions on the grant date was $3.4 million, to be expensed over a remaining service period of approximately three years.
| 6. | Income Taxes |
Our provision for income taxes comprised the following (in thousands):
| Years Ended December 31, | ||||||||||||
| 2013 | 2012 | 2011 | ||||||||||
Current: | ||||||||||||
Federal | $ | 429 | $ | — | $ | — | ||||||
State | — | — | — | |||||||||
|
|
|
|
|
| |||||||
Total current provision for income taxes | $ | 429 | $ | — | $ | — | ||||||
|
|
|
|
|
| |||||||
Deferred: | ||||||||||||
Federal | $ | 41,175 | $ | 3,359 | $ | 3,199 | ||||||
State | 903 | (21 | ) | 289 | ||||||||
|
|
|
|
|
| |||||||
Total deferred provision for income taxes | $ | 42,078 | $ | 3,338 | $ | 3,488 | ||||||
|
|
|
|
|
| |||||||
F-20
Table of Contents
Approach Resources Inc. and Subsidiaries
Notes to Consolidated Financial Statements — (continued)
Total income tax expense differed from the amounts computed by applying the U.S. Federal statutory tax rates to pre-tax income (in thousands):
| Years Ended December 31, | ||||||||||||
| 2013 | 2012 | 2011 | ||||||||||
Statutory tax at 35% | $ | 40,167 | $ | 3,306 | $ | 3,648 | ||||||
State taxes, net of federal impact | 709 | (21 | ) | 289 | ||||||||
Permanent differences(1) | 34 | 53 | (289 | ) | ||||||||
Other differences | 1,597 | — | (160 | ) | ||||||||
|
|
|
|
|
| |||||||
Total | $ | 42,507 | $ | 3,338 | $ | 3,488 | ||||||
|
|
|
|
|
| |||||||
| (1) | Amounts primarily relate to share-based compensation expense. |
Deferred tax assets and liabilities are the result of temporary differences between the financial statement carrying values and tax basis of assets and liabilities. Our net deferred tax assets and liabilities are recorded as a long-term liability of $91.9 million and $48.6 million at December 31, 2013 and 2012, respectively. At December 31, 2013, $0.7 million of deferred taxes expected to be realized within one year were included in current assets. At December 31, 2012, $0.5 million of deferred taxes expected to be realized within one year were included in current liabilities.
Significant components of net deferred tax assets and liabilities are (in thousands):
| Years Ended December 31, | ||||||||
| 2013 | 2012 | |||||||
Deferred tax assets: | ||||||||
Current portion of unrealized loss on commodity derivatives | $ | 681 | — | |||||
Net operating loss carryforwards | 26,674 | $ | 27,353 | |||||
Unrealized loss on commodity derivatives | 113 | — | ||||||
Other | 295 | 542 | ||||||
|
|
|
| |||||
Total deferred tax assets | 27,763 | 27,895 | ||||||
Deferred tax liabilities: | ||||||||
Difference in depreciation, depletion and capitalization methods—oil and gas properties | (118,965 | ) | (76,170 | ) | ||||
Unrealized gain on commodity derivatives | — | (849 | ) | |||||
|
|
|
| |||||
Total deferred tax liabilities | (118,965 | ) | (77,019 | ) | ||||
|
|
|
| |||||
Net deferred tax liability | $ | (91,202 | ) | $ | (49,124 | ) | ||
|
|
|
| |||||
Net operating loss carryforwards for tax purposes have the following expiration dates (in thousands):
Expiration Dates | Amounts | Stock Adjustments | Total | |||||||||
2030 | $ | 4,083 | $ | 750 | $ | 4,833 | ||||||
2031 | 18,642 | 1,012 | 19,654 | |||||||||
2032 | 51,931 | 2,724 | 54,655 | |||||||||
2033 | — | 741 | 741 | |||||||||
|
|
|
|
|
| |||||||
Total | $ | 74,656 | $ | 5,227 | $ | 79,883 | ||||||
|
|
|
|
|
| |||||||
As of December 31, 2013, we had net operating loss carryfowards of approximately $79.9 million, of which approximately $5.2 million was generated from the benefit of stock options. When these benefits are realized, they will be credited to additional paid-in capital.
F-21
Table of Contents
Approach Resources Inc. and Subsidiaries
Notes to Consolidated Financial Statements — (continued)
| 7. | Derivatives |
At December 31, 2013, we had the following commodity derivatives positions outstanding:
Commodity and Period | Contract Type | Volume Transacted | Contract Price | |||
Crude Oil | ||||||
2014 | Collar | 550 Bbls/d | $90.00/Bbl – $105.50/Bbl | |||
2014 | Collar | 950 Bbls/d | $85.05/Bbl – $95.05/Bbl | |||
2014 | Collar | 2,000 Bbls/d | $89.00/Bbl – $98.85/Bbl | |||
2015 | Collar | 2,600 Bbls/d | $84.00/Bbl – $91.00/Bbl | |||
Crude Oil Basis Differential (Midland/Cushing) | ||||||
2014 | Swap | 1,500 Bbls/d | $0.55/Bbl | |||
Natural Gas Liquids | ||||||
Propane 2014 | Swap | 500 Bbls/d | $41.16/Bbl | |||
Natural Gasoline 2014 | Swap | 175 Bbls/d | $83.37/Bbl | |||
Natural Gas | ||||||
2014 | Swap | 360,000 MMBtu/month | $4.18/MMBtu | |||
2014(1) | Swap | 35,000 MMBtu/month | $4.29/MMBtu | |||
2015 | Swap | 200,000 MMBtu/month | $4.10/MMBtu | |||
2015 | Collar | 130,000 MMBtu/month | $4.00/MMBtu – $4.25/MMBtu | |||
| (1) | February 2014 — December 2014. |
Subsequent to December 31, 2013, we entered into a natural gas swap covering 160,000 MMBtu per month for March through December 2014 at a contract price of $4.40/MMBtu. We also entered into a natural gas collar covering 80,000 MMBtu per month for September 2014 through June 2015 at a floor price of $4.00/MMBtu and a ceiling price of $4.74/MMBtu, and a crude oil collar covering 1,500 Bbls per day for April 2014 through March 2015 at a floor price of $85.00/Bbl and a ceiling price of $95.30/Bbl. In January 2014, we early settled the crude oil basis differential swap for $0.7 million.
The following summarizes the fair value of our open commodity derivatives as of December 31, 2013 and 2012 (in thousands):
Asset Derivatives | Liability Derivatives | |||||||||||||||||||
| Fair Value | Fair Value | |||||||||||||||||||
Balance Sheet Location | December 31, 2013 | December 31, 2012 | Balance Sheet | December 31, 2013 | December 31, 2012 | |||||||||||||||
Derivatives not designated as hedging instruments | ||||||||||||||||||||
Commodity derivatives | Unrealized gain on commodity derivatives | $ | 9,108 | $ | 2,433 | Unrealized loss on commodity derivatives | $ | 11,270 | $ | — | ||||||||||
F-22
Table of Contents
Approach Resources Inc. and Subsidiaries
Notes to Consolidated Financial Statements — (continued)
The following summarizes the change in the fair value of our commodity derivatives (in thousands):
Income Statement Location | ||||||||||||||
| Year Ended December 31, | ||||||||||||||
| 2013 | 2012 | 2011 | ||||||||||||
Derivatives not designated as hedging instruments | ||||||||||||||
Commodity derivatives | Unrealized (loss) gain on commodity derivatives | $ | (4,596 | ) | $ | 3,874 | $ | (347 | ) | |||||
Realized (loss) gain on commodity derivatives | (1,048 | ) | (108 | ) | 3,375 | |||||||||
|
|
|
|
|
| |||||||||
| $ | (5,644 | ) | $ | 3,766 | $ | 3,028 | ||||||||
|
|
|
|
|
| |||||||||
Unrealized gains and losses, at fair value, are included on our consolidated balance sheets as current or non-current assets or liabilities based on the anticipated timing of cash settlements under the related contracts. Changes in the fair value of our commodity derivative contracts are recorded in earnings as they occur and included in other income (expense) on our consolidated statements of operations. We estimate the fair value of swap contracts based on the present value of the difference in exchange-quoted forward price curves and contractual settlement prices multiplied by notional quantities. We internally valued the option contracts using industry-standard option pricing models and observable market inputs. We use our internal valuations to determine the fair values of the contracts that are reflected on our consolidated balance sheets. Realized gains and losses are also included in other income (expense) on our consolidated statements of operations.
We are exposed to credit losses in the event of nonperformance by the counterparties on our commodity derivatives positions and have considered the exposure in our internal valuations. However, we do not anticipate nonperformance by the counterparties over the term of the commodity derivatives positions.
To estimate the fair value of our commodity derivatives positions, we use market data or assumptions that market participants would use in pricing the asset or liability, including assumptions about risk and the risks inherent in the inputs to the valuation technique. These inputs can be readily observable, market corroborated or generally unobservable. We primarily apply the market approach for recurring fair value measurements and attempt to use the best available information. We determine the fair value based upon the hierarchy that prioritizes the inputs used to measure fair value. The hierarchy gives the highest priority to unadjusted quoted prices in active markets for identical assets or liabilities (Level 1 measurement) and lowest priority to unobservable inputs (Level 3 measurement). The three levels of fair value hierarchy are as follows:
| • | Level 1 — Quoted prices are available in active markets for identical assets or liabilities as of the reporting date. At December 31, 2013, we had no Level 1 measurements. |
| • | Level 2 — Pricing inputs are other than quoted prices in active markets included in Level 1, which are either directly or indirectly observable as of the reporting date. Level 2 includes those financial instruments that are valued using models or other valuation methodologies. These models are primarily industry-standard models that consider various assumptions, including quoted forward prices for commodities, time value, volatility factors and current market and contractual prices for the underlying instruments, as well as other relevant economic measures. Our derivatives, which consist primarily of commodity swaps and collars, are valued using commodity market data which is derived by combining raw inputs and quantitative models and processes to generate forward curves. Where observable inputs are available, directly or indirectly, for substantially the full term of the asset or liability, the instrument is categorized in Level 2. At December 31, 2013, all of our commodity derivatives were valued using Level 2 measurements. |
F-23
Table of Contents
Approach Resources Inc. and Subsidiaries
Notes to Consolidated Financial Statements — (continued)
| • | Level 3 — Pricing inputs include significant inputs that are generally less observable from objective sources. These inputs may be used with internally developed methodologies that result in management’s best estimate of fair value. At December 31, 2013, we had no Level 3 measurements. |
Financial Instruments Not Recorded at Fair Value
The following table sets forth the fair values of financial instruments that are not recorded at fair value on our financial statements (in thousands).
| December 31, 2013 | ||||||||
| Carrying Amount | Fair Value | |||||||
Senior Notes | $ | 250,000 | $ | 256,875 | ||||
|
|
|
| |||||
The fair value of the Senior Notes uses pricing that is readily available in the public market. Accordingly, the fair value of the Senior Notes would be classified as Level 2 in the fair value hierarchy.
| 8. | Commitments and Contingencies |
In connection with the closing of the Wildcat sale, in October 2013, we entered into an amendment to our crude oil purchase agreement with JP Energy. The amendment, among other things, amends the dedicated area to include certain portions of Crockett and Schleicher Counties, Texas; amends the transportation and marketing fee; provides for the construction of future gathering lines and connection facilities; provides us with priority and preference rights for crude oil capacity on the pipeline system; and provides for trucking of crude oil during construction of gathering lines and connection facilities.
We periodically enter into contractual arrangements under which we are committed to expend funds to drill wells in the future, including agreements to secure drilling rig services, which require us to make future minimum payments to the rig operators. We record drilling commitments in the periods in which well capital expenditures are incurred or rig services are provided. Our commitment under daywork drilling contracts was $1.9 million at December 31, 2013.
At December 31, 2013, we had outstanding employment agreements with four of our five executive officers that contained automatic renewal provisions providing that such agreements may be automatically renewed for successive terms of one year unless the employment is terminated at the end of the term by written notice given to the employee not less than 60 days prior to the end of such term. On January 3, 2014, we entered into an employment agreement with Sergei Krylov as the Company’s Executive Vice President and Chief Financial Officer. Our maximum commitment under the employment agreements, which would apply if the employees covered by these agreements were each terminated without cause, was approximately $4.5 million at December 31, 2013. The commitment under the employment agreement entered into with the Company’s Executive Vice President and Chief Financial Officer on January 3, 2014 is $1.3 million. This estimate assumes the maximum potential bonus for 2014 is earned by each employee during 2014.
We lease our office space in Fort Worth, Texas, under a non-cancelable agreement that expires on December 31, 2017. We also have non-cancelable operating lease commitments related to office equipment that expire by 2017. The following is a schedule by years of future minimum rental payments required under our operating lease arrangements as of December 31, 2013 (in thousands):
2014 | $ | 668 | ||
2015 — 2018 | 2,014 | |||
|
| |||
Total | $ | 2,682 | ||
|
|
F-24
Table of Contents
Approach Resources Inc. and Subsidiaries
Notes to Consolidated Financial Statements — (continued)
Rent expense under our lease arrangements amounted to $734,000, $716,000 and $630,000 for the years ended December 31, 2013, 2012 and 2011, respectively.
Litigation
We are involved in various legal and regulatory proceedings arising in the normal course of business. While we cannot predict the outcome of these proceedings with certainty, we do not believe that an adverse result in any pending legal or regulatory proceeding, individually or in the aggregate, would be material to our consolidated financial condition or cash flows.
Environmental Issues
We are engaged in oil and gas exploration and production and may become subject to certain liabilities or damages as they relate to environmental clean up of well sites or other environmental restoration or ground water contamination, in connection with drilling or operating oil and gas wells. In connection with our acquisition of existing or previously drilled well bores, we may not be aware of what environmental safeguards were taken at the time such wells were drilled or during such time the wells were operated. Should it be determined that a liability exists with respect to any environmental clean up, restoration or contamination, we would be responsible for curing such a violation or paying damages. No claim has been made, nor are we aware of any liability that exists, as it relates to any environmental clean up, restoration, contamination or the violation of any rules or regulations relating thereto.
| 9. | Oil and Gas Producing Activities |
Set forth below is certain information regarding the costs incurred for oil and gas property acquisition, development and exploration activities (in thousands):
| For the Years Ended December 31, | ||||||||||||
| 2013 | 2012 | 2011 | ||||||||||
Property acquisition costs: | ||||||||||||
Unproved properties | $ | 5,857 | $ | 2,335 | $ | 17,361 | ||||||
Proved properties | 1,000 | 5,407 | 5,063 | |||||||||
Working Interest Acquisition | — | — | 70,827 | |||||||||
Exploration costs | 2,238 | 4,550 | 9,991 | |||||||||
Development costs(1) | 287,898 | 285,039 | 182,522 | |||||||||
|
|
|
|
|
| |||||||
Total costs incurred | $ | 296,993 | $ | 297,331 | $ | 285,764 | ||||||
|
|
|
|
|
| |||||||
| (1) | For the years ended December 31, 2013, 2012 and 2011, development costs include $584,000, $409,000 and $1.2 million in non-cash asset retirement obligations, respectively. |
F-25
Table of Contents
Approach Resources Inc. and Subsidiaries
Notes to Consolidated Financial Statements — (continued)
Set forth below is certain information regarding the results of operations for oil and gas producing activities (in thousands):
| For the Years Ended December 31, | ||||||||||||
| 2013 | 2012 | 2011 | ||||||||||
Revenues | $ | 181,302 | $ | 128,892 | $ | 108,387 | ||||||
Production costs | (31,992 | ) | (28,257 | ) | (19,134 | ) | ||||||
Exploration expense | (2,238 | ) | (4,550 | ) | (9,546 | ) | ||||||
Impairment | — | — | (18,476 | ) | ||||||||
Depletion | (76,956 | ) | (60,381 | ) | (31,858 | ) | ||||||
Income tax expense | (42,507 | ) | (12,139 | ) | (9,546 | ) | ||||||
|
|
|
|
|
| |||||||
Results of operations | $ | 27,609 | $ | 23,565 | $ | 19,827 | ||||||
|
|
|
|
|
| |||||||
| 10. | Disclosures About Oil and Gas Producing Activities (unaudited) |
Proved Reserves
All of our estimated oil and natural gas reserves are attributable to properties within the United States, primarily in the Permian Basin in West Texas. The estimates of proved reserves and related valuations for the years ended December 31, 2013, 2012 and 2011, were prepared by DeGolyer and MacNaughton, independent petroleum engineers. Each year’s estimate of proved reserves and related valuations were also prepared in accordance with then-current rules and guidelines established by the Securities and Exchange Commission and the Financial Accounting Standards Board.
The following table summarizes the prices used in the reserve estimates for 2013, 2012 and 2011. Commodity prices used for the reserve estimates, adjusted for basis differentials, grade and quality, are as follows:
| 2013 | 2012 | 2011 | ||||||||||
Oil (per Bbl) | $ | 97.28 | $ | 90.21 | $ | 89.65 | ||||||
Natural gas liquids (per Bbl) | $ | 30.16 | $ | 37.88 | $ | 49.63 | ||||||
Gas (per Mcf) | $ | 3.66 | $ | 2.62 | $ | 3.97 | ||||||
Oil, NGL and natural gas reserve estimates are subject to numerous uncertainties inherent in the estimation of quantities of proved reserves and in the projection of future rates of production and the timing of development expenditures. The accuracy of such estimates is a function of the quality of available data and of engineering and geological interpretation and judgment. Results of subsequent drilling, testing and production may cause either upward or downward revision of previous estimates. Further, the volumes considered to be commercially recoverable fluctuate with changes in prices and operating costs. The Company emphasizes that reserve estimates are inherently imprecise and that estimates of new discoveries are more imprecise than those of currently producing oil and natural gas properties. Accordingly, these estimates are expected to change as additional information becomes available in the future.
F-26
Table of Contents
Approach Resources Inc. and Subsidiaries
Notes to Consolidated Financial Statements — (continued)
The following table provides a summary of the changes of the total proved reserves for the years ended December 31, 2013, 2012 and 2011, as well as proved developed and proved undeveloped reserves at the beginning and end of each respective year.
Total Proved Reserves | Oil (MBbls) | NGLs (MBbls) | Natural Gas (MMcf) | Total (MBoe) | ||||||||||||
Balance — December 31, 2010 | 4,951 | 20,699 | 150,389 | 50,715 | ||||||||||||
Extensions and discoveries | 11,847 | 7,010 | 40,146 | 25,548 | ||||||||||||
Purchases of minerals in place | 2,200 | 4,284 | 24,083 | 10,498 | ||||||||||||
Production | (482 | ) | (798 | ) | (6,345 | ) | (2,338 | ) | ||||||||
Revisions to previous estimates | (465 | ) | (2,072 | ) | (29,466 | ) | (7,448 | ) | ||||||||
|
|
|
|
|
|
|
| |||||||||
Balance — December 31, 2011 | 18,051 | 29,123 | 178,807 | 76,975 | ||||||||||||
Extensions and discoveries | 21,993 | 8,639 | 49,372 | 38,861 | ||||||||||||
Production | (969 | ) | (904 | ) | (6,089 | ) | (2,888 | ) | ||||||||
Revisions to previous estimates | (1,823 | ) | (7,758 | ) | (47,330 | ) | (17,469 | ) | ||||||||
|
|
|
|
|
|
|
| |||||||||
Balance — December 31, 2012 | 37,252 | 29,100 | 174,760 | 95,479 | ||||||||||||
Extensions and discoveries | 14,252 | 6,531 | 38,993 | 27,282 | ||||||||||||
Purchases of minerals in place | 62 | 14 | 197 | 109 | ||||||||||||
Production(1) | (1,444 | ) | (951 | ) | (6,737 | ) | (3,517 | ) | ||||||||
Revisions to previous estimates | (4,055 | ) | (2,102 | ) | (8,789 | ) | (4,692 | ) | ||||||||
|
|
|
|
|
|
|
| |||||||||
Balance — December 31, 2013 | 46,067 | 32,593 | 216,002 | 114,661 | ||||||||||||
|
|
|
|
|
|
|
| |||||||||
(1) Production includes 560 MMcf related to field fuel. |
| |||||||||||||||
Proved Developed Reserves: | ||||||||||||||||
January 1, 2011 | 2,146 | 11,193 | 74,739 | 25,795 | ||||||||||||
December 31, 2011 | 5,542 | 13,945 | 84,743 | 33,611 | ||||||||||||
January 1, 2012 | 5,542 | 13,945 | 84,743 | 33,611 | ||||||||||||
December 31, 2012 | 8,816 | 11,761 | 73,178 | 32,774 | ||||||||||||
January 1, 2013 | 8,816 | 11,761 | 73,178 | 32,774 | ||||||||||||
December 31, 2013 | 13,646 | 14,919 | 99,742 | 45,189 | ||||||||||||
Proved Undeveloped Reserves: | ||||||||||||||||
January 1, 2011 | 2,805 | 9,506 | 75,650 | 24,920 | ||||||||||||
December 31, 2011 | 12,509 | 15,178 | 94,064 | 43,365 | ||||||||||||
January 1, 2012 | 12,509 | 15,178 | 94,064 | 43,365 | ||||||||||||
December 31, 2012 | 28,436 | 17,339 | 101,582 | 62,705 | ||||||||||||
January 1, 2013 | 28,436 | 17,339 | 101,582 | 62,705 | ||||||||||||
December 31, 2013 | 32,421 | 17,674 | 116,260 | 69,472 | ||||||||||||
The following is a discussion of the material changes in our proved reserve quantities for the years ended December 31, 2013, 2012 and 2011:
Year Ended December 31, 2013
Extensions and discoveries for 2013 were 27.3 MMBoe, primarily attributable to our development project in the Wolfcamp shale oil resource play in the Permian Basin. We produced 3.5 MMBoe during 2013. This production included 560 MMcf of gas that was produced and used as field fuel (primarily for compressors and
F-27
Table of Contents
Approach Resources Inc. and Subsidiaries
Notes to Consolidated Financial Statements — (continued)
artificial lifts) before the gas was delivered to a sales point. During 2013, we recorded downward revisions totaling 4.7 MMBoe. Revisions included the reclassification of 7.8 MMBoe of proved undeveloped reserves to probable undeveloped, partially offset by 3.1 MMBoe of positive revisions attributable to gas that will be produced and utilized as field fuel. The reserves reclassified from proved undeveloped to probable undeveloped were attributable to vertical Canyon locations in Project Pangea. Due to our horizontal Wolfcamp development project, including pad drilling, postponement of these deeper locations beyond five years from initial booking is necessary to integrate their development with the shallower Clearfork and Wolfcamp target zones. We expect this integrated development to minimize surface impact and maximize reservoir recoveries.
Year Ended December 31, 2012
Extensions and discoveries of 38.9 MMBoe for 2012 were primarily attributable to ongoing development of Project Pangea in the Wolfcamp oil shale resource play in the Permian Basin. We produced 2.9 MMBoe during 2012, 99.4% of which is attributable to our assets in the Permian Basin. We recorded downward revisions of 17.5 MMBoe to the December 31, 2011, estimates of our proved reserves at year-end 2012. Downward revisions of 17.5 MMBoe include 8.9 MMBoe of deeper, Canyon reserves in southeast Project Pangea that we reclassified to probable undeveloped. Due to our horizontal Wolfcamp development project, including pad drilling, postponement of these deeper Canyon locations beyond five years from initial booking is necessary in order to integrate their development with shallower Clearfork and Wolfcamp target zones. Revisions in 2012 also include 3.3 MMBoe of performance revisions related to vertical Canyon wells in Project Pangea, 2.9 MMBoe of revisions resulting from technical evaluations and 2.4 MMBoe of revisions resulting from lower natural gas and NGL prices in 2012.
Year Ended December 31, 2011
Extensions and discoveries of 25.5 MMBoe for 2011 include 24.2 MMBoe attributable to our Wolfcamp oil shale resource play in the Permian Basin. During 2011, we acquired approximately 10.5 MMBoe of proved reserves through the Working Interest Acquisition. We produced 2.4 MMBoe during 2011, 99% of which is attributable to our assets in the Permian Basin. We recorded downward revisions of 7.5 MMBoe to the December 31, 2010, estimates of our proved reserves at year-end 2011. Downward revisions of 7.5 MMBoe include 5.6 MMBoe of economic revisions in southeast Project Pangea in the Permian Basin and 2.2 MMBoe of proved undeveloped reserves in the East Texas Basin that, due to ongoing, low natural gas prices, we did not expect to develop by year-end 2013. Also included in the revisions were 0.3 MMBoe of positive revisions resulting from higher oil and NGL prices using the average 12-month price in 2011.
Standardized Measure of Discounted Future Net Cash Flows Relating to Proved Reserves
The Standardized Measure of discounted future net cash flows is computed by applying the 12-month unweighted average of the first-day-of-the-month pricing for oil and natural gas (with consideration of price changes only to the extent provided by contractual arrangements) to the estimated future production of proved oil and natural gas reserves less estimated future expenditures (based on year-end costs) to be incurred in developing and producing the proved reserves, discounted using a rate of 10 percent per year to reflect the estimated timing of the future cash flows. Future income taxes are calculated by comparing undiscounted future cash flows to the tax basis of oil and natural gas properties plus available carryforwards and credits and applying the current tax rates to the difference.
Discounted future cash flow estimates like those shown below are not intended to represent estimates of the fair value of oil and natural gas properties. Estimates of fair value would also consider probable and possible
F-28
Table of Contents
Approach Resources Inc. and Subsidiaries
Notes to Consolidated Financial Statements — (continued)
reserves, anticipated future oil and natural gas prices, interest rates, changes in development and production costs and risks associated with future production. Because of these and other considerations, any estimate of fair value is necessarily subjective and imprecise.
The following table provides the Standardized Measure of discounted future net cash flows at December 31, 2013, 2012 and 2011:
| Years Ended December 31, | ||||||||||||
| 2013 | 2012 | 2011 | ||||||||||
Future cash flows | $ | 5,953,060 | $ | 4,920,231 | $ | 3,772,633 | ||||||
Future production costs | (1,372,005 | ) | (1,220,403 | ) | (1,012,044 | ) | ||||||
Future development costs | (1,154,685 | ) | (1,025,193 | ) | (625,994 | ) | ||||||
Future income tax expense | (919,454 | ) | (692,528 | ) | (583,961 | ) | ||||||
|
|
|
|
|
| |||||||
Future net cash flows | 2,506,916 | 1,982,107 | 1,550,634 | |||||||||
10% annual discount for estimated timing of cash flows | (1,830,639 | ) | (1,487,887 | ) | (1,136,253 | ) | ||||||
|
|
|
|
|
| |||||||
Standardized measure of discounted future net cash flows | $ | 676,277 | $ | 494,220 | $ | 414,381 | ||||||
|
|
|
|
|
| |||||||
Future cash flows as shown above were reported without consideration for the effects of commodity derivative transactions outstanding at each period end.
Changes in Standardized Measure of Discounted Future Net Cash Flows
The changes in the Standardized Measure of discounted future net cash flows relating to proved oil and natural gas reserves are as follows (in thousands):
| Years Ended December 31, | ||||||||||||
| 2013 | 2012 | 2011 | ||||||||||
Balance, beginning of period | $ | 494,220 | $ | 414,381 | $ | 204,232 | ||||||
Net change in sales and transfer prices and in production (lifting) costs related to future production | 74,088 | 147,421 | 334,104 | |||||||||
Changes in estimated future development costs | (301,132 | ) | (486,435 | ) | (395,037 | ) | ||||||
Sales and transfers of oil and gas produced during the period | (149,310 | ) | (100,634 | ) | (89,253 | ) | ||||||
Net change due to extensions, discoveries and improved recovery | 360,080 | 467,822 | 291,501 | |||||||||
Net change due to purchase of minerals in place | 1,435 | — | 119,780 | |||||||||
Net change due to revisions in quantity estimates | (61,931 | ) | (210,296 | ) | (84,988 | ) | ||||||
Previously estimated development costs incurred during the period | 287,898 | 285,039 | 182,522 | |||||||||
Accretion of discount | 87,937 | 60,162 | 32,793 | |||||||||
Other | 1,896 | (11,281 | ) | (38,107 | ) | |||||||
Net change in income taxes | (118,904 | ) | (71,959 | ) | (143,166 | ) | ||||||
|
|
|
|
|
| |||||||
Standardized Measure of discounted future net cash flows | $ | 676,277 | $ | 494,220 | $ | 414,381 | ||||||
|
|
|
|
|
| |||||||
F-29
Table of Contents
Approach Resources Inc. and Subsidiaries
Notes to Consolidated Financial Statements — (continued)
| 11. | Supplementary Data |
Selected Quarterly Financial Data (unaudited), (dollars in thousands, except per-share amounts):
| 2013 Quarters Ended | ||||||||||||||||
| December 31 | September 30 | June 30 | March 31 | |||||||||||||
Net revenue | $ | 58,565 | $ | 44,196 | $ | 42,272 | $ | 36,269 | ||||||||
Net operating expenses | (40,402 | ) | (34,314 | ) | (31,329 | ) | (31,665 | ) | ||||||||
Interest expense, net | (5,225 | ) | (5,179 | ) | (2,451 | ) | (1,229 | ) | ||||||||
Equity in (losses) earnings of investee | (4 | ) | 340 | (64 | ) | (116 | ) | |||||||||
Gain on sale of Wildcat pipeline | 90,743 | — | — | — | ||||||||||||
Realized gain (loss) on commodity derivatives | 199 | (840 | ) | (714 | ) | 307 | ||||||||||
Unrealized (loss) gain on commodity derivatives | (1,348 | ) | (3,438 | ) | 4,290 | (4,100 | ) | |||||||||
|
|
|
|
|
|
|
| |||||||||
Income (loss) before income tax (benefit) | 102,528 | 765 | 12,004 | (534 | ) | |||||||||||
Income tax provision (benefit) | 38,207 | 270 | 4,217 | (187 | ) | |||||||||||
|
|
|
|
|
|
|
| |||||||||
Net income (loss) | $ | 64,321 | $ | 495 | $ | 7,787 | $ | (347 | ) | |||||||
|
|
|
|
|
|
|
| |||||||||
Basic net income (loss) applicable to common stockholders per common share | $ | 1.65 | $ | 0.01 | $ | 0.20 | $ | (0.01 | ) | |||||||
|
|
|
|
|
|
|
| |||||||||
Diluted net income (loss) applicable to common stockholders per common share | $ | 1.65 | $ | 0.01 | $ | 0.20 | $ | (0.01 | ) | |||||||
|
|
|
|
|
|
|
| |||||||||
| 2012 Quarters Ended | ||||||||||||||||
| December 31 | September 30 | June 30 | March 31 | |||||||||||||
Net revenue | $ | 35,309 | $ | 33,038 | $ | 29,927 | $ | 30,618 | ||||||||
Net operating expenses | (36,777 | ) | (31,340 | ) | (26,095 | ) | (23,879 | ) | ||||||||
Interest expense, net | (926 | ) | (1,544 | ) | (1,380 | ) | (887 | ) | ||||||||
Equity in losses of investee | (108 | ) | — | — | — | |||||||||||
Realized (loss) gain on commodity derivatives | (408 | ) | 423 | 361 | (484 | ) | ||||||||||
Unrealized gain (loss) on commodity derivatives | 1,292 | (4,185 | ) | 9,439 | (2,672 | ) | ||||||||||
|
|
|
|
|
|
|
| |||||||||
(Loss) income before income tax (benefit) | (1,618 | ) | (3,608 | ) | 12,252 | 2,696 | ||||||||||
Income tax (benefit) provision | (781 | ) | (1,253 | ) | 4,390 | 982 | ||||||||||
|
|
|
|
|
|
|
| |||||||||
Net (loss) income | $ | (837 | ) | $ | (2,355 | ) | $ | 7,862 | $ | 1,714 | ||||||
|
|
|
|
|
|
|
| |||||||||
Basic net (loss) income applicable to common stockholders per common share | $ | (0.02 | ) | $ | (0.07 | ) | $ | 0.23 | $ | 0.05 | ||||||
|
|
|
|
|
|
|
| |||||||||
Diluted net (loss) income applicable to common stockholders per common share | $ | (0.02 | ) | $ | (0.07 | ) | $ | 0.23 | $ | 0.05 | ||||||
|
|
|
|
|
|
|
| |||||||||
F-30
Table of Contents
Approach Resources Inc. and Subsidiaries
Notes to Consolidated Financial Statements — (continued)
| 2011 Quarters Ended | ||||||||||||||||
| December 31 | September 30 | June 30 | March 31 | |||||||||||||
Net revenue | $ | 31,123 | $ | 27,958 | $ | 29,123 | $ | 20,183 | ||||||||
Net operating expenses | (42,339 | ) | (19,092 | ) | (18,170 | ) | (17,930 | ) | ||||||||
Interest expense, net | (1,010 | ) | (1,016 | ) | (863 | ) | (513 | ) | ||||||||
Realized gain on commodity derivatives | 1,720 | 1,392 | 66 | 197 | ||||||||||||
Unrealized (loss) gain on commodity derivatives | (4,168 | ) | 1,739 | 2,231 | (149 | ) | ||||||||||
(Loss) gain on sale of oil and gas properties | (243 | ) | — | 3 | 488 | |||||||||||
|
|
|
|
|
|
|
| |||||||||
(Loss) income before income (benefit) tax | (14,917 | ) | 10,981 | 12,390 | 2,276 | |||||||||||
Income tax (benefit) provision | (5,632 | ) | 3,908 | 4,400 | 812 | |||||||||||
|
|
|
|
|
|
|
| |||||||||
Net (loss) income | $ | (9,285 | ) | $ | 7,073 | $ | 7,990 | $ | 1,464 | |||||||
|
|
|
|
|
|
|
| |||||||||
Basic net (loss) income applicable to common stockholders per common share | $ | (0.30 | ) | $ | 0.25 | $ | 0.28 | $ | 0.05 | |||||||
|
|
|
|
|
|
|
| |||||||||
Diluted net (loss) income applicable to common stockholders per common share | $ | (0.30 | ) | $ | 0.25 | $ | 0.28 | $ | 0.05 | |||||||
|
|
|
|
|
|
|
| |||||||||
F-31
Table of Contents
Approach Resources Inc.
Exhibit | Description of Exhibit | |
2.1 | Equity Purchase Agreement by and among JP Energy Development LP, JP Energy Permian, LLC, Wildcat Midstream Mesquite, LLC, Approach Midstream Holdings LLC, Wildcat Permian Services LLC and joined in for certain limited purposes by Wildcat Midstream Holdings LLC, Approach Resources Inc. and Wildcat Midstream Operating, LLC dated September 18, 2013 (pursuant to a request for confidential treatment, portions of this exhibit have been redacted and have been provided separately to the Securities and Exchange Commission) (filed as Exhibit 2.1 of the Company’s Current Report on Form 8-K filed October 11, 2013, and incorporated herein by reference). | |
3.1 | Restated Certificate of Incorporation of Approach Resources Inc. (filed as Exhibit 3.1 to the Company’s Quarterly Report on Form 10-Q filed December 13, 2007, and incorporated herein by reference). | |
3.2 | Second Amended and Restated Bylaws of Approach Resources Inc. (filed as Exhibit 3.2 to the Company’s Current Report on Form 8-K filed November 8, 2013, and incorporated herein by reference). | |
4.1 | Specimen Common Stock Certificate (filed as Exhibit 4.1 to the Company’s Registration Statement on Form S-1/A filed October 18, 2007 (File No. 333-144512), and incorporated herein by reference). | |
4.2 | First Supplemental Indenture, dated as of June 11, 2013, among Approach Resources Inc., as issuer, the subsidiary guarantors named therein, as guarantors, and Wells Fargo Bank, National Association, as trustee (filed as Exhibit 4.2 to the Company’s Current Report on Form 8-K filed June 11, 2013, and incorporated herein by reference). | |
4.3 | Senior Indenture, dated as of June 11, 2013, among Approach Resources Inc., as issuer, the subsidiary guarantors named therein, as guarantors, and Wells Fargo Bank, National Association, as trustee (filed as Exhibit 4.1 to the Company’s Current Report on Form 8-K filed June 11, 2013, and incorporated herein by reference). | |
10.1 | Form of Amended and Restated Indemnity Agreement between Approach Resources Inc. and each of its directors and officers (filed as Exhibit 10.1 to the Company’s Current Report on Form 8-K filed May 7, 2012 (File No. 333-144512), and incorporated herein by reference). | |
10.2† | Amended and Restated Employment Agreement by and between Approach Resources Inc. and J. Ross Craft dated January 1, 2011 (filed as Exhibit 10.1 to the Company’s Current Report on Form 8-K filed January 6, 2011, and incorporated herein by reference). | |
10.3† | Amended and Restated Employment Agreement by and between Approach Resources Inc. and Steven P. Smart dated January 1, 2011 (filed as Exhibit 10.2 to the Company’s Current Report on Form 8-K filed January 6, 2011, and incorporated herein by reference). | |
10.4† | Employment Agreement by and between Approach Resources Inc. and J. Curtis Henderson dated January 1, 2011 (filed as Exhibit 10.3 to the Company’s Current Report on Form 8-K filed January 6, 2011, and incorporated herein by reference). | |
10.5† | Employment Agreement by and between Approach Resources Inc. and Qingming Yang dated January 24, 2011 (filed as Exhibit 10.1 to the Company’s Current Report on Form 8-K filed January 28, 2011, and incorporated herein by reference). | |
10.6† | Employment Agreement by and between Approach Resources Inc. and Ralph P. Manoushagian dated January 24, 2011 (filed as Exhibit 10.2 to the Company’s Current Report on Form 8-K filed January 28, 2011, and incorporated herein by reference). | |
72
Table of Contents
Approach Resources Inc.
Index to Exhibits — continued
Exhibit | Description of Exhibit | |
*10.7† | Separation Agreement by and between Approach Resources Inc. and Steven P. Smart dated December 31, 2013. | |
10.8† | Approach Resources Inc. 2007 Stock Incentive Plan, effective as of June 28, 2007 (filed as Exhibit 10.6 to the Company’s Registration Statement on Form S-1 filed July 12, 2007, and incorporated herein by reference). | |
10.9† | First Amendment dated December 31, 2008, to Approach Resources Inc. 2007 Stock Incentive Plan, effective as of June 28, 2007 (filed as Exhibit 10.1 to the Company’s Current Report on Form 8-K filed December 31, 2008, and incorporated herein by reference). | |
10.10 | Form of Business Opportunities Agreement among Approach Resources Inc. and the other signatories thereto (filed as Exhibit 10.11 to the Company’s Registration Statement on FormS-1/A filed October 18, 2007 (File No. 333-144512), and incorporated herein by reference). | |
10.11† | Form of Restricted Stock Award Agreement under Approach Resources Inc. 2007 Stock Incentive Plan (filed as Exhibit 10.10 to the Company’s Quarterly Report on Form 10-Q filed November 6, 2008, and incorporated herein by reference). | |
10.12† | Form of Performance-Based, Time-Vesting Restricted Stock Award Agreement under Approach Resources Inc. 2007 Stock Incentive Plan (filed as Exhibit 10.14 to the Company’s Annual Report on Form 10-K filed March 11, 2011, and incorporated herein by reference). | |
10.13† | Form of TSR-Based Restricted Stock Award Agreement under Approach Resources Inc. 2007 Stock Incentive Plan (filed as Exhibit 10.1 to the Company’s Current Report on Form 8-K filed February 20, 2012, and incorporated herein by reference). | |
10.14 | Registration Rights Agreement dated as of November 14, 2007, by and among Approach Resources Inc. and investors identified therein (filed as Exhibit 10.1 to the Company’s Current Report on Form 8-K/A filed December 3, 2007, and incorporated herein by reference). | |
10.15 | Gas Purchase Contract dated as of January 1, 2011, between Approach Resources I, LP and Approach Oil & Gas Inc., as Seller, and DCP Midstream, LP, as Buyer (filed as Exhibit 10.1 to the Company’s Current Report on Form 8-K filed January 14, 2011, and incorporated herein by reference). | |
10.16 | Specimen Oil and Gas Lease for University Lands (filed as Exhibit 10.19 to the Company’s Annual Report on Form 10-K filed March 12, 2012, and incorporated herein by reference). | |
10.17 | $200,000,000 Revolving Credit Agreement dated as of January 18, 2008, among Approach Resources Inc., as borrower, The Frost National Bank, as administrative agent and lender, and the financial institutions named therein (filed as Exhibit 10.1 to the Company’s Current Report on Form 8-K filed January 25, 2008, and incorporated herein by reference). | |
10.18 | Amendment No. 1 dated February 19, 2008, to Credit Agreement dated as of January 18, 2008, among Approach Resources Inc., as borrower, The Frost National Bank, and JPMorgan Chase Bank, NA, as lenders, and Approach Oil & Gas Inc., Approach Oil & Gas (Canada) Inc. and Approach Resources I, LP, as guarantors (filed as Exhibit 10.1 to the Company’s Current Report on Form 8-K filed February 22, 2008, and incorporated herein by reference). | |
73
Table of Contents
Approach Resources Inc.
Index to Exhibits — continued
Exhibit | Description of Exhibit | |
10.19 | Amendment No. 2 dated May 6, 2008, to Credit Agreement dated as of January 18, 2008, among Approach Resources Inc., as borrower, The Frost National Bank, as administrative agent and lender, JPMorgan Chase Bank, NA, as lender, and Approach Oil & Gas Inc., Approach Oil & Gas (Canada) Inc. and Approach Resources I, LP, as guarantors (filed as Exhibit 99.1 to the Company’s Current Report on Form 8-K filed August 28, 2008, and incorporated herein by reference). | |
10.20 | Amendment No. 3 dated August 26, 2008, to Credit Agreement dated as of January 18, 2008, among Approach Resources Inc., as borrower, The Frost National Bank, as administrative agent and lender, JPMorgan Chase Bank, NA, Fortis Capital Corp. and KeyBank National Association, as lenders, and Approach Oil & Gas Inc., Approach Oil & Gas (Canada) Inc. and Approach Resources I, LP, as guarantors (filed as Exhibit 10.1 to the Company’s Current Report on Form 8-K filed August 28, 2008, and incorporated herein by reference). | |
10.21 | Amendment No. 4 dated April 8, 2009, to Credit Agreement dated as of January 18, 2008, among Approach Resources Inc., as borrower, The Frost National Bank, as administrative agent and lender, JPMorgan Chase Bank, NA, Fortis Capital Corp. and KeyBank National Association, as lenders, and Approach Oil & Gas Inc., Approach Oil & Gas (Canada) Inc. and Approach Resources I, LP, as guarantors (filed as Exhibit 10.1 to the Company’s Current Report on Form 8-K filed April 16, 2009, and incorporated herein by reference). | |
10.22 | Amendment No. 5 dated July 8, 2009, to Credit Agreement dated as of January 18, 2008, among Approach Resources Inc., as borrower, The Frost National Bank, as administrative agent and lender, JPMorgan Chase Bank, NA, Fortis Capital Corp. and KeyBank National Association, as lenders, and Approach Oil & Gas Inc., Approach Oil & Gas (Canada) Inc. and Approach Resources I, LP, as guarantors (filed as Exhibit 10.1 to the Company’s Current Report on Form 8-K filed July 14, 2009, and incorporated herein by reference). | |
10.23 | Amendment No. 6 dated as of October 30, 2009, to Credit Agreement dated as of January 18, 2008, among Approach Resources Inc., as borrower, The Frost National Bank, as administrative agent and lender, JPMorgan Chase Bank, NA, Fortis Capital Corp. and KeyBank National Association, as lenders, and Approach Oil & Gas Inc., Approach Oil & Gas (Canada) Inc. and Approach Resources I, LP, as guarantors (filed as Exhibit 10.1 to the Company’s Current Report on Form 8-K filed November 3, 2009, and incorporated herein by reference). | |
10.24 | Amendment No. 7 dated as of February 1, 2010, to Credit Agreement dated as of January 18, 2008, among Approach Resources Inc., as borrower, The Frost National Bank, as administrative agent and lender, JPMorgan Chase Bank, N.A., as successor agent and lender, Fortis Capital Corp. and KeyBank National Association, as lenders, and Approach Oil & Gas Inc., Approach Oil & Gas (Canada) Inc. and Approach Resources I, LP, as guarantors (filed as Exhibit 10.1 to the Company’s Current Report on Form 8-K filed February 4, 2010, and incorporated herein by reference). | |
10.25 | Amendment No. 8 dated as of May 3, 2010, to Credit Agreement dated as of January 18, 2008, among Approach Resources Inc., as Borrower, JPMorgan Chase Bank, N.A., as administrative agent and lender, The Frost National Bank, BNP Paribas and KeyBank National Association, as lenders, Fortis Capital Corp., as departing lender and Approach Oil & Gas Inc., Approach Oil & Gas (Canada) Inc. and Approach Resources I, LP, as guarantors (filed as Exhibit 10.1 to the Company’s Current Report on Form 8-K filed May 6, 2010, and incorporated herein by reference). | |
74
Table of Contents
Approach Resources Inc.
Index to Exhibits — continued
Exhibit | Description of Exhibit | |
10.26 | Amendment No. 9 dated as of October 21, 2010, to Credit Agreement dated as of January 18, 2008, among Approach Resources Inc., as Borrower, JPMorgan Chase Bank, N.A., as administrative agent and lender, The Frost National Bank, BNP Paribas and KeyBank National Association, as lenders, and Approach Oil & Gas Inc., Approach Oil & Gas (Canada) Inc. and Approach Resources I, LP, as guarantors (filed as Exhibit 10.1 to the Company’s Current Report on Form 8-K filed October 26, 2010, and incorporated herein by reference). | |
10.27 | Amendment No. 10 dated as of May 4, 2011, to Credit Agreement dated as of January 18, 2008, among Approach Resources Inc., as Borrower, JPMorgan Chase Bank, N.A., as administrative agent and lender, The Frost National Bank, BNP Paribas, KeyBank National Association and Royal Bank of Canada, as lenders, and Approach Oil & Gas Inc., Approach Oil & Gas (Canada) Inc. and Approach Resources I, LP, as guarantors (filed as Exhibit 10.1 to the Company’s Current Report on Form 8-K filed May 4, 2011, and incorporated herein by reference). | |
10.28 | Amendment No. 11 dated as of October 7, 2011, to Credit Agreement dated as of January 18, 2008, among Approach Resources Inc., as Borrower, JPMorgan Chase Bank, N.A., as administrative agent and lender, The Frost National Bank, BNP Paribas, KeyBank National Association, Royal Bank of Canada and Wells Fargo Bank, N.A., as lenders, and Approach Oil & Gas Inc., Approach Oil & Gas (Canada) Inc. and Approach Resources I, LP, as guarantors (filed as Exhibit 10.1 to the Company’s Current Report on Form 8-K filed October 11, 2011, and incorporated herein by reference). | |
10.29 | Amendment No. 12 dated as of December 20, 2011, to Credit Agreement dated as of January 18, 2008, among Approach Resources Inc., as Borrower, JPMorgan Chase Bank, N.A., as administrative agent and lender, KeyBank National Association, The Frost National Bank, Royal Bank of Canada and Wells Fargo Bank, N.A., as lenders, BNP Paribas, as departing lender, and Approach Oil & Gas Inc., Approach Oil & Gas (Canada) Inc. and Approach Resources I, LP, as guarantors (filed as Exhibit 10.1 to the Company’s Current Report on Form 8-K filed December 21, 2011, and incorporated herein by reference). | |
10.30 | Amendment No. 13 dated as of September 7, 2012, to Credit Agreement dated as of January 18, 2008, among Approach Resources Inc., as Borrower, JPMorgan Chase Bank, N.A., as administrative agent and lender, KeyBank National Association, The Frost National Bank, Royal Bank of Canada and Wells Fargo Bank, N.A., as lenders, and Approach Oil & Gas Inc., Approach Oil & Gas (Canada) Inc. and Approach Resources I, LP, as guarantors (filed as Exhibit 10.1 to the Company’s Current Report on Form 8-K filed September 13, 2012, and incorporated herein by reference). | |
10.31 | Amendment No. 14 dated as of November 16, 2012, to Credit Agreement dated as of January 18, 2008, among Approach Resources Inc., as Borrower, JPMorgan Chase Bank, N.A., as administrative agent and lender, KeyBank National Association, The Frost National Bank, Royal Bank of Canada and Wells Fargo Bank, N.A., as lenders, and Approach Oil & Gas Inc., Approach Resources I, LP, Approach Services, LLC and Approach Midstream Holdings LLC, as guarantors (filed as Exhibit 10.1 to the Company’s Current Report on Form 8-K filed November 21, 2012, and incorporated herein by reference). | |
75
Table of Contents
Approach Resources Inc.
Index to Exhibits — continued
Exhibit | Description of Exhibit | |
10.32 | Amendment No. 15 dated as of May 1, 2013, to Credit Agreement dated as of January 18, 2008, among Approach Resources Inc., as Borrower, JPMorgan Chase Bank, N.A., as administrative agent and lender, KeyBank National Association, The Frost National Bank, Royal Bank of Canada and Wells Fargo Bank, N.A., as lenders, and Approach Oil & Gas Inc., Approach Resources I, LP, Approach Services, LLC and Approach Midstream Holdings LLC, as guarantors (filed as Exhibit 10.1 to the Company’s Current Report on Form 8-K filed May 3, 2013, and incorporated herein by reference). | |
10.33 | Amendment No. 16 dated as of November 6, 2013, to Credit Agreement dated as of January 18, 2008, among Approach Resources Inc., as Borrower, JPMorgan Chase Bank, N.A., as administrative agent and lender, KeyBank National Association, The Frost National Bank, Royal Bank of Canada and Wells Fargo Bank, N.A., as lenders, and Approach Oil & Gas Inc., Approach Resources I, LP, Approach Services, LLC and Approach Midstream Holdings LLC, as guarantors (filed as Exhibit 10.1 to the Company’s Current Report on Form 8-K filed November 8, 2013, and incorporated herein by reference). | |
10.34 | Amendment No. 17 dated as of January 23, 2014, to Credit Agreement dated as of January 18, 2008, among Approach Resources Inc., as Borrower, JPMorgan Chase Bank, N.A., as administrative agent and lender, KeyBank National Association, The Frost National Bank, Royal Bank of Canada and Wells Fargo Bank, N.A., as lenders, and Approach Oil & Gas Inc., Approach Resources I, LP, Approach Services, LLC and Approach Midstream Holdings LLC, as guarantors (filed as Exhibit 10.1 to the Company’s Current Report on Form 8-K filed January 24, 2014, and incorporated herein by reference). | |
10.35 | Second Amendment to the Approach Resources Inc. 2007 Stock Incentive Plan, effective as of May 31, 2012 (filed as Exhibit 10.1 to the Company’s Current Report on Form 8-K filed June 1, 2012, and incorporated herein by reference). | |
10.36 | Crude Oil Purchase Agreement dated as of September 12, 2012, between Approach Operating, LLC and Approach Oil & Gas Inc., as Seller, and Wildcat Permian Services LLC, as Buyer (pursuant to a request for confidential treatment, portions of this exhibit have been redacted and have been provided separately to the Securities and Exchange Commission)(filed as Exhibit 10.4 of the Company’s Quarterly Report on Form 10-Q for the three months ended September 30, 2012 and incorporated herein by reference). | |
*10.37 | Amendment No. 1 to Crude Oil Purchase Agreement dated as of October 7, 2013, between Approach Operating, LLC, Approach Oil & Gas Inc. and Approach Resources I, LP, and Wildcat Permian Services LLC and JP Energy Development, LP (pursuant to a request for confidential treatment, portions of this exhibit have been redacted and have been provided separately to the Securities and Exchange Commission). | |
*12.1 | Statement of Computation Ratio of Earnings to Fixed Charges. | |
14.1 | Code of Conduct (filed as Exhibit 14.1 to the Company’s Annual Report on Form 10-K filed March 28, 2008, and incorporated herein by reference). | |
*21.1 | Subsidiaries. | |
*23.1 | Consent of Hein & Associates LLP. | |
*23.2 | Consent of DeGolyer and MacNaughton. | |
*31.1 | Certification by the President and Chief Executive Officer Pursuant to Section 302 of the Sarbanes-Oxley Act of 2002. | |
76
Table of Contents
Approach Resources Inc.
Index to Exhibits — continued
Exhibit | Description of Exhibit | |
*31.2 | Certification by the Chief Financial Officer Pursuant to Section 302 of the Sarbanes-Oxley Act of 2002. | |
*32.1 | Certification by the President and Chief Executive Officer Pursuant to 18 U.S.C. Section 1350, as adopted Pursuant to Section 906 of the Sarbanes-Oxley Act of 2002. | |
*32.2 | Certification by the Chief Financial Officer Pursuant to U.S.C. Section 1350, as adopted Pursuant to Section 906 of the Sarbanes-Oxley Act of 2002. | |
*99.1 | Report of DeGolyer and MacNaughton. | |
*101.INS | XBRL Instance Document. | |
*101.SCH | XBRL Taxonomy Extension Schema Document. | |
*101.CAL | XBRL Taxonomy Extension Calculation Linkbase Document. | |
*101.LAB | XBRL Taxonomy Extension Label Linkbase Document. | |
*101.PRE | XBRL Taxonomy Extension Presentation Linkbase Document. | |
*101.DEF | XBRL Taxonomy Extension Definition Linkbase Document. | |
| * | Filed herewith. |
| † | Denotes management contract or compensatory plan or arrangement. |
77