 Third Quarter 2014 Results NOVEMBER 5, 2014 Exhibit 99.3 |
 Forward-looking statements 2 Cautionary statements regarding oil & gas quantities Third Quarter 2014 Results – November 2014 |
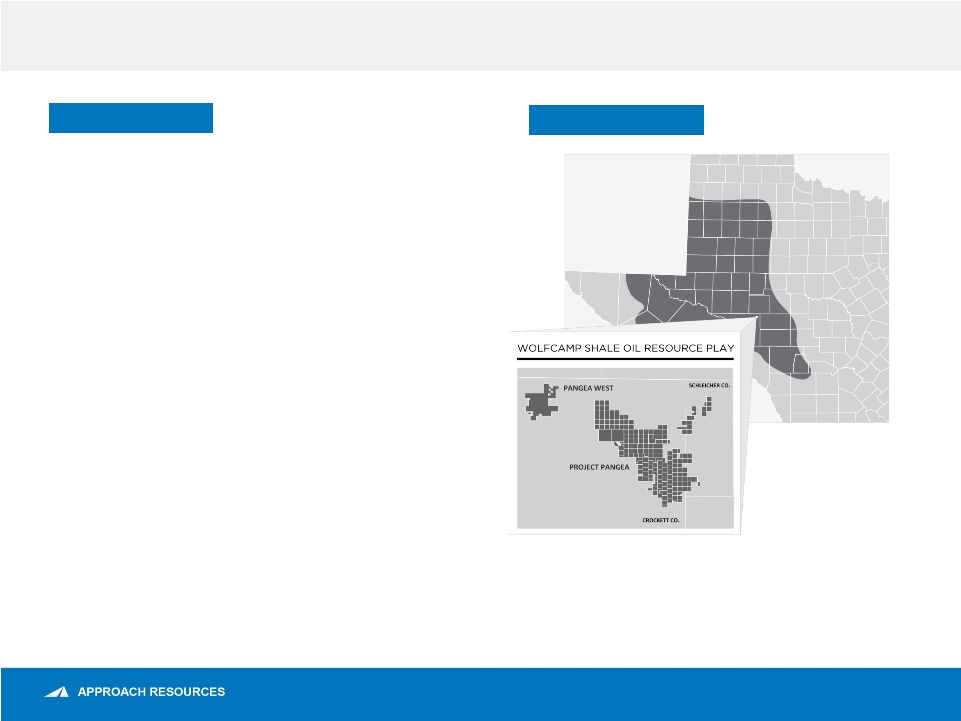 Company overview AREX OVERVIEW ASSET OVERVIEW Enterprise value $710 MM High-quality reserve base Permian core operating area 2014 Capital program of $400 MM Notes: Proved reserves and acreage as of 12/31/2013 and 9/30/2014, respectively. All Boe and Mcfe calculations are based on a 6 to 1 conversion ratio. Enterprise value is equal to market capitalization using the closing share price of $9.44 per share on 11/3/2014, plus net debt as of 9/30/2014. See “PV-10 (unaudited)” slide. 3 Third Quarter 2014 Results – November 2014 115 MMBoe proved reserves $1.1 BN proved PV-10 99% Permian Basin 155,000 gross (136,500 net) acres Running 3 HZ rigs in the Wolfcamp shale play to drill 70 wells during 2014 ~1+ BnBoe gross, unrisked resource potential ~2,000+ Identified HZ drilling locations targeting Wolfcamp A/B/C |
 3Q14 Key highlights 4 3Q14 HIGHLIGHTS • Drilled 18 and completed 16 HZ wells • Maintained best-in-class HZ well costs • New Elliott well expands Wolfcamp development eastward • Increased 3Q14 production 61% YoY to 14.2 MBoe/d • Delivered seventh consecutive record quarterly EBITDAX • Solid financial position further strengthened by borrowing base increase 3Q14 SUMMARY RESULTS Production (MBoe/d) 14.2 % Oil 39% % Total liquids 69% Average realized price ($/Boe) Average realized price, excluding commodity derivatives impact $ 52.17 Average realized price, including commodity derivatives impact 51.59 Costs and expenses ($/Boe) LOE $ 5.87 Production and ad valorem taxes 2.55 Exploration 0.68 General and administrative 5.88 G&A – cash component 4.37 G&A – noncash component 1.51 DD&A 19.88 Third Quarter 2014 Results – November 2014 |
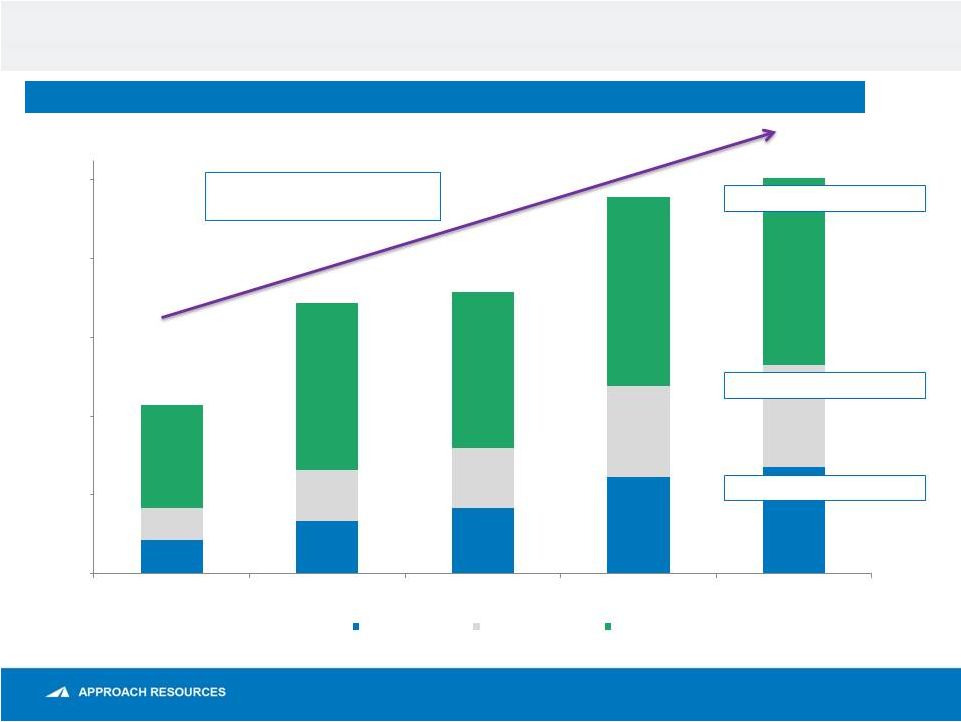 Outperformance in gas/NGL volumes achieves higher reserve recovery and drives production growth Horizontal Wolfcamp Production by Commodity 83% oil growth since 3Q13 135% growth in HZ Wolfcamp production since 3Q13 216% NGL growth since 3Q13 218% gas growth since 3Q13 Mboe 85 135 166 247 270 82 128 153 230 259 260 424 396 481 475 0 200 400 600 800 1,000 3Q13 4Q13 1Q14 2Q14 3Q14 Gas NGLs Oil 5 427 687 715 957 1,004 Third Quarter 2014 Results – November 2014 |
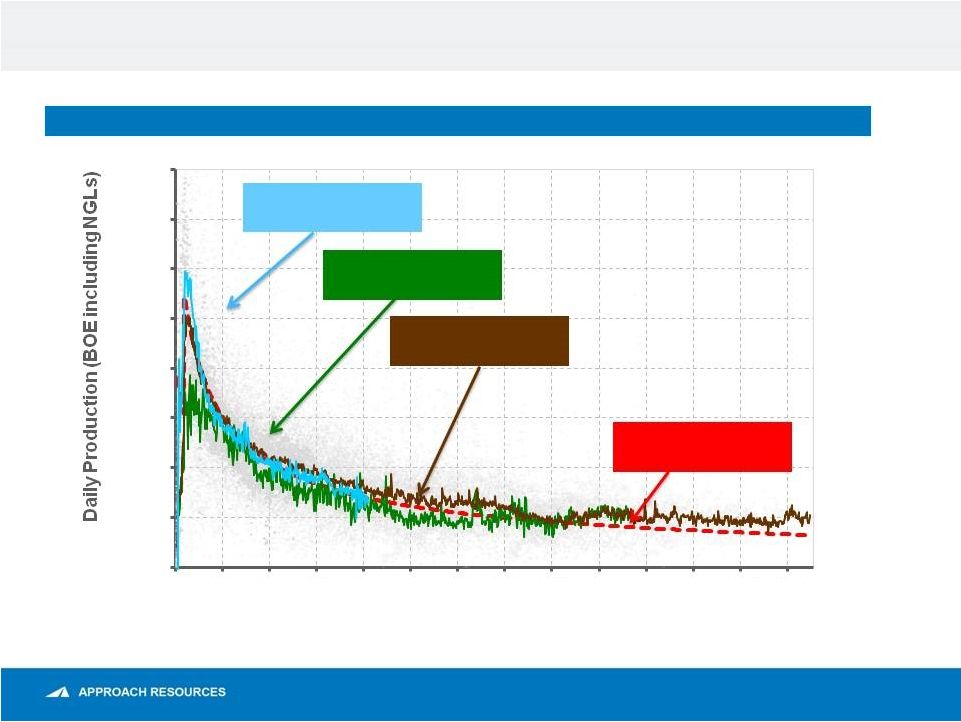 AREX HZ Wolfcamp Well Performance 6 AREX HZ WOLFCAMP (BOE/D) Note: Daily production normalized for operational downtime. Third Quarter 2014 Results – November 2014 Production Data from AREX A Bench Wells (11) 450 MBoe Type Curve Wolfcamp Shale Oil Production Data from AREX B Bench Wells (74) Production Data from AREX C Bench Wells (13) 0 200 300 400 600 700 800 0 90 180 270 360 450 540 630 720 810 900 990 1080 1170 Time (Days) 100 500 |
 3Q14 Operating highlights OPERATING HIGHLIGHTS Maximizing Returns • Oil differential of $(4.17)/Bbl • HZ well costs continue to track $5.5 MM per well • LOE of $5.87/Boe, improved 5% QoQ Tracking Development Plan • Drilled 18 HZ wells and completed 16 HZ wells • Wolfcamp A – 2 wells, Wolfcamp B – 7 wells and Wolfcamp C – 7 wells • HZ Wolfcamp B/C average IP 746 Boe/d (67% oil, 85% liquids) • Overall HZ well results continue to track at or above type curve • Impressive initial results from recent Elliott C bench well (IP of 806 Boe/d, 63% oil and 83% liquids) expand Wolfcamp development eastward Delivering Production Growth • Total production 14.2 MBoe/d (up 61% YoY) • Oil production 5.5 Mbbl/d (up 61% YoY) 7 Third Quarter 2014 Results – November 2014 |
 3Q14 Financial highlights FINANCIAL HIGHLIGHTS Significant Cash Flow • Record quarterly EBITDAX (non-GAAP) of $50.7 MM (up 60% YoY), or $1.29 per diluted share (up 59% YoY) • Capital expenditures of $104.9 MM ($94 million for D&C) Strong Financial Position • Liquidity of $362MM at September 30 • Increased borrowing base to $600 MM in November 2014 Increasing Revenues • Revenues of $68.1 MM (up 54% YoY) • Net income of $22.4 MM, or $0.57 per diluted share • Adjusted net income (non-GAAP) of $10.5 MM, or $0.27 per diluted share Strong Balance Sheet and Liquidity to Develop HZ Wolfcamp Shale Note: See “Adjusted Net Income,” “EBITDAX” and “Strong, Simple Balance Sheet” slides. 8 Third Quarter 2014 Results – November 2014 th |
 Current hedge position 9 Commodity & Period Contract Type Volume Contract Price Crude Oil October 2014 – December 2014 Collar 550 Bbls/d $90.00/Bbl - $105.50/Bbl October 2014 – December 2014 Collar 950 Bbls/d $85.05/Bbl - $95.05/Bbl October 2014 – December 2014 Collar 2,000 Bbls/d $89.00/Bbl - $98.85/Bbl October 2014 – March 2015 Collar 1,500 Bbls/d $85.00/Bbl - $95.30/Bbl January 2015 – December 2015 Collar 1,600 Bbls/d $84.00/Bbl - $91.00/Bbl January 2015 – December 2015 Collar 1,000 Bbls/d $90.00/Bbl - $102.50/Bbl January 2015 – December 2015 3-way Collar 500 Bbls/d $75.00/Bbl - $84.00/Bbl - $94.00/Bbl January 2015 – December 2015 3-way Collar 500 Bbls/d $75.00/Bbl - $84.00/Bbl - $95.00/Bbl Natural Gas Liquids Propane October 2014 – December 2014 Swap 500 Bbls/d $41.16/Bbl Natural Gasoline October 2014 – December 2014 Swap 175 Bbls/d $83.37/Bbl Natural Gas October 2014 – December 2014 Swap 360,000 MMBtu/month $4.18/MMBtu October 2014 – December 2014 Swap 35,000 MMBtu/month $4.29/MMBtu October 2014 – December 2014 Swap 160,000 MMBtu/month $4.40/MMBtu October 2014 – June 2015 Collar 80,000 MMBtu/month $4.00/MMBtu - $4.74/MMBtu January 2015 – December 2015 Swap 200,000 MMBtu/month $4.10/MMBtu January 2015 – December 2015 Collar 130,000 MMBtu/month $4.00/MMBtu - $4.25/MMBtu Third Quarter 2014 Results – November 2014 |
 Production and expense guidance 10 2014 Guidance Production Total (MBoe) 4,950 Oil (MBbls) 2,050 – 2,200 Percent total liquids 70% Operating costs and expenses (per Boe) Lease operating $6.00 - $6.75 Production and ad valorem taxes 6.5% of oil & gas revenues Cash general and administrative $4.50 - $5.00 Exploration $0.50 - $1.00 Depletion, depreciation and amortization $21.00 - $23.00 Capital expenditures (in millions) Approx. $400 Horizontal wells 70 Third Quarter 2014 Results – November 2014 |
 Strong, simple balance sheet 11 FINANCIAL RESULTS ($MM) As of September 30, 2014 Summary Balance Sheet Cash and Cash Equivalents $1.6 Credit Facility 89.5 Senior Notes 250.0 Total Long-Term Debt $339.5 Shareholders’ Equity 745.1 Total Book Capitalization $1,084.6 Liquidity Borrowing Base $450.0 Cash and Cash Equivalents 1.6 Long-term Debt under Credit Facility (89.5) Undrawn Letters of Credit (0.3) Liquidity $361.8 Key Metrics LTM EBITDAX (non-GAAP) $185.1 Total Reserves (MMBoe) 114.7 Proved Developed Reserves (MMBoe) 45.2 % Proved Developed 39% % Liquids 69% Credit Statistics Debt / Book Capital 31% Debt / LTM EBITDAX 1.8x LTM EBITDAX / LTM Interest 8.7x Debt / Proved Reserves ($/Boe) $2.96 Third Quarter 2014 Results – November 2014 Note: See “EBITDAX” slide for reconciliation. |
 Appendix |
 Adjusted net income (unaudited) 13 (in thousands, except per-share amounts) Three Months Ended September 30, 2014 2013 Net income $ 22,447 $ 495 Adjustments for certain items: Unrealized (gain) loss on commodity derivatives (18,810) 3,438 Related income tax effect 6,816 (1,169) Adjusted net income $ 10,453 $ 2,764 Adjusted net income per diluted share $ 0.27 $ 0.07 The amounts included in the calculation of adjusted net income and adjusted net income per diluted share below were computed in accordance with GAAP. We believe adjusted net income and adjusted net income per diluted share are useful to investors because they provide readers with a more meaningful measure of our profitability before recording certain items whose timing or amount cannot be reasonably determined. However, these measures are provided in addition to, and not as an alternative for, and should be read in conjunction with, the information contained in our financial statements prepared in accordance with GAAP (including the notes), included in our SEC filings and posted on our website. The following table provides a reconciliation of adjusted net income to net income for the three months ended September 30, 2014 and 2013. ADJUSTED NET INCOME (UNAUDITED) Third Quarter 2014 Results – November 2014 |
 EBITDAX (unaudited) 14 EBITDAX (UNAUDITED) The amounts included in the calculation of EBITDAX were computed in accordance with GAAP. EBITDAX is not a measure of net income or cash flow as determined by GAAP. EBITDAX is presented herein and reconciled to the GAAP measure of net income because of its wide acceptance by the investment community as a financial indicator of a company's ability to internally fund development and exploration activities. This measure is provided in addition to, and not as an alternative for, and should be read in conjunction with, the information contained in our financial statements prepared in accordance with GAAP (including the notes), included in our SEC filings and posted on our website. The following table provides a reconciliation of EBITDAX to net income for the three months ended September 30, 2014 and 2013. (in thousands, except per-share amounts) Three Months Ended September 30, 2014 2013 Net income $ 22,447 $ 495 Exploration 891 1,193 Depletion, depreciation and amortization 25,959 19,413 Share-based compensation 1,965 1,599 Unrealized (gain) loss on commodity derivatives (18,810) 3,438 Interest expense, net 5,442 5,179 Income tax provision 12,756 270 EBITDAX $ 50,650 $ 31,587 EBITDAX per diluted share $ 1.29 $ 0.81 Third Quarter 2014 Results – November 2014 |
 PV-10 (unaudited) 15 PV-10 (UNAUDITED) (in millions) December 31, 2013 PV-10 $ 1,132 Less income taxes: Undiscounted future income taxes (919) 10% discount factor 463 Future discounted income taxes (456) Standardized measure of discounted future net cash flows $ 676 The present value of our proved reserves, discounted at 10% (“PV-10”), was estimated at $1.1 billion at December 31, 2013, and was calculated based on the first-of-the-month, twelve-month average prices for oil, NGLs and gas, of $97.28 per Bbl of oil, $30.16 per Bbl of NGLs and $3.66 per MMBtu of natural gas. PV-10 is our estimate of the present value of future net revenues from proved oil and gas reserves after deducting estimated production and ad valorem taxes, future capital costs and operating expenses, but before deducting any estimates of future income taxes. The estimated future net revenues are discounted at an annual rate of 10% to determine their “present value.” We believe PV-10 to be an important measure for evaluating the relative significance of our oil and gas properties and that the presentation of the non-GAAP financial measure of PV-10 provides useful information to investors because it is widely used by professional analysts and investors in evaluating oil and gas companies. Because there are many unique factors that can impact an individual company when estimating the amount of future income taxes to be paid, we believe the use of a pre-tax measure is valuable for evaluating the Company. We believe that PV-10 is a financial measure routinely used and calculated similarly by other companies in the oil and gas industry. The following table reconciles PV-10 to our standardized measure of discounted future net cash flows, the most directly comparable measure calculated and presented in accordance with GAAP. PV-10 should not be considered as an alternative to the standardized measure as computed under GAAP. Third Quarter 2014 Results – November 2014 |
 Contact information SERGEI KRYLOV Executive Vice President & Chief Financial Officer 817.989.9000 ir@approachresources.com www.approachresources.com |