Table of Contents
SECURITIES AND EXCHANGE COMMISSION
| o | REGISTRATION STATEMENT PURSUANT TO SECTION 12(B) OR 12(G) OF THE SECURITIES EXCHANGE ACT OF 1934 |
| þ | ANNUAL REPORT PURSUANT TO SECTION 13 OR 15(D) OF THE SECURITIES EXCHANGE ACT OF 1934 |
| o | TRANSITION REPORT PURSUANT TO SECTION 13 OR 15(D) OF THE SECURITIES EXCHANGE ACT OF 1934 |
| o | SHELL COMPANY REPORT PURSUANT TO SECTION 13 OR 15(D) OF THE SECURITIES EXCHANGE ACT OF 1934 |
N/A
(Translation of Registrant’s name into English)
Cayman Islands
(Jurisdiction of incorporation or organization)
17/F, Merchandise Harvest Building (East)
No. 333 North Chengdu Road
Shanghai, PRC 200041
People’s Republic of China
(Address of principal executive offices)
Li-Lan Cheng
E-House (China) Holdings Limited
17/F, Merchandise Harvest Building (East)
No. 333 North Chengdu Road
Shanghai, PRC 200041
People’s Republic of China
Phone: +8621 6133 0808
Facsimile: +8621 6133 0707
(Name, telephone, e-mail and/or facsimile number and address of company contact person)
| Title of each class | Name of exchange on which registered | |
| American Depositary Shares, each representing one ordinary share, par value $0.001 per share | New York Stock Exchange |
(Title of Class)
(Title of Class)
Securities Exchange Act of 1934 during the preceding 12 months (or for such shorter period that the registrant was required to file such reports), and (2) has been subject to such filing requirements for the past 90 days. Yesþ Noo
US GAAPþ | International Financial Reporting Standards as issued by the International Accounting Standards Boardo | Othero |
Table of Contents
| • | “China” or “PRC” refers to the People’s Republic of China, excluding, for the purpose of this annual report only, Taiwan, Hong Kong and Macau; |
| • | “CRIC system” refers to China Real Estate Information Circle, our proprietary real estate information database and analysis system; |
| • | “shares” or “ordinary shares” refers to our ordinary shares, par value $0.001 per share, and “preferred shares” refers to our series A convertible and redeemable preferred shares, all of which were converted into our ordinary shares upon the completion of our initial public offering on August 13, 2007; |
| • | “ADSs” refers to our American depositary shares, each of which represents one ordinary share, and “ADRs” refers to the American depositary receipts that evidence our ADSs; |
| • | “primary real estate market” refers to the market for newly constructed and completed residential and commercial real properties, “primary real estate agency services” refers to agency services provided for the primary real estate market, “secondary real estate market” refers to the market for all residential and commercial real properties other than those for sale in the primary real estate market, and “secondary real estate brokerage services” refers to brokerage services provided for the secondary real estate market; |
| • | “The China Real Estate Top 10 Committee” refers to a real estate market research task force jointly organized by the China Real Estate Association, the Enterprise Research Institute of Development Research Center of the State Council of PRC, the Institute of Real Estate Studies of Tsinghua University and the China Index Academy; and |
| • | all references to “RMB” or “Renminbi” are to the legal currency of China; all references to “$,” “dollars,” “US$” and “U.S. dollars” are to the legal currency of the United States; and all references to “HKD” and “Hong Kong dollars” are to the legal currency of the Hong Kong Special Administrative Region. |
1
Table of Contents
| • | our anticipated growth strategies; |
| • | our future business development, results of operations and financial condition; |
| • | expected changes in our revenues and certain cost or expense items; |
| • | our ability to attract clients and further enhance our brand recognition; and |
| • | trends and competition in the real estate services industry. |
2
Table of Contents
| As of and for the Year Ended December 31, | ||||||||||||||||||||
| 2004 | 2005 | 2006 | 2007 | 2008 | ||||||||||||||||
| (in thousands of $, except share, per share and per ADS data) | ||||||||||||||||||||
Consolidated Statement of Operations Data: | ||||||||||||||||||||
| Total revenues | 31,198 | 38,661 | 55,999 | 121,016 | 154,487 | |||||||||||||||
| Cost of revenues | (9,844 | ) | (10,818 | ) | (10,244 | ) | (23,510 | ) | (31,856 | ) | ||||||||||
| Selling, general and administrative expenses | (14,299 | ) | (13,250 | ) | (21,322 | ) | (45,546 | ) | (77,197 | ) | ||||||||||
| Income from operations | 7,055 | 14,593 | 24,433 | 51,960 | 45,434 | |||||||||||||||
| Net income | 5,589 | 11,148 | 18,107 | 41,726 | 39,576 | |||||||||||||||
Earnings per ordinary share and ADS(1): | ||||||||||||||||||||
| Basic | $ | 0.11 | $ | 0.22 | $ | 0.27 | $ | 0.62 | $ | 0.48 | ||||||||||
| Diluted | $ | 0.11 | $ | 0.22 | $ | 0.27 | $ | 0.56 | $ | 0.48 | ||||||||||
| Dividends per ordinary share: | ||||||||||||||||||||
| Basic | 0.10 | 0.07 | 0.08 | — | — | |||||||||||||||
| Weighted average number of ordinary shares used in per share calculations: | ||||||||||||||||||||
| Basic | 50,000,000 | 50,000,000 | 50,000,000 | 60,386,083 | 81,818,972 | |||||||||||||||
| Diluted | 50,000,000 | 50,000,000 | 67,372,353 | 74,555,709 | 82,110,430 | |||||||||||||||
Consolidated Balance Sheet Data: | ||||||||||||||||||||
| Cash and cash equivalents | 10,071 | 12,712 | 24,306 | 101,148 | 225,663 | |||||||||||||||
| Total assets | 54,159 | 48,231 | 89,430 | 329,553 | 519,914 | |||||||||||||||
| Total current liabilities | 40,785 | 39,895 | 28,751 | 54,510 | 108,673 | |||||||||||||||
| Mezzanine equity | — | — | 24,828 | — | — | |||||||||||||||
| Total shareholders’ equity | 9,807 | 5,242 | 32,370 | 271,173 | 403,298 | |||||||||||||||
| Note: (1) Each ADS represents one ordinary share. | ||
3
Table of Contents
| Noon Buying Rate | ||||||||||||||||
| Period | ||||||||||||||||
| Period | End | Average(1) | Low | High | ||||||||||||
| 2004 | 8.2765 | 8.2768 | 8.2774 | 8.2764 | ||||||||||||
| 2005 | 8.0702 | 8.1826 | 8.2765 | 8.0702 | ||||||||||||
| 2006 | 7.8041 | 7.9579 | 8.0702 | 7.8041 | ||||||||||||
| 2007 | 7.2946 | 7.5806 | 7.8127 | 7.2946 | ||||||||||||
| 2008 | 6.8225 | 6.9193 | 7.2946 | 6.7800 | ||||||||||||
| October | 6.8388 | 6.8358 | 6.8521 | 6.8171 | ||||||||||||
| November | 6.8254 | 6.8281 | 6.8373 | 6.8220 | ||||||||||||
| December | 6.8225 | 6.8539 | 6.8842 | 6.8225 | ||||||||||||
| 2009 January | 6.8392 | 6.8360 | 6.8403 | 6.8225 | ||||||||||||
| February | 6.8395 | 6.8363 | 6.8470 | 6.8241 | ||||||||||||
| March | 6.8329 | 6.8360 | 6.8438 | 6.8240 | ||||||||||||
| April (through April 24) | 6.8250 | 6.8318 | 6.8361 | 6.8250 | ||||||||||||
| (1) | Annual averages are calculated from month-end rates. Monthly averages are calculated using the average of the daily rates during the relevant period. |
4
Table of Contents
5
Table of Contents
6
Table of Contents
7
Table of Contents
8
Table of Contents
9
Table of Contents
10
Table of Contents
| • | revoking the business and operating licenses of our PRC subsidiaries and affiliates; | ||
| • | discontinuing or restricting our PRC subsidiaries’ and affiliates’ operations; | ||
| • | imposing conditions or requirements with which we or our PRC subsidiaries and affiliates may not be able to comply; or | ||
| • | requiring us or our PRC subsidiaries and affiliates to restructure the relevant ownership structure or operations. |
11
Table of Contents
12
Table of Contents
13
Table of Contents
14
Table of Contents
15
Table of Contents
16
Table of Contents
| • | actual or anticipated fluctuations in our quarterly operating results; |
| • | changes in financial estimates by securities research analysts; |
| • | conditions in the real estate industry in China; |
| • | changes in the economic performance or market valuations of other real estate services companies; |
| • | announcements by us or our competitors of new products, acquisitions, strategic partnerships, joint ventures or capital commitments; |
| • | addition or departure of key personnel; |
| • | fluctuations of exchange rates between the RMB and U.S. dollar or other foreign currencies; |
| • | potential litigation or administrative investigations; |
| • | sales or repurchases of our ADSs or ordinary shares; and |
| • | general economic or political conditions in China. |
17
Table of Contents
18
Table of Contents
19
Table of Contents
| For the Year Ended December 31, | ||||||||||||
| 2006 | 2007 | 2008 | ||||||||||
| Total GFA of new properties sold (thousands of square meters) | 1,955 | 3,985 | 4,115 | |||||||||
| Total value of new properties sold (millions of $) | 2,037 | 3,929 | 4,478 | |||||||||
20
Table of Contents
21
Table of Contents
22
Table of Contents
23
Table of Contents
24
Table of Contents
25
Table of Contents
 ” and “
 ” registered trademarks in China. We have also applied for the registration of the trademarks “
 ,” “CRIC,” “
 ” and “E-House.” We have registered our domain names,www.ehousechina.com,www.1fang.com,www.cityrehouse.com.cnandwww.yiju.orgwith China Internet Network Information Center. We have developed our CRIC system and own its copyright. Our rights in the CRIC system, including but not limited to rights to publish, amend, issue and license such copyright, are all protected in accordance with the “Computer Software Protect Regulation.” The copyright owner has the right to license or transfer the copyright to other parties by collecting remuneration. We have applied for and obtained the Software Copyright Certificate for the CRIC system, thus our core technology CRIC system is better protected under the PRC law.
26
Table of Contents
27
Table of Contents
| • | requiring real estate developers to fund with their internal resources 35% rather than 20% of the total projected capital outlays of any real estate development; |
| • | restricting credit availability based on the criteria that monthly housing expense, including mortgage payments and property service fees, to 50% of an individual borrower’s monthly income, and limiting all monthly debt service payments of an individual borrower to 55% of his or her monthly income; and |
| • | tightening regulations governing mortgage lending and restricting approval of areas for new development. |
| • | requiring that at least 70% of the land approved by a local government for residential real estate development for any given year be used for developing low- to medium-cost and small- to medium-sized units and low-cost rental properties; |
| • | requiring that at least 70% of the total development and construction area of residential projects approved, or construction which commenced, on or after June 1, 2006 within each city or county, consist of units with a floor area of less than 90 square meters per unit; |
| • | increasing the minimum down payment from 20% to 30% of the purchase price for property with a unit floor area of 90 square meters or more; and |
| • | imposing a business tax on the proceeds from re-sale of properties held for less than five years. |
28
Table of Contents
| • | for a first-time home owner, increasing the minimum amount of down payment to 30% of the purchase price of the underlying property if the underlying property has a unit floor area of 90 square meters or more and the purchaser is buying the property as his/her own residence; |
| • | for a second-time home buyer, increasing (i) the minimum amount of down payment to 40% of the purchase price of the underlying property and (ii) the minimum mortgage loan interest rate to 110% of the relevant benchmark lending interest rate of the People’s Bank of China; |
| • | for a commercial real estate buyer, (i) requiring banks not to finance any purchase of pre-sold properties, (ii) increasing the minimum amount of down payment to 50% of the purchase price of the underlying property, (iii) increasing the minimum mortgage loan interest rate to 110% of the relevant benchmark lending interest rate of People’s Bank of China, (iv) limiting the terms of such bank loans to no more than ten years, although the commercial banks are allowed flexibility based on its risk assessment; and |
| • | for a buyer of commercial/residential dual-purpose properties, increasing the minimum amount of down payment to 45% of the purchase price of the underlying property, with the other terms to be decided by reference to commercial properties. |
| • | In transactions where first time homebuyers purchase units with floor areas of 90 square meters or less, the deed tax rate is reduced to 1%; |
| • | all residential real estate transactions by individuals are exempt from stamp tax; and |
| • | all residential real estate transactions by individuals are exempt from land appreciation tax. |
29
Table of Contents
| • | From January 1, 2009 to December 31, 2009, |
| • | sales of ordinary housing units held by individuals for at least two years are exempt from business tax; |
| • | sales of ordinary housing units held by individuals for less than two years are subject to business tax on the difference between the sales price and the purchase price; |
| • | sales of non-ordinary housing units held by individuals for at least two years are subject to business tax on the difference between the sales price and the purchase price; |
| • | sales of non-ordinary housing units held by individuals for less than two years are subject to business tax on the sales price; and |
| • | The urban real estate tax is abolished and domestic enterprises, foreign enterprises, foreign-funded enterprises and individuals shall pay real estate tax in accordance with the Interim Regulation on Real Estate Tax. |
30
Table of Contents
31
Table of Contents
| • | the Wholly Foreign Owned Enterprise Law (1986), as amended; |
| • | the Wholly Foreign Owned Enterprise Law Implementing Rules (1990), as amended; |
| • | the Sino-foreign Equity Joint Venture Enterprise Law (1979), as amended; and |
| • | the Sino-foreign Equity Joint Venture Enterprise Law Implementing Rules (1983), as amended. |
| • | we are able to exert effective control over Tian Zhuo and its subsidiaries; |
| • | a substantial portion of the economic benefits of Tian Zhuo and its subsidiaries are transferred to us; and |
| • | we have an exclusive option to purchase all of the equity interests in Tian Zhuo to the extent permitted by PRC law. |
32
Table of Contents
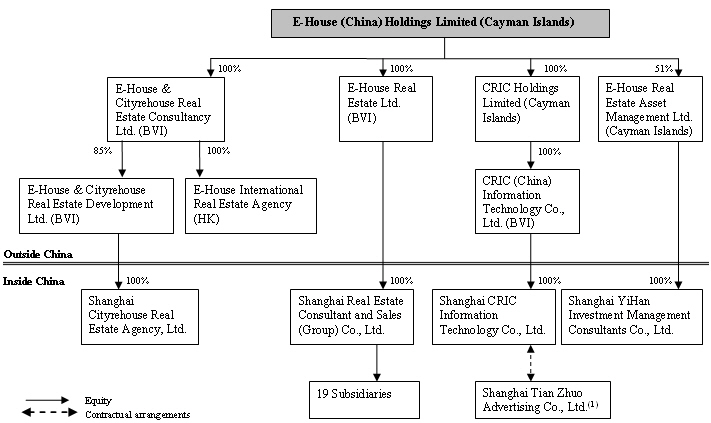
| (1) | Shanghai Tian Zhuo Advertising Co., Ltd. is a variable interest entity established in China in 2008 and is wholly owned by Mr. Xin Zhou, our chief executive officer. We effectively control Shanghai Tian Zhuo Advertising Co., Ltd. through contractual arrangements. See “Item 7. Major Shareholders and Related Party Transactions—B. Related Party Transactions—Contractual Agreements with Shanghai Tian Zhuo Advertising Co. Ltd.” |
33
Table of Contents
| For The Year Ended December 31, | ||||||||||||||||||||||||
| 2006 | 2007 | 2008 | ||||||||||||||||||||||
| $ | % | $ | % | $ | % | |||||||||||||||||||
| Revenues: | ||||||||||||||||||||||||
| Primary real estate agency services | 45,708 | 81.6 | 100,541 | 83.1 | 90,492 | 58.6 | ||||||||||||||||||
| Secondary real estate brokerage services | 3,846 | 6.9 | 11,888 | 9.8 | 12,058 | 7.8 | ||||||||||||||||||
| Real estate consulting and information services | 6,445 | 11.5 | 8,587 | 7.1 | 49,816 | 32.2 | ||||||||||||||||||
| Others | — | — | — | — | 2,121 | 1.4 | ||||||||||||||||||
| Total revenues | 55,999 | 100.0 | 121,016 | 100.0 | 154,487 | 100.0 | ||||||||||||||||||
34
Table of Contents
| • | total GFA of the properties we sell; |
| • | total transaction value of the properties we sell; and |
| • | commission rates. |
35
Table of Contents
36
Table of Contents
| Number of Ordinary Shares | ||||||||
| Grant Date | Underlying Options Granted | Exercise Price | ||||||
| November 28, 2006 | 436,364 | (1) | $ | 3.30 | ||||
| March 9, 2007 | 300,000 | $ | 5.50 | |||||
| July 17, 2007 | 640,833 | (2) | $ | 5.37 | (2) | |||
| July 23, 2007 | 66,666 | (2) | $ | 5.37 | (2) | |||
| January 7, 2008 | 427,000 | (2) | $ | 5.37 | (2) | |||
| January 10, 2008 | 21,500 | $ | 5.37 | (2) | ||||
| April 15, 2008 | 708,500 | (2) | $ | 5.37 | (2) | |||
| June 12, 2008 | 10,000 | $ | 5.37 | (2) | ||||
| August 3, 2008 | 100,000 | $ | 5.37 | (2) | ||||
| (1) | These options were subsequently surrendered for cancellation in exchange for the same number of restricted shares having the same vesting schedule and a purchase price equal to the original option exercise price. | |
| (2) | On November 7, 2008, our board of directors authorized the adjustment of the exercise price of some previously granted options to $5.37 per ordinary share and authorized the amendment and restatement of options granted pursuant to our share option plan. Modifications subsequently made to selected granted options pursuant to this authorization did not affect the manner in which we recognize share-based compensation expense. |
We engaged an independent appraiser to assess the fair value of our options and ordinary shares underlying the options. Determining the fair value of options and ordinary shares requires making complex and subjective judgments. In assessing the fair value of our ordinary shares prior to our IPO on August 8, 2007, we considered the following principal factors:
| • | the nature of our business and the contracts and agreements relating to our business; |
| • | the global economic outlook in general and the specific economic and competitive elements affecting our business; |
| • | the nature and prospects of the real estate services industry in China; |
| • | the growth of our operations; and |
| • | our business risks. |
The fair value of our ordinary shares was determined to be $3.30 per share as of November 28, 2006, which was the price in a share sales transaction between an existing shareholder of our company and a group of third parties unrelated to us, which transaction took place one day after we granted the option.
The income approach was used to assess the fair value of our ordinary shares as of March 9 and July 23, 2007. The income approach resulted in a fair value of $5.50 and $10.67 per share, respectively. The March 9, 2007 valuation was the same as the price in a share sales transaction between an existing shareholder of our company and a group of third parties unrelated to us, which transaction took place three days before we granted the options.
The income approach involved applying appropriate discount rates to estimated cash flows that were based on our earnings forecasts. The major assumptions used by the independent appraiser in deriving the fair value of our ordinary shares were consistent with our business plan and major milestones that we achieved. Other major assumptions used in determining the fair value of our ordinary share as of March 9 and July 23, 2007 included the following:
| • | Weighted average costs of capital, or WACC, of 13.2% and 14.3%, respectively, was used. This was the combined result of the changes in risk-free rate and industry average beta and the decrease in our company-specific risks; and |
| • | Discount for Lack of Marketability, or DLOM, of 6% was used for both valuations. This took into consideration our proposed offering in several months. |
The independent appraiser also used other general assumptions, including the following: no material changes in the existing political, legal, fiscal and economic conditions and real estate industry in China; our ability to retain competent management and key personnel to support our ongoing operations; and no material deviation in market conditions from economic forecasts.
37
Table of Contents
38
Table of Contents
39
Table of Contents
40
Table of Contents
| For the Year Ended December 31, | ||||||||||||
| 2006 | 2007 | 2008 | ||||||||||
| (in thousands of $) | ||||||||||||
Consolidated Statement of Operations Data: | ||||||||||||
| Revenues | 55,999 | 121,016 | 154,487 | |||||||||
| Cost of revenues | (10,244 | ) | (23,510 | ) | (31,856 | ) | ||||||
| Selling, general and administrative expenses | (21,322 | ) | (45,546 | ) | (77,197 | ) | ||||||
| Income from operations | 24,433 | 51,960 | 45,434 | |||||||||
| Other income (expense): | ||||||||||||
| Interest expense | (594 | ) | (622 | ) | (2,420 | ) | ||||||
| Interest income | 206 | 2,490 | 3,063 | |||||||||
| Other income | 168 | 199 | 1,970 | |||||||||
| Income before taxes, equity in affiliates and minority interest | 24,213 | 54,027 | 48,047 | |||||||||
| Income tax expenses | (5,751 | ) | (10,277 | ) | (8,713 | ) | ||||||
| Income from investment in affiliates | — | — | 154 | |||||||||
| Minority interests, net of tax | (355 | ) | (2,024 | ) | 88 | |||||||
| Net income | 18,107 | 41,726 | 39,576 | |||||||||
| Secondary | ||||||||||||||||||||||||
| real estate | Real estate | |||||||||||||||||||||||
| Primary real | brokerage | consulting | ||||||||||||||||||||||
| estate agency | service | and information | ||||||||||||||||||||||
| 2008 | service segment | segment | service segment | Others | Non-allocated | Total | ||||||||||||||||||
| $ | $ | $ | $ | $ | $ | |||||||||||||||||||
| Revenues from external customers | 90,492,009 | 12,058,598 | 49,815,916 | 2,120,932 | — | 154,487,455 | ||||||||||||||||||
| Cost of revenues | (27,179,848 | ) | (1,725,941 | ) | (2,855,398 | ) | (94,661 | ) | — | (31,855,848 | ) | |||||||||||||
| Selling, general and administrative expenses | (33,624,754 | ) | (20,209,062 | ) | (14,446,451 | ) | (2,109,633 | ) | (6,807,731 | ) | (77,197,631 | ) | ||||||||||||
| Income/(loss) from operations | 29,687,407 | (9,876,405 | ) | 32,514,067 | (83,362 | ) | (6,807,731 | ) | 45,433,976 | |||||||||||||||
| Interest expense | — | — | — | — | (2,420,468 | ) | (2,420,468 | ) | ||||||||||||||||
| Interest income | 551,545 | 30,475 | 416,769 | 8,152 | 2,055,572 | 3,062,513 | ||||||||||||||||||
| Other income | 1,209,253 | 22,483 | (1,110,367 | ) | — | 1,849,112 | 1,970,481 | |||||||||||||||||
| Income before taxes, equity in an associate and minority interest | 31,448,205 | (9,823,447 | ) | 31,820,469 | (75,210 | ) | (5,323,515 | ) | 48,046,502 | |||||||||||||||
| Income tax expense | (4,825,590 | ) | 52,535 | (4,245,774 | ) | 306,271 | — | (8,712,558 | ) | |||||||||||||||
| Income before equity in an associate and minority interest | 26,622,615 | (9,770,912 | ) | 27,574,695 | 231,061 | (5,323,515 | ) | 39,333,944 | ||||||||||||||||
| Income from investment in affiliated company | — | — | 153,700 | — | — | 153,700 | ||||||||||||||||||
| Net income/(loss) after taxes before minority interest | 26,622,615 | (9,770,912 | ) | 27,728,395 | 231,061 | (5,323,515 | ) | 39,487,644 | ||||||||||||||||
41
Table of Contents
| Secondary | ||||||||||||||||||||
| real estate | Real estate | |||||||||||||||||||
| Primary real | brokerage | consulting | ||||||||||||||||||
| estate agency | service | and information | ||||||||||||||||||
| 2007 | service segment | segment | service segment | Non-allocated | Total | |||||||||||||||
| $ | $ | $ | $ | $ | ||||||||||||||||
| Revenues from external customers | 100,541,226 | 11,888,443 | 8,586,931 | — | 121,016,600 | |||||||||||||||
| Cost of revenues | (22,859,701 | ) | — | (650,364 | ) | — | (23,510,065 | ) | ||||||||||||
| Selling, general and administrative expenses | (23,777,560 | ) | (14,997,248 | ) | (4,402,954 | ) | (2,368,038 | ) | (45,545,800 | ) | ||||||||||
| Income/(loss) from operations | 53,903,965 | (3,108,805 | ) | 3,533,613 | (2,368,038 | ) | 51,960,735 | |||||||||||||
| Interest expense | — | — | — | (621,903 | ) | (621,903 | ) | |||||||||||||
| Interest income | 884,139 | 36,274 | 2,797 | 1,566,458 | 2,489,668 | |||||||||||||||
| Other income | 753,476 | 96,372 | (503,849 | ) | (148,107 | ) | 197,892 | |||||||||||||
| Income before taxes and minority interest | 55,541,580 | (2,976,159 | ) | 3,032,561 | (1,571,590 | ) | 54,026,392 | |||||||||||||
| Income tax expense | (10,312,711 | ) | (4,506 | ) | 40,177 | — | (10,277,040 | ) | ||||||||||||
| Net income/(loss) after taxes before minority interest | 45,228,869 | (2,980,665 | ) | 3,072,738 | (1,571,590 | ) | 43,749,352 | |||||||||||||
| Secondary | ||||||||||||||||||||
| real estate | Real estate | |||||||||||||||||||
| Primary real | brokerage | consulting | ||||||||||||||||||
| estate agency | service | and information | ||||||||||||||||||
| 2006 | service segment | segment | service segment | Non-allocated | Total | |||||||||||||||
| $ | $ | $ | $ | $ | ||||||||||||||||
| Revenues from external customers | 45,708,032 | 3,845,296 | 6,445,196 | — | 55,998,524 | |||||||||||||||
| Cost of revenues | (10,062,254 | ) | — | (181,714 | ) | — | (10,243,968 | ) | ||||||||||||
| Selling, general and administrative income/(expenses) | (13,397,110 | ) | (5,285,358 | ) | (703,026 | ) | (1,936,232 | ) | (21,321,726 | ) | ||||||||||
| Income/(Loss) from operations | 22,248,668 | (1,440,062 | ) | 5,560,456 | (1,936,232 | ) | 24,432,830 | |||||||||||||
| Interest expense | — | — | — | (594,488 | ) | (594,488 | ) | |||||||||||||
| Interest income | 188,888 | 6,115 | 11,375 | — | 206,378 | |||||||||||||||
| Income/(Loss) before taxes and minority interest | 22,605,571 | (1,433,947 | ) | 5,571,831 | (2,530,720 | ) | 24,212,735 | |||||||||||||
| Income tax expense | (5,751,102 | ) | — | — | — | (5,751,102 | ) | |||||||||||||
| Net income/(loss) after taxes before minority interest | 16,854,469 | (1,433,947 | ) | 5,571,831 | (2,530,720 | ) | 18,461,633 | |||||||||||||
| • | Primary Real Estate Agency Services. Revenues from our primary real estate agency services decreased by 10.0% from $100.5 million in 2007 to $90.5 million in 2008. This decrease was primarily due to a lower average commission rate of 2.0% in 2008, compared to 2.6% in 2007. This was partially offset by increases in both the GFA and total transaction value of new properties sold. The GFA of properties we sold increased from approximately 4.0 million square meters in 2007 to approximately 4.1 million square meters in 2008 and the total transaction value of the properties we sold increased from $3.9 billion in 2007 to $4.5 billion in 2007. |
| • | Secondary Real Estate Brokerage Services. Revenues from our secondary real estate brokerage services increased by 1.4% from $11.9 million in 2007 to $12.1 million in 2008. Revenue growth was negatively affected by reduced secondary real estate transaction volume in 2008 as a result of slower growth in China’s economy and deterioration of the demand for real estate purchases. As of December 31, 2008, we had a total of 115 secondary real estate brokerage stores in five cities in China, compared to 160 stores as of December 31, 2007, as a result of our decision to reduce the number of stores in response to deteriorating market conditions and in an effort to decrease operating expenses. |
42
Table of Contents
| • | Real Estate Consulting and Information Services. Revenues from our real estate consulting and information services increased by 480.1% from $8.6 million in 2007 to $49.8 million in 2008. This growth was primarily due to substantial consulting revenues derived from strategic arrangements we entered into with major developers covering multiple cities and projects and an increase in the number and size of consulting projects completed for other developers. The increase also resulted from the completion of a number of consulting projects associated with land transfer in 2008. |
| • | Primary Real Estate Agency Segment. Selling, general and administrative expenses for our primary real estate agency segment increased by 41.4% from $23.8 million in 2007 to $33.6 million in 2008 primarily due to an increase in staff salaries for our management employees by $2.7 million as a result of hiring additional staff and increases in salaries, and an increase in marketing, consulting, rental and travel expenses by $5.8 million as a result of hiring new employees and expanding our operations. |
| • | Secondary Real Estate Brokerage Service Segment. Selling, general and administrative expenses for our secondary real estate brokerage service segment increased by 34.8% from $15.0 million in 2007 to $20.2 million in 2008 primarily due to an increase in staff salaries by $3.2 million as a result of a larger number of staff, and an increase in rental and administrative expenses for our brokerage storefronts by $3.7 million as a result of operating a higher average number of stores in 2008 than in 2007. |
| • | Real Estate Consulting and Information Service Segment. Selling , general and administrative expense for our real estate consulting and information service segment increased by 228.1% from $4.4 million in 2007 to $14.4 million in 2008 primarily due to an increase in staff salaries for our management employees by $5.5 million as a result of hiring additional staff and increases in salaries, and an increase in marketing, consulting, rental, travel and other administrative expenses by $5.4 million as a result of hiring new employees and expanding our operations. |
43
Table of Contents
| • | Primary Real Estate Agency Services. Revenues from our primary real estate agency services increased by 120.0% from $45.7 million in 2006 to $100.5 million in 2007. This increase was primarily due to the further expansion of primary real estate agency operations, which resulted in a significant increase in the GFA and total transaction value of new properties sold. The GFA of properties we sold increased from approximately 2.0 million square meters in 2006 to approximately 4.0 million square meters in 2007 and the total transaction value of the properties we sold increased from $2.0 billion in 2006 to $3.9 billion in 2007. The average commission rate was 2.6% in 2007, compared to 2.2% in 2006, mainly due to higher commission revenues earned upon exceeding sales targets for a number of projects. |
| • | Secondary Real Estate Brokerage Services. Revenues from our secondary real estate brokerage services increased substantially by 209.2% from $3.8 million in 2006 to $11.9 million in 2007. This growth was primarily attributable to the continued expansion of our secondary real estate brokerage services. As of December 31, 2007, we had a total of 160 secondary real estate brokerage stores in five cities in China. |
| • | Real Estate Consulting and Information Services. Revenues from our real estate consulting and information services increased by 33.2% from $6.4 million in 2006 to $8.6 million in 2007. This growth was primarily due to continued expansion of our real estate consulting services and our strengthened efforts in commercializing the CRIC system in 2007. |
| • | Primary Real Estate Agency Segment. Selling, general and administrative expenses for our primary real estate agency segment increased from $13.4 million in 2006 to $23.8 million in 2007 primarily due to an increase in staff costs for our management employees by $4.6 million as a result of hiring additional staff, and an increase in marketing, consulting, rental, travel, and other administrative expenses by $5.8 million as a result of expanding our operations and hiring new employees. |
| • | Secondary Real Estate Brokerage Service Segment. Selling, general and administrative expenses for our secondary real estate brokerage service segment increased from $5.3 million in 2006 to $15.0 million in 2007 primarily due to the expansion of our secondary real estate brokerage service, resulting in increases in staff costs by $4.4 million due to the hiring of additional staff, and increase in marketing, rental and administrative expenses for brokerage storefronts by $5.3 million. |
| • | Real Estate Consulting and Information Service Segment.Selling, general and administrative expenses for our real estate consulting and information service segment changed from an income of $0.7 million in 2006 to an expense of $4.4 million in 2007 primarily due to an increase in staff costs for our management employees by $2.6 million as a result of hiring additional staff, and an increase in marketing, consulting, rental, travel, and other administrative expenses by $1.1 million as a result of expanding our operations and hiring new employees. |
44
Table of Contents
| For the Year Ended December 31, | ||||||||||||
| 2006 | 2007 | 2008 | ||||||||||
| (in thousands of $) | ||||||||||||
| Net cash (used in) provided by operating activities | (2,590 | ) | (81,273 | ) | 77,973 | |||||||
| Net cash (used in) provided by investing activities | (12,624 | ) | (5,500 | ) | (26,521 | ) | ||||||
| Net cash provided by (used in) financing activities | 26,413 | 162,108 | 70,103 | |||||||||
| Net increase (decrease) in cash and cash equivalents | 11,594 | 76,842 | 124,515 | |||||||||
| Cash and cash equivalents at beginning of the period | 12,712 | 24,306 | 101,148 | |||||||||
| Cash and cash equivalents at end of the period | 24,306 | 101,148 | 225,663 | |||||||||
45
Table of Contents
| Type | Amount | Interest Rate | Maturity Date | |||||||||
| Bank loan | RMB100,000,000 ($14,657,000) | 7.2270% fixed rate | September 17, 2009 | |||||||||
| Bank loan | RMB50,000,000 ($7,329,000) | 6.1380% fixed rate | March 30, 2009 | |||||||||
46
Table of Contents
”and “”registered trademarks in China. We have also applied for the registration of the trademarks “,” “CRIC,” “” and“E-House.” We have registered our domain names, www.ehousechina.com, www.1fang.com, www.cityrehouse.com.cn and www.yiju.org with China Internet Network Information Center. We have developed our CRIC system and own its copyright. Our rights in the CRIC system, including but not limited to rights to publish, amend, issue and license such copyright, are all protected in accordance with the “Computer Software Protect Regulation.” The copyright owner has the right to license or transfer the copyright to other parties by collecting remuneration. We have applied for and obtained the Software Copyright Certificate for the CRIC system, thus our core technology CRIC system is better protected under the PRC law.
47
Table of Contents
| Payment Due by Period | ||||||||||||||||||||
| Less than | More than | |||||||||||||||||||
| Total | 1 year | 1-3 year | 3-5 year | 5 years | ||||||||||||||||
| (in thousands of $) | ||||||||||||||||||||
| Short-term debt obligations (including interest payment) | 21,947 | 21,947 | — | — | — | |||||||||||||||
| Operating lease obligations | 19,041 | 9,491 | 8,333 | 1,213 | 4 | |||||||||||||||
| Total | 40,988 | 31,438 | 8,333 | 1,213 | 4 | |||||||||||||||
48
Table of Contents
| Directors and Executive Officers | Age | Position/Title | ||||
| Xin Zhou | 41 | Chairman, Chief Executive Officer | ||||
| Neil Nanpeng Shen | 41 | Director | ||||
| Charles Chao | 43 | Director | ||||
| Bing Xiang | 46 | Independent Director | ||||
| Hongchao Zhu | 49 | Independent Director | ||||
| May Wu | 41 | Independent Director | ||||
| Jeffrey Zhijie Zeng | 40 | Independent Director | ||||
| Yunchang Gu | 65 | Independent Director | ||||
| Canhao Huang | 51 | Executive Director and Head of Operations Management | ||||
| Li-Lan Cheng | 44 | Chief Financial Officer | ||||
| Yongyue Zhang | 54 | Head of E-House Research Institute | ||||
| Jianjun Zang | 41 | Co-head of Primary Agency Service | ||||
| Xudong Zhu | 41 | Co-head of Primary Agency Service | ||||
| Zuyu Ding | 35 | Head of Consulting and Information Service | ||||
| Ber Jen Ko | 45 | Head of Secondary Brokerage Service | ||||
49
Table of Contents
50
Table of Contents
51
Table of Contents
| Ordinary Shares | Exercise Price(2) | |||||||||
| Name | Underlying Options | ($/Share) | Date of Grant | Date of Expiration | ||||||
| Neil Nanpeng Shen | 40,000 | 5.50 | March 9, 2007 | March 8, 2017 | ||||||
| 20,000 | 5.37 | April 15, 2008 | April 14, 2018 | |||||||
| Charles Chao | 60,000 | 5.50 | March 9, 2007 | March 8, 2017 | ||||||
| 20,000 | 5.37 | April 15, 2008 | April 14, 2018 | |||||||
| Bing Xiang | 40,000 | 5.50 | March 9, 2007 | March 8, 2017 | ||||||
| 20,000 | 5.37 | April 15, 2008 | April 14, 2018 | |||||||
| Hongchao Zhu | 40,000 | 5.50 | March 9, 2007 | March 8, 2017 | ||||||
| 20,000 | 5.37 | April 15, 2008 | April 14, 2018 | |||||||
| May Wu | 40,000 | 5.37 | April 15, 2008 | April 14, 2018 | ||||||
| 20,000 | 5.37 | August 3, 2008 | August 2, 2018 | |||||||
| Jeffrey Zhijie Zeng | 40,000 | 5.37 | August 3, 2008 | August 2, 2018 | ||||||
| Yunchang Gu | 40,000 | 5.37 | August 3, 2008 | August 2, 2018 | ||||||
| Yongyue Zhang | 40,000 | 5.37 | April 15, 2008 | April 14, 2018 | ||||||
| Li-Lan Cheng | 436,364 | (1) | 3.30 | November 28, 2006 | No expiration date | |||||
| 40,000 | 5.37 | April 15, 2008 | April 14, 2018 | |||||||
| Jianjun Zang | 40,000 | 5.37 | April 15, 2008 | April 14, 2018 | ||||||
| Xudong Zhu | 40,000 | 5.37 | April 15, 2008 | April 14, 2018 | ||||||
| Canhao Huang | 40,000 | 5.37 | April 15, 2008 | April 14, 2018 | ||||||
| Zuyu Ding | 100,000 | 5.37 | July 17, 2007 | July 16, 2017 | ||||||
| 40,000 | 5.37 | April 15, 2008 | April 14, 2018 | |||||||
| Ber Jen Ko | 80,000 | 5.50 | March 9, 2007 | March 8, 2017 | ||||||
| 20,000 | 5.37 | April 15, 2008 | April 14, 2018 | |||||||
| Other Individuals as a group | 1,434,499 | (2)(3) | 5.37 to 5.50 | March 9, 2007 to | March 8, 2017 to | |||||
| June 12, 2008 | June 11, 2018 | |||||||||
| (1) | These options were subsequently surrendered for cancellation in exchange for the same number of restricted shares having the same vesting schedule and a purchase price equal to the original option exercise price. | |
| (2) | On November 7, 2008, our board of directors authorized the adjustment of the exercise price of some previously granted options to $5.37 per ordinary share and authorized the amendment of the terms of options granted pursuant to the E-House plan. Modifications subsequently made to selected options pursuant to this authorization did not affect the manner in which we recognize share-based compensation expense. | |
| (3) | As of March 31, 2009, options representing 296,501 underlying ordinary shares previously granted to various individuals have been cancelled. |
52
Table of Contents
53
Table of Contents
| Common Shares | Exercise Price | |||||||||||
| Name | Underlying Options | ($/Share) | Date of Grant | Date of Expiration | ||||||||
| Xin Zhou | 2,500,000 | 1.50 | January 1, 2009 | December 31, 2018 | ||||||||
| Yongyue Zhang | 1,500,000 | 1.50 | January 1, 2009 | December 31, 2018 | ||||||||
| Li-Lan Cheng | 500,000 | 1.50 | January 1, 2009 | December 31, 2018 | ||||||||
| Jianjun Zang | 50,000 | 1.50 | January 1, 2009 | December 31, 2018 | ||||||||
| Xudong Zhu | 50,000 | 1.50 | January 1, 2009 | December 31, 2018 | ||||||||
| Canhao Huang | 50,000 | 1.50 | January 1, 2009 | December 31, 2018 | ||||||||
| Zuyu Ding | 2,000,000 | 1.50 | January 1, 2009 | December 31, 2018 | ||||||||
| Ber Jen Ko | 20,000 | 1.50 | January 1, 2009 | December 31, 2018 | ||||||||
| Other Individuals as a group | 5,310,000 | 1.50 | January 1, 2009 | December 31, 2018 | ||||||||
| • | appointing the independent auditors and pre-approving all audit and non-audit services permitted to be performed by the independent auditors; | ||
| • | reviewing with the independent auditors any audit problems or difficulties and management’s response; | ||
| • | reviewing and approving all proposed related party transactions, as defined in Item 404 of Regulation S-K under the Securities Act; | ||
| • | discussing the annual audited financial statements with management and the independent auditors; | ||
| • | reviewing major issues as to the adequacy of our internal controls and any special audit steps adopted in light of material control deficiencies; and | ||
| • | meeting separately and periodically with management and the independent auditors. |
54
Table of Contents
| • | reviewing and evaluating at least annually and, if necessary, revising the compensation policies adopted by our management; | ||
| • | reviewing and evaluating at least annually the performance, and determining the compensation, of our chief executive officer; | ||
| • | reviewing and approving our chief executive officer’s employment agreement and amendments thereto, and severance arrangement, if any; | ||
| • | reviewing all annual bonus, long-term incentive compensation, share option, employee pension and welfare benefit plans; and | ||
| • | reviewing and approving director and executive officer indemnification and insurance matters, and any employee loans in an amount equal to or greater than $60,000. |
| • | recommending to our board of directors for nomination or appointment by the board such candidates as the committee has found to be well qualified and willing and ready to be elected or reelected to serve as our members of our board or its committees or to fill any vacancies on our board or its committees, respectively; | ||
| • | reviewing annually the composition of our board of directors and its committees in light of the characteristics of independence, qualification, experience and availability of the board members; | ||
| • | developing and recommending to our board of directors a set of corporate governance guidelines and principles applicable to the company; and | ||
| • | monitoring of compliance with the company’s code of business conduct and ethics, including reviewing the adequacy and effectiveness of our internal rules and procedures to ensure compliance with applicable laws and regulations. |
55
Table of Contents
| Number of | Percentage of | |||||||
| Employees | Employees | |||||||
| Corporate Offices | 1,173 | 18.3 | % | |||||
| Research Department | 1,626 | 25.4 | % | |||||
| Sales Staff | 3,598 | 56.3 | % | |||||
| Total | 6,397 | 100.0 | % | |||||
| • | each of our directors and executive officers; and | ||
| • | each person known to us to own beneficially more than 5.0% of our ordinary shares. |
56
Table of Contents
| Shares Beneficially Owned | ||||||||
| Immediately | ||||||||
| Number | % | |||||||
Directors and Executive Officers: | ||||||||
Xin Zhou(1)(†) | 24,884,500 | 31.30 | ||||||
Neil Nanpeng Shen(2) | 6,786,664 | 8.53 | ||||||
Charles Chao(3) | 51,666 | * | ||||||
Bing Xiang(4) | 36,664 | * | ||||||
Hongchao Zhu(5) | 36,664 | * | ||||||
May Wu(6) | 13,333 | * | ||||||
Yongyue Zhang(7) | 759,800 | * | ||||||
Li-Lan Cheng(8) | 292,364 | * | ||||||
Jianjun Zang(9)(†) | 3,245,646 | 4.08 | ||||||
Canhao Huang(10)(†) | 1,085,457 | 1.37 | ||||||
Zuyu Ding(11)(†) | 390,783 | * | ||||||
Ber Jen Ko(12) | 53,600 | * | ||||||
| Xudong Zhu | — | * | ||||||
| Jeffrey Zhijie Zeng | — | * | ||||||
| Yunchang Gu | — | * | ||||||
All Directors and Executive Officers as a Group(†) | 32,948,588 | 41.31 | ||||||
Principal Shareholders: | ||||||||
On Chance Inc.(13)(†) | 12,969,500 | 16.31 | ||||||
CHF Investment Limited(14) | 9,307,874 | 11.71 | ||||||
Jun Heng Investment Limited(15)(†) | 11,915,000 | 14.99 | ||||||
Smart Create Group Limited(16) | 6,750,000 | 8.49 | ||||||
Orbis Investment Management (B.V.I) Limited and affiliates(17) | 5,697,510 | 7.17 | ||||||
| * | Less than 1% of our total outstanding shares. | |
| † | Each of these directors and executive officers is a beneficial owner of our shares through On Chance Inc., Jun Heng Investment Limited or both, as the case may be. On Chance Inc., or On Chance, is also a shareholder of Jun Heng Investment Limited, or Jun Heng. | |
| (1) | Includes 12,969,500 ordinary shares and 11,915,000 ordinary shares respectively held by On Chance Inc., or On Chance, and Jun Heng Investment Limited, or Jun Heng. Each of On Chance and Jun Heng is a company incorporated in British Virgin Islands and controlled by Mr. Zhou. As a result, Mr. Zhou is deemed to be the beneficial owner of 24,884,500 ordinary shares of our company. Mr. Zhou disclaims beneficial ownership of these 24,884,500 shares except to the extent of his pecuniary interest therein. The business address of Mr. Zhou is 17/F, Merchandise Harvest Building (East), No. 333 North Chengdu Road, Shanghai, PRC 200041, People’s Republic of China. | |
| (2) | Includes 6,750,000 ordinary shares held by Smart Create Group Limited, or Smart Create, a British Virgin Islands company that is controlled by Mr. Shen. Mr. Shen, a shareholder of Smart Create, has been granted a voting proxy by the other shareholders of Smart Create to vote on their behalf. Mr. Shen disclaims beneficial ownership of these 6,750,000 shares except to the extent of his pecuniary interest therein. The business address of Mr. Shen is Suite 2215, 22/F, Two Pacific Place, 88 Queensway Road, Hong Kong. | |
| (3) | Represents 51,666 shares issuable upon exercise of options held by Mr. Chao within 60 days from March 31, 2009. The business address of Mr. Chao is 17/F, Merchandise Harvest Building (East), No. 333 North Chengdu Road, Shanghai, PRC 200041, People’s Republic of China. | |
| (4) | Represents 36,664 shares issuable upon exercise of options held by Mr. Xiang within 60 days from March 31, 2009. The business address of Mr. Xiang is 17/F, Merchandise Harvest Building (East), No. 333 North Chengdu Road, Shanghai, PRC 200041, People’s Republic of China. | |
| (5) | Represents 36,664 shares issuable upon exercise of options held by Mr. Zhu within 60 days from March 31, 2009. The business address of Mr. Zhu is 17/F, Merchandise Harvest Building (East), No. 333 North Chengdu Road, Shanghai, PRC 200041, People’s Republic of China. |
57
Table of Contents
| (6) | Represents 13,333 shares issuable upon exercise of options held by Ms. Wu within 60 days from March 31, 2009. The business address of Ms. Wu is 17/F, Merchandise Harvest Building (East), No. 333 North Chengdu Road, Shanghai, PRC 200041, People’s Republic of China. | |
| (7) | Represents 759,800 ordinary shares held by Mr. Zhang. The business address of Mr. Zhang is 17/F, Merchandise Harvest Building (East), No. 333 North Chengdu Road, Shanghai, PRC 200041, People’s Republic of China. | |
| (8) | Represents 292,364 restricted shares held by Mr. Cheng. The business address of Mr. Cheng is 17/F, Merchandise Harvest Building (East), No. 333 North Chengdu Road, Shanghai, PRC 200041, People’s Republic of China. | |
| (9) | Represents 3,245,646 ordinary shares held by Jun Heng that is approximately 27.24%-owned by Mr. Zang. The business address of Mr. Zang is 17/F, Merchandise Harvest Building (East), No. 333 North Chengdu Road, Shanghai, PRC 200041, People’s Republic of China. | |
| (10) | Represents 1,085,457 ordinary shares held by Jun Heng that is approximately 9.11%-owned by Mr. Huang. The business address of Mr. Huang is 17/F, Merchandise Harvest Building (East), No. 333 North Chengdu Road, Shanghai, PRC 200041, People’s Republic of China. | |
| (11) | Represents 357,450 ordinary shares held by Jun Heng that is approximately 3.00%-owned by Mr. Ding. The business address of Mr. Ding is 17/F, Merchandise Harvest Building (East), No. 333 North Chengdu Road, Shanghai, PRC 200041, People’s Republic of China. | |
| (12) | Represents 53.600 shares issuable upon exercise of options held by Mr. Ko within 60 days from March 31, 2009. The business address of Mr. Ko is 17/F, Merchandise Harvest Building (East), No. 333 North Chengdu Road, Shanghai, PRC 200041, People’s Republic of China. | |
| (13) | On Chance Inc. is a company incorporated in British Virgin Islands and 95%-owned by Xin Zhou. The registered address of On Chance Inc. is Sea Meadow House, Blackburne Highway, Road Town, Tortola, British Virgin Islands. | |
| (14) | Represents 9,307,874 ordinary shares held by CHF Investment Limited, a British Virgin Islands company, with the registered address at P.O. Box 173, Kingston Chambers, Road Town, Tortola, British Virgin Islands. Voting and investment power of shares beneficially held by CHF Investment Limited is exercised by a committee which consists of Mark Qiu, Hung Shih, Li Zhenzhi, Charles Pieper and Nicole Arnaboldi. The address for these committee members is c/o China Renaissance Capital Investment, L.P., M&C Corporate Services Limited, P.O. Box 309GT, Ugland House, South Church Street, George Town, Grand Cayman, Cayman Islands. In addition, 720,000 ordinary shares are held by China Century Investment Fund Limited, a Cayman Islands company, with registered address at M&C Corporate Services Limited, P.O. Box 309GT, Ugland House, South Church Street, George Town, Grand Cayman, Cayman Islands. Voting and investment power of shares beneficially held by China Century Investment Fund Limited is exercised by the same committee of five persons. Such persons disclaim beneficial ownership of these 10,027,874 shares except to the extent of their pecuniary interest therein. | |
| (15) | Jun Heng Investment Limited is a company incorporated in British Virgin Islands and controlled by Xin Zhou. The registered address of Jun Heng Investment Limited is Beaufort House, P.O. Box 438, Road Town, Tortola, British Virgin Islands. | |
| (16) | Smart Create Group Limited is a company incorporated in British Virgin Islands and controlled by Neil Nanpeng Shen. The registered address of Smart Create Group Limited is P.O. Box 957, Offshore Incorporations Centre, Road Town, Tortola, British Virgin Islands. | |
| (17) | Based on Schedule 13G filed by Orbis Investment Management (B.V.I) Limited, Orbis Investment Management Limited and Orbis Asset Management Limited on February 17, 2009. |
58
Table of Contents
59
Table of Contents
60
Table of Contents
61
Table of Contents
| Sales Price ($) | ||||||||
| High | Low | |||||||
| 2007 (from August 9) | 36.45 | 12.26 | ||||||
| Fourth quarter | 36.45 | 18.00 | ||||||
| 2008 | 28.09 | 4.00 | ||||||
| First quarter | 28.09 | 10.05 | ||||||
| Second quarter | 18.38 | 10.32 | ||||||
| Third quarter | 11.75 | 6.69 | ||||||
| Fourth quarter | 8.87 | 4.00 | ||||||
| October | 7.35 | 4.51 | ||||||
| November | 6.94 | 4.00 | ||||||
| December | 8.87 | 5.18 | ||||||
| 2009 | ||||||||
| First quarter | 8.80 | 5.60 | ||||||
| January | 8.80 | 5.60 | ||||||
| February | 7.88 | 5.88 | ||||||
| March | 8.78 | 6.02 | ||||||
| April | 13.09 | 7.65 | ||||||
| May (through May 1) | 12.80 | 12.01 | ||||||
62
Table of Contents
63
Table of Contents
| • | banks; | ||
| • | insurance companies; | ||
| • | regulated investment companies; | ||
| • | real estate investment trusts; | ||
| • | broker-dealers; | ||
| • | traders that elect to mark-to-market; | ||
| • | U.S. expatriates; | ||
| • | tax-exempt entities; | ||
| • | persons liable for alternative minimum tax; | ||
| • | persons holding an ADS or ordinary share as part of a straddle, hedging, conversion or integrated transaction; | ||
| • | persons that actually or constructively own 10% or more of the total combined voting power of all classes of our voting stock; | ||
| • | persons who acquired ADSs or ordinary shares pursuant to the exercise of any employee share option or otherwise as compensation; or | ||
| • | persons holding ADSs or ordinary shares through partnerships or other pass-through entities. |
64
Table of Contents
| • | an individual who is a citizen or resident of the United States; | ||
| • | a corporation (or other entity taxable as a corporation) organized under the laws of the United States, any State thereof or the District of Columbia; | ||
| • | an estate, the income of which is subject to U.S. federal income taxation regardless of its source; or | ||
| • | a trust that (1) is subject to the primary supervision of a court within the United States and the control of one or more U.S. persons for all substantial decisions or (2) has a valid election in effect under applicable U.S. Treasury regulations to be treated as a U.S. person. |
65
Table of Contents
| • | at least 75% of its gross income for such year is passive income, or | ||
| • | at least 50% of the value of its assets (based on an average of the quarterly values of the assets) during such year is attributable to assets that produce passive income or are held for the production of passive income (the “asset test”). |
66
Table of Contents
| • | the excess distribution or gain will be allocated ratably over your holding period for the ADSs or ordinary shares, | ||
| • | the amount allocated to the current taxable year, and any taxable years in your holding period prior to the first taxable year in which we were a PFIC, will be treated as ordinary income, and | ||
| • | the amount allocated to each other year will be subject to the highest tax rate in effect for individuals or corporations, as applicable, for each such year and the interest charge generally applicable to underpayments of tax will be imposed on the resulting tax attributable to each such year. |
67
Table of Contents
68
Table of Contents
69
Table of Contents
| • | the registration statement on Form F-1 (File number: 333-144451), or the IPO Registration Statement for our initial public offering of 13,167,500 ADSs, representing 13,167,500 ordinary shares, which IPO Registration Statement was declared effective by the SEC on August 8, 2007; and | ||
| • | the registration statement on Form F-1 (File number: 333-148729), or the Follow-on Registration Statement for our follow-on public offering of 6,000,000 ADSs, representing 6,000,000 ordinary shares, which Follow-on Registration Statement was declared effective by the SEC on January 31, 2008. |
| • | approximately $3.0 million to fund capital expenditure; |
| • | approximately $1.0 million to invest in our information and operational systems; |
| • | approximately $130.0 million to expand our sales and marketing efforts; and |
| • | approximately $15.9 million for general corporate purposes. |
| • | approximately $5.8 million to fund capital expenditure; |
| • | approximately $14.5 million to purchase properties held for sale; |
| • | approximately $2.8 million to invest in our information and operational systems; and |
| • | approximately $76.6 million to expand our sales and marketing efforts. |
70
Table of Contents
71
Table of Contents
| For the Year Ended December 31, | ||||||||
| 2007 | 2008 | |||||||
Audit fees(1) | 668,515 | 1,020,648 | ||||||
Audit-related fees(2) | 1,113,385 | 374,073 | ||||||
Tax fees(3) | 98,137 | 22,219 | ||||||
| (1) | “Audit fees” means the aggregate fees billed for professional services rendered by our principal auditors for the audit of our annual financial statements and the review of our comparative interim financial statements. | |
| (2) | “Audit related fees” represents aggregate fees billed for professional services rendered by our principal auditors for the assurance and related services, which mainly included the issuance of the audit and review of financial statements and other assurance services rendered in connection with our initial public offering in 2007 and expenses incurred during 2007 for our subsequent follow-on in January 2008. | |
| (3) | “Tax fees” represents aggregate fees billed for professional services rendered by our principal auditors for tax compliance, tax advice and tax planning. |
| Approximate | ||||||||||||||||
| Total Number of | Dollar Value of | |||||||||||||||
| Shares Purchased | Shares that May | |||||||||||||||
| Total Number of | Average Price Paid | as Part of Publicly | Yet Be Purchased | |||||||||||||
| Period | Shares Purchased | Per Share(1) | Announced Plans(2) | Under the Plans(1) | ||||||||||||
| November 24-28 | 524,575 | $ | 5.52 | 524,575 | $ | 37,106,000 | ||||||||||
| December 1-31 | 2,442,603 | $ | 7.00 | 2,442,603 | $ | 20,000,000 | ||||||||||
| Total | 2,967,178 | $ | 6.74 | 2,967,178 | $ | 20,000,000 | ||||||||||
| (1) | Each of our ADSs represents one ordinary share. | |
| (2) | We publicly announced two share repurchase plans in 2008. We announced the first plan on August 22, 2008, which plan provided for the repurchase of up to $20.0 million of our ordinary shares and was completed on December 31, 2008. We announced the second plan on December 29, 2008, which plan provides for the repurchase of up to an additional $20.0 million of our ordinary shares and expires on December 29, 2009. |
72
Table of Contents
| Exhibit Number | Description of Document | |||
| 1.1 | Amended and Restated Memorandum and Articles of Association (incorporated by reference to Exhibit 3.2 from our F-1 registration statement (File No. 333-148729), as amended, initially filed with the Commission on January 17, 2008) | |||
| 4.1 | E-House Share Incentive Plan, as amended and restated on October 16, 2008 (incorporated by reference to Exhibit 10.1 from our S-8 registration statement (File No. 333-148058), filed with the Commission on December 23, 2008) | |||
| 4.2 | * | CRIC Share Incentive Plan adopted as of September 9, 2008 | ||
| 4.3 | Form of Indemnification Agreement with the Registrant’s directors (incorporated by reference to Exhibit 10.2 from our F-1 registration statement (File No. 333-148729), as amended, initially filed with the Commission on January 17, 2008) | |||
| 4.4 | Form of Employment Agreement with the Registrant’s senior executives (incorporated by reference to Exhibit 10.3 from our F-1 registration statement (File No. 333-148729), as amended, initially filed with the Commission on January 17, 2008) | |||
| 4.5 | * | Equity Pledge Agreement dated April 1, 2008 between Shanghai CRIC and Xin Zhou | ||
| 4.6 | * | Exclusive Equity Transfer Call Agreement dated April 1, 2008 between Shanghai CRIC, Tian Zhuo and Xin Zhou | ||
| 4.7 | * | Loan Agreement dated March 10, 2008, between Shanghai CRIC and Xin Zhou | ||
| 4.8 | * | Loan Agreement dated April 1, 2008 between Shanghai CRIC and Xin Zhou | ||
| 4.9 | * | Loan Agreement dated April 1, 2008 between Tian Zhuo and Xin Zhou | ||
| 4.10 | * | Loan Agreement dated September 8, 2008 between Shanghai CRIC and Xin Zhou | ||
| 4.11 | * | Loan Agreement dated September 8, 2008 between Tian Zhuo and Xin Zhou | ||
| 4.12 | * | Shareholder Voting Rights Proxy Agreement dated April 1, 2008 between Shanghai CRIC, Tian Zhuo and Xin Zhou | ||
| 4.13 | * | Consultancy Service Agreement dated April 1, 2008 between Shanghai CRIC and Tian Zhuo | ||
| 8.1 | * | Subsidiaries of the Registrant | ||
| 11.1 | Code of Business Conduct and Ethics of the Registrant (incorporated by reference to Exhibit 99.1 from our F-1 registration statement (File No. 333-144451), as amended, initially filed with the Commission on July 10, 2007) | |||
| 12.1 | * | CEO Certification Pursuant to Section 302 of the Sarbanes-Oxley Act of 2002 | ||
| 12.2 | * | CFO Certification Pursuant to Section 302 of the Sarbanes-Oxley Act of 2002 | ||
| 13.1 | * | CEO Certification Pursuant to Section 906 of the Sarbanes-Oxley Act of 2002 | ||
| 13.2 | * | CFO Certification Pursuant to Section 906 of the Sarbanes-Oxley Act of 2002 | ||
| 23.1 | * | Consent of Deloitte Touche Tohmatsu CPA Ltd. | ||
| 23.2 | * | Consent of Jin Mao PRC Lawyers | ||
| 23.3 | * | Consent of Fangda Partners | ||
| * | Filed with this Annual Report on Form 20-F. |
73
Table of Contents
| E-HOUSE (CHINA) HOLDINGS LIMITED | ||||
| By: | /s/ Xin Zhou | |||
| Name: | Xin Zhou | |||
| Title: | Chairman and Chief Executive Officer | |||
74
Table of Contents
FOR THE YEARS ENDED DECEMBER 31, 2006, 2007 AND 2008
| F-2 | ||||
| F-4 | ||||
| F-5 | ||||
| F-6 | ||||
| F-7 | ||||
| F-9 |
Table of Contents
E-House (China) Holdings Ltd.
May 4, 2009
F-2
Table of Contents
E-House (China) Holdings Ltd.
May 4, 2009
F-3
Table of Contents
(In U.S. dollar except for share data)
| December 31, | ||||||||
| 2007 | 2008 | |||||||
| $ | $ | |||||||
ASSETS | ||||||||
| Current assets: | ||||||||
| Cash and cash equivalents | 101,147,547 | 225,663,324 | ||||||
| Restricted cash | 3,091,293 | 23,930,951 | ||||||
| Marketable securities | — | 8,096,038 | ||||||
| Customer deposits, net of allowance for doubtful accounts of nil and $438,942 at December 31, 2007 and 2008, respectively | 123,338,996 | 71,855,522 | ||||||
| Unbilled accounts receivable, net of allowance for doubtful accounts of nil and $1,628,326 at December 31, 2007 and 2008, respectively | 55,845,944 | 83,617,483 | ||||||
| Accounts receivable, net of allowance for doubtful accounts of $2,441,796 and $1,330,631 at December 31, 2007 and 2008, respectively | 11,166,552 | 36,667,535 | ||||||
| Properties held for sale | 872,408 | 1,064,789 | ||||||
| Deferred tax assets | 2,684,060 | 3,815,688 | ||||||
| Prepaid expenses and other current assets | 7,066,549 | 25,470,452 | ||||||
| Amounts due from related parties | 2,773,988 | 749,074 | ||||||
| Total current assets | 307,987,337 | 480,930,856 | ||||||
| Property and equipment, net | 6,502,380 | 9,622,486 | ||||||
| Intangible assets, net | 3,098,525 | 3,433,205 | ||||||
| Goodwill | 2,549,398 | 7,457,763 | ||||||
| Investment in affiliates | — | 5,062,394 | ||||||
| Customer deposits, non-current portion | 7,886,672 | 1,285,954 | ||||||
| Deferred tax assets, non-current portion | 447,254 | 1,435,262 | ||||||
| Other non-current assets | 1,081,508 | 10,685,625 | ||||||
| TOTAL ASSETS | 329,553,074 | 519,913,545 | ||||||
LIABILITIES, MEZZANINE EQUITY AND SHAREHOLDERS’ EQUITY | ||||||||
| Current liabilities: | ||||||||
| Short-term borrowings | 6,845,000 | 21,947,100 | ||||||
| Accounts payable | 1,556,785 | 1,492,242 | ||||||
| Accrued payroll and welfare expenses | 12,631,639 | 11,628,750 | ||||||
| Income tax payable | 17,880,163 | 17,560,407 | ||||||
| Other tax payable | 5,567,513 | 6,638,047 | ||||||
| Deposits payable | — | 39,212,152 | ||||||
| Amounts due to related parties | 2,572,399 | 621,518 | ||||||
| Other current liabilities | 7,456,455 | 9,572,417 | ||||||
| Total current liabilities | 54,509,954 | 108,672,633 | ||||||
| Other non-current liabilities | 951,500 | 4,250,907 | ||||||
| Total liabilities | 55,461,454 | 112,923,540 | ||||||
| Commitments and contingencies (Note 22 ) | ||||||||
| Minority interest | 2,918,600 | 3,691,533 | ||||||
| Shareholders’ equity: | ||||||||
| Ordinary share ($0.001 par value): 1,000,000,000 and 1,000,000,000 shares authorized, 76,473,759 and 79,769,481 shares issued and outstanding, as of December 31, 2007 and 2008, respectively | 76,474 | 79,770 | ||||||
| Additional paid-in capital | 209,906,488 | 301,812,186 | ||||||
| Retained earnings | 54,504,945 | 85,296,056 | ||||||
| Accumulated other comprehensive income | 6,685,113 | 16,110,460 | ||||||
| Total shareholders’ equity | 271,173,020 | 403,298,472 | ||||||
| TOTAL LIABILITIES AND SHAREHOLDERS’ EQUITY | 329,553,074 | 519,913,545 | ||||||
F-4
Table of Contents
(In U.S. dollar except for share data)
| Years Ended December 31, | ||||||||||||
| 2006 | 2007 | 2008 | ||||||||||
| $ | $ | $ | ||||||||||
| Total revenues | 55,998,524 | 121,016,600 | 154,487,455 | |||||||||
| Cost of revenues | (10,243,968 | ) | (23,510,065 | ) | (31,855,848 | ) | ||||||
| Selling, general and administrative expenses | (21,321,726 | ) | (45,545,800 | ) | (77,197,631 | ) | ||||||
| Income from operations | 24,432,830 | 51,960,735 | 45,433,976 | |||||||||
| Other income (expense): | ||||||||||||
| Interest expense | (594,488 | ) | (621,903 | ) | (2,420,468 | ) | ||||||
| Interest income | 206,378 | 2,489,668 | 3,062,513 | |||||||||
| Other income, net | 168,015 | 197,892 | 1,970,481 | |||||||||
| Income before taxes, equity in affiliates and minority interest | 24,212,735 | 54,026,392 | 48,046,502 | |||||||||
| Income tax expense | (5,751,102 | ) | (10,277,040 | ) | (8,712,558 | ) | ||||||
| Income before equity in affiliates and minority interest | 18,461,633 | 43,749,352 | 39,333,944 | |||||||||
| Income from investment in affiliates | — | — | 153,700 | |||||||||
| Minority interest | (354,668 | ) | (2,023,537 | ) | 88,380 | |||||||
| Net income | 18,106,965 | 41,725,815 | 39,576,024 | |||||||||
| Earnings per share: | ||||||||||||
| Basic | $ | 0.27 | $ | 0.62 | $ | 0.48 | ||||||
| Diluted | $ | 0.27 | $ | 0.56 | $ | 0.48 | ||||||
| Shares used in computation: | ||||||||||||
| Basic | 50,000,000 | 60,386,083 | 81,818,972 | |||||||||
| Diluted | 67,372,353 | 74,555,709 | 82,110,430 | |||||||||
F-5
Table of Contents
AND COMPREHENSIVE INCOME
(In U.S. dollar)
| Accumulated | ||||||||||||||||||||||||||||||||
| Additional | Other | Total | Total | |||||||||||||||||||||||||||||
| Paid-in | Retained | Comprehensive | Subscription | Shareholders | Comprehensive | |||||||||||||||||||||||||||
| Ordinary Shares | Capital | Earnings | Income | Receivable | Equity | Income | ||||||||||||||||||||||||||
| Number | $ | $ | $ | $ | $ | $ | $ | |||||||||||||||||||||||||
| Balance at January 1, 2006 | 50,000,000 | 50,000 | 6,041,200 | (1,102,670 | ) | 303,118 | (50,000 | ) | 5,241,648 | — | ||||||||||||||||||||||
| Net income | — | — | — | 18,106,965 | — | — | 18,106,965 | 18,106,965 | ||||||||||||||||||||||||
| Dividend declared ($0.08 per share) | — | — | — | (4,025,165 | ) | — | — | (4,025,165 | ) | — | ||||||||||||||||||||||
| Dividend declared upon reorganization returned as contributed capital | — | — | 12,341,300 | — | — | — | 12,341,300 | — | ||||||||||||||||||||||||
| Collection of subscription receivable | — | — | — | — | — | 50,000 | 50,000 | — | ||||||||||||||||||||||||
| Share-based compensation | — | — | 16,806 | — | — | — | 16,806 | — | ||||||||||||||||||||||||
| Foreign currency translation adjustments | — | — | — | — | 638,637 | — | 638,637 | 638,637 | ||||||||||||||||||||||||
| Balance at December 31, 2006 | 50,000,000 | 50,000 | 18,399,306 | 12,979,130 | 941,755 | — | 32,370,191 | 18,745,602 | ||||||||||||||||||||||||
| Series A redeemable convertible preferred shares converted into ordinary shares | 13,157,895 | 13,158 | 24,815,254 | — | — | — | 24,828,412 | — | ||||||||||||||||||||||||
| Issuance of ordinary shares, net of issuance costs | 13,167,500 | 13,168 | 165,249,586 | — | — | — | 165,262,754 | — | ||||||||||||||||||||||||
| Vesting of restricted shares | 148,364 | 148 | 489,453 | — | — | — | 489,601 | — | ||||||||||||||||||||||||
| Net income | — | — | — | 41,725,815 | — | — | 41,725,815 | 41,725,815 | ||||||||||||||||||||||||
| Adoption of FIN 48 | — | — | — | (200,000 | ) | — | — | (200,000 | ) | — | ||||||||||||||||||||||
| Share-based compensation | — | — | 952,889 | — | — | — | 952,889 | — | ||||||||||||||||||||||||
| Foreign currency translation adjustments | — | — | — | — | 5,743,358 | — | 5,743,358 | 5,743,358 | ||||||||||||||||||||||||
| Balance at December 31, 2007 | 76,473,759 | 76,474 | 209,906,488 | 54,504,945 | 6,685,113 | — | 271,173,020 | 47,469,173 | ||||||||||||||||||||||||
| Issuance of ordinary shares, net of issuance costs | 6,000,000 | 6,000 | 97,392,482 | — | — | — | 97,398,482 | — | ||||||||||||||||||||||||
| Repurchase of shares | (2,848,278 | ) | (2,848 | ) | (10,563,338 | ) | (8,784,913 | ) | — | — | (19,351,099 | ) | — | |||||||||||||||||||
| Vesting of restricted shares | 144,000 | 144 | 475,056 | — | — | — | 475,200 | — | ||||||||||||||||||||||||
| Net income | — | — | — | 39,576,024 | — | — | 39,576,024 | 39,576,024 | ||||||||||||||||||||||||
| Share-based compensation | — | — | 4,601,498 | — | — | — | 4,601,498 | — | ||||||||||||||||||||||||
| Foreign currency translation adjustments | — | — | — | — | 9,425,347 | — | 9,425,347 | 9,425,347 | ||||||||||||||||||||||||
| Balance at December 31, 2008 | 79,769,481 | 79,770 | 301,812,186 | 85,296,056 | 16,110,460 | — | 403,298,472 | 49,001,371 | ||||||||||||||||||||||||
F-6
Table of Contents
(In U.S. dollar)
| Years Ended December 31, | ||||||||||||
| 2006 | 2007 | 2008 | ||||||||||
| $ | $ | $ | ||||||||||
| Operating activities: | ||||||||||||
| Net income | 18,106,965 | 41,725,815 | 39,576,024 | |||||||||
| Adjustments to reconcile net income to net cash provided (used in) operating activities: | ||||||||||||
| Depreciation and amortization | 1,103,446 | 2,328,527 | 4,114,761 | |||||||||
| Minority interest | 354,668 | 2,023,537 | (88,380 | ) | ||||||||
| Allowance for doubtful accounts | 29,795 | 2,359,752 | 2,583,853 | |||||||||
| Share-based compensation | 16,806 | 952,889 | 4,601,498 | |||||||||
| Others | (311,250 | ) | 196,084 | 84,195 | ||||||||
| Changes in operating assets and liabilities: | ||||||||||||
| Restricted cash | — | (829,127 | ) | 1,887,622 | ||||||||
| Customer deposits | (3,568,674 | ) | (121,452,918 | ) | 56,359,296 | |||||||
| Accounts receivable | (26,247,109 | ) | (31,388,959 | ) | (57,191,210 | ) | ||||||
| Marketable securities | — | — | (8,096,038 | ) | ||||||||
| Amounts due from related parties | (170,623 | ) | (1,900,060 | ) | 2,024,914 | |||||||
| Deferred taxes | (299,468 | ) | (2,529,949 | ) | (1,131,628 | ) | ||||||
| Prepaid expenses and other current assets | 2,139,226 | 2,190,645 | (5,610,975 | ) | ||||||||
| Deferred taxes, non-current portion | — | (411,861 | ) | (988,010 | ) | |||||||
| Other non-current assets | — | (1,026,750 | ) | 2,308,366 | ||||||||
| Accounts payable | (275,573 | ) | 277,021 | (155,316 | ) | |||||||
| Accrued payroll and welfare expenses | 1,351,020 | 8,532,783 | (1,108,809 | ) | ||||||||
| Income tax payable | 4,003,333 | 10,834,505 | (325,654 | ) | ||||||||
| Other tax payable | 940,950 | 2,951,409 | 1,076,658 | |||||||||
| Amounts due to related parties | (445,375 | ) | 1,621,999 | (1,475,685 | ) | |||||||
| Deposits payable | — | — | 39,212,152 | |||||||||
| Other current liabilities | 682,020 | 2,271,595 | 315,506 | |||||||||
| Net cash provided (used in) operating activities | (2,589,843 | ) | (81,273,063 | ) | 77,973,140 | |||||||
| Investing activities: | ||||||||||||
| Purchases of property and equipment | (1,464,976 | ) | (4,287,825 | ) | (20,756,767 | ) | ||||||
| Purchase of subsidiaries, net of cash acquired | (1,478,431 | ) | (568,640 | ) | (2,399,326 | ) | ||||||
| Prepayment for acquisition | — | — | (1,594,823 | ) | ||||||||
| Investment in affiliates | — | — | (2,500,000 | ) | ||||||||
| Purchase of minority interests of subsidiaries | (72,995 | ) | (1,331,400 | ) | (65,999 | ) | ||||||
| Purchase of subsidiary upon reorganization | (12,391,300 | ) | — | — | ||||||||
| Proceeds from sale of property held for sale | 2,000,443 | 627,027 | 749,999 | |||||||||
| Proceeds from disposal of property and equipment | 61,712 | 16,597 | 46,193 | |||||||||
| Loans to related parties | (2,370,948 | ) | — | — | ||||||||
| Collection of loans to related parties | 3,092,911 | 43,885 | — | |||||||||
| Net cash provided (used in) investing activities | (12,623,584 | ) | (5,500,356 | ) | (26,520,723 | ) | ||||||
F-7
Table of Contents
(In U.S. dollar)
| Years Ended December 31, | ||||||||||||
| 2006 | 2007 | 2008 | ||||||||||
| $ | $ | $ | ||||||||||
| Financing activities: | ||||||||||||
| Net proceeds from short-term borrowings | — | — | 42,482,100 | |||||||||
| Repayment of short-term borrowings | (381,700 | ) | (4,233,916 | ) | (27,380,000 | ) | ||||||
| Restricted cash-pledged accounts | — | — | (22,727,280 | ) | ||||||||
| Dividend paid | (4,213,465 | ) | — | — | ||||||||
| Advance from a related party | — | 1,440,001 | — | |||||||||
| Contribution from minority shareholders | 37,353 | — | — | |||||||||
| Dividend declared upon reorganization returned as contributed capital | 12,341,300 | — | — | |||||||||
| Proceeds from issuance of preferred shares (net of issuance costs of $171,588) | 24,828,412 | — | — | |||||||||
| Proceeds from collection of subscription receivable | 50,000 | — | — | |||||||||
| Proceeds from issuance of ordinary shares, net of issuance costs of $16,106,695 and $4,488,986, respectively | — | 165,612,754 | 97,505,014 | |||||||||
| Payment of initial public offering costs | — | — | (220,804 | ) | ||||||||
| Repurchase of shares | — | — | (19,208,685 | ) | ||||||||
| Dividends to minority interests | — | (644,194 | ) | (346,937 | ) | |||||||
| Loans from related parties | 2,091,559 | 1,264,698 | — | |||||||||
| Repayment of loans from related parties | (8,340,065 | ) | (1,331,797 | ) | — | |||||||
| Net cash provided by (used in) financing activities | 26,413,394 | 162,107,546 | 70,103,408 | |||||||||
| Effect of exchange rate changes | 393,545 | 1,507,415 | 2,959,952 | |||||||||
| Net increase in cash and cash equivalents | 11,593,512 | 76,841,542 | 124,515,777 | |||||||||
| Cash and cash equivalents at the beginning of the year | 12,712,493 | 24,306,005 | 101,147,547 | |||||||||
| Cash and cash equivalents at the end of the year | 24,306,005 | 101,147,547 | 225,663,324 | |||||||||
| Supplemental disclosure of cash flow information: | ||||||||||||
| Interest paid | 594,488 | 621,903 | 2,396,514 | |||||||||
| Income taxes paid | 1,857,044 | 3,559,865 | 12,466,793 | |||||||||
| Non-cash investing and financing activities: | ||||||||||||
| Acquisition of property held for sale — Accounts receivable | — | 859,850 | — | |||||||||
| Advance payment for property held for sale — Accounts receivable | — | — | 1,098,721 | |||||||||
| Acquisition of minority interest — Accounts payable | 114,928 | — | — | |||||||||
| Capitalization of offering costs — other current liabilities | — | 350,000 | 235,728 | |||||||||
| Capitalization of costs for repurchase of shares — other current liabilities | — | — | 142,414 | |||||||||
| Provision for FIN 48 uncertain tax positions | — | 200,000 | — | |||||||||
F-8
Table of Contents
FOR THE YEARS ENDED DECEMBER 31, 2006, 2007 AND 2008
(In U.S. dollar)
| Date of | Place of | Percentage of | ||||||||
| incorporation | incorporation | ownership | ||||||||
| Shanghai Real Estate Consultant & Sales (Group) Co., Ltd. | August 15, 2000 | PRC | 100 | % | ||||||
| Shanghai City Rehouse Agent Consultants Co., Ltd. | May 17, 2002 | PRC | 85 | % | ||||||
| E-house Real Estate Asset Management Co.,Ltd. | August 22, 2006 | Cayman | 51 | % | ||||||
| CRIC (Shanghai) Information Technology Co., Ltd. | July 3, 2006 | PRC | 100 | % | ||||||
| Shanghai Tian Zhuo Advertising Co., Ltd. | April 1, 2008 | PRC | VIE | |||||||
F-9
Table of Contents
| As of December 31, 2008 | ||||
| Total assets | 14,738,217 | |||
| Total liabilities | 15,509,814 | |||
F-10
Table of Contents
F-11
Table of Contents
| Leasehold improvements | Over the shorter of the lease term or their estimated useful lives | |
| Buildings | 30 years | |
| Furniture, fixtures and equipment | 5 years | |
| Motor vehicles | 5 years |
F-12
Table of Contents
F-13
Table of Contents
F-14
Table of Contents
| 2006 | 2007 | 2008 | ||||||||||
| $ | $ | $ | ||||||||||
| Balance as of January 1, | 35,892 | 52,551 | 2,441,796 | |||||||||
| Provisions for doubtful accounts | 29,795 | 2,359,752 | 2,583,853 | |||||||||
| Write offs | (19,680 | ) | — | (1,691,021 | ) | |||||||
| Changes due to foreign exchange | 6,544 | 29,493 | 63,271 | |||||||||
| Balance as of December 31, | 52,551 | 2,441,796 | 3,397,899 | |||||||||
F-15
Table of Contents
| Years Ended December 31, | ||||||||||||
| 2006 | 2007 | 2008 | ||||||||||
| Net income attributable to ordinary shareholders — basic | $ | 13,437,979 | $ | 37,263,701 | $ | 39,576,024 | ||||||
| Amount allocated to Series A Shares for participating rights to dividends | $ | 4,668,986 | $ | 4,462,114 | — | |||||||
| Net income attributable to ordinary shareholders — diluted | $ | 18,106,965 | $ | 41,725,815 | $ | 39,576,024 | ||||||
| Weighted average ordinary shares outstanding | 50,000,000 | 60,386,083 | 81,818,972 | |||||||||
| Stock options | — | 397,393 | 291,458 | |||||||||
| Series A preferred shares | 17,372,353 | 13,772,233 | — | |||||||||
| Weighted average number of ordinary shares outstanding — diluted | 67,372,353 | 74,555,709 | 82,110,430 | |||||||||
| Basic earnings per share | $ | 0.27 | $ | 0.62 | $ | 0.48 | ||||||
| Diluted earnings per share | $ | 0.27 | $ | 0.56 | $ | 0.48 | ||||||
F-16
Table of Contents
F-17
Table of Contents
| As of December 31 | ||||||||
| 2007 | 2008 | |||||||
| $ | $ | |||||||
| Advance payment for advertising placement | — | 7,654,577 | ||||||
| Advance payment for properties | — | 7,829,165 | ||||||
| Prepaid expenses | 1,590,885 | 1,987,959 | ||||||
| Others | 5,475,664 | 8,109,747 | ||||||
| Allowance | — | (110,996 | ) | |||||
| Total | 7,066,549 | 25,470,452 | ||||||
F-18
Table of Contents
| As of December 31 | ||||||||
| 2007 | 2008 | |||||||
| $ | $ | |||||||
| Leasehold improvements | 3,346,027 | 4,815,820 | ||||||
| Buildings | 1,052,480 | 1,124,993 | ||||||
| Furniture, fixtures and equipment | 3,839,130 | 6,493,426 | ||||||
| Motor vehicles | 2,664,113 | 4,130,132 | ||||||
| Total | 10,901,750 | 16,564,371 | ||||||
| Less: Accumulated depreciation | (4,399,370 | ) | (6,941,885 | ) | ||||
| Property and equipment, net | 6,502,380 | 9,622,486 | ||||||
| As of December 31, | ||||||||
| 2007 | 2008 | |||||||
| $ | $ | |||||||
| Intangible assets not subject to amortization are comprised of the following: | ||||||||
| Trademark | 692,480 | 698,133 | ||||||
| Intangible assets subject to amortization are comprised of the following: | ||||||||
| Customer contracts | 4,853,501 | 5,192,903 | ||||||
| Non-compete agreements | — | 998,912 | ||||||
| Computer software licenses | 401,195 | 850,976 | ||||||
| 5,254,696 | 7,042,791 | |||||||
| Less: Accumulated amortization | ||||||||
| Customer contracts | (2,572,930 | ) | (3,951,845 | ) | ||||
| Non-compete agreements | — | — | ||||||
| Computer software licenses | (275,721 | ) | (355,874 | ) | ||||
| Intangible assets subject to amortization, net | 2,406,045 | 2,735,072 | ||||||
| Total intangible assets, net | 3,098,525 | 3,433,205 | ||||||
F-19
Table of Contents
| Secondary | Real estate | |||||||||||||||||||
| Real estate | Consulting and | |||||||||||||||||||
| Primary real | brokerage | information | ||||||||||||||||||
| estate agency | service | service | ||||||||||||||||||
| service segment | segment | segment | Others | Total | ||||||||||||||||
| $ | $ | $ | $ | $ | ||||||||||||||||
| Balance as of January 1, 2007 | 2,227,293 | — | — | — | 2,227,293 | |||||||||||||||
| Goodwill recognized upon acquisition | 100,067 | 67,447 | — | — | 167,514 | |||||||||||||||
| Exchange rate translation | 153,713 | 878 | — | — | 154,591 | |||||||||||||||
| Balance as of December 31, 2007 | 2,481,073 | 68,325 | — | — | 2,549,398 | |||||||||||||||
| Goodwill recognized upon acquisition | — | — | 4,028,514 | 674,847 | 4,703,361 | |||||||||||||||
| Exchange rate translation | 200,305 | 4,699 | — | — | 205,004 | |||||||||||||||
| Balance as of December 31, 2008 | 2,681,378 | 73,024 | 4,028,514 | 674,847 | 7,457,763 | |||||||||||||||
| As of December 31 | ||||||||
| 2007 | 2008 | |||||||
| $ | $ | |||||||
| Advance payment for advertising placement, non-current portion (note 4) | 1,081,508 | 2,889,702 | ||||||
| Advance payment for properties, non-current portion | — | 7,791,586 | ||||||
| Other non-current assets | — | 4,337 | ||||||
| Total | 1,081,508 | 10,685,625 | ||||||
F-20
Table of Contents
F-21
Table of Contents
| Years Ended December 31, | ||||||||||||
| 2006 | 2007 | 2008 | ||||||||||
| $ | $ | $ | ||||||||||
| Gain from sale of investment | 142,058 | 525,220 | — | |||||||||
| Gain from sale of marketable securities | 25,957 | — | 405,781 | |||||||||
| Fund management fee | — | 339,181 | — | |||||||||
| Financial subsidy | — | — | 1,247,468 | |||||||||
| Reimbursement income from depository agent | — | — | 778,196 | |||||||||
| Foreign exchange gain (loss) | — | (666,509 | ) | (460,964 | ) | |||||||
| Total other income | 168,015 | 197,892 | 1,970,481 | |||||||||
| Years Ended December 31 | ||||||||||||
| 2006 | 2007 | 2008 | ||||||||||
| $ | $ | $ | ||||||||||
| Current Tax | ||||||||||||
| PRC | 6,050,570 | 13,127,387 | 9,328,732 | |||||||||
| Other | — | — | 1,549,525 | |||||||||
| 6,050,570 | 13,127,387 | 10,878,257 | ||||||||||
| Deferred Tax | ||||||||||||
| PRC | (299,468 | ) | (2,850,347 | ) | (2,165,699 | ) | ||||||
| Other | — | — | — | |||||||||
| (299,468 | ) | (2,850,347 | ) | (2,165,699 | ) | |||||||
| Income tax expense | 5,751,102 | 10,277,040 | 8,712,558 | |||||||||
F-22
Table of Contents
F-23
Table of Contents
| Unrecognized Tax Benefit — January 1, 2007 | $ | 200,000 | ||
| Gross increases — tax positions in prior period | — | |||
| Gross decreases — tax positions in prior period | — | |||
| Gross increases — tax positions in current period | — | |||
| Settlements | — | |||
| Lapse of statute of limitations | — | |||
| Unrecognized Tax Benefit — December 31, 2007 | $ | 200,000 | ||
| Gross increases — tax positions in prior period | — | |||
| Gross decreases — tax positions in prior period | — | |||
| Gross increases — tax positions in current period | — | |||
| Settlements | — | |||
| Lapse of statute of limitations | — | |||
| Unrecognized Tax Benefit — December 31, 2008 | $ | 200,000 | ||
| As of December 31, | ||||||||||||
| 2006 | 2007 | 2008 | ||||||||||
| $ | $ | $ | ||||||||||
| Deferred tax assets: | ||||||||||||
| Accrued salary expenses | 348,505 | 2,501,150 | 1,682,580 | |||||||||
| Bad debt provision | 58,575 | 596,560 | 740,439 | |||||||||
| Start-up costs | 100,575 | 63,554 | — | |||||||||
| Decoration amortization | 33,576 | 170,112 | 154,013 | |||||||||
| Advertising expenses | — | 14,625 | 285,686 | |||||||||
| Fair value assets step-up | 45,649 | 43,110 | 11,090 | |||||||||
| Impairment for property held for sales | — | 10,663 | 47,042 | |||||||||
| Net operating loss carryforwards | 994,564 | 1,746,906 | 5,537,472 | |||||||||
| Gross deferred tax assets | 1,581,444 | 5,146,680 | 8,458,322 | |||||||||
| Valuation allowance | (994,564 | ) | (2,015,366 | ) | (3,207,372 | ) | ||||||
| Total deferred tax assets | 586,880 | 3,131,314 | 5,250,950 | |||||||||
| Analysis as: | ||||||||||||
| Current | 151,070 | 2,684,060 | 3,815,688 | |||||||||
| Non-current | 435,810 | 447,254 | 1,435,262 | |||||||||
| Deferred tax liabilities: | ||||||||||||
| Amortization of intangible and other assets | 1,151,919 | 751,500 | 705,980 | |||||||||
| Total deferred tax liabilities | 1,151,919 | 751,500 | 705,980 | |||||||||
| Analysis as: | ||||||||||||
| Current | — | — | — | |||||||||
| Non-current | 1,151,919 | 751,500 | 705,980 | |||||||||
F-24
Table of Contents
| 2006 | 2007 | 2008 | ||||||||||
| $ | $ | $ | ||||||||||
| Balance as of January 1, | 248,775 | 994,564 | 2,015,366 | |||||||||
| Additions | 779,554 | 1,005,463 | 1,847,356 | |||||||||
| Releases | (42,097 | ) | (91,077 | ) | (827,828 | ) | ||||||
| Changes due to foreign exchange | 8,332 | 106,416 | 172,478 | |||||||||
| Balance as of December 31, | 994,564 | 2,015,366 | 3,207,372 | |||||||||
| Year Ended December 31, | ||||||||||||
| 2006 | 2007 | 2008 | ||||||||||
| PRC income tax rate | 33.00 | % | 33.00 | % | 25.00 | % | ||||||
| Expenses not deductible for tax purposes | 2.13 | % | 1.08 | % | 0.48 | % | ||||||
| Investment income under equity method | (1.09 | %) | — | (0.14 | %) | |||||||
| Tax exemption granted to group | — | (1.66 | %) | — | ||||||||
| Effect of lower rates in certain domestic locations | (12.11 | %) | (14.35 | %) | (9.13 | %) | ||||||
| Effect of different tax rate of subsidiary operation in other jurisdiction | (1.26 | %) | (0.46 | %) | (0.37 | %) | ||||||
| Effect of new income tax law | — | (0.70 | %) | — | ||||||||
| Valuation allowance movement | 3.08 | % | 2.11 | % | 2.23 | % | ||||||
| 23.75 | % | 19.02 | % | 18.07 | % | |||||||
| Year Ended December 31, | ||||||||||||
| 2006 | 2007 | 2008 | ||||||||||
| $ | $ | $ | ||||||||||
| The aggregate dollar effect | — | 633,549 | — | |||||||||
| Per share effect —basic | — | 0.01 | — | |||||||||
| Per share effect—diluted | — | 0.01 | — | |||||||||
F-25
Table of Contents
| 2006 | 2007 | 2008 | ||||||||||
| Average risk-free rate of return | 4.50 | % | 4.76 | % | 3.98 | % | ||||||
| Weighted average expected option life | 10 years | 10 years | 10 years | |||||||||
| Average estimated volatility rate | 49.0 | % | 62.7 | % | 59.3 | % | ||||||
| Average dividend yield | 0.00 | % | 0.00 | % | 0.00 | % | ||||||
| Weighted | ||||||||||||||||
| Weighted | average | |||||||||||||||
| average | remaining | Aggregate | ||||||||||||||
| Number of | exercise | contractual | intrinsic | |||||||||||||
| options | price | term | value of options | |||||||||||||
| $ | $ | |||||||||||||||
| Outstanding, as of January 1, 2008 | 1,215,000 | 5.40 | ||||||||||||||
| Granted | 1,356,000 | 5.37 | ||||||||||||||
| Exercised | — | — | ||||||||||||||
| Forfeited | (256,834 | ) | 5.37 | |||||||||||||
| Cancelled | — | — | ||||||||||||||
| Outstanding, as of December 31, 2008. | 2,314,166 | 5.39 | 8.9 years | 6,278,673 | ||||||||||||
| Vested and expected to vest as of December 31, 2008 | 2,126,589 | 5.39 | 8.9 years | 5,766,588 | ||||||||||||
| Exercisable as of December 31, 2008 | 387,484 | 5.40 | 8.5 years | 1,044,831 | ||||||||||||
F-26
Table of Contents
| No. of | Weighted average | |||||||
| restricted shares | grant-date fair value | |||||||
| $ | ||||||||
| Unvested as of January 1, 2008 | 288,000 | 1.39 | ||||||
| Granted | — | — | ||||||
| Vested | (144,000 | ) | 1.39 | |||||
| Forfeited | — | — | ||||||
| Unvested as of December 31, 2008 | 144,000 | 1.39 | ||||||
F-27
Table of Contents
| Secondary | ||||||||||||||||||||||||
| real estate | Real estate | |||||||||||||||||||||||
| Primary real | brokerage | consulting | ||||||||||||||||||||||
| estate agency | service | and information | ||||||||||||||||||||||
| 2008 | service segment | segment | service segment | Others | Non-allocated | Total | ||||||||||||||||||
| $ | $ | $ | $ | $ | $ | |||||||||||||||||||
| Revenues from external customers | 90,492,009 | 12,058,598 | 49,815,916 | 2,120,932 | — | 154,487,455 | ||||||||||||||||||
| Cost of revenues | (27,179,848 | ) | (1,725,941 | ) | (2,855,398 | ) | (94,661 | ) | — | (31,855,848 | ) | |||||||||||||
| Selling, general and administrative expenses | (33,624,754 | ) | (20,209,062 | ) | (14,446,451 | ) | (2,109,633 | ) | (6,807,731 | ) | (77,197,631 | ) | ||||||||||||
| Income/(loss) from operations | 29,687,407 | (9,876,405 | ) | 32,514,067 | (83,362 | ) | (6,807,731 | ) | 45,433,976 | |||||||||||||||
| Interest expense | — | — | — | — | (2,420,468 | ) | (2,420,468 | ) | ||||||||||||||||
| Interest income | 551,545 | 30,475 | 416,769 | 8,152 | 2,055,572 | 3,062,513 | ||||||||||||||||||
| Other income | 1,209,253 | 22,483 | (1,110,367 | ) | — | 1,849,112 | 1,970,481 | |||||||||||||||||
| Income before taxes, equity in an associate and minority interest | 31,448,205 | (9,823,447 | ) | 31,820,469 | (75,210 | ) | (5,323,515 | ) | 48,046,502 | |||||||||||||||
| Income tax expense | (4,825,590 | ) | 52,535 | (4,245,774 | ) | 306,271 | — | (8,712,558 | ) | |||||||||||||||
| Income before equity in an associate and minority interest | 26,622,615 | (9,770,912 | ) | 27,574,695 | 231,061 | (5,323,515 | ) | 39,333,944 | ||||||||||||||||
| Income from investment in affiliated company | — | — | 153,700 | — | 153,700 | |||||||||||||||||||
| Net income/(loss) after taxes before minority interest | 26,622,615 | (9,770,912 | ) | 27,728,395 | 231,061 | (5,323,515 | ) | 39,487,644 | ||||||||||||||||
F-28
Table of Contents
| Secondary | ||||||||||||||||||||
| real estate | Real estate | |||||||||||||||||||
| Primary real | brokerage | consulting | ||||||||||||||||||
| estate agency | service | and information | ||||||||||||||||||
| 2007 | service segment | segment | service segment | Non-allocated | Total | |||||||||||||||
| $ | $ | $ | $ | $ | ||||||||||||||||
| Revenues from external customers | 100,541,226 | 11,888,443 | 8,586,931 | — | 121,016,600 | |||||||||||||||
| Cost of revenues | (22,859,701 | ) | — | (650,364 | ) | — | (23,510,065 | ) | ||||||||||||
| Selling, general and administrative expenses | (23,777,560 | ) | (14,997,248 | ) | (4,402,954 | ) | (2,368,038 | ) | (45,545,800 | ) | ||||||||||
| Income/(loss) from operations | 53,903,965 | (3,108,805 | ) | 3,533,613 | (2,368,038 | ) | 51,960,735 | |||||||||||||
| Interest expense | — | — | — | (621,903 | ) | (621,903 | ) | |||||||||||||
| Interest income | 884,139 | 36,274 | 2,797 | 1,566,458 | 2,489,668 | |||||||||||||||
| Other income, net | 753,476 | 96,372 | (503,849 | ) | (148,107 | ) | 197,892 | |||||||||||||
| Income before taxes and minority interest | 55,541,580 | (2,976,159 | ) | 3,032,561 | (1,571,590 | ) | 54,026,392 | |||||||||||||
| Income tax expense | (10,312,711 | ) | (4,506 | ) | 40,177 | — | (10,277,040 | ) | ||||||||||||
| Net income/(loss) after taxes before minority interest | 45,228,869 | (2,980,665 | ) | 3,072,738 | (1,571,590 | ) | 43,749,352 | |||||||||||||
| Secondary | ||||||||||||||||||||
| real estate | Real estate | |||||||||||||||||||
| Primary real | brokerage | consulting | ||||||||||||||||||
| estate agency | service | and information | ||||||||||||||||||
| 2006 | service segment | segment | service segment | Non-allocated | Total | |||||||||||||||
| $ | $ | $ | $ | $ | ||||||||||||||||
| Revenues from external customers | 45,708,032 | 3,845,296 | 6,445,196 | — | 55,998,524 | |||||||||||||||
| Cost of revenues | (10,062,254 | ) | — | (181,714 | ) | — | (10,243,968 | ) | ||||||||||||
| Selling, general and administrative expenses | (13,397,110 | ) | (5,285,358 | ) | (703,026 | ) | (1,936,232 | ) | (21,321,726 | ) | ||||||||||
| Income/(Loss) from operations | 22,248,668 | (1,440,062 | ) | 5,560,456 | (1,936,232 | ) | 24,432,830 | |||||||||||||
| Interest expense | — | — | — | (594,488 | ) | (594,488 | ) | |||||||||||||
| Interest income | 188,888 | 6,115 | 11,375 | — | 206,378 | |||||||||||||||
| Income/(Loss) before taxes and minority interest | 22,605,571 | (1,433,947 | ) | 5,571,831 | (2,530,720 | ) | 24,212,735 | |||||||||||||
| Income tax expense | (5,751,102 | ) | — | — | — | (5,751,102 | ) | |||||||||||||
| Net income/(loss) after taxes before minority interest | 16,854,469 | (1,433,947 | ) | 5,571,831 | (2,530,720 | ) | 18,461,633 | |||||||||||||
| Years Ended December 31, | ||||||||||||
| 2006 | 2007 | 2008 | ||||||||||
| $ | $ | $ | ||||||||||
| Customer A | * | * | 32,498,047 | |||||||||
| Customer B | * | 25,478,208 | * | |||||||||
| Customer C | * | 17,710,007 | * | |||||||||
| * | indicates the revenue from these customers was less than 10% in the stated periods. |
| Years Ended December 31, | ||||||||
| 2007 | 2008 | |||||||
| $ | $ | |||||||
| Customer B | * | 20,533,748 | ||||||
| Customer C | 16,240,944 | * | ||||||
| * | indicates the accounts receivables from the customer was less than 10% as at the stated year end. |
F-29
Table of Contents
| Years Ended December 31, | ||||||||
| 2007 | 2008 | |||||||
| $ | $ | |||||||
| Customer A | 102,554,401 | 29,262,800 | ||||||
| Customer C | 12,527,661 | — | ||||||
| Customer D | — | 14,631,400 | ||||||
| Customer E | — | 9,949,352 | ||||||
| As of December 31, | ||||||||
| 2007 | 2008 | |||||||
| $ | $ | |||||||
| Customer and supplier | 1,730,656 | 386,857 | ||||||
| Other | 1,043,332 | 362,217 | ||||||
| Total amounts due from related parties | 2,773,988 | 749,074 | ||||||
| As of December 31, | ||||||||
| 2007 | 2008 | |||||||
| $ | $ | |||||||
| Management | (950,401 | ) | (475,204 | ) | ||||
| Other | (1,621,998 | ) | (146,314 | ) | ||||
| Total amounts due to related parties | (2,572,399 | ) | (621,518 | ) | ||||
| Years Ended December 31, | ||||||||||||
| 2006 | 2007 | 2008 | ||||||||||
| $ | $ | $ | ||||||||||
| Revenue — Shanghai Yueshun Real Estate Development Co., Ltd. | 167,858 | 2,801,505 | 321 | |||||||||
| Cost of revenues — Shanghai Xuyang Media Co., Ltd. | (257,971 | ) | — | — | ||||||||
| Selling and marketing expenses — Shanghai Xuyang Media Co., Ltd. | (105,322 | ) | — | — | ||||||||
| As of December 31, | ||||||||
| 2007 | 2008 | |||||||
| $ | $ | |||||||
| Accounts receivable — Shanghai Yueshun Real Estate Development Co., Ltd. | 1,730,656 | 386,857 | ||||||
F-30
Table of Contents
| As of December 31 | ||||||||
| 2007 | 2008 | |||||||
| $ | $ | |||||||
| Turbo Chance Co., Ltd. (1) | 704,421 | — | ||||||
| E-House Property Investment 1 (China) Limited (2) | 338,911 | 362,217 | ||||||
| Total amounts due from other related parties | 1,043,332 | 362,217 | ||||||
| E-House Property Investment 1 (China) Limited (2) | (1,621,998 | ) | — | |||||
| Shanghai Jin Yue Real Estate Development Co., Ltd. (3) | — | (146,314 | ) | |||||
| Total amounts payable to other related parties | (1,621,998 | ) | (146,314 | ) | ||||
| (1) | Entity is controlled by Xin Zhou. The balance as of December 31, 2007 represents a prepaid acquisition cost in connection with an acquisition with a third party of a secondary real estate brokerage company in Hangzhou, for which the entity is acting as an intermediary. The amount was intended to be | |
| applied towards the acquisition of Hangzhou Cityrehouse Real Estate Broker Co., Ltd. (“Hangzhou Chenxin”), which occurred in December 2007. Due to the foreign currency administration restriction imposed by the PRC government, the amount due from Turbo Chance Co., Inc. of HK$5,495,000 ($704,421) was not able to be applied to the acquisition of Hangzhou Chenxin. As such, on January 12, 2008, Turbo Chance Co., Inc. repaid the amount due to the Group. The amount is unsecured, interest free and has no fixed repayment term. | ||
| (2) | Entity is partially owned by Xin Zhou and Nanpeng Shen, directors of the Company. In connection with a primary real estate project, the entity contributed 50% of the customer deposit paid to the developer client and is entitled to 50% of the project’s profits. For the years ended December 31, 2007, E-House Property Investment 1 (China) Limited had earned $1,621,998 from the project, all of which was recorded as cost of sales and was payable as of December 31, 2007. The Company was entitled to $339,181 in fund management fees from the project, all of which was recorded as other income and as a receivable as of December 31, 2007. | |
| (3) | Xin Zhou is a director of the entity. The amount payable represents a loan to the Company. The amount is unsecured, interest free and has no fixed repayment term. |
F-31
Table of Contents
| Year ending December 31 | $ | |||
| 2009 | 9,491,096 | |||
| 2010 | 5,824,695 | |||
| 2011 | 2,508,622 | |||
| 2012 | 969,912 | |||
| 2013 | 243,265 | |||
| Total | 19,037,590 | |||
F-32
Table of Contents
| Exhibit Number | Description of Document | |||
| 1.1 | Amended and Restated Memorandum and Articles of Association (incorporated by reference to Exhibit 3.2 from our F-1 registration statement (File No. 333-148729), as amended, initially filed with the Commission on January 17, 2008) | |||
| 4.1 | E-House Share Incentive Plan, as amended and restated on October 16, 2008 (incorporated by reference to Exhibit 10.1 from our S-8 registration statement (File No. 333-148058), filed with the Commission on December 23, 2008) | |||
| 4.2 | * | CRIC Share Incentive Plan adopted as of September 9, 2008 | ||
| 4.3 | Form of Indemnification Agreement with the Registrant’s directors (incorporated by reference to Exhibit 10.2 from our F-1 registration statement (File No. 333-148729), as amended, initially filed with the Commission on January 17, 2008) | |||
| 4.4 | Form of Employment Agreement with the Registrant’s senior executives (incorporated by reference to Exhibit 10.3 from our F-1 registration statement (File No. 333-148729), as amended, initially filed with the Commission on January 17, 2008) | |||
| 4.5 | * | Equity Pledge Agreement dated April 1, 2008 between Shanghai CRIC and Xin Zhou | ||
| 4.6 | * | Exclusive Equity Transfer Call Agreement dated April 1, 2008 between Shanghai CRIC, Tian Zhuo and Xin Zhou | ||
| 4.7 | * | Loan Agreement dated March 10, 2008, between Shanghai CRIC and Xin Zhou | ||
| 4.8 | * | Loan Agreement dated April 1, 2008 between Shanghai CRIC and Xin Zhou | ||
| 4.9 | * | Loan Agreement dated April 1, 2008 between Tian Zhuo and Xin Zhou | ||
| 4.10 | * | Loan Agreement dated September 8, 2008 between Shanghai CRIC and Xin Zhou | ||
| 4.11 | * | Loan Agreement dated September 8, 2008 between Tian Zhuo and Xin Zhou | ||
| 4.12 | * | Shareholder Voting Rights Proxy Agreement dated April 1, 2008 between Shanghai CRIC, Tian Zhuo and Xin Zhou | ||
| 4.13 | * | Consultancy Service Agreement dated April 1, 2008 between Shanghai CRIC and Tian Zhuo | ||
| 8.1 | * | Subsidiaries of the Registrant | ||
| 11.1 | Code of Business Conduct and Ethics of the Registrant (incorporated by reference to Exhibit 99.1 from our F-1 registration statement (File No. 333-144451), as amended, initially filed with the Commission on July 10, 2007) | |||
| 12.1 | * | CEO Certification Pursuant to Section 302 of the Sarbanes-Oxley Act of 2002 | ||
| 12.2 | * | CFO Certification Pursuant to Section 302 of the Sarbanes-Oxley Act of 2002 | ||
| 13.1 | * | CEO Certification Pursuant to Section 906 of the Sarbanes-Oxley Act of 2002 | ||
| 13.2 | * | CFO Certification Pursuant to Section 906 of the Sarbanes-Oxley Act of 2002 | ||
| 23.1 | * | Consent of Deloitte Touche Tohmatsu CPA Ltd. | ||
| 23.2 | * | Consent of Jin Mao PRC Lawyers | ||
| 23.3 | * | Consent of Fangda Partners | ||
| * | Filed with this Annual Report on Form 20-F. |
33