UNITED STATES
SECURITIES AND EXCHANGE COMMISSION
WASHINGTON, D.C. 20549
FORM N-CSR
CERTIFIED SHAREHOLDER REPORT OF REGISTERED
MANAGEMENT INVESTMENT COMPANIES
Investment Company Act file number 811-22092
Oppenheimer Global Value Fund
(Exact name of registrant as specified in charter)
6803 South Tucson Way, Centennial, Colorado 80112-3924
(Address of principal executive offices) (Zip code)
Arthur S. Gabinet
OFI Global Asset Management, Inc.
Two World Financial Center, New York, New York 10281-1008
(Name and address of agent for service)
Registrant’s telephone number, including area code: (303) 768-3200
Date of fiscal year end: April 30
Date of reporting period: 4/30/2014
Item 1. Reports to Stockholders.
Table of Contents
Class A Shares
AVERAGE ANNUAL TOTAL RETURNS AT 4/30/14
| | | | | | |
| | | Class A Shares of the Fund | | |
| | | Without Sales Charge | | With Sales Charge | | MSCI All Country
World Index |
1-Year | | 18.59% | | 11.77% | | 14.40% |
5-Year | | 23.16 | | 21.71 | | 15.42 |
Since Inception (10/1/07) | | 6.14 | | 5.19 | | 2.15 |
Performance data quoted represents past performance, which does not guarantee future results. The investment return and principal value of an investment in the Fund will fluctuate so that an investor’s shares, when redeemed, may be worth more or less than their original cost. Fund returns include changes in share price, reinvested distributions, and a 5.75% maximum applicable sales charge except where “without sales charge” is indicated. Current performance may be lower or higher than the performance quoted. Returns do not consider capital gains or income taxes on an individual’s investment. For performance data current to the most recent month-end, visit oppenheimerfunds.com or call 1.800.CALL OPP (225.5677).
2 OPPENHEIMER GLOBAL VALUE FUND
Fund Performance Discussion
The Fund’s Class A shares (without sales charge) produced a total return of 18.59% during the reporting period, outperforming the MSCI All Country World Index (the “Index”), which returned 14.40%. The Fund received positive contributions to return from eight out of ten sectors of the Index, with meaningful contributions from holdings in the consumer discretionary, financials, telecommunication services and information technology sectors. Holdings in the health care sector detracted slightly from performance during the reporting period, and performance was roughly flat in the energy sector, where the Fund was significantly underweight the Index.
MARKET OVERVIEW
Global equity markets performed positively this reporting period, particularly over the first half of the reporting period, as they reacted favorably to good fiscal news and clear guidance on monetary policy in the United States. In October, the United States Congress managed to reach a bipartisan agreement to raise the national debt ceiling, and did so well ahead of the potential default deadline. In December, the Federal Reserve
(the “Fed”) announced that it would reduce its monthly bond purchases by $10 billion, or roughly 12%, from $85 billion to $75 billion, starting in January 2014. The Fed continued to hold short-term interest rates at very low levels.
However, most markets around the world were volatile over the second half of the reporting period. This was not surprising
COMPARISON OF CHANGE IN VALUE OF $10,000 HYPOTHETICAL INVESTMENTS IN:
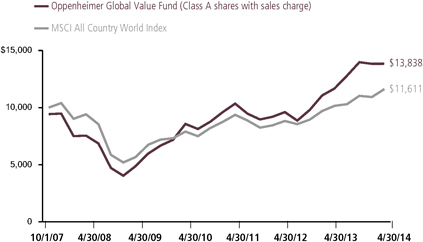
3 OPPENHEIMER GLOBAL VALUE FUND
given the surge in 2013. Financial headlines during this time were full of discussion of Fed policy, events in Ukraine, and the implications of a slowdown in China. Continued debate over tapering has inspired many moments of panic in the past year. It’s been clear for some time that returning to a normal state of monetary affairs is inevitable, will likely bring higher interest rates, and will come with various uncertainties. It is decidedly not clear that any of these possibilities has much to do with the long-term value of the companies we own or the potential investments we can make. We remain agnostic on Fed policy when it comes to positioning the portfolio. Seeking to obtain a large gap between what we’ve paid and the value of what we’ve received is our focus. We’ve had several opportunities to purchase securities that we believe demonstrate these large gaps because the headlines are full of issues such as “tapering.”
FUND REVIEW
Top performing holdings of the Fund this reporting period included Baidu, Inc., Kaveri Seed Co. Ltd. and Viacom, Inc. Shares of Baidu, the dominant search engine in China with more than 60% market share, gained significantly during the reporting period. We increased our position in Baidu over the first half of the reporting period, as the company continued on the right path to adapt to monetizing mobile search. We are not concerned with the recent volatility in Baidu’s shares, which resulted from macro turmoil and general weakness in technology-related companies. Baidu’s business results continue
to progress, and we believe the company represents compelling value.
Kaveri Seed is an India-based global leader in seed development. Demand for protein is rising due to an increasing number of people entering the middle class each year, particularly in the emerging markets. Urbanization, which typically feeds higher disposable income, is also spreading and decreasing the acreage available for agricultural use. The only viable solution to produce more food on less land is to increase yield. In this high barrier to entry industry, only seven companies worldwide matter, in our opinion. We consider these seed companies intellectual property companies, given the massive amount of research, time and money required to bring a seed to market. We increased our position in Kaveri Seed during the reporting period as volatility in India created an opportunity to buy at prices we believed represented great value. This decision proved beneficial to Fund returns, as shares rallied significantly in early 2014 with better than expected business results reported.
Top ten weighted position Viacom performed well as it delivered improvements in ratings at Nickelodeon and continued buying back large amounts of stock. We continue to have conviction in Viacom, as it has been better able to monetize its content by rolling out its own online and mobile applications, which directly link viewers to the company. This allows it to capture more value from its programming. Viacom may disproportionately
4 OPPENHEIMER GLOBAL VALUE FUND
benefit from on-demand and online viewership, with 300 online properties in 160 countries.
While detractors from performance were limited this reporting period, the most significant was NII Holdings, Inc. Shares of NII Holdings, which provides mobile telecommunication services throughout Latin America, declined largely due to management’s failure to execute on its plan in Mexico. We are willing to own companies that we believe have temporary operational or financial risk; however, we will not own companies that we believe have both. We exited our position during the reporting period because of the company’s operational and balance sheet risk.
Detracting from performance to a lesser degree were Quindell plc and RealD, Inc., both of which we exited during the reporting period. Quindell is a holding company that is involved in the sale of software and consulting services, and the provision of technology that enables business process outsourcing services to various industries.
RealD is the leading provider of 3D technology for movie theaters. The stock underperformed when box office results were weaker than expected. The percentage of movie revenues attributable to 3D films dropped substantially, partly due to a weak film slate.
STRATEGY
Our investment approach combines a thematic framework to idea generation with fundamental company analysis. As the world undergoes major economic and demographic structural shifts, we are keenly interested in where, and to whom, the economic benefits of these changes will flow. Broad in scope, these shifts serve as useful guides for identifying pockets of durable change. It’s within in these “pockets” that we search even further to find smaller investable sub-themes. Fundamental company analysis then helps us identify businesses with durable characteristics and good economics that we believe will benefit from these sub-themes and are poised to outperform over the long term. We seek companies that have a combination that includes, but is not limited to, revenue growth, high margins, durable, competitive advantages in a high-barrier-to-entry industry, strong franchise values, and unique or attractive assets.
Entry points are sought where a large gap exists between the current market price and a conservative estimate of intrinsic value. Our approach anchors valuation in business reality, such as cash-oriented metrics, which are the heart and soul of a company. When we examine the investment merits of a company and value it, we do so as if we were going to take it over, manage it and harvest the excess cash out of it. We believe it is a more strategic way to consider investment, more common to control investing or perhaps private equity than mutual fund investing.
5 OPPENHEIMER GLOBAL VALUE FUND
Our aim is to provide investors with attractive upside potential and limited downside. And our 3- to 5-year investment horizon allows our good ideas time to create real value for investors.
We believe turmoil in the markets always creates opportunity. We specialize in finding that opportunity and seeking to capture it for our shareholders. We believe significant, attractive opportunities have been created for shareholders this reporting period as numerous top-quality businesses in the sweet spot of positive structural trends have suffered severe declines.
| | |
 | | 
Randall C. Dishmon Portfolio Manager |
6 OPPENHEIMER GLOBAL VALUE FUND
Top Holdings and Allocations
TOP TEN COMMON STOCK HOLDINGS
| | |
Twenty-First Century Fox, Inc., Cl. A | | 4.8% |
Citigroup, Inc. | | 4.5 |
Google, Inc., Cl. A | | 3.6 |
Credit Suisse Group AG | | 3.5 |
Blinkx plc | | 3.4 |
Baidu, Inc., Sponsored ADR | | 3.2 |
Christian Dior SA | | 3.0 |
Yandex NV, Cl. A | | 2.6 |
Viacom, Inc., Cl. B | | 2.6 |
Assured Guaranty Ltd. | | 2.5 |
Portfolio holdings and allocations are subject to change. Percentages are as of April 30, 2014, and are based on net assets. For more current Fund holdings, please visit oppenheimerfunds.com.
TOP TEN GEOGRAPHICAL HOLDINGS
| | |
United States | | 47.3% |
Switzerland | | 8.1 |
France | | 7.9 |
Russia | | 6.7 |
Sweden | | 5.3 |
Japan | | 4.4 |
China | | 3.5 |
United Kingdom | | 3.4 |
Germany | | 3.3 |
India | | 2.8 |
Portfolio holdings and allocation are subject to change. Percentages are as of April 30, 2014, and are based on total market value of investments.
REGIONAL ALLOCATION
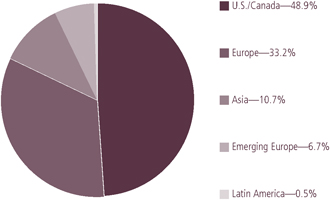
Portfolio holdings and allocations are subject to change. Percentages are as of April 30, 2014, and are based on the total market value of investments.
7 OPPENHEIMER GLOBAL VALUE FUND
Share Class Performance
AVERAGE ANNUAL TOTAL RETURNS WITHOUT SALES CHARGE AS OF 4/30/14
| | | | | | | | | | |
| | | Inception Date | | 1-Year | | 5-Year | | Since Inception | | |
Class A (GLVAX) | | 10/1/07 | | 18.59% | | 23.16% | | 6.14% | | |
Class C (GLVCX) | | 10/1/07 | | 17.65% | | 22.23% | | 5.33% | | |
Class I (GLVIX) | | 8/28/12 | | 19.09% | | N/A | | 26.67% | | |
Class N (GLVNX) | | 10/1/07 | | 18.20% | | 22.83% | | 5.86% | | |
Class Y (GLVYX) | | 10/1/07 | | 18.88% | | 23.56% | | 6.49% | | |
AVERAGE ANNUAL TOTAL RETURNS WITH SALES CHARGE AS OF 4/30/14
| | | | | | | | | | |
| | | Inception Date | | 1-Year | | 5-Year | | Since Inception | | |
Class A (GLVAX) | | 10/1/07 | | 11.77% | | 21.71% | | 5.19% | | |
Class C (GLVCX) | | 10/1/07 | | 16.65% | | 22.23% | | 5.33% | | |
Class I (GLVIX) | | 8/28/12 | | 19.09% | | N/A | | 26.67% | | |
Class N (GLVNX) | | 10/1/07 | | 17.20% | | 22.83% | | 5.86% | | |
Class Y (GLVYX) | | 10/1/07 | | 18.88% | | 23.56% | | 6.49% | | |
Performance data quoted represents past performance, which does not guarantee future results. The investment return and principal value of an investment in the Fund will fluctuate so that an investor’s shares, when redeemed, may be worth more or less than their original cost. Current performance may be lower or higher than the performance quoted. Returns do not consider capital gains or income taxes on an individual’s investment. For performance data current to the most recent month-end, visit oppenheimerfunds.com or call 1.800.CALL OPP (225.5677). Fund returns include changes in share price, reinvested distributions, and the applicable sales charge: for Class A shares, the current maximum initial sales charge of 5.75%; and for Class C and N shares, the contingent deferred sales charge of 1% for the 1-year period. There is no sales charge for Class I and Class Y shares.
The Fund’s performance is compared to the performance of the MSCI All Country World Index. The MSCI All Country World Index is a free float-adjusted market capitalization weighted index that is designed to measure the equity market performance of developed and emerging markets. The Index is unmanaged and cannot be purchased directly by investors. While index comparisons may be useful to provide a benchmark for the Fund’s performance, it must be noted that the Fund’s investments are not limited to the investments comprising the Index. Index performance includes reinvestment of income, but does not reflect transaction costs, fees, expenses or taxes. Index performance is shown for illustrative purposes only as a benchmark for the Fund’s performance, and does not predict or depict performance of the Fund. The Fund’s performance reflects the effects of the Fund’s business and operating expenses.
The Fund’s investment strategy and focus can change over time. The mention of specific fund holdings does not constitute a recommendation by OppenheimerFunds, Inc. or its affiliates.
8 OPPENHEIMER GLOBAL VALUE FUND
Before investing in any of the Oppenheimer funds, investors should carefully consider a fund’s investment objectives, risks, charges and expenses. Fund prospectuses and summary prospectuses contain this and other information about the funds, and may be obtained by asking your financial advisor, visiting oppenheimerfunds.com, or calling 1.800.CALL OPP (225.5677). Read prospectuses and summary prospectuses carefully before investing.
Shares of Oppenheimer funds are not deposits or obligations of any bank, are not guaranteed by any bank, are not insured by the FDIC or any other agency, and involve investment risks, including the possible loss of the principal amount invested.
9 OPPENHEIMER GLOBAL VALUE FUND
Fund Expenses
Fund Expenses. As a shareholder of the Fund, you incur two types of costs: (1) transaction costs, which may include sales charges (loads) on purchase payments, contingent deferred sales charges on redemptions; and (2) ongoing costs, including management fees; distribution and service fees; and other Fund expenses. These examples are intended to help you understand your ongoing costs (in dollars) of investing in the Fund and to compare these costs with the ongoing costs of investing in other mutual funds.
The examples are based on an investment of $1,000.00 invested at the beginning of the period and held for the entire 6-month period ended April 30, 2014.
Actual Expenses. The first section of the table provides information about actual account values and actual expenses. You may use the information in this section for the class of shares you hold, together with the amount you invested, to estimate the expense that you paid over the period. Simply divide your account value by $1,000.00 (for example, an $8,600.00 account value divided by $1,000.00 = 8.60), then multiply the result by the number in the first section under the heading entitled “Expenses Paid During Period” to estimate the expenses you paid on your account during this period.
Hypothetical Example for Comparison Purposes. The second section of the table provides information about hypothetical account values and hypothetical expenses based on the Fund’s actual expense ratio for each class of shares, and an assumed rate of return of 5% per year for each class before expenses, which is not the actual return. The hypothetical account values and expenses may not be used to estimate the actual ending account balance or expenses you paid for the period. You may use this information to compare the ongoing costs of investing in the Fund and other funds. To do so, compare this 5% hypothetical example for the class of shares you hold with the 5% hypothetical examples that appear in the shareholder reports of the other funds.
Please note that the expenses shown in the table are meant to highlight your ongoing costs only and do not reflect any transactional costs, such as front-end or contingent deferred sales charges (loads). Therefore, the “hypothetical” section of the table is useful in comparing ongoing costs only, and will not help you determine the relative total costs of owning different funds. In addition, if these transactional costs were included, your costs would have been higher.
10 OPPENHEIMER GLOBAL VALUE FUND
| | | | | | | | | | | | | | | | | | |
| Actual | | Beginning Account Value November 1, 2013 | | Ending Account Value April 30, 2014 | | Expenses Paid During 6 Months Ended April 30, 2014 | | | |
Class A | | $ | 1,000.00 | | | | | $ | 990.40 | | | | | $ | 6.44 | | | |
Class C | | | 1,000.00 | | | | | | 986.90 | | | | | | 10.20 | | | |
Class I | | | 1,000.00 | | | | | | 992.70 | | | | | | 4.26 | | | |
Class N | | | 1,000.00 | | | | | | 989.00 | | | | | | 7.67 | | | |
Class Y | | | 1,000.00 | | | | | | 991.50 | | | | | | 5.25 | | | |
| | | | | | |
Hypothetical (5% return before expenses) | | | | | | | | | | | | | | | | | | |
Class A | | | 1,000.00 | | | | | | 1,018.35 | | | | | | 6.53 | | | |
Class C | | | 1,000.00 | | | | | | 1,014.58 | | | | | | 10.34 | | | |
Class I | | | 1,000.00 | | | | | | 1,020.53 | | | | | | 4.32 | | | |
Class N | | | 1,000.00 | | | | | | 1,017.11 | | | | | | 7.78 | | | |
Class Y | | | 1,000.00 | | | | | | 1,019.54 | | | | | | 5.32 | | | |
Expenses are equal to the Fund’s annualized expense ratio for that class, multiplied by the average account value over the period, multiplied by 181/365 (to reflect the one-half year period). Those annualized expense ratios, excluding indirect expenses from affiliated funds, based on the 6-month period ended April 30, 2014 are as follows:
| | | | | | |
| Class | | Expense Ratios | | | |
Class A | | | 1.30 | % | | |
Class C | | | 2.06 | | | |
Class I | | | 0.86 | | | |
Class N | | | 1.55 | | | |
Class Y | | | 1.06 | | | |
The expense ratios reflect voluntary and/or contractual waivers and/or reimbursements of expenses by the Fund’s Manager. Some of these undertakings may be modified or terminated at any time, as indicated in the Fund’s prospectus. The “Financial Highlights” tables in the Fund’s financial statements, included in this report, also show the gross expense ratios, without such waivers or reimbursements and reduction to custodian expenses, if applicable.
11 OPPENHEIMER GLOBAL VALUE FUND
| | | | |
| | |
| | STATEMENT OF INVESTMENTS April 30, 2014 | | |
| | | | |
| | | | | | | | |
| | | Shares | | | Value | |
| |
| Common Stocks—98.9% | |
| |
| Consumer Discretionary—34.7% | |
| |
| Diversified Consumer Services—1.6% | |
| Ascent Capital Group, Inc., Cl. A1 | | | 121,975 | | | $ | 8,388,221 | |
|
| |
| Internet & Catalog Retail—7.0% | |
| Amazon.com, Inc.1 | | | 16,160 | | | | 4,914,741 | |
| |
| CDON Group AB1 | | | 1,720,312 | | | | 7,012,013 | |
| |
| Liberty Interactive Corp., Cl. A1 | | | 354,530 | | | | 10,302,642 | |
| |
| Rakuten, Inc. | | | 729,703 | | | | 9,435,387 | |
| |
| Yoox SpA1 | | | 143,287 | | | | 5,161,786 | |
| | | | | | | | |
| | | | | | | 36,826,569 | |
|
| |
| Media—18.8% | |
AMC Networks, Inc.,
Cl. A1 | | | 177,480 | | | | 11,655,112 | |
| |
| Grupo Televisa SAB, Sponsored ADR | | | 82,630 | | | | 2,711,090 | |
| |
| Liberty Global plc, Cl. A1 | | | 306,220 | | | | 12,193,680 | |
| |
| Madison Square Garden Co. (The), Cl. A1 | | | 206,980 | | | | 11,301,108 | |
| |
| News Corp., Cl. A1 | | | 122,352 | | | | 2,082,431 | |
| |
| Scripps Networks Interactive, Inc., Cl. A | | | 140,570 | | | | 10,552,590 | |
| |
| Twenty-First Century Fox, Inc., Cl. A | | | 788,440 | | | | 25,245,849 | |
| |
| Viacom, Inc., Cl. B | | | 161,110 | | | | 13,691,128 | |
| |
| Zee Entertainment Enterprises Ltd. | | | 1,618,811 | | | | 7,045,885 | |
| |
| ZON OPTIMUS SGPS SA | | | 380,347 | | | | 2,749,047 | |
| | | | | | | | |
| | | | | | | 99,227,920 | |
|
| |
| Textiles, Apparel & Luxury Goods—7.3% | |
| Christian Dior SA | | | 76,050 | | | | 15,644,761 | |
| |
| lululemon athletica, Inc.1 | | | 191,700 | | | | 8,804,781 | |
| |
| LVMH Moet Hennessy Louis Vuitton SA | | | 40,000 | | | | 7,873,684 | |
| |
| Prada SpA | | | 801,400 | | | | 6,421,503 | |
| | | | | | | | |
| | | | | | | 38,744,729 | |
|
| |
| Consumer Staples—7.1% | |
| |
| Beverages—2.7% | |
| Monster Beverage Corp.1 | | | 71,620 | | | | 4,795,675 | |
| | | | | | | | |
| | | Shares | | | Value | |
| |
| Beverages (Continued) | |
| |
| Pernod-Ricard SA | | | 78,860 | | | $ | 9,468,611 | |
| | | | | | | | |
| | | | | | | 14,264,286 | |
|
| |
| Food Products—2.9% | |
| Kaveri Seed Co. Ltd. | | | 624,884 | | | | 6,556,968 | |
| |
| KWS Saat AG | | | 19,575 | | | | 7,001,731 | |
| |
| Labixiaoxin Snacks Group Ltd. | | | 6,012,000 | | | | 1,744,755 | |
| | | | | | | | |
| | | | | | | 15,303,454 | |
|
| |
| Tobacco—1.5% | |
| Swedish Match AB1 | | | 233,346 | | | | 8,016,184 | |
|
| |
| Energy—1.1% | |
| |
| Oil, Gas & Consumable Fuels—1.1% | |
| Gazprom OAO, Sponsored ADR | | | 824,500 | | | | 5,982,466 | |
|
| |
| Financials—21.2% | |
| |
| Capital Markets—5.8% | |
| Credit Suisse Group AG1 | | | 581,275 | | | | 18,429,110 | |
| |
| UBS AG1 | | | 591,636 | | | | 12,382,796 | |
| | | | | | | | |
| | | | | | | 30,811,906 | |
|
| |
| Commercial Banks—7.1% | |
| Banco Bilbao Vizcaya Argentaria SA | | | 391,258 | | | | 4,818,282 | |
| |
| BNP Paribas SA | | | 114,630 | | | | 8,620,406 | |
| |
| Citigroup, Inc. | | | 501,140 | | | | 24,009,617 | |
| | | | | | | | |
| | | | | | | 37,448,305 | |
|
| |
| Diversified Financial Services—4.4% | |
| Bank of America Corp. | | | 830,973 | | | | 12,580,931 | |
| |
| Investment AB Kinnevik, Cl. B | | | 304,208 | | | | 10,722,503 | |
| | | | | | | | |
| | | | | | | 23,303,434 | |
|
| |
| Insurance—3.9% | |
| Assured Guaranty Ltd. | | | 557,443 | | | | 13,328,462 | |
| |
| MBIA, Inc.1 | | | 574,960 | | | | 6,968,515 | |
| | | | | | | | |
| | | | | | | 20,296,977 | |
|
| |
| Health Care—0.8% | |
| |
| Health Care Providers & Services—0.8% | |
| BioScrip, Inc.1 | | | 651,770 | | | | 4,510,248 | |
|
| |
| Industrials—1.6% | |
| |
| Machinery—1.6% | |
| Arcam AB1 | | | 73,487 | | | | 1,909,120 | |
12 OPPENHEIMER GLOBAL VALUE FUND
| | | | | | | | |
| | | Shares | | | Value | |
| |
| Machinery (Continued) | |
| |
| Navistar International Corp.1 | | | 172,863 | | | $ | 6,556,693 | |
| | | | | | | | |
| | | | | | | 8,465,813 | |
|
| |
| Information Technology—19.1% | |
| |
| Internet Software & Services—15.0% | |
Baidu, Inc.,
Sponsored ADR1 | | | 109,550 | | | | 16,854,267 | |
| |
| Blinkx plc1 | | | 12,294,170 | | | | 17,860,127 | |
| |
| eBay, Inc.1 | | | 227,798 | | | | 11,806,770 | |
| |
| Google, Inc., Cl. A1 | | | 35,370 | | | | 18,918,706 | |
| |
| Yandex NV, Cl. A1 | | | 525,430 | | | | 13,923,895 | |
| | | | | | | | |
| | | | | | | 79,363,765 | |
|
| |
| IT Services—3.3% | |
QIWI plc,
Sponsored ADR | | | 243,670 | | | | 7,049,373 | |
| |
| Wirecard AG | | | 249,954 | | | | 10,493,662 | |
| | | | | | | | |
| | | | | | | 17,543,035 | |
|
| |
| Software—0.8% | |
| Guidance Software, Inc.1 | | | 454,130 | | | | 4,182,537 | |
|
| |
| Materials—5.4% | | | | | | | | |
| |
| Chemicals—5.4% | | | | | | | | |
| Chr. Hansen Holding AS | | | 183,957 | | | | 8,294,719 | |
| |
| Monsanto Co. | | | 77,470 | | | | 8,575,929 | |
| |
| Syngenta AG1 | | | 29,180 | | | | 11,586,390 | |
| | | | | | | | |
| | | | | | | 28,457,038 | |
|
| |
| Telecommunication Services—6.2% | |
| |
| Wireless Telecommunication Services—6.2% | |
| KDDI Corp. | | | 123,300 | | | | 6,563,073 | |
| |
| Sistema JSFC, Sponsored GDR | | | 360,100 | | | | 8,615,734 | |
| |
| SoftBank Corp. | | | 95,100 | | | | 7,058,958 | |
| |
| Telephone & Data Systems, Inc. | | | 380,330 | | | | 10,341,173 | |
| | | | | | | | |
| | | | | | | 32,578,938 | |
| | | | | | | | |
| | | Shares | | | Value | |
| |
| Utilities—1.7% | | | | | | | | |
| |
| Gas Utilities—1.7% | | | | | | | | |
| National Fuel Gas Co. | | | 119,740 | | | $ | 8,817,654 | |
| | | | | | | | |
Total Common Stocks (Cost $484,608,360) | | | | | | | 522,533,479 | |
|
| |
| Preferred Stock—0.1% | |
Zee Entertainment Enterprises Ltd., 6% Cum. Non-Cv. (Cost $372,487) | | | 33,995,031 | | | | 433,992 | |
|
| |
| Investment Company—0.5% | |
| |
Oppenheimer Institutional Money Market Fund, Cl. E, 0.08%2,3 (Cost $2,827,177) | | | 2,827,177 | | | | 2,827,177 | |
| |
Total Investments, at Value (Cost $487,808,024) | | | 99.5 | % | | | 525,794,648 | |
| |
| Assets in Excess of Other Liabilities | | | 0.5 | | | | 2,716,527 | |
| | | | |
| Net Assets | | | 100.0 | % | | $ | 528,511,175 | |
| | | | |
Footnotes to Statement of Investments
1. Non-income producing security.
2. Rate shown is the 7-day yield as of April 30, 2014.
13 OPPENHEIMER GLOBAL VALUE FUND
| | | | |
| | |
| | STATEMENT OF INVESTMENTS Continued | | |
| | |
| | Footnotes to Statement of Investments (Continued) | | |
3. Is or was an affiliate, as defined in the Investment Company Act of 1940, at or during the period ended April 30, 2014, by virtue of the Fund owning at least 5% of the voting securities of the issuer or as a result of the Fund and the issuer having the same investment adviser. Transactions during the period in which the issuer was an affiliate are as follows:
| | | | | | | | | | | | | | | | |
| | | Shares April 30, 2013 | | | Gross Additions | | | Gross Reductions | | | Shares April 30, 2014 | |
| Oppenheimer Institutional Money Market Fund, Cl. E | | | 2,537,943 | | | | 160,322,129 | | | | 160,032,895 | | | | 2,827,177 | |
| | | | |
| | | | | | | | | Value | | | Income | |
| Oppenheimer Institutional Money Market Fund, Cl. E | | | | | | | | | | $ | 2,827,177 | | | $ | 4,030 | |
| | | | | | | | |
| Distribution of investments representing geographic holdings, as a percentage of total investments at value, is as follows: | |
| Geographic Holdings | | Value | | | Percent | |
United States | | | $ 248,547,590 | | | | 47.3% | |
Switzerland | | | 42,398,295 | | | | 8.1 | |
France | | | 41,607,462 | | | | 7.9 | |
Russia | | | 35,571,468 | | | | 6.7 | |
Sweden | | | 27,659,819 | | | | 5.3 | |
Japan | | | 23,057,419 | | | | 4.4 | |
China | | | 18,599,023 | | | | 3.5 | |
United Kingdom | | | 17,860,127 | | | | 3.4 | |
Germany | | | 17,495,392 | | | | 3.3 | |
India | | | 14,036,846 | | | | 2.8 | |
Italy | | | 11,583,288 | | | | 2.2 | |
Canada | | | 8,804,781 | | | | 1.6 | |
Denmark | | | 8,294,719 | | | | 1.6 | |
Spain | | | 4,818,282 | | | | 0.9 | |
Portugal | | | 2,749,047 | | | | 0.5 | |
Mexico | | | 2,711,090 | | | | 0.5 | |
| | | | |
Total | | | $ 525,794,648 | | | | 100.0% | |
| | | | |
See accompanying Notes to Financial Statements.
14 OPPENHEIMER GLOBAL VALUE FUND
| | | | |
| | |
| | STATEMENTOF ASSETS AND LIABILITIES April 30, 2014 | | |
| | | | |
| |
| Assets | | | | |
| Investments, at value—see accompanying statement of investments: | | | | |
| Unaffiliated companies (cost $484,980,847) | | $ | 522,967,471 | |
| Affiliated companies (cost $2,827,177) | | | 2,827,177 | |
| | | | |
| | | 525,794,648 | |
| |
| Receivables and other assets: | | | | |
| Investments sold | | | 14,804,404 | |
| Shares of beneficial interest sold | | | 3,999,782 | |
| Dividends | | | 105,247 | |
| Other | | | 8,137 | |
| | | | |
| Total assets | | | 544,712,218 | |
|
| |
| Liabilities | | | | |
| Bank overdraft | | | 5 | |
| |
| Payables and other liabilities: | | | | |
| Investments purchased | | | 9,796,886 | |
| Shares of beneficial interest redeemed | | | 5,563,786 | |
| Foreign capital gains tax | | | 711,199 | |
| Distribution and service plan fees | | | 82,300 | |
| Shareholder communications | | | 6,678 | |
| Trustees’ compensation | | | 3,643 | |
| Other | | | 36,546 | |
| | | | |
| Total liabilities | | | 16,201,043 | |
|
| |
| Net Assets | | $ | 528,511,175 | |
| | | | |
|
| |
| Composition of Net Assets | | | | |
| Par value of shares of beneficial interest | | $ | 12,631 | |
| |
| Additional paid-in capital | | | 483,078,365 | |
| |
| Accumulated net investment loss | | | (3,024) | |
| |
| Accumulated net realized gain on investments and foreign currency transactions | | | 8,145,011 | |
| |
| Net unrealized appreciation on investments and translation of assets and liabilities denominated in foreign currencies | | | 37,278,192 | |
| | | | |
| Net Assets | | $ | 528,511,175 | |
| | | | |
15 OPPENHEIMER GLOBAL VALUE FUND
| | | | |
| | |
| | STATEMENTOF ASSETS AND LIABILITIES Continued | | |
| | | | |
| |
Net Asset Value Per Share | | | | |
Class A Shares: | | | | |
| Net asset value and redemption price per share (based on net assets of $301,853,862 and 7,184,498 shares of beneficial interest outstanding) | | $ | 42.01 | |
| Maximum offering price per share (net asset value plus sales charge of 5.75% of offering price) | | $ | 44.57 | |
| |
Class C Shares: | | | | |
| Net asset value, redemption price (excludes applicable contingent deferred sales charge) and offering price per share (based on net assets of $94,011,454 and 2,312,443 shares of beneficial interest outstanding) | | $ | 40.65 | |
| |
Class I Shares: | | | | |
| Net asset value, redemption price and offering price per share (based on net assets of $14,349,738 and 338,238 shares of beneficial interest outstanding) | | $ | 42.42 | |
| |
Class N Shares: | | | | |
| Net asset value, redemption price (excludes applicable contingent deferred sales charge) and offering price per share (based on net assets of $5,445,552 and 131,213 shares of beneficial interest outstanding) | | $ | 41.50 | |
| |
Class Y Shares: | | | | |
| Net asset value, redemption price and offering price per share (based on net assets of $112,850,569 and 2,664,591 shares of beneficial interest outstanding) | | $ | 42.35 | |
See accompanying Notes to Financial Statements.
16 OPPENHEIMER GLOBAL VALUE FUND
| | | | |
| | |
| | STATEMENTOF OPERATIONS For the Year Ended April 30, 2014 | | |
| | | | |
| |
Investment Income | | | | |
| |
Dividends: | | | | |
Unaffiliated companies (net of foreign withholding taxes of $225,859) | | $ | 2,875,229 | |
Affiliated companies | | | 4,030 | |
| |
Other income | | | 444 | |
| | | | |
Total investment income | | | 2,879,703 | |
|
| |
Expenses | | | | |
Management fees | | | 2,640,250 | |
| |
Distribution and service plan fees: | | | | |
Class A | | | 495,709 | |
Class C | | | 513,056 | |
Class N | | | 17,112 | |
| |
Transfer and shareholder servicing agent fees: | | | | |
Class A | | | 433,531 | |
Class C | | | 112,962 | |
Class I | | | 3,134 | |
Class N | | | 8,232 | |
Class Y | | | 122,706 | |
| |
Shareholder communications: | | | | |
Class A | | | 39,648 | |
Class C | | | 9,306 | |
Class I | | | 42 | |
Class N | | | 952 | |
Class Y | | | 4,705 | |
| |
Custodian fees and expenses | | | 27,593 | |
| |
Trustees’ compensation | | | 5,738 | |
| |
Other | | | 69,920 | |
| | | | |
Total expenses | | | 4,504,596 | |
Less waivers and reimbursements of expenses | | | (4,775) | |
| | | | |
Net expenses | | | 4,499,821 | |
|
| |
Net Investment Loss | | | (1,620,118) | |
|
| |
Realized and Unrealized Gain (Loss) | | | | |
Net realized gain (loss) on: | | | | |
Investments from unaffiliated companies (net of foreign capital gains tax of $118,913) | | | 17,320,437 | |
Foreign currency transactions | | | (61,930) | |
| | | | |
Net realized gain | | | 17,258,507 | |
| |
Net change in unrealized appreciation/depreciation on: | | | | |
Investments (net of foreign capital gains tax of $711,199) | | | 8,566,325 | |
Translation of assets and liabilities denominated in foreign currencies | | | 4,261,696 | |
| | | | |
Net change in unrealized appreciation/depreciation | | | 12,828,021 | |
|
| |
Net Increase in Net Assets Resulting from Operations | | $ | 28,466,410 | |
| | | | |
See accompanying Notes to Financial Statements.
17 OPPENHEIMER GLOBAL VALUE FUND
| | | | |
| | |
| | STATEMENTS OF CHANGES IN NET ASSETS | | |
| | | | | | | | |
| | | Year Ended | | | Year Ended | |
| | | April 30, 2014 | | | April 30, 2013 | |
| |
Operations | | | | |
Net investment income (loss) | | $ | (1,620,118) | | | $ | 326,069 | |
| |
Net realized gain (loss) | | | 17,258,507 | | | | (2,308,525) | |
| |
Net change in unrealized appreciation/depreciation | | | 12,828,021 | | | | 22,045,433 | |
| | | | | | | | |
Net increase in net assets resulting from operations | | | 28,466,410 | | | | 20,062,977 | |
| |
Dividends and/or Distributions to Shareholders | | | | |
Dividends from net investment income: | | | | |
Class A | | | (295,855) | | | | — | |
Class C | | | — | | | | — | |
Class I | | | (40,064) | | | | — | |
Class N | | | — | | | | — | |
Class Y | | | (181,707) | | | | — | |
| | | | |
| | | (517,626) | | | | — | |
| |
Beneficial Interest Transactions | | | | |
Net increase in net assets resulting from beneficial interest transactions: | | | | |
Class A | | | 186,371,350 | | | | 25,411,186 | |
Class C | | | 72,854,790 | | | | 6,415,141 | |
Class I | | | 6,676,473 | | | | 5,852,313 | |
Class N | | | 3,568,342 | | | | 37,727 | |
Class Y | | | 87,974,029 | | | | 6,301,596 | |
| | | | | | | | |
| | | 357,444,984 | | | | 44,017,963 | |
| |
Net Assets | | | | |
Total increase | | | 385,393,768 | | | | 64,080,940 | |
| |
Beginning of period | | | 143,117,407 | | | | 79,036,467 | |
| | | | | | | | |
End of period (including accumulated net investment income (loss) of $(3,024) and $514,471, respectively) | | $ | 528,511,175 | | | $ | 143,117,407 | |
| | | | |
See accompanying Notes to Financial Statements.
18 OPPENHEIMER GLOBAL VALUE FUND
| | | | | | | | | | | | | | | | | | | | |
| Class A | | Year Ended April 30,
2014 | | | Year Ended April 30,
2013 | | | Year Ended April 30,
2012 | | | Year Ended April 29,
20111 | | | Year Ended April 30,
2010 | |
| |
| Per Share Operating Data | | | | | | | | | | | | | | | | | | | | |
| Net asset value, beginning of period | | $ | 35.48 | | | $ | 29.20 | | | $ | 31.60 | | | $ | 26.18 | | | $ | 15.03 | |
| |
| Income (loss) from investment operations: | | | | | | | | | | | | | | | | | | | | |
| Net investment income (loss)2 | | | (0.17) | | | | 0.12 | | | | (0.09) | | | | (0.16) | | | | (0.01) | |
| Net realized and unrealized gain (loss) | | | 6.75 | | | | 6.16 | | | | (2.18) | | | | 5.58 | | | | 11.33 | |
| | | | |
| Total from investment operations | | | 6.58 | | | | 6.28 | | | | (2.27) | | | | 5.42 | | | | 11.32 | |
| |
| Dividends and/or distributions to shareholders: | | | | | | | | | | | | | | | | | | | | |
| Dividends from net investment income | | | (0.05) | | | | 0.00 | | | | 0.00 | | | | 0.00 | | | | (0.17) | |
| Distributions from net realized gain | | | 0.00 | | | | 0.00 | | | | (0.13) | | | | 0.00 | | | | 0.00 | |
| | | | |
| Total dividends and/or distributions to shareholders | | | (0.05) | | | | 0.00 | | | | (0.13) | | | | 0.00 | | | | (0.17) | |
| |
| Net asset value, end of period | | $ | 42.01 | | | $ | 35.48 | | | $ | 29.20 | | | $ | 31.60 | | | $ | 26.18 | |
| | | | |
|
| |
Total Return, at Net Asset Value3 | | | 18.59% | | | | 21.51% | | | | (7.16)% | | | | 20.70% | | | | 75.50% | |
| |
| Ratios/Supplemental Data | | | | | | | | | | | | | | | | | | | | |
| Net assets, end of period (in thousands) | | $ | 301,854 | | | $ | 94,978 | | | $ | 56,178 | | | $ | 32,944 | | | $ | 2,255 | |
| |
| Average net assets (in thousands) | | $ | 206,885 | | | $ | 63,128 | | | $ | 33,226 | | | $ | 8,939 | | | $ | 1,801 | |
| |
| Ratios to average net assets:4 | | | | | | | | | | | | | | | | | | | | |
| Net investment income (loss) | | | (0.41)% | | | | 0.40% | | | | (0.33)% | | | | (0.57)% | | | | (0.04)% | |
| Total expenses5 | | | 1.30% | | | | 1.34% | | | | 1.41% | | | | 1.73% | | | | 3.95% | |
| Expenses after payments, waivers and/or reimbursements and reduction to custodian expenses | | | 1.30% | | | | 1.34% | | | | 1.34% | | | | 1.40% | | | | 1.40% | |
| |
| Portfolio turnover rate | | | 59% | | | | 87% | | | | 62% | | | | 37% | | | | 85% | |
1. April 29, 2011 represents the last business day of the Fund’s 2011 reporting period.
2. Per share amounts calculated based on the average shares outstanding during the period.
3. Assumes an initial investment on the business day before the first day of the fiscal period, with all dividends and distributions reinvested in additional shares on the reinvestment date, and redemption at the net asset value calculated on the last business day of the fiscal period. Sales charges are not reflected in the total returns. Total returns are not annualized for periods less than one full year. Returns do not reflect the deduction of taxes that a shareholder would pay on fund distributions or the redemption of fund shares.
4. Annualized for periods less than one full year.
5. Total expenses including indirect expenses from affiliated fund were as follows:
| | | | | | | | | | |
| | Year Ended April 30, 2014 | | | 1.30 | % | | | | |
| | Year Ended April 30, 2013 | | | 1.34 | % | | | | |
| | Year Ended April 30, 2012 | | | 1.41 | % | | | | |
| | Year Ended April 29, 2011 | | | 1.73 | % | | | | |
| | Year Ended April 30, 2010 | | | 3.95 | % | | | | |
See accompanying Notes to Financial Statements.
19 OPPENHEIMER GLOBAL VALUE FUND
| | | | |
| | FINANCIAL HIGHLIGHTS Continued | | |
| | | | | | | | | | | | | | | | | | | | |
| Class C | | Year Ended April 30,
2014 | | | Year Ended April 30,
2013 | | | Year Ended April 30,
2012 | | | Year Ended April 29,
20111 | | | Year Ended April 30,
2010 | |
| |
| Per Share Operating Data | | | | | | | | | | | | | | | | | | | | |
| Net asset value, beginning of period | | $ | 34.56 | | | $ | 28.67 | | | $ | 31.26 | | | $ | 26.11 | | | $ | 15.01 | |
| |
| Income (loss) from investment operations: | | | | | | | | | | | | | | | | | | | | |
| Net investment loss2 | | | (0.50) | | | | (0.13) | | | | (0.33) | | | | (0.37) | | | | (0.17) | |
| Net realized and unrealized gain (loss) | | | 6.59 | | | | 6.02 | | | | (2.13) | | | | 5.52 | | | | 11.32 | |
| | | | |
| Total from investment operations | | | 6.09 | | | | 5.89 | | | | (2.46) | | | | 5.15 | | | | 11.15 | |
| |
| Dividends and/or distributions to shareholders: | | | | | | | | | | | | | | | | | | | | |
| Dividends from net investment income | | | 0.00 | | | | 0.00 | | | | 0.00 | | | | 0.00 | | | | (0.05) | |
| Distributions from net realized gain | | | 0.00 | | | | 0.00 | | | | (0.13) | | | | 0.00 | | | | 0.00 | |
| | | | |
| Total dividends and/or distributions to shareholders | | | 0.00 | | | | 0.00 | | | | (0.13) | | | | 0.00 | | | | (0.05) | |
| |
| Net asset value, end of period | | $ | 40.65 | | | $ | 34.56 | | | $ | 28.67 | | | $ | 31.26 | | | $ | 26.11 | |
| | | | |
|
| |
Total Return, at Net Asset Value3 | | | 17.65% | | | | 20.55% | | | | (7.84)% | | | | 19.73% | | | | 74.33% | |
| |
| Ratios/Supplemental Data | | | | | | | | | | | | | | | | | | | | |
| Net assets, end of period (in thousands) | | $ | 94,011 | | | $ | 18,062 | | | $ | 9,116 | | | $ | 3,824 | | | $ | 44 | |
| |
| Average net assets (in thousands) | | $ | 51,545 | | | $ | 11,396 | | | $ | 5,630 | | | $ | 745 | | | $ | 36 | |
| |
| Ratios to average net assets:4 | | | | | | | | | | | | | | | | | | | | |
| Net investment loss | | | (1.23)% | | | | (0.43)% | | | | (1.19)% | | | | (1.26)% | | | | (0.79)% | |
| Total expenses5 | | | 2.06% | | | | 2.16% | | | | 2.26% | | | | 2.63% | | | | 9.28% | |
| Expenses after payments, waivers and/or reimbursements and reduction to custodian expenses | | | 2.06% | | | | 2.14% | | | | 2.15% | | | | 2.15% | | | | 2.15% | |
| |
| Portfolio turnover rate | | | 59% | | | | 87% | | | | 62% | | | | 37% | | | | 85% | |
1. April 29, 2011 represents the last business day of the Fund’s 2011 reporting period.
2. Per share amounts calculated based on the average shares outstanding during the period.
3. Assumes an initial investment on the business day before the first day of the fiscal period, with all dividends and distributions reinvested in additional shares on the reinvestment date, and redemption at the net asset value calculated on the last business day of the fiscal period. Sales charges are not reflected in the total returns. Total returns are not annualized for periods less than one full year. Returns do not reflect the deduction of taxes that a shareholder would pay on fund distributions or the redemption of fund shares.
4. Annualized for periods less than one full year.
5. Total expenses including indirect expenses from affiliated fund were as follows:
| | | | | | | | | | |
| | Year Ended April 30, 2014 | | | 2.06 | % | | | | |
| | Year Ended April 30, 2013 | | | 2.16 | % | | | | |
| | Year Ended April 30, 2012 | | | 2.26 | % | | | | |
| | Year Ended April 29, 2011 | | | 2.63 | % | | | | |
| | Year Ended April 30, 2010 | | | 9.28 | % | | | | |
See accompanying Notes to Financial Statements.
20 OPPENHEIMER GLOBAL VALUE FUND
| | | | | | | | | | | | | | | | | | |
| | | Year Ended Period Ended | | | | | | | | | | | |
| Class I | | April 30,
2014 | | | April 30,
20131 | | | | | | | | | | | |
| | | | | | | | | | | |
Per Share Operating Data | | | | | | | | | | | | | | | | | | |
| Net asset value, beginning of period | | $ | 35.76 | | | $ | 28.68 | | | | | | | | | | | |
| | | | | | | | | | | |
| Income (loss) from investment operations: | | | | | | | | | | | | | | | | | | |
Net investment income2 | | | 0.04 | | | | 0.07 | | | | | | | | | | | |
Net realized and unrealized gain | | | 6.78 | | | | 7.01 | | | | | | | | | | | |
| | | | | | | | | | | | | | |
Total from investment operations | | | 6.82 | | | | 7.08 | | | | | | | | | | | |
| | | | | | | | | | | |
| Dividends and/or distributions to shareholders: | | | | | | | | | | | | | | | | | | |
| Dividends from net investment income | | | (0.16) | | | | 0.00 | | | | | | | | | | | |
| Distributions from net realized gain | | | 0.00 | | | | 0.00 | | | | | | | | | | | |
| | | | | | | | | | | | | | |
| Total dividends and/or distributions to shareholders | | | (0.16) | | | | 0.00 | | | | | | | | | | | |
| | | | | | | | | | | |
Net asset value, end of period | | $ | 42.42 | | | $ | 35.76 | | | | | | | | | | | |
| | | | | | | | | | | | | | |
| | | | | |
| | | | | | | | | | | |
| Total Return, at Net Asset Value3 | | | 19.09% | | | | 24.69% | | | | | | | | | | | |
| | | | | |
| | | | | | | | | | | |
| Ratios/Supplemental Data | | | | | | | | | | | | | | | | | | |
| Net assets, end of period (in thousands) | | $ | 14,350 | | | $ | 6,364 | | | | | | | | | | | |
| | | | | | | | | | | |
| Average net assets (in thousands) | | $ | 10,473 | | | $ | 2,381 | | | | | | | | | | | |
| | | | | | | | | | | |
Ratios to average net assets:4 | | | | | | | | | | | | | | | | | | |
Net investment income | | | 0.10% | | | | 0.31% | | | | | | | | | | | |
Total expenses5 | | | 0.86% | | | | 0.89% | | | | | | | | | | | |
| Expenses after payments, waivers and/or reimbursements and reduction to custodian expenses | | | 0.86% | | | | 0.89% | | | | | | | | | | | |
| | | | | | | | | | | |
Portfolio turnover rate | | | 59% | | | | 87% | | | | | | | | | | | |
1. For the period from August 28, 2012 (inception of offering) to April 30, 2013.
2. Per share amounts calculated based on the average shares outstanding during the period.
3. Assumes an initial investment on the business day before the first day of the fiscal period, with all dividends and distributions reinvested in additional shares on the reinvestment date, and redemption at the net asset value calculated on the last business day of the fiscal period. Sales charges are not reflected in the total returns. Total returns are not annualized for periods less than one full year. Returns do not reflect the deduction of taxes that a shareholder would pay on fund distributions or the redemption of fund shares.
4. Annualized for periods less than one full year.
5. Total expenses including indirect expenses from affiliated fund were as follows:
| | | | | | | | |
| | Year Ended April 30, 2014 | | | 0.86% | | | |
| | Period Ended April 30, 2013 | | | 0.89% | | | |
See accompanying Notes to Financial Statements.
21 OPPENHEIMER GLOBAL VALUE FUND
| | | | |
| | FINANCIAL HIGHLIGHTS Continued | | |
| | | | | | | | | | | | | | | | | | | | |
| Class N | | Year Ended
April 30,
2014 | | | Year Ended
April 30,
2013 | | | Year Ended
April 30,
2012 | | | Year Ended
April 29,
20111 | | | Year Ended
April 30,
2010 | |
| |
Per Share Operating Data | | | | | | | | | | | | | | | | | | | | |
Net asset value, beginning of period | | $ | 35.11 | | | $ | 28.98 | | | $ | 31.43 | | | $ | 26.11 | | | $ | 15.00 | |
| |
Income (loss) from investment operations: | | | | | | | | | | | | | | | | | | | | |
Net investment income (loss)2 | | | (0.29) | | | | 0.03 | | | | (0.17) | | | | (0.22) | | | | (0.06) | |
Net realized and unrealized gain (loss) | | | 6.68 | | | | 6.10 | | | | (2.15) | | | | 5.54 | | | | 11.30 | |
| | | | |
Total from investment operations | | | 6.39 | | | | 6.13 | | | | (2.32) | | | | 5.32 | | | | 11.24 | |
| |
Dividends and/or distributions to shareholders: | | | | | | | | | | | | | | | | | | | | |
Dividends from net investment income | | | 0.00 | | | | 0.00 | | | | 0.00 | | | | 0.00 | | | | (0.13) | |
Distributions from net realized gain | | | 0.00 | | | | 0.00 | | | | (0.13) | | | | 0.00 | | | | 0.00 | |
| | | | |
Total dividends and/or distributions to shareholders | | | 0.00 | | | | 0.00 | | | | (0.13) | | | | 0.00 | | | | (0.13) | |
| |
Net asset value, end of period | | $ | 41.50 | | | $ | 35.11 | | | $ | 28.98 | | | $ | 31.43 | | | $ | 26.11 | |
| | | | |
|
| |
Total Return, at Net Asset Value3 | | | 18.20% | | | | 21.15% | | | | (7.35)% | | | | 20.38% | | | | 75.09% | |
|
| |
Ratios/Supplemental Data | | | | | | | | | | | | | | | | | | | | |
Net assets, end of period (in thousands) | | $ | 5,445 | | | $ | 1,555 | | | $ | 1,278 | | | $ | 610 | | | $ | 44 | |
| |
Average net assets (in thousands) | | $ | 3,548 | | | $ | 1,188 | | | $ | 763 | | | $ | 150 | | | $ | 36 | |
| |
Ratios to average net assets:4 | | | | | | | | | | | | | | | | | | | | |
Net investment income (loss) | | | (0.69)% | | | | 0.11% | | | | (0.62)% | | | | (0.78)% | | | | (0.29)% | |
Total expenses5 | | | 1.57% | | | | 1.64% | | | | 1.67% | | | | 3.21% | | | | 8.78% | |
| Expenses after payments, waivers and/or reimbursements and reduction to custodian expenses | | | 1.56% | | | | 1.64% | | | | 1.60% | | | | 1.65% | | | | 1.65% | |
| |
Portfolio turnover rate | | | 59% | | | | 87% | | | | 62% | | | | 37% | | | | 85% | |
1. April 29, 2011 represents the last business day of the Fund’s 2011 reporting period.
2. Per share amounts calculated based on the average shares outstanding during the period.
3. Assumes an initial investment on the business day before the first day of the fiscal period, with all dividends and distributions reinvested in additional shares on the reinvestment date, and redemption at the net asset value calculated on the last business day of the fiscal period. Sales charges are not reflected in the total returns. Total returns are not annualized for periods less than one full year. Returns do not reflect the deduction of taxes that a shareholder would pay on fund distributions or the redemption of fund shares.
4. Annualized for periods less than one full year.
5. Total expenses including indirect expenses from affiliated fund were as follows:
| | | | | | | | |
| | Year Ended April 30, 2014 | | | 1.57% | | | |
| | Year Ended April 30, 2013 | | | 1.64% | | | |
| | Year Ended April 30, 2012 | | | 1.67% | | | |
| | Year Ended April 29, 2011 | | | 3.21% | | | |
| | Year Ended April 30, 2010 | | | 8.78% | | | |
See accompanying Notes to Financial Statement.
22 OPPENHEIMER GLOBAL VALUE FUND
| | | | | | | | | | | | | | | | | | | | |
| Class Y | | Year Ended
April 30,
2014 | | | Year Ended
April 30,
2013 | | | Year Ended
April 30,
2012 | | | Year Ended
April 29,
20111 | | | Year Ended
April 30,
2010 | |
| |
Per Share Operating Data | | | | | | | | | | | | | | | | | | | | |
Net asset value, beginning of period | | $ | 35.73 | | | $ | 29.32 | | | $ | 31.62 | | | $ | 26.11 | | | $ | 14.97 | |
| |
Income (loss) from investment operations: | | | | | | | | | | | | | | | | | | | | |
Net investment income (loss)2 | | | (0.09) | | | | 0.23 | | | | (0.03) | | | | (0.08) | | | | 0.06 | |
Net realized and unrealized gain (loss) | | | 6.84 | | | | 6.18 | | | | (2.14) | | | | 5.59 | | | | 11.31 | |
| | | | |
Total from investment operations | | | 6.75 | | | | 6.41 | | | | (2.17) | | | | 5.51 | | | | 11.37 | |
| |
Dividends and/or distributions to shareholders: | | | | | | | | | | | | | | | | | | | | |
Dividends from net investment income | | | (0.13) | | | | 0.00 | | | | 0.00 | | | | 0.00 | | | | (0.23) | |
Distributions from net realized gain | | | 0.00 | | | | 0.00 | | | | (0.13) | | | | 0.00 | | | | 0.00 | |
| | | | |
Total dividends and/or distributions to shareholders | | | (0.13) | | | | 0.00 | | | | (0.13) | | | | 0.00 | | | | (0.23) | |
| |
Net asset value, end of period | | $ | 42.35 | | | $ | 35.73 | | | $ | 29.32 | | | $ | 31.62 | | | $ | 26.11 | |
| | | | |
|
| |
Total Return, at Net Asset Value3 | | | 18.88% | | | | 21.86% | | | | (6.83)% | | | | 21.11% | | | | 76.23% | |
|
| |
Ratios/Supplemental Data | | | | | | | | | | | | | | | | | | | | |
Net assets, end of period (in thousands) | | $ | 112,851 | | | $ | 22,158 | | | $ | 12,464 | | | $ | 4,248 | | | $ | 45 | |
| |
Average net assets (in thousands) | | $ | 59,159 | | | $ | 15,188 | | | $ | 7,141 | | | $ | 637 | | | $ | 36 | |
| |
Ratios to average net assets:4 | | | | | | | | | | | | | | | | | | | | |
Net investment income (loss) | | | (0.22)% | | | | 0.74% | | | | (0.11)% | | | | (0.28)% | | | | 0.31% | |
Total expenses5 | | | 1.04% | | | | 1.03% | | | | 1.14% | | | | 1.58% | | | | 8.53% | |
| Expenses after payments, waivers and/or reimbursements and reduction to custodian expenses | | | 1.04% | | | | 1.02% | | | | 1.05% | | | | 1.05% | | | | 1.05% | |
| |
Portfolio turnover rate | | | 59% | | | | 87% | | | | 62% | | | | 37% | | | | 85% | |
1. April 29, 2011 represents the last business day of the Fund’s 2011 reporting period.
2. Per share amounts calculated based on the average shares outstanding during the period.
3. Assumes an initial investment on the business day before the first day of the fiscal period, with all dividends and distributions reinvested in additional shares on the reinvestment date, and redemption at the net asset value calculated on the last business day of the fiscal period. Sales charges are not reflected in the total returns. Total returns are not annualized for periods less than one full year. Returns do not reflect the deduction of taxes that a shareholder would pay on fund distributions or the redemption of fund shares.
4. Annualized for periods less than one full year.
5. Total expenses including indirect expenses from affiliated fund were as follows:
| | | | | | | | |
| | Year Ended April 30, 2014 | | | 1.04% | | | |
| | Year Ended April 30, 2013 | | | 1.03% | | | |
| | Year Ended April 30, 2012 | | | 1.14% | | | |
| | Year Ended April 29, 2011 | | | 1.58% | | | |
| | Year Ended April 30, 2010 | | | 8.53% | | | |
See accompanying Notes to Financial Statement.
23 OPPENHEIMER GLOBAL VALUE FUND
| | | | |
| | NOTES TO FINANCIAL STATEMENTS April 30, 2014 | | |
| | | | |
1. Significant Accounting Policies
Oppenheimer Global Value Fund (the “Fund”) is registered under the Investment Company Act of 1940, as amended, as a diversified open-end management investment company. The Fund’s investment objective is to seek capital appreciation. The Fund’s investment adviser is OFI Global Asset Management, Inc. (“OFI Global” or the “Manager”), a wholly-owned subsidiary of OppenheimerFunds, Inc. (“OFI” or the “Sub-Adviser”). The Manager has entered into a sub-advisory agreement with OFI.
The Fund offers Class A, Class C, Class I, Class N and Class Y shares. Class A shares are sold at their offering price, which is normally net asset value plus a front-end sales charge. Class C and Class N shares are sold without a front-end sales charge but may be subject to a contingent deferred sales charge (“CDSC”). Class N shares are sold only through retirement plans. Retirement plans that offer Class N shares may impose charges on those accounts. Class I and Class Y shares are sold to certain institutional investors or intermediaries without either a front-end sales charge or a CDSC, however, the intermediaries may impose charges on their accountholders who beneficially own Class I and Class Y shares. All classes of shares have identical rights and voting privileges with respect to the Fund in general and exclusive voting rights on matters that affect that class alone. Earnings, net assets and net asset value per share may differ due to each class having its own expenses, such as transfer and shareholder servicing agent fees and shareholder communications, directly attributable to that class. Class A, C and N shares have separate distribution and/or service plans under which they pay fees. Class I and Class Y shares do not pay such fees.
The following is a summary of significant accounting policies consistently followed by the Fund.
Investment in Oppenheimer Institutional Money Market Fund. The Fund is permitted to invest daily available cash balances in an affiliated money market fund. The Fund may invest the available cash in Class E shares of Oppenheimer Institutional Money Market Fund (“IMMF”) to seek current income while preserving liquidity. IMMF is a registered open-end management investment company, regulated as a money market fund under the Investment Company Act of 1940, as amended. The Manager is the investment adviser of IMMF, and the Sub-Adviser provides investment and related advisory services to IMMF. When applicable, the Fund’s investment in IMMF is included in the Statement of Investments. Shares of IMMF are valued at their net asset value per share. As a shareholder, the Fund is subject to its proportional share of IMMF’s Class E expenses, including its management fee. The Manager will waive fees and/or reimburse Fund expenses in an amount equal to the indirect management fees incurred through the Fund’s investment in IMMF.
Foreign Currency Translation. The Fund’s accounting records are maintained in U.S. dollars. The values of securities denominated in foreign currencies and amounts related to the purchase and sale of foreign securities and foreign investment income are translated into U.S. dollars as of the close of the New York Stock Exchange (the “Exchange”), normally 4:00 P.M.
24 OPPENHEIMER GLOBAL VALUE FUND
| | | | |
| | | | |
| | 1. Significant Accounting Policies (Continued) | | |
Eastern time, on each day the Exchange is open for trading. Foreign exchange rates may be valued primarily using a reliable bank, dealer or service authorized by the Board of Trustees.
Reported net realized gains and losses from foreign currency transactions arise from sales of portfolio securities, sales and maturities of short-term securities, sales of foreign currencies, exchange rate fluctuations between the trade and settlement dates on securities transactions, and the difference between the amounts of dividends, interest, and foreign withholding taxes recorded on the Fund’s books and the U.S. dollar equivalent of the amounts actually received or paid. Net unrealized appreciation and depreciation on the translation of assets and liabilities denominated in foreign currencies arise from changes in the values of assets and liabilities, including investments in securities at fiscal period end, resulting from changes in exchange rates.
The effect of changes in foreign currency exchange rates on investments is separately identified from the fluctuations arising from changes in market values of securities held and reported with all other foreign currency gains and losses in the Fund’s Statement of Operations.
Allocation of Income, Expenses, Gains and Losses. Income, expenses (other than those attributable to a specific class), gains and losses are allocated on a daily basis to each class of shares based upon the relative proportion of net assets represented by such class. Operating expenses directly attributable to a specific class are charged against the operations of that class.
Federal Taxes. The Fund intends to comply with provisions of the Internal Revenue Code applicable to regulated investment companies and to distribute substantially all of its investment company taxable income, including any net realized gain on investments not offset by capital loss carryforwards, if any, to shareholders. Therefore, no federal income or excise tax provision is required. The Fund files income tax returns in U.S. federal and applicable state jurisdictions. The statute of limitations on the Fund’s tax return filings generally remain open for the three preceding fiscal reporting period ends.
The tax components of capital shown in the following table represent distribution requirements the Fund must satisfy under the income tax regulations, losses the Fund may be able to offset against income and gains realized in future years and unrealized appreciation or depreciation of securities and other investments for federal income tax purposes.
| | | | | | | | | | | | |
Undistributed Net Investment Income | | Undistributed
Long-Term
Gain | | | Accumulated Loss
Carryforward1,2 | | | Net Unrealized
Appreciation
Based on cost of
Securities and
Other Investments
for Federal Income
Tax Purposes | |
$2,565,876 | | | $6,307,808 | | | | $— | | | | $36,549,519 | |
25 OPPENHEIMER GLOBAL VALUE FUND
| | | | |
| | |
| | NOTES TO FINANCIAL STATEMENTS Continued | | |
| | | | |
| | 1. Significant Accounting Policies (Continued) | | |
1. During the fiscal year ended April 30, 2014, the Fund utilized $5,091,817 of capital loss carryforward to offset capital gains realized in that fiscal year.
2. During the fiscal year ended April 30, 2013, the Fund did not utilize any capital loss carryforward.
Net investment income (loss) and net realized gain (loss) may differ for financial statement and tax purposes. The character of dividends and distributions made during the fiscal year from net investment income or net realized gains may differ from their ultimate characterization for federal income tax purposes. Also, due to timing of dividends and distributions, the fiscal year in which amounts are distributed may differ from the fiscal year in which the income or net realized gain was recorded by the Fund.
Accordingly, the following amounts have been reclassified for April 30, 2014. Net assets of the Fund were unaffected by the reclassifications.
| | | | | | | | |
Increase to Paid-in Capital | | Reduction
to Accumulated
Net Investment
Loss | | | Reduction
to Accumulated Net
Realized Gain on
Investments3 | |
$1,270,027 | | | $1,620,249 | | | | $2,890,276 | |
3. $1,270,027, including $1,016,009 of long-term capital gain, was distributed in connection with Fund share redemptions.
The tax character of distributions paid during the years ended April 30, 2014 and April 30, 2013 was as follows:
| | | | | | | | |
| | | Year Ended April 30, 2014 | | | Year Ended
April 30, 2013 | |
Distributions paid from: | | | | | | | | |
Ordinary income | | $ | 517,626 | | | $ | — | |
The aggregate cost of securities and other investments and the composition of unrealized appreciation and depreciation of securities and other investments for federal income tax purposes as of April 30, 2014 are noted in the following table. The primary difference between book and tax appreciation or depreciation of securities and other investments, if applicable, is attributable to the tax deferral of losses or tax realization of financial statement unrealized gain or loss.
| | | | |
Federal tax cost of securities | | $ | 488,536,697 | |
| | | | |
Gross unrealized appreciation | | $ | 49,914,679 | |
Gross unrealized depreciation | | | (13,365,160) | |
| | | | |
Net unrealized appreciation | | $ | 36,549,519 | |
| | | | |
Certain foreign countries impose a tax on capital gains which is accrued by the Fund based on unrealized appreciation, if any, on affected securities. The tax is paid when the gain is realized.
26 OPPENHEIMER GLOBAL VALUE FUND
| | | | |
| | | | |
| | 1. Significant Accounting Policies (Continued) | | |
Trustees’ Compensation. The Board of Trustees has adopted a compensation deferral plan for independent trustees that enables trustees to elect to defer receipt of all or a portion of the annual compensation they are entitled to receive from the Fund. For purposes of determining the amount owed to the Trustee under the plan, deferred amounts are treated as though equal dollar amounts had been invested in shares of the Fund or in other Oppenheimer funds selected by the Trustee. The Fund purchases shares of the funds selected for deferral by the Trustee in amounts equal to his or her deemed investment, resulting in a Fund asset equal to the deferred compensation liability. Such assets are included as a component of “Other” within the asset section of the Statement of Assets and Liabilities. Deferral of trustees’ fees under the plan will not affect the net assets of the Fund, and will not materially affect the Fund’s assets, liabilities or net investment income per share. Amounts will be deferred until distributed in accordance with the compensation deferral plan.
Dividends and Distributions to Shareholders. Dividends and distributions to shareholders, which are determined in accordance with income tax regulations and may differ from U.S. generally accepted accounting principles, are recorded on the ex-dividend date. Income and capital gain distributions, if any, are declared and paid annually or at other times as deemed necessary by the Manager.
Investment Income. Dividend income is recorded on the ex-dividend date or upon ex-dividend notification in the case of certain foreign dividends where the ex-dividend date may have passed. Non-cash dividends included in dividend income, if any, are recorded at the fair market value of the securities received. Interest income is recognized on an accrual basis. Discount and premium, which are included in interest income on the Statement of Operations, are amortized or accreted daily.
Custodian Fees. “Custodian fees and expenses” in the Statement of Operations may include interest expense incurred by the Fund on any cash overdrafts of its custodian account during the period. Such cash overdrafts may result from the effects of failed trades in portfolio securities and from cash outflows resulting from unanticipated shareholder redemption activity. The Fund pays interest to its custodian on such cash overdrafts, to the extent they are not offset by positive cash balances maintained by the Fund, at a rate equal to the Federal Funds Rate plus 0.50%. The “Reduction to custodian expenses” line item, if applicable, represents earnings on cash balances maintained by the Fund during the period. Such interest expense and other custodian fees may be paid with these earnings.
Security Transactions. Security transactions are recorded on the trade date. Realized gains and losses on securities sold are determined on the basis of identified cost.
Indemnifications. The Fund’s organizational documents provide current and former trustees and officers with a limited indemnification against liabilities arising in connection with the performance of their duties to the Fund. In the normal course of business, the Fund may also
27 OPPENHEIMER GLOBAL VALUE FUND
| | | | |
| | NOTES TO FINANCIAL STATEMENTS Continued | | |
| | | | |
| | 1. Significant Accounting Policies (Continued) | | |
enter into contracts that provide general indemnifications. The Fund’s maximum exposure under these arrangements is unknown as this would be dependent on future claims that may be made against the Fund. The risk of material loss from such claims is considered remote.
Other. The preparation of financial statements in conformity with accounting principles generally accepted in the United States of America requires management to make estimates and assumptions that affect the reported amounts of assets and liabilities and disclosure of contingent assets and liabilities at the date of the financial statements and the reported amounts of increases and decreases in net assets from operations during the reporting period. Actual results could differ from those estimates.
2. Securities Valuation
The Fund calculates the net asset value of its shares as of the close of the New York Stock Exchange (the “Exchange”), normally 4:00 P.M. Eastern time, on each day the Exchange is open for trading.
The Fund’s Board has adopted procedures for the valuation of the Fund’s securities and has delegated the day-to-day responsibility for valuation determinations under those procedures to the Manager. The Manager has established a Valuation Committee which is responsible for determining a “fair valuation” for any security for which market quotations are not “readily available.” The Valuation Committee’s fair valuation determinations are subject to review, approval and ratification by the Fund’s Board at its next regularly scheduled meeting covering the calendar quarter in which the fair valuation was determined.
Valuation Methods and Inputs
Securities are valued using unadjusted quoted market prices, when available, as supplied primarily by third party pricing services or dealers.
The following methodologies are used to determine the market value or the fair value of the types of securities described below:
Securities traded on a registered U.S. securities exchange (including exchange-traded derivatives other than futures and futures options) are valued based on the last sale price of the security reported on the principal exchange on which it is traded, prior to the time when the Fund’s assets are valued. In the absence of a sale, the security is valued at the last sale price on the prior trading day, if it is within the spread of the current day’s closing “bid” and “asked” prices, and if not, at the current day’s closing bid price. A security of a foreign issuer traded on a foreign exchange, but not listed on a registered U.S. securities exchange, is valued based on the last sale price on the principal exchange on which the security is traded, as identified by the third party pricing service used by the Manager, prior to the time when the Fund’s assets are valued. If the last sale price is unavailable, the security is valued at the most recent official closing price on the principal exchange on which it is traded. If the last sales price or official closing price for a foreign security is not available, the security is valued at the mean between the bid and asked price per the exchange or, if not available from the exchange, obtained from two dealers. If bid and asked prices are not available from either the
28 OPPENHEIMER GLOBAL VALUE FUND
| | | | |
| | | | |
| | 2. Securities Valuation (Continued) | | |
exchange or two dealers, the security is valued by using one of the following methodologies (listed in order of priority): (1) using a bid from the exchange, (2) the mean between the bid and asked price as provided by a single dealer, or (3) a bid from a single dealer.
Shares of a registered investment company that are not traded on an exchange are valued at that investment company’s net asset value per share.
Corporate and government debt securities (of U.S. or foreign issuers) and municipal debt securities, event-linked bonds, loans, mortgage-backed securities, collateralized mortgage obligations, and asset-backed securities are valued at the mean between the “bid” and “asked” prices utilizing evaluated prices obtained from third party pricing services or broker-dealers who may use matrix pricing methods to determine the evaluated prices.
Short-term money market type debt securities with a remaining maturity of sixty days or less are valued at cost adjusted by the amortization of discount or premium to maturity (amortized cost), which approximates market value. Short-term debt securities with a remaining maturity in excess of sixty days are valued at the mean between the “bid” and “asked” prices utilizing evaluated prices obtained from third party pricing services or broker-dealers.
A description of the standard inputs that may generally be considered by the third party pricing vendors in determining their evaluated prices is provided below.
| | |
| Security Type | | Standard inputs generally considered by third-party pricing vendors |
| Corporate debt, government debt, municipal, mortgage-backed and asset-backed securities | | Reported trade data, broker-dealer price quotations, benchmark yields, issuer spreads on comparable securities, the credit quality, yield, maturity, and other appropriate factors. |
| Loans | | Information obtained from market participants regarding reported trade data and broker-dealer price quotations. |
| Event-linked bonds | | Information obtained from market participants regarding reported trade data and broker-dealer price quotations. |
If a market value or price cannot be determined for a security using the methodologies described above, or if, in the “good faith” opinion of the Manager, the market value or price obtained does not constitute a “readily available market quotation,” or a significant event has occurred that would materially affect the value of the security the security is fair valued either (i) by a standardized fair valuation methodology applicable to the security type or the significant event as previously approved by the Valuation Committee and the Fund’s Board or (ii) as determined in good faith by the Manager’s Valuation Committee. The Valuation Committee considers all relevant facts that are reasonably available, through either public information or information available to the Manager, when determining the fair value of a security. Fair value determinations by the Manager are subject to review, approval and ratification by the Fund’s Board at its next regularly scheduled meeting covering the calendar quarter in which the fair valuation was determined. Those fair valuation standardized methodologies include, but are not limited to, valuing securities at the last sale price or initially at cost and subsequently adjusting the value based on: changes in company specific fundamentals, changes in an appropriate securities index, or changes in the value of similar
29 OPPENHEIMER GLOBAL VALUE FUND
| | | | |
| | |
| | NOTES TO FINANCIAL STATEMENTS Continued | | |
| | | | |
| | 2. Securities Valuation (Continued) | | |
securities which may be further adjusted for any discounts related to security-specific resale restrictions. When possible, such methodologies use observable market inputs such as unadjusted quoted prices of similar securities, observable interest rates, currency rates and yield curves. The methodologies used for valuing securities are not necessarily an indication of the risks associated with investing in those securities nor can it be assured that the Fund can obtain the fair value assigned to a security if it were to sell the security.
To assess the continuing appropriateness of security valuations, the Manager, or its third party service provider who is subject to oversight by the Manager, regularly compares prior day prices, prices on comparable securities, and sale prices to the current day prices and challenges those prices exceeding certain tolerance levels with the third party pricing service or broker source. For those securities valued by fair valuations, whether through a standardized fair valuation methodology or a fair valuation determination, the Valuation Committee reviews and affirms the reasonableness of the valuations based on such methodologies and fair valuation determinations on a regular basis after considering all relevant information that is reasonably available.
Classifications
Each investment asset or liability of the Fund is assigned a level at measurement date based on the significance and source of the inputs to its valuation. Various data inputs are used in determining the value of each of the Fund’s investments as of the reporting period end. These data inputs are categorized in the following hierarchy under applicable financial accounting standards:
1) Level 1-unadjusted quoted prices in active markets for identical assets or liabilities (including securities actively traded on a securities exchange)
2) Level 2-inputs other than unadjusted quoted prices that are observable for the asset or liability (such as unadjusted quoted prices for similar assets and market corroborated inputs such as interest rates, prepayment speeds, credit risks, etc.)
3) Level 3-significant unobservable inputs (including the Manager’s own judgments about assumptions that market participants would use in pricing the asset or liability).
The inputs used for valuing securities are not necessarily an indication of the risks associated with investing in those securities.
The table below categorizes amounts that are included in the Fund’s Statement of Assets and Liabilities as of April 30, 2014 based on valuation input level:
| | | | | | | | | | | | | | | | |
| | | Level 1—
Unadjusted
Quoted Prices | | | Level 2— Other Significant
Observable Inputs | | | Level 3—
Significant
Unobservable
Inputs | | | Value | |
Assets Table | | | | | | | | | | | | | | | | |
Investments, at Value: | | | | | | | | | | | | | | | | |
Common Stocks | | | | | | | | | | | | | | | | |
Consumer Discretionary | | $ | 121,843,373 | | | $ | 61,344,066 | | | $ | — | | | $ | 183,187,439 | |
Consumer Staples | | | 4,795,675 | | | | 32,788,249 | | | | — | | | | 37,583,924 | |
Energy | | | — | | | | 5,982,466 | | | | — | | | | 5,982,466 | |
Financials | | | 56,887,525 | | | | 54,973,097 | | | | — | | | | 111,860,622 | |
30 OPPENHEIMER GLOBAL VALUE FUND
| | | | |
| | | | |
| | 2. Securities Valuation (Continued) | | |
| | | | | | | | | | | | | | | | |
| | | Level 1—
Unadjusted
Quoted Prices | | | Level 2— Other Significant
Observable Inputs | | | Level 3—
Significant
Unobservable
Inputs | | | Value | |
Investments, at Value: (Continued) | | | | | | | | | | | | | | | | |
Health Care | | $ | 4,510,248 | | | $ | — | | | $ | — | | | $ | 4,510,248 | |
Industrials | | | 6,556,693 | | | | 1,909,120 | | | | — | | | | 8,465,813 | |
Information Technology | | | 72,735,548 | | | | 28,353,789 | | | | — | | | | 101,089,337 | |
Materials | | | 8,575,929 | | | | 19,881,109 | | | | — | | | | 28,457,038 | |
Telecommunication Services | | | 10,341,173 | | | | 22,237,765 | | | | — | | | | 32,578,938 | |
Utilities | | | 8,817,654 | | | | — | | | | — | | | | 8,817,654 | |
Preferred Stock | | | 433,992 | | | | — | | | | — | | | | 433,992 | |
Investment Company | | | 2,827,177 | | | | — | | | | — | | | | 2,827,177 | |
Total Assets | | $ | 298,324,987 | | | $ | 227,469,661 | | | $ | — | | | $ | 525,794,648 | |
Currency contracts and forwards, if any, are reported at their unrealized appreciation/ depreciation at measurement date, which represents the change in the contract’s value from trade date. Futures, if any, are reported at their variation margin at measurement date, which represents the amount due to/from the Fund at that date. All additional assets and liabilities included in the above table are reported at their market value at measurement date.
The table below shows the transfers between Level 1 and Level 2. The Fund’s policy is to recognize transfers in and transfers out as of the beginning of the reporting period.
| | | | | | | | |
| | | Transfers out of Level 1* | | | Transfers into Level 2* | |
Assets Table | | | | | | | | |
Investments, at Value: | | | | | | | | |
Commons Stocks | | | | | | | | |
Consumer Discretionary | | $ | (6,131,384 | ) | | $ | 6,131,384 | |
Consumer Staples | | | (8,832,482 | ) | | | 8,832,482 | |
Financials | | | (4,582,246 | ) | | | 4,582,246 | |
Information Technology | | | (6,705,800 | ) | | | 6,705,800 | |
Materials | | | (1,671,754 | ) | | | 1,671,754 | |
Telecommunication Services | | | (3,961,753 | ) | | | 3,961,753 | |
Total Assets | | $ | (31,885,419 | ) | | $ | 31,885,419 | |
* Transferred from Level 1 to Level 2 due to the absence of a readily available unadjusted quoted market price.
3. Shares of Beneficial Interest
The Fund has authorized an unlimited number of $0.001 par value shares of beneficial interest of each class. Transactions in shares of beneficial interest were as follows:
31 OPPENHEIMER GLOBAL VALUE FUND
| | | | |
| | NOTES TO FINANCIAL STATEMENTS Continued | | |
| | | | |
| | 3. Shares of Beneficial Interest (Continued) | | |
| | | | | | | | | | | | | | | | |
| | | Year Ended April 30, 2014 | | | Year Ended April 30, 20131 | |
| | | Shares | | | Amount | | | Shares | | | Amount | |
Class A | | | | | | | | | | | | | | | | |
Sold | | | 5,976,293 | | | $ | 248,157,743 | | | | 1,836,214 | | | $ | 57,305,873 | |
Dividends and/or distributions reinvested | | | 6,726 | | | | 286,579 | | | | — | | | | — | |
Redeemed | | | (1,475,111 | ) | | | (62,072,972 | ) | | | (1,083,188 | ) | | | (31,894,687) | |
| | | | |
Net increase | | | 4,507,908 | | | $ | 186,371,350 | | | | 753,026 | | | $ | 25,411,186 | |
| | | | |
|
| |
Class C | | | | | | | | | | | | | | | | |
Sold | | | 2,026,783 | | | $ | 82,471,856 | | | | 305,822 | | | $ | 9,423,019 | |
Dividends and/or distributions reinvested | | | — | | | | — | | | | — | | | | — | |
Redeemed | | | (237,027 | ) | | | (9,617,066 | ) | | | (101,107 | ) | | | (3,007,878) | |
| | | | |
Net increase | | | 1,789,756 | | | $ | 72,854,790 | | | | 204,715 | | | $ | 6,415,141 | |
| | | | |
|
| |
Class I | | | | | | | | | | | | | | | | |
Sold | | | 237,862 | | | $ | 9,866,409 | | | | 181,429 | | | $ | 5,971,550 | |
Dividends and/or distributions reinvested | | | 931 | | | | 40,008 | | | | — | | | | — | |
Redeemed | | | (78,498 | ) | | | (3,229,944 | ) | | | (3,486 | ) | | | (119,237) | |
| | | | |
Net increase | | | 160,295 | | | $ | 6,676,473 | | | | 177,943 | | | $ | 5,852,313 | |
| | | | |
|
| |
Class N | | | | | | | | | | | | | | | | |
Sold | | | 108,588 | | | $ | 4,466,418 | | | | 19,804 | | | $ | 615,904 | |
Dividends and/or distributions reinvested | | | — | | | | — | | | | — | | | | — | |
Redeemed | | | (21,675 | ) | | | (898,076 | ) | | | (19,628 | ) | | | (578,177) | |
| | | | |
Net increase | | | 86,913 | | | $ | 3,568,342 | | | | 176 | | | $ | 37,727 | |
| | | | |
|
| |
Class Y | | | | | | | | | | | | | | | | |
Sold | | | 2,528,615 | | | $ | 108,432,984 | | | | 478,641 | | | $ | 15,019,415 | |
Dividends and/or distributions reinvested | | | 4,216 | | | | 180,911 | | | | — | | | | — | |
Redeemed | | | (488,326 | ) | | | (20,639,866 | ) | | | (283,730 | ) | | | (8,717,819) | |
| | | | |
Net increase | | | 2,044,505 | | | $ | 87,974,029 | | | | 194,911 | | | $ | 6,301,596 | |
| | | | |
1. For the year ended April 30, 2013 for Class A, Class C, Class N and Class Y shares, and for the period from August 28, 2012 (inception of offering) to April 30, 2013 for Class I shares.
4. Purchases and Sales of Securities
The aggregate cost of purchases and proceeds from sales of securities, other than short-term obligations and investments in IMMF, for the year ended April 30, 2014 were as follows:
| | | | | | | | |
| | | Purchases | | | Sales | |
Investment securities | | | $545,893,751 | | | | $195,437,264 | |
32 OPPENHEIMER GLOBAL VALUE FUND
5. Fees and Other Transactions with Affiliates
Management Fees. Under the investment advisory agreement, the Fund pays the Manager a management fee based on the daily net assets of the Fund at an annual rate of 0.80%.
Sub-Adviser Fees. The Manager has retained the Sub-Adviser to provide the day-to-day portfolio management of the Fund. Under the Sub-Advisory Agreement, the Manager pays the Sub-Adviser an annual fee in monthly installments, equal to a percentage of the investment management fee collected by the Manager from the Fund, which shall be calculated after any investment management fee waivers. The fee paid to the Sub-Adviser is paid by the Manager, not by the Fund.
Transfer Agent Fees. OFI Global (the “Transfer Agent”) serves as the transfer and shareholder servicing agent for the Fund. The Fund pays the Transfer Agent a fee based on annual net assets. Fees incurred by the Fund with respect to these services are detailed in the Statement of Operations.
Sub-Transfer Agent Fees. The Transfer Agent has retained Shareholder Services, Inc., a wholly-owned subsidiary of OFI (the “Sub-Transfer Agent”), to provide the day-to-day transfer agent and shareholder servicing of the Fund. Under the Sub-Transfer Agency Agreement, the Transfer Agent pays the Sub-Transfer Agent an annual fee in monthly installments, equal to a percentage of the transfer agent fee collected by the Transfer Agent from the Fund, which shall be calculated after any applicable fee waivers. The fee paid to the Sub-Transfer Agent is paid by the Transfer Agent, not by the Fund.
Distribution and Service Plan (12b-1) Fees. Under its General Distributor’s Agreement with the Fund, OppenheimerFunds Distributor, Inc. (the “Distributor”) acts as the Fund’s principal underwriter in the continuous public offering of the Fund’s classes of shares.
Service Plan for Class A Shares. The Fund has adopted a Service Plan (the “Plan”) for Class A shares under Rule 12b-1 of the Investment Company Act of 1940. Under the Plan, the Fund reimburses the Distributor for a portion of its costs incurred for services provided to accounts that hold Class A shares. Reimbursement is made periodically at an annual rate of up to 0.25% of the daily net assets of Class A shares of the Fund. The Distributor currently uses all of those fees to pay dealers, brokers, banks and other financial institutions periodically for providing personal service and maintenance of accounts of their customers that hold Class A shares. Any unreimbursed expenses the Distributor incurs with respect to Class A shares in any fiscal year cannot be recovered in subsequent periods. Fees incurred by the Fund under the Plan are detailed in the Statement of Operations.
Distribution and Service Plans for Class C and Class N Shares. The Fund has adopted Distribution and Service Plans (the “Plans”) for Class C and Class N shares under Rule 12b-1 of the Investment Company Act of 1940 to compensate the Distributor for its services in connection with the distribution of those shares and servicing accounts. Under the Plans, the Fund pays the Distributor an annual asset-based sales charge of 0.75% on Class C shares
33 OPPENHEIMER GLOBAL VALUE FUND
| | | | |
| | NOTES TO FINANCIAL STATEMENTS Continued | | |
| | | | |
| | 5. Fees and Other Transactions with Affiliates (Continued) | | |
daily net assets and 0.25% on Class N shares daily net assets. The Distributor also receives a service fee of 0.25% per year under each plan. If either the Class C or Class N plan is terminated by the Fund or by the shareholders of a class, the Board of Trustees and its independent trustees must determine whether the Distributor shall be entitled to payment from the Fund of all or a portion of the service fee and/or asset-based sales charge in respect to shares sold prior to the effective date of such termination. Fees incurred by the Fund under the Plans are detailed in the Statement of Operations. The Distributor determines its uncompensated expenses under the Plans at calendar quarter ends. The Distributor’s aggregate uncompensated expenses under the Plans at March 31, 2014 were as follows:
| | | | |
Class C | | $ | 611,080 | |
Class N | | | 26,034 | |
Sales Charges. Front-end sales charges and contingent deferred sales charges (“CDSC”) do not represent expenses of the Fund. They are deducted from the proceeds of sales of Fund shares prior to investment or from redemption proceeds prior to remittance, as applicable. The sales charges retained by the Distributor from the sale of shares and the CDSC retained by the Distributor on the redemption of shares is shown in the following table for the period indicated.
| | | | | | | | | | | | | | | | | | |
| Year Ended | | Class A Front-End
Sales Charges
Retained by
Distributor | | | Class A
Contingent
Deferred Sales
Charges
Retained by
Distributor | | | Class C
Contingent
Deferred Sales
Charges
Retained by
Distributor | | | Class N
Contingent
Deferred Sales
Charges
Retained by
Distributor | | | |
April 30, 2014 | | | $313,924 | | | | $1,786 | | | | $8,955 | | | | $438 | | |
Waivers and Reimbursements of Expenses. The Manager has contractually agreed to waive fees and/or reimburse certain expenses so that “Expenses after payments, waivers and/or reimbursements and reduction to custodian expenses”, excluding expenses incurred directly or indirectly by the Fund as a result of investments in other investment companies, wholly-owned subsidiaries and pooled investment vehicles; will not exceed 1.40% for Class A shares, 2.15% for Class C shares, 0.90% for Class I shares, 1.65% for Class N shares and 1.05% for Class Y shares. During the year ended April 30, 2014, the Manager waived $57, $107, $192 and $42 for Class A, Class C, Class N and Class Y shares, respectively.
The Manager will waive fees and/or reimburse Fund expenses in an amount equal to the indirect management fees incurred through the Fund’s investment in IMMF. During the year ended April 30, 2014, the Manager waived fees and/or reimbursed the Fund $4,377 for IMMF management fees.
The Transfer Agent has contractually agreed to limit transfer and shareholder servicing agent fees for Classes C, N and Y shares to 0.35% of average annual net assets per class and for Class A shares to 0.30% of average annual net assets of the class.
Some of these undertakings may be modified or terminated at any time; some may not be modified or terminated until after one year from the date of the current prospectus, as indicated therein.
34 OPPENHEIMER GLOBAL VALUE FUND
6. Pending Litigation
Since 2009, seven class action lawsuits have been pending in the U.S. District Court for the District of Colorado against OppenheimerFunds, Inc. (“OFI”), OppenheimerFunds Distributor, Inc., the Fund’s principal underwriter and distributor (the “Distributor”), and certain funds (but not including the Fund) advised by OFI Global Asset Management, Inc. and distributed by the Distributor (the “Defendant Funds”). The lawsuits also name as defendants certain officers and current and former trustees of the respective Defendant Funds. The lawsuits raise claims under federal securities law and allege, among other things, that the disclosure documents of the respective Defendant Funds contained misrepresentations and omissions and that the respective Defendant Funds’ investment policies were not followed. The plaintiffs in these actions seek unspecified damages, equitable relief and awards of attorneys’ fees and litigation expenses. The Defendant Funds’ Boards of Trustees have also engaged counsel to represent the Funds and the present and former Independent Trustees named in those suits. On March 5, 2014, the parties in six of these lawsuits executed stipulations and agreements of settlement resolving those actions. The settlements are subject to a variety of contingencies, including approval by the court. The settlements do not resolve a seventh outstanding lawsuit relating to Oppenheimer Rochester California Municipal Fund.
Other class action and individual lawsuits have been filed since 2008 in various state and federal courts against OFI and certain of its affiliates by investors seeking to recover investments they allegedly lost as a result of the “Ponzi” scheme run by Bernard L. Madoff and his firm, Bernard L. Madoff Investment Securities, LLC (“BLMIS”). Plaintiffs in these suits allege that they suffered losses as a result of their investments in several funds managed by an affiliate of OFI and assert a variety of claims, including breach of fiduciary duty, fraud, negligent misrepresentation, unjust enrichment, and violation of federal and state securities laws and regulations, among others. They seek unspecified damages, equitable relief and awards of attorneys’ fees and litigation expenses. Neither the Distributor, nor any of the Oppenheimer mutual funds, their independent trustees or directors are named as defendants in these lawsuits. None of the Oppenheimer mutual funds invested in any funds or accounts managed by Madoff or BLMIS. On February 28, 2011, a stipulation of partial settlement of three groups of consolidated putative class action lawsuits relating to these matters was filed in the U.S. District Court for the Southern District of New York. On August 19, 2011, the court entered an order and final judgment approving the settlement as fair, reasonable and adequate. In September 2011, certain parties filed notices of appeal from the court’s order approving the settlement. The settlement does not resolve other outstanding lawsuits against OFI and its affiliates relating to BLMIS.
OFI believes the lawsuits and appeals described above are without legal merit and, with the exception of actions it has settled, is defending against them vigorously. While it is premature to render any opinion as to the outcome in these lawsuits, or whether any costs that the Defendant Funds may bear in defending the suits might not be reimbursed by insurance, OFI believes that these suits should not impair the ability of OFI or the Distributor to perform their respective duties to the Fund, and that the outcome of all of the suits together should not have any material effect on the operations of any of the Oppenheimer mutual funds.
35 OPPENHEIMER GLOBAL VALUE FUND
| | | | |
| | REPORT OF INDEPENDENT REGISTERED PUBLIC ACCOUNTING FIRM | | |
| | | | |
The Board of Trustees and Shareholders of Oppenheimer Global Value Fund:
We have audited the accompanying statement of assets and liabilities of Oppenheimer Global Value Fund, including the statement of investments, as of April 30, 2014, and the related statement of operations for the year then ended, the statements of changes in net assets for each of the years in the two-year period then ended, and the financial highlights for each of the years or periods in the five-year period then ended. These financial statements and financial highlights are the responsibility of the Fund’s management. Our responsibility is to express an opinion on these financial statements and financial highlights based on our audits.
We conducted our audits in accordance with the standards of the Public Company Accounting Oversight Board (United States). Those standards require that we plan and perform the audit to obtain reasonable assurance about whether the financial statements and financial highlights are free of material misstatement. An audit includes examining, on a test basis, evidence supporting the amounts and disclosures in the financial statements. Our procedures included confirmation of securities owned as of April 30, 2014, by correspondence with the custodian, transfer agent and brokers, or by other appropriate auditing procedures where replies from brokers were not received. An audit also includes assessing the accounting principles used and significant estimates made by management, as well as evaluating the overall financial statement presentation. We believe that our audits provide a reasonable basis for our opinion.
In our opinion, the financial statements and financial highlights referred to above present fairly, in all material respects, the financial position of Oppenheimer Global Value Fund as of April 30, 2014, the results of its operations for the year then ended, the changes in its net assets for each of the years in the two-year period then ended, and the financial highlights for each of the years or periods in the five-year period then ended, in conformity with U.S. generally accepted accounting principles.
KPMG LLP
Denver, Colorado
June 11, 2014
36 OPPENHEIMER GLOBAL VALUE FUND
| | | | |
| | FEDERAL INCOME TAX INFORMATION Unaudited | | |
| | | | |
In early 2014, if applicable, shareholders of record received information regarding all dividends and distributions paid to them by the Fund during calendar year 2013.
Dividends, if any, paid by the Fund during the fiscal year ended April 30, 2014 which are not designated as capital gain distributions should be multiplied by the maximum amount allowable but not less than 41.47% to arrive at the amount eligible for the corporate dividend-received deduction.
A portion, if any, of the dividends paid by the Fund during the fiscal year ended April 30, 2014 which are not designated as capital gain distributions are eligible for lower individual income tax rates to the extent that the Fund has received qualified dividend income as stipulated by recent tax legislation. The maximum amount allowable but not less than $2,913,037 of the Fund’s fiscal year taxable income may be eligible for the lower individual income tax rates. In early 2014, shareholders of record received information regarding the percentage of distributions that are eligible for lower individual income tax rates.
The foregoing information is presented to assist shareholders in reporting distributions received from the Fund to the Internal Revenue Service. Because of the complexity of the federal regulations which may affect your individual tax return and the many variations in state and local tax regulations, we recommend that you consult your tax advisor for specific guidance.
37 OPPENHEIMER GLOBAL VALUE FUND
| | | | |
| | PORTFOLIO PROXY VOTING POLICIESAND PROCEDURES; UPDATES TO STATEMENTS OF INVESTMENTS Unaudited | | |
| | | | |
The Fund has adopted Portfolio Proxy Voting Policies and Procedures under which the Fund votes proxies relating to securities (“portfolio proxies”) held by the Fund. A description of the Fund’s Portfolio Proxy Voting Policies and Procedures is available (i) without charge, upon request, by calling the Fund toll-free at 1.800.CALL OPP (225.5677), (ii) on the Fund’s website at oppenheimerfunds.com, and (iii) on the SEC’s website at www.sec.gov. In addition, the Fund is required to file Form N-PX, with its complete proxy voting record for the 12 months ended June 30th, no later than August 31st of each year. The Fund’s voting record is available (i) without charge, upon request, by calling the Fund toll-free at 1.800.CALL OPP (225.5677), and (ii) in the Form N-PX filing on the SEC’s website at www.sec.gov.
The Fund files its complete schedule of portfolio holdings with the SEC for the first quarter and the third quarter of each fiscal year on Form N-Q. The Fund’s Form N-Q filings are available on the SEC’s website at www.sec.gov. Those forms may be reviewed and copied at the SEC’s Public Reference Room in Washington, D.C. Information on the operation of the Public Reference Room may be obtained by calling 1-800-SEC-0330.
Householding—Delivery of Shareholder Documents
This is to inform you about OppenheimerFunds’ “householding” policy. If more than one member of your household maintains an account in a particular fund, OppenheimerFunds will mail only one copy of the fund’s prospectus (or, if available, the fund’s summary prospectus), annual and semiannual report and privacy policy. The consolidation of these mailings, called householding, benefits your fund through reduced mailing expense, and benefits you by reducing the volume of mail you receive from OppenheimerFunds. Householding does not affect the delivery of your account statements.
Please note that we will continue to household these mailings for as long as you remain an OppenheimerFunds shareholder, unless you request otherwise. If you prefer to receive multiple copies of these materials, please call us at 1.800.CALL-OPP (225-5677). You may also notify us in writing or via email. We will begin sending you individual copies of the prospectus (or, if available, the summary prospectus), reports and privacy policy within 30 days of receiving your request to stop householding.
38 OPPENHEIMER GLOBAL VALUE FUND
| | | | |
| | |
| | TRUSTEES AND OFFICERS Unaudited | | |
| | |
Name, Position(s) Held with the Fund, Length of Service, Year of
Birth | | Principal Occupation(s) During the Past 5 Years; Other Trusteeships/Directorships Held; Number of
Portfolios in the Fund Complex Currently Overseen |
| |
INDEPENDENT TRUSTEES | | The address of each Trustee in the chart below is 6803 S. Tucson Way, Centennial, Colorado 80112-3924. Each Trustee serves for an indefinite term, or until his or her resignation, retirement, death or removal. |
| |
Brian F. Wruble, Chairman of the Board of
Trustees and Trustee (since 2007) Year of Birth: 1943 | | Director of Community Foundation of the Florida Keys (non-profit) (since July 2012); Chairman Emeritus and Non-Voting Trustee of The Jackson Laboratory (non-profit) (since August 2011); Director of Special Value Opportunities Fund, LLC (registered investment company) (affiliate of the Sub-Adviser’s parent company) (since September 2004); Member of Zurich Insurance Advisory Council (insurance) (since 2004); Treasurer (since 2007) and Trustee of the Institute for Advanced Study (non-profit educational institute) (since May 1992); Chairman (August 2007-August 2011) and Trustee (since August 1991) of the Board of Trustees of The Jackson Laboratory (non-profit); General Partner of Odyssey Partners, L.P. (hedge fund) (September 1995-December 2007); Special Limited Partner of Odyssey Investment Partners, LLC (private equity investment) (January 1999-September 2004). Oversees 52 portfolios in the OppenheimerFunds complex. Mr. Wruble has served on the Boards of certain Oppenheimer funds since April 2001, during which time he has become familiar with the Fund’s (and other Oppenheimer funds’) financial, accounting, regulatory and investment matters and has contributed to the Boards’ deliberations. |
| |
David K. Downes, Trustee (since 2007) Year of Birth: 1940 | | Director of THL Credit Inc. (since June 2009); Trustee of Employee Trusts (since January 2006); Chief Executive Officer and Board Member of Community Capital Management (investment management company) (since January 2004); President of The Community Reinvestment Act Qualified Investment Fund (investment management company) (since 2004); Director of Internet Capital Group (information technology company) (since October 2003); formerly, Independent Chairman GSK Employee Benefit Trust (April 2006- June 2013); Director of Correctnet (January 2006-2007); Independent Chairman of the Board of Trustees of Quaker Investment Trust (registered investment company) (2004-2007); Chief Operating Officer and Chief Financial Officer of Lincoln National Investment Companies, Inc. (subsidiary of Lincoln National Corporation, a publicly traded company) and Delaware Investments U.S., Inc. (investment management subsidiary of Lincoln National Corporation) (1993-2003); President, Chief Executive Officer and Trustee of Delaware Investment Family of Funds (1993-2003); President and Board Member of Lincoln National Convertible Securities Funds, Inc. and the Lincoln National Income Funds, TDC (1993-2003); Chairman and Chief Executive Officer of Retirement Financial Services, Inc. (registered transfer agent and investment adviser and subsidiary of Delaware Investments U.S., Inc.) (1993-2003); President and Chief Executive Officer of Delaware Service Company, Inc. (1995-2003); Chief Administrative Officer, Chief Financial Officer, Vice Chairman and Director of Equitable Capital Management Corporation (investment subsidiary of Equitable Life Assurance Society) (1985-1992); Corporate Controller of Merrill Lynch Company (financial services holding company) (1977-1985); held the following positions at the Colonial Penn Group, Inc. (insurance company): Corporate Budget Director (1974-1977), Assistant Treasurer (1972-1974) and Director of Corporate Taxes (1969-1972); held the following positions at Price |
39 OPPENHEIMER GLOBAL VALUE FUND
| | | | |
| | |
| | TRUSTEES AND OFFICERS Unaudited / Continued | | |
| | |
| |
David K. Downes, Continued | | Waterhouse Company (financial services firm): Tax Manager (1967-1969), Tax Senior (1965-1967) and Staff Accountant (1963-1965); United States Marine Corps (1957-1959). Oversees 52 portfolios in the OppenheimerFunds complex. Mr. Downes has served on the Boards of certain Oppenheimer funds since December 2005, during which time he has become familiar with the Fund’s (and other Oppenheimer funds’) financial, accounting, regulatory and investment matters and has contributed to the Boards’ deliberations. |
| |
Matthew P. Fink, Trustee (since 2007) Year of Birth: 1941 | | Trustee of the Committee for Economic Development (policy research foundation) (2005-2011); Director of ICI Education Foundation (education foundation) (October 1991-August 2006); President of the Investment Company Institute (trade association) (October 1991-June 2004); Director of ICI Mutual Insurance Company (insurance company) (October 1991-June 2004); Author of The Rise of Mutual Funds: An Insider’s View published by Oxford University Press (second edition 2010). Oversees 52 portfolios in the OppenheimerFunds complex. Mr. Fink has served on the Boards of certain Oppenheimer funds since January 2005, during which time he has become familiar with the Fund’s (and other Oppenheimer funds’) financial, accounting, regulatory and investment matters and has contributed to the Boards’ deliberations. |
| |
Edmund P. Giambastiani, Jr., Trustee (since 2013) Year of Birth: 1948 | | Advisory Board Member of the Maxwell School of Citizenship and Public Affairs of Syracuse University (since April 2012); Director of Mercury Defense Systems Inc. (information technology) (August 2011-February 2013); Trustee of the U.S. Naval Academy Foundation (since November 2010); Advisory Board Member of the Massachusetts Institute of Technology Lincoln Laboratory (federally-funded research development center) (since May 2010); Director of The Boeing Company (aerospace and defense) (since October 2009); Trustee of MITRE Corporation (federally-funded research development center) (since September 2008); Independent Director of QinetiQ Group Plc (defense technology and security) (February 2008-August 2011); Director of Monster Worldwide, Inc. (on-line career services) (since January 2008, Lead Director since June 2011); Chairman of Alenia North America, Inc. (military and defense products) (January 2008-October 2009); Director of SRA International, Inc. (information technology and services) (January 2008-July 2011); President of Giambastiani Group LLC (national security and energy consulting) (since October 2007); United States Navy, career nuclear submarine officer (June 1970-October 2007), Vice Chairman of the Joint Chiefs of Staff (2005-October 2007), NATO Supreme Allied Commander Transformation (2003-2005), Commander, U.S. Joint Forces Command (2002-2005). Since his retirement from the U.S. Navy in October 2007, Admiral Giambastiani has also served on numerous U.S. Government advisory boards, investigations and task forces for the Secretaries of Defense, State and Interior and the Central Intelligence Agency. Oversees 52 portfolios in the OppenheimerFunds complex. Admiral Giambastiani has served on the Boards of certain Oppenheimer funds since February 2013, including as an Advisory Board Member for certain Oppenheimer funds, during which time he has become familiar with the Fund’s (and other Oppenheimer funds’) financial, accounting, regulatory and investment matters and has contributed to the Boards’ deliberations. For purposes of this report, Admiral Giambastiani is identified as a Trustee. |
40 OPPENHEIMER GLOBAL VALUE FUND
| | |
| |
Mary F. Miller, Trustee (since 2007) Year of Birth: 1942 | | Trustee of International House (not-for-profit) (since June 2007); Trustee of the American Symphony Orchestra (not-for-profit) (October 1998-November 2011); and Senior Vice President and General Auditor of American Express Company (financial services company) (July 1998-February 2003). Oversees 52 portfolios in the OppenheimerFunds complex. Ms. Miller has served on the Boards of certain Oppenheimer funds since August 2004, during which time she has become familiar with the Fund’s (and other Oppenheimer funds’) financial, accounting, regulatory and investment matters and has contributed to the Boards’ deliberations. |
| |
Joel W. Motley, Trustee (since 2007) Year of Birth: 1952 | | Member of the Vestry of Trinity Wall Street (since April 2012); Director of Southern Africa Legal Services Foundation (since March 2012); Board Member of Pulitzer Center for Crisis Reporting (non-profit journalism) (since December 2010); Managing Director of Public Capital Advisors, LLC (privately-held financial advisor) (since January 2006); Managing Director of Carmona Motley, Inc. (privately-held financial advisor) (since January 2002); Director of Columbia Equity Financial Corp. (privately-held financial advisor) (2002-2007); Managing Director of Carmona Motley Hoffman Inc. (privately-held financial advisor) (January 1998-December 2001); Member of the Finance and Budget Committee of the Council on Foreign Relations, Member of the Investment Committee and Board of Human Rights Watch and Member of the Investment Committee and Board of Historic Hudson Valley. Oversees 52 portfolios in the OppenheimerFunds complex. Mr. Motley has served on the Boards of certain Oppenheimer funds since October 2002, during which time he has become familiar with the Fund’s (and other Oppenheimer funds’) financial, accounting, regulatory and investment matters and has contributed to the Boards’ deliberations. |
| |
Joanne Pace, Trustee (since 2013) Year of Birth: 1952 | | Board Director of Horizon Blue Cross Blue Shield of New Jersey (since November 2012); Advisory Board Director of The Alberleen Group LLC (since March 2012); Advisory Board Director of The Agile Trading Group LLC (since March 2012); Advisory Council Member of 100 Women in Hedge Funds (non-profit) (since December 2012); Advisory Council Member of Morgan Stanley Children’s Hospital (non-profit) (since May 2012); Board Director of The Komera Project (non-profit) (since April 2012); New York Advisory Board Director of Peace First (non-profit) (since March 2010); Senior Advisor of SECOR Asset Management, LP (2010-2011); Managing Director and Chief Operating Officer of Morgan Stanley Investment Management (2006-2010); Partner and Chief Operating Officer of FrontPoint Partners, LLC (hedge fund) (2005-2006); held the following positions at Credit Suisse: Managing Director (2003-2005); Global Head of Human Resources and member of Executive Board and Operating Committee (2004-2005), Global Head of Operations and Product Control (2003-2004); held the following positions at Morgan Stanley: Managing Director (1997-2003), Controller and Principal Accounting Officer (1999-2003); Chief Financial Officer (temporary assignment) for the Oversight Committee, Long Term Capital Management (1998-1999). Lead Independent Director and Chair of the Audit and Nominating Committee of The Global Chartist Fund, LLC of Oppenheimer Asset Management (2011-2012); Board Director of Managed Funds Association (2008-2010); Board Director of Morgan Stanley Foundation (2007-2010) and Investment Committee Chair (2008-2010). Oversees 52 portfolios in the OppenheimerFunds complex. Ms. Pace has served on the Boards of certain Oppenheimer funds since November 2012, including as an Advisory Board Member for certain Oppenheimer funds, during which time she has become familiar with the Fund’s (and other |
41 OPPENHEIMER GLOBAL VALUE FUND
| | | | |
| | |
| | TRUSTEES AND OFFICERS Unaudited / Continued | | |
| | |
| |
Joanne Pace, Continued | | Oppenheimer funds’) financial, accounting, regulatory and investment matters and has contributed to the Board’s deliberations. For purposes of this report, Ms. Pace is identified as a Trustee. |
| |
Joseph M. Wikler, Trustee (since 2007) Year of Birth: 1941 | | Director of C-TASC (bio-statistics services) (2007-2012); formerly, Director of the following medical device companies: Medintec (1992-2011) and Cathco (1996-2011); Member of the Investment Committee of the Associated Jewish Charities of Baltimore (since 1994); Director of Lakes Environmental Association (environmental protection organization) (1996-2008); Director of Fortis/Hartford mutual funds (1994-December 2001). Oversees 52 portfolios in the OppenheimerFunds complex. Mr. Wikler has served on the Boards of certain Oppenheimer funds since August 2005, during which time he has become familiar with the Fund’s (and other Oppenheimer funds’) financial, accounting, regulatory and investment matters and has contributed to the Boards’ deliberations. |
| |
Peter I. Wold, Trustee (since 2007) Year of Birth: 1948 | | Director of Arch Coal, Inc. (since 2010); President of Wold Oil Properties, Inc. (oil and gas exploration and production company) (since 1994); Vice President of American Talc Company, Inc. (talc mining and milling) (since 1999); Managing Member of Hole-in-the-Wall Ranch (cattle ranching) (since 1979); Director and Chairman of Wyoming Enhanced Oil Recovery Institute Commission (enhanced oil recovery study) (2004-2012); Director and Chairman of the Denver Branch of the Federal Reserve Bank of Kansas City (1993-1999); and Director of PacifiCorp. (electric utility) (1995-1999). Oversees 52 portfolios in the OppenheimerFunds complex. Mr. Wold has served on the Boards of certain Oppenheimer funds since August 2005, during which time he has become familiar with the Fund’s (and other Oppenheimer funds’) financial, accounting, regulatory and investment matters and has contributed to the Boards’ deliberations. |
INTERESTED TRUSTEE AND OFFICER | | Mr. Glavin is an “Interested Trustee” because he is affiliated with the Manager and the Sub-Adviser by virtue of his positions as an officer and director of the Manager and a director of the Sub-Adviser, and as a shareholder of the Sub-Adviser’s parent company. Both as a Trustee and as an officer, he serves for an indefinite term, or until his resignation, retirement, death or removal. Mr. Glavin’s address is 225 Liberty Street, 11th Floor, New York, New York 10281-1008. |
| |
William F. Glavin, Jr., Trustee (since 2013), President and Principal Executive Officer (since 2009) Year of Birth: 1958 | | Director, Chairman and Chief Executive Officer of the Manager (since January 2013); President of the Manager (January 2013-May 2013); Chairman of the Sub-Adviser (December 2009-December 2012); Chief Executive Officer (January 2009-December 2012) and Director of the Sub-Adviser (since January 2009); President of the Sub-Adviser (May 2009-December 2012); Management Director (since June 2009), President (since December 2009) and Chief Executive Officer (since January 2011) of Oppenheimer Acquisition Corp. (“OAC”) (the Sub-Adviser’s parent holding company); Director of Oppenheimer Real Asset Management, Inc. (since March 2010); Executive Vice President (March 2006-February 2009) and Chief Operating Officer (July 2007-February 2009) of Massachusetts Mutual Life Insurance Company (OAC’s parent company); Director (May 2004-March 2006) and Chief Operating Officer and Chief Compliance Officer (May 2004-January 2005), President (January 2005-March 2006) and Chief Executive Officer (June 2005-March |
42 OPPENHEIMER GLOBAL VALUE FUND
| | |
| |
William F. Glavin, Jr., Continued | | 2006) of Babson Capital Management LLC; Director (March 2005-March 2006), President (May 2003-March 2006) and Chief Compliance Officer (July 2005-March 2006) of Babson Capital Securities, Inc. (a broker-dealer); President (May 2003-March 2006) of Babson Investment Company, Inc.; Director (May 2004-August 2006) of Babson Capital Europe Limited; Director (May 2004-October 2006) of Babson Capital Guernsey Limited; Director (May 2004-March 2006) of Babson Capital Management LLC; Non-Executive Director (March 2005-March 2007) of Baring Asset Management Limited; Director (February 2005-June 2006) Baring Pension Trustees Limited; Director and Treasurer (December 2003-November 2006) of Charter Oak Capital Management, Inc.; Director (May 2006-September 2006) of C.M. Benefit Insurance Company; Director (May 2008-June 2009) and Executive Vice President (June 2007-July 2009) of C.M. Life Insurance Company; President (March 2006-May 2007) of MassMutual Assignment Company; Director (January 2005-December 2006), Deputy Chairman (March 2005-December 2006) and President (February 2005-March 2005) of MassMutual Holdings (Bermuda) Limited; Director (May 2008-June 2009) and Executive Vice President (June 2007-July 2009) of MML Bay State Life Insurance Company; Chief Executive Officer and President (April 2007-January 2009) of MML Distributors, LLC; and Chairman (March 2006-December 2008) and Chief Executive Officer (May 2007-December 2008) of MML Investors Services, Inc. An officer of 91 portfolios in the OppenheimerFunds complex. |
| | |
| OTHER OFFICERS OF THE FUND | | The addresses of the Officers in the chart below are as follows: for Messrs. Dishmon, Gabinet, Mss. Nasta and Picciotto, 225 Liberty Street, New York, New York 10281-1008, for Mr. Wixted, 6803 S. Tucson Way, Centennial, Colorado 80112-3924. Each Officer serves for an indefinite term or until his or her resignation, retirement, death or removal. |
| |
Randall C. Dishmon, Vice President (since 2007) Year of Birth: 1966 | | Vice President of the Sub-Adviser (since January 2005); Assistant Vice President and Senior Research Analyst of the Sub-Adviser (June 2001-January 2005). A portfolio manager and officer in the OppenheimerFunds complex. |
| |
Arthur S. Gabinet, Secretary and Chief Legal Officer (since 2011) Year of Birth: 1958 | | Executive Vice President, Secretary and General Counsel of the Manager (since January 2013); General Counsel OFI SteelPath, Inc. (since January 2013); Executive Vice President (May 2010-December 2012) and General Counsel (since January 2011) of the Sub-Adviser; General Counsel of the Distributor (since January 2011); General Counsel of Centennial Asset Management Corporation (January 2011-December 2012); Executive Vice President (January 2011-December 2012) and General Counsel of HarbourView Asset Management Corporation (since January 2011); Assistant Secretary (since January 2011) and Director (since January 2011) of OppenheimerFunds International Ltd. and OppenheimerFunds plc; Director of Oppenheimer Real Asset Management, Inc. (January 2011-December 2012) and General Counsel (since January 2011); Executive Vice President (January 2011-December 2011) and General Counsel of Shareholder Financial Services, Inc. and Shareholder Services, Inc. (since January 2011); Executive Vice President (January 2011-December 2012) and General Counsel of OFI Private Investments Inc. (since January 2011); Vice President of OppenheimerFunds Legacy Program (January 2011-December 2011); Executive Vice President (January 2011-December 2012) and General Counsel of OFI Institutional Asset Management, Inc. (since January 2011); General Counsel, Asset Management of the Sub-Adviser (May |
43 OPPENHEIMER GLOBAL VALUE FUND
| | | | |
| | |
| | TRUSTEES AND OFFICERS Unaudited / Continued | | |
| | |
| |
Arthur S. Gabinet, Continued | | 2010-December 2010); Principal, The Vanguard Group (November 2005-April 2010); District Administrator, U.S. Securities and Exchange Commission (January 2003-October 2005). An officer of 91 portfolios in the OppenheimerFunds complex. |
| |
Christina M. Nasta, Vice President and Chief Business Officer (since 2009) Year of Birth: 1973 | | Senior Vice President of OppenheimerFunds Distributor, Inc. (since January 2013); Senior Vice President of the Sub-Adviser (July 2010-December 2012); Vice President of the Sub-Adviser (January 2003-July 2010); Vice President of OppenheimerFunds Distributor, Inc. (January 2003-July 2010). An officer of 91 portfolios in the OppenheimerFunds complex. |
| |
Mary Ann Picciotto, Chief Compliance Officer and Chief Anti-Money Laundering Officer (since 2014) Year of Birth: 1973 | | Senior Vice President and Chief Compliance Officer of the Manager (since March 2014); Chief Compliance Officer of the Sub-Adviser, OFI SteelPath, Inc., OFI Global Trust Company, OFI Global Institutional, Inc., Oppenheimer Real Asset Management, Inc., OFI Private Investments, Inc., Harborview Asset Management Corporation, Trinity Investment Management Corporation, and Shareholder Services, Inc. (since March 2014); Managing Director of Morgan Stanley Investment Management Inc. and certain of its various affiliated entities; Chief Compliance Officer of various Morgan Stanley Funds (May 2010-January 2014); Chief Compliance Officer of Morgan Stanley Investment Management Inc. (April 2007-January 2014). An officer of 91 portfolios in the OppenheimerFunds complex. |
| |
Brian W. Wixted, Treasurer and Principal Financial & Accounting Officer (since 2007) Year of Birth: 1959 | | Senior Vice President of the Manager (since January 2013); Treasurer of the Sub-Adviser, HarbourView Asset Management Corporation, Shareholder Financial Services, Inc., Shareholder Services, Inc., and Oppenheimer Real Asset Management, Inc. (March 1999-June 2008), OFI Private Investments, Inc. (March 2000-June 2008), OppenheimerFunds International Ltd. and OppenheimerFunds plc (since May 2000), OFI Institutional Asset Management, Inc. (November 2000-June 2008), and OppenheimerFunds Legacy Program (charitable trust program established by the Sub-Adviser) (June 2003-December 2011); Treasurer and Chief Financial Officer of OFI Trust Company (since May 2000); Assistant Treasurer of Oppenheimer Acquisition Corporation (March 1999-June 2008). An officer of 91 portfolios in the OppenheimerFunds complex. |
The Fund’s Statement of Additional Information contains additional information about the Fund’s Trustees and Officers and is available without charge upon request, by calling 1.800.CALL OPP (225.5677).
44 OPPENHEIMER GLOBAL VALUE FUND
OPPENHEIMER GLOBAL VALUE FUND
| | |
| Manager | | OFI Global Asset Management, Inc. |
| |
| Sub-Adviser | | OppenheimerFunds, Inc. |
| |
| Distributor | | OppenheimerFunds Distributor, Inc. |
| |
| Transfer and Shareholder Servicing Agent | | OFI Global Asset Management, Inc. |
| |
| Sub-Transfer Agent | | Shareholder Services, Inc. DBA OppenheimerFunds Services |
| |
Independent Registered Public Accounting Firm | | KPMG LLP |
| |
| Legal Counsel | | Kramer Levin Naftalis & Frankel LLP |
© 2014 OppenheimerFunds, Inc. All rights reserved.
45 OPPENHEIMER GLOBAL VALUE FUND
PRIVACY POLICY NOTICE
As an Oppenheimer fund shareholder, you are entitled to know how we protect your personal information and how we limit its disclosure.
Information Sources
We obtain nonpublic personal information about our shareholders from the following sources:
| | — | | Applications or other forms | |
| | — | | When you create a user ID and password for online account access | |
| | — | | When you enroll in eDocs Direct, our electronic document delivery service | |
| | — | | Your transactions with us, our affiliates or others | |
| | — | | A software program on our website, often referred to as a “cookie,” which indicates which parts of our site you’ve visited | |
| | — | | When you set up challenge questions to reset your password online | |
If you visit oppenheimerfunds.com and do not log on to the secure account information areas, we do not obtain any personal information about you. When you do log on to a secure area, we do obtain your user ID and password to identify you. We also use this information to provide you with products and services you have requested, to inform you about products and services that you may be interested in and assist you in other ways.
We do not collect personal information through our website unless you willingly provide it to us, either directly by email or in those areas of the website that request information. In order to update your personal information (including your mailing address, email address and phone number) you must first log on and visit your user profile.
If you have set your browser to warn you before accepting cookies, you will receive the warning message with each cookie. You can refuse cookies by turning them off in your browser. However, doing so may limit your access to certain sections of our website.
We use cookies to help us improve and manage our website. For example, cookies help us recognize new versus repeat visitors to the site, track the pages visited, and enable some special features on the website. This data helps us provide a better service for our website visitors.
Protection of Information
We do not disclose any non-public personal information (such as names on a customer list) about current or former customers to anyone, except as permitted by law.
Disclosure of Information
We send your financial advisor (as designated by you) copies of confirmations, account statements and other documents reporting activity in your fund accounts. We may also use details about you and your investments to help us, our financial service affiliates, or firms that jointly market their financial products and services with ours, to better serve your investment needs or suggest financial services or educational material that may be of interest to you. If this requires us to provide you with an opportunity to “opt in” or “opt out” of such information sharing with a firm not affiliated with us, you will receive notification on how to do so, before any such sharing takes place.
Right of Refusal
We will not disclose your personal information to unaffiliated third parties (except as permitted by law), unless we first offer you a reasonable opportunity to refuse or “opt out” of such disclosure.
46 OPPENHEIMER GLOBAL VALUE FUND
Internet Security and Encryption
In general, the email services provided by our website are encrypted and provide a secure and private means of communication with us. To protect your own privacy, confidential and/or personal information should only be communicated via email when you are advised that you are using a secure website.
As a security measure, we do not include personal or account information in non-secure emails, and we advise you not to send such information to us in non-secure emails. Instead, you may take advantage of the secure features of our website to encrypt your email correspondence. To do this, you will need to use a browser that supports Secure Sockets Layer (SSL) protocol.
We do not guarantee or warrant that any part of our website, including files available for download, are free of viruses or other harmful code. It is your responsibility to take appropriate precautions, such as use of an anti-virus software package, to protect your computer hardware and software.
| | — | | All transactions, including redemptions, exchanges and purchases, are secured by SSL and 128-bit encryption. SSL is used to establish a secure connection between your PC and OppenheimerFunds’ server. It transmits information in an encrypted and scrambled format. | |
| | — | | Encryption is achieved through an electronic scrambling technology that uses a “key” to code and then decode the data. Encryption acts like the cable converter box you may have on your television set. It scrambles data with a secret code so that no one can make sense of it while it is being transmitted. When the data reaches its destination, the same software unscrambles the data. | |
| | — | | You can exit the secure area by either closing your browser, or for added security, you can use the Log Out button before you close your browser. | |
Other Security Measures
We maintain physical, electronic and procedural safeguards to protect your personal account information. Our employees and agents have access to that information only so that they may offer you products or provide services, for example, when responding to your account questions.
How You Can Help
You can also do your part to keep your account information private and to prevent unauthorized transactions. If you obtain a user ID and password for your account, do not allow it to be used by anyone else. Also, take special precautions when accessing your account on a computer used by others.
Who We Are
This joint notice describes the privacy policies of the Oppenheimer funds, OppenheimerFunds, Inc., and each of its investment adviser subsidiaries, OppenheimerFunds Distributor, Inc. and OFI Global Trust Co. It applies to all Oppenheimer fund accounts you presently have, or may open in the future, using your Social Security number—whether or not you remain a shareholder of our funds. This notice was last updated November 2013. In the event it is updated or changed, we will post an updated notice on our website at oppenheimerfunds.com. If you have any questions about these privacy policies, write to us at P.O. Box 5270, Denver, CO 80217-5270, email us by clicking on the Contact Us section of our website at oppenheimerfunds.com or call us at 1.800.CALL OPP (225.5677).
47 OPPENHEIMER GLOBAL VALUE FUND

Item 2. Code of Ethics.
The registrant has adopted a code of ethics that applies to the registrant’s principal executive officer, principal financial officer, principal accounting officer or controller or persons performing similar functions.
Item 3. Audit Committee Financial Expert.
The Board of Trustees of the registrant has determined that David Downes, the Board’s Audit Committee Chairman, is an audit committee financial expert and that Mr. Downes is “independent” for purposes of this Item 3.
Item 4. Principal Accountant Fees and Services.
The principal accountant for the audit of the registrant’s annual financial statements billed $22,100 in fiscal 2014 and $21,700 in fiscal 2013.
The principal accountant for the audit of the registrant’s annual financial statements billed no such fees in fiscal 2014 and no such fees in fiscal 2013.
The principal accountant for the audit of the registrant’s annual financial statements billed $883,775 in fiscal 2014 and $568,480 in fiscal 2013 to the registrant’s investment adviser or any entity controlling, controlled by, or under common control with the adviser that provides ongoing services to the registrant.
Such services include: Internal control reviews, GIPS attestation procedures, internal audit training, surprise exams, company reorganization, and system conversion testing
The principal accountant for the audit of the registrant’s annual financial statements billed $1,675 in fiscal 2014 and $2,175 in fiscal 2013.
The principal accountant for the audit of the registrant’s annual financial statements billed $343,117 in fiscal 2014 and $434,876 in fiscal 2013 to the registrant’s investment adviser or any entity controlling, controlled by, or under common control with the adviser that provides ongoing services to the registrant.
Such services include: tax compliance, tax planning and tax advice. Tax compliance generally involves preparation of original and amended tax returns, claims for a refund and tax payment-planning services. Tax planning and tax advice includes assistance with tax audits and appeals, tax advice related to mergers and acquisitions and requests for rulings or technical advice from taxing authorities.
The principal accountant for the audit of the registrant’s annual financial statements billed no such fees in fiscal 2014 and no such fees in fiscal 2013.
The principal accountant for the audit of the registrant’s annual financial statements billed no such fees in fiscal 2014 and no such fees in fiscal 2013 to the registrant’s investment adviser or any entity controlling, controlled by, or under common control with the adviser that provides ongoing services to the registrant.
Such fees would include the cost to the principal accountant of attending audit committee meetings and consultations regarding the registrant’s retirement plan with respect to its Trustees.
| (e) | (1) During its regularly scheduled periodic meetings, the registrant’s audit committee will pre-approve all audit, audit-related, tax and other services to be provided by the principal accountants of the registrant. |
The audit committee has delegated pre-approval authority to its Chairman for any subsequent new engagements that arise between regularly scheduled meeting dates provided that any fees such pre-approved are presented to the audit committee at its next regularly scheduled meeting.
Under applicable laws, pre-approval of non-audit services may be waived provided that: 1) the aggregate amount of all such services provided constitutes no more than five percent of the total amount of fees paid by the registrant to its principal accountant during the fiscal year in which services are provided 2) such services were not recognized by the registrant at the time of engagement as non-audit services and 3) such services are promptly brought to the attention of the audit committee of the registrant and approved prior to the completion of the audit.
| (f) | Not applicable as less than 50%. |
| (g) | The principal accountant for the audit of the registrant’s annual financial statements billed $1,228,567 in fiscal 2014 and $1,005,531 in fiscal 2013 to the registrant and the registrant’s investment adviser or any entity controlling, controlled by, or under common control with the adviser that provides ongoing services to the registrant related to non-audit fees. Those billings did not include any prohibited non-audit services as defined by the Securities Exchange Act of 1934. |
| (h) | The registrant’s audit committee of the board of Trustees has considered whether the provision of non-audit services that were rendered to the registrant’s investment adviser, and any entity controlling, controlled by, or under common control with the investment adviser that provides ongoing services to the registrant that were not pre-approved pursuant to paragraph (c)(7)(ii) of Rule 2-01 of Regulation S-X is compatible with maintaining the principal accountant’s independence. No such services were rendered. |
Item 5. Audit Committee of Listed Registrants
Not applicable.
Item 6. Schedule of Investments.
a) Not applicable. The complete schedule of investments is included in Item 1 of this Form N-CSR.
b) Not applicable.
Item 7. Disclosure of Proxy Voting Policies and Procedures for Closed-End Management Investment Companies.
Not applicable.
Item 8. Portfolio Managers of Closed-End Management Investment Companies.
Not applicable.
Item 9. Purchases of Equity Securities by Closed-End Management Investment Company and Affiliated Purchasers.
Not applicable.
Item 10. Submission of Matters to a Vote of Security Holders.
The Fund’s Governance Committee Provisions with Respect to Nominations of Directors/Trustees to the Respective Boards
None
Item 11. Controls and Procedures.
Based on their evaluation of the registrant’s disclosure controls and procedures (as defined in rule 30a-3(c) under the Investment Company Act of 1940 (17 CFR 270.30a-3(c)) as of 4/30/2014, the registrant’s principal executive officer and principal financial officer found the registrant’s disclosure controls and procedures to provide reasonable assurances that information required to be disclosed by the registrant in the reports that it files under the Securities Exchange Act of 1934 (a) is accumulated and communicated to registrant’s management, including its principal executive officer and principal financial officer, to allow timely decisions regarding required disclosure, and (b) is recorded, processed, summarized and reported, within the time periods specified in the rules and forms adopted by the U.S. Securities and Exchange Commission.
There have been no changes in the registrant’s internal controls over financial reporting that occurred during the registrant’s second fiscal quarter of the period covered by this report that have materially affected, or are reasonably likely to materially affect, the registrant’s internal control over financial reporting.
Item 12. Exhibits.
| (a) | (1) Exhibit attached hereto. |
(2) Exhibits attached hereto.
(3) Not applicable.
| (b) | Exhibit attached hereto. |
SIGNATURES
Pursuant to the requirements of the Securities Exchange Act of 1934 and the Investment Company Act of 1940, the registrant has duly caused this report to be signed on its behalf by the undersigned, thereunto duly authorized.
Oppenheimer Global Value Fund
| | |
| By: | | /s/ William F. Glavin, Jr. |
| | William F. Glavin, Jr. |
| | Principal Executive Officer |
| |
| Date: | | 6/9/2014 |
Pursuant to the requirements of the Securities Exchange Act of 1934 and the Investment Company Act of 1940, this report has been signed below by the following persons on behalf of the registrant and in the capacities and on the dates indicated.
| | |
| By: | | /s/ William F. Glavin, Jr. |
| | William F. Glavin, Jr. |
| | Principal Executive Officer |
| |
| Date: | | 6/9/2014 |
| | |
| By: | | /s/ Brian W. Wixted |
| | Brian W. Wixted |
| | Principal Financial Officer |
| |
| Date: | | 6/9/2014 |