Goldman Sachs
Small/Mid Cap Financial Services Symposium
February 11-12, 2008
Focused on Maximizing Value for Shareholders

Forward Looking Statements
This presentation contains “forward-looking statements” within the meaning of the federal securities laws. These forward-looking
statements are identified by their use of terms and phrases such as “believe,” “anticipate,” “could,” “estimate,” “likely,” “intend,” “may,”
“plan,” “expect,” and similar expressions, including references to assumptions or our plans and goals. These statements reflect our current
views with respect to future events and are subject to risk and uncertainties. We note that a variety of factors and uncertainties could cause
our actual results to differ significantly from the results discussed in the forward-looking statements. Factors and uncertainties that might
cause such differences include, but are not limited to: general economic, market, or business conditions; demand for new housing;
competitive actions by other companies; changes in laws or regulations and actions or restrictions of regulatory agencies; deposit attrition,
customer loss, or revenue loss in the ordinary course of business; costs or difficulties related to becoming a stand-alone public company;
the inability to realize elements of our strategic plans; changes in the interest rate environment that expand or reduce margins or adversely
affect critical estimates and projected returns on investments; economic conditions affecting real estate values and oil and gas prices and
changes in market and/or general economic conditions, either nationally or regionally, that are less favorable than expected; natural
disasters in primary market areas that may result in prolonged business disruption or materially impair the value of collateral securing
loans; assumptions and estimates underlying critical accounting policies, particularly allowance for credit losses, may prove to be
materially incorrect or may not be borne out by subsequent events; current or future litigation, regulatory investigations, proceedings or
inquiries; strategies to manage interest rate risk may yield results other than those anticipated; a significant change in the rate of inflation or
deflation; changes in the securities markets; the ability to complete merger, acquisition or divestiture plans; regulatory or other limitations
imposed as a result of a merger, acquisition or divestiture; and the success of our business following a merger, acquisition or divestiture;
the final resolutions or outcomes with respect to our contingent and other corporate liabilities related to our business and any related
actions for indemnification made pursuant to the separation and distribution agreement between us and Temple-Inland Inc.; and other risks
as set out in the reports we have filed with the Securities and Exchange Commission, which you may view at www.sec.gov.
New factors emerge from time to time and it is not possible for us to predict all such factors, nor can we assess the impact of any such
factor on our business or the extent to which any factor, or combination of factors, may cause results to differ materially from those
contained in any forward-looking statement.
Any forward-looking statement speaks only as of the date on which such statement is made, and, except as required by law, we expressly
disclaim any obligation or undertaking to disseminate any updates or revisions to any forward-looking statement to reflect events or
circumstances after the date of this presentation.
2

Over $16 billion in assets
2nd largest publicly-traded depository institution
headquartered in Texas
158 branches
Texas - 102
California - 56
Insurance agency – 9th largest bank-owned agency in U.S.
Top 11 officers have been with the bank an average
11 years and in the industry an average 27 years
Spin-off from Temple-Inland completed Dec. 28, 2007
Company Profile
Guaranty is focused on creating significant value for
shareholders, customers, employees and communities
3

Investment Highlights
Branches Located in High-Growth Texas and California
Markets
Loan Growth Driven by Geographic and Product
Diversification
Lowering Costs and Improving Financial Performance
Strong Credit Culture
Controlled Interest Rate Risk
Experienced Management Team
We believe Guaranty is uniquely
positioned to maximize shareholder value
4

Grow commercial lending franchise
Grow retail franchise in TX and CA
Increase fee income
Provide distinctive customer service
Improve operating efficiency
Maintain strong credit and risk standards
Strategy
We believe the combination of our strategy, expertise,
growing markets and financial strength positions Guaranty to
create significant value for shareholders
5
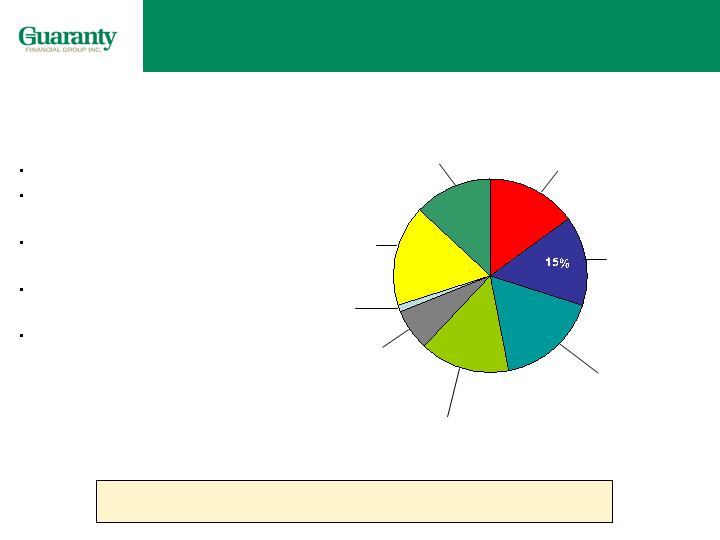
Loan Portfolio
Dec. 31, 2007
Maintain diversified loan portfolio
Overview
$10 billion total
Strong middle market
focus
Strong energy lending
with focus on E&P
Significant commercial
real estate experience
Lower risk single family
mortgage portfolio
Single-family
mortgage
Single-family
construction
Commercial and
business
Energy
Consumer and
other 1%
Multifamily and
senior housing
Single-family mortgage
warehouse
Commercial
real estate
7%
15%
17%
13%
15%
17%
6
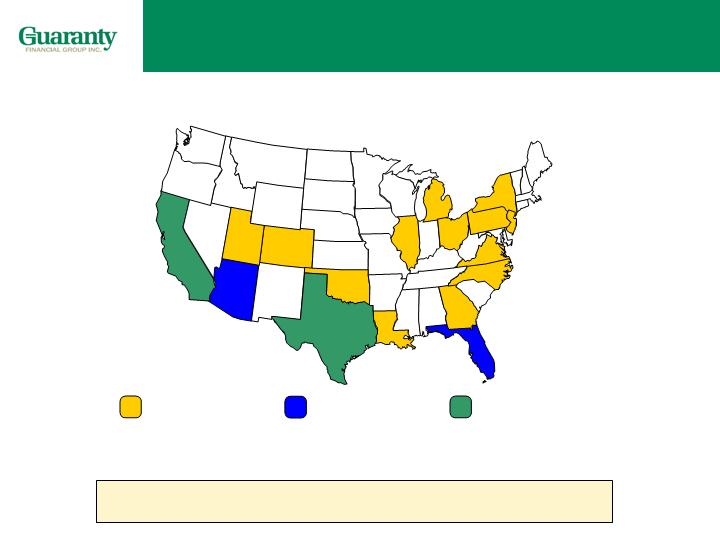
1% to 5% of
loan portfolio
5% to 10% of
loan portfolio
Greater than 10%
of loan portfolio
Grow Commercial Lending Franchise
Nationwide targeted markets
As of Dec. 31, 2007
7
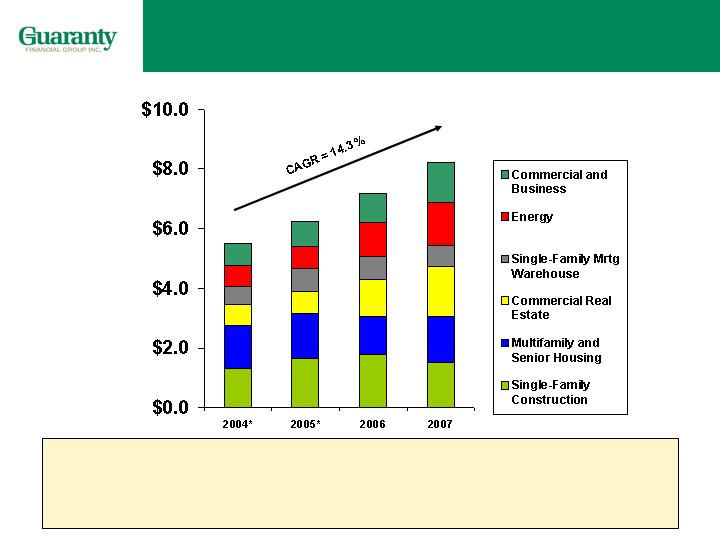
($ in Billions)
Continue strong growth in diversified commercial loan
portfolio focusing on business, commercial RE,
energy, middle market and senior housing
$5.5
$7.2
$6.2
$8.2
Commercial Loan Balances
*Excludes asset
based lending,
which was exited in
2006.
8

Grow commercial lending franchise
Grow retail franchise in TX and CA
Increase fee income
Provide distinctive customer service
Improve operating efficiency
Maintain strong credit and risk standards
Strategy
We believe the combination of our strategy, management
expertise, growing markets and financial strength positions
Guaranty to create significant value for shareholders
9

Texas Demographics
2nd largest state in U.S. (pop. 23 million)
3 of the 10 largest cities in the U.S.
Houston # 4
San Antonio # 8
Dallas # 9
2nd fastest growing state population
4 of the 25 fastest growing MSAs:
Dallas area # 2
Houston area # 3
Austin area # 18
San Antonio area # 25
- 102 branches
- $6.4 billion in retail deposits at 12/31/07
- 8th largest in Texas by total deposits
- Top 10 in 3 major markets
Texas Retail Operation
Grow Retail Franchise in TX and CA
Significant opportunity in Texas
Source: Claritas Incorporated
Houston
Dallas/Ft. Worth
Austin
San Antonio
10
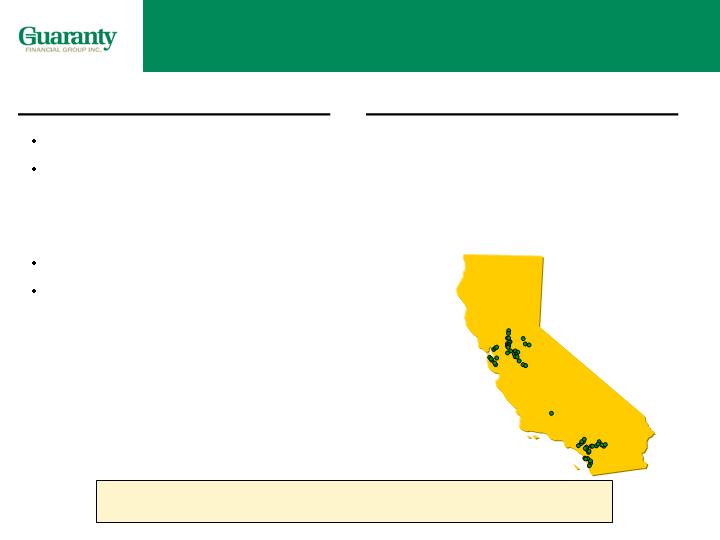
California Demographics
- 56 branches
- $2.4 billion in retail deposits at 12/31/08
- 31st largest in California by total deposits
- Significant presence in Central
Valley and the Inland Empire
California Retail Operation
Largest state in U.S. (pop. 36 million)
3 of the 10 largest cities in the U.S.
Los Angeles # 2
San Diego # 7
San Jose # 10
Fastest growing state population
4 of the 25 fastest growing MSAs in
the country:
Los Angeles area # 7
Riverside area # 8
Sacramento area # 15
San Diego # 20
Grow Retail Franchise in TX and CA
Significant opportunity in California
Source: Claritas Incorporated
San Diego
San Francisco
Sacramento
Central Valley
Los Angeles
Inland Empire
11
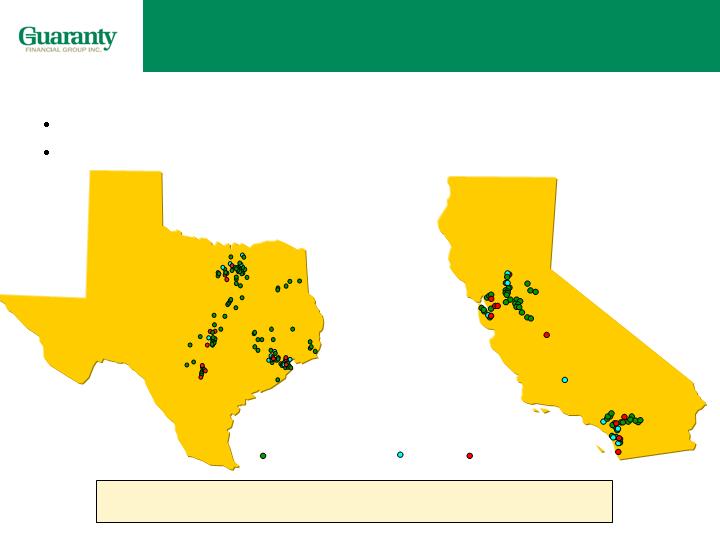
Launched program to open 42 de novo branches.
18 de novo branches opened through year end 2007.
Grow Retail Franchise in TX and CA
Growing branch network in targeted areas
De Novo Branching
Previously Existing (140)
New (18)
To be opened (24)
San Diego
San Francisco
Sacramento
Central Valley
Los Angeles
Inland Empire
Houston
Dallas/Ft. Worth
Austin
San Antonio
12
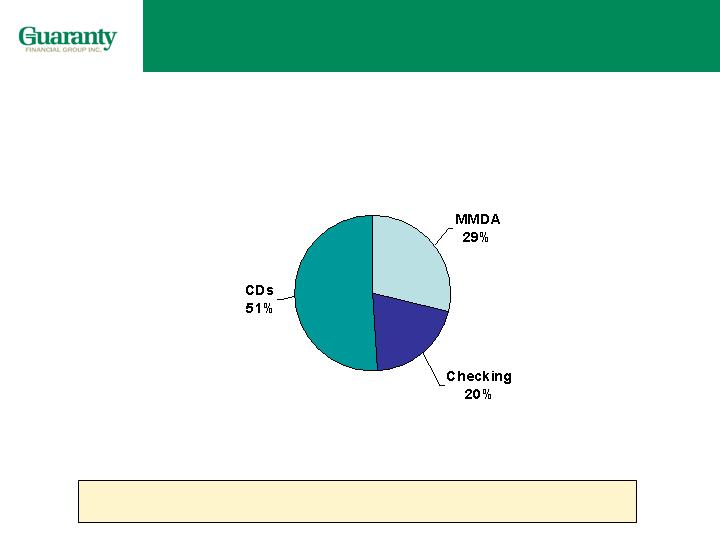
Diversified deposit base
Total Deposits (Dec 31, 2007)
Deposits
Total: $9.4 billion
13
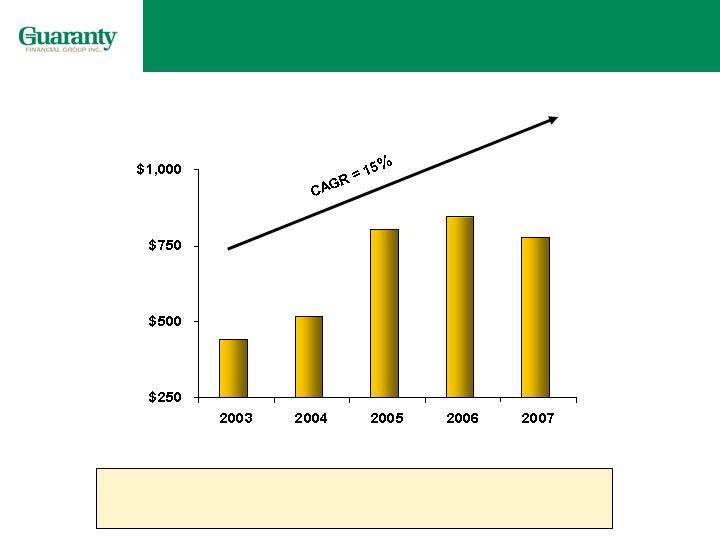
($ in Millions)
Continue to emphasize non-interest
bearing checking deposits
Non-Interest Bearing Deposits
Grow Retail Franchise in TX and CA
$443
$519
$803
$845
$779
14

Grow Retail Franchise in TX and CA
Additional Product Expansion Opportunities:
Expand consumer lending
Grow small business banking
Expand banking services to title insurance agencies
and related transactions
Offer expanded banking products to professionals
Leverage branch network
15

Grow commercial lending franchise
Grow retail franchise in TX and CA
Increase fee income
Provide distinctive customer service
Improved operating efficiency
Maintain strong credit and risk standards
Strategy
We believe the combination of our strategy, management
expertise, growing markets and financial strength positions
Guaranty to create significant value for shareholders
16

Increase Fee Income
*Excludes fee income from exited mortgage banking business.
Fee Income*
($ in Millions)
Diversified and growing fee income
$136
$158
Loan and Other Fees
Deposit Fees and
Non-Deposit Investment
Fees
Insurance
Commission and Fees
$166
**Unaudited.
$157
17
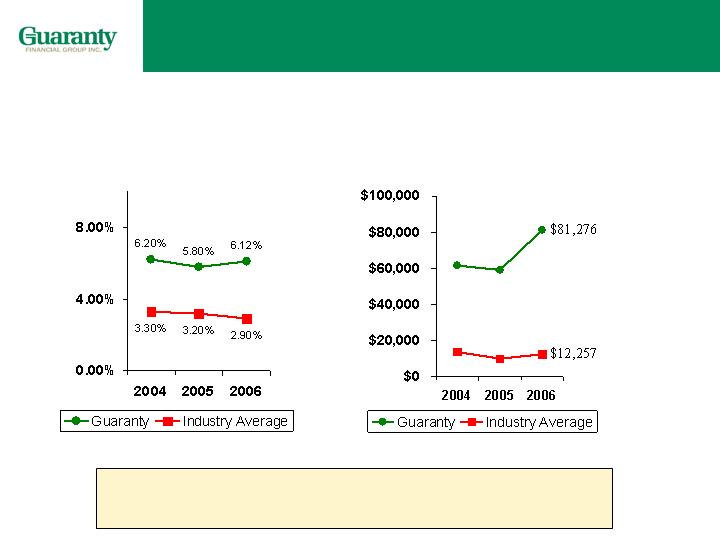
Increase Fee Income
Annuities and Mutual Funds
Deposit Account Penetration
Revenue per Licensed Banker
Our non-deposit investment
program has been very successful
Source of Industry Average Data: 2006 Kehrer-ENSI Financial Institution Investment Program Benchmarking Study
18

Los Angeles
Dallas/Ft. Worth
9th largest bank-owned insurance agency in US
The largest bank-owned agency based in TX
In operation for over 50 years
Products:
Property and Casualty
Group Benefits
Risk Management
Increase Fee Income
Guaranty Insurance is an important
source for growing fee income
Guaranty Insurance Services, Inc.
San Diego
Austin
San Antonio
Houston
Sacramento
San Francisco
Insurance locations
19

Increase Fee Income
Treasury Management
Remote Deposit
Capital Markets
Wealth Management
We believe we have significant
additional cross sell opportunities
20

Grow commercial lending franchise
Grow retail franchise in TX and CA
Increase fee income
Provide distinctive customer service
Improve operating efficiency
Maintain strong credit and risk standards
Strategy
We believe the combination of our strategy, management
expertise, growing markets and financial strength positions
Guaranty to create significant value for shareholders
21
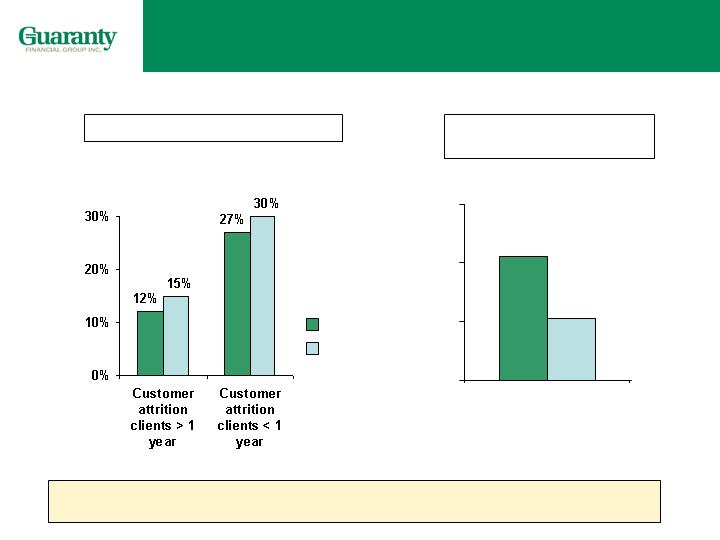
Provide Distinctive Customer Service
Successful in satisfying the needs of our customers
Retail Customer Attrition Rates
Guaranty Bank
Industry
Source of Industry Data: Council for Financial Competition
Retail Customer Tenure
(years)
10.2
8.1
6
8
10
12
22

Grow commercial lending franchise
Grow retail franchise in TX and CA
Increase fee income
Provide distinctive customer service
Improve operating efficiency
Maintain strong credit and risk standards
Strategy
We believe the combination of our strategy, management
expertise, growing markets and financial strength positions
Guaranty to create significant value for shareholders
23

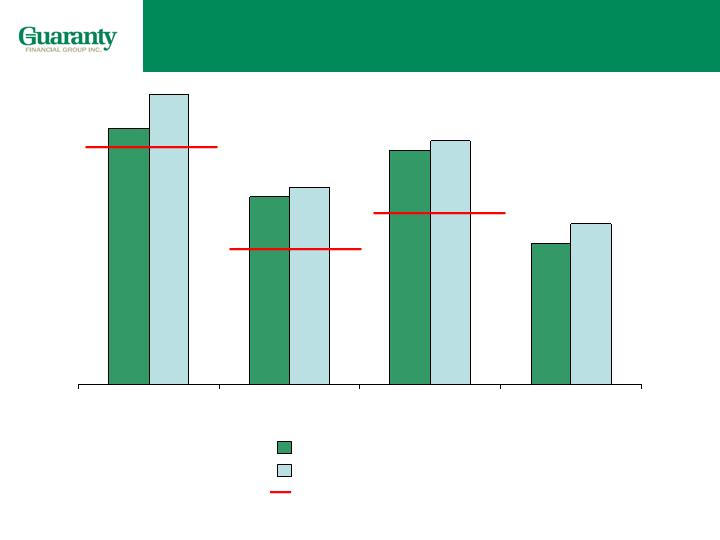
Improve Operating Efficiency
Remain focused on expense management
372
388
384
534
149
151
154
184
Other
--
11
5
34
Charges related to asset impairments and severance
68%
65%
66%
74%
Efficiency ratio (excluding charges related to asset
impairments and severance charges)
14
14
16
19
Information systems and technology
28
28
27
31
Occupancy
$181
$184
$182
$266
Compensation and benefits
2007
2006
2005
2004
Noninterest Expenses
24

Grow commercial lending franchise
Grow retail franchise in TX and CA
Increase fee income
Provide distinctive customer service
Improve operating efficiency
Maintain strong credit and risk standards
Strategy
We believe the combination of our strategy, management
expertise, growing markets and financial strength positions
Guaranty to create significant value for shareholders
25
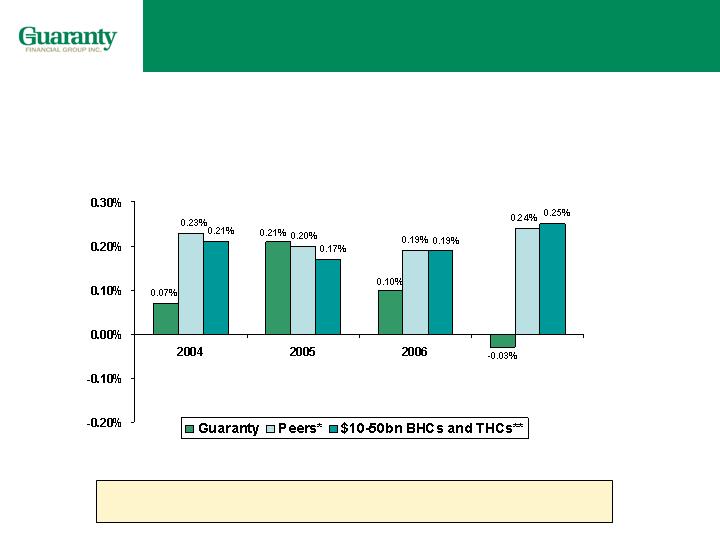
Maintain Strong Credit and Risk Standards
Average charge-off rate (2004 thru 2007):
Guaranty = .09% Peers* = .22% $10-50bn BHCs and THCs** = .21%
Net charge-offs lower than our peers
Net charge-offs as a percentage of average loans outstanding
2007
*Peers: ASBC, BOH, BOKF, BXS, CBSH, CFR, CNB, CYN, FCNCA, FMER, FULT, STSA, SUSQ, TCB, TSFG, VLY, WBS, and WTNY (IBOC 2007 information unavailable on 2/7/08).
**2007 Information unavailable for 5 institutions on 2/7/08.
Data source: SNL data
26
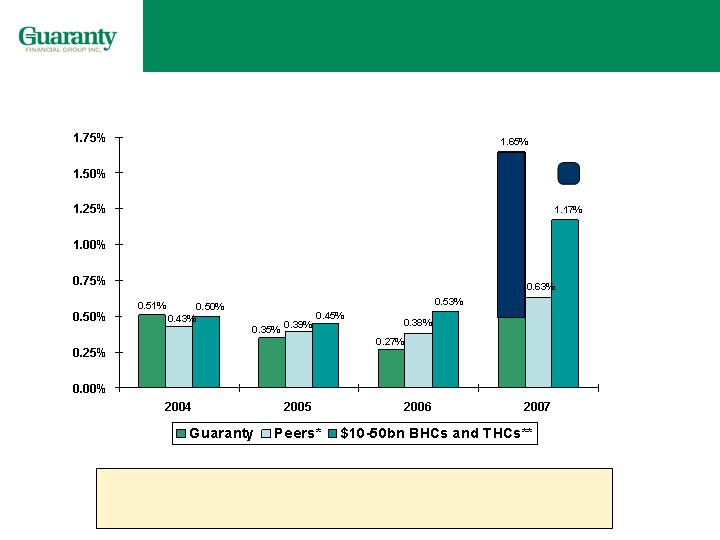
Maintain Strong Credit and Risk Standards
Non Performing loans as a percentage of total loans
Recent increase in historically low non-
performing loans due to market conditions
*Peers: ASBC, BOH, BOKF, BXS, CBSH, CFR, CNB, CYN, FCNCA, FMER, FULT, STSA, SUSQ, TCB, TSFG, WBS, and WTNY (IBOC and VLY 2007 information unavailable on 2/7/08).
.85%
.48%
1.17%
Homebuilder loans
**2007 Information unavailable for 8 institutions on 2/7/08.
Data source: SNL data
27
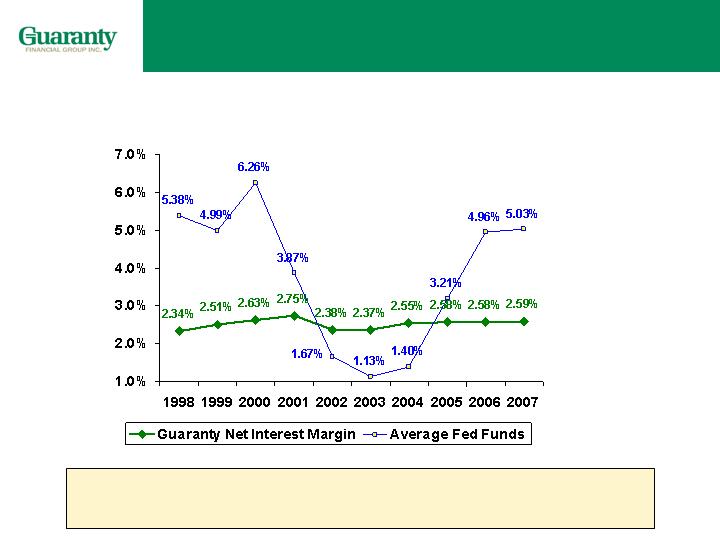
Maintain Strong Credit and Risk Standards
Net Interest Margin
Despite volatility in interest rates, successfully
maintained stable net interest margin
28

Financial Overview
29

$2.20
N/A
N/A
N/A
Diluted Earnings Per Share
7.52%
11.67%
11.97%
10.00%
Return on Average Equity
.49%
.72%
.71%
.56%
Return on Average Assets
78
121
116
95
Net Income
(48)
(70)
(66)
(56)
Income Tax Expense
126
191
182
151
Income Before Taxes
(372)
(388)
(384)
(534)
Non-Interest Expense
157
168
180
267
Non-Interest Income
341
411
386
418
Net Interest Income After Provision
(50)
(1)
(10)
12
(Provision) Credit for Credit Losses
$391
$412
$396
$406
Net Interest Income before LLP
2007
2006
2005
2004
($ in millions, except per share data)
Earnings Highlights
30

32.16
N/A
N/A
N/A
Book Equity Per Share
27.36
N/A
N/A
N/A
Tangible Equity Per Share
1.1
1.0
1.0
0.9
Stockholders’ Equity
5.7
5.1
6.9
4.7
FHLB Borrowings
9.4
9.5
9.2
9.0
Deposits
15.7
15.2
16.7
15.2
Total Liabilities
5.5
5.4
6.2
4.7
Securities
9.9
9.6
9.8
9.6
Loans, net of allowance
$16.8
$16.2
$17.7
$16.1
Total Assets
2007
2006
2005
2004
($ in billions, except per share data)
Balance Sheet Highlights
31
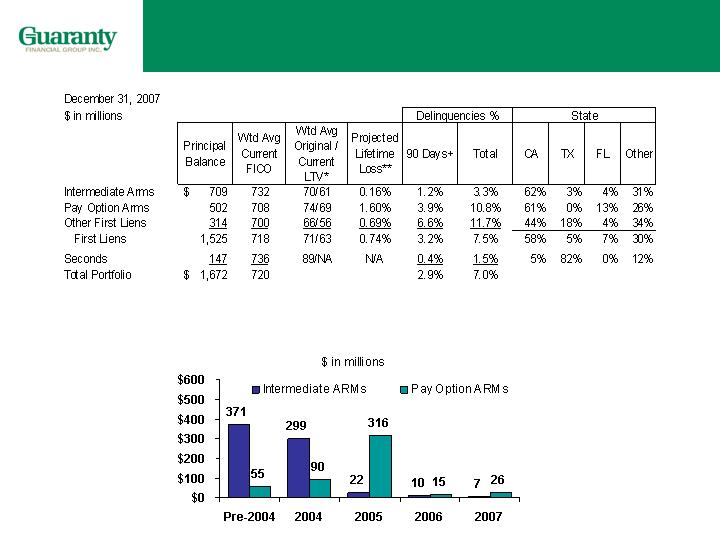
Single-Family Mortgages Detail
*Current loan to value reflects changes in loan balance and changes in property value since loan origination (with changes in value estimated using Office of Federal Housing Enterprise Oversight
data from September 2007).
**Lifetime loss projection from S&P Levels ® model (version 6.2, January 2008, midpoint of ‘B’ loss projection)
Vintage of Origination
32

Mortgage Backed Securities
As of Dec. 31, 2007 ($ Billions)
Amortized Cost Fair Value
Available for Sale:
Agency $0.57 $0.57
Private $1.37 $1.31
Held to Maturity:
Agency $1.23 $1.23
Private $2.41 $2.20
Total: $5.58 $5.31
Private Issue MBS
Adjustable rate
All AAA rated
Underlying collateral delinquency rate: 11%
Weighted average current LTV: 78% (current loan balance/original appraised value)
Weighted average current credit score: 708
_____________________
Significant, and growing
subordination levels
provide protection from
credit losses
_____________________
33
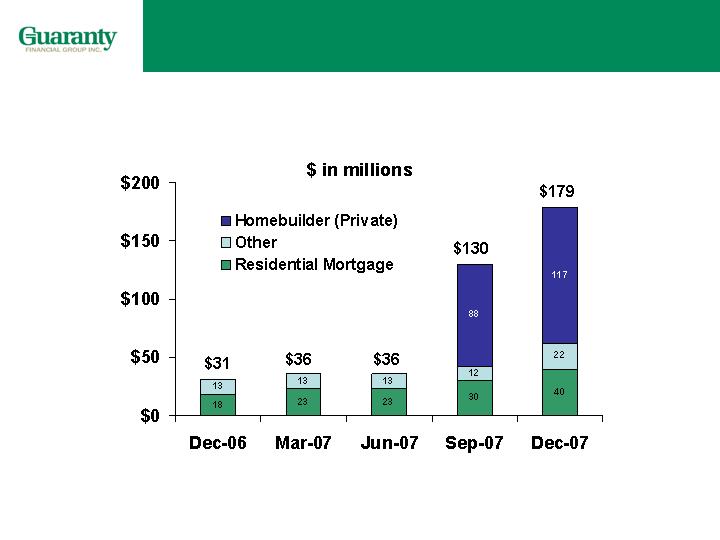
Nonperforming Assets
34
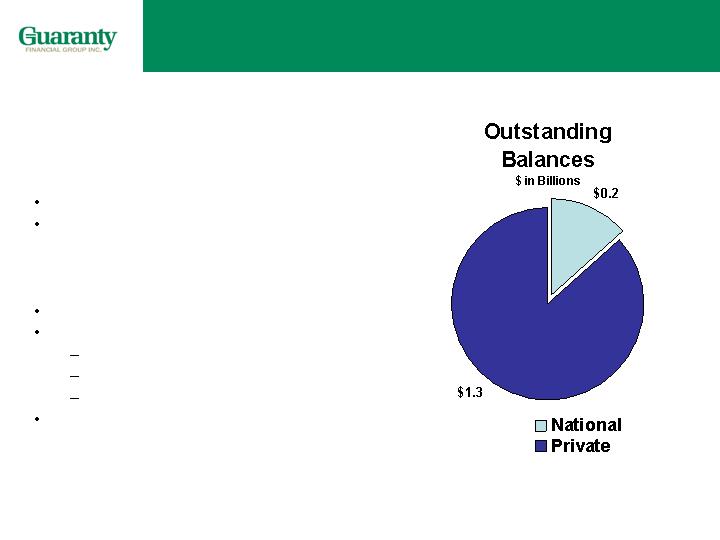
Homebuilder Portfolios
As of Dec 31, 2007
National (mostly public builders)
Approximately half secured
Borrowing base
Regional (all private builders)
Over 90% secured
Policy limits
Land Max. 50% Original LTV
Lots Max. 75% Original LTV
Houses Max. 80% Original LTV
Guarantees
35

Regional Homebuilder Loans
*Represents approx. 3% of total loans.
7%
85
34
51
Colorado
589
163
30
52
105
94
94
Houses
100%
1264
675
31%
382
219
Other
5%
66
36
Arizona
9%
119
67
Florida
10%
132
27
Texas
18%
222
128
Other California
20%
258*
164
Northern & Central California
% of Total
Total
Land/Lots &
Other
As of December 31, 2007 ($ in millions)
36
Capital
Guaranty as of December 31, 2007
Peers* as of September 30, 2007
OTS Well Capitalized Standard
Total Risk-Based Capital
Tier 1 Risk-Based Capital
Tier 1 (Core) Capital (Leverage)
10%
6.0%
5.0%
10.5%
11.9%
7.7%
8.1%
9.6%
10.0%
5.8%
6.6%
TCE/TA
*Peers: ASBC, BOH, BOKF, BXS, CBSH, CFR, CNB, CYN, FCNCA, FMER, FULT, IBOC, STSA, SUSQ, TCB, TSFG, VLY, WBS, and WTNY.
(Bank Level)
(Bank Level)
(Bank Level)
(Holding Company Level)
Data source: SNL data
37

Creating Value For Shareholders
Summary
Long, Successful Track Record in Commercial Lending
Great Markets
Experienced, Cohesive Management Team
It’s a New Day
We believe Guaranty is uniquely
positioned to maximize shareholder value
38