April 17, 2012
Jennifer Thompson
Accounting Bureau Chief
Securities and Exchange Commission
100 F Street NE
Washington, D.C. 20549-3561
Mail Stop 3561
Re: Brookfield Infrastructure Partners L.P.
Form 20-F for the Fiscal Year Ended December 31, 2010
Filed April 26, 2011
File No. 001-33632
Dear Ms. Thompson:
Enclosed for filing with the Securities and Exchange Commission (the “SEC”) on behalf of Brookfield Infrastructure Partners L.P. (the “Partnership”) is the Partnership’s response to your letter dated March 26, 2012. The Staff’s letter set forth specific comments (the “Comments”) regarding the Partnership’s Annual Report on Form 20-F for the fiscal year ended December 31, 2010 (the “Form 20-F”).
Set forth below are the Partnership’s responses to the Comments, which the Partnership has requested the undersigned submit to you on its behalf. For purposes of facilitating the Staff’s review of the Partnership’s responses to the Comments, the original comments are included at the beginning of each response.
Consolidated Financial Statements, page F-1
Consolidated and Combined Statements of Operating Results, page F-6
1. We note your response to comment 4 from our letter dated February 13, 2012. We are not persuaded by your argument that the presentation of a subtotal that includes the key operating components that are included in EBITDA does not contradict paragraph BC 56 of IAS 1. We continue to believe that depreciation and amortization are items of an operating nature which should not be excluded from a measure that represents or could be construed to represent the results of operating activities. Please revise future filings to remove this subtotal or classify depreciation and amortization within this subtotal.
The Partnership acknowledges the Staff’s comment and, in future filings, will classify depreciation and amortization within this subtotal.
Note 7. Acquisition of Businesses, page F-34
2. We have read your response to comment 6 from our letter dated February 13, 2012, and it does not appear from your response that you have considered the impact of the error on the total mix of information available, which would include net income. Although we recognize that cash generation and distribution are important to your partnership and your investors, net income should be considered in your materiality analysis, and a quantitatively material impact to net income should not be disregarded. Please restate your financial statements for all periods affected or provide us with a more detailed materiality analysis that addresses the following points:
· On pages 6, 66, and 94 of your Form 20-F you state that “to measure performance, we focus on net income as well as funds from operations, or FFO.” We further note your disclosures on page 94 that FFO is unlikely to be comparable to similar measures presented by other issuers and that FFO should not be considered as the sole measure of your performance and should not be considered in isolation from, or as a substitute for, analysis of your results as reported under IFRS. Please explain to us in further detail how, in light of these disclosures, it is appropriate to focus on a non-GAAP measure when considering the materiality of an error that impacted your GAAP basis financial statements. In this regard, it would appear a reasonable person would use GAAP net income in making judgments about your company.
· You stated in your response letter dated January 31, 2012 that you considered the impact of the error on reported key metrics such as comprehensive income and earnings per unit attributable to limited partners. Please provide us with your analysis or consideration of the impact of the error on these key metrics.
· Explain to us in greater detail the nature of the “mechanical error” and clarify how and when you discovered it. We note that your previous financial statement disclosures did not characterize the $28 million gain as the correction of an error. Please explain to us how you considered the qualitative aspects of mischaracterizing the error in your previously issued financial statements in your materiality analysis.
As discussed with the Staff, the Partnership respectfully reconfirms its position that partnership capital is the most appropriate basis for the Partnership to assess the materiality of the error in question. For the fiscal year ended December 31, 2009 (“Fiscal 2009”), the Partnership’s materiality threshold was $40 million or, approximately 2% of its partnership capital (currently the Partnership’s materiality is $60 million). The impact on partnership capital in Fiscal 2009 of this error was $28 million, or less than 1.5% of partnership capital, and comfortably below the Partnership’s materiality threshold. Based on this, together with the other considerations that the Partnership has described in its prior correspondence with the Staff, management and the audit committee, with the concurrence of the Partnership’s auditors, concluded that the error was not material in the context of the Partnership’s financial statements taken as a whole.
The Partnership would like to clarify that it does not view net income or other measures (GAAP and non-GAAP) as immaterial to its analysis of its overall performance. Rather, in evaluating the materiality of items relevant to the Partnership’s financial statements, the key metric that management relies upon is partnership capital. As per the Staff’s request, the following is a summary of the Partnership’s materiality analysis.
2
Why the Partnership believes that partnership capital is the appropriate metric to measure materiality
The Partnership was spun-off from Brookfield Asset Management on January 31, 2008. Since the spin-off, management and the Partnership’s audit committee have consistently employed partnership capital as the key metric in assessing any materiality determinations related to the Partnership’s financial statements.
In accordance with the Statements on Auditing Standards 107, Auditing Risk and Materiality in Conducting an Audit (“SAS 107”), management and the audit committee have consistently assessed various possible methods of calculating materiality. Management and the audit committee have considered, among other metrics, net income and total assets as measures for assessing materiality before ultimately concluding that partnership capital is the most appropriate basis, for the following reasons:
· The Partnership invests in capital intensive infrastructure assets that require a substantial amount of equity capital in order to fund construction as well as upgrades and expansions to its asset base. For many of the Partnership’s assets, the Partnership generates revenue under regulatory frameworks or long term contracts. The equity that the Partnership invests in its business is directly correlated to the sustainable earnings and cash flows generated by the Partnership. As a result, partnership capital is viewed by management and the audit committee to be the Partnership’s core measure under the International Financial Reporting Standards as issued by the International Accounting Standards Board (“IFRS”) for determining materiality.
· A significant aspect of the Partnership’s strategy is to make acquisitions and investments in recapitalizations and restructurings and, to the extent possible, make divestitures of non-core assets. Accordingly, the Partnership’s net income from period to period can be impacted by significant items such as the $68 million gain on the sale of Transmissions Brasileiras de Energia in 2009 and the $405 million bargain purchase price gain in relation to the merger with Prime Infrastructure (“Prime”) in 2010. Additionally, under IFRS, the Partnership recognizes fair value adjustments and mark-to-market gains and losses on derivatives in its net income. The Partnership believes that the magnitude of these items will vary considerably from year to year. As a result, the Partnership’s net income is subject to significant fluctuations and, therefore, in the opinion of both management and the Partnership’s audit committee, does not lend itself well to serving as a principal basis for determining materiality.
In assessing the materiality of the error in question, the Partnership also considered information in addition to partnership capital, including the impact of the error on net income. Specifically, the error resulted in a gain of $28 million for Fiscal 2009. Because the Partnership’s business strategy is to make investments that generate sustainable income and cash flows over the medium to long term, as opposed to generating short term transaction-related gains, the Partnership believes that its investors focus on its recurring income and cash flows, rather than transaction-related gains, when assessing its performance. As such, the Partnership believes that the relevance of these transaction-related gains, which are included in net income, is the impact of such gains upon partnership capital. In other words, transaction-related gains are analyzed by investors based on their impact on partnership capital, which in turn is used in assessing the future sustainable earnings and cash flow profile of the Partnership.
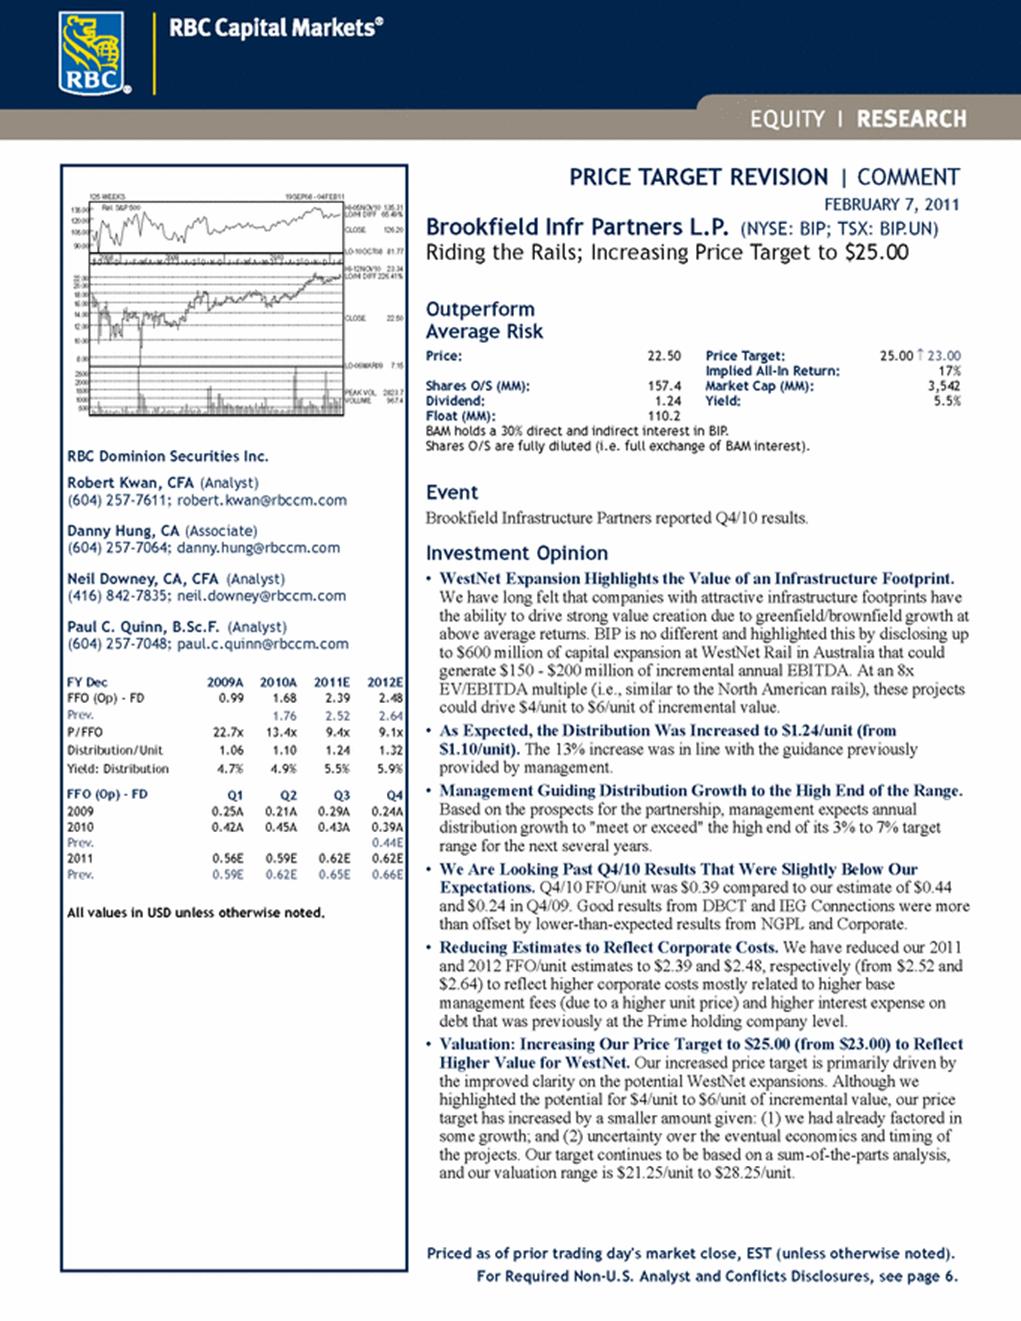
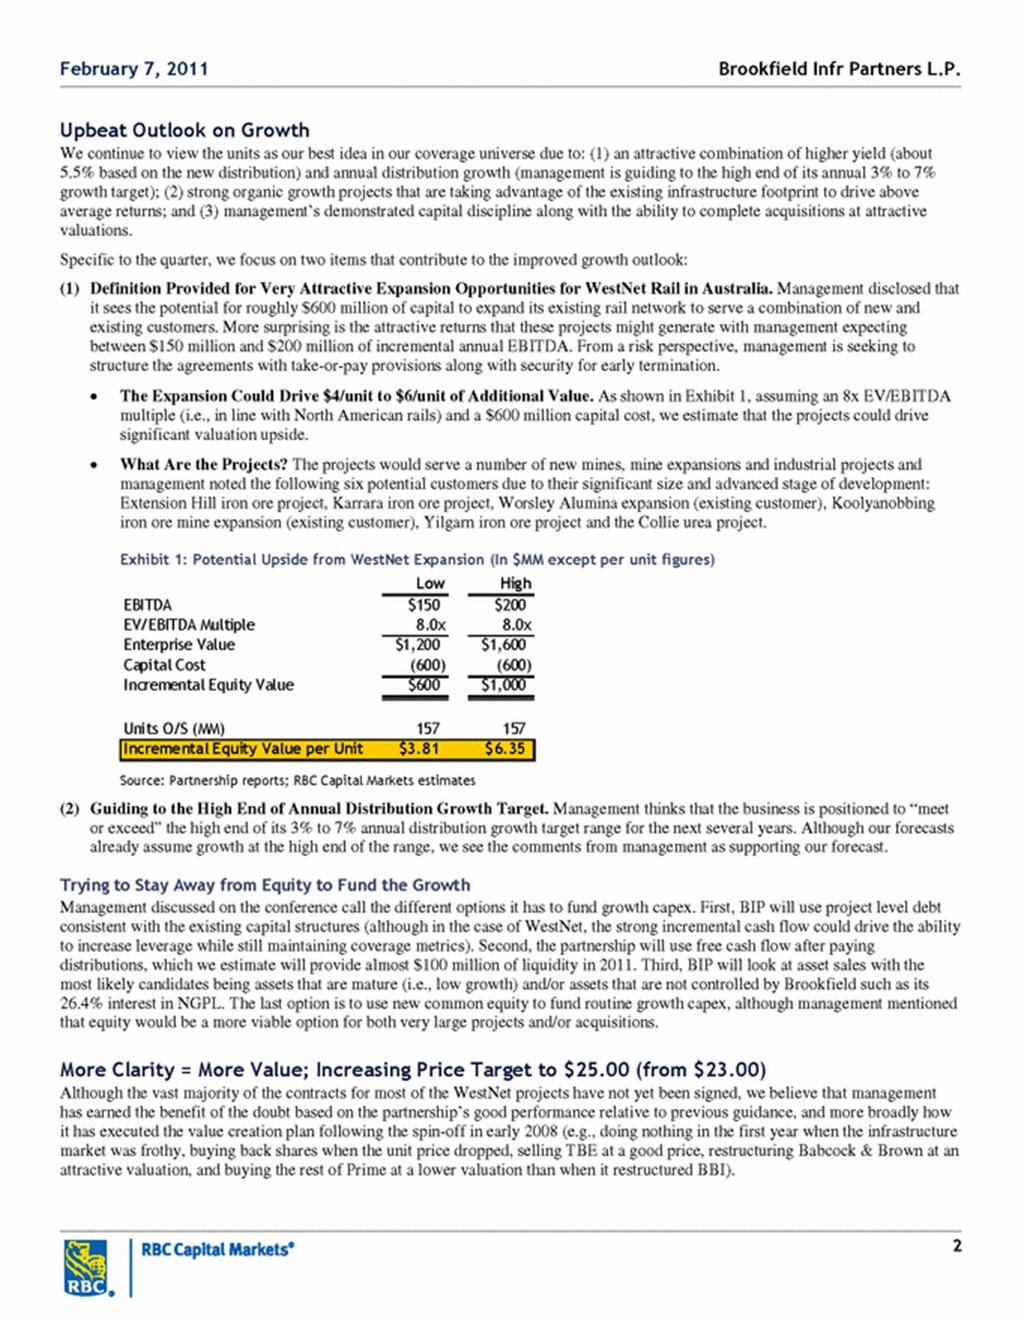
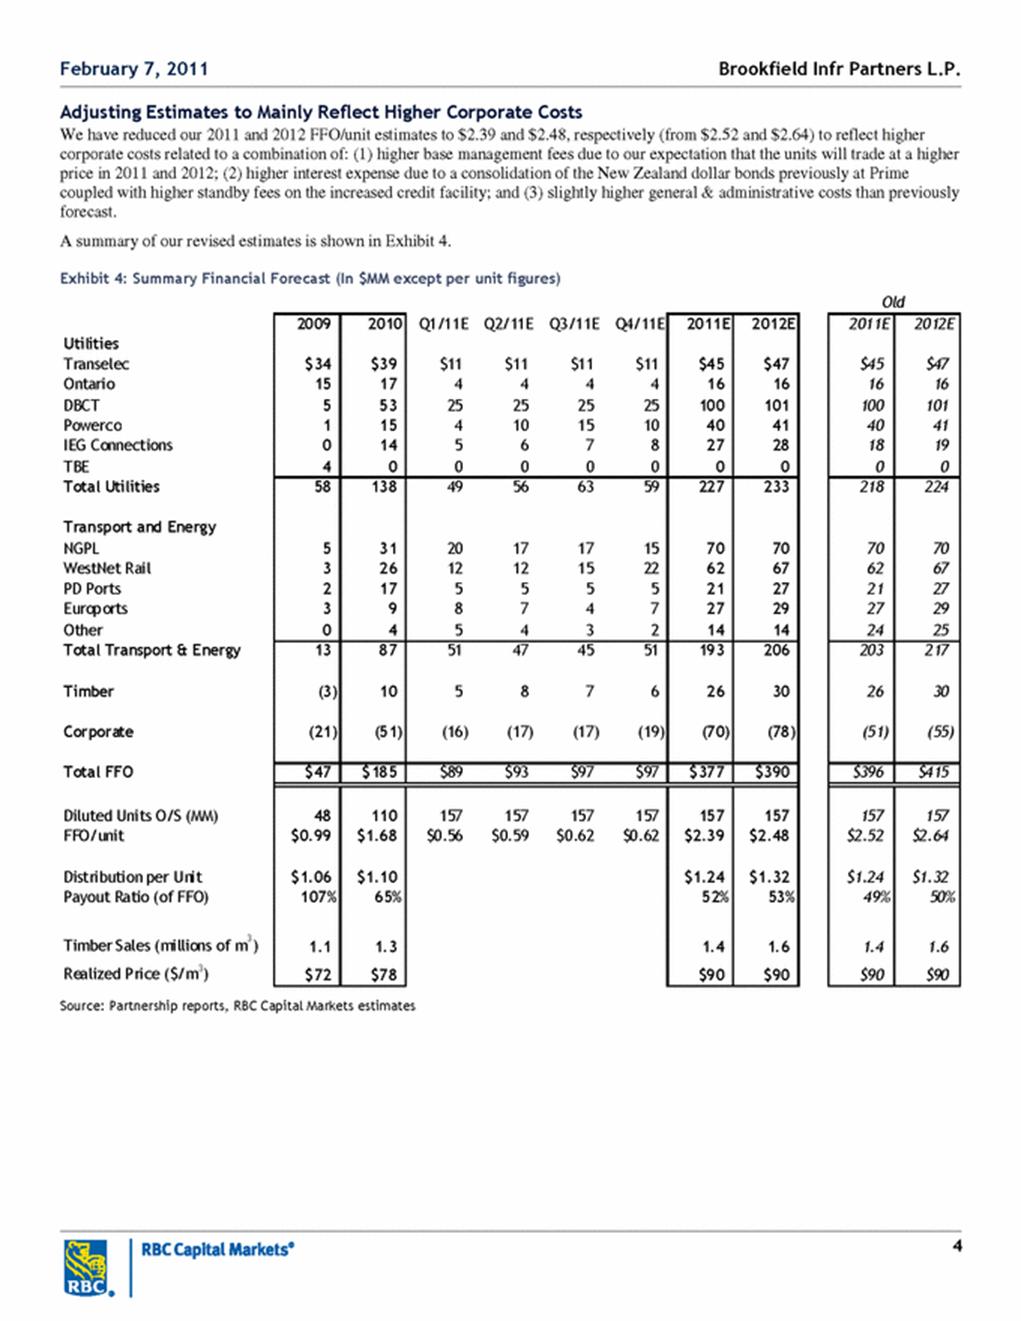
The Partnership believes that its views on the relative immateriality of the transaction-related gains is corroborated by the fact that none of the analyst reports of which the Partnership is aware (copies of which are attached to this letter as Annex A for the Staff’s benefit) published during any of the periods in question discuss or even refer to the $433 million bargain purchase gain, of which the error was a component.
3
Furthermore, an analysis of the trading price of the Partnership’s limited partnership units at the time of the first release of financial information that included the bargain purchase gain shows virtually no impact of the disclosure of the gain on the Partnership’s stock price.
The graph below compares the Partnership’s’s unit price performance to the performance of the S&P 500 and the Dow Jones Brookfield Global Infrastructure (“DJBGI”) Composite Index for the period from August 2010, the date of the announcement of the Partnership’s’s merger with Prime, to March 2011, the date of the release of the Partnership’s’s 2010 annual financial results. The Partnership respectfully submits that in comparing the Partnership’s’s unit price performance to the performance of the S&P 500 and DJBGI over this period, the Partnership’s performance was strongly correlated to the performance of these indices, with the exception of three economic events, none of which were the result of this transaction-related gain:
· On August 22, 2010: The Partnership announced a proposed merger with Prime Infrastructure (this announcement did not contain any discussion of the bargain purchase gain)
· On November 3, 2010: The Partnership announced an expected 13% increase in its per unit distribution as part of third quarter financial results, following completion of the merger with Prime (similarly, the announcement did not contain any discussion of the bargain purchase gain); and
· On November 5, 2010: The Partnership announced that Prime security holders approved the merger with Prime (still no discussion of the bargain purchase gain)
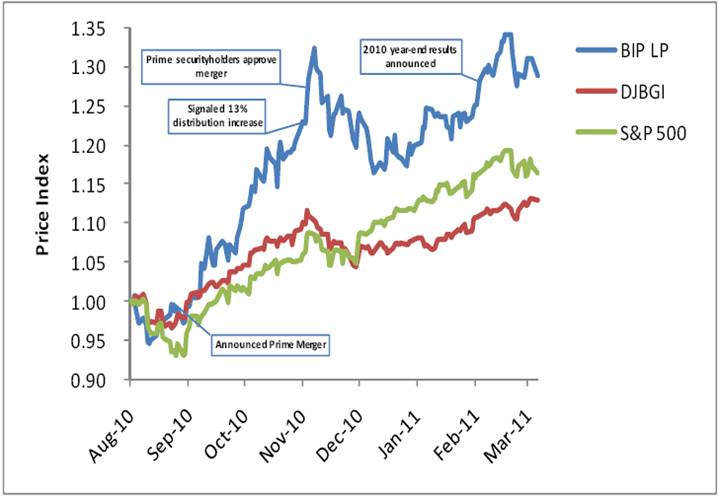
The Partnership believes that this demonstrates that investors viewed the Prime transaction as important due to its overall impact and as a demonstration of the Partnership’s ability to execute on its strategy, and not because of the impact of any related gain on its financial statements.
4
Furthermore, the Partnership respectfully submits that upon the release of the Partnership’s 2010 annual financial results on February 4, 2011, which included the first public reference to the re-measurement and bargain purchase gain in excess of $400 million, the Partnership’s trading price did not diverge meaningfully from the comparable indexes. The Partnership’s unit price increased 1% in the week following the release of annual results, compared to 1% and 2% for the S&P 500 and DJBGI, respectively, during the same period. The Partnership respectfully submits that these market observations support management’s assessment of these transaction-related gains and the manner in which they are viewed by users of the Partnership’s financial statements.
For these reasons, the Partnership believes that management and the audit committee properly focused primarily on partnership capital when considering the materiality of the error in the context of the Partnership’s financial statements taken as a whole.
Impact of the error on partnership capital and other reported key metrics
The Partnership acknowledges that its prior correspondence with the Staff regarding the error has focused on some of the qualitative analysis upon which the Partnership also based its determination of materiality in accordance with SAB 99, including certain non-GAAP measures. However, the Partnership would like to clarify that its assessment of materiality was primarily grounded in an analysis of partnership capital, a core measure under IFRS, whereas any previous discussion of other quantitative and qualitative factors was intended only to amplify the Partnership’s analysis of materiality as presented to the Staff. As noted above, for Fiscal 2009, the Partnership’s materiality threshold was $40 million or, approximately 2% of its partnership capital (currently the Partnership’s materiality is $60 million). The impact on partnership capital in Fiscal 2009 of the error at issue was $28 million, or less than 1.5% of partnership capital, and comfortably below the Partnership’s materiality threshold.
As requested by the Staff, we have outlined in the table below the impact of the error on net income, earnings per limited partnership unit and comprehensive income. However, as discussed above, given (i) the Partnership’s use of partnership capital as its primary measure and the emphasis placed on this measure by readers of its financial statements, (ii) the non-recurring nature of the error on income, (iii) the immaterial effect of the error upon an assessment of the sustainability of the Partnership’s performance in accordance with its core business strategy, and (iv) all of the other quantitative and qualitative analysis that Partnership has described in our prior correspondence with Staff, management and the audit committee, with the concurrence of its auditors, concluded that the error was not material in the context of the Partnership’s financial statements taken as a whole.
| | 2009 | |
US$ millions, except for per unit amounts | | As Presented | | Adjusted | | Change ($) | | Change (%) | |
Net loss | | (59 | ) | (31 | ) | 28 | | 48 | % |
Earnings per limited partnership unit | | 0.52 | | 1.11 | | 0.59 | | 112 | % |
Comprehensive loss | | (107 | ) | (79 | ) | 28 | | 26 | % |
| | 2010 | |
US$ millions, except for per unit amounts | | As Presented | | Adjusted | | Change ($) | | Change (%) | |
Net income | | 501 | | 473 | | (28 | ) | -6 | % |
Earnings per limited partnership unit | | 4.17 | | 3.92 | | (0.25 | ) | -6 | % |
Comprehensive income | | 606 | | 578 | | (28 | ) | -6 | % |
5
Nature of the error and how it was discovered
The Partnership advises the Staff that from the Partnership’s inception until (and including) the end of Fiscal 2009, the Partnership prepared financial statements in accordance with U.S. generally accepted accounting principles (“U.S. GAAP”). The Partnership’s investment in PD Ports was made through an investment in a fund that applied Investment Company accounting, in accordance with the related AICPA Audit and Accounting Guide. Under U.S. GAAP, for purposes of the Partnership’s accounting of its investment in PD Ports, the Partnership maintained this specialized basis of accounting of the fund in accordance with the guidance set forth under EITF 85-12 “Retention of Specialized Accounting for Investments in Consolidation”. On this basis, the error had no impact upon the Partnership’s financial statements for Fiscal 2009.
When the Partnership transitioned to IFRS during the year ended December 31, 2010 (“Fiscal 2010”), it was required to complete a purchase price allocation exercise (which, among other things, valued all of the Partnership’s assets and liabilities on an individual basis). The Partnership’s use of purchase price accounting in accordance with IFRS necessarily differed considerably from the original recognition of the investment in PD Ports in 2009 under U.S. GAAP, since the Partnership was required to account for the investment as a consolidated subsidiary, rather than using the enterprise value approach that had been applied under U.S. GAAP. The main components of these differences, which were discovered only in the latter part of 2010 are explained as follows:
· The first adjustment related to the revaluation of the assets and liabilities of PD Ports, and was due in large part to a transposition error that occurred when that entity’s securitized debt was fair valued for purposes of the purchase price allocation. By way of background, PD Ports has listed securitized debt, of which two tranches were outstanding at the November 2009 acquisition date. These consisted of A2 notes with a nominal value of £145 million and B notes with a nominal value of £70 million. As part of the fair value exercise to establish the acquisition balance sheet, these notes were revalued to their market value based on prices the Partnership obtained from Bloomberg trading screens. The prices obtained were 80.53 pence for the A2 notes and 126.27 pence for the B notes. These prices were input into a spreadsheet to calculate the premium (or discount) to market value. The prices were correctly allocated to the applicable notes, with 80.53 pence attributed to the A2 notes and 126.27 pence attributed to the B notes. However, the nominal values of the two tranches were incorrectly transposed in the spreadsheet columns so that the A2 notes were shown as having £70 million outstanding and the B notes as having £145 million outstanding. In October 2010, PD Ports purchased approximately £5.3 million of the B Notes in the open market at a discount to par. As a result of this purchase, the Partnership was required to compute the profit between the purchase price and its carrying value, so that the applicable premium (or discount) in respect of the purchased notes could be taken into income. In making this computation, management returned to the spreadsheet that had been used to compute the original valuation and immediately identified the fact that the amounts for the two tranches of notes had been incorrectly transposed.
· The second adjustment related to a failure to record a tax amortization benefit (“TAB”) upon completion of the fair value work relating to PD Ports’ intangible assets, in accordance with business combination rules set forth under IFRS 3. This fair value measurement recognizes the benefit that a future buyer would receive as a result of the tax-deductible expense generated from the amortization of intangibles. This error was also detected during the fourth quarter of 2010
6
while the management team was in the process of completing the company’s statutory financial statements.
The Partnership concluded that, since these adjustments were not material, they should be recorded in the Fiscal 2010 financial statements as a remeasurement gain instead of being recast to its 2009 comparative financial statements. As discussed with the Staff, in hindsight, the amount would have been more properly described as an immaterial error when recorded in the Fiscal 2010 financial statements.
Conclusion and proposed treatment in 2011 Form 20-F
For the reasons discussed above, the Partnership continues to believe that the amount of these adjustments is not material, and that the Partnership should not, therefore, be required to restate its historical financial statements to address them. However, the Partnership acknowledges the Staff’s comment and also acknowledges that disclosure concerning this transaction could be improved to make the disclosure more clear to users of the Partnership’s financial statements. The Partnership, therefore, proposes to include in its Form 20-F for the year ended December 31, 2011, the disclosure included in Annex B to this response letter, which would reflect the relevant adjustments as immaterial prior period corrections of immaterial errors.
*****
The Partnership, in response to the request contained in the Staff’s comments, hereby acknowledges that:
· The Partnership is responsible for the adequacy and accuracy of the disclosure in the filings;
· Staff comments or changes to disclosure in response to Staff comments do not foreclose the Commission from taking any action with respect to the filings; and
· The Partnership may not assert Staff comments as a defense in any proceeding initiated by the Commission or any person under the federal securities laws of the United States.
If there are additional comments or questions, please do not hesitate to contact the undersigned at (212) 310-8165.
Very truly yours, | |
| |
/s/ Matthew D. Bloch | |
| |
Matthew D. Bloch | |
cc: | Sam Pollock |
| John Stinebaugh |
7
Annex A
Analyst reports attached
| PRICE TARGET REVISION | COMMENT FEBRUARY 7, 2011 Brookfield Infr Partners L.P. (NYSE: BIP; TSX: BIP.UN) Riding the Rails; Increasing Price Target to $25.00 Outperform Average Risk Price: 22.50 Shares O/S (MM): 157.4 Dividend: 1.24 Float (MM): 110.2 Price Target: 25.00 23.00 Implied All-In Return: 17% Market Cap (MM): 3,542 Yield: 5.5% BAM holds a 30% direct and indirect interest in BIP. Shares O/S are fully diluted (i.e. full exchange of BAM interest). Event Brookfield Infrastructure Partners reported Q4/10 results. Investment Opinion • WestNet Expansion Highlights the Value of an Infrastructure Footprint. We have long felt that companies with attractive infrastructure footprints have the ability to drive strong value creation due to greenfield/brownfield growth at above average returns. BIP is no different and highlighted this by disclosing up to $600 million of capital expansion at WestNet Rail in Australia that could generate $150 - $200 million of incremental annual EBITDA. At an 8x EV/EBITDA multiple (i.e., similar to the North American rails), these projects could drive $4/unit to $6/unit of incremental value. • As Expected, the Distribution Was Increased to $1.24/unit (from $1.10/unit). The 13% increase was in line with the guidance previously provided by management. • Management Guiding Distribution Growth to the High End of the Range. Based on the prospects for the partnership, management expects annual distribution growth to "meet or exceed" the high end of its 3% to 7% target range for the next several years. • We Are Looking Past Q4/10 Results That Were Slightly Below Our Expectations. Q4/10 FFO/unit was $0.39 compared to our estimate of $0.44 and $0.24 in Q4/09. Good results from DBCT and IEG Connections were more than offset by lower-than-expected results from NGPL and Corporate. • Reducing Estimates to Reflect Corporate Costs. We have reduced our 2011 and 2012 FFO/unit estimates to $2.39 and $2.48, respectively (from $2.52 and $2.64) to reflect higher corporate costs mostly related to higher base management fees (due to a higher unit price) and higher interest expense on debt that was previously at the Prime holding company level. • Valuation: Increasing Our Price Target to $25.00 (from $23.00) to Reflect Higher Value for WestNet. Our increased price target is primarily driven by the improved clarity on the potential WestNet expansions. Although we highlighted the potential for $4/unit to $6/unit of incremental value, our price target has increased by a smaller amount given: (1) we had already factored in some growth; and (2) uncertainty over the eventual economics and timing of the projects. Our target continues to be based on a sum-of-the-parts analysis, and our valuation range is $21.25/unit to $28.25/unit. Priced as of prior trading day's market close, EST (unless otherwise noted). 125 WEEKS 19SEP08 - 04FEB11 8.00 10.00 12.00 14.00 16.00 18.00 20.00 22.00 S O N 2008 D J F M A M J J A S O N 2009 D J F M A M J J A S O N 2010 D J F HI-12NOV10 23.34 LO/HI DIFF 226.41% CLOSE 22.50 LO-06MAR09 7.15 500 1000 1500 2000 2500 PEAK VOL. 2823.7 VOLUME 967.4 90.00 105.00 120.00 135.00 Rel. S&P 500 HI-05NOV10 135.31 LO/HI DIFF 65.49% CLOSE 126.20 LO-10OCT08 81.77 RBC Dominion Securities Inc. Robert Kwan, CFA (Analyst) (604) 257-7611; robert.kwan@rbccm.com Danny Hung, CA (Associate) (604) 257-7064; danny.hung@rbccm.com Neil Downey, CA, CFA (Analyst) (416) 842-7835; neil.downey@rbccm.com Paul C. Quinn, B.Sc.F. (Analyst) (604) 257-7048; paul.c.quinn@rbccm.com FY Dec 2009A 2010A 2011E 2012E FFO (Op) - FD 0.99 1.68 2.39 2.48 Prev. 1.76 2.52 2.64 P/FFO 22.7x 13.4x 9.4x 9.1x Distribution/Unit 1.06 1.10 1.24 1.32 Yield: Distribution 4.7% 4.9% 5.5% 5.9% FFO (Op) - FD Q1 Q2 Q3 Q4 2009 0.25A 0.21A 0.29A 0.24A 2010 0.42A 0.45A 0.43A 0.39A Prev. 0.44E 2011 0.56E 0.59E 0.62E 0.62E Prev. 0.59E 0.62E 0.65E 0.66E All values in USD unless otherwise noted. For Required Non-U.S. Analyst and Conflicts Disclosures, see page 6. |
| 2 Upbeat Outlook on Growth We continue to view the units as our best idea in our coverage universe due to: (1) an attractive combination of higher yield (about 5.5% based on the new distribution) and annual distribution growth (management is guiding to the high end of its annual 3% to 7% growth target); (2) strong organic growth projects that are taking advantage of the existing infrastructure footprint to drive above average returns; and (3) management’s demonstrated capital discipline along with the ability to complete acquisitions at attractive valuations. Specific to the quarter, we focus on two items that contribute to the improved growth outlook: (1) Definition Provided for Very Attractive Expansion Opportunities for WestNet Rail in Australia. Management disclosed that it sees the potential for roughly $600 million of capital to expand its existing rail network to serve a combination of new and existing customers. More surprising is the attractive returns that these projects might generate with management expecting between $150 million and $200 million of incremental annual EBITDA. From a risk perspective, management is seeking to structure the agreements with take-or-pay provisions along with security for early termination. • The Expansion Could Drive $4/unit to $6/unit of Additional Value. As shown in Exhibit 1, assuming an 8x EV/EBITDA multiple (i.e., in line with North American rails) and a $600 million capital cost, we estimate that the projects could drive significant valuation upside. • What Are the Projects? The projects would serve a number of new mines, mine expansions and industrial projects and management noted the following six potential customers due to their significant size and advanced stage of development: Extension Hill iron ore project, Karrara iron ore project, Worsley Alumina expansion (existing customer), Koolyanobbing iron ore mine expansion (existing customer), Yilgarn iron ore project and the Collie urea project. Exhibit 1: Potential Upside from WestNet Expansion (In $MM except per unit figures) Low High EBITDA $150 $200 EV/EBITDA Multiple 8.0x 8.0x Enterprise Value $1,200 $1,600 Capital Cost (600) (600) Incremental Equity Value $600 $1,000 Units O/S (MM) 157 157 Incremental Equity Value per Unit $3.81 $6.35 Source: Partnership reports; RBC Capital Markets estimates (2) Guiding to the High End of Annual Distribution Growth Target. Management thinks that the business is positioned to “meet or exceed” the high end of its 3% to 7% annual distribution growth target range for the next several years. Although our forecasts already assume growth at the high end of the range, we see the comments from management as supporting our forecast. Trying to Stay Away from Equity to Fund the Growth Management discussed on the conference call the different options it has to fund growth capex. First, BIP will use project level debt consistent with the existing capital structures (although in the case of WestNet, the strong incremental cash flow could drive the ability to increase leverage while still maintaining coverage metrics). Second, the partnership will use free cash flow after paying distributions, which we estimate will provide almost $100 million of liquidity in 2011. Third, BIP will look at asset sales with the most likely candidates being assets that are mature (i.e., low growth) and/or assets that are not controlled by Brookfield such as its 26.4% interest in NGPL. The last option is to use new common equity to fund routine growth capex, although management mentioned that equity would be a more viable option for both very large projects and/or acquisitions. More Clarity = More Value; Increasing Price Target to $25.00 (from $23.00) Although the vast majority of the contracts for most of the WestNet projects have not yet been signed, we believe that management has earned the benefit of the doubt based on the partnership’s good performance relative to previous guidance, and more broadly how it has executed the value creation plan following the spin-off in early 2008 (e.g., doing nothing in the first year when the infrastructure market was frothy, buying back shares when the unit price dropped, selling TBE at a good price, restructuring Babcock & Brown at an attractive valuation, and buying the rest of Prime at a lower valuation than when it restructured BBI). Brookfield Infr Partners L.P. February 7, 2011 |

| 3 Although Exhibit 1 (above) shows the potential for $4/unit to $6/unit of value creation, we have increased our price target by a lower amount as: (1) our valuation for WestNet Rail already included some growth; and (2) we have taken a modest discount (about $1/unit) for uncertainty regarding the timing, the number of contracts signed and the overall economics. Our revised sum-of-the-parts valuation is set out in Exhibit 2. Exhibit 2: Sum-of-the-Parts Valuation (In $MM except per unit figures) Aggregate Per Unit Low High Low High Primary Valuation Methodology Utilities $1,474 $1,855 $9.00 $12.00 EV/EBITDA (10x-11x) Transport & Energy 1,918 2,302 12.00 15.00 EV/EBITDA (10.5x-11.5x; includes benef it of WestNet expansion) Timber 458 607 2.90 3.90 Per acre valuation Other 28 28 0.20 0.20 Approximate book value Equity Value of Existing Assets $3,878 $4,791 $24.10 $31.10 Fees and Administrative (628) (628) (4.00) (4.00) Expected fees and admin costs capped at 10% Net Cash (Debt) (36) (36) (0.20) (0.20) Incr. Eq. Value from Potential Acq./Investments 204 204 1.30 1.30 IRR "value added" (assumes $1 billion of annual capital deployed over 3-yrs) Equity Valuation (rounded to the nearest $0.25) $3,418 $4,331 $21.25 $28.25 Diluted Units Outstanding (MM) 157.4 157.4 Source: Partnership reports; RBC Capital Markets estimates Q4/10 Results a Bit Light, but We’re Not That Concerned Q4/10 FFO/unit was $0.39 compared to our estimate of $0.44 and $0.24 in Q4/09. Better-than-expected results from DBCT and IEG Connections were more than offset by lower-than-forecast results from NGPL, Corporate and Tas Gas/IEG Distribution. A table showing the Q4/10 results is set out in Exhibit 3. Exhibit 3: Normalized Q4/10 Results (In $MM except per unit figures) RBC CM Q4/10 Q4/10E Q4/09 2010 2009 Utilities Transelec $10 $11 $8 $39 $34 Ontario 4 4 4 17 15 DBCT 16 13 5 53 5 Powerco 5 4 1 15 1 IEG Connections 7 3 0 14 0 TBE 0 0 0 0 4 Total Utilities 42 36 18 138 58 Transport and Energy NGPL 7 9 5 31 5 WestNet Rail 6 6 3 26 3 PD Ports 5 5 2 17 2 Euroports 2 3 3 9 3 Other (1) 3 0 4 0 Total Fee-for-Service 19 26 13 87 13 Timber 2 3 (3) 10 (3) Corporate (17) (14) (10) (51) (21) Total FFO $46 $51 $19 $185 $47 Diluted Units O/S (MM) 119 115 77 110 48 FFO/unit $0.39 $0.44 $0.24 $1.68 $0.99 Timber Sales (000s of m3) 305 275 254 1,297 1,057 Realized Price ($/m3) $82 $82 $69 $78 $72 Source: Partnership reports, RBC Capital Markets estimates Brookfield Infr Partners L.P. February 7, 2011 |
| 4 Adjusting Estimates to Mainly Reflect Higher Corporate Costs We have reduced our 2011 and 2012 FFO/unit estimates to $2.39 and $2.48, respectively (from $2.52 and $2.64) to reflect higher corporate costs related to a combination of: (1) higher base management fees due to our expectation that the units will trade at a higher price in 2011 and 2012; (2) higher interest expense due to a consolidation of the New Zealand dollar bonds previously at Prime coupled with higher standby fees on the increased credit facility; and (3) slightly higher general & administrative costs than previously forecast. A summary of our revised estimates is shown in Exhibit 4. Exhibit 4: Summary Financial Forecast (In $MM except per unit figures) Old 2009 2010 Q1/11E Q2/11E Q3/11E Q4/11E 2011E 2012E 2011E 2012E Utilities Transelec $34 $39 $11 $11 $11 $11 $45 $47 $45 $47 Ontario 15 17 4 4 4 4 16 16 16 16 DBCT 5 53 25 25 25 25 100 101 100 101 Powerco 1 15 4 10 15 10 40 41 40 41 IEG Connections 0 14 5 6 7 8 27 28 18 19 TBE 4 0 0 0 0 0 0 0 0 0 Total Utilities 58 138 49 56 63 59 227 233 218 224 Transport and Energy NGPL 5 31 20 17 17 15 70 70 70 70 WestNet Rail 3 26 12 12 15 22 62 67 62 67 PD Ports 2 17 5 5 5 5 21 27 21 27 Euroports 3 9 8 7 4 7 27 29 27 29 Other 0 4 5 4 3 2 14 14 24 25 Total Transport & Energy 13 87 51 47 45 51 193 206 203 217 Timber (3) 10 5 8 7 6 26 30 26 30 Corporate (21) (51) (16) (17) (17) (19) (70) (78) (51) (55) Total FFO $47 $185 $89 $93 $97 $97 $377 $390 $396 $415 Diluted Units O/S (MM) 48 110 157 157 157 157 157 157 157 157 FFO/unit $0.99 $1.68 $0.56 $0.59 $0.62 $0.62 $2.39 $2.48 $2.52 $2.64 Distribution per Unit $1.06 $1.10 $1.24 $1.32 $1.24 $1.32 Payout Ratio (of FFO) 107% 65% 52% 53% 49% 50% Timber Sales (millions of m3) 1.1 1.3 1.4 1.6 1.4 1.6 Realized Price ($/m3) $72 $78 $90 $90 $90 $90 Source: Partnership reports, RBC Capital Markets estimates Brookfield Infr Partners L.P. February 7, 2011 |

| 5 Valuation Our $25.00 price target is based on our sum-of-the-parts analysis that separately values the Utilities, Transport & Energy, and Timber businesses. From that, we subtract the negative value associated with management and administrative costs. Our valuation range is $21.25/unit to $28.25/unit. Price Target Impediment Impediments to our price target include: (1) acquisitions that do not add value or fail to gain the confidence of investors; (2) negative regulatory/legal decisions; (3) an increase in interest rates and/or equity risk premiums; (4) tax issues; and (5) foreign exchange rates impacting the value of non-US$ generating investments. Company Description Brookfield Infrastructure Partners L.P. has a 70% interest in an infrastructure partnership, which in turn holds an indirect interest in a portfolio of investments: a 100% interest in an Ontario electric transmission company; a 17.8% interest in Transelec (electric transmission in Chile); a 37.5% interest in Island Timberlands; a 30% interest in Longview Fibre; a 71% direct and indirect interest in a coal-terminal in Australia (DBCT); a 66% direct interest in a port in the U.K. (PD Ports); and various interests in assets formerly owned by Prime Infrastructure. BIP is sponsored by Brookfield Asset Management, which holds a 30% direct and indirect interest in BIP's units. BAM provides management and administration services for the partnership. Brookfield Infr Partners L.P. February 7, 2011 |
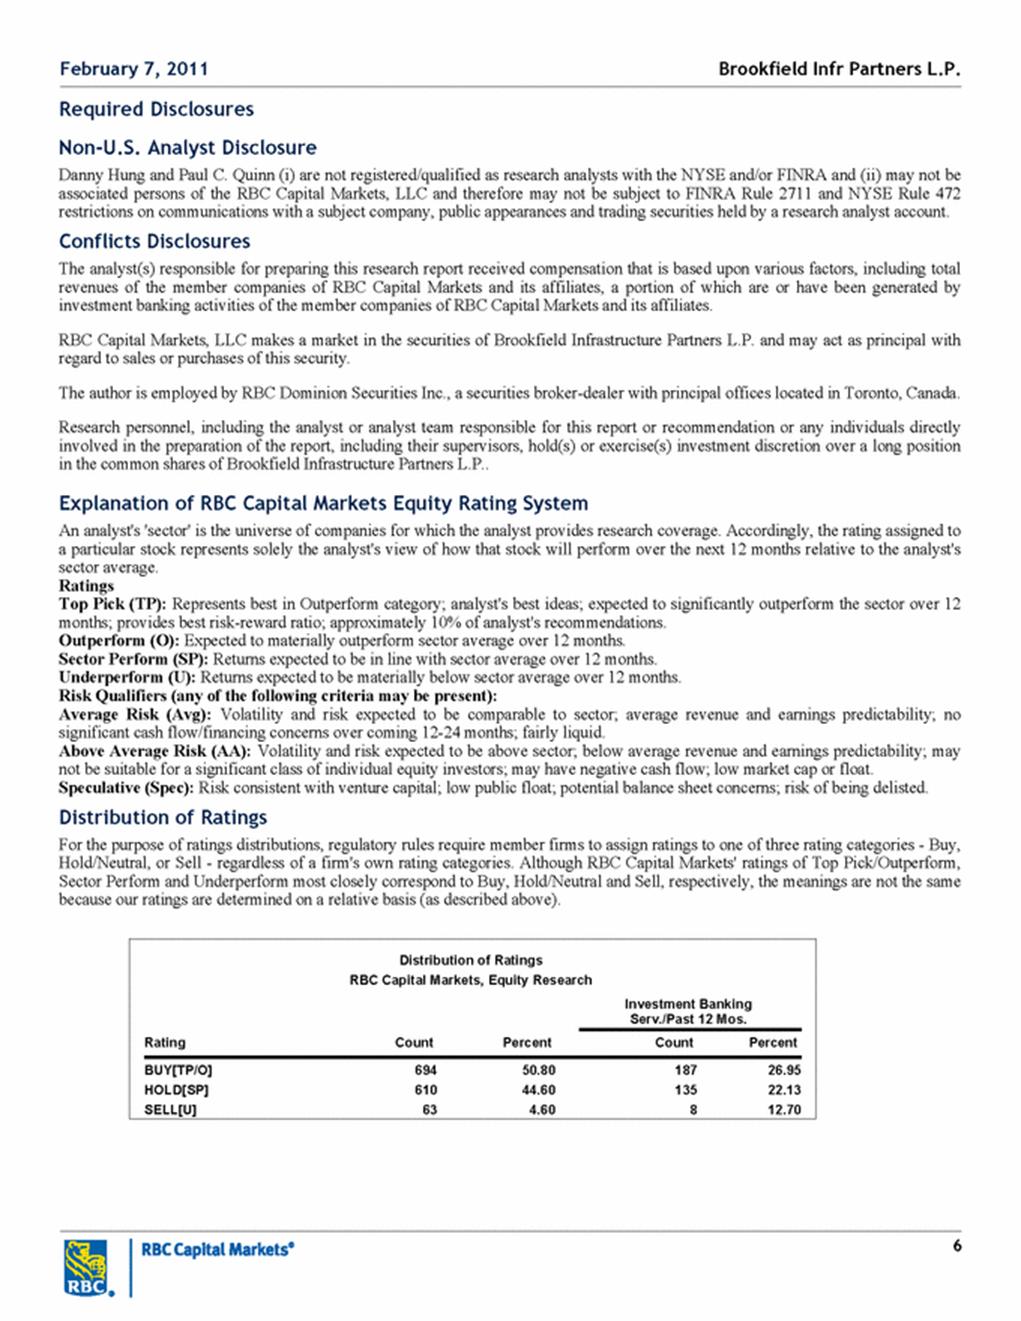
| 6 Required Disclosures Non-U.S. Analyst Disclosure Danny Hung and Paul C. Quinn (i) are not registered/qualified as research analysts with the NYSE and/or FINRA and (ii) may not be associated persons of the RBC Capital Markets, LLC and therefore may not be subject to FINRA Rule 2711 and NYSE Rule 472 restrictions on communications with a subject company, public appearances and trading securities held by a research analyst account. Conflicts Disclosures The analyst(s) responsible for preparing this research report received compensation that is based upon various factors, including total revenues of the member companies of RBC Capital Markets and its affiliates, a portion of which are or have been generated by investment banking activities of the member companies of RBC Capital Markets and its affiliates. RBC Capital Markets, LLC makes a market in the securities of Brookfield Infrastructure Partners L.P. and may act as principal with regard to sales or purchases of this security. The author is employed by RBC Dominion Securities Inc., a securities broker-dealer with principal offices located in Toronto, Canada. Research personnel, including the analyst or analyst team responsible for this report or recommendation or any individuals directly involved in the preparation of the report, including their supervisors, hold(s) or exercise(s) investment discretion over a long position in the common shares of Brookfield Infrastructure Partners L.P.. Explanation of RBC Capital Markets Equity Rating System An analyst's 'sector' is the universe of companies for which the analyst provides research coverage. Accordingly, the rating assigned to a particular stock represents solely the analyst's view of how that stock will perform over the next 12 months relative to the analyst's sector average. Ratings Top Pick (TP): Represents best in Outperform category; analyst's best ideas; expected to significantly outperform the sector over 12 months; provides best risk-reward ratio; approximately 10% of analyst's recommendations. Outperform (O): Expected to materially outperform sector average over 12 months. Sector Perform (SP): Returns expected to be in line with sector average over 12 months. Underperform (U): Returns expected to be materially below sector average over 12 months. Risk Qualifiers (any of the following criteria may be present): Average Risk (Avg): Volatility and risk expected to be comparable to sector; average revenue and earnings predictability; no significant cash flow/financing concerns over coming 12-24 months; fairly liquid. Above Average Risk (AA): Volatility and risk expected to be above sector; below average revenue and earnings predictability; may not be suitable for a significant class of individual equity investors; may have negative cash flow; low market cap or float. Speculative (Spec): Risk consistent with venture capital; low public float; potential balance sheet concerns; risk of being delisted. Distribution of Ratings For the purpose of ratings distributions, regulatory rules require member firms to assign ratings to one of three rating categories - Buy, Hold/Neutral, or Sell - regardless of a firm's own rating categories. Although RBC Capital Markets' ratings of Top Pick/Outperform, Sector Perform and Underperform most closely correspond to Buy, Hold/Neutral and Sell, respectively, the meanings are not the same because our ratings are determined on a relative basis (as described above). Distribution of Ratings RBC Capital Markets, Equity Research Investment Banking Serv./Past 12 Mos. Rating Count Percent Count Percent BUY[TP/O] 694 50.80 187 26.95 HOLD[SP] 610 44.60 135 22.13 SELL[U] 63 4.60 8 12.70 Brookfield Infr Partners L.P. February 7, 2011 |
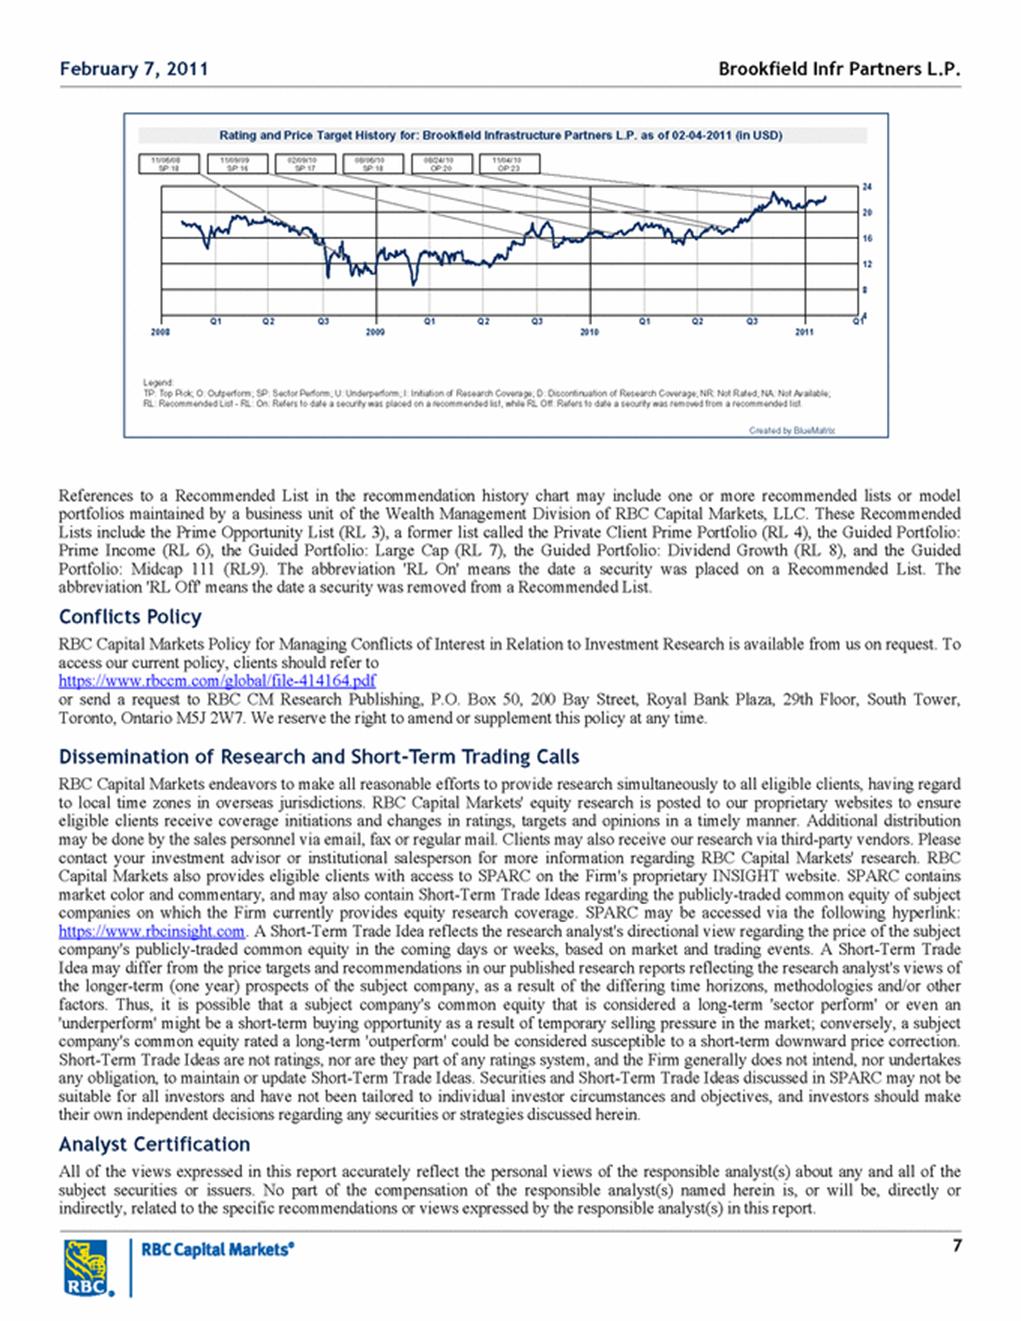
| 7 Q1 Q2 Q3 Q1 Q2 Q3 Q1 Q2 Q3 Q1 4 8 12 16 20 24 2008 2009 2010 2011 11/05/08 SP:18 11/09/09 SP:16 02/09/10 SP:17 08/05/10 SP:18 08/24/10 OP:20 11/04/10 OP:23 Rating and Price Target History for: Brookfield Infrastructure Partners L.P. as of 02-04-2011 (in USD) Legend: TP: Top Pick; O: Outperform; SP: Sector Perform; U: Underperform; I: Initiation of Research Coverage; D: Discontinuation of Research Coverage; NR: Not Rated; NA: Not Available; RL: Recommended List - RL: On: Refers to date a security was placed on a recommended list, while RL Off: Refers to date a security was removed from a recommended list. Created by BlueMatrix References to a Recommended List in the recommendation history chart may include one or more recommended lists or model portfolios maintained by a business unit of the Wealth Management Division of RBC Capital Markets, LLC. These Recommended Lists include the Prime Opportunity List (RL 3), a former list called the Private Client Prime Portfolio (RL 4), the Guided Portfolio: Prime Income (RL 6), the Guided Portfolio: Large Cap (RL 7), the Guided Portfolio: Dividend Growth (RL 8), and the Guided Portfolio: Midcap 111 (RL9). The abbreviation 'RL On' means the date a security was placed on a Recommended List. The abbreviation 'RL Off' means the date a security was removed from a Recommended List. Conflicts Policy RBC Capital Markets Policy for Managing Conflicts of Interest in Relation to Investment Research is available from us on request. To access our current policy, clients should refer to https://www.rbccm.com/global/file-414164.pdf or send a request to RBC CM Research Publishing, P.O. Box 50, 200 Bay Street, Royal Bank Plaza, 29th Floor, South Tower, Toronto, Ontario M5J 2W7. We reserve the right to amend or supplement this policy at any time. Dissemination of Research and Short-Term Trading Calls RBC Capital Markets endeavors to make all reasonable efforts to provide research simultaneously to all eligible clients, having regard to local time zones in overseas jurisdictions. RBC Capital Markets' equity research is posted to our proprietary websites to ensure eligible clients receive coverage initiations and changes in ratings, targets and opinions in a timely manner. Additional distribution may be done by the sales personnel via email, fax or regular mail. Clients may also receive our research via third-party vendors. Please contact your investment advisor or institutional salesperson for more information regarding RBC Capital Markets' research. RBC Capital Markets also provides eligible clients with access to SPARC on the Firm's proprietary INSIGHT website. SPARC contains market color and commentary, and may also contain Short-Term Trade Ideas regarding the publicly-traded common equity of subject companies on which the Firm currently provides equity research coverage. SPARC may be accessed via the following hyperlink: https://www.rbcinsight.com. A Short-Term Trade Idea reflects the research analyst's directional view regarding the price of the subject company's publicly-traded common equity in the coming days or weeks, based on market and trading events. A Short-Term Trade Idea may differ from the price targets and recommendations in our published research reports reflecting the research analyst's views of the longer-term (one year) prospects of the subject company, as a result of the differing time horizons, methodologies and/or other factors. Thus, it is possible that a subject company's common equity that is considered a long-term 'sector perform' or even an 'underperform' might be a short-term buying opportunity as a result of temporary selling pressure in the market; conversely, a subject company's common equity rated a long-term 'outperform' could be considered susceptible to a short-term downward price correction. Short-Term Trade Ideas are not ratings, nor are they part of any ratings system, and the Firm generally does not intend, nor undertakes any obligation, to maintain or update Short-Term Trade Ideas. Securities and Short-Term Trade Ideas discussed in SPARC may not be suitable for all investors and have not been tailored to individual investor circumstances and objectives, and investors should make their own independent decisions regarding any securities or strategies discussed herein. Analyst Certification All of the views expressed in this report accurately reflect the personal views of the responsible analyst(s) about any and all of the subject securities or issuers. No part of the compensation of the responsible analyst(s) named herein is, or will be, directly or indirectly, related to the specific recommendations or views expressed by the responsible analyst(s) in this report. Brookfield Infr Partners L.P. February 7, 2011 |
| 8 Disclaimer RBC Capital Markets is the business name used by certain subsidiaries of Royal Bank of Canada, including RBC Dominion Securities Inc., RBC Capital Markets, LLC, Royal Bank of Canada Europe Limited and Royal Bank of Canada - Sydney Branch. The information contained in this report has been compiled by RBC Capital Markets from sources believed to be reliable, but no representation or warranty, express or implied, is made by Royal Bank of Canada, RBC Capital Markets, its affiliates or any other person as to its accuracy, completeness or correctness. All opinions and estimates contained in this report constitute RBC Capital Markets' judgement as of the date of this report, are subject to change without notice and are provided in good faith but without legal responsibility. Nothing in this report constitutes legal, accounting or tax advice or individually tailored investment advice. This material is prepared for general circulation to clients and has been prepared without regard to the individual financial circumstances and objectives of persons who receive it. The investments or services contained in this report may not be suitable for you and it is recommended that you consult an independent investment advisor if you are in doubt about the suitability of such investments or services. This report is not an offer to sell or a solicitation of an offer to buy any securities. Past performance is not a guide to future performance, future returns are not guaranteed, and a loss of original capital may occur. RBC Capital Markets research analyst compensation is based in part on the overall profitability of RBC Capital Markets, which includes profits attributable to investment banking revenues. Every province in Canada, state in the U.S., and most countries throughout the world have their own laws regulating the types of securities and other investment products which may be offered to their residents, as well as the process for doing so. As a result, the securities discussed in this report may not be eligible for sale in some jurisdictions. This report is not, and under no circumstances should be construed as, a solicitation to act as securities broker or dealer in any jurisdiction by any person or company that is not legally permitted to carry on the business of a securities broker or dealer in that jurisdiction. To the full extent permitted by law neither RBC Capital Markets nor any of its affiliates, nor any other person, accepts any liability whatsoever for any direct or consequential loss arising from any use of this report or the information contained herein. No matter contained in this document may be reproduced or copied by any means without the prior consent of RBC Capital Markets. Additional information is available on request. To U.S. Residents: This publication has been approved by RBC Capital Markets, LLC (member FINRA, NYSE), which is a U.S. registered broker-dealer and which accepts responsibility for this report and its dissemination in the United States. Any U.S. recipient of this report that is not a registered broker-dealer or a bank acting in a broker or dealer capacity and that wishes further information regarding, or to effect any transaction in, any of the securities discussed in this report, should contact and place orders with RBC Capital Markets, LLC. To Canadian Residents: This publication has been approved by RBC Dominion Securities Inc.(member IIROC). Any Canadian recipient of this report that is not a Designated Institution in Ontario, an Accredited Investor in British Columbia or Alberta or a Sophisticated Purchaser in Quebec (or similar permitted purchaser in any other province) and that wishes further information regarding, or to effect any transaction in, any of the securities discussed in this report should contact and place orders with RBC Dominion Securities Inc., which, without in any way limiting the foregoing, accepts responsibility for this report and its dissemination in Canada. To U.K. Residents: This publication has been approved by Royal Bank of Canada Europe Limited ('RBCEL') which is authorized and regulated by Financial ServicesAuthority ('FSA'), in connection with its distribution in the United Kingdom. This material is not for general distribution in the United Kingdom to retail clients, as defined under the rules of the FSA. However, targeted distribution may be made to selected retail clients of RBC and its affiliates. RBCEL accepts responsibility for this report and its dissemination in the United Kingdom. To Persons Receiving This Advice in Australia: This material has been distributed in Australia by Royal Bank of Canada - Sydney Branch (ABN 86 076 940 880, AFSL No. 246521). This material has been prepared for general circulation and does not take into account the objectives, financial situation or needs of any recipient. Accordingly, any recipient should, before acting on this material, consider the appropriateness of this material having regard to their objectives, financial situation and needs. If this material relates to the acquisition or possible acquisition of a particular financial product, a recipient in Australia should obtain any relevant disclosure document prepared in respect of that product and consider that document before making any decision about whether to acquire the product. To Hong Kong Residents: This publication is distributed in Hong Kong by RBC Investment Services (Asia) Limited and RBC Investment Management (Asia) Limited, licensed corporations under the Securities and Futures Ordinance or, by Royal Bank of Canada, Hong Kong Branch, a registered institution under the Securities and Futures Ordinance. This material has been prepared for general circulation and does not take into account the objectives, financial situation, or needs of any recipient. Hong Kong persons wishing to obtain further information on any of the securities mentioned in this publication should contact RBC Investment Services (Asia) Limited, RBC Investment Management (Asia) Limited or Royal Bank of Canada, Hong Kong Branch at 17/Floor, Cheung Kong Center, 2 Queen's Road Central, Hong Kong (telephone number is 2848-1388). To Singapore Residents: This publication is distributed in Singapore by RBC (Singapore Branch) and RBC (Asia) Limited, registered entities granted offshore bank status by the Monetary Authority of Singapore. This material has been prepared for general circulation and does not take into account the objectives, financial situation, or needs of any recipient. You are advised to seek independent advice from a financial adviser before purchasing any product. If you do not obtain independent advice, you should consider whether the product is suitable for you. Past performance is not indicative of future performance. .® Registered trademark of Royal Bank of Canada. RBC Capital Markets is a trademark of Royal Bank of Canada. Used under license. Copyright © RBC Capital Markets, LLC 2011 - Member SIPC Copyright © RBC Dominion Securities Inc. 2011 - Member CIPF Copyright © Royal Bank of Canada Europe Limited 2011 Copyright © Royal Bank of Canada 2011 All rights reserved Brookfield Infr Partners L.P. February 7, 2011 |
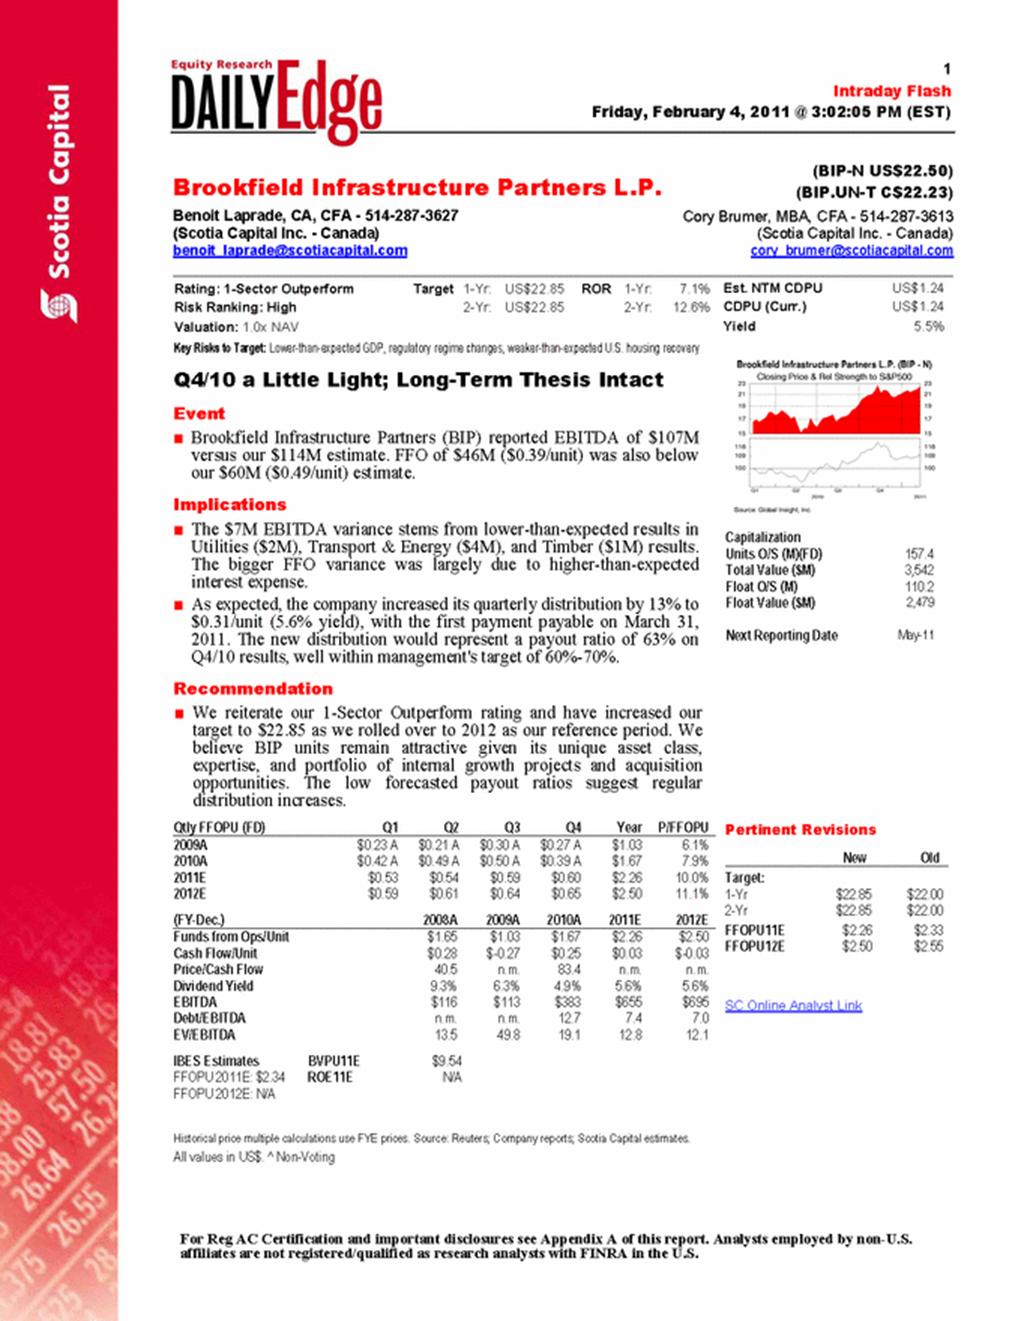
| Intraday Flash Friday, February 4, 2011 @ 3:02:05 PM (EST) Brookfield Infrastructure Partners L.P. (BIP-N US$22.50) (BIP.UN-T C$22.23) Benoit Laprade, CA, CFA - 514-287-3627 (Scotia Capital Inc. - Canada) benoit_laprade@scotiacapital.com Cory Brumer, MBA, CFA - 514-287-3613 (Scotia Capital Inc. - Canada) cory_brumer@scotiacapital.com Rating: 1-Sector Outperform Target 1-Yr: US$22.85 ROR 1-Yr: 7.1% Risk Ranking: High 2-Yr: US$22.85 2-Yr: 12.6% Valuation: 1.0x NAV ey Risks to Target: Lower-than-expected GDP, regulatory regime changes, weaker-than-expected U.S. housing recovery K Est. NTM CDPU US$1.24 CDPU (Curr.) US$1.24 Yield 5.5% Q4/10 a Little Light; Long-Term Thesis Intact Capitalization Units O/S (M)(FD) 157.4 Total Value ($M) 3,542 Float O/S (M) 110.2 Float Value ($M) 2,479 ext Reporting Date May-11 N Event ¦ Brookfield Infrastructure Partners (BIP) reported EBITDA of $107M versus our $114M estimate. FFO of $46M ($0.39/unit) was also below our $60M ($0.49/unit) estimate. Implications ¦ The $7M EBITDA variance stems from lower-than-expected results in Utilities ($2M), Transport & Energy ($4M), and Timber ($1M) results. The bigger FFO variance was largely due to higher-than-expected interest expense. ¦ As expected, the company increased its quarterly distribution by 13% to $0.31/unit (5.6% yield), with the first payment payable on March 31, 2011. The new distribution would represent a payout ratio of 63% on Q4/10 results, well within management's target of 60%-70%. Recommendation ¦ We reiterate our 1-Sector Outperform rating and have increased our target to $22.85 as we rolled over to 2012 as our reference period. We believe BIP units remain attractive given its unique asset class, expertise, and portfolio of internal growth projects and acquisition opportunities. The low forecasted payout ratios suggest regular distribution increases. Qtly FFOPU (FD) Q1 Q2 Q3 Q4 Year P/FFOPU Pertinent Revisions New Old Target: 1-Yr $22.85 $22.00 2-Yr $22.85 $22.00 FFOPU11E $2.26 $2.33 FFOPU12E $2.50 $2.55 SC Online Analyst Link 2009A $0.23 A $0.21 A $0.30 A $0.27 A $1.03 6.1% 2010A $0.42 A $0.49 A $0.50 A $0.39 A $1.67 7.9% 2011E $0.53 $0.54 $0.59 $0.60 $2.26 10.0% 2012E $0.59 $0.61 $0.64 $0.65 $2.50 11.1% (FY-Dec.) 2008A 2009A 2010A 2011E 2012E Funds from Ops/Unit $1.65 $1.03 $1.67 $2.26 $2.50 Cash Flow/Unit $0.28 $-0.27 $0.25 $0.03 $-0.03 Price/Cash Flow 40.5 n.m. 83.4 n.m. n.m. Dividend Yield 9.3% 6.3% 4.9% 5.6% 5.6% EBITDA $116 $113 $383 $655 $695 Debt/EBITDA n.m. n.m. 12.7 7.4 7.0 EV/EBITDA 13.5 49.8 19.1 12.8 12.1 IBES Estimates BVPU11E $9.54 FFOPU 2011E: $2.34 ROE11E N/A FFOPU 2012E: N/A Historical price multiple calculations use FYE prices. Source: Reuters; Company reports; Scotia Capital estimates. All values in US$. ^ Non-Voting Exhibit 1 - Segmented FFO ($M) Q4/10 Q3/10 Q4/09 Utilities 42 37 20 Transport & Energy 19 20 13 Timber 2 0 -3 Corporate & Other -17 -11 -10 Total ANOI 46 46 20 For Reg AC Certification and important disclosures see Appendix A of this report. Analysts employed by non-U.S. affiliates are not registered/qualified as research analysts with FINRA in the U.S. |
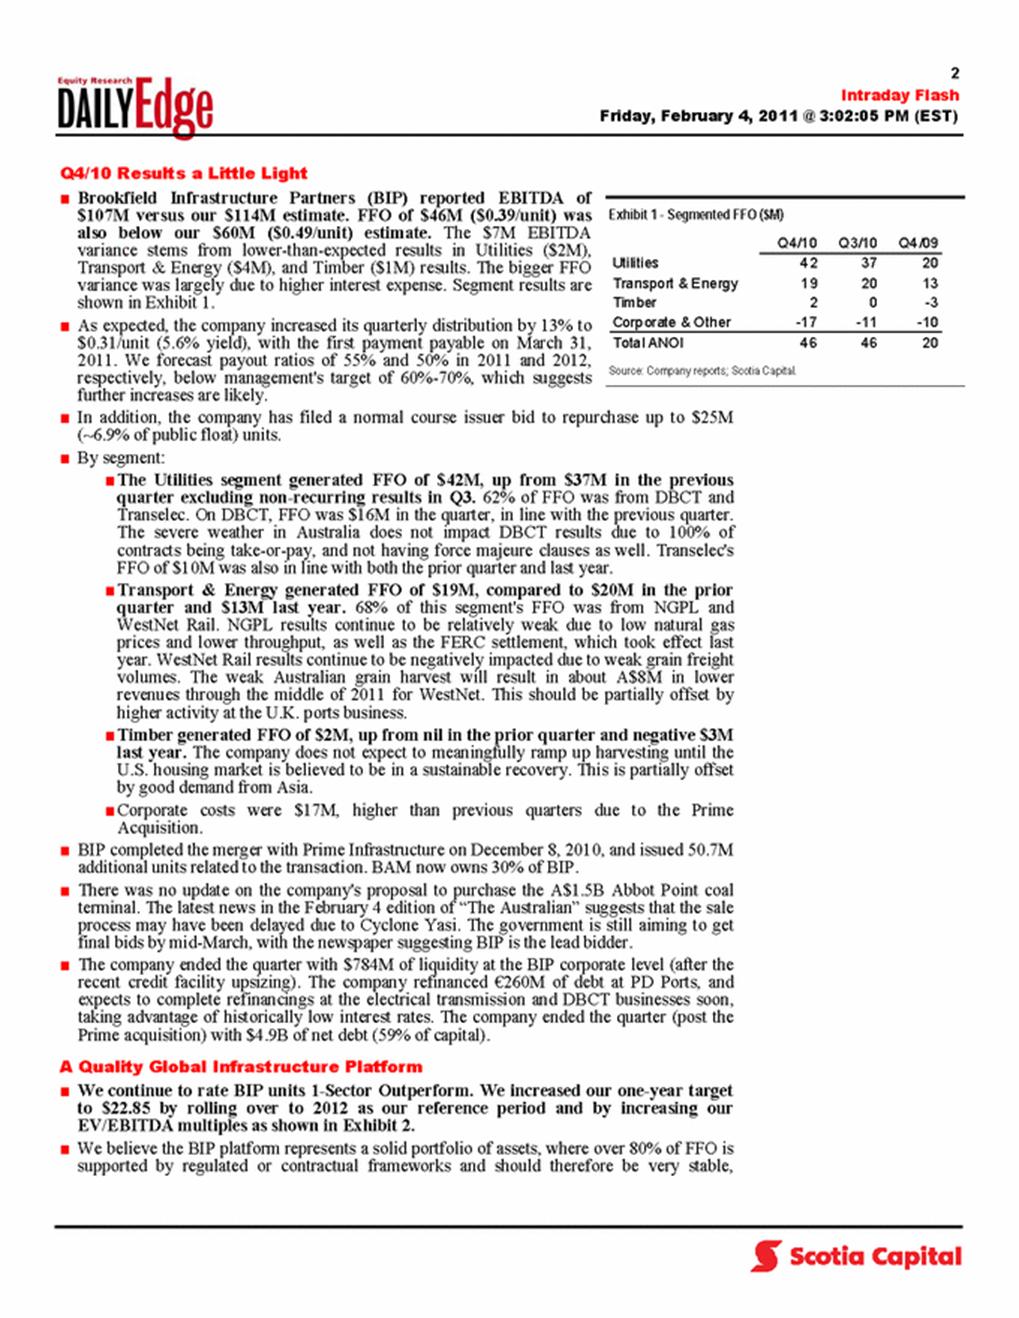
| Q4/10 Results a Little Light ¦ Brookfield Infrastructure Partners (BIP) reported EBITDA of $107M versus our $114M estimate. FFO of $46M ($0.39/unit) was also below our $60M ($0.49/unit) estimate. The $7M EBITDA variance stems from lower-than-expected results in Utilities ($2M), Transport & Energy ($4M), and Timber ($1M) results. The bigger FFO variance was largely due to higher interest expense. Segment results are shown in Exhibit 1. ¦ As expected, the company increased its quarterly distribution by 13% to $0.31/unit (5.6% yield), with the first payment payable on March 31, 2011. We forecast payout ratios of 55% and 50% in 2011 and 2012, respectively, below management's target of 60%-70%, which suggests further increases are likely. ¦ In addition, the company has filed a normal course issuer bid to repurchase up to $25M (~6.9% of public float) units. ¦ By segment: ¦ The Utilities segment generated FFO of $42M, up from $37M in the previous quarter excluding non-recurring results in Q3. 62% of FFO was from DBCT and Transelec. On DBCT, FFO was $16M in the quarter, in line with the previous quarter. The severe weather in Australia does not impact DBCT results due to 100% of contracts being take-or-pay, and not having force majeure clauses as well. Transelec's FFO of $10M was also in line with both the prior quarter and last year. ¦ Transport & Energy generated FFO of $19M, compared to $20M in the prior quarter and $13M last year. 68% of this segment's FFO was from NGPL and WestNet Rail. NGPL results continue to be relatively weak due to low natural gas prices and lower throughput, as well as the FERC settlement, which took effect last year. WestNet Rail results continue to be negatively impacted due to weak grain freight volumes. The weak Australian grain harvest will result in about A$8M in lower revenues through the middle of 2011 for WestNet. This should be partially offset by higher activity at the U.K. ports business. ¦ Timber generated FFO of $2M, up from nil in the prior quarter and negative $3M last year. The company does not expect to meaningfully ramp up harvesting until the U.S. housing market is believed to be in a sustainable recovery. This is partially offset by good demand from Asia. ¦ Corporate costs were $17M, higher than previous quarters due to the Prime Acquisition. ¦ BIP completed the merger with Prime Infrastructure on December 8, 2010, and issued 50.7M additional units related to the transaction. BAM now owns 30% of BIP. ¦ There was no update on the company's proposal to purchase the A$1.5B Abbot Point coal terminal. The latest news in the February 4 edition of “The Australian” suggests that the sale process may have been delayed due to Cyclone Yasi. The government is still aiming to get final bids by mid-March, with the newspaper suggesting BIP is the lead bidder. ¦ The company ended the quarter with $784M of liquidity at the BIP corporate level (after the recent credit facility upsizing). The company refinanced €260M of debt at PD Ports, and expects to complete refinancings at the electrical transmission and DBCT businesses soon, taking advantage of historically low interest rates. The company ended the quarter (post the Prime acquisition) with $4.9B of net debt (59% of capital). A Quality Global Infrastructure Platform ¦ We continue to rate BIP units 1-Sector Outperform. We increased our one-year target to $22.85 by rolling over to 2012 as our reference period and by increasing our EV/EBITDA multiples as shown in Exhibit 2. ¦ We believe the BIP platform represents a solid portfolio of assets, where over 80% of FFO is supported by regulated or contractual frameworks and should therefore be very stable, Exhibit 1 - Segmented FFO ($M) Source: Company reports; Scotia Capital. |

| Intraday Flash Friday, February 4, 2011 @ 3:02:05 PM (EST) supporting the new $1.24/annum distribution. Mid-single-digit distribution increases in coming years appear likely given the low forecasted payout ratios and growth prospects. ¦ The company has a number of internal and external growth projects to be pursued over the coming years. The company has a significant backlog of investment projects, including $310M in Utilities, and $506M in Transport & Energy. The latter includes $490M over the next couple of years to expand the Australian railroad capacity by 50%, to serve several new mining and other industrial projects. This could expand to $600M in coming years, potentially generating incremental EBITDA of $150M-$250M per year according to management. Other large projects could include a 40M-50M tonne expansion of the Australian coal terminal, which could potentially cost $2B (at 100% ownership), as well as acquiring the A$1.5B Abbot Point coal terminal, also in Australia. SC Online Analyst Link Exhibit 2 - BIP NAV Source: Company reports; Scotia Capital estimates. Valuation Asset Brookfield Per Per Methodology Acres Value Infrastructure L.P. Unit FX Unit ($M) (%) ($M) (US$) (C$) Island Timberlands $1,200 per acre 600,837 721.0 37.5% 270.4 1.72 1.00 1.72 Island Timberlands - HBU $4,500 per acre 33,163 149.2 37.5% 56.0 0.36 0.36 Longview Timber $2,800 per acre 655,000 1,834.0 30.0% 550.2 3.50 3.50 Timber Net Debt (460.0) (2.92) (2.92) Total Timber 416.5 2.65 2.65 2012E EBITDA (Proportionate) ($M) Utilities 11.50 x EBITDA 332 3,813.6 24.23 24.23 Utilities Net Debt (2,325.0) (14.77) (14.77) Total Utilities 1,488.6 9.46 9.46 Transport & Energy 10.75 x EBITDA 366 3938.1 25.02 25.02 Transport & Energy Net Debt (1,945.0) (12.36) (12.36) Total Transport & Energy 1993.1 12.66 12.66 Social 20 0.13 0.13 Total 3,918.2 24.89 24.89 Preferred Shares (20.0) (0.13) (0.13) Management Fees (180.0) (1.14) (1.14) Corporate Debt (122.0) (0.78) (0.78) NAV 3,596.2 22.85 22.85 |
| Intraday Flash Friday, February 4, 2011 @ 3:02:05 PM (EST) Appendix A: Important Disclosures Company Ticker Disclosures (see legend below)* I, Benoit Laprade, certify that (1) the views expressed in this report in connection with securities or issuers that I analyze accurately reflect my personal views and (2) no part of my compensation was, is, or will be directly or indirectly, related to the specific recommendations or views expressed by me in this report. This research report was prepared by employees of Scotia Capital who have the title of Analyst. All pricing of securities in reports is based on the closing price of the securities’ principal marketplace on the night before the publication date, unless otherwise explicitly stated. All Equity Research Analysts report to the Head of Equity Research. The Head of Equity Research reports to the Managing Director, Head of Institutional Equity Sales, Trading and Research, who is not and does not report to the Head of the Investment Banking Department. The Supervisory Analyst, who reviews the report prior to publication, has a dual reporting line to the Head of Equity Research and the Head of Scotia Capital Compliance. Scotia Capital has policies that are reasonably designed to prevent or control the sharing of material non-public information across internal information barriers, such as between Investment Banking and Research. The compensation of the research analyst who prepared this report is based on several factors, including but not limited to, the overall profitability of Scotia Capital and the revenues generated from its various departments, including investment banking. Furthermore, the research analyst's compensation is charged as an expense to various Scotia Capital departments, including investment banking. Research Analysts may not receive compensation from the companies they cover. Non-U.S. analysts may not be associated persons of Scotia Capital (USA) Inc. and therefore may not be subject to NASD Rule 2711 restrictions on communications with subject company, public appearances and trading securities held by the analysts. For Scotia Capital Research analyst standards and disclosure policies, please visit http://www.scotiacapital.com/disclosures Scotia Capital Research, 40 King Street West, 33rd Floor, Toronto, Ontario, M5H 1H1. * Legend |

| Intraday Flash Friday, February 4, 2011 @ 3:02:05 PM (EST) Numbers are located to the left of the lines they represent. Numbers indicated with a plus sign (+) have more than one target or rating change in the given month. Brookfield Infrastructure Partners L.P. # Date Closing Price Rating Target- 1YR 1 17-Dec-09 US$15.81 * 1-Sector Outperform *$17.00 2 16-Apr-10 US$17.62 * 2-Sector Perform $17.00 3 24-Aug-10 US$17.50 * 1-Sector Outperform *$20.00 4 7-Oct-10 US$20.02 1-Sector Outperform *$20.75 5 4-Nov-10 US$22.10 1-Sector Outperform *$22.00 * represents the value(s) that has changed. |
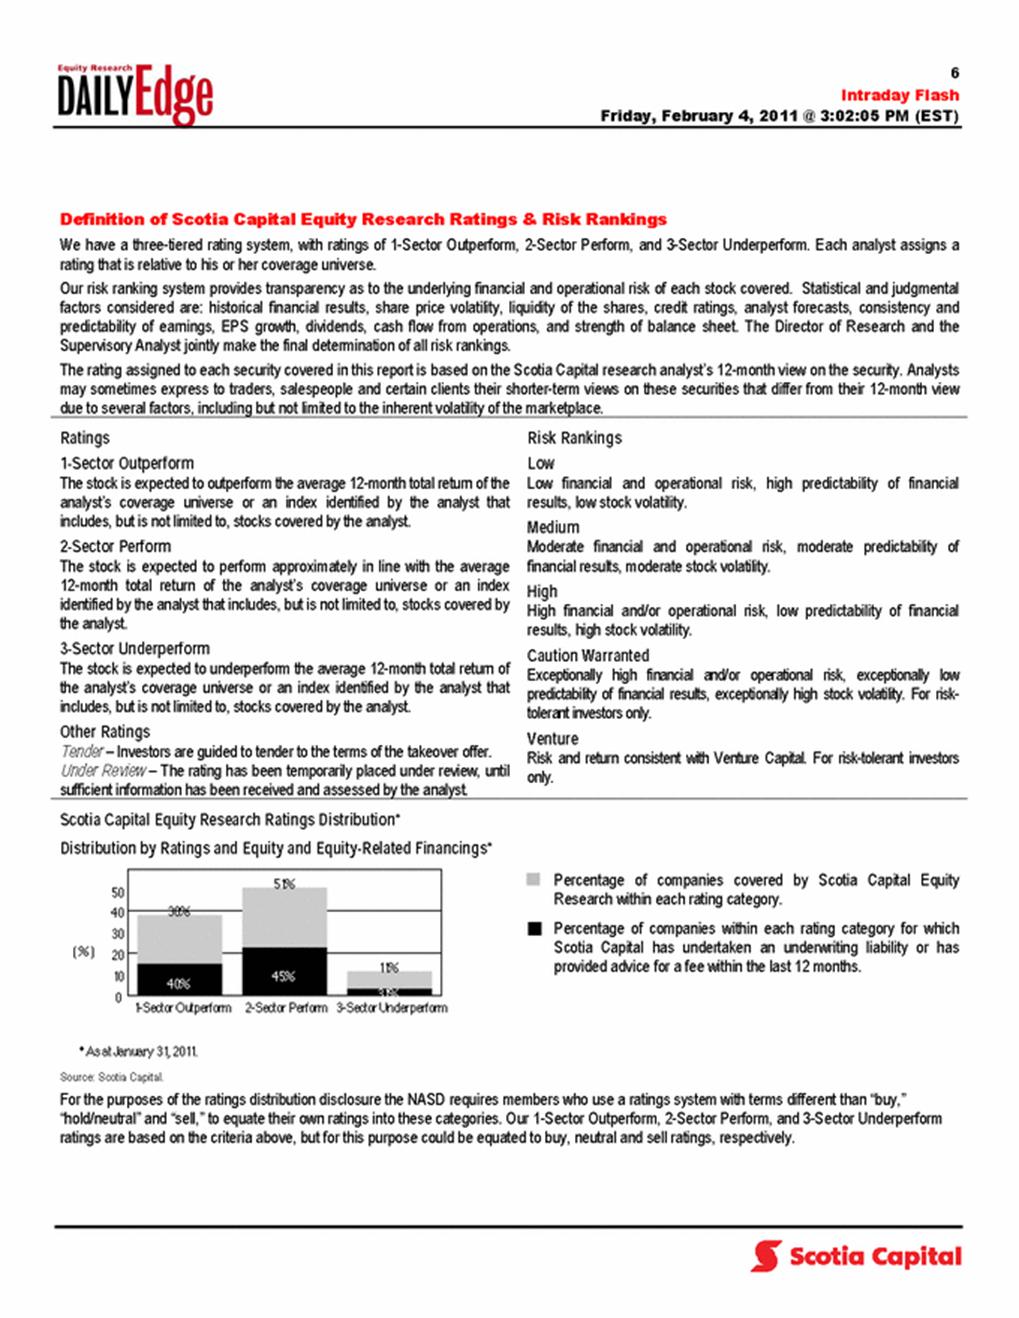
| Intraday Flash Friday, February 4, 2011 @ 3:02:05 PM (EST) Definition of Scotia Capital Equity Research Ratings & Risk Rankings We have a three-tiered rating system, with ratings of 1-Sector Outperform, 2-Sector Perform, and 3-Sector Underperform. Each analyst assigns a rating that is relative to his or her coverage universe. Our risk ranking system provides transparency as to the underlying financial and operational risk of each stock covered. Statistical and judgmental factors considered are: historical financial results, share price volatility, liquidity of the shares, credit ratings, analyst forecasts, consistency and predictability of earnings, EPS growth, dividends, cash flow from operations, and strength of balance sheet. The Director of Research and the Supervisory Analyst jointly make the final determination of all risk rankings. The rating assigned to each security covered in this report is based on the Scotia Capital research analyst’s 12-month view on the security. Analysts may sometimes express to traders, salespeople and certain clients their shorter-term views on these securities that differ from their 12-month view due to several factors, including but not limited to the inherent volatility of the marketplace. Ratings Risk Rankings 1-Sector Outperform The stock is expected to outperform the average 12-month total return of the analyst’s coverage universe or an index identified by the analyst that includes, but is not limited to, stocks covered by the analyst. 2-Sector Perform The stock is expected to perform approximately in line with the average 12-month total return of the analyst’s coverage universe or an index identified by the analyst that includes, but is not limited to, stocks covered by the analyst. 3-Sector Underperform The stock is expected to underperform the average 12-month total return of the analyst’s coverage universe or an index identified by the analyst that includes, but is not limited to, stocks covered by the analyst. Other Ratings Tender – Investors are guided to tender to the terms of the takeover offer. Under Review – The rating has been temporarily placed under review, until sufficient information has been received and assessed by the analyst. Low Low financial and operational risk, high predictability of financial results, low stock volatility. Medium Moderate financial and operational risk, moderate predictability of financial results, moderate stock volatility. High High financial and/or operational risk, low predictability of financial results, high stock volatility. Caution Warranted Exceptionally high financial and/or operational risk, exceptionally low predictability of financial results, exceptionally high stock volatility. For risk- tolerant investors only. Venture Risk and return consistent with Venture Capital. For risk-tolerant investors only. Scotia Capital Equity Research Ratings Distribution* Distribution by Ratings and Equity and Equity-Related Financings* Percentage of companies covered by Scotia Capital Equity Research within each rating category. Percentage of companies within each rating category for which Scotia Capital has undertaken an underwriting liability or has provided advice for a fee within the last 12 months. Source: Scotia Capital. For the purposes of the ratings distribution disclosure the NASD requires members who use a ratings system with terms different than “buy,” “hold/neutral” and “sell,” to equate their own ratings into these categories. Our 1-Sector Outperform, 2-Sector Perform, and 3-Sector Underperform ratings are based on the criteria above, but for this purpose could be equated to buy, neutral and sell ratings, respectively. |
| Intraday Flash Friday, February 4, 2011 @ 3:02:05 PM (EST) General Disclosures This report has been prepared by analysts who are employed by the Research Department of Scotia CapitalTM. The Scotia Capital trademark represents the corporate and investment banking businesses of the Scotiabank Group. Scotia Capital Research produces research reports under a single marketing identity referred to as “Globally-branded research” under U.S. rules. This research is produced on a single global research platform with one set of rules which meet the most stringent standards set by regulators in the various jurisdictions in which the research reports are produced. In addition, the analysts who produce the research reports, regardless of location, are subject to one set of policies designed to meet the most stringent rules established by regulators in the various jurisdictions where the research reports are produced. This report is provided to you for informational purposes only. This report is not, and is not to be construed as, an offer to sell or solicitation of an offer to buy any securities and/or commodity futures contracts. The securities mentioned in this report may neither be suitable for all investors nor eligible for sale in some jurisdictions where the report is distributed. The information and opinions contained herein have been compiled or arrived at from sources believed reliable, however, Scotia Capital makes no representation or warranty, express or implied, as to their accuracy or completeness. Scotia Capital has policies designed to make best efforts to ensure that the information contained in this report is current as of the date of this report, unless otherwise specified. Any prices that are stated in this report are for informational purposes only. Scotia Capital makes no representation that any transaction may be or could have been effected at those prices. Any opinions expressed herein are those of the author(s) and are subject to change without notice and may differ or be contrary from the opinions expressed by other departments of Scotia Capital or any of its affiliates. Neither Scotia Capital nor its affiliates accepts any liability whatsoever for any direct or consequential loss arising from any use of this report or its contents. Equity research reports published by Scotia Capital are available electronically via: Bloomberg, Thomson Financial/First Call - Research Direct, Reuters, Capital IQ, and FactSet. Institutional clients with questions regarding distribution of equity research should contact us at 1-800-208-7666. This report and all the information, opinions, and conclusions contained in it are protected by copyright. This report may not be reproduced in whole or in part, or referred to in any manner whatsoever, nor may the information, opinions, and conclusions contained in it be referred to without the prior express consent of Scotia Capital. Additional Disclosures Canada: This report is distributed by Scotia Capital Inc., a subsidiary of the Bank of Nova Scotia. Scotia Capital Inc. is a member of CIPF. Mexico: This report is distributed by Scotia Inverlat Casa de Bolsa S.A. de C.V., a subsidiary of the Bank of Nova Scotia. United Kingdom and the rest of Europe: Except as otherwise specified herein, this report is distributed by Scotia Capital (Europe) Limited, a subsidiary of the Bank of Nova Scotia. Scotia Capital (Europe) Limited is authorized and regulated by the Financial Services Authority (FSA). Scotia Capital (Europe) Limited research complies with all the FSA requirements and laws concerning disclosures and these are indicated on the research where applicable. Scotia Capital Inc. is regulated by the FSA for the conduct of investment business in the UK. United States: This report is distributed by Scotia Capital (USA) Inc., a subsidiary of Scotia Capital Inc., and a registered U.S. broker-dealer. All transactions by a U.S. investor of securities mentioned in this report must be effected through Scotia Capital (USA) Inc. Non-U.S. investors wishing to effect a transaction in the securities discussed in this report should contact a Scotia Capital entity in their local jurisdiction unless governing law permits otherwise. |
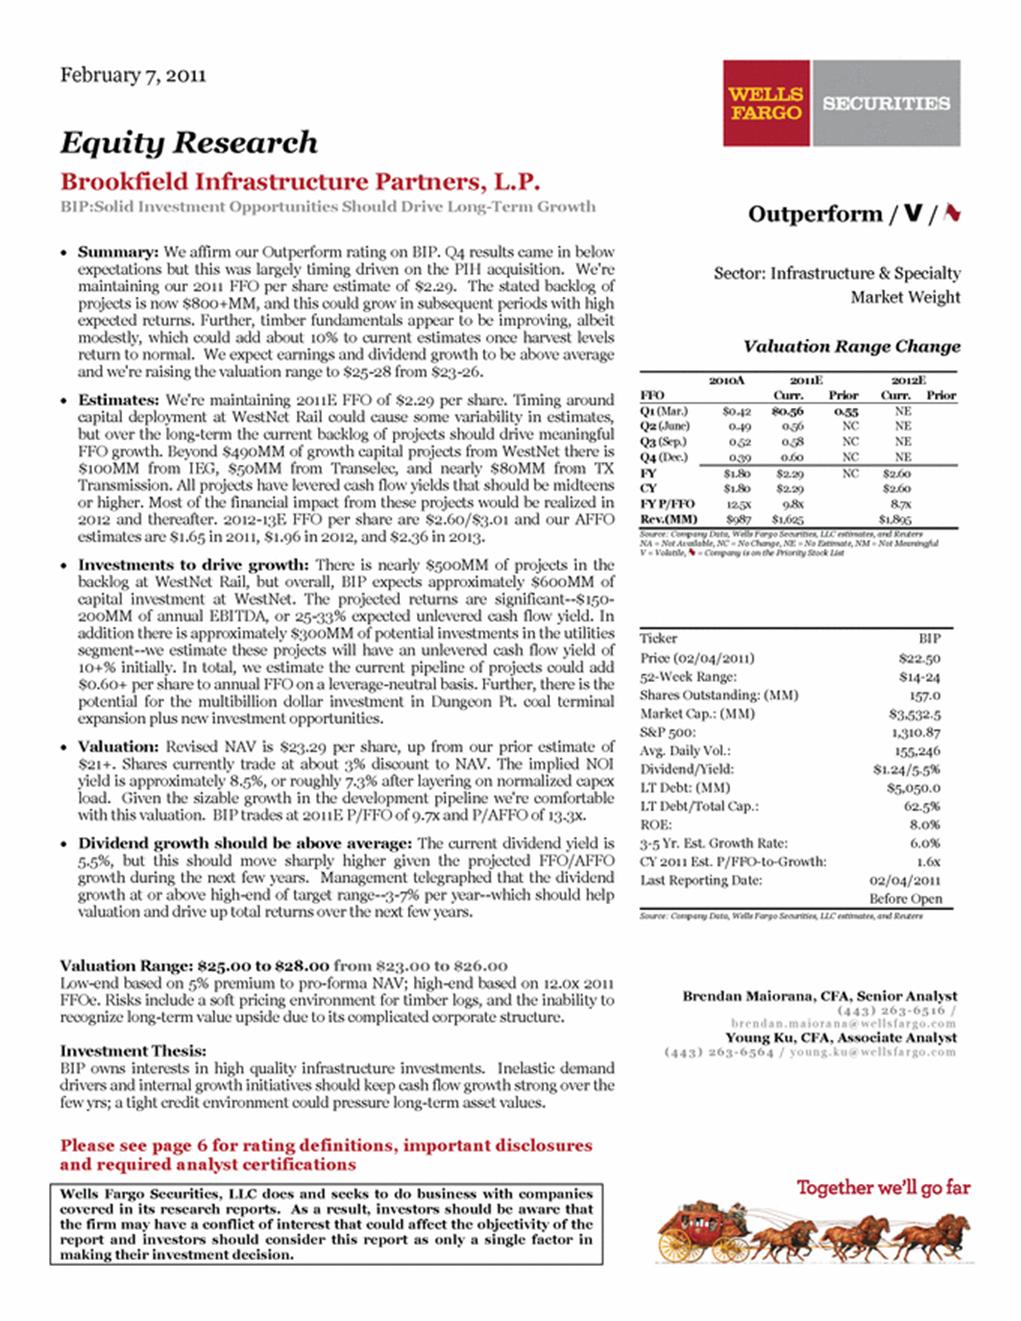
| Please see page 6 for rating definitions, important disclosures and required analyst certifications Wells Fargo Securities, LLC does and seeks to do business with companies covered in its research reports. As a result, investors should be aware that the firm may have a conflict of interest that could affect the objectivity of the report and investors should consider this report as only a single factor in making their investment decision. February 7, 2011 Equity Research Brookfield Infrastructure Partners, L.P. BIP:Solid Investment Opportunities Should Drive Long-Term Growth • Summary: We affirm our Outperform rating on BIP. Q4 results came in below expectations but this was largely timing driven on the PIH acquisition. We're maintaining our 2011 FFO per share estimate of $2.29. The stated backlog of projects is now $800+MM, and this could grow in subsequent periods with high expected returns. Further, timber fundamentals appear to be improving, albeit modestly, which could add about 10% to current estimates once harvest levels return to normal. We expect earnings and dividend growth to be above average and we're raising the valuation range to $25-28 from $23-26. • Estimates: We're maintaining 2011E FFO of $2.29 per share. Timing around capital deployment at WestNet Rail could cause some variability in estimates, but over the long-term the current backlog of projects should drive meaningful FFO growth. Beyond $490MM of growth capital projects from WestNet there is $100MM from IEG, $50MM from Transelec, and nearly $80MM from TX Transmission. All projects have levered cash flow yields that should be midteens or higher. Most of the financial impact from these projects would be realized in 2012 and thereafter. 2012-13E FFO per share are $2.60/$3.01 and our AFFO estimates are $1.65 in 2011, $1.96 in 2012, and $2.36 in 2013. • Investments to drive growth: There is nearly $500MM of projects in the backlog at WestNet Rail, but overall, BIP expects approximately $600MM of capital investment at WestNet. The projected returns are significant--$150- 200MM of annual EBITDA, or 25-33% expected unlevered cash flow yield. In addition there is approximately $300MM of potential investments in the utilities segment--we estimate these projects will have an unlevered cash flow yield of 10+% initially. In total, we estimate the current pipeline of projects could add $0.60+ per share to annual FFO on a leverage-neutral basis. Further, there is the potential for the multibillion dollar investment in Dungeon Pt. coal terminal expansion plus new investment opportunities. • Valuation: Revised NAV is $23.29 per share, up from our prior estimate of $21+. Shares currently trade at about 3% discount to NAV. The implied NOI yield is approximately 8.5%, or roughly 7.3% after layering on normalized capex load. Given the sizable growth in the development pipeline we're comfortable with this valuation. BIP trades at 2011E P/FFO of 9.7x and P/AFFO of 13.3x. • Dividend growth should be above average: The current dividend yield is 5.5%, but this should move sharply higher given the projected FFO/AFFO growth during the next few years. Management telegraphed that the dividend growth at or above high-end of target range--3-7% per year--which should help valuation and drive up total returns over the next few years. Valuation Range: $25.00 to $28.00 from $23.00 to $26.00 Low-end based on 5% premium to pro-forma NAV; high-end based on 12.0x 2011 FFOe. Risks include a soft pricing environment for timber logs, and the inability to recognize long-term value upside due to its complicated corporate structure. Investment Thesis: BIP owns interests in high quality infrastructure investments. Inelastic demand drivers and internal growth initiatives should keep cash flow growth strong over the few yrs; a tight credit environment could pressure long-term asset values. Outperform / V / Sector: Infrastructure & Specialty Market Weight Valuation Range Change 2010A 2011E 2012E FFO Curr. Prior Curr. Prior Q1 (Mar.) $0.42 $0.56 0.55 NE Q2 (June) 0.49 0.56 NC NE Q3 (Sep.) 0.52 0.58 NC NE Q4 (Dec.) 0.39 0.60 NC NE FY $1.80 $2.29 NC $2.60 CY $1.80 $2.29 $2.60 FY P/FFO 12.5x 9.8x 8.7x Rev.(MM) $987 $1,625 $1,895 Source: Company Data, Wells Fargo Securities, LLC estimates, and Reuters NA = Not Available, NC = No Change, NE = No Estimate, NM = Not Meaningful V = Volatile, = Company is on the Priority Stock List Ticker BIP Price (02/04/2011) $22.50 52-Week Range: $14-24 Shares Outstanding: (MM) 157.0 Market Cap.: (MM) $3,532.5 S&P 500: 1,310.87 Avg. Daily Vol.: 155,246 Dividend/Yield: $1.24/5.5% LT Debt: (MM) $5,050.0 LT Debt/Total Cap.: 62.5% ROE: 8.0% 3-5 Yr. Est. Growth Rate: 6.0% CY 2011 Est. P/FFO-to-Growth: 1.6x Last Reporting Date: 02/04/2011 Before Open Source: Company Data, Wells Fargo Securities, LLC estimates, and Reuters Brendan Maiorana, CFA, Senior Analyst (443) 263-6516 / brendan.maiorana@wellsfargo.com Young Ku, CFA, Associate Analyst (443) 263-6564 / young.ku@wellsfargo.com Together we’ll go far |
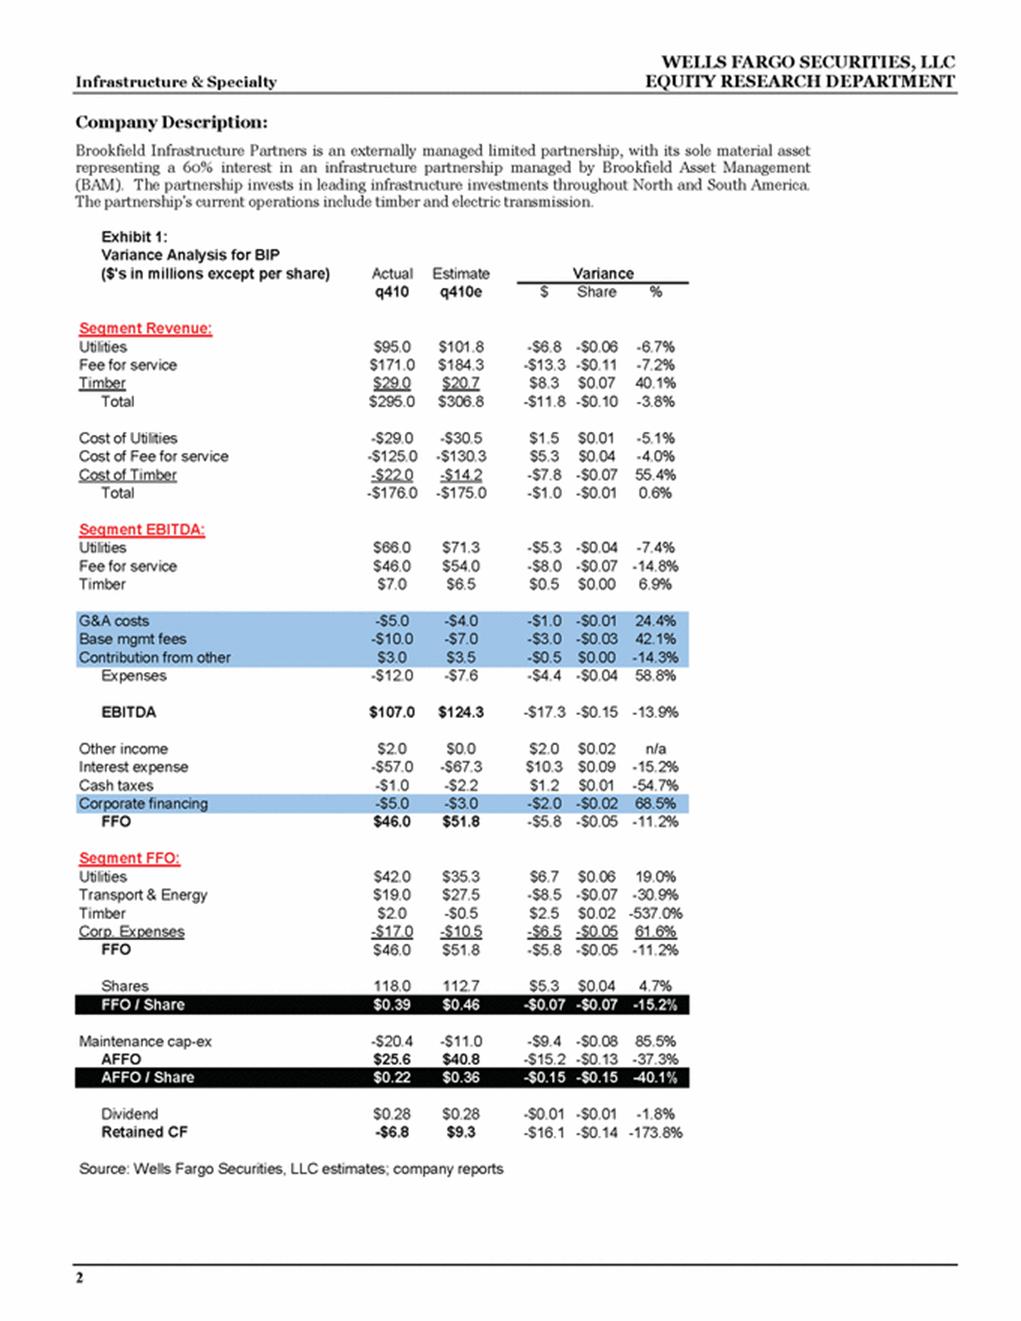
| WELLS FARGO SECURITIES, LLC Infrastructure & Specialty EQUITY RESEARCH DEPARTMENT 2 Company Description: Brookfield Infrastructure Partners is an externally managed limited partnership, with its sole material asset representing a 60% interest in an infrastructure partnership managed by Brookfield Asset Management (BAM). The partnership invests in leading infrastructure investments throughout North and South America. The partnership's current operations include timber and electric transmission. Exhibit 1: Variance Analysis for BIP ($'s in millions except per share) Actual Estimate Variance q410 q410e $ Share % Segment Revenue: Utilities $95.0 $101.8 -$6.8 -$0.06 -6.7% Fee for service $171.0 $184.3 -$13.3 -$0.11 -7.2% Timber $29.0 $20.7 $8.3 $0.07 40.1% Total $295.0 $306.8 -$11.8 -$0.10 -3.8% Cost of Utilities -$29.0 -$30.5 $1.5 $0.01 -5.1% Cost of Fee for service -$125.0 -$130.3 $5.3 $0.04 -4.0% Cost of Timber -$22.0 -$14.2 -$7.8 -$0.07 55.4% Total -$176.0 -$175.0 -$1.0 -$0.01 0.6% Segment EBITDA: Utilities $66.0 $71.3 -$5.3 -$0.04 -7.4% Fee for service $46.0 $54.0 -$8.0 -$0.07 -14.8% Timber $7.0 $6.5 $0.5 $0.00 6.9% G&A costs -$5.0 -$4.0 -$1.0 -$0.01 24.4% Base mgmt fees -$10.0 -$7.0 -$3.0 -$0.03 42.1% Contribution from other $3.0 $3.5 -$0.5 $0.00 -14.3% Expenses -$12.0 -$7.6 -$4.4 -$0.04 58.8% EBITDA $107.0 $124.3 -$17.3 -$0.15 -13.9% Other income $2.0 $0.0 $2.0 $0.02 n/a Interest expense -$57.0 -$67.3 $10.3 $0.09 -15.2% Cash taxes -$1.0 -$2.2 $1.2 $0.01 -54.7% Corporate financing -$5.0 -$3.0 -$2.0 -$0.02 68.5% FFO $46.0 $51.8 -$5.8 -$0.05 -11.2% Segment FFO: Utilities $42.0 $35.3 $6.7 $0.06 19.0% Transport & Energy $19.0 $27.5 -$8.5 -$0.07 -30.9% Timber $2.0 -$0.5 $2.5 $0.02 -537.0% Corp. Expenses -$17.0 -$10.5 -$6.5 -$0.05 61.6% FFO $46.0 $51.8 -$5.8 -$0.05 -11.2% Shares 118.0 112.7 $5.3 $0.04 4.7% FFO / Share $0.39 $0.46 -$0.07 -$0.07 -15.2% Maintenance cap-ex -$20.4 -$11.0 -$9.4 -$0.08 85.5% AFFO $25.6 $40.8 -$15.2 -$0.13 -37.3% AFFO / Share $0.22 $0.36 -$0.15 -$0.15 -40.1% Dividend $0.28 $0.28 -$0.01 -$0.01 -1.8% Retained CF -$6.8 $9.3 -$16.1 -$0.14 -173.8% Source: Wells Fargo Securities, LLC estimates; company reports |
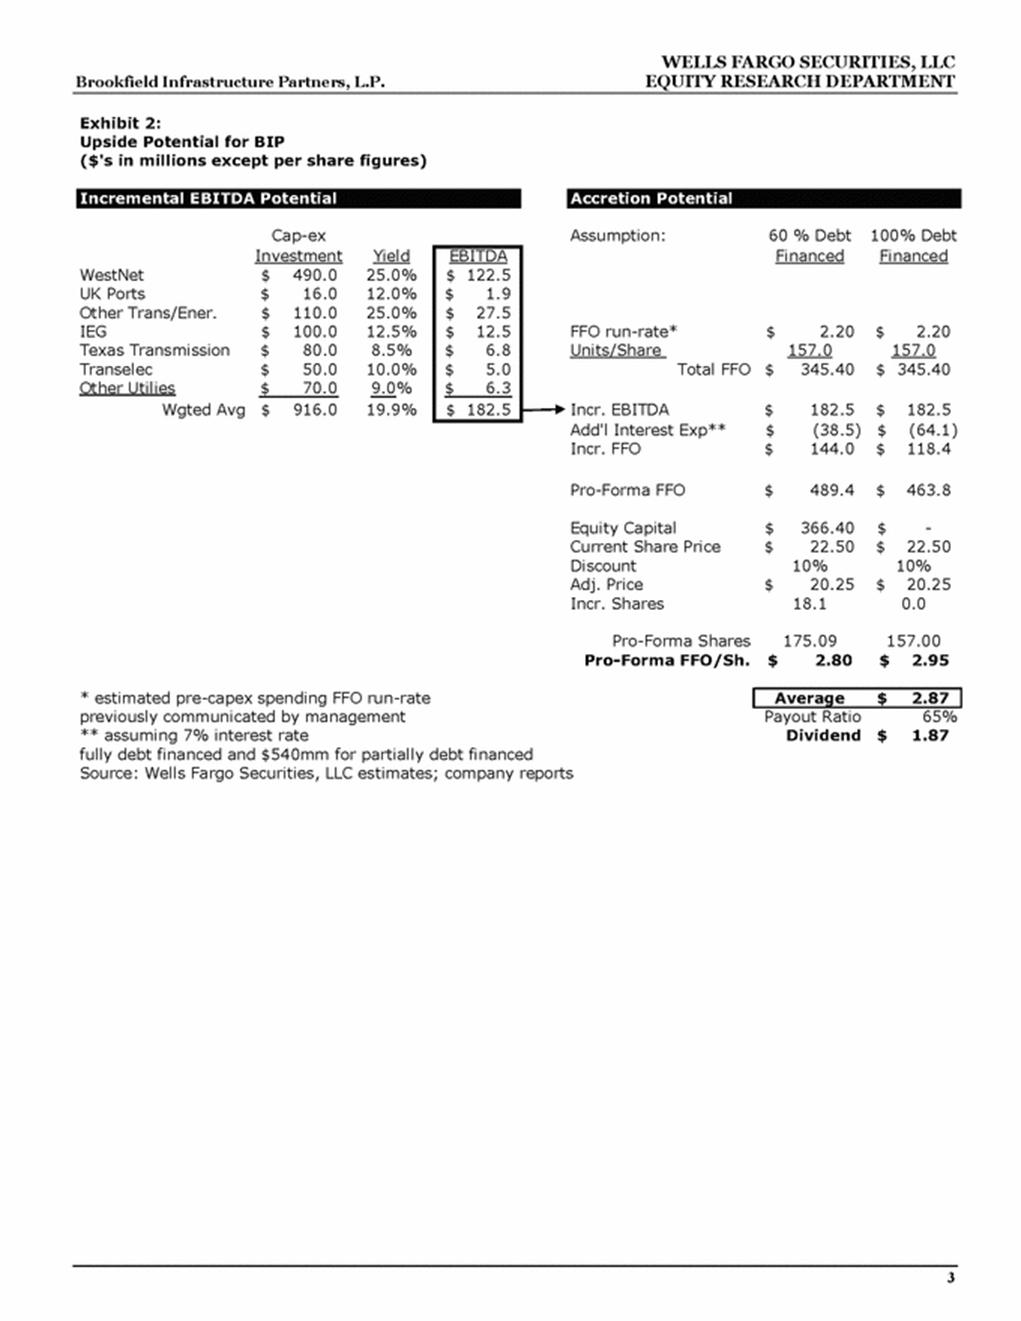
| WELLS FARGO SECURITIES, LLC Brookfield Infrastructure Partners, L.P. EQUITY RESEARCH DEPARTMENT 3 Exhibit 2: Upside Potential for BIP ($'s in millions except per share figures) Incremental EBITDA Potential Accretion Potential Cap-ex Assumption: 60 % Debt 100% Debt Investment Yield EBITDA Financed Financed WestNet 490.0 $ 25.0% 122.5 $ UK Ports 16.0 $ 12.0% 1.9 $ Other Trans/Ener. 110.0 $ 25.0% 27.5 $ IEG 100.0 $ 12.5% 12.5 $ FFO run-rate* 2.20 $ 2.20 $ Texas Transmission 80.0 $ 8.5% 6.8 $ Units/Share 157.0 157.0 Transelec 50.0 $ 10.0% 5.0 $ Total FFO 345.40 $ 345.40 $ Other Utilies 70.0 $ 9.0% 6.3 $ Wgted Avg 916.0 $ 19.9% 182.5 $ Incr. EBITDA 182.5 $ 182.5 $ Add'l Interest Exp** (38.5) $ (64.1) $ Incr. FFO 144.0 $ 118.4 $ Pro-Forma FFO 489.4 $ 463.8 $ Equity Capital 366.40 $ - $ Current Share Price 22.50 $ 22.50 $ Discount 10% 10% Adj. Price 20.25 $ 20.25 $ Incr. Shares 18.1 0.0 Pro-Forma Shares 175.09 157.00 Pro-Forma FFO/Sh. 2.80 $ 2.95 $ * estimated pre-capex spending FFO run-rate Average 2.87 $ previously communicated by management Payout Ratio 65% ** assuming 7% interest rate Dividend 1.87 $ fully debt financed and $540mm for partially debt financed Source: Wells Fargo Securities, LLC estimates; company reports |
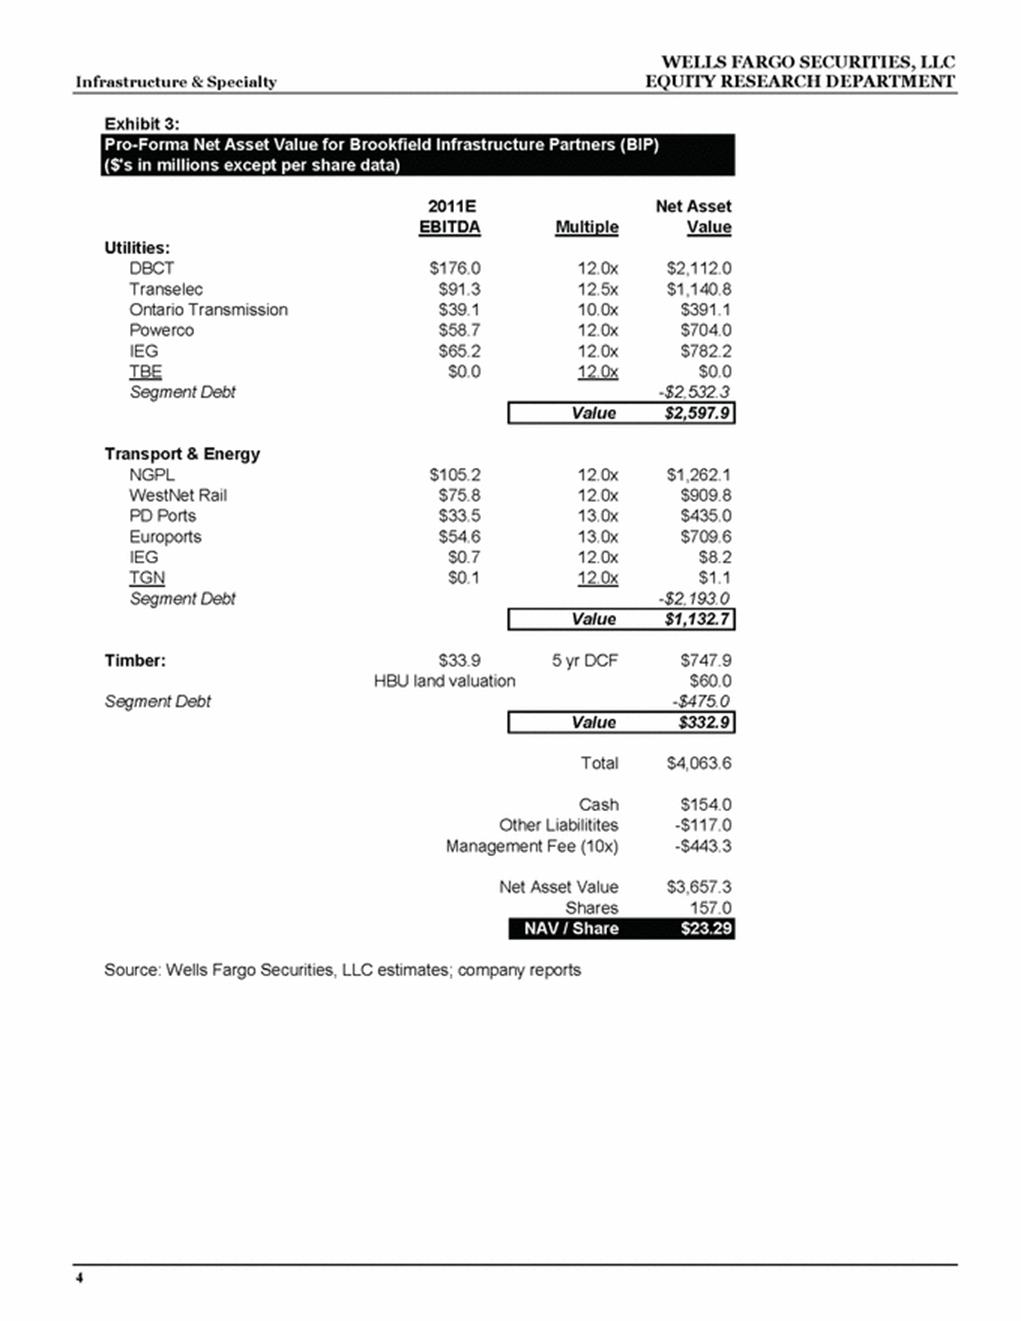
| WELLS FARGO SECURITIES, LLC Infrastructure & Specialty EQUITY RESEARCH DEPARTMENT 4 Exhibit 3: Pro-Forma Net Asset Value for Brookfield Infrastructure Partners (BIP) ($'s in millions except per share data) 2011E Net Asset EBITDA Multiple Value Utilities: DBCT $176.0 12.0x $2,112.0 Transelec $91.3 12.5x $1,140.8 Ontario Transmission $39.1 10.0x $391.1 Powerco $58.7 12.0x $704.0 IEG $65.2 12.0x $782.2 TBE $0.0 12.0x $0.0 Segment Debt -$2,532.3 Value $2,597.9 Transport & Energy NGPL $105.2 12.0x $1,262.1 WestNet Rail $75.8 12.0x $909.8 PD Ports $33.5 13.0x $435.0 Euroports $54.6 13.0x $709.6 IEG $0.7 12.0x $8.2 TGN $0.1 12.0x $1.1 Segment Debt -$2,193.0 Value $1,132.7 Timber: $33.9 5 yr DCF $747.9 HBU land valuation $60.0 Segment Debt -$475.0 Value $332.9 Total $4,063.6 Cash $154.0 Other Liabilitites -$117.0 Management Fee (10x) -$443.3 Net Asset Value $3,657.3 Shares 157.0 NAV / Share $23.29 Source: Wells Fargo Securities, LLC estimates; company reports |
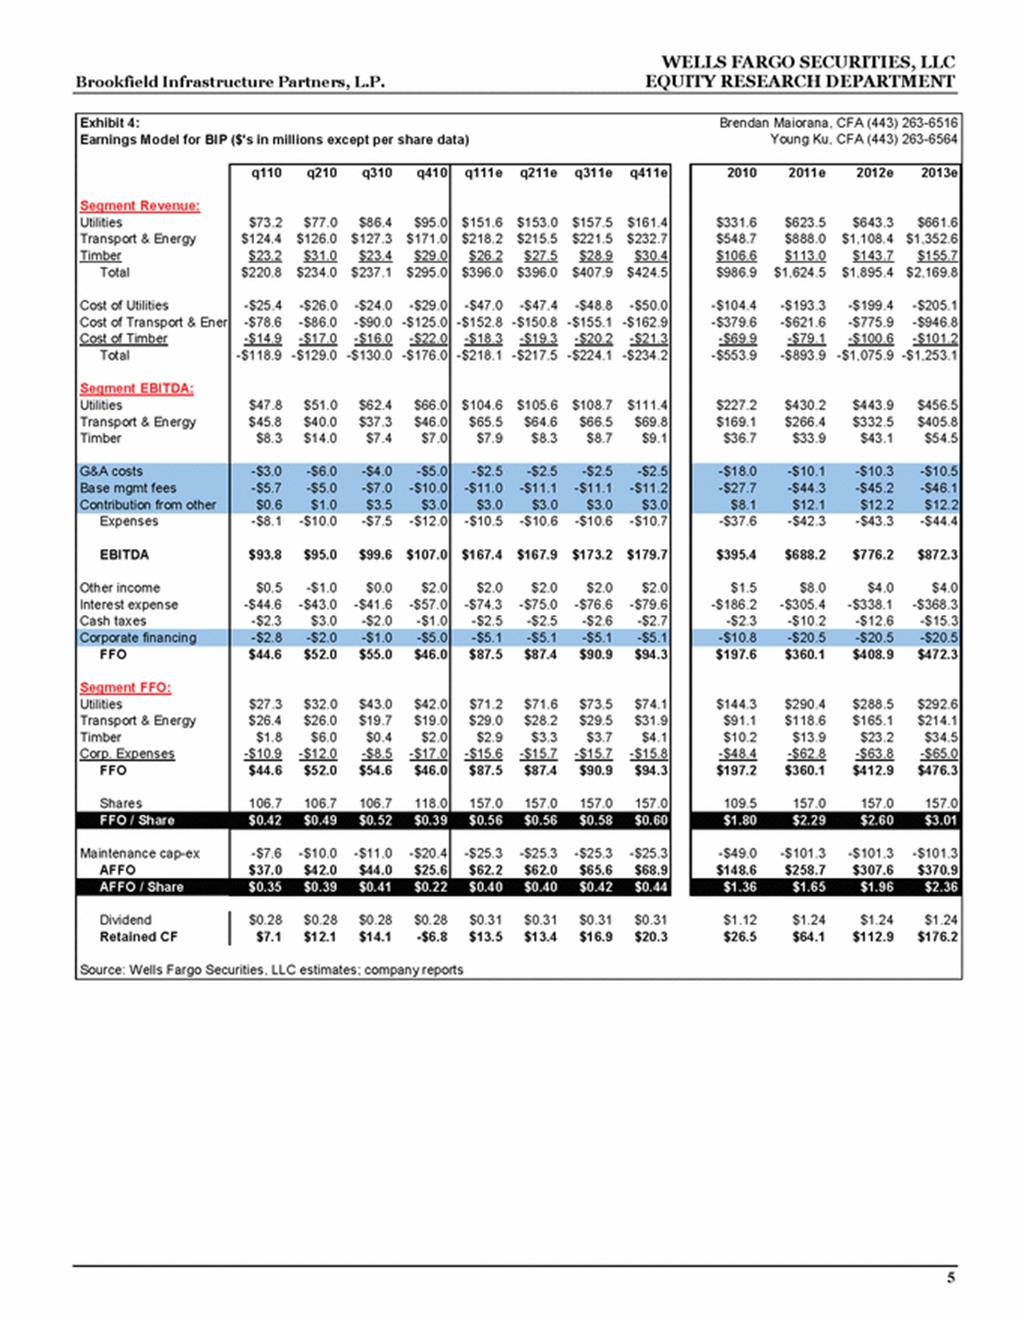
| WELLS FARGO SECURITIES, LLC Brookfield Infrastructure Partners, L.P. EQUITY RESEARCH DEPARTMENT 5 Exhibit 4: Brendan Maiorana, CFA (443) 263-6516 Earnings Model for BIP ($'s in millions except per share data) Young Ku, CFA (443) 263-6564 q110 q210 q310 q410 q111e q211e q311e q411e 2010 2011e 2012e 2013e Segment Revenue: Utilities $73.2 $77.0 $86.4 $95.0 $151.6 $153.0 $157.5 $161.4 $331.6 $623.5 $643.3 $661.6 Transport & Energy $124.4 $126.0 $127.3 $171.0 $218.2 $215.5 $221.5 $232.7 $548.7 $888.0 $1,108.4 $1,352.6 Timber $23.2 $31.0 $23.4 $29.0 $26.2 $27.5 $28.9 $30.4 $106.6 $113.0 $143.7 $155.7 Total $220.8 $234.0 $237.1 $295.0 $396.0 $396.0 $407.9 $424.5 $986.9 $1,624.5 $1,895.4 $2,169.8 Cost of Utilities -$25.4 -$26.0 -$24.0 -$29.0 -$47.0 -$47.4 -$48.8 -$50.0 -$104.4 -$193.3 -$199.4 -$205.1 Cost of Transport & Energ -$78.6 -$86.0 -$90.0 -$125.0 -$152.8 -$150.8 -$155.1 -$162.9 -$379.6 -$621.6 -$775.9 -$946.8 Cost of Timber -$14.9 -$17.0 -$16.0 -$22.0 -$18.3 -$19.3 -$20.2 -$21.3 -$69.9 -$79.1 -$100.6 -$101.2 Total -$118.9 -$129.0 -$130.0 -$176.0 -$218.1 -$217.5 -$224.1 -$234.2 -$553.9 -$893.9 -$1,075.9 -$1,253.1 Segment EBITDA: Utilities $47.8 $51.0 $62.4 $66.0 $104.6 $105.6 $108.7 $111.4 $227.2 $430.2 $443.9 $456.5 Transport & Energy $45.8 $40.0 $37.3 $46.0 $65.5 $64.6 $66.5 $69.8 $169.1 $266.4 $332.5 $405.8 Timber $8.3 $14.0 $7.4 $7.0 $7.9 $8.3 $8.7 $9.1 $36.7 $33.9 $43.1 $54.5 G&A costs -$3.0 -$6.0 -$4.0 -$5.0 -$2.5 -$2.5 -$2.5 -$2.5 -$18.0 -$10.1 -$10.3 -$10.5 Base mgmt fees -$5.7 -$5.0 -$7.0 -$10.0 -$11.0 -$11.1 -$11.1 -$11.2 -$27.7 -$44.3 -$45.2 -$46.1 Contribution from other $0.6 $1.0 $3.5 $3.0 $3.0 $3.0 $3.0 $3.0 $8.1 $12.1 $12.2 $12.2 Expenses -$8.1 -$10.0 -$7.5 -$12.0 -$10.5 -$10.6 -$10.6 -$10.7 -$37.6 -$42.3 -$43.3 -$44.4 EBITDA $93.8 $95.0 $99.6 $107.0 $167.4 $167.9 $173.2 $179.7 $395.4 $688.2 $776.2 $872.3 Other income $0.5 -$1.0 $0.0 $2.0 $2.0 $2.0 $2.0 $2.0 $1.5 $8.0 $4.0 $4.0 Interest expense -$44.6 -$43.0 -$41.6 -$57.0 -$74.3 -$75.0 -$76.6 -$79.6 -$186.2 -$305.4 -$338.1 -$368.3 Cash taxes -$2.3 $3.0 -$2.0 -$1.0 -$2.5 -$2.5 -$2.6 -$2.7 -$2.3 -$10.2 -$12.6 -$15.3 Corporate financing -$2.8 -$2.0 -$1.0 -$5.0 -$5.1 -$5.1 -$5.1 -$5.1 -$10.8 -$20.5 -$20.5 -$20.5 FFO $44.6 $52.0 $55.0 $46.0 $87.5 $87.4 $90.9 $94.3 $197.6 $360.1 $408.9 $472.3 Segment FFO: Utilities $27.3 $32.0 $43.0 $42.0 $71.2 $71.6 $73.5 $74.1 $144.3 $290.4 $288.5 $292.6 Transport & Energy $26.4 $26.0 $19.7 $19.0 $29.0 $28.2 $29.5 $31.9 $91.1 $118.6 $165.1 $214.1 Timber $1.8 $6.0 $0.4 $2.0 $2.9 $3.3 $3.7 $4.1 $10.2 $13.9 $23.2 $34.5 Corp. Expenses -$10.9 -$12.0 -$8.5 -$17.0 -$15.6 -$15.7 -$15.7 -$15.8 -$48.4 -$62.8 -$63.8 -$65.0 FFO $44.6 $52.0 $54.6 $46.0 $87.5 $87.4 $90.9 $94.3 $197.2 $360.1 $412.9 $476.3 Shares 106.7 106.7 106.7 118.0 157.0 157.0 157.0 157.0 109.5 157.0 157.0 157.0 FFO / Share $0.42 $0.49 $0.52 $0.39 $0.56 $0.56 $0.58 $0.60 $1.80 $2.29 $2.60 $3.01 Maintenance cap-ex -$7.6 -$10.0 -$11.0 -$20.4 -$25.3 -$25.3 -$25.3 -$25.3 -$49.0 -$101.3 -$101.3 -$101.3 AFFO $37.0 $42.0 $44.0 $25.6 $62.2 $62.0 $65.6 $68.9 $148.6 $258.7 $307.6 $370.9 AFFO / Share $0.35 $0.39 $0.41 $0.22 $0.40 $0.40 $0.42 $0.44 $1.36 $1.65 $1.96 $2.36 Dividend $0.28 $0.28 $0.28 $0.28 $0.31 $0.31 $0.31 $0.31 $1.12 $1.24 $1.24 $1.24 Retained CF $7.1 $12.1 $14.1 -$6.8 $13.5 $13.4 $16.9 $20.3 $26.5 $64.1 $112.9 $176.2 Source: Wells Fargo Securities, LLC estimates; company reports |
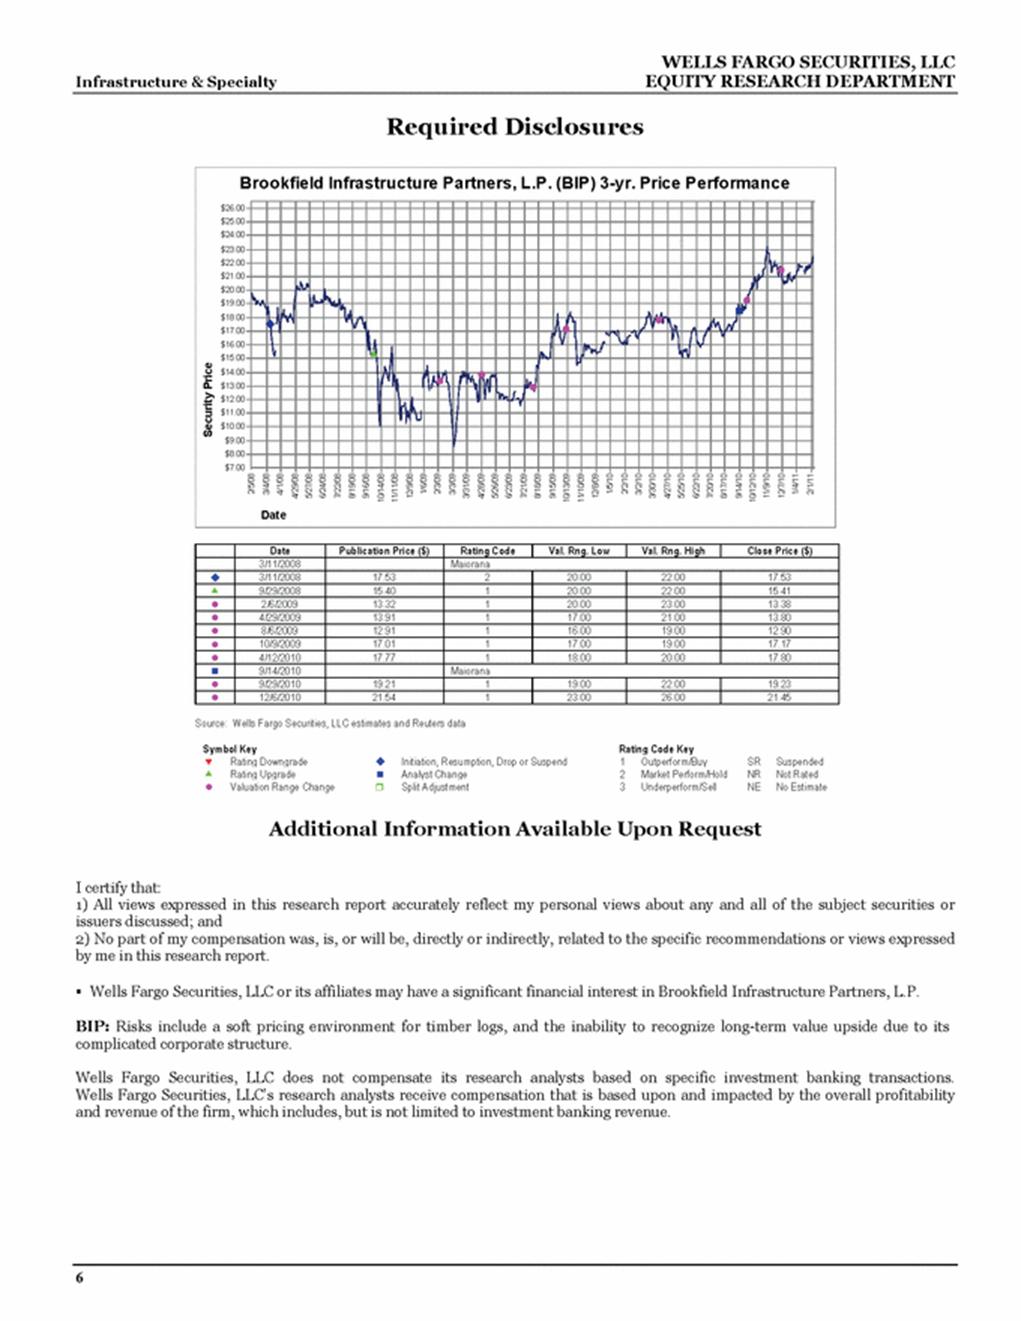
| WELLS FARGO SECURITIES, LLC Infrastructure & Specialty EQUITY RESEARCH DEPARTMENT 6 Required Disclosures $7.00 $8.00 $9.00 $10.00 $11.00 $12.00 $13.00 $14.00 $15.00 $16.00 $17.00 $18.00 $19.00 $20.00 $21.00 $22.00 $23.00 $24.00 $25.00 $26.00 2/5/08 3/4/08 4/1/08 4/29/08 5/27/08 6/24/08 7/22/08 8/19/08 9/16/08 10/14/08 11/11/08 12/9/08 1/6/09 2/3/09 3/3/09 3/31/09 4/28/09 5/26/09 6/23/09 7/21/09 8/18/09 9/15/09 10/13/09 11/10/09 12/8/09 1/5/10 2/2/10 3/2/10 3/30/10 4/27/10 5/25/10 6/22/10 7/20/10 8/17/10 9/14/10 10/12/10 11/9/10 12/7/10 1/4/11 2/1/11 Security Price Brookfield Infrastructure Partners, L.P. (BIP) 3-yr. Price Performance Brookfield Infrastructure Partners, L.P. (BIP) 3-yr. Price Performance Date Date Publication Price ($) Rating Code Val. Rng. Low Val. Rng. High Close Price ($) 3/11/2008 Maiorana 3/11/2008 17.53 2 20.00 22.00 17.53 9/29/2008 15.40 1 20.00 22.00 15.41 2/6/2009 13.32 1 20.00 23.00 13.38 4/29/2009 13.91 1 17.00 21.00 13.80 8/6/2009 12.91 1 16.00 19.00 12.90 10/9/2009 17.01 1 17.00 19.00 17.17 4/12/2010 17.77 1 18.00 20.00 17.80 9/14/2010 Maiorana 9/29/2010 19.21 1 19.00 22.00 19.23 12/6/2010 21.54 1 23.00 26.00 21.45 Source: Wells Fargo Securities, LLC estimates and Reuters data Symbol Key Rating Code Key Rating Downgrade Initiation, Resumption, Drop or Suspend 1 Outperform/Buy SR Suspended Rating Upgrade Analyst Change 2 Market Perform/Hold NR Not Rated Valuation Range Change Split Adjustment 3 Underperform/Sell NE No Estimate Additional Information Available Upon Request I certify that: 1) All views expressed in this research report accurately reflect my personal views about any and all of the subject securities or issuers discussed; and 2) No part of my compensation was, is, or will be, directly or indirectly, related to the specific recommendations or views expressed by me in this research report. Wells Fargo Securities, LLC or its affiliates may have a significant financial interest in Brookfield Infrastructure Partners, L.P. BIP: Risks include a soft pricing environment for timber logs, and the inability to recognize long-term value upside due to its complicated corporate structure. Wells Fargo Securities, LLC does not compensate its research analysts based on specific investment banking transactions. Wells Fargo Securities, LLC’s research analysts receive compensation that is based upon and impacted by the overall profitability and revenue of the firm, which includes, but is not limited to investment banking revenue. |
| WELLS FARGO SECURITIES, LLC Brookfield Infrastructure Partners, L.P. EQUITY RESEARCH DEPARTMENT 7 STOCK RATING 1=Outperform: The stock appears attractively valued, and we believe the stock's total return will exceed that of the market over the next 12 months. BUY 2=Market Perform: The stock appears appropriately valued, and we believe the stock's total return will be in line with the market over the next 12 months. HOLD 3=Underperform: The stock appears overvalued, and we believe the stock's total return will be below the market over the next 12 months. SELL SECTOR RATING O=Overweight: Industry expected to outperform the relevant broad market benchmark over the next 12 months. M=Market Weight: Industry expected to perform in-line with the relevant broad market benchmark over the next 12 months. U=Underweight: Industry expected to underperform the relevant broad market benchmark over the next 12 months. VOLATILITY RATING V = A stock is defined as volatile if the stock price has fluctuated by +/-20% or greater in at least 8 of the past 24 months or if the analyst expects significant volatility. All IPO stocks are automatically rated volatile within the first 24 months of trading. As of: February 7, 2011 44% of companies covered by Wells Fargo Securities, LLC Equity Research are rated Outperform. Wells Fargo Securities, LLC has provided investment banking services for 42% of its Equity Research Outperform-rated companies. 53% of companies covered by Wells Fargo Securities, LLC Equity Research are rated Market Perform. Wells Fargo Securities, LLC has provided investment banking services for 45% of its Equity Research Market Perform-rated companies. 3% of companies covered by Wells Fargo Securities, LLC Equity Research are rated Underperform. Wells Fargo Securities, LLC has provided investment banking services for 46% of its Equity Research Underperform-rated companies. Important Disclosure for International Clients EEA – The securities and related financial instruments described herein may not be eligible for sale in all jurisdictions or to certain categories of investors. For recipients in the EEA, this report is distributed by Wells Fargo Securities International Limited (“WFSIL”). WFSIL is a U.K. incorporated investment firm authorized and regulated by the Financial Services Authority. For the purposes of Section 21 of the UK Financial Services and Markets Act 2000 (“the Act”), the content of this report has been approved by WFSIL a regulated person under the Act. WFSIL does not deal with retail clients as defined in the Markets in Financial Instruments Directive 2007. The FSA rules made under the Financial Services and Markets Act 2000 for the protection of retail clients will therefore not apply, nor will the Financial Services Compensation Scheme be available. This report is not intended for, and should not be relied upon by, retail clients. Australia – Wells Fargo Securities, LLC is exempt from the requirements to hold an Australian financial services license in respect of the financial services it provides to wholesale clients in Australia. Wells Fargo Securities, LLC is regulated under U.S. laws which differ from Australian laws. Any offer or documentation provided to Australian recipients by Wells Fargo Securities, LLC in the course of providing the financial services will be prepared in accordance with the laws of the United States and not Australian laws. Hong Kong – This report is issued and distributed in Hong Kong by Wells Fargo Securities Asia Limited (“WFSAL”), a Hong Kong incorporated investment firm licensed and regulated by the Securities and Futures Commission to carry on types 1, 4, 6 and 9 regulated activities (as defined in the Securities and Futures Ordinance, “the SFO”). This report is not intended for, and should not be relied on by, any person other than professional investors (as defined in the SFO). Any securities and related financial instruments described herein are not intended for sale, nor will be sold, to any person other than professional investors (as defined in the SFO). Japan – This report is distributed in Japan by Wells Fargo Securities (Japan) Co., Ltd, registered with the Kanto Local Finance Bureau to conduct broking and dealing of type 1 and type 2 financial instruments and agency or intermediary service for entry into investment advisory or discretionary investment contracts. This report is intended for distribution only to professional customers (Tokutei Toushika) and is not intended for, and should not be relied upon by, ordinary customers (Ippan Toushika). The rating stated on the document is not a credit rating assigned by a rating agency registered with the Financial Services Agency of Japan but a rating assigned by a group company of a registered rating agency. The rating agency groups call respectively Fitch Ratings, Moody’s Investors Services Inc or Standard & Poor’s Rating Services. Any decision to invest in securities or transaction should be made after reviewing policies and methodologies used for assigning credit ratings and assumptions, significance and limitations of credit rating stated on the web site of rating agencies. |

| WELLS FARGO SECURITIES, LLC Infrastructure & Specialty EQUITY RESEARCH DEPARTMENT 8 About Wells Fargo Securities, LLC Wells Fargo Securities, LLC is a U.S. broker-dealer registered with the U.S. Securities and Exchange Commission and a member of the New York Stock Exchange, the Financial Industry Regulatory Authority and the Securities Investor Protection Corp. This report is for your information only and is not an offer to sell, or a solicitation of an offer to buy, the securities or instruments named or described in this report. Interested parties are advised to contact the entity with which they deal, or the entity that provided this report to them, if they desire further information. The information in this report has been obtained or derived from sources believed by Wells Fargo Securities, LLC, to be reliable, but Wells Fargo Securities, LLC, does not represent that this information is accurate or complete. Any opinions or estimates contained in this report represent the judgment of Wells Fargo Securities, LLC, at this time, and are subject to change without notice. For the purposes of the U.K. Financial Services Authority's rules, this report constitutes impartial investment research. Each of Wells Fargo Securities, LLC, and Wells Fargo Securities International Limited is a separate legal entity and distinct from affiliated banks. Copyright © 2011 Wells Fargo Securities, LLC. SECURITIES: NOT FDIC-INSURED/NOT BANK-GUARANTEED/MAY LOSE VALUE |
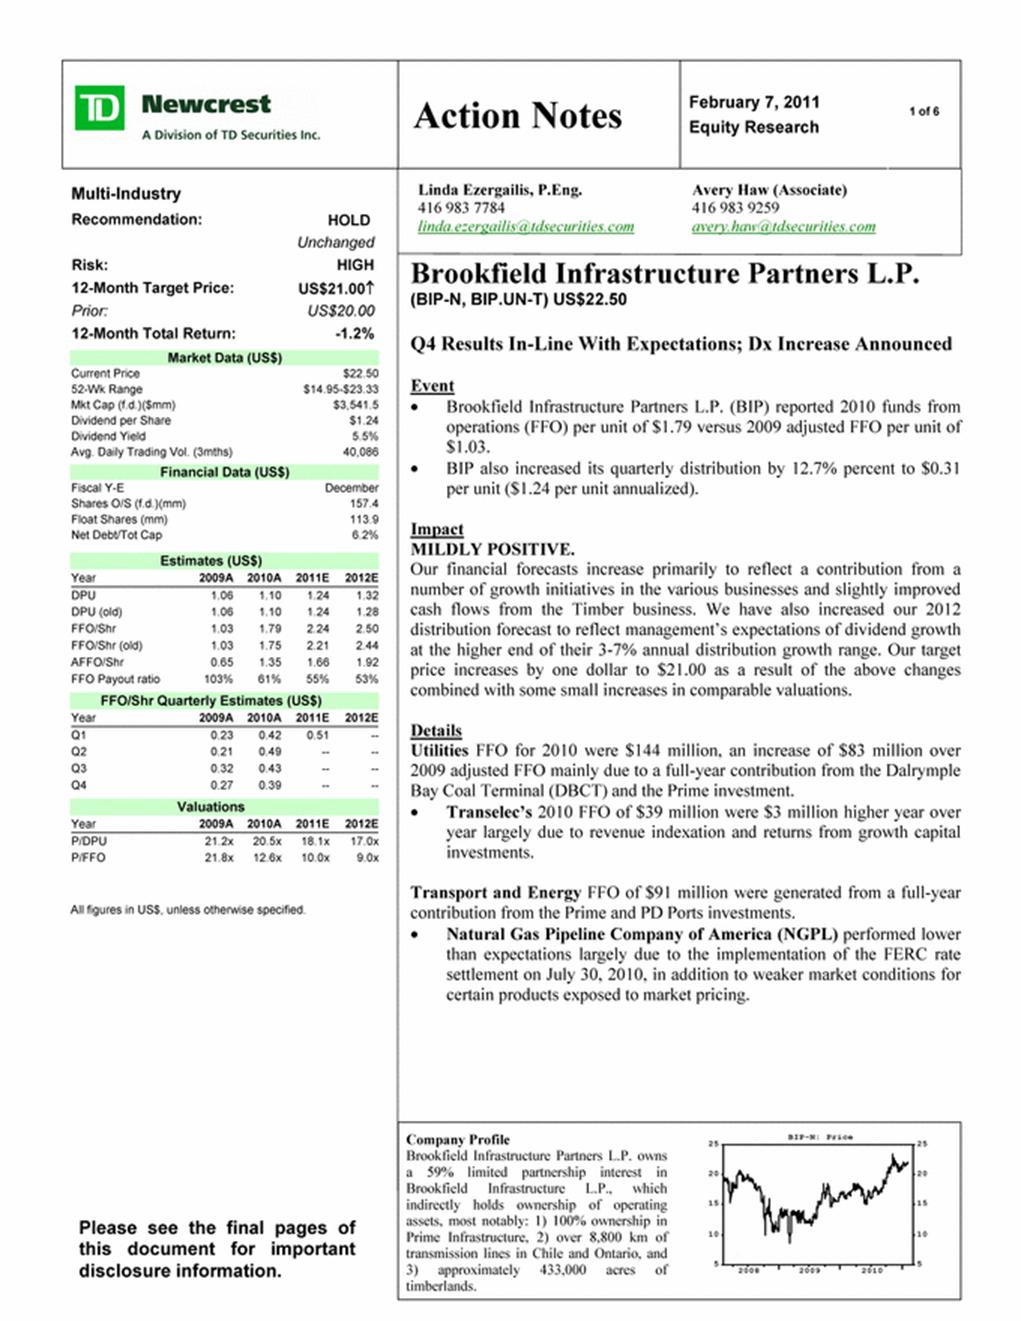
| February 7, 2011 Action Notes Equity Research 1 of 6 Company Profile Brookfield Infrastructure Partners L.P. owns a 59% limited partnership interest in Brookfield Infrastructure L.P., which indirectly holds ownership of operating assets, most notably: 1) 100% ownership in Prime Infrastructure, 2) over 8,800 km of transmission lines in Chile and Ontario, and 3) approximately 433,000 acres of timberlands. 2008 2009 2010 5 10 15 20 25 5 10 15 20 25 BIP-N: Price Please see the final pages of this document for important disclosure information. Brookfield Infrastructure Partners L.P. (BIP-N, BIP.UN-T) US$22.50 Q4 Results In-Line With Expectations; Dx Increase Announced Event • Brookfield Infrastructure Partners L.P. (BIP) reported 2010 funds from operations (FFO) per unit of $1.79 versus 2009 adjusted FFO per unit of $1.03. • BIP also increased its quarterly distribution by 12.7% percent to $0.31 per unit ($1.24 per unit annualized). Impact MILDLY POSITIVE. Our financial forecasts increase primarily to reflect a contribution from a number of growth initiatives in the various businesses and slightly improved cash flows from the Timber business. We have also increased our 2012 distribution forecast to reflect management’s expectations of dividend growth at the higher end of their 3-7% annual distribution growth range. Our target price increases by one dollar to $21.00 as a result of the above changes combined with some small increases in comparable valuations. Details Utilities FFO for 2010 were $144 million, an increase of $83 million over 2009 adjusted FFO mainly due to a full-year contribution from the Dalrymple Bay Coal Terminal (DBCT) and the Prime investment. • Transelec’s 2010 FFO of $39 million were $3 million higher year over year largely due to revenue indexation and returns from growth capital investments. Transport and Energy FFO of $91 million were generated from a full-year contribution from the Prime and PD Ports investments. • Natural Gas Pipeline Company of America (NGPL) performed lower than expectations largely due to the implementation of the FERC rate settlement on July 30, 2010, in addition to weaker market conditions for certain products exposed to market pricing. Multi-Industry Recommendation: HOLD Unchanged Risk: HIGH 12-Month Target Price: US$21.00. Prior: US$20.00 12-Month Total Return: -1.2% Market Data (US$) Current Price $22.50 52-Wk Range $14.95-$23.33 Mkt Cap (f.d.)($mm) $3,541.5 Dividend per Share $1.24 Dividend Yield 5.5% Avg. Daily Trading Vol. (3mths) 40,086 Financial Data (US$) Fiscal Y-E December Shares O/S (f.d.)(mm) 157.4 Float Shares (mm) 113.9 Net Debt/Tot Cap 6.2% Estimates (US$) Year 2009A 2010A 2011E 2012E DPU 1.06 1.10 1.24 1.32 DPU (old) 1.06 1.10 1.24 1.28 FFO/Shr 1.03 1.79 2.24 2.50 FFO/Shr (old) 1.03 1.75 2.21 2.44 AFFO/Shr 0.65 1.35 1.66 1.92 FFO Payout ratio 103% 61% 55% 53% FFO/Shr Quarterly Estimates (US$) Year 2009A 2010A 2011E 2012E Q1 0.23 0.42 0.51 -- Q2 0.21 0.49 -- -- Q3 0.32 0.43 -- -- Q4 0.27 0.39 -- -- Valuations Year 2009A 2010A 2011E 2012E P/DPU 21.2x 20.5x 18.1x 17.0x P/FFO 21.8x 12.6x 10.0x 9.0x All figures in US$, unless otherwise specified. Linda Ezergailis, P.Eng. Avery Haw (Associate) 416 983 7784 416 983 9259 linda.ezergailis@tdsecurities.com avery.haw@tdsecurities.com |
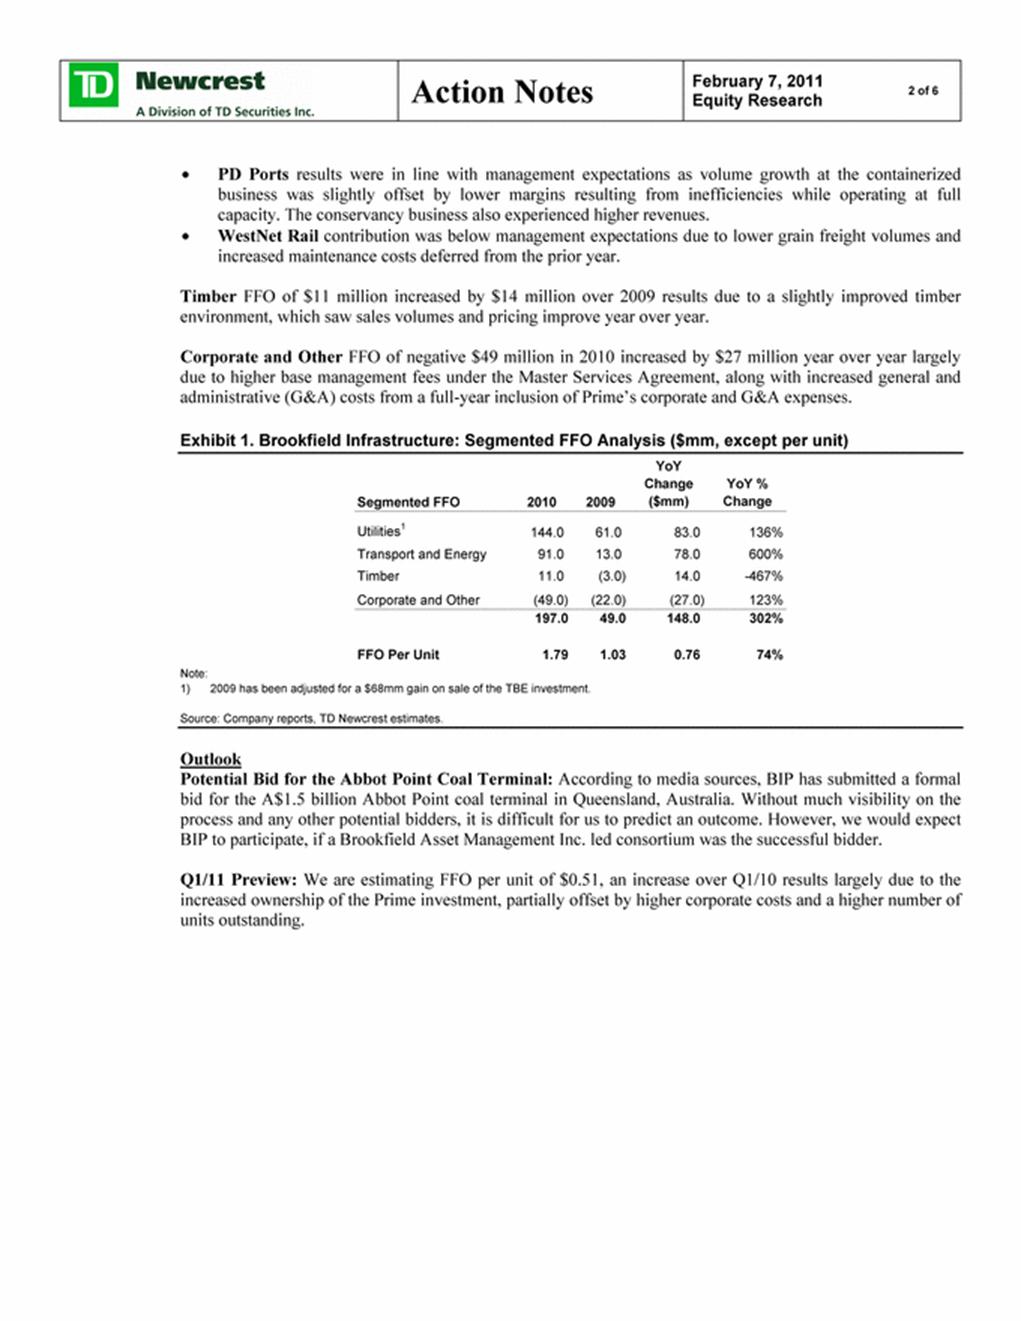
| Action Notes February 7, 2011 Equity Research 2 of 6 • PD Ports results were in line with management expectations as volume growth at the containerized business was slightly offset by lower margins resulting from inefficiencies while operating at full capacity. The conservancy business also experienced higher revenues. • WestNet Rail contribution was below management expectations due to lower grain freight volumes and increased maintenance costs deferred from the prior year. Timber FFO of $11 million increased by $14 million over 2009 results due to a slightly improved timber environment, which saw sales volumes and pricing improve year over year. Corporate and Other FFO of negative $49 million in 2010 increased by $27 million year over year largely due to higher base management fees under the Master Services Agreement, along with increased general and administrative (G&A) costs from a full-year inclusion of Prime’s corporate and G&A expenses. Exhibit 1. Brookfield Infrastructure: Segmented FFO Analysis ($mm, except per unit) Segmented FFO 2010 2009 YoY Change ($mm) YoY % Change Utilities1 144.0 61.0 83.0 136% Transport and Energy 91.0 13.0 78.0 600% Timber 11.0 (3.0) 14.0 -467% Corporate and Other (49.0) (22.0) (27.0) 123% 197.0 49.0 148.0 302% FFO Per Unit 1.79 1.03 0.76 74% Note: 1) 2009 has been adjusted for a $68mm gain on sale of the TBE investment. Source: Company reports, TD Newcrest estimates. Outlook Potential Bid for the Abbot Point Coal Terminal: According to media sources, BIP has submitted a formal bid for the A$1.5 billion Abbot Point coal terminal in Queensland, Australia. Without much visibility on the process and any other potential bidders, it is difficult for us to predict an outcome. However, we would expect BIP to participate, if a Brookfield Asset Management Inc. led consortium was the successful bidder. Q1/11 Preview: We are estimating FFO per unit of $0.51, an increase over Q1/10 results largely due to the increased ownership of the Prime investment, partially offset by higher corporate costs and a higher number of units outstanding. |
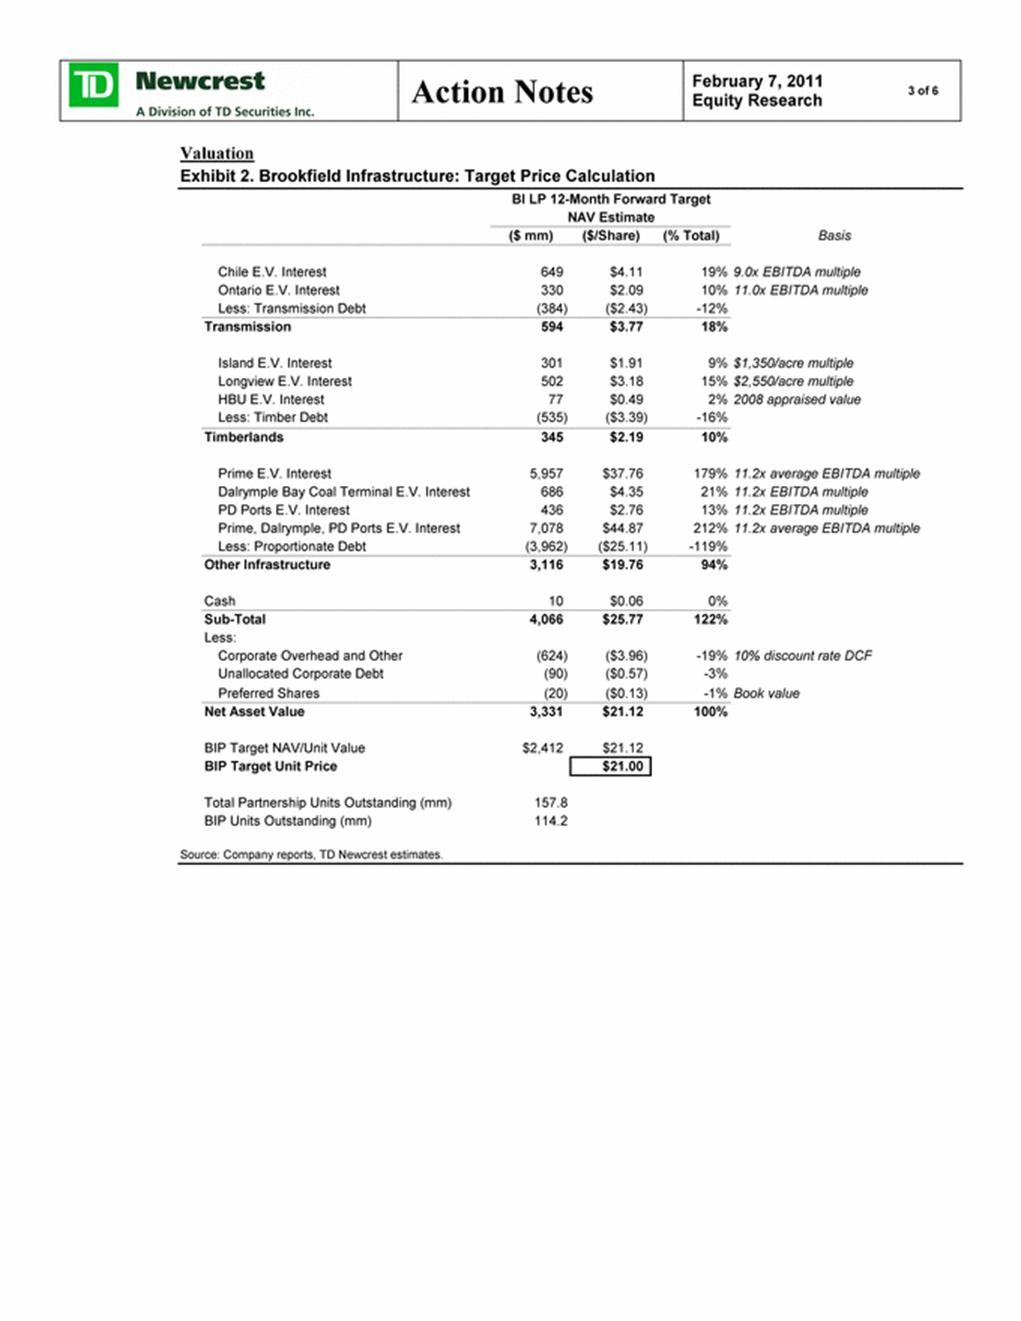
| Action Notes February 7, 2011 Equity Research 3 of 6 Valuation Exhibit 2. Brookfield Infrastructure: Target Price Calculation BI LP 12-Month Forward Target NAV Estimate ($ mm) ($/Share) (% Total) Basis Chile E.V. Interest 649 $4.11 19% 9.0x EBITDA multiple Ontario E.V. Interest 330 $2.09 10% 11.0x EBITDA multiple Less: Transmission Debt (384) ($2.43) -12% Transmission 594 $3.77 18% Island E.V. Interest 301 $1.91 9% $1,350/acre multiple Longview E.V. Interest 502 $3.18 15% $2,550/acre multiple HBU E.V. Interest 77 $0.49 2% 2008 appraised value Less: Timber Debt (535) ($3.39) -16% Timberlands 345 $2.19 10% Prime E.V. Interest 5,957 $37.76 179% 11.2x average EBITDA multiple Dalrymple Bay Coal Terminal E.V. Interest 686 $4.35 21% 11.2x EBITDA multiple PD Ports E.V. Interest 436 $2.76 13% 11.2x EBITDA multiple Prime, Dalrymple, PD Ports E.V. Interest 7,078 $44.87 212% 11.2x average EBITDA multiple Less: Proportionate Debt (3,962) ($25.11) -119% Other Infrastructure 3,116 $19.76 94% Cash 10 $0.06 0% Sub-Total 4,066 $25.77 122% Less: Corporate Overhead and Other (624) ($3.96) -19% 10% discount rate DCF Unallocated Corporate Debt (90) ($0.57) -3% Preferred Shares (20) ($0.13) -1% Book value Net Asset Value 3,331 $21.12 100% BIP Target NAV/Unit Value $2,412 $21.12 BIP Target Unit Price $21.00 Total Partnership Units Outstanding (mm) 157.8 BIP Units Outstanding (mm) 114.2 Source: Company reports, TD Newcrest estimates. |
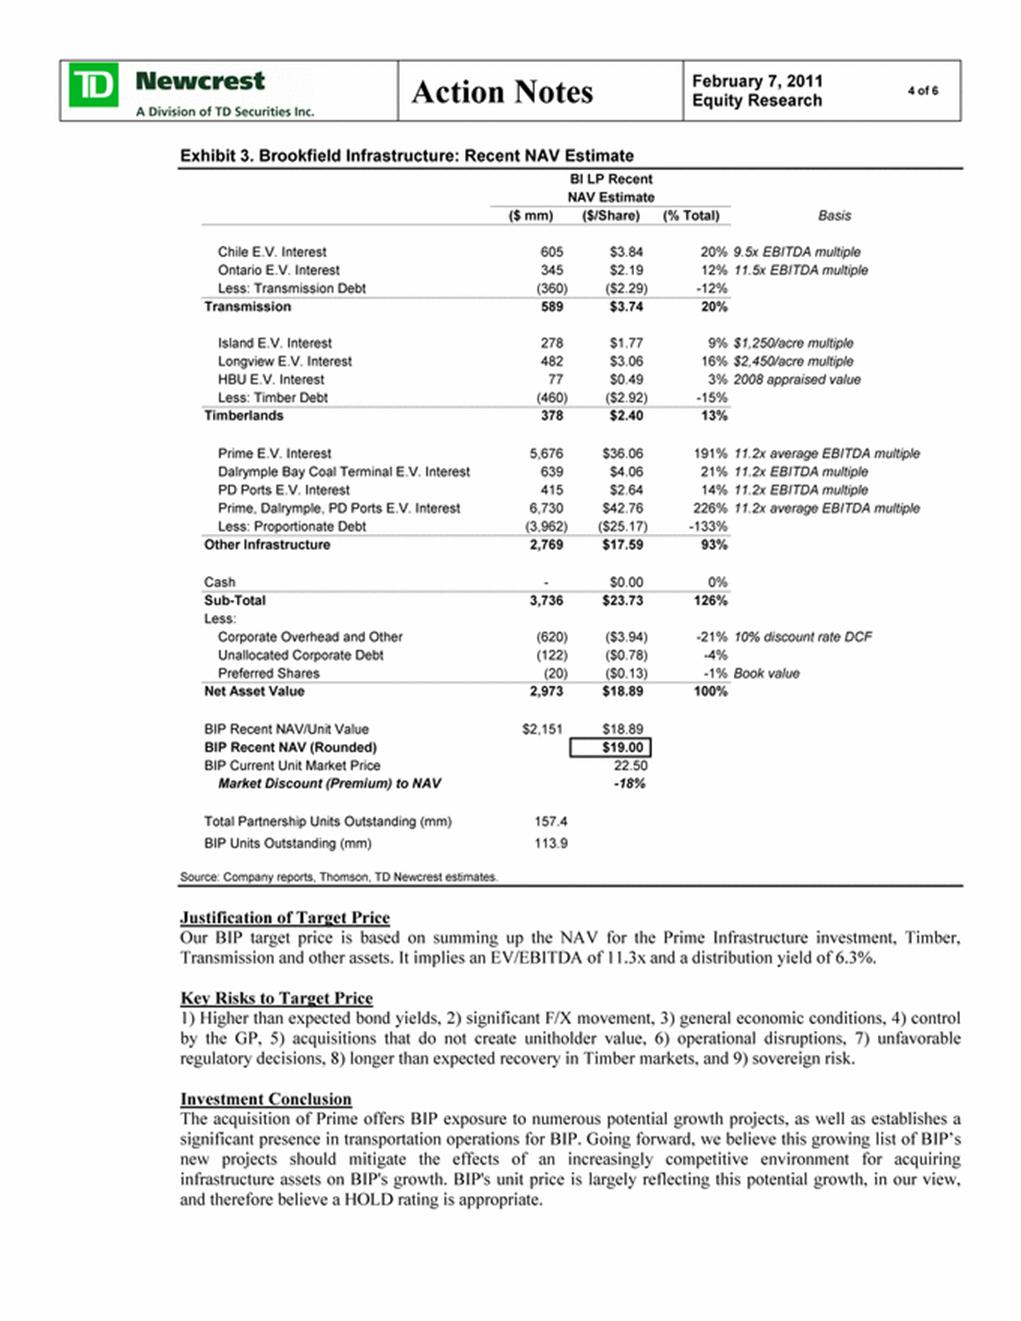
| Action Notes February 7, 2011 Equity Research 4 of 6 Exhibit 3. Brookfield Infrastructure: Recent NAV Estimate BI LP Recent NAV Estimate ($ mm) ($/Share) (% Total) Basis Chile E.V. Interest 605 $3.84 20% 9.5x EBITDA multiple Ontario E.V. Interest 345 $2.19 12% 11.5x EBITDA multiple Less: Transmission Debt (360) ($2.29) -12% Transmission 589 $3.74 20% Island E.V. Interest 278 $1.77 9% $1,250/acre multiple Longview E.V. Interest 482 $3.06 16% $2,450/acre multiple HBU E.V. Interest 77 $0.49 3% 2008 appraised value Less: Timber Debt (460) ($2.92) -15% Timberlands 378 $2.40 13% Prime E.V. Interest 5,676 $36.06 191% 11.2x average EBITDA multiple Dalrymple Bay Coal Terminal E.V. Interest 639 $4.06 21% 11.2x EBITDA multiple PD Ports E.V. Interest 415 $2.64 14% 11.2x EBITDA multiple Prime, Dalrymple, PD Ports E.V. Interest 6,730 $42.76 226% 11.2x average EBITDA multiple Less: Proportionate Debt (3,962) ($25.17) -133% Other Infrastructure 2,769 $17.59 93% Cash - $0.00 0% Sub-Total 3,736 $23.73 126% Less: Corporate Overhead and Other (620) ($3.94) -21% 10% discount rate DCF Unallocated Corporate Debt (122) ($0.78) -4% Preferred Shares (20) ($0.13) -1% Book value Net Asset Value 2,973 $18.89 100% BIP Recent NAV/Unit Value $2,151 $18.89 BIP Recent NAV (Rounded) $19.00 BIP Current Unit Market Price 22.50 Market Discount (Premium) to NAV -18% Total Partnership Units Outstanding (mm) 157.4 BIP Units Outstanding (mm) 113.9 Source: Company reports, Thomson, TD Newcrest estimates. Justification of Target Price Our BIP target price is based on summing up the NAV for the Prime Infrastructure investment, Timber, Transmission and other assets. It implies an EV/EBITDA of 11.3x and a distribution yield of 6.3%. Key Risks to Target Price 1) Higher than expected bond yields, 2) significant F/X movement, 3) general economic conditions, 4) control by the GP, 5) acquisitions that do not create unitholder value, 6) operational disruptions, 7) unfavorable regulatory decisions, 8) longer than expected recovery in Timber markets, and 9) sovereign risk. Investment Conclusion The acquisition of Prime offers BIP exposure to numerous potential growth projects, as well as establishes a significant presence in transportation operations for BIP. Going forward, we believe this growing list of BIP’s new projects should mitigate the effects of an increasingly competitive environment for acquiring infrastructure assets on BIP's growth. BIP's unit price is largely reflecting this potential growth, in our view, and therefore believe a HOLD rating is appropriate. |
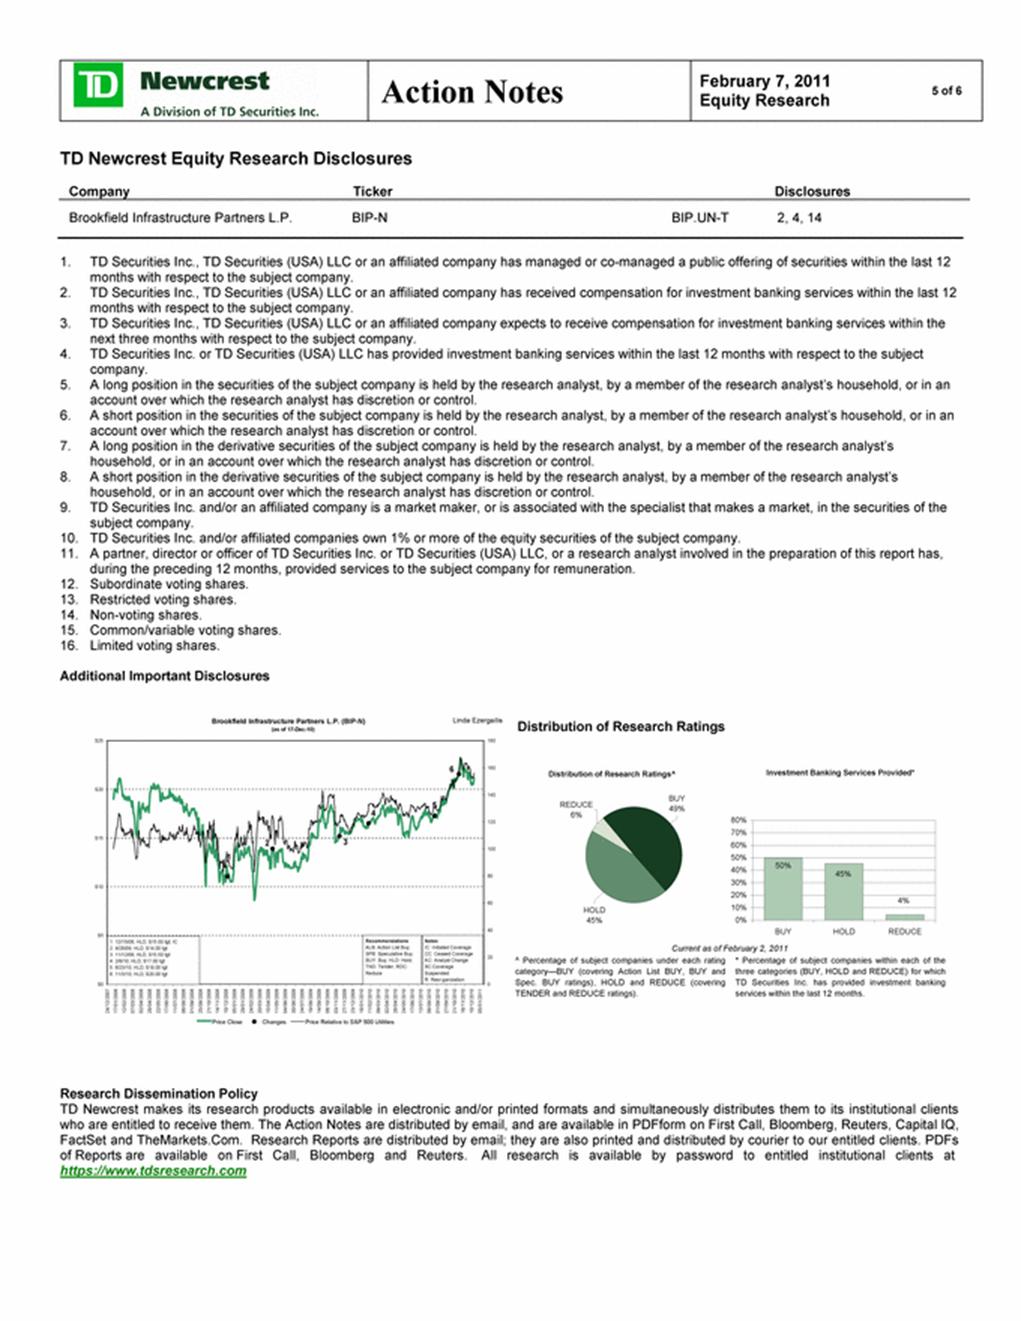
| Action Notes February 7, 2011 Equity Research 5 of 6 TD Newcrest Equity Research Disclosures Company Ticker Disclosures Brookfield Infrastructure Partners L.P. BIP-N BIP.UN-T 2, 4, 14 1. TD Securities Inc., TD Securities (USA) LLC or an affiliated company has managed or co-managed a public offering of securities within the last 12 months with respect to the subject company. 2. TD Securities Inc., TD Securities (USA) LLC or an affiliated company has received compensation for investment banking services within the last 12 months with respect to the subject company. 3. TD Securities Inc., TD Securities (USA) LLC or an affiliated company expects to receive compensation for investment banking services within the next three months with respect to the subject company. 4. TD Securities Inc. or TD Securities (USA) LLC has provided investment banking services within the last 12 months with respect to the subject company. 5. A long position in the securities of the subject company is held by the research analyst, by a member of the research analyst’s household, or in an account over which the research analyst has discretion or control. 6. A short position in the securities of the subject company is held by the research analyst, by a member of the research analyst’s household, or in an account over which the research analyst has discretion or control. 7. A long position in the derivative securities of the subject company is held by the research analyst, by a member of the research analyst’s household, or in an account over which the research analyst has discretion or control. 8. A short position in the derivative securities of the subject company is held by the research analyst, by a member of the research analyst’s household, or in an account over which the research analyst has discretion or control. 9. TD Securities Inc. and/or an affiliated company is a market maker, or is associated with the specialist that makes a market, in the securities of the subject company. 10. TD Securities Inc. and/or affiliated companies own 1% or more of the equity securities of the subject company. 11. A partner, director or officer of TD Securities Inc. or TD Securities (USA) LLC, or a research analyst involved in the preparation of this report has, during the preceding 12 months, provided services to the subject company for remuneration. 12. Subordinate voting shares. 13. Restricted voting shares. 14. Non-voting shares. 15. Common/variable voting shares. 16. Limited voting shares. Additional Important Disclosures Brookfield Infrastructure Partners L.P. (BIP-N) (as of 17-Dec-10) 4 3 2 6 1 5 $0 $5 $10 $15 $20 $25 24/12/2007 17/01/2008 12/02/2008 07/03/2008 02/04/2008 28/04/2008 22/05/2008 17/06/2008 11/07/2008 06/08/2008 01/09/2008 25/09/2008 21/10/2008 14/11/2008 10/12/2008 05/01/2009 29/01/2009 24/02/2009 20/03/2009 15/04/2009 11/05/2009 04/06/2009 30/06/2009 24/07/2009 19/08/2009 14/09/2009 08/10/2009 03/11/2009 27/11/2009 23/12/2009 18/01/2010 11/02/2010 09/03/2010 02/04/2010 28/04/2010 24/05/2010 17/06/2010 13/07/2010 06/08/2010 01/09/2010 27/09/2010 21/10/2010 16/11/2010 10/12/2010 05/01/2011 0 20 40 60 80 100 120 140 160 180 Price Close Changes Price Relative to S&P 500 Utilities Linda Ezergailis Recommendations ALB: Action List Buy; SPB: Speculative Buy; BUY: Buy; HLD: Hold; TND: Tender; RDC: Reduce Notes IC: Initiated Coverage CC: Ceased Coverage AC: Analyst Change SC:Coverage Suspended R: Reorganization 1: 12/15/08; HLD, $15.00 tgt; IC 2: 4/28/09; HLD, $14.00 tgt 3: 11/12/09; HLD, $15.50 tgt 4: 2/8/10; HLD, $17.00 tgt 5: 8/23/10; HLD, $19.00 tgt 6: 11/3/10; HLD, $20.00 tgt Distribution of Research Ratings ^ Percentage of subject companies under each rating category—BUY (covering Action List BUY, BUY and Spec. BUY ratings), HOLD and REDUCE (covering TENDER and REDUCE ratings). * Percentage of subject companies within each of the three categories (BUY, HOLD and REDUCE) for which TD Securities Inc. has provided investment banking services within the last 12 months. Current as of February 2, 2011 Investment Banking Services Provided* 45% 50% 4% 0% 10% 20% 30% 40% 50% 60% 70% 80% BUY HOLD REDUCE Distribution of Research Ratings^ HOLD 45% REDUCE 6% BUY 49% Research Dissemination Policy TD Newcrest makes its research products available in electronic and/or printed formats and simultaneously distributes them to its institutional clients who are entitled to receive them. The Action Notes are distributed by email, and are available in PDFform on First Call, Bloomberg, Reuters, Capital IQ, FactSet and TheMarkets.Com. Research Reports are distributed by email; they are also printed and distributed by courier to our entitled clients. PDFs of Reports are available on First Call, Bloomberg and Reuters. All research is available by password to entitled institutional clients at https://www.tdsresearch.com |

| Action Notes February 7, 2011 Equity Research 6 of 6 Research Ratings ACTION LIST BUY: The stock's total return is expected to exceed a minimum of 15%, on a risk-adjusted basis, over the next 12 months and it is a top pick in the Analyst's sector. BUY: The stock’s total return is expected to exceed a minimum of 15%, on a risk-adjusted basis, over the next 12 months. SPECULATIVE BUY: The stock's total return is expected to exceed 30% over the next 12 months; however, there is material event risk associated with the investment that could result in significant loss. HOLD: The stock’s total return is expected to be between 0% and 15%, on a risk-adjusted basis, over the next 12 months. TENDER: Investors are advised to tender their shares to a specific offer for the company's securities or to support a proposed combination reflecting our view that a superior offer is not forthcoming. REDUCE: The stock’s total return is expected to be negative over the next 12 months. Overall Risk Rating in order of increasing risk: Low (7.3% of coverage universe), Medium (33.3%), High (49.4%), Speculative (10.0%) Analyst Certification Each analyst of TD Securities Inc. whose name appears on page 1 of this research report hereby certifies that (i) the recommendations and opinions expressed in the research report accurately reflect the research analyst's personal views about any and all of the securities or issuers discussed herein that are within the analyst’s coverage universe and (ii) no part of the research analyst's compensation was, is, or will be, directly or indirectly, related to the provision of specific recommendations or views expressed by the research analyst in the research report. Disclaimer This report is produced entirely by TD Securities Inc. Although the information contained in this report has been obtained from sources that TD Securities Inc. believes to be reliable, we do not guarantee its accuracy, and as such, the information may be incomplete or condensed. All opinions, estimates and other information included in this report constitute our judgment as of the date hereof and are subject to change without notice. TD Securities Inc. will furnish upon request publicly available information on which this report is based. TD Securities (USA) LLC has accepted responsibility in the United States for the contents of this research. TD Securities Limited has accepted responsibility in Europe for the contents this report. Canadian clients wishing to effect transactions in any security discussed should do so through a qualified salesperson of TD Securities Inc. Canadian retail investors are served by TD Waterhouse Canada Inc., a subsidiary of The Toronto-Dominion Bank. U.S. clients wishing to effect transactions in any security discussed should do so through a qualified salesperson of TD Securities (USA) LLC. European clients wishing to effect transactions in any security discussed should do so through a qualified salesperson of TD Securities Limited. Insofar as the information on this report is issued in the U.K. and Europe, it has been issued with the prior approval of TD Securities Limited and only to persons falling within Articles 19 and 49 of the Financial Services & Markets Act 2000 (Financial Promotion) Order 2001, namely persons sufficiently expert to understand the risks involved. No recipient may pass on the information contained in this report to any other person without the prior written consent of TD Securities Inc. TD Newcrest is the trade name that TD Securities Inc., TD Securities (USA) LLC and TD Securities Limited use to market their institutional equity services. TD Securities Inc., TD Securities (USA) LLC and TD Securities Limited are wholly owned subsidiaries of The Toronto-Dominion Bank. TD Securities Limited is authorised and regulated by the Financial Services Authority. The activities of The Toronto-Dominion Bank under its Financial Services Licence are regulated by the Australian Securities and Investment Commission in Australia. Copyright 2011 by TD Securities. All rights reserved. Full disclosures for all companies covered by TD Newcrest can be viewed at https://www.tdsresearch.com/equities/disclosures by TD Newcrest’s institutional equity clients. |
Annex B
NOTE X. CORRECTION OF IMMATERIAL ERROR
It was determined that the previously issued consolidated and combined financial statements for the years ended and as of December 31, 2010 and 2009 required correction for certain immaterial adjustments. During 2010, Brookfield Infrastructure completed a purchase price allocation exercise for its acquisition of its UK port operations acquired in 2009. The result of this purchase price allocation was a $28 million bargain purchase that should have been recorded in the Partnership’s 2009 financials that was recorded in 2010. After considering both quantitative and qualitative information applicable to the error, the Partnership believes that the error is not material to its previously issued historical consolidated and combined financial statements. However, the Partnership has sought to correct its disclosures by adjusting its comparative financials.
The effect of these adjustments on the consolidated and combined statement of financial position is summarized below:
| | As at December 31, | |
| | 2010 | | 2009 | |
US$ MILLIONS | | As
previously
reported | | Adjustment | | As
Adjusted | | As
previously
reported | | Adjustment | | As
Adjusted | |
Property, plant and equipment | | 2,995 | | — | | 3,131 | | 1,183 | | (33 | ) | 1,150 | |
Intangible assets | | 2,903 | | — | | 2,903 | | 306 | | 39 | | 345 | |
Non-recourse borrowings (non-current) | | 3,960 | | — | | 3,960 | | 1,985 | | (59 | ) | 1,926 | |
Deferred income tax liability | | 1,025 | | — | | 1,305 | | 681 | | 13 | | 694 | |
Retained earnings (deficit) | | 306 | | — | | 297 | | (44 | ) | 28 | | (16 | ) |
Non-controlling interest | | 1,605 | | — | | 1,552 | | 1,281 | | 24 | | 1,305 | |
The effect of these adjustments on the consolidated and combined statement of operating results is summarized below:
| | For the years ended December 31, | |
| | 2010 | | 2009 | |
US$ MILLIONS | | As
previously
reported | | Adjustment | | As
Adjusted | | As
previously
reported | | Adjustment | | As
Adjusted | |
Fair value gains and other items | | $ | 433 | | $ | (28 | ) | $ | 405 | | $ | — | | $ | 28 | | $ | 28 | |
Net income (loss) | | 510 | | (28 | ) | 482 | | (59 | ) | 28 | | (31 | ) |
Net income attributable to partnership | | 467 | | (28 | ) | 439 | | 25 | | 28 | | 53 | |
Earnings per unit — basic and diluted | | 4.25 | | (0.26 | ) | 3.99 | | 0.52 | | 0.59 | | 1.11 | |
| | | | | | | | | | | | | | | | | | | |


