UNITED STATES
SECURITIES AND EXCHANGE COMMISSION
Washington, D.C. 20549
FORM N-CSR
CERTIFIED SHAREHOLDER REPORT OF REGISTERED
MANAGEMENT INVESTMENT COMPANIES
Investment Company Act file number: 811-22099
Gateway Trust
(Exact name of Registrant as specified in charter)
888 Boylston Street, Suite 800 Boston, Massachusetts 02199-8197
(Address of principal executive offices) (Zip code)
Susan McWhan Tobin, Esq.
Natixis Distribution, LLC
888 Boylston Street, Suite 800
Boston, Massachusetts 02199-8197
(Name and address of agent for service)
Registrant’s telephone number, including area code: (617) 449-2139
Date of fiscal year end: December 31
Date of reporting period: June 30, 2024
Item 1. Reports to Stockholders.
| (a) | The Registrant’s Tailored Shareholder Reports transmitted to shareholders pursuant to Rule 30e-1 under the Investment Company Act of 1940 are as follows: |
Class A
GCPAX
Gateway Equity Call Premium Fund

Semi-annual Shareholder Report - June 30, 2024
This semi-annual shareholder report contains important information about Gateway Equity Call Premium Fund for the period of January 1, 2024 to June 30, 2024. You can find additional information (including tax information) about the Fund at im.natixis.com/funddocuments.You can also request the information by contacting us at 800-225-5478 or by contacting your financial intermediary directly.
What were the fund costs for the last six months? (based on a hypothetical $10,000 investment)
| Class Name | Cost of a $10,000 investment | Costs paid as a percentage of a $10,000 investment |
|---|---|---|
| Class A | $49 | 0.93% |
Key Fund Statistics
| Total Net Assets | $322,957,284 |
| # of Portfolio Holdings (including overnight repurchase agreements and derivatives) | 263 |
| Portfolio Turnover Rate | 7% |
| Total Advisory Fees Paid | $685,527 |
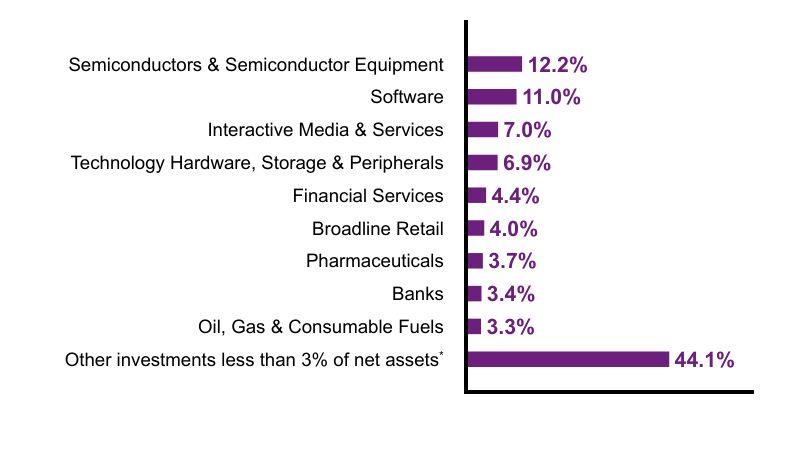
What did the Fund invest in? (% of Net Assets)
Industry Summary

| Value | Value |
|---|---|
Other investments less than 3% of net assetsFootnote Reference* | 44.1% |
| Oil, Gas & Consumable Fuels | 3.3% |
| Banks | 3.4% |
| Pharmaceuticals | 3.7% |
| Broadline Retail | 4.0% |
| Financial Services | 4.4% |
| Technology Hardware, Storage & Peripherals | 6.9% |
| Interactive Media & Services | 7.0% |
| Software | 11.0% |
| Semiconductors & Semiconductor Equipment | 12.2% |
| Footnote | Description |
Footnote* | Net of other assets less liabilities (including open written options) |
Top Ten Holdings
| Microsoft Corp. | 7.3% |
| Apple, Inc. | 6.8% |
| NVIDIA Corp. | 6.7% |
| Amazon.com, Inc. | 4.0% |
| Alphabet, Inc., Class C | 2.8% |
| Meta Platforms, Inc., Class A | 2.5% |
| Berkshire Hathaway, Inc., Class B | 2.2% |
| Eli Lilly & Co. | 1.7% |
| Broadcom, Inc. | 1.7% |
| Alphabet, Inc., Class A | 1.6% |
Material Fund Changes
There were no material fund changes during the period.
There were no changes in or disagreements with Accountants during the period.
Additional Information
For additional information about the Fund, including its prospectus, financial information, holdings and proxy information, scan the QR code or visit im.natixis.com/funddocuments

Phone: 800-225-5478
Email: secretaryofthefunds@natixis.com
TGECP88A-0624
Class C
GCPCX
Gateway Equity Call Premium Fund

Semi-annual Shareholder Report - June 30, 2024
This semi-annual shareholder report contains important information about Gateway Equity Call Premium Fund for the period of January 1, 2024 to June 30, 2024. You can find additional information (including tax information) about the Fund at im.natixis.com/funddocuments.You can also request the information by contacting us at 800-225-5478 or by contacting your financial intermediary directly.
What were the fund costs for the last six months? (based on a hypothetical $10,000 investment)
| Class Name | Cost of a $10,000 investment | Costs paid as a percentage of a $10,000 investment |
|---|---|---|
| Class C | $88 | 1.68% |
Key Fund Statistics
| Total Net Assets | $322,957,284 |
| # of Portfolio Holdings (including overnight repurchase agreements and derivatives) | 263 |
| Portfolio Turnover Rate | 7% |
| Total Advisory Fees Paid | $685,527 |
What did the Fund invest in? (% of Net Assets)
Industry Summary

| Value | Value |
|---|---|
Other investments less than 3% of net assetsFootnote Reference* | 44.1% |
| Oil, Gas & Consumable Fuels | 3.3% |
| Banks | 3.4% |
| Pharmaceuticals | 3.7% |
| Broadline Retail | 4.0% |
| Financial Services | 4.4% |
| Technology Hardware, Storage & Peripherals | 6.9% |
| Interactive Media & Services | 7.0% |
| Software | 11.0% |
| Semiconductors & Semiconductor Equipment | 12.2% |
| Footnote | Description |
Footnote* | Net of other assets less liabilities (including open written options) |
Top Ten Holdings
| Microsoft Corp. | 7.3% |
| Apple, Inc. | 6.8% |
| NVIDIA Corp. | 6.7% |
| Amazon.com, Inc. | 4.0% |
| Alphabet, Inc., Class C | 2.8% |
| Meta Platforms, Inc., Class A | 2.5% |
| Berkshire Hathaway, Inc., Class B | 2.2% |
| Eli Lilly & Co. | 1.7% |
| Broadcom, Inc. | 1.7% |
| Alphabet, Inc., Class A | 1.6% |
Material Fund Changes
There were no material fund changes during the period.
There were no changes in or disagreements with Accountants during the period.
Additional Information
For additional information about the Fund, including its prospectus, financial information, holdings and proxy information, scan the QR code or visit im.natixis.com/funddocuments

Phone: 800-225-5478
Email: secretaryofthefunds@natixis.com
TGECP88C-0624
Class N
GCPNX
Gateway Equity Call Premium Fund

Semi-annual Shareholder Report - June 30, 2024
This semi-annual shareholder report contains important information about Gateway Equity Call Premium Fund for the period of January 1, 2024 to June 30, 2024. You can find additional information (including tax information) about the Fund at im.natixis.com/funddocuments.You can also request the information by contacting us at 800-225-5478 or by contacting your financial intermediary directly.
What were the fund costs for the last six months? (based on a hypothetical $10,000 investment)
| Class Name | Cost of a $10,000 investment | Costs paid as a percentage of a $10,000 investment |
|---|---|---|
| Class N | $33 | 0.63% |
Key Fund Statistics
| Total Net Assets | $322,957,284 |
| # of Portfolio Holdings (including overnight repurchase agreements and derivatives) | 263 |
| Portfolio Turnover Rate | 7% |
| Total Advisory Fees Paid | $685,527 |
What did the Fund invest in? (% of Net Assets)
Industry Summary

| Value | Value |
|---|---|
Other investments less than 3% of net assetsFootnote Reference* | 44.1% |
| Oil, Gas & Consumable Fuels | 3.3% |
| Banks | 3.4% |
| Pharmaceuticals | 3.7% |
| Broadline Retail | 4.0% |
| Financial Services | 4.4% |
| Technology Hardware, Storage & Peripherals | 6.9% |
| Interactive Media & Services | 7.0% |
| Software | 11.0% |
| Semiconductors & Semiconductor Equipment | 12.2% |
| Footnote | Description |
Footnote* | Net of other assets less liabilities (including open written options) |
Top Ten Holdings
| Microsoft Corp. | 7.3% |
| Apple, Inc. | 6.8% |
| NVIDIA Corp. | 6.7% |
| Amazon.com, Inc. | 4.0% |
| Alphabet, Inc., Class C | 2.8% |
| Meta Platforms, Inc., Class A | 2.5% |
| Berkshire Hathaway, Inc., Class B | 2.2% |
| Eli Lilly & Co. | 1.7% |
| Broadcom, Inc. | 1.7% |
| Alphabet, Inc., Class A | 1.6% |
Material Fund Changes
There were no material fund changes during the period.
There were no changes in or disagreements with Accountants during the period.
Additional Information
For additional information about the Fund, including its prospectus, financial information, holdings and proxy information, scan the QR code or visit im.natixis.com/funddocuments

Phone: 800-225-5478
Email: secretaryofthefunds@natixis.com
TGECP88N-0624
Class Y
GCPYX
Gateway Equity Call Premium Fund

Semi-annual Shareholder Report - June 30, 2024
This semi-annual shareholder report contains important information about Gateway Equity Call Premium Fund for the period of January 1, 2024 to June 30, 2024. You can find additional information (including tax information) about the Fund at im.natixis.com/funddocuments.You can also request the information by contacting us at 800-225-5478 or by contacting your financial intermediary directly.
What were the fund costs for the last six months? (based on a hypothetical $10,000 investment)
| Class Name | Cost of a $10,000 investment | Costs paid as a percentage of a $10,000 investment |
|---|---|---|
| Class Y | $36 | 0.68% |
Key Fund Statistics
| Total Net Assets | $322,957,284 |
| # of Portfolio Holdings (including overnight repurchase agreements and derivatives) | 263 |
| Portfolio Turnover Rate | 7% |
| Total Advisory Fees Paid | $685,527 |
What did the Fund invest in? (% of Net Assets)
Industry Summary
| Value | Value |
|---|---|
Other investments less than 3% of net assetsFootnote Reference* | 44.1% |
| Oil, Gas & Consumable Fuels | 3.3% |
| Banks | 3.4% |
| Pharmaceuticals | 3.7% |
| Broadline Retail | 4.0% |
| Financial Services | 4.4% |
| Technology Hardware, Storage & Peripherals | 6.9% |
| Interactive Media & Services | 7.0% |
| Software | 11.0% |
| Semiconductors & Semiconductor Equipment | 12.2% |
| Footnote | Description |
Footnote* | Net of other assets less liabilities (including open written options) |
Top Ten Holdings
| Microsoft Corp. | 7.3% |
| Apple, Inc. | 6.8% |
| NVIDIA Corp. | 6.7% |
| Amazon.com, Inc. | 4.0% |
| Alphabet, Inc., Class C | 2.8% |
| Meta Platforms, Inc., Class A | 2.5% |
| Berkshire Hathaway, Inc., Class B | 2.2% |
| Eli Lilly & Co. | 1.7% |
| Broadcom, Inc. | 1.7% |
| Alphabet, Inc., Class A | 1.6% |
Material Fund Changes
There were no material fund changes during the period.
There were no changes in or disagreements with Accountants during the period.
Additional Information
For additional information about the Fund, including its prospectus, financial information, holdings and proxy information, scan the QR code or visit im.natixis.com/funddocuments

Phone: 800-225-5478
Email: secretaryofthefunds@natixis.com
TGECP88Y-0624
Class A
GATEX
Gateway Fund

Semi-annual Shareholder Report - June 30, 2024
This semi-annual shareholder report contains important information about Gateway Fund for the period of January 1, 2024 to June 30, 2024. You can find additional information (including tax information) about the Fund at im.natixis.com/funddocuments.You can also request the information by contacting us at 800-225-5478 or by contacting your financial intermediary directly.
What were the fund costs for the last six months? (based on a hypothetical $10,000 investment)
| Class Name | Cost of a $10,000 investment | Costs paid as a percentage of a $10,000 investment |
|---|---|---|
| Class A | $49 | 0.94% |
Key Fund Statistics
| Total Net Assets | $6,500,417,542 |
| # of Portfolio Holdings (including overnight repurchase agreements and derivatives) | 210 |
| Portfolio Turnover Rate | 4% |
| Total Advisory Fees Paid | $18,089,368 |
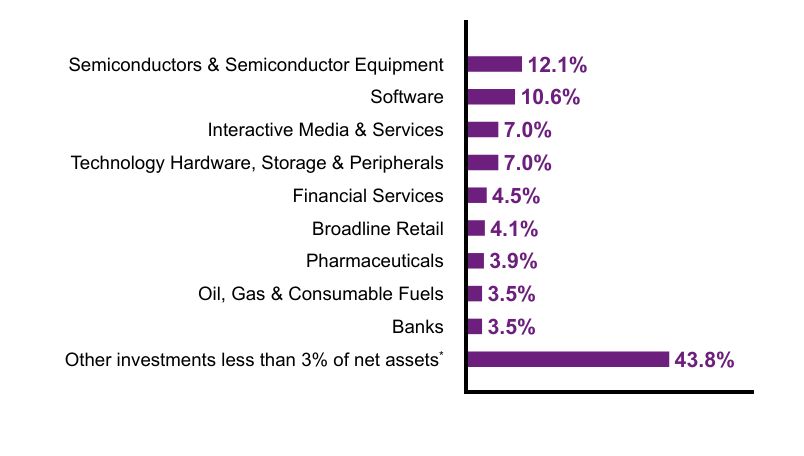
What did the Fund invest in? (% of Net Assets)
Industry Summary
| Value | Value |
|---|---|
Other investments less than 3% of net assetsFootnote Reference* | 43.8% |
| Banks | 3.5% |
| Oil, Gas & Consumable Fuels | 3.5% |
| Pharmaceuticals | 3.9% |
| Broadline Retail | 4.1% |
| Financial Services | 4.5% |
| Technology Hardware, Storage & Peripherals | 7.0% |
| Interactive Media & Services | 7.0% |
| Software | 10.6% |
| Semiconductors & Semiconductor Equipment | 12.1% |
| Footnote | Description |
Footnote* | Net of other assets less liabilities (including open written options) |
Top Ten Holdings
| Microsoft Corp. | 7.6% |
| Apple, Inc. | 6.9% |
| NVIDIA Corp. | 6.8% |
| Amazon.com, Inc. | 4.1% |
| Alphabet, Inc., Class C | 3.6% |
| Meta Platforms, Inc., Class A | 2.6% |
| Berkshire Hathaway, Inc., Class B | 2.1% |
| Eli Lilly & Co. | 1.8% |
| Broadcom, Inc. | 1.8% |
| JPMorgan Chase & Co. | 1.7% |
Material Fund Changes
There were no material fund changes during the period.
There were no changes in or disagreements with Accountants during the period.
Additional Information
For additional information about the Fund, including its prospectus, financial information, holdings and proxy information, scan the QR code or visit im.natixis.com/funddocuments

Phone: 800-225-5478
Email: secretaryofthefunds@natixis.com
TGF88A-0624
Class C
GTECX
Gateway Fund

Semi-annual Shareholder Report - June 30, 2024
This semi-annual shareholder report contains important information about Gateway Fund for the period of January 1, 2024 to June 30, 2024. You can find additional information (including tax information) about the Fund at im.natixis.com/funddocuments.You can also request the information by contacting us at 800-225-5478 or by contacting your financial intermediary directly.
What were the fund costs for the last six months? (based on a hypothetical $10,000 investment)
| Class Name | Cost of a $10,000 investment | Costs paid as a percentage of a $10,000 investment |
|---|---|---|
| Class C | $88 | 1.70% |
Key Fund Statistics
| Total Net Assets | $6,500,417,542 |
| # of Portfolio Holdings (including overnight repurchase agreements and derivatives) | 210 |
| Portfolio Turnover Rate | 4% |
| Total Advisory Fees Paid | $18,089,368 |
What did the Fund invest in? (% of Net Assets)
Industry Summary

| Value | Value |
|---|---|
Other investments less than 3% of net assetsFootnote Reference* | 43.8% |
| Banks | 3.5% |
| Oil, Gas & Consumable Fuels | 3.5% |
| Pharmaceuticals | 3.9% |
| Broadline Retail | 4.1% |
| Financial Services | 4.5% |
| Technology Hardware, Storage & Peripherals | 7.0% |
| Interactive Media & Services | 7.0% |
| Software | 10.6% |
| Semiconductors & Semiconductor Equipment | 12.1% |
| Footnote | Description |
Footnote* | Net of other assets less liabilities (including open written options) |
Top Ten Holdings
| Microsoft Corp. | 7.6% |
| Apple, Inc. | 6.9% |
| NVIDIA Corp. | 6.8% |
| Amazon.com, Inc. | 4.1% |
| Alphabet, Inc., Class C | 3.6% |
| Meta Platforms, Inc., Class A | 2.6% |
| Berkshire Hathaway, Inc., Class B | 2.1% |
| Eli Lilly & Co. | 1.8% |
| Broadcom, Inc. | 1.8% |
| JPMorgan Chase & Co. | 1.7% |
Material Fund Changes
There were no material fund changes during the period.
There were no changes in or disagreements with Accountants during the period.
Additional Information
For additional information about the Fund, including its prospectus, financial information, holdings and proxy information, scan the QR code or visit im.natixis.com/funddocuments

Phone: 800-225-5478
Email: secretaryofthefunds@natixis.com
TGF88C-0624
Class N
GTENX
Gateway Fund

Semi-annual Shareholder Report - June 30, 2024
This semi-annual shareholder report contains important information about Gateway Fund for the period of January 1, 2024 to June 30, 2024. You can find additional information (including tax information) about the Fund at im.natixis.com/funddocuments.You can also request the information by contacting us at 800-225-5478 or by contacting your financial intermediary directly.
What were the fund costs for the last six months? (based on a hypothetical $10,000 investment)
| Class Name | Cost of a $10,000 investment | Costs paid as a percentage of a $10,000 investment |
|---|---|---|
| Class N | $34 | 0.65% |
Key Fund Statistics
| Total Net Assets | $6,500,417,542 |
| # of Portfolio Holdings (including overnight repurchase agreements and derivatives) | 210 |
| Portfolio Turnover Rate | 4% |
| Total Advisory Fees Paid | $18,089,368 |
What did the Fund invest in? (% of Net Assets)
Industry Summary

| Value | Value |
|---|---|
Other investments less than 3% of net assetsFootnote Reference* | 43.8% |
| Banks | 3.5% |
| Oil, Gas & Consumable Fuels | 3.5% |
| Pharmaceuticals | 3.9% |
| Broadline Retail | 4.1% |
| Financial Services | 4.5% |
| Technology Hardware, Storage & Peripherals | 7.0% |
| Interactive Media & Services | 7.0% |
| Software | 10.6% |
| Semiconductors & Semiconductor Equipment | 12.1% |
| Footnote | Description |
Footnote* | Net of other assets less liabilities (including open written options) |
Top Ten Holdings
| Microsoft Corp. | 7.6% |
| Apple, Inc. | 6.9% |
| NVIDIA Corp. | 6.8% |
| Amazon.com, Inc. | 4.1% |
| Alphabet, Inc., Class C | 3.6% |
| Meta Platforms, Inc., Class A | 2.6% |
| Berkshire Hathaway, Inc., Class B | 2.1% |
| Eli Lilly & Co. | 1.8% |
| Broadcom, Inc. | 1.8% |
| JPMorgan Chase & Co. | 1.7% |
Material Fund Changes
There were no material fund changes during the period.
There were no changes in or disagreements with Accountants during the period.
Additional Information
For additional information about the Fund, including its prospectus, financial information, holdings and proxy information, scan the QR code or visit im.natixis.com/funddocuments

Phone: 800-225-5478
Email: secretaryofthefunds@natixis.com
TGF88N-0624
Class Y
GTEYX
Gateway Fund

Semi-annual Shareholder Report - June 30, 2024
This semi-annual shareholder report contains important information about Gateway Fund for the period of January 1, 2024 to June 30, 2024. You can find additional information (including tax information) about the Fund at im.natixis.com/funddocuments.You can also request the information by contacting us at 800-225-5478 or by contacting your financial intermediary directly.
What were the fund costs for the last six months? (based on a hypothetical $10,000 investment)
| Class Name | Cost of a $10,000 investment | Costs paid as a percentage of a $10,000 investment |
|---|---|---|
| Class Y | $36 | 0.70% |
Key Fund Statistics
| Total Net Assets | $6,500,417,542 |
| # of Portfolio Holdings (including overnight repurchase agreements and derivatives) | 210 |
| Portfolio Turnover Rate | 4% |
| Total Advisory Fees Paid | $18,089,368 |
What did the Fund invest in? (% of Net Assets)
Industry Summary

| Value | Value |
|---|---|
Other investments less than 3% of net assetsFootnote Reference* | 43.8% |
| Banks | 3.5% |
| Oil, Gas & Consumable Fuels | 3.5% |
| Pharmaceuticals | 3.9% |
| Broadline Retail | 4.1% |
| Financial Services | 4.5% |
| Technology Hardware, Storage & Peripherals | 7.0% |
| Interactive Media & Services | 7.0% |
| Software | 10.6% |
| Semiconductors & Semiconductor Equipment | 12.1% |
| Footnote | Description |
Footnote* | Net of other assets less liabilities (including open written options) |
Top Ten Holdings
| Microsoft Corp. | 7.6% |
| Apple, Inc. | 6.9% |
| NVIDIA Corp. | 6.8% |
| Amazon.com, Inc. | 4.1% |
| Alphabet, Inc., Class C | 3.6% |
| Meta Platforms, Inc., Class A | 2.6% |
| Berkshire Hathaway, Inc., Class B | 2.1% |
| Eli Lilly & Co. | 1.8% |
| Broadcom, Inc. | 1.8% |
| JPMorgan Chase & Co. | 1.7% |
Material Fund Changes
There were no material fund changes during the period.
There were no changes in or disagreements with Accountants during the period.
Additional Information
For additional information about the Fund, including its prospectus, financial information, holdings and proxy information, scan the QR code or visit im.natixis.com/funddocuments

Phone: 800-225-5478
Email: secretaryofthefunds@natixis.com
TGF88Y-0624
| (b) | Not applicable. |
Item 2. Code of Ethics.
Not applicable.
Item 3. Audit Committee Financial Expert.
Not applicable.
Item 4. Principal Accountant Fees and Services.
Not applicable.
Item 5. Audit Committee of Listed Registrants.
Not applicable.
Item 6. Schedule of Investments.
The Schedule of Investments are incorporated by reference as part of the Financial Statements and Other Important Information for Open-End Management Investment Companies filed as Item 7 herewith.
Item 7. Financial Statements and Financial Highlights for Open-End Management Investment Companies.
The Registrant’s Financial Statements and Other Important Information are as follows:


Gateway Fund |
Gateway Equity Call Premium Fund |
Mirova Global Green Bond Fund |
Mirova Global Sustainable Equity Fund |
Mirova International Sustainable Equity Fund |
Shares | Description | Value (†) |
Common Stocks — 100.0% of Net Assets | ||
Aerospace & Defense — 1.6% | ||
139,958 | Boeing Co.(a)(b) | $25,473,755 |
153,873 | General Electric Co.(a) | 24,461,191 |
41,278 | HEICO Corp.(a) | 9,230,174 |
438,402 | RTX Corp.(a) | 44,011,177 |
103,176,297 | ||
Air Freight & Logistics — 0.5% | ||
216,724 | United Parcel Service, Inc., Class B(a) | 29,658,679 |
Automobile Components — 0.1% | ||
36,852 | Autoliv, Inc.(a) | 3,942,796 |
15,796 | Magna International, Inc. | 661,852 |
4,604,648 | ||
Automobiles — 1.4% | ||
3,363 | Ferrari NV(a) | 1,373,349 |
1,177,145 | Ford Motor Co.(a) | 14,761,398 |
382,758 | Tesla, Inc.(a)(b) | 75,740,153 |
91,874,900 | ||
Banks — 3.5% | ||
1,798,636 | Bank of America Corp.(a) | 71,531,754 |
541,030 | JPMorgan Chase & Co.(a) | 109,428,728 |
744,414 | Wells Fargo & Co.(a) | 44,210,747 |
225,171,229 | ||
Beverages — 1.1% | ||
349,444 | Monster Beverage Corp.(a)(b) | 17,454,728 |
320,572 | PepsiCo, Inc.(a) | 52,871,940 |
70,326,668 | ||
Biotechnology — 2.0% | ||
335,866 | AbbVie, Inc.(a) | 57,607,736 |
1,352 | Alnylam Pharmaceuticals, Inc.(b) | 328,536 |
111,552 | Amgen, Inc.(a) | 34,854,423 |
39,867 | Biogen, Inc.(a)(b) | 9,241,968 |
62,713 | Vertex Pharmaceuticals, Inc.(a)(b) | 29,394,837 |
131,427,500 | ||
Broadline Retail — 4.1% | ||
1,364,043 | Amazon.com, Inc.(a)(b) | 263,601,310 |
2,538 | MercadoLibre, Inc.(a)(b) | 4,170,949 |
267,772,259 | ||
Building Products — 0.5% | ||
355,197 | Carrier Global Corp.(a) | 22,405,827 |
17,766 | Lennox International, Inc.(a) | 9,504,454 |
31,910,281 | ||
Capital Markets — 2.3% | ||
78,843 | Brookfield Corp., Class A(a) | 3,275,138 |
295,252 | Charles Schwab Corp.(a) | 21,757,120 |
14,601 | FactSet Research Systems, Inc.(a) | 5,961,150 |
216,194 | Intercontinental Exchange, Inc.(a) | 29,594,797 |
62,241 | KKR & Co., Inc.(a) | 6,550,243 |
414,283 | Morgan Stanley(a) | 40,264,165 |
41,804 | MSCI, Inc.(a) | 20,139,077 |
43,865 | S&P Global, Inc.(a) | 19,563,790 |
147,105,480 | ||
Chemicals — 1.4% | ||
57,441 | Ashland, Inc.(a) | 5,427,600 |
71,767 | Celanese Corp.(a) | 9,680,650 |
275,738 | Corteva, Inc.(a) | 14,873,308 |
267,776 | Dow, Inc.(a) | 14,205,517 |
Shares | Description | Value (†) |
Chemicals — continued | ||
117,596 | Eastman Chemical Co.(a) | $11,520,880 |
167,820 | LyondellBasell Industries NV, Class A(a) | 16,053,661 |
125,903 | Mosaic Co.(a) | 3,638,597 |
66,451 | Olin Corp. | 3,133,165 |
95,921 | RPM International, Inc.(a) | 10,328,773 |
88,862,151 | ||
Commercial Services & Supplies — 1.1% | ||
421,729 | Copart, Inc.(a)(b) | 22,840,843 |
53,505 | Waste Connections, Inc.(a) | 9,382,637 |
185,672 | Waste Management, Inc.(a) | 39,611,264 |
71,834,744 | ||
Communications Equipment — 0.8% | ||
1,032,557 | Cisco Systems, Inc.(a) | 49,056,783 |
367,820 | Telefonaktiebolaget LM Ericsson, ADR(a) | 2,269,449 |
51,326,232 | ||
Construction Materials — 0.4% | ||
43,244 | Martin Marietta Materials, Inc.(a) | 23,429,599 |
Consumer Finance — 0.8% | ||
232,900 | Ally Financial, Inc.(a) | 9,239,143 |
169,338 | Discover Financial Services(a) | 22,151,104 |
389,561 | Synchrony Financial(a) | 18,383,383 |
49,773,630 | ||
Consumer Staples Distribution & Retail — 2.2% | ||
22,203 | Casey's General Stores, Inc.(a) | 8,471,777 |
74,519 | Costco Wholesale Corp.(a) | 63,340,405 |
148,193 | Target Corp.(a) | 21,938,492 |
68,318 | U.S. Foods Holding Corp.(a)(b) | 3,619,487 |
641,255 | Walmart, Inc.(a) | 43,419,376 |
140,789,537 | ||
Containers & Packaging — 0.4% | ||
54,360 | Avery Dennison Corp.(a) | 11,885,814 |
60,185 | Crown Holdings, Inc.(a) | 4,477,162 |
141,364 | WestRock Co.(a) | 7,104,955 |
23,467,931 | ||
Distributors — 0.2% | ||
107,529 | Genuine Parts Co.(a) | 14,873,411 |
Diversified Consumer Services — 0.1% | ||
67,454 | Service Corp. International(a) | 4,798,003 |
Diversified Telecommunication Services — 0.5% | ||
1,619,824 | AT&T, Inc.(a) | 30,954,837 |
Electric Utilities — 0.7% | ||
271,750 | Alliant Energy Corp.(a) | 13,832,075 |
373,580 | American Electric Power Co., Inc.(a) | 32,777,909 |
61,200 | OGE Energy Corp.(a) | 2,184,840 |
48,794,824 | ||
Electrical Equipment — 0.7% | ||
118,720 | Eaton Corp. PLC(a) | 37,224,656 |
31,715 | Hubbell, Inc.(a) | 11,591,198 |
48,815,854 | ||
Electronic Equipment, Instruments & Components — 0.7% | ||
97,069 | CDW Corp.(a) | 21,727,925 |
24,082 | Coherent Corp.(a)(b) | 1,744,982 |
330,537 | Corning, Inc.(a) | 12,841,362 |
33,350 | Zebra Technologies Corp., Class A(a)(b) | 10,302,816 |
46,617,085 | ||
Shares | Description | Value (†) |
Energy Equipment & Services — 0.2% | ||
448,161 | Halliburton Co.(a) | $15,138,879 |
Entertainment — 1.5% | ||
79,556 | Live Nation Entertainment, Inc.(a)(b) | 7,457,580 |
75,624 | Netflix, Inc.(a)(b) | 51,037,125 |
370,308 | Walt Disney Co.(a) | 36,767,881 |
95,262,586 | ||
Financial Services — 4.5% | ||
337,344 | Berkshire Hathaway, Inc., Class B(a)(b) | 137,231,539 |
65,201 | Block, Inc.(a)(b) | 4,204,812 |
82,605 | Mastercard, Inc., Class A(a) | 36,442,022 |
300,792 | PayPal Holdings, Inc.(a)(b) | 17,454,960 |
356,233 | Visa, Inc., Class A(a) | 93,500,475 |
34,671 | Voya Financial, Inc.(a) | 2,466,842 |
291,300,650 | ||
Food Products — 0.8% | ||
61,781 | Bunge Global SA(a) | 6,596,357 |
74,762 | Lamb Weston Holdings, Inc.(a) | 6,285,989 |
575,935 | Mondelez International, Inc., Class A(a) | 37,689,187 |
50,571,533 | ||
Ground Transportation — 0.8% | ||
88,900 | Canadian Pacific Kansas City Ltd.(a) | 6,999,097 |
836,813 | CSX Corp.(a) | 27,991,395 |
77,264 | Old Dominion Freight Line, Inc.(a) | 13,644,822 |
3,720 | Saia, Inc.(a)(b) | 1,764,359 |
50,399,673 | ||
Health Care Equipment & Supplies — 2.4% | ||
413,711 | Abbott Laboratories(a) | 42,988,710 |
494,281 | Boston Scientific Corp.(a)(b) | 38,064,580 |
176,847 | Edwards Lifesciences Corp.(a)(b) | 16,335,357 |
108,061 | Intuitive Surgical, Inc.(a)(b) | 48,070,936 |
45,637 | STERIS PLC(a) | 10,019,147 |
155,478,730 | ||
Health Care Providers & Services — 2.8% | ||
299,844 | CVS Health Corp.(a) | 17,708,787 |
79,403 | Elevance Health, Inc.(a) | 43,025,309 |
77,106 | HCA Healthcare, Inc.(a) | 24,772,616 |
16,707 | Molina Healthcare, Inc.(a)(b) | 4,966,991 |
164,078 | UnitedHealth Group, Inc.(a) | 83,558,362 |
46,177 | Universal Health Services, Inc., Class B(a) | 8,539,513 |
182,571,578 | ||
Health Care Technology — 0.1% | ||
35,149 | Veeva Systems, Inc., Class A(a)(b) | 6,432,619 |
Hotels, Restaurants & Leisure — 1.6% | ||
7,251 | Booking Holdings, Inc.(a) | 28,724,836 |
14,526 | DoorDash, Inc., Class A(a)(b) | 1,580,138 |
64,509 | DraftKings, Inc., Class A(a)(b) | 2,462,309 |
140,501 | Hilton Worldwide Holdings, Inc.(a) | 30,657,318 |
148,507 | McDonald's Corp.(a) | 37,845,524 |
68,473 | Restaurant Brands International, Inc.(a) | 4,818,445 |
106,088,570 | ||
Household Durables — 0.4% | ||
2,093 | NVR, Inc.(a)(b) | 15,882,856 |
118,830 | Toll Brothers, Inc.(a) | 13,686,839 |
29,569,695 | ||
Household Products — 1.0% | ||
413,582 | Procter & Gamble Co.(a) | 68,207,943 |
Shares | Description | Value (†) |
Independent Power & Renewable Electricity Producers — 0.2% | ||
606,341 | AES Corp.(a) | $10,653,411 |
Industrial Conglomerates — 0.7% | ||
205,995 | Honeywell International, Inc.(a) | 43,988,172 |
Industrial REITs — 0.4% | ||
227,816 | Prologis, Inc.(a) | 25,586,015 |
Insurance — 1.9% | ||
367,972 | Aflac, Inc.(a) | 32,863,579 |
62,253 | American Financial Group, Inc.(a) | 7,658,364 |
91,119 | Aon PLC, Class A(a) | 26,750,716 |
147,374 | Arthur J Gallagher & Co.(a) | 38,215,552 |
74,687 | Fidelity National Financial, Inc. | 3,691,032 |
3,155 | Markel Group, Inc.(a)(b) | 4,971,207 |
245,220 | Unum Group(a) | 12,533,194 |
126,683,644 | ||
Interactive Media & Services — 7.0% | ||
304,000 | Alphabet, Inc., Class A(a) | 55,373,600 |
1,278,891 | Alphabet, Inc., Class C(a) | 234,574,187 |
334,610 | Meta Platforms, Inc., Class A(a) | 168,717,054 |
458,664,841 | ||
IT Services — 0.3% | ||
42,770 | Shopify, Inc., Class A(a)(b) | 2,824,959 |
27,852 | Twilio, Inc., Class A(a)(b) | 1,582,272 |
72,450 | VeriSign, Inc.(a)(b) | 12,881,610 |
17,288,841 | ||
Life Sciences Tools & Services — 0.9% | ||
91,948 | Agilent Technologies, Inc.(a) | 11,919,219 |
17,245 | ICON PLC, ADR(a)(b) | 5,405,790 |
71,103 | Thermo Fisher Scientific, Inc.(a) | 39,319,959 |
56,644,968 | ||
Machinery — 1.9% | ||
121,157 | Caterpillar, Inc.(a) | 40,357,397 |
74,195 | Cummins, Inc.(a) | 20,546,821 |
66,901 | Deere & Co.(a) | 24,996,221 |
56,430 | Parker-Hannifin Corp.(a) | 28,542,858 |
121,067 | Pentair PLC(a) | 9,282,207 |
123,725,504 | ||
Media — 0.4% | ||
750,524 | Comcast Corp., Class A(a) | 29,390,520 |
Metals & Mining — 0.4% | ||
190,162 | Barrick Gold Corp.(a) | 3,171,902 |
221,472 | Newmont Corp.(a) | 9,273,033 |
92,695 | Southern Copper Corp.(a) | 9,986,959 |
47,801 | Steel Dynamics, Inc.(a) | 6,190,230 |
28,622,124 | ||
Multi-Utilities — 0.9% | ||
287,648 | Ameren Corp.(a) | 20,454,649 |
206,097 | Consolidated Edison, Inc.(a) | 18,429,194 |
227,581 | WEC Energy Group, Inc.(a) | 17,856,005 |
56,739,848 | ||
Oil, Gas & Consumable Fuels — 3.5% | ||
45,031 | Cheniere Energy, Inc.(a) | 7,872,770 |
328,652 | Chevron Corp.(a) | 51,407,746 |
365,530 | ConocoPhillips(a) | 41,809,321 |
679,633 | Exxon Mobil Corp.(a) | 78,239,351 |
221,709 | Occidental Petroleum Corp.(a) | 13,974,318 |
Shares | Description | Value (†) |
Oil, Gas & Consumable Fuels — continued | ||
226,052 | ONEOK, Inc.(a) | $18,434,541 |
115,966 | Targa Resources Corp.(a) | 14,934,101 |
226,672,148 | ||
Passenger Airlines — 0.1% | ||
153,012 | Alaska Air Group, Inc.(a)(b) | 6,181,685 |
Pharmaceuticals — 3.9% | ||
128,130 | Eli Lilly & Co.(a) | 116,006,339 |
397,525 | Johnson & Johnson(a) | 58,102,254 |
427,014 | Merck & Co., Inc.(a) | 52,864,333 |
1,023,970 | Pfizer, Inc.(a) | 28,650,681 |
255,623,607 | ||
Professional Services — 0.8% | ||
141,064 | Automatic Data Processing, Inc.(a) | 33,670,566 |
4,628 | Booz Allen Hamilton Holding Corp. | 712,249 |
160,547 | Paychex, Inc.(a) | 19,034,453 |
53,417,268 | ||
Real Estate Management & Development — 0.1% | ||
176,849 | Zillow Group, Inc., Class C(a)(b) | 8,204,025 |
Residential REITs — 0.3% | ||
252,006 | American Homes 4 Rent, Class A(a) | 9,364,543 |
85,332 | Camden Property Trust(a) | 9,310,575 |
1 | Equity LifeStyle Properties, Inc. | 65 |
18,675,183 | ||
Retail REITs — 0.1% | ||
57,774 | Federal Realty Investment Trust(a) | 5,833,441 |
Semiconductors & Semiconductor Equipment — 12.1% | ||
287,494 | Advanced Micro Devices, Inc.(a)(b) | 46,634,402 |
127,044 | Analog Devices, Inc.(a) | 28,999,064 |
481 | ASML Holding NV | 491,933 |
71,920 | Broadcom, Inc.(a) | 115,469,718 |
733,171 | Intel Corp.(a) | 22,706,306 |
83,719 | Marvell Technology, Inc.(a) | 5,851,958 |
161,763 | Micron Technology, Inc.(a) | 21,276,687 |
3,587,530 | NVIDIA Corp.(a) | 443,203,456 |
213,684 | QUALCOMM, Inc.(a) | 42,561,579 |
106,600 | Teradyne, Inc.(a) | 15,807,714 |
242,298 | Texas Instruments, Inc.(a) | 47,134,230 |
790,137,047 | ||
Software — 10.6% | ||
91,488 | Adobe, Inc.(a)(b) | 50,825,243 |
5,608 | Atlassian Corp., Class A(b) | 991,943 |
100,560 | Cadence Design Systems, Inc.(a)(b) | 30,947,340 |
1,098,379 | Microsoft Corp.(a) | 490,920,494 |
321,834 | Oracle Corp.(a) | 45,442,961 |
122,261 | Salesforce, Inc.(a) | 31,433,303 |
40,910 | ServiceNow, Inc.(a)(b) | 32,182,670 |
22,602 | Workday, Inc., Class A(a)(b) | 5,052,903 |
687,796,857 | ||
Shares | Description | Value (†) |
Specialized REITs — 0.9% | ||
240,520 | CubeSmart(a) | $10,864,288 |
102,236 | Extra Space Storage, Inc.(a) | 15,888,497 |
84,210 | SBA Communications Corp.(a) | 16,530,423 |
552,098 | VICI Properties, Inc.(a) | 15,812,087 |
59,095,295 | ||
Specialty Retail — 1.9% | ||
1,749 | Burlington Stores, Inc.(b) | 419,760 |
20,171 | Dick's Sporting Goods, Inc.(a) | 4,333,740 |
208,388 | Home Depot, Inc.(a) | 71,735,485 |
171,807 | Lowe's Cos., Inc.(a) | 37,876,571 |
161,306 | Valvoline, Inc.(a)(b) | 6,968,419 |
121,333,975 | ||
Technology Hardware, Storage & Peripherals — 7.0% | ||
2,133,712 | Apple, Inc.(a) | 449,402,422 |
38,399 | Dell Technologies, Inc., Class C(a) | 5,295,606 |
454,698,028 | ||
Textiles, Apparel & Luxury Goods — 0.1% | ||
24,454 | Lululemon Athletica, Inc.(a)(b) | 7,304,410 |
Tobacco — 0.1% | ||
222,271 | British American Tobacco PLC, ADR(a) | 6,874,842 |
Water Utilities — 0.3% | ||
138,626 | American Water Works Co., Inc.(a) | 17,904,934 |
Total Common Stocks (Identified Cost $1,656,186,844) | 6,496,128,868 | |
Total Purchased Options — 0.4% (Identified Cost $55,982,802) (see details below) | 27,200,905 | |
Principal Amount | ||
Short-Term Investments — 1.3% | ||
$85,842,729 | Tri-Party Repurchase Agreement with Fixed Income Clearing Corporation, dated 6/28/2024 at 3.500% to be repurchased at $85,867,766 on 07/01/2024 collateralized by $40,507,900 U.S. Treasury Inflation Indexed Note, 0.125% due 7/15/2026 valued at $50,606,952; $38,687,000 U.S. Treasury Note, 1.875% due 6/30/2026 valued at $36,952,690 including accrued interest (Note 2 of Notes to Financial Statements) (Identified Cost $85,842,729) | 85,842,729 |
Total Investments — 101.7% (Identified Cost $1,798,012,375) | 6,609,172,502 | |
Other assets less liabilities — (1.7)% | (108,754,960 ) | |
Net Assets — 100.0% | $6,500,417,542 | |
Description | Expiration Date | Exercise Price | Contracts | Notional Amount | Cost | Value (†) |
Index Options — 0.4% | ||||||
S&P 500® Index, Put(b) | 8/30/2024 | 4,950 | 1,681 | $917,906,688 | $6,593,723 | $2,202,110 |
S&P 500® Index, Put(b) | 9/20/2024 | 4,700 | 1,681 | 917,906,688 | 13,956,502 | 1,966,770 |
S&P 500® Index, Put(b) | 9/20/2024 | 4,800 | 1,681 | 917,906,688 | 6,652,557 | 2,420,640 |
S&P 500® Index, Put(b) | 9/20/2024 | 5,000 | 1,682 | 918,452,736 | 7,840,643 | 3,910,650 |
S&P 500® Index, Put(b) | 9/20/2024 | 5,100 | 1,681 | 917,906,688 | 8,666,395 | 5,127,050 |
S&P 500® Index, Put(b) | 9/30/2024 | 5,100 | 1,681 | 917,906,688 | 6,166,749 | 5,849,880 |
S&P 500® Index, Put(b) | 10/18/2024 | 5,000 | 1,681 | 917,906,688 | 6,106,233 | 5,723,805 |
Total | $55,982,802 | $27,200,905 | ||||
Description | Expiration Date | Exercise Price | Contracts | Notional Amount | Premiums (Received) | Value (†) |
Index Options — (1.7%) | ||||||
S&P 500® Index, Call | 7/31/2024 | 5,450 | (1,308 ) | $(714,230,784 ) | $(6,788,769 ) | $(12,242,880 ) |
S&P 500® Index, Call | 8/16/2024 | 5,400 | (1,308 ) | (714,230,784 ) | (7,690,543 ) | (20,156,280 ) |
S&P 500® Index, Call | 8/16/2024 | 5,450 | (1,308 ) | (714,230,784 ) | (7,727,010 ) | (15,506,340 ) |
S&P 500® Index, Call | 8/16/2024 | 5,550 | (1,307 ) | (713,684,736 ) | (4,584,499 ) | (8,011,910 ) |
S&P 500® Index, Call | 8/30/2024 | 5,350 | (1,308 ) | (714,230,784 ) | (19,869,174 ) | (27,906,180 ) |
S&P 500® Index, Call | 8/30/2024 | 5,500 | (1,308 ) | (714,230,784 ) | (5,013,917 ) | (14,152,560 ) |
S&P 500® Index, Call | 9/20/2024 | 5,750 | (1,307 ) | (713,684,736 ) | (5,642,972 ) | (3,822,975 ) |
S&P 500® Index, Call | 9/20/2024 | 5,800 | (1,307 ) | (713,684,736 ) | (4,388,252 ) | (2,614,000 ) |
S&P 500® Index, Call | 9/30/2024 | 5,750 | (1,307 ) | (713,684,736 ) | (5,400,563 ) | (4,652,920 ) |
Total | $(67,105,699 ) | $(109,066,045 ) | ||||
(†) | See Note 2 of Notes to Financial Statements. |
(a) | Security (or a portion thereof) has been pledged as collateral for open derivative contracts. |
(b) | Non-income producing security. |
ADR | An American Depositary Receipt is a certificate issued by a custodian bank representing the right to receive securities of the foreign issuer described. The values of ADRs may be significantly influenced by trading on exchanges not located in the United States. |
REITs | Real Estate Investment Trusts |
Semiconductors & Semiconductor Equipment | 12.1 % |
Software | 10.6 |
Interactive Media & Services | 7.0 |
Technology Hardware, Storage & Peripherals | 7.0 |
Financial Services | 4.5 |
Broadline Retail | 4.1 |
Pharmaceuticals | 3.9 |
Oil, Gas & Consumable Fuels | 3.5 |
Banks | 3.5 |
Health Care Providers & Services | 2.8 |
Health Care Equipment & Supplies | 2.4 |
Capital Markets | 2.3 |
Consumer Staples Distribution & Retail | 2.2 |
Biotechnology | 2.0 |
Other Investments, less than 2% each | 32.5 |
Short-Term Investments | 1.3 |
Total Investments | 101.7 |
Other assets less liabilities (including open written options) | (1.7 ) |
Net Assets | 100.0 % |
Shares | Description | Value (†) |
Common Stocks — 100.4% of Net Assets | ||
Aerospace & Defense — 2.0% | ||
5,959 | Boeing Co.(a)(b) | $1,084,598 |
11,150 | General Electric Co.(a) | 1,772,516 |
2,764 | HEICO Corp.(a) | 618,058 |
3,392 | Lockheed Martin Corp.(a) | 1,584,403 |
13,824 | RTX Corp.(a) | 1,387,791 |
6,447,366 | ||
Air Freight & Logistics — 0.3% | ||
5,682 | Expeditors International of Washington, Inc.(a) | 709,057 |
5,320 | GXO Logistics, Inc.(a)(b) | 268,660 |
977,717 | ||
Automobile Components — 0.1% | ||
3,861 | Gentex Corp.(a) | 130,154 |
1,060 | Lear Corp.(a) | 121,063 |
1,844 | Magna International, Inc.(a) | 77,264 |
328,481 | ||
Automobiles — 1.3% | ||
375 | Ferrari NV(a) | 153,139 |
20,345 | Tesla, Inc.(a)(b) | 4,025,868 |
4,179,007 | ||
Banks — 3.4% | ||
63,845 | Bank of America Corp.(a) | 2,539,116 |
4,668 | East West Bancorp, Inc.(a) | 341,838 |
30,005 | Fifth Third Bancorp(a) | 1,094,882 |
13,709 | First Horizon Corp.(a) | 216,191 |
8,803 | ICICI Bank Ltd., ADR(a) | 253,614 |
16,342 | Itau Unibanco Holding SA, ADR | 95,437 |
21,198 | JPMorgan Chase & Co.(a) | 4,287,508 |
33,433 | Wells Fargo & Co.(a) | 1,985,586 |
10,814,172 | ||
Beverages — 1.4% | ||
14,760 | Brown-Forman Corp., Class B(a) | 637,484 |
6,370 | Coca-Cola Europacific Partners PLC(a) | 464,182 |
24,317 | Keurig Dr Pepper, Inc.(a) | 812,188 |
15,984 | PepsiCo, Inc.(a) | 2,636,241 |
4,550,095 | ||
Biotechnology — 2.0% | ||
15,215 | AbbVie, Inc.(a) | 2,609,677 |
1,480 | Alnylam Pharmaceuticals, Inc.(a)(b) | 359,640 |
4,773 | Amgen, Inc.(a) | 1,491,324 |
3,464 | BioMarin Pharmaceutical, Inc.(a)(b) | 285,191 |
1,252 | Exact Sciences Corp.(b) | 52,897 |
888 | United Therapeutics Corp.(a)(b) | 282,872 |
2,769 | Vertex Pharmaceuticals, Inc.(a)(b) | 1,297,886 |
6,379,487 | ||
Broadline Retail — 4.0% | ||
619 | Alibaba Group Holding Ltd., ADR(a) | 44,568 |
66,128 | Amazon.com, Inc.(a)(b) | 12,779,236 |
1,983 | JD.com, Inc., ADR(a) | 51,241 |
71 | MercadoLibre, Inc.(a)(b) | 116,681 |
12,991,726 | ||
Building Products — 0.3% | ||
774 | Carlisle Cos., Inc.(a) | 313,633 |
5,236 | Fortune Brands Innovations, Inc.(a) | 340,026 |
726 | Lennox International, Inc.(a) | 388,395 |
1,042,054 | ||
Shares | Description | Value (†) |
Capital Markets — 2.9% | ||
18,326 | Bank of New York Mellon Corp.(a) | $1,097,544 |
2,557 | BlackRock, Inc.(a) | 2,013,177 |
9,864 | Blackstone, Inc.(a) | 1,221,163 |
8,038 | Brookfield Asset Management Ltd., Class A(a) | 305,846 |
10,046 | Brookfield Corp., Class A(a) | 417,311 |
5,640 | KKR & Co., Inc.(a) | 593,554 |
1,473 | LPL Financial Holdings, Inc.(a) | 411,409 |
15,208 | Morgan Stanley(a) | 1,478,066 |
1,710 | MSCI, Inc.(a) | 823,792 |
7,080 | Raymond James Financial, Inc.(a) | 875,159 |
9,237,021 | ||
Chemicals — 1.4% | ||
3,612 | Air Products & Chemicals, Inc.(a) | 932,076 |
4,444 | Linde PLC(a) | 1,950,072 |
3,004 | Nutrien Ltd.(a) | 152,934 |
7,841 | PPG Industries, Inc.(a) | 987,103 |
3,228 | RPM International, Inc.(a) | 347,591 |
4,369,776 | ||
Commercial Services & Supplies — 0.6% | ||
2,989 | Waste Connections, Inc.(a) | 524,151 |
6,238 | Waste Management, Inc.(a) | 1,330,815 |
1,854,966 | ||
Communications Equipment — 0.8% | ||
5,886 | Ciena Corp.(a)(b) | 283,587 |
41,314 | Cisco Systems, Inc.(a) | 1,962,828 |
49,104 | Telefonaktiebolaget LM Ericsson, ADR(a) | 302,972 |
2,549,387 | ||
Construction & Engineering — 0.1% | ||
904 | EMCOR Group, Inc.(a) | 330,032 |
Construction Materials — 0.5% | ||
2,797 | Martin Marietta Materials, Inc.(a) | 1,515,415 |
Consumer Finance — 0.3% | ||
7,234 | Ally Financial, Inc.(a) | 286,973 |
15,939 | Synchrony Financial(a) | 752,161 |
1,039,134 | ||
Consumer Staples Distribution & Retail — 2.1% | ||
3,807 | Costco Wholesale Corp.(a) | 3,235,912 |
5,794 | Target Corp.(a) | 857,744 |
37,296 | Walmart, Inc.(a) | 2,525,312 |
6,618,968 | ||
Containers & Packaging — 0.1% | ||
4,418 | Crown Holdings, Inc.(a) | 328,655 |
Distributors — 0.2% | ||
4,664 | Genuine Parts Co.(a) | 645,125 |
Diversified Consumer Services — 0.1% | ||
2,315 | Service Corp. International(a) | 164,666 |
Diversified REITs — 0.0% | ||
2,146 | W.P. Carey, Inc.(a) | 118,137 |
Diversified Telecommunication Services — 0.6% | ||
107,663 | AT&T, Inc.(a) | 2,057,440 |
Electric Utilities — 1.5% | ||
18,386 | Alliant Energy Corp.(a) | 935,847 |
16,072 | American Electric Power Co., Inc.(a) | 1,410,157 |
21,313 | NextEra Energy, Inc.(a) | 1,509,174 |
23,351 | OGE Energy Corp.(a) | 833,631 |
4,688,809 | ||
Shares | Description | Value (†) |
Electrical Equipment — 0.8% | ||
1,231 | Acuity Brands, Inc.(a) | $297,212 |
9,338 | Emerson Electric Co.(a) | 1,028,674 |
3,070 | GE Vernova, Inc.(a)(b) | 526,536 |
1,562 | Hubbell, Inc.(a) | 570,880 |
1,294 | NEXTracker, Inc., Class A(a)(b) | 60,663 |
5,579 | Sensata Technologies Holding PLC(a) | 208,599 |
2,692,564 | ||
Electronic Equipment, Instruments & Components — 0.4% | ||
1,888 | Arrow Electronics, Inc.(a)(b) | 227,995 |
3,542 | CDW Corp.(a) | 792,841 |
7,429 | Flex Ltd.(a)(b) | 219,081 |
1,239,917 | ||
Energy Equipment & Services — 0.2% | ||
17,314 | Halliburton Co.(a) | 584,867 |
6,142 | NOV, Inc.(a) | 116,759 |
701,626 | ||
Entertainment — 1.3% | ||
3,401 | Liberty Media Corp.-Liberty Formula One, Class C(b) | 244,328 |
3,514 | Netflix, Inc.(a)(b) | 2,371,528 |
1,329 | TKO Group Holdings, Inc.(a) | 143,519 |
15,414 | Walt Disney Co.(a) | 1,530,456 |
4,289,831 | ||
Financial Services — 4.4% | ||
17,241 | Berkshire Hathaway, Inc., Class B(a)(b) | 7,013,639 |
4,264 | Block, Inc.(a)(b) | 274,985 |
7,629 | Mastercard, Inc., Class A(a) | 3,365,610 |
13,588 | Visa, Inc., Class A(a) | 3,566,442 |
14,220,676 | ||
Food Products — 0.6% | ||
13,562 | Hormel Foods Corp.(a) | 413,505 |
2,045 | Ingredion, Inc.(a) | 234,561 |
19,167 | Kellanova(a) | 1,105,553 |
3,025 | Post Holdings, Inc.(a)(b) | 315,084 |
2,068,703 | ||
Ground Transportation — 1.0% | ||
3,371 | Canadian National Railway Co.(a) | 398,216 |
3,153 | Canadian Pacific Kansas City Ltd.(a) | 248,236 |
17,000 | Uber Technologies, Inc.(a)(b) | 1,235,560 |
5,591 | Union Pacific Corp.(a) | 1,265,020 |
1,670 | XPO, Inc.(a)(b) | 177,270 |
3,324,302 | ||
Health Care Equipment & Supplies — 1.9% | ||
17,681 | Abbott Laboratories(a) | 1,837,233 |
4,403 | Alcon, Inc.(a) | 392,219 |
4,594 | Dexcom, Inc.(a)(b) | 520,868 |
1,287 | IDEXX Laboratories, Inc.(a)(b) | 627,026 |
20,600 | Medtronic PLC(a) | 1,621,426 |
2,554 | ResMed, Inc.(a) | 488,887 |
2,671 | Solventum Corp.(a)(b) | 141,242 |
1,858 | Teleflex, Inc.(a) | 390,793 |
6,019,694 | ||
Health Care Providers & Services — 2.3% | ||
2,951 | Cigna Group(a) | 975,512 |
1,419 | DaVita, Inc.(a)(b) | 196,631 |
2,561 | Elevance Health, Inc.(a) | 1,387,703 |
3,611 | Labcorp Holdings, Inc.(a) | 734,875 |
Shares | Description | Value (†) |
Health Care Providers & Services — continued | ||
1,242 | Molina Healthcare, Inc.(a)(b) | $369,247 |
7,294 | UnitedHealth Group, Inc.(a) | 3,714,542 |
7,378,510 | ||
Health Care Technology — 0.1% | ||
1,165 | Veeva Systems, Inc., Class A(a)(b) | 213,207 |
Hotels, Restaurants & Leisure — 1.6% | ||
326 | Booking Holdings, Inc.(a) | 1,291,449 |
2,039 | DraftKings, Inc., Class A(a)(b) | 77,829 |
4,186 | Hilton Worldwide Holdings, Inc.(a) | 913,385 |
6,056 | McDonald's Corp.(a) | 1,543,311 |
2,643 | Restaurant Brands International, Inc.(a) | 185,988 |
11,216 | Starbucks Corp.(a) | 873,165 |
1,224 | Trip.com Group Ltd., ADR(a)(b) | 57,528 |
977 | Vail Resorts, Inc.(a) | 175,987 |
2,169 | Yum China Holdings, Inc.(a) | 66,892 |
5,185,534 | ||
Household Durables — 0.3% | ||
6,602 | PulteGroup, Inc.(a) | 726,880 |
3,406 | Toll Brothers, Inc.(a) | 392,303 |
1,119,183 | ||
Household Products — 1.4% | ||
4,100 | Clorox Co.(a) | 559,527 |
23,367 | Procter & Gamble Co.(a) | 3,853,686 |
4,413,213 | ||
Industrial REITs — 0.5% | ||
15,589 | Prologis, Inc.(a) | 1,750,801 |
Insurance — 2.0% | ||
7,547 | Arch Capital Group Ltd.(a)(b) | 761,417 |
5,305 | Cincinnati Financial Corp.(a) | 626,520 |
12,601 | Hartford Financial Services Group, Inc.(a) | 1,266,904 |
20,270 | Manulife Financial Corp.(a) | 539,587 |
269 | Markel Group, Inc.(a)(b) | 423,853 |
9,288 | Prudential Financial, Inc.(a) | 1,088,461 |
911 | RenaissanceRe Holdings Ltd.(a) | 203,618 |
10,478 | W.R. Berkley Corp.(a) | 823,361 |
3,178 | Willis Towers Watson PLC(a) | 833,081 |
6,566,802 | ||
Interactive Media & Services — 7.0% | ||
28,325 | Alphabet, Inc., Class A(a) | 5,159,399 |
50,182 | Alphabet, Inc., Class C(a) | 9,204,382 |
1,423 | Baidu, Inc., ADR(a)(b) | 123,061 |
16,110 | Meta Platforms, Inc., Class A(a) | 8,122,984 |
22,609,826 | ||
IT Services — 0.9% | ||
5,957 | Accenture PLC, Class A(a) | 1,807,413 |
2,454 | Amdocs Ltd.(a) | 193,670 |
1,327 | EPAM Systems, Inc.(a)(b) | 249,622 |
2,185 | Shopify, Inc., Class A(a)(b) | 144,319 |
3,202 | Twilio, Inc., Class A(a)(b) | 181,906 |
2,533 | VeriSign, Inc.(a)(b) | 450,367 |
3,027,297 | ||
Leisure Products — 0.1% | ||
2,342 | Brunswick Corp.(a) | 170,427 |
515 | Polaris, Inc.(a) | 40,330 |
210,757 | ||
Life Sciences Tools & Services — 1.3% | ||
9,551 | Avantor, Inc.(a)(b) | 202,481 |
Shares | Description | Value (†) |
Life Sciences Tools & Services — continued | ||
746 | Bio-Rad Laboratories, Inc., Class A(a)(b) | $203,740 |
1,206 | ICON PLC, ADR(a)(b) | 378,045 |
3,338 | Revvity, Inc.(a) | 350,023 |
4,127 | Thermo Fisher Scientific, Inc.(a) | 2,282,231 |
2,280 | Waters Corp.(a)(b) | 661,473 |
4,077,993 | ||
Machinery — 1.5% | ||
1,247 | AGCO Corp.(a) | 122,057 |
4,889 | Caterpillar, Inc.(a) | 1,628,526 |
3,656 | Cummins, Inc.(a) | 1,012,456 |
2,621 | Deere & Co.(a) | 979,284 |
12,435 | Otis Worldwide Corp.(a) | 1,196,993 |
4,939,316 | ||
Media — 0.5% | ||
40,226 | Comcast Corp., Class A(a) | 1,575,250 |
2,745 | Liberty Broadband Corp., Class C(a)(b) | 150,481 |
1,725,731 | ||
Metals & Mining — 0.5% | ||
6,051 | Alcoa Corp.(a) | 240,709 |
16,691 | Barrick Gold Corp.(a) | 278,406 |
588 | Reliance, Inc.(a) | 167,933 |
3,960 | Rio Tinto PLC, ADR(a) | 261,083 |
2,073 | Southern Copper Corp.(a) | 223,345 |
2,587 | Steel Dynamics, Inc.(a) | 335,016 |
9,883 | Vale SA, ADR(a) | 110,393 |
1,616,885 | ||
Mortgage Real Estate Investment Trusts (REITs) — 0.0% | ||
7,880 | Annaly Capital Management, Inc.(a) | 150,193 |
Multi-Utilities — 0.9% | ||
21,925 | Ameren Corp.(a) | 1,559,087 |
23,753 | CMS Energy Corp.(a) | 1,414,016 |
2,973,103 | ||
Oil, Gas & Consumable Fuels — 3.3% | ||
9,506 | Canadian Natural Resources Ltd.(a) | 338,414 |
9,259 | Cenovus Energy, Inc.(a) | 182,032 |
1,244 | Cheniere Energy, Inc.(a) | 217,489 |
13,924 | Chevron Corp.(a) | 2,177,992 |
13,451 | ConocoPhillips(a) | 1,538,525 |
6,043 | Enbridge, Inc.(a) | 215,070 |
36,322 | Exxon Mobil Corp.(a) | 4,181,389 |
2,451 | HF Sinclair Corp.(a) | 130,736 |
2,073 | Ovintiv, Inc.(a) | 97,162 |
7,564 | Suncor Energy, Inc.(a) | 288,188 |
9,326 | Targa Resources Corp.(a) | 1,201,002 |
5,425 | TC Energy Corp.(a) | 205,608 |
10,773,607 | ||
Passenger Airlines — 0.3% | ||
17,239 | Delta Air Lines, Inc.(a) | 817,818 |
Personal Care Products — 0.0% | ||
2,246 | BellRing Brands, Inc.(a)(b) | 128,336 |
Pharmaceuticals — 3.7% | ||
3,456 | AstraZeneca PLC, ADR(a) | 269,533 |
6,029 | Eli Lilly & Co.(a) | 5,458,536 |
1,744 | Jazz Pharmaceuticals PLC(a)(b) | 186,137 |
21,374 | Johnson & Johnson(a) | 3,124,024 |
21,262 | Merck & Co., Inc.(a) | 2,632,236 |
Shares | Description | Value (†) |
Pharmaceuticals — continued | ||
2,056 | Novartis AG, ADR(a) | $218,882 |
10,812 | Teva Pharmaceutical Industries Ltd., ADR(a)(b) | 175,695 |
12,065,043 | ||
Professional Services — 0.7% | ||
1,986 | Booz Allen Hamilton Holding Corp.(a) | 305,645 |
3,378 | Leidos Holdings, Inc.(a) | 492,783 |
4,378 | SS&C Technologies Holdings, Inc.(a) | 274,369 |
3,824 | TransUnion(a) | 283,588 |
3,146 | Verisk Analytics, Inc.(a) | 848,004 |
2,204,389 | ||
Real Estate Management & Development — 0.1% | ||
1,157 | Jones Lang LaSalle, Inc.(a)(b) | 237,509 |
Residential REITs — 0.3% | ||
1,628 | American Homes 4 Rent, Class A(a) | 60,497 |
22,727 | Invitation Homes, Inc.(a) | 815,672 |
876,169 | ||
Retail REITs — 0.6% | ||
9,368 | NNN REIT, Inc.(a) | 399,077 |
26,901 | Realty Income Corp.(a) | 1,420,911 |
1,819,988 | ||
Semiconductors & Semiconductor Equipment — 12.2% | ||
13,309 | Advanced Micro Devices, Inc.(a)(b) | 2,158,853 |
6,263 | Analog Devices, Inc.(a) | 1,429,592 |
9,241 | Applied Materials, Inc.(a) | 2,180,784 |
409 | ASML Holding NV | 418,297 |
3,344 | Broadcom, Inc.(a) | 5,368,892 |
1,550 | Enphase Energy, Inc.(a)(b) | 154,551 |
4,290 | Entegris, Inc.(a) | 580,866 |
4,326 | Marvell Technology, Inc.(a) | 302,387 |
176,303 | NVIDIA Corp.(a) | 21,780,473 |
10,018 | QUALCOMM, Inc.(a) | 1,995,385 |
1,432 | Taiwan Semiconductor Manufacturing Co. Ltd., ADR(a) | 248,896 |
4,605 | Teradyne, Inc.(a) | 682,875 |
10,614 | Texas Instruments, Inc.(a) | 2,064,741 |
39,366,592 | ||
Software — 11.0% | ||
3,675 | Adobe, Inc.(a)(b) | 2,041,610 |
659 | Atlassian Corp., Class A(a)(b) | 116,564 |
2,341 | Check Point Software Technologies Ltd.(a)(b) | 386,265 |
8,916 | Fortinet, Inc.(a)(b) | 537,367 |
2,777 | Intuit, Inc.(a) | 1,825,072 |
52,941 | Microsoft Corp.(a) | 23,661,980 |
13,109 | Oracle Corp.(a) | 1,850,991 |
2,749 | Palo Alto Networks, Inc.(a)(b) | 931,938 |
8,492 | Salesforce, Inc.(a) | 2,183,293 |
589 | SAP SE, ADR(a) | 118,807 |
2,095 | ServiceNow, Inc.(a)(b) | 1,648,074 |
1,002 | Workday, Inc., Class A(a)(b) | 224,007 |
2,608 | Zoom Video Communications, Inc., Class A(a)(b) | 154,368 |
35,680,336 | ||
Specialized REITs — 0.8% | ||
16,370 | CubeSmart(a) | 739,433 |
18,708 | Gaming & Leisure Properties, Inc.(a) | 845,789 |
4,884 | SBA Communications Corp.(a) | 958,729 |
2,543,951 | ||
Specialty Retail — 1.5% | ||
677 | Burlington Stores, Inc.(a)(b) | 162,480 |
Shares | Description | Value (†) |
Specialty Retail — continued | ||
933 | Dick's Sporting Goods, Inc.(a) | $200,455 |
2,102 | Gap, Inc.(a) | 50,217 |
7,768 | Home Depot, Inc.(a) | 2,674,056 |
5,464 | Lowe's Cos., Inc.(a) | 1,204,594 |
952 | Ulta Beauty, Inc.(a)(b) | 367,348 |
520 | Williams-Sonoma, Inc.(a) | 146,832 |
4,805,982 | ||
Technology Hardware, Storage & Peripherals — 6.9% | ||
104,092 | Apple, Inc.(a) | 21,923,857 |
2,340 | Dell Technologies, Inc., Class C(a) | 322,709 |
22,246,566 | ||
Textiles, Apparel & Luxury Goods — 0.3% | ||
288 | Deckers Outdoor Corp.(a)(b) | 278,770 |
1,538 | Lululemon Athletica, Inc.(a)(b) | 459,400 |
2,457 | Skechers USA, Inc., Class A(a)(b) | 169,828 |
907,998 | ||
Tobacco — 0.8% | ||
20,165 | British American Tobacco PLC, ADR(a) | 623,703 |
18,933 | Philip Morris International, Inc.(a) | 1,918,481 |
2,542,184 | ||
Trading Companies & Distributors — 0.3% | ||
2,288 | Ferguson PLC(a) | 443,071 |
1,027 | Watsco, Inc.(a) | 475,748 |
918,819 | ||
Shares | Description | Value (†) |
Wireless Telecommunication Services — 0.1% | ||
10,858 | America Movil SAB de CV, ADR(a) | $184,586 |
28,940 | Vodafone Group PLC, ADR(a) | 256,698 |
441,284 | ||
Total Common Stocks (Identified Cost $209,290,631) | 324,119,871 | |
Principal Amount | ||
Short-Term Investments — 1.6% | ||
$5,322,066 | Tri-Party Repurchase Agreement with Fixed Income Clearing Corporation, dated 6/28/2024 at 3.500% to be repurchased at $5,323,618 on 7/01/2024 collateralized by $4,345,300 U.S. Treasury Inflation Indexed Note, 0.125% due 7/15/2026 valued at $5,428,749 including accrued interest (Note 2 of Notes to Financial Statements) (Identified Cost $5,322,066) | 5,322,066 |
Total Investments — 102.0% (Identified Cost $214,612,697) | 329,441,937 | |
Other assets less liabilities — (2.0)% | (6,484,653 ) | |
Net Assets — 100.0% | $322,957,284 | |
Description | Expiration Date | Exercise Price | Contracts | Notional Amount | Premiums (Received) | Value (†) |
Index Options — (1.9%) | ||||||
S&P 500® Index, Call | 7/31/2024 | 5,300 | (65 ) | $(35,493,120 ) | $(523,836 ) | $(1,372,475 ) |
S&P 500® Index, Call | 7/31/2024 | 5,450 | (65 ) | (35,493,120 ) | (337,362 ) | (608,400 ) |
S&P 500® Index, Call | 8/16/2024 | 5,400 | (65 ) | (35,493,120 ) | (637,460 ) | (1,001,650 ) |
S&P 500® Index, Call | 8/16/2024 | 5,450 | (66 ) | (36,039,168 ) | (556,705 ) | (782,430 ) |
S&P 500® Index, Call | 8/30/2024 | 5,350 | (66 ) | (36,039,168 ) | (1,002,573 ) | (1,408,110 ) |
S&P 500® Index, Call | 8/30/2024 | 5,550 | (65 ) | (35,493,120 ) | (676,521 ) | (522,275 ) |
S&P 500® Index, Call | 9/20/2024 | 5,750 | (65 ) | (35,493,120 ) | (280,637 ) | (190,125 ) |
S&P 500® Index, Call | 9/20/2024 | 5,800 | (65 ) | (35,493,120 ) | (218,237 ) | (130,000 ) |
S&P 500® Index, Call | 9/30/2024 | 5,750 | (65 ) | (35,493,120 ) | (268,582 ) | (231,400 ) |
Total | $(4,501,913 ) | $(6,246,865 ) | ||||
(†) | See Note 2 of Notes to Financial Statements. |
(a) | Security (or a portion thereof) has been pledged as collateral for open derivative contracts. |
(b) | Non-income producing security. |
ADR | An American Depositary Receipt is a certificate issued by a custodian bank representing the right to receive securities of the foreign issuer described. The values of ADRs may be significantly influenced by trading on exchanges not located in the United States. |
REITs | Real Estate Investment Trusts |
Semiconductors & Semiconductor Equipment | 12.2 % |
Software | 11.0 |
Interactive Media & Services | 7.0 |
Technology Hardware, Storage & Peripherals | 6.9 |
Financial Services | 4.4 |
Broadline Retail | 4.0 |
Pharmaceuticals | 3.7 |
Banks | 3.4 |
Oil, Gas & Consumable Fuels | 3.3 |
Capital Markets | 2.9 |
Health Care Providers & Services | 2.3 |
Consumer Staples Distribution & Retail | 2.1 |
Insurance | 2.0 |
Aerospace & Defense | 2.0 |
Biotechnology | 2.0 |
Other Investments, less than 2% each | 31.2 |
Short-Term Investments | 1.6 |
Total Investments | 102.0 |
Other assets less liabilities (including open written options) | (2.0 ) |
Net Assets | 100.0 % |
Principal Amount(‡) | Description | Value (†) |
Bonds and Notes — 91.0% of Net Assets | ||
Canada — 0.1% | ||
50,000 | Province of Quebec, 2.600%, 7/06/2025, (CAD) | $35,905 |
Chile — 1.9% | ||
500,000 | Chile Government International Bonds, 1.250%, 1/29/2040, (EUR) | 367,668 |
500,000 | Chile Government International Bonds, 3.500%, 1/25/2050 | 358,923 |
726,591 | ||
Denmark — 3.0% | ||
500,000 | Orsted AS, 1.500%, 11/26/2029, (EUR) | 480,683 |
200,000 | Orsted AS, (fixed rate to 9/09/2027, variable rate thereafter), 1.750%, 12/09/3019, (EUR) | 192,018 |
500,000 | Vestas Wind Systems Finance BV, EMTN, 1.500%, 6/15/2029, (EUR) | 485,262 |
1,157,963 | ||
Finland — 0.5% | ||
200,000 | VR-Yhtyma OYJ, 2.375%, 5/30/2029, (EUR) | 202,337 |
France — 7.7% | ||
400,000 | Altarea SCA, 1.750%, 1/16/2030, (EUR) | 356,370 |
400,000 | Banque Stellantis France SACA, EMTN, 3.875%, 1/19/2026, (EUR) | 429,059 |
400,000 | Cie de Saint-Gobain SA, EMTN, 2.125%, 6/10/2028, (EUR) | 407,842 |
200,000 | Covivio SA, 1.125%, 9/17/2031, (EUR) | 176,407 |
400,000 | Credit Mutuel Arkea SA, EMTN, 4.250%, 12/01/2032, (EUR) | 440,959 |
200,000 | Derichebourg SA, 2.250%, 7/15/2028, (EUR) | 194,378 |
200,000 | Forvia SE, 2.375%, 6/15/2029, (EUR) | 192,272 |
100,000 | Getlink SE, 3.500%, 10/30/2025, (EUR) | 106,024 |
300,000 | ICADE, 1.500%, 9/13/2027, (EUR) | 299,037 |
600,000 | Societe Des Grands Projets EPIC, EMTN, 1.700%, 5/25/2050, (EUR) | 414,699 |
3,017,047 | ||
Germany — 13.5% | ||
3,500,000 | Bundesrepublik Deutschland Bundesanleihe, Series G, Zero Coupon, 2.296%–2.788%, 8/15/2030, (EUR)(a) | 3,246,905 |
2,800,000 | Bundesrepublik Deutschland Bundesanleihe, Series G, Zero Coupon, 1.719%–3.065%, 8/15/2050, (EUR)(a) | 1,522,001 |
500,000 | EnBW Energie Baden-Wuerttemberg AG, (fixed rate to 3/30/2026, variable rate thereafter), 1.875%, 6/29/2080, (EUR) | 505,221 |
5,274,127 | ||
Hungary — 1.0% | ||
500,000 | Hungary Government International Bonds, 1.750%, 6/05/2035, (EUR) | 404,284 |
Indonesia — 1.3% | ||
500,000 | Perusahaan Penerbit SBSN Indonesia III, 3.900%, 8/20/2024 | 498,486 |
Ireland — 0.6% | ||
300,000 | ESB Finance DAC, EMTN, 1.000%, 7/19/2034, (EUR) | 251,111 |
Italy — 8.3% | ||
400,000 | A2A SpA, EMTN, 1.000%, 7/16/2029, (EUR) | 376,084 |
600,000 | Assicurazioni Generali SpA, EMTN, 2.124%, 10/01/2030, (EUR) | 569,509 |
400,000 | Cassa Depositi e Prestiti SpA, 3.875%, 2/13/2029, (EUR) | 428,798 |
Principal Amount(‡) | Description | Value (†) |
Italy — continued | ||
300,000 | ERG SpA, EMTN, 0.500%, 9/11/2027, (EUR) | $289,709 |
400,000 | Hera SpA, EMTN, 2.500%, 5/25/2029, (EUR) | 407,717 |
1,300,000 | Italy Buoni Poliennali Del Tesoro, Series 34Y, 1.500%, 4/30/2045, (EUR) | 849,361 |
300,000 | Terna - Rete Elettrica Nazionale, EMTN, 3.875%, 7/24/2033, (EUR) | 322,867 |
3,244,045 | ||
Japan — 2.3% | ||
500,000 | Denso Corp., 1.239%, 9/16/2026 | 456,946 |
400,000 | Mizuho Financial Group, Inc., EMTN, 3.490%, 9/05/2027, (EUR) | 428,375 |
885,321 | ||
Korea — 1.7% | ||
400,000 | Kookmin Bank, GMTN, 4.500%, 2/01/2029 | 383,969 |
300,000 | Korea International Bonds, Zero Coupon, 0.000%, 10/15/2026, (EUR)(b) | 297,361 |
681,330 | ||
Mexico — 2.0% | ||
800,000 | Mexico Government International Bonds, 1.350%, 9/18/2027, (EUR) | 792,108 |
Netherlands — 7.9% | ||
300,000 | Alliander NV, EMTN, 2.625%, 9/09/2027, (EUR) | 314,705 |
400,000 | CTP NV, EMTN, 2.125%, 10/01/2025, (EUR) | 418,058 |
400,000 | de Volksbank NV, EMTN, 0.375%, 3/03/2028, (EUR) | 378,279 |
600,000 | de Volksbank NV, EMTN, (fixed rate to 10/22/2025, variable rate thereafter), 1.750%, 10/22/2030, (EUR) | 619,119 |
300,000 | Enexis Holding NV, EMTN, 3.625%, 6/12/2034, (EUR) | 325,948 |
500,000 | Koninklijke Philips NV, EMTN, 2.125%, 11/05/2029, (EUR) | 498,061 |
300,000 | Stedin Holding NV, EMTN, 2.375%, 6/03/2030, (EUR) | 301,466 |
150,000 | TenneT Holding BV, EMTN, 1.250%, 10/24/2033, (EUR) | 132,407 |
100,000 | TenneT Holding BV, EMTN, 1.875%, 6/13/2036, (EUR) | 89,366 |
3,077,409 | ||
Norway — 0.8% | ||
300,000 | Statkraft AS, EMTN, 2.875%, 9/13/2029, (EUR) | 313,238 |
Portugal — 2.1% | ||
400,000 | EDP Finance BV, EMTN, 3.875%, 3/11/2030, (EUR) | 432,915 |
400,000 | Ren Finance BV, EMTN, 0.500%, 4/16/2029, (EUR) | 372,968 |
805,883 | ||
Singapore — 1.3% | ||
500,000 | Vena Energy Capital Pte. Ltd., EMTN, 3.133%, 2/26/2025 | 490,885 |
Spain — 6.4% | ||
400,000 | Banco Bilbao Vizcaya Argentaria SA, 1.000%, 6/21/2026, (EUR) | 407,689 |
300,000 | Banco Bilbao Vizcaya Argentaria SA, GMTN, 4.375%, 10/14/2029, (EUR) | 334,336 |
500,000 | Bankinter SA, 0.625%, 10/06/2027, (EUR) | 486,094 |
400,000 | Iberdrola Finanzas SA, EMTN, 1.375%, 3/11/2032, (EUR) | 371,202 |
900,000 | Spain Government Bonds, 1.000%, 7/30/2042, (EUR) | 617,080 |
300,000 | Telefonica Europe BV, (fixed rate to 2/05/2027, variable rate thereafter), 2.502%, (EUR)(c) | 304,427 |
2,520,828 | ||
Supranationals — 4.8% | ||
2,000,000 | European Investment Bank, 2.375%, 5/24/2027 | 1,880,429 |
Principal Amount(‡) | Description | Value (†) |
Sweden — 3.3% | ||
400,000 | SKF AB, 3.125%, 9/14/2028, (EUR) | $421,584 |
500,000 | Vattenfall AB, EMTN, 0.125%, 2/12/2029, (EUR) | 460,864 |
400,000 | Volvo Car AB, EMTN, 2.500%, 10/07/2027, (EUR) | 406,056 |
1,288,504 | ||
Switzerland — 0.5% | ||
200,000 | ABB Finance BV, EMTN, Zero Coupon, 0.282%, 1/19/2030, (EUR)(b) | 179,897 |
United Kingdom — 9.3% | ||
500,000 | Anglian Water Services Financing PLC, EMTN, 1.625%, 8/10/2025, (GBP) | 604,087 |
500,000 | DS Smith PLC, EMTN, 4.375%, 7/27/2027, (EUR) | 546,123 |
100,000 | Severn Trent Utilities Finance PLC, EMTN, 5.250%, 4/04/2036, (GBP) | 123,262 |
500,000 | SSE PLC, EMTN, 1.375%, 9/04/2027, (EUR) | 502,919 |
300,000 | SSE PLC, EMTN, 2.875%, 8/01/2029, (EUR) | 310,431 |
1,300,000 | U.K. Gilts, 0.875%, 7/31/2033, (GBP) | 1,240,274 |
500,000 | U.K. Gilts, 1.500%, 7/31/2053, (GBP) | 318,427 |
3,645,523 | ||
United States — 10.7% | ||
600,000 | Digital Dutch Finco BV, 1.500%, 3/15/2030, (EUR) | 561,596 |
300,000 | Digital Intrepid Holding BV, 0.625%, 7/15/2031, (EUR) | 252,603 |
200,000 | DTE Electric Co., 3.950%, 3/01/2049 | 157,551 |
400,000 | Ford Motor Co., 3.250%, 2/12/2032 | 330,574 |
500,000 | General Motors Co., 5.400%, 10/15/2029 | 497,440 |
200,000 | Johnson Controls International PLC, 4.250%, 5/23/2035, (EUR) | 218,046 |
400,000 | Southern Power Co., 4.150%, 12/01/2025 | 392,877 |
300,000 | Stellantis NV, EMTN, 4.375%, 3/14/2030, (EUR) | 330,339 |
200,000 | Thermo Fisher Scientific, Inc., 4.100%, 8/15/2047 | 164,658 |
700,000 | Verizon Communications, Inc., 3.875%, 2/08/2029 | 665,312 |
600,000 | Wabtec Transportation Netherlands BV, 1.250%, 12/03/2027, (EUR) | 595,215 |
4,166,211 | ||
Total Bonds and Notes (Identified Cost $39,257,780) | 35,539,462 | |
Principal Amount(‡) | Description | Value (†) |
Short-Term Investments — 1.3% | ||
$487,329 | Tri-Party Repurchase Agreement with Fixed Income Clearing Corporation, dated 6/28/2024 at 3.500% to be repurchased at $487,471 on 7/01/2024 collateralized by $397,900 U.S. Treasury Inflation Indexed Note, 0.125% due 7/15/2026 valued at $497,125 including accrued interest (Note 2 of Notes to Financial Statements) (Identified Cost $487,329) | $487,329 |
Total Investments — 92.3% (Identified Cost $39,745,109) | 36,026,791 | |
Other assets less liabilities — 7.7% | 3,015,701 | |
Net Assets — 100.0% | $39,042,492 | |
(†) | See Note 2 of Notes to Financial Statements. |
(‡) | Principal Amount stated in U.S. dollars unless otherwise noted. |
(a) | Interest rate represents annualized yield at time of purchase; not a coupon rate. The Fund’s investment in this security is comprised of various lots with differing annualized yields. |
(b) | Interest rate represents annualized yield at time of purchase; not a coupon rate. |
(c) | Perpetual bond with no specified maturity date. |
EMTN | Euro Medium Term Note |
GMTN | Global Medium Term Note |
CAD | Canadian Dollar |
EUR | Euro |
GBP | British Pound |
Financial Futures | Expiration Date | Contracts | Notional Amount | Value | Unrealized Appreciation (Depreciation) |
CBOT 10 Year U.S. Treasury Notes Futures | 9/19/2024 | 10 | $1,080,704 | $1,099,844 | $19,140 |
Eurex 10 Year Euro BUND Futures | 9/06/2024 | 5 | 703,239 | 704,792 | 1,553 |
Eurex 30 Year Euro BUXL Futures | 9/06/2024 | 5 | 700,723 | 697,403 | (3,320 ) |
Eurex 5 Year Euro BOBL Futures | 9/06/2024 | 6 | 745,767 | 748,209 | 2,442 |
Montreal Exchange 10 Year Canadian Bond Futures | 9/18/2024 | 7 | 605,928 | 614,371 | 8,443 |
Total | $28,258 |
Financial Futures | Expiration Date | Contracts | Notional Amount | Value | Unrealized Appreciation (Depreciation) |
CME British Pound Currency Futures | 9/16/2024 | 32 | $2,547,200 | $2,529,800 | $17,400 |
Financial Futures | Expiration Date | Contracts | Notional Amount | Value | Unrealized Appreciation (Depreciation) |
CME Canadian Dollar Currency Futures | 9/17/2024 | 4 | $293,228 | $292,800 | $428 |
CME Euro Foreign Exchange Currency Futures | 9/16/2024 | 205 | 27,911,006 | 27,552,000 | 359,006 |
Total | $376,834 |
Government National | 25.6 % |
Industrial | 15.8 |
Utility-Electric | 15.4 |
Bank | 8.9 |
Financial | 7.9 |
Special Purpose | 6.2 |
Supra-National | 4.8 |
Telephone | 2.5 |
Other Investments, less than 2% each | 3.9 |
Short-Term Investments | 1.3 |
Total Investments | 92.3 |
Other assets less liabilities (including futures contracts) | 7.7 |
Net Assets | 100.0 % |
Euro | 68.9 % |
United States Dollar | 17.5 |
British Pound | 5.8 |
Canadian Dollar | 0.1 |
Total Investments | 92.3 |
Other assets less liabilities (including futures contracts) | 7.7 |
Net Assets | 100.0 % |
Shares | Description | Value (†) |
Common Stocks — 98.3% of Net Assets | ||
Belgium — 0.9% | ||
136,504 | KBC Group NV | $9,618,413 |
Canada — 2.6% | ||
191,982 | Canadian Pacific Kansas City Ltd. | 15,114,743 |
180,535 | Shopify, Inc., Class A(a) | 11,924,337 |
27,039,080 | ||
Denmark — 7.0% | ||
372,017 | Novo Nordisk AS, Class B | 53,229,961 |
879,472 | Vestas Wind Systems AS(a) | 20,393,164 |
73,623,125 | ||
France — 3.6% | ||
82,687 | Air Liquide SA | 14,270,741 |
478,072 | Credit Agricole SA | 6,527,891 |
82,941 | EssilorLuxottica SA | 17,822,655 |
38,621,287 | ||
Germany — 4.0% | ||
97,282 | SAP SE | 19,541,577 |
186,508 | Symrise AG | 22,820,583 |
42,362,160 | ||
Hong Kong — 0.9% | ||
1,458,211 | AIA Group Ltd. | 9,865,887 |
Japan — 2.9% | ||
760,003 | Sekisui House Ltd. | 16,891,202 |
800,076 | Terumo Corp. | 13,269,420 |
30,160,622 | ||
Netherlands — 4.1% | ||
16,003 | Adyen NV(a) | 19,006,373 |
23,813 | ASML Holding NV | 24,269,396 |
43,275,769 | ||
Spain — 2.8% | ||
2,287,337 | Iberdrola SA | 29,678,033 |
Taiwan — 3.9% | ||
235,207 | Taiwan Semiconductor Manufacturing Co. Ltd., ADR | 40,881,329 |
United Kingdom — 4.0% | ||
70,273 | AstraZeneca PLC | 10,936,795 |
3,958,280 | Legal & General Group PLC | 11,334,795 |
229,312 | RELX PLC | 10,506,808 |
173,598 | Unilever PLC | 9,522,931 |
42,301,329 | ||
United States — 61.6% | ||
16,798 | Accenture PLC, Class A | 5,096,681 |
43,233 | Adobe, Inc.(a) | 24,017,661 |
103,098 | AGCO Corp. | 10,091,232 |
143,163 | American Water Works Co., Inc. | 18,490,933 |
237,926 | Aptiv PLC(a) | 16,754,749 |
259,652 | Ball Corp. | 15,584,313 |
104,119 | Danaher Corp. | 26,014,132 |
784,692 | eBay, Inc. | 42,153,654 |
172,197 | Ecolab, Inc. | 40,982,886 |
77,128 | Edwards Lifesciences Corp.(a) | 7,124,313 |
53,072 | Eli Lilly & Co. | 48,050,327 |
51,098 | Enphase Energy, Inc.(a) | 5,094,982 |
35,329 | Intuitive Surgical, Inc.(a) | 15,716,106 |
106,931 | Mastercard, Inc., Class A | 47,173,680 |
116,021 | Microsoft Corp. | 51,855,586 |
Shares | Description | Value (†) |
United States — continued | ||
352,570 | NextEra Energy, Inc. | $24,965,482 |
523,040 | NVIDIA Corp. | 64,616,362 |
75,148 | Palo Alto Networks, Inc.(a) | 25,475,924 |
61,806 | Roper Technologies, Inc. | 34,837,570 |
70,650 | Thermo Fisher Scientific, Inc. | 39,069,450 |
92,777 | Veralto Corp. | 8,857,420 |
70,693 | Visa, Inc., Class A | 18,554,792 |
128,838 | Waste Management, Inc. | 27,486,299 |
62,520 | Watts Water Technologies, Inc., Class A | 11,464,292 |
166,542 | Xylem, Inc. | 22,588,091 |
652,116,917 | ||
Total Common Stocks (Identified Cost $845,630,249) | 1,039,543,951 | |
Principal Amount | ||
Short-Term Investments — 1.0% | ||
$10,854,815 | Tri-Party Repurchase Agreement with Fixed Income Clearing Corporation, dated 6/28/2024 at 3.500% to be repurchased at $10,857,981 on 7/01/2024 collateralized by $8,862,500 U.S. Treasury Inflation Indexed Note, 0.125% due 7/15/2026 valued at $11,072,113 including accrued interest (Note 2 of Notes to Financial Statements) (Identified Cost $10,854,815) | 10,854,815 |
Total Investments — 99.3% (Identified Cost $856,485,064) | 1,050,398,766 | |
Other assets less liabilities — 0.7% | 7,833,655 | |
Net Assets — 100.0% | $1,058,232,421 | |
(†) | See Note 2 of Notes to Financial Statements. |
(a) | Non-income producing security. |
ADR | An American Depositary Receipt is a certificate issued by a custodian bank representing the right to receive securities of the foreign issuer described. The values of ADRs may be significantly influenced by trading on exchanges not located in the United States. |
Software | 14.7 % |
Semiconductors & Semiconductor Equipment | 12.8 |
Pharmaceuticals | 10.6 |
Financial Services | 7.9 |
Chemicals | 7.4 |
Life Sciences Tools & Services | 6.2 |
Electric Utilities | 5.2 |
Health Care Equipment & Supplies | 5.2 |
Machinery | 4.1 |
Broadline Retail | 4.0 |
Commercial Services & Supplies | 3.4 |
Insurance | 2.0 |
Other Investments, less than 2% each | 14.8 |
Short-Term Investments | 1.0 |
Total Investments | 99.3 |
Other assets less liabilities | 0.7 |
Net Assets | 100.0 % |
United States Dollar | 69.1 % |
Euro | 16.3 |
Danish Krone | 7.0 |
British Pound | 3.1 |
Japanese Yen | 2.9 |
Hong Kong Dollar | 0.9 |
Total Investments | 99.3 |
Other assets less liabilities | 0.7 |
Net Assets | 100.0 % |
Shares | Description | Value (†) |
Common Stocks — 93.6% of Net Assets | ||
Australia — 1.0% | ||
63,087 | Stockland | $174,736 |
Belgium — 4.3% | ||
10,286 | KBC Group NV | 724,777 |
Canada — 3.9% | ||
3,987 | Canadian Pacific Kansas City Ltd. | 313,897 |
5,224 | Shopify, Inc., Class A(a) | 345,045 |
658,942 | ||
Denmark — 8.3% | ||
6,526 | Novo Nordisk AS, Class B | 933,771 |
20,613 | Vestas Wind Systems AS(a) | 477,974 |
1,411,745 | ||
France — 11.6% | ||
3,482 | Air Liquide SA | 600,950 |
25,851 | Credit Agricole SA | 352,986 |
7,212 | Dassault Systemes SE | 271,178 |
1,724 | EssilorLuxottica SA | 370,459 |
871 | L'Oreal SA | 383,384 |
1,978,957 | ||
Germany — 10.5% | ||
13,873 | Deutsche Telekom AG | 348,705 |
4,271 | SAP SE | 857,940 |
4,756 | Symrise AG | 581,930 |
1,788,575 | ||
Hong Kong — 1.9% | ||
47,316 | AIA Group Ltd. | 320,128 |
Ireland — 5.1% | ||
6,769 | Kingspan Group PLC | 575,282 |
6,402 | Smurfit Kappa Group PLC | 285,546 |
860,828 | ||
Japan — 9.8% | ||
2,900 | Kao Corp. | 117,412 |
34,808 | Kubota Corp. | 489,156 |
14,848 | Sekisui House Ltd. | 329,999 |
2,000 | Shimano, Inc. | 309,088 |
19,200 | Terumo Corp. | 318,436 |
5,400 | West Japan Railway Co. | 100,761 |
1,664,852 | ||
Netherlands — 7.6% | ||
317 | Adyen NV(a) | 376,493 |
891 | ASML Holding NV | 908,077 |
1,284,570 | ||
Spain — 3.8% | ||
49,994 | Iberdrola SA | 648,668 |
Switzerland — 2.6% | ||
766 | Geberit AG, (Registered) | 451,214 |
Taiwan — 5.8% | ||
5,653 | Taiwan Semiconductor Manufacturing Co. Ltd., ADR | 982,548 |
United Kingdom — 16.2% | ||
2,366 | AstraZeneca PLC | 368,228 |
7,258 | Croda International PLC | 361,078 |
15,475 | Halma PLC | 527,474 |
42,492 | Land Securities Group PLC | 332,014 |
186,435 | Legal & General Group PLC | 533,869 |
Shares | Description | Value (†) |
United Kingdom — continued | ||
7,668 | RELX PLC | $351,339 |
5,245 | Unilever PLC | 287,721 |
2,761,723 | ||
United States — 1.2% | ||
2,126 | Sanofi SA | 205,038 |
Total Common Stocks (Identified Cost $15,350,276) | 15,917,301 | |
Principal Amount | ||
Short-Term Investments — 3.7% | ||
$623,534 | Tri-Party Repurchase Agreement with Fixed Income Clearing Corporation, dated 6/28/2024 at 3.500% to be repurchased at $623,716 on 7/01/2024 collateralized by $509,100 U.S. Treasury Inflation Indexed Note, 0.125% due 7/15/2026 valued at $636,043 including accrued interest (Note 2 of Notes to Financial Statements) (Identified Cost $623,534) | 623,534 |
Total Investments — 97.3% (Identified Cost $15,973,810) | 16,540,835 | |
Other assets less liabilities — 2.7% | 459,685 | |
Net Assets — 100.0% | $17,000,520 | |
(†) | See Note 2 of Notes to Financial Statements. |
(a) | Non-income producing security. |
ADR | An American Depositary Receipt is a certificate issued by a custodian bank representing the right to receive securities of the foreign issuer described. The values of ADRs may be significantly influenced by trading on exchanges not located in the United States. |
Semiconductors & Semiconductor Equipment | 11.2 % |
Chemicals | 9.0 |
Pharmaceuticals | 8.9 |
Software | 6.6 |
Banks | 6.4 |
Building Products | 6.0 |
Insurance | 5.0 |
Personal Care Products | 4.6 |
Health Care Equipment & Supplies | 4.1 |
Electric Utilities | 3.8 |
Electronic Equipment, Instruments & Components | 3.1 |
Diversified REITs | 2.9 |
Machinery | 2.9 |
Electrical Equipment | 2.8 |
Ground Transportation | 2.5 |
Financial Services | 2.2 |
Professional Services | 2.1 |
Diversified Telecommunication Services | 2.1 |
IT Services | 2.0 |
Other Investments, less than 2% each | 5.4 |
Short-Term Investments | 3.7 |
Total Investments | 97.3 |
Other assets less liabilities | 2.7 |
Net Assets | 100.0 % |
Euro | 45.8 % |
British Pound | 14.5 |
United States Dollar | 13.4 |
Japanese Yen | 9.8 |
Danish Krone | 8.3 |
Swiss Franc | 2.6 |
Other, less than 2% each | 2.9 |
Total Investments | 97.3 |
Other assets less liabilities | 2.7 |
Net Assets | 100.0 % |
Gateway Fund | Gateway Equity Call Premium Fund | Mirova Global Green Bond Fund | |
ASSETS | |||
Investments at cost | $1,798,012,375 | $214,612,697 | $39,745,109 |
Net unrealized appreciation (depreciation) | 4,811,160,127 | 114,829,240 | (3,718,318 ) |
Investments at value | 6,609,172,502 | 329,441,937 | 36,026,791 |
Cash | 5,367 | — | — |
Due from brokers (including variation margin on futures contracts) (Note 2) | — | — | 440,489 |
Foreign currency at value (identified cost $0, $0 and $2,055,556, respectively) | — | — | 2,064,287 |
Receivable for Fund shares sold | 5,661,385 | 108,655 | 26,225 |
Receivable from investment adviser (Note 6) | — | — | 1,473 |
Dividends and interest receivable | 1,873,038 | 162,164 | 340,331 |
Unrealized appreciation on futures contracts (Note 2) | — | — | 408,412 |
Tax reclaims receivable | — | 500 | — |
Prepaid expenses | 312 | 312 | 312 |
TOTAL ASSETS | 6,616,712,604 | 329,713,568 | 39,308,320 |
LIABILITIES | |||
Options written, at value (premiums received $67,105,699, $4,501,913 and $0, respectively) (Note 2) | 109,066,045 | 6,246,865 | — |
Payable for Fund shares redeemed | 2,385,540 | 243,094 | 182,062 |
Unrealized depreciation on futures contracts (Note 2) | — | — | 3,320 |
Management fees payable (Note 6) | 2,983,716 | 121,133 | — |
Deferred Trustees’ fees (Note 6) | 1,144,471 | 57,077 | 24,235 |
Administrative fees payable (Note 6) | 235,715 | 11,731 | 1,433 |
Payable to distributor (Note 6d) | 52,752 | 3,116 | 327 |
Audit and tax services fees payable | 33,479 | 32,325 | 29,424 |
Other accounts payable and accrued expenses | 393,344 | 40,943 | 25,027 |
TOTAL LIABILITIES | 116,295,062 | 6,756,284 | 265,828 |
COMMITMENTS AND CONTINGENCIES(a) | — | — | — |
NET ASSETS | $6,500,417,542 | $322,957,284 | $39,042,492 |
NET ASSETS CONSIST OF: | |||
Paid-in capital | $2,693,883,612 | $244,024,954 | $46,692,533 |
Accumulated earnings (loss) | 3,806,533,930 | 78,932,330 | (7,650,041 ) |
NET ASSETS | $6,500,417,542 | $322,957,284 | $39,042,492 |
COMPUTATION OF NET ASSET VALUE AND OFFERING PRICE: | |||
Class A shares: | |||
Net assets | $668,279,145 | $2,589,679 | $5,404,219 |
Shares of beneficial interest | 15,291,174 | 138,683 | 641,458 |
Net asset value and redemption price per share | $43.70 | $18.67 | $8.42 |
Offering price per share (100/[100-maximum sales charge] of net asset value) (Note 1) | $46.37 | $19.81 | $8.79 |
Class C shares: (redemption price per share is equal to net asset value less any applicable contingent deferred sales charge) (Note 1) | |||
Net assets | $57,182,136 | $1,190,728 | $— |
Shares of beneficial interest | 1,323,249 | 64,508 | — |
Net asset value and offering price per share | $43.21 | $18.46 | $— |
Class N shares: | |||
Net assets | $402,260,919 | $280,804 | $7,862,658 |
Shares of beneficial interest | 9,212,177 | 15,064 | 926,611 |
Net asset value, offering and redemption price per share | $43.67 | $18.64 | $8.49 |
Class Y shares: | |||
Net assets | $5,372,695,342 | $318,896,073 | $25,775,615 |
Shares of beneficial interest | 123,059,143 | 17,094,120 | 3,042,501 |
Net asset value, offering and redemption price per share | $43.66 | $18.66 | $8.47 |
(a) | As disclosed in the Notes to Financial Statements, if applicable. |
Mirova Global Sustainable Equity Fund | Mirova International Sustainable Equity Fund | |
ASSETS | ||
Investments at cost | $856,485,064 | $15,973,810 |
Net unrealized appreciation (depreciation) | 193,913,702 | 567,025 |
Investments at value | 1,050,398,766 | 16,540,835 |
Foreign currency at value (identified cost $8,364,014 and $409,915, respectively) | 8,266,600 | 399,271 |
Receivable for Fund shares sold | 666,118 | 32,442 |
Receivable from investment adviser (Note 6) | — | 3,025 |
Dividends and interest receivable | 289,133 | 19,626 |
Tax reclaims receivable | 740,845 | 70,993 |
Prepaid expenses | 312 | 312 |
TOTAL ASSETS | 1,060,361,774 | 17,066,504 |
LIABILITIES | ||
Payable for Fund shares redeemed | 1,242,800 | — |
Management fees payable (Note 6) | 673,620 | — |
Deferred Trustees’ fees (Note 6) | 56,104 | 16,620 |
Administrative fees payable (Note 6) | 39,152 | 625 |
Payable to distributor (Note 6d) | 10,238 | 37 |
Audit and tax services fees payable | 27,229 | 27,415 |
Other accounts payable and accrued expenses | 80,210 | 21,287 |
TOTAL LIABILITIES | 2,129,353 | 65,984 |
COMMITMENTS AND CONTINGENCIES(a) | — | — |
NET ASSETS | $1,058,232,421 | $17,000,520 |
NET ASSETS CONSIST OF: | ||
Paid-in capital | $871,687,971 | $17,786,433 |
Accumulated earnings (loss) | 186,544,450 | (785,913 ) |
NET ASSETS | $1,058,232,421 | $17,000,520 |
COMPUTATION OF NET ASSET VALUE AND OFFERING PRICE: | ||
Class A shares: | ||
Net assets | $33,978,750 | $629,225 |
Shares of beneficial interest | 1,666,375 | 50,685 |
Net asset value and redemption price per share | $20.39 | $12.41 |
Offering price per share (100/94.25 of net asset value) (Note 1) | $21.63 | $13.17 |
Class C shares: (redemption price per share is equal to net asset value less any applicable contingent deferred sales charge) (Note 1) | ||
Net assets | $11,116,879 | $ — |
Shares of beneficial interest | 577,763 | — |
Net asset value and offering price per share | $19.24 | $ — |
Class N shares: | ||
Net assets | $281,119,904 | $12,285,988 |
Shares of beneficial interest | 13,639,492 | 983,619 |
Net asset value, offering and redemption price per share | $20.61 | $12.49 |
Class Y shares: | ||
Net assets | $732,016,888 | $4,085,307 |
Shares of beneficial interest | 35,528,047 | 327,667 |
Net asset value, offering and redemption price per share | $20.60 | $12.47 |
(a) | As disclosed in the Notes to Financial Statements, if applicable. |
Gateway Fund | Gateway Equity Call Premium Fund | Mirova Global Green Bond Fund | |
INVESTMENT INCOME | |||
Dividends | $45,020,490 | $2,223,055 | $ — |
Interest | 1,871,337 | 103,922 | 514,391 |
Less net foreign taxes withheld | (39,173 ) | (13,402 ) | — |
46,852,654 | 2,313,575 | 514,391 | |
Expenses | |||
Management fees (Note 6) | 18,933,718 | 875,222 | 98,598 |
Service and distribution fees (Note 6) | 1,180,430 | 8,777 | 6,606 |
Administrative fees (Note 6) | 1,449,881 | 67,983 | 8,891 |
Trustees' fees and expenses (Note 6) | 241,210 | 20,073 | 11,933 |
Transfer agent fees and expenses (Notes 6, 7 and 8) | 2,169,301 | 123,656 | 16,046 |
Audit and tax services fees | 27,589 | 27,521 | 23,192 |
Custodian fees and expenses | 103,297 | 28,690 | 5,137 |
Excise tax expenses (Note 12) | — | — | 1,413 |
Interest expense (Note 11) | — | — | 131 |
Legal fees | 146,513 | 6,129 | 879 |
Registration fees | 66,883 | 35,120 | 23,455 |
Regulatory filing fees | 6,500 | 6,500 | 6,500 |
Shareholder reporting expenses | 114,809 | 11,003 | 10,224 |
Miscellaneous expenses | 118,386 | 17,718 | 12,288 |
Total expenses | 24,558,517 | 1,228,392 | 225,293 |
Less waiver and/or expense reimbursement (Note 6) | (917,157 ) | (190,261 ) | (91,602 ) |
Less expense offset (Note 8) | (97,354 ) | (3,256 ) | (652 ) |
Net expenses | 23,544,006 | 1,034,875 | 133,039 |
Net investment income | 23,308,648 | 1,278,700 | 381,352 |
Net realized and unrealized gain (loss) on Investments, Futures contracts, Options written and Foreign currency transactions | |||
Net realized gain (loss) on: | |||
Investments | 342,776,851 | 495,284 | (226,948 ) |
Futures contracts | — | — | 282,442 |
Options written | (254,441,089 ) | (13,794,907 ) | — |
Foreign currency transactions (Note 2c) | (783 ) | (97 ) | 12,144 |
Net change in unrealized appreciation (depreciation) on: | |||
Investments | 408,514,293 | 40,909,121 | (1,209,423 ) |
Futures contracts | — | — | 488,403 |
Options written | 9,814,512 | 428,497 | — |
Foreign currency translations (Note 2c) | (435 ) | (66 ) | (32,994 ) |
Net realized and unrealized gain (loss) on Investments, Futures contracts, Options written and Foreign currency transactions | 506,663,349 | 28,037,832 | (686,376 ) |
NET INCREASE (DECREASE) IN NET ASSETS RESULTING FROM OPERATIONS | $529,971,997 | $29,316,532 | $(305,024 ) |
Mirova Global Sustainable Equity Fund | Mirova International Sustainable Equity Fund | |
INVESTMENT INCOME | ||
Dividends | $8,225,423 | $280,551 |
Non-cash dividends (Note 2b) | 558,796 | — |
Interest | 330,528 | 11,349 |
Less net foreign taxes withheld | (663,061 ) | (22,880 ) |
8,451,686 | 269,020 | |
Expenses | ||
Management fees (Note 6) | 4,341,193 | 64,563 |
Service and distribution fees (Note 6) | 94,059 | 776 |
Administrative fees (Note 6) | 244,568 | 3,637 |
Trustees' fees and expenses (Note 6) | 33,828 | 10,730 |
Transfer agent fees and expenses (Notes 6, 7 and 8) | 415,028 | 3,878 |
Audit and tax services fees | 22,985 | 22,976 |
Custodian fees and expenses | 30,519 | 4,769 |
Interest expense (Note 11) | — | 536 |
Legal fees | 23,732 | 323 |
Registration fees | 66,506 | 25,262 |
Regulatory filing fees | 6,500 | 6,500 |
Shareholder reporting expenses | 52,301 | 7,590 |
Miscellaneous expenses | 29,801 | 9,102 |
Total expenses | 5,361,020 | 160,642 |
Less waiver and/or expense reimbursement (Note 6) | (183,335 ) | (85,480 ) |
Less expense offset (Note 8) | (2,988 ) | (84 ) |
Net expenses | 5,174,697 | 75,078 |
Net investment income | 3,276,989 | 193,942 |
Net realized and unrealized gain (loss) on Investments and Foreign currency transactions | ||
Net realized gain (loss) on: | ||
Investments | 26,384,000 | (401,864 ) |
Foreign currency transactions (Note 2c) | (117,567 ) | 11,910 |
Net change in unrealized appreciation (depreciation) on: | ||
Investments | 112,499,047 | 902,436 |
Foreign currency translations (Note 2c) | (189,635 ) | (28,314 ) |
Net realized and unrealized gain on Investments and Foreign currency transactions | 138,575,845 | 484,168 |
NET INCREASE IN NET ASSETS RESULTING FROM OPERATIONS | $141,852,834 | $678,110 |
Gateway Fund | Gateway Equity Call Premium Fund | |||
Six Months Ended June 30,2024 (Unaudited) | Year Ended December 31,2023 | Six Months Ended June 30,2024 (Unaudited) | Year Ended December 31,2023 | |
FROM OPERATIONS: | ||||
Net investment income | $23,308,648 | $57,100,451 | $1,278,700 | $2,382,893 |
Net realized gain (loss) on investments, written options and foreign currency transactions | 88,334,979 | 6,738,601 | (13,299,720 ) | (12,935,957 ) |
Net change in unrealized appreciation on investments, written options and foreign currency translations | 418,328,370 | 804,362,927 | 41,337,552 | 45,102,037 |
Net increase in net assets resulting from operations | 529,971,997 | 868,201,979 | 29,316,532 | 34,548,973 |
FROM DISTRIBUTIONS TO SHAREHOLDERS: | ||||
Class A | (1,944,894 ) | (5,628,870 ) | (7,291 ) | (14,160 ) |
Class C | (11,785 ) | (35,832 ) | (120 ) | (383 ) |
Class N | (1,672,166 ) | (4,248,718 ) | (1,166 ) | (2,435 ) |
Class Y | (20,931,293 ) | (47,085,481 ) | (1,258,149 ) | (2,318,924 ) |
Total distributions | (24,560,138 ) | (56,998,901 ) | (1,266,726 ) | (2,335,902 ) |
NET INCREASE (DECREASE) IN NET ASSETS FROM CAPITAL SHARES TRANSACTIONS (Note 14) | (457,288,439 ) | (696,948,462 ) | 24,416,822 | 98,867,789 |
Net increase in net assets | 48,123,420 | 114,254,616 | 52,466,628 | 131,080,860 |
NET ASSETS | ||||
Beginning of the period | 6,452,294,122 | 6,338,039,506 | 270,490,656 | 139,409,796 |
End of the period | $6,500,417,542 | $6,452,294,122 | $322,957,284 | $270,490,656 |
Mirova Global Green Bond Fund | Mirova Global Sustainable Equity Fund | |||
Six Months Ended June 30,2024 (Unaudited) | Year Ended December 31,2023 | Six Months Ended June 30,2024 (Unaudited) | Year Ended December 31,2023 | |
FROM OPERATIONS: | ||||
Net investment income | $381,352 | $658,338 | $3,276,989 | $5,968,893 |
Net realized gain (loss) on investments, futures contracts and foreign currency transactions | 67,638 | (1,682,652 ) | 26,266,433 | (21,970,730 ) |
Net change in unrealized appreciation (depreciation) on investments, futures contracts and foreign currency translations | (754,014 ) | 4,173,620 | 112,309,412 | 180,547,685 |
Net increase (decrease) in net assets resulting from operations | (305,024 ) | 3,149,306 | 141,852,834 | 164,545,848 |
FROM DISTRIBUTIONS TO SHAREHOLDERS: | ||||
Class A | — | (102,967 ) | (9,124 ) | (114,468 ) |
Class C | — | — | (3,198 ) | (7,207 ) |
Class N | — | (155,506 ) | (75,821 ) | (1,592,541 ) |
Class Y | — | (592,982 ) | (223,246 ) | (4,579,840 ) |
Total distributions | — | (851,455 ) | (311,389 ) | (6,294,056 ) |
NET INCREASE (DECREASE) IN NET ASSETS FROM CAPITAL SHARES TRANSACTIONS (Note 14) | 83,230 | 1,351,141 | (117,025,050 ) | 8,031,826 |
Net increase (decrease) in net assets | (221,794 ) | 3,648,992 | 24,516,395 | 166,283,618 |
NET ASSETS | ||||
Beginning of the period | 39,264,286 | 35,615,294 | 1,033,716,026 | 867,432,408 |
End of the period | $39,042,492 | $39,264,286 | $1,058,232,421 | $1,033,716,026 |
Mirova International Sustainable Equity Fund | ||
Six Months Ended June 30,2024 (Unaudited) | Year Ended December 31,2023 | |
FROM OPERATIONS: | ||
Net investment income | $193,942 | $189,054 |
Net realized loss on investments and foreign currency transactions | (389,954 ) | (851,122 ) |
Net change in unrealized appreciation on investments and foreign currency translations | 874,122 | 2,270,242 |
Net increase in net assets resulting from operations | 678,110 | 1,608,174 |
FROM DISTRIBUTIONS TO SHAREHOLDERS: | ||
Class A | (190 ) | (6,318 ) |
Class N | (3,652 ) | (138,982 ) |
Class Y | (1,252 ) | (61,156 ) |
Total distributions | (5,094 ) | (206,456 ) |
NET INCREASE IN NET ASSETS FROM CAPITAL SHARES TRANSACTIONS (Note 14) | 119,023 | 5,848,519 |
Net increase in net assets | 792,039 | 7,250,237 |
NET ASSETS | ||
Beginning of the period | 16,208,481 | 8,958,244 |
End of the period | $17,000,520 | $16,208,481 |
Gateway Fund—Class A | ||||||
Six Months Ended June 30, 2024 (Unaudited) | Year Ended December 31, 2023 | Year Ended December 31, 2022 | Year Ended December 31, 2021 | Year Ended December 31, 2020 | Year Ended December 31, 2019 | |
Net asset value, beginning of the period | $40.42 | $35.57 | $40.70 | $36.76 | $34.69 | $31.65 |
INCOME (LOSS) FROM INVESTMENT OPERATIONS: | ||||||
Net investment income(a) | 0.11 | 0.27 | 0.22 | 0.18 | 0.30 | 0.37 |
Net realized and unrealized gain (loss) | 3.29 | 4.85 | (5.13 ) | 3.93 | 2.08 | 3.05 |
Total from Investment Operations | 3.40 | 5.12 | (4.91 ) | 4.11 | 2.38 | 3.42 |
LESS DISTRIBUTIONS FROM: | ||||||
Net investment income | (0.12 ) | (0.27 ) | (0.22 ) | (0.17 ) | (0.31 ) | (0.38 ) |
Net asset value, end of the period | $43.70 | $40.42 | $35.57 | $40.70 | $36.76 | $34.69 |
Total return(b)(c) | 8.41 %(d) | 14.43 % | (12.06 )% | 11.24 % | 6.92 % | 10.84 % |
RATIOS TO AVERAGE NET ASSETS: | ||||||
Net assets, end of the period (000's) | $668,279 | $778,973 | $869,122 | $1,073,713 | $987,702 | $1,125,464 |
Net expenses(e) | 0.94 %(f)(g) | 0.94 %(h) | 0.93 %(i) | 0.94 %(i) | 0.94 % | 0.94 % |
Gross expenses | 0.98 %(f)(g) | 0.98 %(h) | 0.96 %(i) | 0.98 %(i) | 1.02 % | 1.01 % |
Net investment income | 0.51 %(f) | 0.71 % | 0.60 % | 0.46 % | 0.88 % | 1.12 % |
Portfolio turnover rate | 4 % | 18 % | 16 % | 11 % | 22 % | 12 % |
(a) | Per share net investment income has been calculated using the average shares outstanding during the period. |
(b) | A sales charge for Class A shares is not reflected in total return calculations. |
(c) | Had certain expenses not been waived/reimbursed during the period, total returns would have been lower. |
(d) | Periods less than one year are not annualized. |
(e) | The investment adviser agreed to waive its fees and/or reimburse a portion of the Fund’s expenses during the period. Without this waiver/reimbursement, expenses would have been higher. |
(f) | Computed on an annualized basis for periods less than one year. |
(g) | Includes refund of prior year service fee of less than 0.01%. See Note 6b of Notes to Financial Statements. |
(h) | Includes refund of prior year service fee of less than 0.01%. |
(i) | Includes refund of prior year service fee of 0.01%. |
Gateway Fund—Class C | ||||||
Six Months Ended June 30, 2024 (Unaudited) | Year Ended December 31, 2023 | Year Ended December 31, 2022 | Year Ended December 31, 2021 | Year Ended December 31, 2020 | Year Ended December 31, 2019 | |
Net asset value, beginning of the period | $40.02 | $35.26 | $40.41 | $36.60 | $34.54 | $31.50 |
INCOME (LOSS) FROM INVESTMENT OPERATIONS: | ||||||
Net investment income (loss)(a) | (0.05 ) | (0.02 ) | (0.06 ) | (0.11 ) | 0.04 | 0.12 |
Net realized and unrealized gain (loss) | 3.25 | 4.80 | (5.09 ) | 3.92 | 2.07 | 3.03 |
Total from Investment Operations | 3.20 | 4.78 | (5.15 ) | 3.81 | 2.11 | 3.15 |
LESS DISTRIBUTIONS FROM: | ||||||
Net investment income | (0.01 ) | (0.02 ) | — | — | (0.05 ) | (0.11 ) |
Net asset value, end of the period | $43.21 | $40.02 | $35.26 | $40.41 | $36.60 | $34.54 |
Total return(b)(c) | 7.99 %(d) | 13.56 % | (12.74 )% | 10.41 % | 6.13 % | 10.02 % |
RATIOS TO AVERAGE NET ASSETS: | ||||||
Net assets, end of the period (000's) | $57,182 | $61,730 | $77,355 | $114,019 | $142,623 | $215,947 |
Net expenses(e) | 1.70 %(f) | 1.70 % | 1.70 % | 1.70 % | 1.70 % | 1.70 % |
Gross expenses | 1.73 %(f) | 1.73 % | 1.71 % | 1.73 % | 1.77 % | 1.76 % |
Net investment income (loss) | (0.24 )%(f) | (0.06 )% | (0.17 )% | (0.30 )% | 0.12 % | 0.37 % |
Portfolio turnover rate | 4 % | 18 % | 16 % | 11 % | 22 % | 12 % |
(a) | Per share net investment income (loss) has been calculated using the average shares outstanding during the period. |
(b) | A contingent deferred sales charge for Class C shares is not reflected in total return calculations. |
(c) | Had certain expenses not been waived/reimbursed during the period, total returns would have been lower. |
(d) | Periods less than one year are not annualized. |
(e) | The investment adviser agreed to waive its fees and/or reimburse a portion of the Fund’s expenses during the period. Without this waiver/reimbursement, expenses would have been higher. |
(f) | Computed on an annualized basis for periods less than one year. |
Gateway Fund—Class N | ||||||
Six Months Ended June 30, 2024 (Unaudited) | Year Ended December 31, 2023 | Year Ended December 31, 2022 | Year Ended December 31, 2021 | Year Ended December 31, 2020 | Year Ended December 31, 2019 | |
Net asset value, beginning of the period | $40.39 | $35.55 | $40.68 | $36.74 | $34.68 | $31.63 |
INCOME (LOSS) FROM INVESTMENT OPERATIONS: | ||||||
Net investment income(a) | 0.17 | 0.39 | 0.33 | 0.29 | 0.40 | 0.47 |
Net realized and unrealized gain (loss) | 3.29 | 4.83 | (5.13 ) | 3.94 | 2.07 | 3.06 |
Total from Investment Operations | 3.46 | 5.22 | (4.80 ) | 4.23 | 2.47 | 3.53 |
LESS DISTRIBUTIONS FROM: | ||||||
Net investment income | (0.18 ) | (0.38 ) | (0.33 ) | (0.29 ) | (0.41 ) | (0.48 ) |
Net asset value, end of the period | $43.67 | $40.39 | $35.55 | $40.68 | $36.74 | $34.68 |
Total return | 8.57 %(b)(c) | 14.75 %(b) | (11.80 )% | 11.57 %(b) | 7.25 %(b) | 11.17 %(b) |
RATIOS TO AVERAGE NET ASSETS: | ||||||
Net assets, end of the period (000's) | $402,261 | $540,446 | $378,377 | $504,299 | $369,829 | $369,793 |
Net expenses | 0.65 %(d)(e) | 0.65 %(d) | 0.65 % | 0.65 %(d) | 0.65 %(d) | 0.65 %(d) |
Gross expenses | 0.66 %(e) | 0.66 % | 0.65 % | 0.67 % | 0.70 % | 0.69 % |
Net investment income | 0.83 %(e) | 1.00 % | 0.88 % | 0.74 % | 1.17 % | 1.40 % |
Portfolio turnover rate | 4 % | 18 % | 16 % | 11 % | 22 % | 12 % |
(a) | Per share net investment income has been calculated using the average shares outstanding during the period. |
(b) | Had certain expenses not been waived/reimbursed during the period, total returns would have been lower. |
(c) | Periods less than one year are not annualized. |
(d) | The investment adviser agreed to waive its fees and/or reimburse a portion of the Fund’s expenses during the period. Without this waiver/reimbursement, expenses would have been higher. |
(e) | Computed on an annualized basis for periods less than one year. |
Gateway Fund—Class Y | ||||||
Six Months Ended June 30, 2024 (Unaudited) | Year Ended December 31, 2023 | Year Ended December 31, 2022 | Year Ended December 31, 2021 | Year Ended December 31, 2020 | Year Ended December 31, 2019 | |
Net asset value, beginning of the period | $40.38 | $35.54 | $40.67 | $36.73 | $34.67 | $31.63 |
INCOME (LOSS) FROM INVESTMENT OPERATIONS: | ||||||
Net investment income(a) | 0.16 | 0.36 | 0.31 | 0.27 | 0.38 | 0.46 |
Net realized and unrealized gain (loss) | 3.29 | 4.84 | (5.13 ) | 3.94 | 2.07 | 3.04 |
Total from Investment Operations | 3.45 | 5.20 | (4.82 ) | 4.21 | 2.45 | 3.50 |
LESS DISTRIBUTIONS FROM: | ||||||
Net investment income | (0.17 ) | (0.36 ) | (0.31 ) | (0.27 ) | (0.39 ) | (0.46 ) |
Net asset value, end of the period | $43.66 | $40.38 | $35.54 | $40.67 | $36.73 | $34.67 |
Total return(b) | 8.55 %(c) | 14.70 % | (11.85 )% | 11.49 % | 7.19 % | 11.12 % |
RATIOS TO AVERAGE NET ASSETS: | ||||||
Net assets, end of the period (000's) | $5,372,695 | $5,071,145 | $5,013,186 | $6,492,511 | $5,624,810 | $6,446,007 |
Net expenses(d) | 0.70 %(e) | 0.70 % | 0.70 % | 0.70 % | 0.70 % | 0.70 % |
Gross expenses | 0.73 %(e) | 0.73 % | 0.71 % | 0.73 % | 0.77 % | 0.76 % |
Net investment income | 0.76 %(e) | 0.94 % | 0.83 % | 0.70 % | 1.12 % | 1.37 % |
Portfolio turnover rate | 4 % | 18 % | 16 % | 11 % | 22 % | 12 % |
(a) | Per share net investment income has been calculated using the average shares outstanding during the period. |
(b) | Had certain expenses not been waived/reimbursed during the period, total returns would have been lower. |
(c) | Periods less than one year are not annualized. |
(d) | The investment adviser agreed to waive its fees and/or reimburse a portion of the Fund’s expenses during the period. Without this waiver/reimbursement, expenses would have been higher. |
(e) | Computed on an annualized basis for periods less than one year. |
Gateway Equity Call Premium Fund—Class A | ||||||
Six Months Ended June 30, 2024 (Unaudited) | Year Ended December 31, 2023 | Year Ended December 31, 2022 | Year Ended December 31, 2021 | Year Ended December 31, 2020 | Year Ended December 31, 2019 | |
Net asset value, beginning of the period | $17.01 | $14.60 | $16.66 | $14.03 | $13.07 | $11.32 |
INCOME (LOSS) FROM INVESTMENT OPERATIONS: | ||||||
Net investment income(a) | 0.05 | 0.12 | 0.10 | 0.07 | 0.09 | 0.10 |
Net realized and unrealized gain (loss) | 1.66 | 2.41 | (2.06 ) | 2.62 | 0.95 | 1.76 |
Total from Investment Operations | 1.71 | 2.53 | (1.96 ) | 2.69 | 1.04 | 1.86 |
LESS DISTRIBUTIONS FROM: | ||||||
Net investment income | (0.05 ) | (0.12 ) | (0.10 ) | (0.06 ) | (0.08 ) | (0.11 ) |
Net asset value, end of the period | $18.67 | $17.01 | $14.60 | $16.66 | $14.03 | $13.07 |
Total return(b)(c) | 10.07 %(d) | 17.35 % | (11.77 )% | 19.20 % | 8.06 % | 16.46 % |
RATIOS TO AVERAGE NET ASSETS: | ||||||
Net assets, end of the period (000's) | $2,590 | $2,073 | $1,617 | $2,613 | $1,456 | $2,363 |
Net expenses(e) | 0.93 %(f) | 0.93 % | 0.93 % | 1.03 %(g)(h) | 1.20 % | 1.20 % |
Gross expenses | 1.07 %(f)(i) | 1.09 % | 1.16 % | 1.20 % | 1.43 % | 1.42 % |
Net investment income | 0.60 %(f) | 0.78 % | 0.66 % | 0.43 % | 0.69 % | 0.82 % |
Portfolio turnover rate | 7 % | 32 % | 11 % | 5 % | 15 % | 17 % |
(a) | Per share net investment income has been calculated using the average shares outstanding during the period. |
(b) | A sales charge for Class A shares is not reflected in total return calculations. |
(c) | Had certain expenses not been waived/reimbursed during the period, total returns would have been lower. |
(d) | Periods less than one year are not annualized. |
(e) | The investment adviser agreed to waive its fees and/or reimburse a portion of the Fund’s expenses during the period. Without this waiver/reimbursement, expenses would have been higher. |
(f) | Computed on an annualized basis for periods less than one year. |
(g) | Effective July 1, 2021, the expense limit decreased from 1.20% to 0.93%. |
(h) | Includes additional voluntary waiver of advisory fee of 0.02%. |
(i) | Includes transfer agent fees and expenses before expense offset. Without these expenses the ratio of gross expenses would have been 1.06%. See Note 8 of Notes to Financial Statements. |
Gateway Equity Call Premium Fund—Class C | ||||||
Six Months Ended June 30, 2024 (Unaudited) | Year Ended December 31, 2023 | Year Ended December 31, 2022 | Year Ended December 31, 2021 | Year Ended December 31, 2020 | Year Ended December 31, 2019 | |
Net asset value, beginning of the period | $16.83 | $14.46 | $16.52 | $13.96 | $13.03 | $11.29 |
INCOME (LOSS) FROM INVESTMENT OPERATIONS: | ||||||
Net investment income (loss)(a) | (0.01 ) | 0.00 (b) | (0.01 ) | (0.05 ) | (0.01 ) | 0.01 |
Net realized and unrealized gain (loss) | 1.64 | 2.38 | (2.04 ) | 2.61 | 0.95 | 1.74 |
Total from Investment Operations | 1.63 | 2.38 | (2.05 ) | 2.56 | 0.94 | 1.75 |
LESS DISTRIBUTIONS FROM: | ||||||
Net investment income | (0.00 )(b) | (0.01 ) | (0.01 ) | (0.00 )(b) | (0.01 ) | (0.01 ) |
Net asset value, end of the period | $18.46 | $16.83 | $14.46 | $16.52 | $13.96 | $13.03 |
Total return(c)(d) | 9.70 %(e) | 16.44 % | (12.36 )% | 18.28 % | 7.23 % | 15.54 % |
RATIOS TO AVERAGE NET ASSETS: | ||||||
Net assets, end of the period (000's) | $1,191 | $1,130 | $944 | $814 | $741 | $727 |
Net expenses(f) | 1.68 %(g) | 1.68 % | 1.68 % | 1.79 %(h)(i) | 1.95 % | 1.95 % |
Gross expenses | 1.81 %(g) | 1.84 % | 1.91 % | 1.96 % | 2.17 % | 2.17 % |
Net investment income (loss) | (0.15 )%(g) | 0.03 % | (0.06 )% | (0.33 )% | (0.10 )% | 0.07 % |
Portfolio turnover rate | 7 % | 32 % | 11 % | 5 % | 15 % | 17 % |
(a) | Per share net investment income (loss) has been calculated using the average shares outstanding during the period. |
(b) | Amount rounds to less than $0.01 per share. |
(c) | A contingent deferred sales charge for Class C shares is not reflected in total return calculations. |
(d) | Had certain expenses not been waived/reimbursed during the period, total returns would have been lower. |
(e) | Periods less than one year are not annualized. |
(f) | The investment adviser agreed to waive its fees and/or reimburse a portion of the Fund’s expenses during the period. Without this waiver/reimbursement, expenses would have been higher. |
(g) | Computed on an annualized basis for periods less than one year. |
(h) | Effective July 1, 2021, the expense limit decreased from 1.95% to 1.68%. |
(i) | Includes additional voluntary waiver of advisory fee of 0.02%. |
Gateway Equity Call Premium Fund—Class N | ||||||
Six Months Ended June 30, 2024 (Unaudited) | Year Ended December 31, 2023 | Year Ended December 31, 2022 | Year Ended December 31, 2021 | Year Ended December 31, 2020 | Year Ended December 31, 2019 | |
Net asset value, beginning of the period | $16.98 | $14.57 | $16.63 | $14.01 | $13.06 | $11.32 |
INCOME (LOSS) FROM INVESTMENT OPERATIONS: | ||||||
Net investment income(a) | 0.08 | 0.17 | 0.14 | 0.11 | 0.12 | 0.13 |
Net realized and unrealized gain (loss) | 1.66 | 2.40 | (2.05 ) | 2.61 | 0.95 | 1.76 |
Total from Investment Operations | 1.74 | 2.57 | (1.91 ) | 2.72 | 1.07 | 1.89 |
LESS DISTRIBUTIONS FROM: | ||||||
Net investment income | (0.08 ) | (0.16 ) | (0.15 ) | (0.10 ) | (0.12 ) | (0.15 ) |
Net asset value, end of the period | $18.64 | $16.98 | $14.57 | $16.63 | $14.01 | $13.06 |
Total return(b) | 10.24 %(c) | 17.74 % | (11.51 )% | 19.49 % | 8.36 % | 16.73 % |
RATIOS TO AVERAGE NET ASSETS: | ||||||
Net assets, end of the period (000's) | $281 | $255 | $219 | $437 | $728 | $530 |
Net expenses(d) | 0.63 %(e) | 0.63 % | 0.63 % | 0.77 %(f) | 0.90 % | 0.90 % |
Gross expenses | 1.16 %(e) | 1.28 % | 1.23 % | 1.08 % | 1.29 % | 1.63 % |
Net investment income | 0.90 %(e) | 1.08 % | 0.95 % | 0.70 % | 0.95 % | 1.03 % |
Portfolio turnover rate | 7 % | 32 % | 11 % | 5 % | 15 % | 17 % |
(a) | Per share net investment income has been calculated using the average shares outstanding during the period. |
(b) | Had certain expenses not been waived/reimbursed during the period, total returns would have been lower. |
(c) | Periods less than one year are not annualized. |
(d) | The investment adviser agreed to waive its fees and/or reimburse a portion of the Fund’s expenses during the period. Without this waiver/reimbursement, expenses would have been higher. |
(e) | Computed on an annualized basis for periods less than one year. |
(f) | Effective July 1, 2021, the expense limit decreased from 0.90% to 0.63%. |
Gateway Equity Call Premium Fund—Class Y | ||||||
Six Months Ended June 30, 2024 (Unaudited) | Year Ended December 31, 2023 | Year Ended December 31, 2022 | Year Ended December 31, 2021 | Year Ended December 31, 2020 | Year Ended December 31, 2019 | |
Net asset value, beginning of the period | $16.99 | $14.59 | $16.65 | $14.02 | $13.07 | $11.32 |
INCOME (LOSS) FROM INVESTMENT OPERATIONS: | ||||||
Net investment income(a) | 0.08 | 0.17 | 0.14 | 0.10 | 0.11 | 0.13 |
Net realized and unrealized gain (loss) | 1.66 | 2.39 | (2.06 ) | 2.63 | 0.96 | 1.76 |
Total from Investment Operations | 1.74 | 2.56 | (1.92 ) | 2.73 | 1.07 | 1.89 |
LESS DISTRIBUTIONS FROM: | ||||||
Net investment income | (0.07 ) | (0.16 ) | (0.14 ) | (0.10 ) | (0.12 ) | (0.14 ) |
Net asset value, end of the period | $18.66 | $16.99 | $14.59 | $16.65 | $14.02 | $13.07 |
Total return(b) | 10.27 %(c) | 17.59 % | (11.48 )% | 19.43 % | 8.38 % | 16.67 % |
RATIOS TO AVERAGE NET ASSETS: | ||||||
Net assets, end of the period (000's) | $318,896 | $267,033 | $136,629 | $102,004 | $56,979 | $60,794 |
Net expenses(d) | 0.68 %(e) | 0.68 % | 0.68 % | 0.78 %(f)(g) | 0.95 % | 0.95 % |
Gross expenses | 0.81 %(e) | 0.84 % | 0.91 % | 0.95 % | 1.17 % | 1.17 % |
Net investment income | 0.85 %(e) | 1.04 % | 0.95 % | 0.67 % | 0.90 % | 1.06 % |
Portfolio turnover rate | 7 % | 32 % | 11 % | 5 % | 15 % | 17 % |
(a) | Per share net investment income has been calculated using the average shares outstanding during the period. |
(b) | Had certain expenses not been waived/reimbursed during the period, total returns would have been lower. |
(c) | Periods less than one year are not annualized. |
(d) | The investment adviser agreed to waive its fees and/or reimburse a portion of the Fund’s expenses during the period. Without this waiver/reimbursement, expenses would have been higher. |
(e) | Computed on an annualized basis for periods less than one year. |
(f) | Effective July 1, 2021, the expense limit decreased from 0.95% to 0.68%. |
(g) | Includes additional voluntary waiver of advisory fee of 0.02%. |
Mirova Global Green Bond Fund—Class A | ||||||
Six Months Ended June 30, 2024 (Unaudited) | Year Ended December 31, 2023 | Year Ended December 31, 2022 | Year Ended December 31, 2021 | Year Ended December 31, 2020 | Year Ended December 31, 2019 | |
Net asset value, beginning of the period | $8.50 | $7.99 | $10.14 | $10.77 | $10.36 | $9.71 |
INCOME (LOSS) FROM INVESTMENT OPERATIONS: | ||||||
Net investment income(a) | 0.07 | 0.13 | 0.07 | 0.04 | 0.07 | 0.09 |
Net realized and unrealized gain (loss) | (0.15 ) | 0.55 | (1.75 ) | (0.37 ) | 0.71 | 0.80 |
Total from Investment Operations | (0.08 ) | 0.68 | (1.68 ) | (0.33 ) | 0.78 | 0.89 |
LESS DISTRIBUTIONS FROM: | ||||||
Net investment income | — | (0.17 ) | (0.01 ) | (0.14 ) | (0.18 ) | (0.10 ) |
Net realized capital gains | — | — | (0.46 ) | (0.16 ) | (0.19 ) | (0.14 ) |
Total Distributions | — | (0.17 ) | (0.47 ) | (0.30 ) | (0.37 ) | (0.24 ) |
Net asset value, end of the period | $8.42 | $8.50 | $7.99 | $10.14 | $10.77 | $10.36 |
Total return(b)(c) | (0.94 )%(d) | 8.48 % | (16.73 )% | (3.02 )% | 7.61 % | 9.16 % |
RATIOS TO AVERAGE NET ASSETS: | ||||||
Net assets, end of the period (000's) | $5,404 | $5,230 | $5,278 | $6,798 | $5,674 | $2,549 |
Net expenses(e) | 0.90 %(f) | 0.93 %(g) | 0.91 %(h) | 0.96 %(i)(j) | 0.97 %(k) | 0.96 %(l) |
Gross expenses | 1.37 %(f) | 1.41 %(g) | 1.34 %(h) | 1.41 %(j) | 1.43 %(k) | 1.56 %(l) |
Net investment income | 1.71 %(f) | 1.55 % | 0.83 % | 0.39 % | 0.69 % | 0.86 % |
Portfolio turnover rate | 7 % | 18 % | 60 % | 37 % | 53 % | 25 % |
(a) | Per share net investment income has been calculated using the average shares outstanding during the period. |
(b) | A sales charge for Class A shares is not reflected in total return calculations. |
(c) | Had certain expenses not been waived/reimbursed during the period, total returns would have been lower. |
(d) | Periods less than one year are not annualized. |
(e) | The investment adviser agreed to waive its fees and/or reimburse a portion of the Fund’s expenses during the period. Without this waiver/reimbursement, expenses would have been higher. |
(f) | Computed on an annualized basis for periods less than one year. |
(g) | Includes interest expense. Without this expense the ratio of net expenses would have been 0.90% and the ratio of gross expenses would have been 1.38%. |
(h) | Includes interest expense. Without this expense the ratio of net expenses would have been 0.90% and the ratio of gross expenses would have been 1.33%. |
(i) | Effective July 1, 2021, the expense limit decreased from 0.95% to 0.90%. |
(j) | Includes interest expense. Without this expense the ratio of net expenses would have been 0.92% and the ratio of gross expenses would have been 1.37%. |
(k) | Includes interest expense. Without this expense the ratio of net expenses would have been 0.95% and the ratio of gross expenses would have been 1.41%. |
(l) | Includes interest expense. Without this expense the ratio of net expenses would have been 0.95% and the ratio of gross expenses would have been 1.55%. |
Mirova Global Green Bond Fund—Class N | ||||||
Six Months Ended June 30, 2024 (Unaudited) | Year Ended December 31, 2023 | Year Ended December 31, 2022 | Year Ended December 31, 2021 | Year Ended December 31, 2020 | Year Ended December 31, 2019 | |
Net asset value, beginning of the period | $8.55 | $8.04 | $10.17 | $10.80 | $10.39 | $9.73 |
INCOME (LOSS) FROM INVESTMENT OPERATIONS: | ||||||
Net investment income(a) | 0.08 | 0.15 | 0.10 | 0.07 | 0.10 | 0.12 |
Net realized and unrealized gain (loss) | (0.14 ) | 0.55 | (1.75 ) | (0.36 ) | 0.71 | 0.80 |
Total from Investment Operations | (0.06 ) | 0.70 | (1.65 ) | (0.29 ) | 0.81 | 0.92 |
LESS DISTRIBUTIONS FROM: | ||||||
Net investment income | — | (0.19 ) | (0.02 ) | (0.18 ) | (0.21 ) | (0.12 ) |
Net realized capital gains | — | — | (0.46 ) | (0.16 ) | (0.19 ) | (0.14 ) |
Total Distributions | — | (0.19 ) | (0.48 ) | (0.34 ) | (0.40 ) | (0.26 ) |
Net asset value, end of the period | $8.49 | $8.55 | $8.04 | $10.17 | $10.80 | $10.39 |
Total return(b) | (0.70 )%(c) | 8.73 % | (16.42 )% | (2.73 )% | 7.89 % | 9.52 % |
RATIOS TO AVERAGE NET ASSETS: | ||||||
Net assets, end of the period (000's) | $7,863 | $7,045 | $5,224 | $8,110 | $11,781 | $27,322 |
Net expenses(d) | 0.60 %(e) | 0.62 %(f) | 0.61 %(g) | 0.67 %(h)(i) | 0.67 %(j) | 0.66 %(k) |
Gross expenses | 1.05 %(e) | 1.08 %(f) | 0.99 %(g) | 1.05 %(i) | 1.07 %(j) | 1.08 %(k) |
Net investment income | 2.01 %(e) | 1.86 % | 1.11 % | 0.69 % | 0.96 % | 1.17 % |
Portfolio turnover rate | 7 % | 18 % | 60 % | 37 % | 53 % | 25 % |
(a) | Per share net investment income has been calculated using the average shares outstanding during the period. |
(b) | Had certain expenses not been waived/reimbursed during the period, total returns would have been lower. |
(c) | Periods less than one year are not annualized. |
(d) | The investment adviser agreed to waive its fees and/or reimburse a portion of the Fund’s expenses during the period. Without this waiver/reimbursement, expenses would have been higher. |
(e) | Computed on an annualized basis for periods less than one year. |
(f) | Includes interest expense. Without this expense the ratio of net expenses would have been 0.60% and the ratio of gross expenses would have been 1.06%. |
(g) | Includes interest expense. Without this expense the ratio of net expenses would have been 0.60% and the ratio of gross expenses would have been 0.98%. |
(h) | Effective July 1, 2021, the expense limit decreased from 0.65% to 0.60%. |
(i) | Includes interest expense. Without this expense the ratio of net expenses would have been 0.63% and the ratio of gross expenses would have been 1.02%. |
(j) | Includes interest expense. Without this expense the ratio of net expenses would have been 0.65% and the ratio of gross expenses would have been 1.05%. |
(k) | Includes interest expense. Without this expense the ratio of net expenses would have been 0.65% and the ratio of gross expenses would have been 1.07%. |
Mirova Global Green Bond Fund—Class Y | ||||||
Six Months Ended June 30, 2024 (Unaudited) | Year Ended December 31, 2023 | Year Ended December 31, 2022 | Year Ended December 31, 2021 | Year Ended December 31, 2020 | Year Ended December 31, 2019 | |
Net asset value, beginning of the period | $8.54 | $8.03 | $10.16 | $10.79 | $10.37 | $9.72 |
INCOME (LOSS) FROM INVESTMENT OPERATIONS: | ||||||
Net investment income(a) | 0.08 | 0.15 | 0.10 | 0.07 | 0.10 | 0.11 |
Net realized and unrealized gain (loss) | (0.15 ) | 0.55 | (1.76 ) | (0.37 ) | 0.72 | 0.80 |
Total from Investment Operations | (0.07 ) | 0.70 | (1.66 ) | (0.30 ) | 0.82 | 0.91 |
LESS DISTRIBUTIONS FROM: | ||||||
Net investment income | — | (0.19 ) | (0.01 ) | (0.17 ) | (0.21 ) | (0.12 ) |
Net realized capital gains | — | — | (0.46 ) | (0.16 ) | (0.19 ) | (0.14 ) |
Total Distributions | — | (0.19 ) | (0.47 ) | (0.33 ) | (0.40 ) | (0.26 ) |
Net asset value, end of the period | $8.47 | $8.54 | $8.03 | $10.16 | $10.79 | $10.37 |
Total return(b) | (0.82 )%(c) | 8.69 % | (16.45 )% | (2.69 )% | 7.85 % | 9.38 % |
RATIOS TO AVERAGE NET ASSETS: | ||||||
Net assets, end of the period (000's) | $25,776 | $26,989 | $25,113 | $32,217 | $22,081 | $7,060 |
Net expenses(d) | 0.65 %(e) | 0.68 %(f) | 0.66 %(g) | 0.71 %(h)(i) | 0.72 %(j) | 0.71 %(k) |
Gross expenses | 1.12 %(e) | 1.16 %(f) | 1.09 %(g) | 1.16 %(i) | 1.18 %(j) | 1.28 %(k) |
Net investment income | 1.96 %(e) | 1.80 % | 1.09 % | 0.63 % | 0.94 % | 1.10 % |
Portfolio turnover rate | 7 % | 18 % | 60 % | 37 % | 53 % | 25 % |
(a) | Per share net investment income has been calculated using the average shares outstanding during the period. |
(b) | Had certain expenses not been waived/reimbursed during the period, total returns would have been lower. |
(c) | Periods less than one year are not annualized. |
(d) | The investment adviser agreed to waive its fees and/or reimburse a portion of the Fund’s expenses during the period. Without this waiver/reimbursement, expenses would have been higher. |
(e) | Computed on an annualized basis for periods less than one year. |
(f) | Includes interest expense. Without this expense the ratio of net expenses would have been 0.65% and the ratio of gross expenses would have been 1.13%. |
(g) | Includes interest expense. Without this expense the ratio of net expenses would have been 0.65% and the ratio of gross expenses would have been 1.08%. |
(h) | Effective July 1, 2021, the expense limit decreased from 0.70% to 0.65%. |
(i) | Includes interest expense. Without this expense the ratio of net expenses would have been 0.67% and the ratio of gross expenses would have been 1.13%. |
(j) | Includes interest expense. Without this expense the ratio of net expenses would have been 0.70% and the ratio of gross expenses would have been 1.16%. |
(k) | Includes interest expense. Without this expense the ratio of net expenses would have been 0.70% and the ratio of gross expenses would have been 1.27%. |
Mirova Global Sustainable Equity Fund—Class A | ||||||
Six Months Ended June 30, 2024 (Unaudited) | Year Ended December 31, 2023 | Year Ended December 31, 2022 | Year Ended December 31, 2021 | Year Ended December 31, 2020 | Year Ended December 31, 2019 | |
Net asset value, beginning of the period | $17.94 | $15.22 | $20.53 | $19.57 | $14.92 | $11.45 |
INCOME (LOSS) FROM INVESTMENT OPERATIONS: | ||||||
Net investment income (loss)(a) | 0.03 | 0.06 | 0.08 | (0.01 ) | (0.02 ) | 0.03 |
Net realized and unrealized gain (loss) | 2.43 | 2.73 | (4.62 ) | 3.45 | 4.77 | 3.69 |
Total from Investment Operations | 2.46 | 2.79 | (4.54 ) | 3.44 | 4.75 | 3.72 |
LESS DISTRIBUTIONS FROM: | ||||||
Net investment income | (0.01 ) | (0.07 ) | (0.07 ) | (0.00 )(b) | (0.00 )(b) | (0.03 ) |
Net realized capital gains | — | — | (0.70 ) | (2.48 ) | (0.10 ) | (0.22 ) |
Total Distributions | (0.01 ) | (0.07 ) | (0.77 ) | (2.48 ) | (0.10 ) | (0.25 ) |
Net asset value, end of the period | $20.39 | $17.94 | $15.22 | $20.53 | $19.57 | $14.92 |
Total return(c)(d) | 13.69 %(e) | 18.32 % | (22.56 )% | 17.82 % | 32.07 % | 32.63 % |
RATIOS TO AVERAGE NET ASSETS: | ||||||
Net assets, end of the period (000's) | $33,979 | $30,525 | $29,013 | $43,117 | $33,625 | $12,884 |
Net expenses(f) | 1.20 %(g) | 1.20 % | 1.20 %(h) | 1.21 %(i) | 1.20 % | 1.21 %(j) |
Gross expenses | 1.25 %(g) | 1.24 % | 1.26 %(h) | 1.24 %(i) | 1.24 % | 1.39 %(j) |
Net investment income (loss) | 0.36 %(g) | 0.37 % | 0.51 % | (0.03 )% | (0.14 )% | 0.21 % |
Portfolio turnover rate | 9 % | 23 % | 23 % | 40 %(k) | 11 % | 23 % |
(a) | Per share net investment income (loss) has been calculated using the average shares outstanding during the period. |
(b) | Amount rounds to less than $0.01 per share. |
(c) | A sales charge for Class A shares is not reflected in total return calculations. |
(d) | Had certain expenses not been waived/reimbursed during the period, total returns would have been lower. |
(e) | Periods less than one year are not annualized. |
(f) | The investment adviser agreed to waive its fees and/or reimburse a portion of the Fund’s expenses during the period. Without this waiver/reimbursement, expenses would have been higher. |
(g) | Computed on an annualized basis for periods less than one year. |
(h) | Includes interest expense. Without this expense the ratio of net expenses would have been 1.20% and the ratio of gross expenses would have been 1.25%. |
(i) | Includes interest expense. Without this expense the ratio of net expenses would have been 1.20% and the ratio of gross expenses would have been 1.24%. |
(j) | Includes interest expense. Without this expense the ratio of net expenses would have been 1.20% and the ratio of gross expenses would have been 1.38%. |
(k) | The variation in the Fund’s turnover rate from 2020 to 2021 was primarily due to an increase in shareholder activity. |
Mirova Global Sustainable Equity Fund—Class C | ||||||
Six Months Ended June 30, 2024 (Unaudited) | Year Ended December 31, 2023 | Year Ended December 31, 2022 | Year Ended December 31, 2021 | Year Ended December 31, 2020 | Year Ended December 31, 2019 | |
Net asset value, beginning of the period | $16.99 | $14.48 | $19.62 | $18.95 | $14.56 | $11.24 |
INCOME (LOSS) FROM INVESTMENT OPERATIONS: | ||||||
Net investment loss(a) | (0.04 ) | (0.06 ) | (0.04 ) | (0.16 ) | (0.13 ) | (0.07 ) |
Net realized and unrealized gain (loss) | 2.30 | 2.58 | (4.40 ) | 3.31 | 4.62 | 3.61 |
Total from Investment Operations | 2.26 | 2.52 | (4.44 ) | 3.15 | 4.49 | 3.54 |
LESS DISTRIBUTIONS FROM: | ||||||
Net investment income | (0.01 ) | (0.01 ) | — | (0.00 )(b) | (0.00 )(b) | — |
Net realized capital gains | — | — | (0.70 ) | (2.48 ) | (0.10 ) | (0.22 ) |
Total Distributions | (0.01 ) | (0.01 ) | (0.70 ) | (2.48 ) | (0.10 ) | (0.22 ) |
Net asset value, end of the period | $19.24 | $16.99 | $14.48 | $19.62 | $18.95 | $14.56 |
Total return(c)(d) | 13.28 %(e) | 17.41 % | (23.11 )% | 16.85 % | 31.07 % | 31.66 % |
RATIOS TO AVERAGE NET ASSETS: | ||||||
Net assets, end of the period (000's) | $11,117 | $10,786 | $11,441 | $17,248 | $11,196 | $5,406 |
Net expenses(f) | 1.95 %(g) | 1.95 % | 1.95 %(h) | 1.96 %(i) | 1.95 % | 1.96 %(j) |
Gross expenses | 1.99 %(g) | 1.99 % | 2.01 %(h) | 1.99 %(i) | 1.99 % | 2.14 %(j) |
Net investment loss | (0.40 )%(g) | (0.38 )% | (0.23 )% | (0.79 )% | (0.84 )% | (0.52 )% |
Portfolio turnover rate | 9 % | 23 % | 23 % | 40 %(k) | 11 % | 23 % |
(a) | Per share net investment loss has been calculated using the average shares outstanding during the period. |
(b) | Amount rounds to less than $0.01 per share. |
(c) | A contingent deferred sales charge for Class C shares is not reflected in total return calculations. |
(d) | Had certain expenses not been waived/reimbursed during the period, total returns would have been lower. |
(e) | Periods less than one year are not annualized. |
(f) | The investment adviser agreed to waive its fees and/or reimburse a portion of the Fund’s expenses during the period. Without this waiver/reimbursement, expenses would have been higher. |
(g) | Computed on an annualized basis for periods less than one year. |
(h) | Includes interest expense. Without this expense the ratio of net expenses would have been 1.95% and the ratio of gross expenses would have been 2.00%. |
(i) | Includes interest expense. Without this expense the ratio of net expenses would have been 1.95% and the ratio of gross expenses would have been 1.99%. |
(j) | Includes interest expense. Without this expense the ratio of net expenses would have been 1.95% and the ratio of gross expenses would have been 2.13%. |
(k) | The variation in the Fund’s turnover rate from 2020 to 2021 was primarily due to an increase in shareholder activity. |
Mirova Global Sustainable Equity Fund—Class N | ||||||
Six Months Ended June 30, 2024 (Unaudited) | Year Ended December 31, 2023 | Year Ended December 31, 2022 | Year Ended December 31, 2021 | Year Ended December 31, 2020 | Year Ended December 31, 2019 | |
Net asset value, beginning of the period | $18.11 | $15.36 | $20.72 | $19.71 | $14.99 | $11.49 |
INCOME (LOSS) FROM INVESTMENT OPERATIONS: | ||||||
Net investment income(a) | 0.06 | 0.11 | 0.13 | 0.05 | 0.01 | 0.06 |
Net realized and unrealized gain (loss) | 2.45 | 2.76 | (4.67 ) | 3.49 | 4.82 | 3.72 |
Total from Investment Operations | 2.51 | 2.87 | (4.54 ) | 3.54 | 4.83 | 3.78 |
LESS DISTRIBUTIONS FROM: | ||||||
Net investment income | (0.01 ) | (0.12 ) | (0.12 ) | (0.05 ) | (0.01 ) | (0.06 ) |
Net realized capital gains | — | — | (0.70 ) | (2.48 ) | (0.10 ) | (0.22 ) |
Total Distributions | (0.01 ) | (0.12 ) | (0.82 ) | (2.53 ) | (0.11 ) | (0.28 ) |
Net asset value, end of the period | $20.61 | $18.11 | $15.36 | $20.72 | $19.71 | $14.99 |
Total return | 13.84 %(b)(c) | 18.70 % | (22.32 )% | 18.17 % | 32.44 %(b) | 33.05 %(b) |
RATIOS TO AVERAGE NET ASSETS: | ||||||
Net assets, end of the period (000's) | $281,120 | $239,009 | $189,957 | $219,679 | $72,768 | $11,000 |
Net expenses | 0.89 %(d)(e) | 0.89 % | 0.90 %(f) | 0.91 %(g)(h) | 0.90 %(d) | 0.90 %(d)(i) |
Gross expenses | 0.90 %(e) | 0.89 % | 0.90 %(f) | 0.91 %(g)(h) | 0.93 % | 1.08 %(i) |
Net investment income | 0.67 %(e) | 0.64 % | 0.81 % | 0.24 % | 0.08 % | 0.46 % |
Portfolio turnover rate | 9 % | 23 % | 23 % | 40 %(j) | 11 % | 23 % |
(a) | Per share net investment income has been calculated using the average shares outstanding during the period. |
(b) | Had certain expenses not been waived/reimbursed during the period, total returns would have been lower. |
(c) | Periods less than one year are not annualized. |
(d) | The investment adviser agreed to waive its fees and/or reimburse a portion of the Fund’s expenses during the period. Without this waiver/reimbursement, expenses would have been higher. |
(e) | Computed on an annualized basis for periods less than one year. |
(f) | Includes interest expense. Without this expense the ratio of net expenses would have been 0.89% and the ratio of gross expenses would have been 0.89%. |
(g) | Includes interest expense. Without this expense the ratio of net expenses would have been 0.90% and the ratio of gross expenses would have been 0.90%. |
(h) | Includes fee/expense recovery of 0.01%. |
(i) | Includes interest expense of less than 0.01%. |
(j) | The variation in the Fund’s turnover rate from 2020 to 2021 was primarily due to an increase in shareholder activity. |
Mirova Global Sustainable Equity Fund—Class Y | ||||||
Six Months Ended June 30, 2024 (Unaudited) | Year Ended December 31, 2023 | Year Ended December 31, 2022 | Year Ended December 31, 2021 | Year Ended December 31, 2020 | Year Ended December 31, 2019 | |
Net asset value, beginning of the period | $18.11 | $15.36 | $20.71 | $19.71 | $14.99 | $11.49 |
INCOME (LOSS) FROM INVESTMENT OPERATIONS: | ||||||
Net investment income(a) | 0.06 | 0.11 | 0.12 | 0.05 | 0.01 | 0.07 |
Net realized and unrealized gain (loss) | 2.44 | 2.75 | (4.66 ) | 3.46 | 4.81 | 3.70 |
Total from Investment Operations | 2.50 | 2.86 | (4.54 ) | 3.51 | 4.82 | 3.77 |
LESS DISTRIBUTIONS FROM: | ||||||
Net investment income | (0.01 ) | (0.11 ) | (0.11 ) | (0.03 ) | (0.00 )(b) | (0.05 ) |
Net realized capital gains | — | — | (0.70 ) | (2.48 ) | (0.10 ) | (0.22 ) |
Total Distributions | (0.01 ) | (0.11 ) | (0.81 ) | (2.51 ) | (0.10 ) | (0.27 ) |
Net asset value, end of the period | $20.60 | $18.11 | $15.36 | $20.71 | $19.71 | $14.99 |
Total return(c) | 13.78 %(d) | 18.63 % | (22.33 )% | 18.06 % | 32.42 % | 32.99 % |
RATIOS TO AVERAGE NET ASSETS: | ||||||
Net assets, end of the period (000's) | $732,017 | $753,396 | $637,021 | $840,638 | $760,181 | $118,032 |
Net expenses(e) | 0.95 %(f) | 0.95 % | 0.95 %(g) | 0.96 %(h) | 0.95 % | 0.96 %(i) |
Gross expenses | 0.99 %(f) | 0.99 % | 1.01 %(g) | 0.99 %(h) | 0.99 % | 1.14 %(i) |
Net investment income | 0.61 %(f) | 0.63 % | 0.76 % | 0.22 % | 0.06 % | 0.50 % |
Portfolio turnover rate | 9 % | 23 % | 23 % | 40 %(j) | 11 % | 23 % |
(a) | Per share net investment income has been calculated using the average shares outstanding during the period. |
(b) | Amount rounds to less than $0.01 per share. |
(c) | Had certain expenses not been waived/reimbursed during the period, total returns would have been lower. |
(d) | Periods less than one year are not annualized. |
(e) | The investment adviser agreed to waive its fees and/or reimburse a portion of the Fund’s expenses during the period. Without this waiver/reimbursement, expenses would have been higher. |
(f) | Computed on an annualized basis for periods less than one year. |
(g) | Includes interest expense. Without this expense the ratio of net expenses would have been 0.95% and the ratio of gross expenses would have been 1.00%. |
(h) | Includes interest expense. Without this expense the ratio of net expenses would have been 0.95% and the ratio of gross expenses would have been 0.99%. |
(i) | Includes interest expense. Without this expense the ratio of net expenses would have been 0.95% and the ratio of gross expenses would have been 1.13%. |
(j) | The variation in the Fund’s turnover rate from 2020 to 2021 was primarily due to an increase in shareholder activity. |
Mirova International Sustainable Equity Fund—Class A | ||||||
Six Months Ended June 30, 2024 (Unaudited) | Year Ended December 31, 2023 | Year Ended December 31, 2022 | Year Ended December 31, 2021 | Year Ended December 31, 2020 | Year Ended December 31, 2019 | |
Net asset value, beginning of the period | $11.85 | $10.47 | $14.35 | $13.95 | $12.51 | $10.03 |
INCOME (LOSS) FROM INVESTMENT OPERATIONS: | ||||||
Net investment income (loss)(a) | 0.13 | 0.17 | 0.11 | 0.08 | (0.01 ) | 0.12 |
Net realized and unrealized gain (loss) | 0.43 | 1.33 | (3.62 ) | 0.78 | 2.87 | 2.48 |
Total from Investment Operations | 0.56 | 1.50 | (3.51 ) | 0.86 | 2.86 | 2.60 |
LESS DISTRIBUTIONS FROM: | ||||||
Net investment income | (0.00 )(b) | (0.12 ) | (0.37 ) | (0.09 ) | (0.12 ) | (0.12 ) |
Net realized capital gains | — | — | — | (0.37 ) | (1.30 ) | — |
Total Distributions | (0.00 ) | (0.12 ) | (0.37 ) | (0.46 ) | (1.42 ) | (0.12 ) |
Net asset value, end of the period | $12.41 | $11.85 | $10.47 | $14.35 | $13.95 | $12.51 |
Total return(c)(d) | 4.76 %(e) | 14.37 % | (24.42 )% | 6.22 % | 23.18 % | 25.97 % |
RATIOS TO AVERAGE NET ASSETS: | ||||||
Net assets, end of the period (000's) | $629 | $601 | $717 | $380 | $76 | $4 |
Net expenses(f) | 1.21 %(g)(h) | 1.20 % | 1.21 %(i) | 1.21 %(j) | 1.26 %(k) | 1.21 %(l) |
Gross expenses | 2.33 %(g)(h) | 2.64 % | 2.30 %(i) | 2.08 %(j) | 5.69 %(k) | 107.91 %(l) |
Net investment income (loss) | 2.08 %(g) | 1.51 % | 0.99 % | 0.57 % | (0.04 )% | 1.09 % |
Portfolio turnover rate | 23 % | 14 % | 8 % | 8 % | 11 % | 8 % |
(a) | Per share net investment income (loss) has been calculated using the average shares outstanding during the period. |
(b) | Amount rounds to less than $0.01 per share. |
(c) | A sales charge for Class A shares is not reflected in total return calculations. |
(d) | Had certain expenses not been waived/reimbursed during the period, total returns would have been lower. |
(e) | Periods less than one year are not annualized. |
(f) | The investment adviser agreed to waive its fees and/or reimburse a portion of the Fund’s expenses during the period. Without this waiver/reimbursement, expenses would have been higher. |
(g) | Computed on an annualized basis for periods less than one year. |
(h) | Includes transfer agent fees and expenses before expense offset and interest expense. Without these expenses the ratio of net expenses would have been 1.20% and the ratio of gross expenses would have been 2.31%. See Note 8 of Notes to Financial Statements. |
(i) | Includes interest expense. Without this expense the ratio of net expenses would have been 1.20% and the ratio of gross expenses would have been 2.29%. |
(j) | Includes interest expense. Without this expense the ratio of net expenses would have been 1.20% and the ratio of gross expenses would have been 2.07%. |
(k) | Includes interest expense. Without this expense the ratio of net expenses would have been 1.20% and the ratio of gross expenses would have been 5.64%. |
(l) | Includes interest expense. Without this expense the ratio of net expenses would have been 1.20% and the ratio of gross expenses would have been 107.90%. |
Mirova International Sustainable Equity Fund—Class N | ||||||
Six Months Ended June 30, 2024 (Unaudited) | Year Ended December 31, 2023 | Year Ended December 31, 2022 | Year Ended December 31, 2021 | Year Ended December 31, 2020 | Year Ended December 31, 2019 | |
Net asset value, beginning of the period | $11.90 | $10.52 | $14.40 | $13.99 | $12.51 | $10.03 |
INCOME (LOSS) FROM INVESTMENT OPERATIONS: | ||||||
Net investment income(a) | 0.15 | 0.19 | 0.23 | 0.14 | 0.07 | 0.15 |
Net realized and unrealized gain (loss) | 0.44 | 1.35 | (3.71 ) | 0.76 | 2.84 | 2.49 |
Total from Investment Operations | 0.59 | 1.54 | (3.48 ) | 0.90 | 2.91 | 2.64 |
LESS DISTRIBUTIONS FROM: | ||||||
Net investment income | (0.00 )(b) | (0.16 ) | (0.40 ) | (0.12 ) | (0.13 ) | (0.16 ) |
Net realized capital gains | — | — | — | (0.37 ) | (1.30 ) | — |
Total Distributions | (0.00 ) | (0.16 ) | (0.40 ) | (0.49 ) | (1.43 ) | (0.16 ) |
Net asset value, end of the period | $12.49 | $11.90 | $10.52 | $14.40 | $13.99 | $12.51 |
Total return(c) | 4.99 %(d) | 14.66 % | (24.17 )% | 6.47 % | 23.60 % | 26.31 % |
RATIOS TO AVERAGE NET ASSETS: | ||||||
Net assets, end of the period (000's) | $12,286 | $10,540 | $7,433 | $27,569 | $16,478 | $17,193 |
Net expenses(e) | 0.91 %(f)(g) | 0.90 % | 0.91 %(h) | 0.91 %(i) | 0.93 %(j) | 0.92 %(k) |
Gross expenses | 1.94 %(f)(g) | 2.28 % | 1.80 %(h) | 1.44 %(i) | 1.83 %(j) | 1.99 %(k) |
Net investment income | 2.43 %(f) | 1.68 % | 2.01 % | 0.94 % | 0.58 % | 1.36 % |
Portfolio turnover rate | 23 % | 14 % | 8 % | 8 % | 11 % | 8 % |
(a) | Per share investment income has been calculated using the average shares outstanding during the period. |
(b) | Amount rounds to less than $0.01 per share. |
(c) | Had certain expenses not been waived/reimbursed during the period, total returns would have been lower. |
(d) | Periods less than one year are not annualized. |
(e) | The investment adviser agreed to waive its fees and/or reimburse a portion of the Fund’s expenses during the period. Without this waiver/reimbursement, expenses would have been higher. |
(f) | Computed on an annualized basis for periods less than one year. |
(g) | Includes interest expense. Without this expense the ratio of net expenses would have been 0.90% and the ratio of gross expenses would have been 1.94%. |
(h) | Includes interest expense. Without this expense the ratio of net expenses would have been 0.90% and the ratio of gross expenses would have been 1.79%. |
(i) | Includes interest expense. Without this expense the ratio of net expenses would have been 0.90% and the ratio of gross expenses would have been 1.43%. |
(j) | Includes interest expense. Without this expense the ratio of net expenses would have been 0.90% and the ratio of gross expenses would have been 1.80%. |
(k) | Includes interest expense. Without this expense the ratio of net expenses would have been 0.75% and the ratio of gross expenses would have been 1.22%. |
Mirova International Sustainable Equity Fund—Class Y | ||||||
Six Months Ended June 30, 2024 (Unaudited) | Year Ended December 31, 2023 | Year Ended December 31, 2022 | Year Ended December 31, 2021 | Year Ended December 31, 2020 | Year Ended December 31, 2019 | |
Net asset value, beginning of the period | $11.89 | $10.51 | $14.38 | $13.98 | $12.50 | $10.03 |
INCOME (LOSS) FROM INVESTMENT OPERATIONS: | ||||||
Net investment income(a) | 0.14 | 0.13 | 0.24 | 0.08 | 0.03 | 0.15 |
Net realized and unrealized gain (loss) | 0.44 | 1.41 | (3.72 ) | 0.80 | 2.88 | 2.48 |
Total from Investment Operations | 0.58 | 1.54 | (3.48 ) | 0.88 | 2.91 | 2.63 |
LESS DISTRIBUTIONS FROM: | ||||||
Net investment income | (0.00 )(b) | (0.16 ) | (0.39 ) | (0.11 ) | (0.13 ) | (0.16 ) |
Net realized capital gains | — | — | — | (0.37 ) | (1.30 ) | — |
Total Distributions | (0.00 ) | (0.16 ) | (0.39 ) | (0.48 ) | (1.43 ) | (0.16 ) |
Net asset value, end of the period | $12.47 | $11.89 | $10.51 | $14.38 | $13.98 | $12.50 |
Total return(c) | 4.91 %(d) | 14.64 % | (24.18 )% | 6.39 % | 23.60 % | 26.21 % |
RATIOS TO AVERAGE NET ASSETS: | ||||||
Net assets, end of the period (000's) | $4,085 | $5,067 | $808 | $1,783 | $75 | $9 |
Net expenses(e) | 0.96 %(f)(g) | 0.95 % | 0.96 %(h) | 0.96 %(i) | 1.00 %(j) | 0.96 %(k) |
Gross expenses | 2.07 %(f)(g) | 2.39 % | 2.05 %(h) | 1.83 %(i) | 6.51 %(j) | 94.13 %(k) |
Net investment income | 2.36 %(f) | 1.14 % | 2.09 % | 0.52 % | 0.21 % | 1.36 % |
Portfolio turnover rate | 23 % | 14 % | 8 % | 8 % | 11 % | 8 % |
(a) | Per share investment income has been calculated using the average shares outstanding during the period. |
(b) | Amount rounds to less than $0.01 per share. |
(c) | Had certain expenses not been waived/reimbursed during the period, total returns would have been lower. |
(d) | Periods less than one year are not annualized. |
(e) | The investment adviser agreed to waive its fees and/or reimburse a portion of the Fund’s expenses during the period. Without this waiver/reimbursement, expenses would have been higher. |
(f) | Computed on an annualized basis for periods less than one year. |
(g) | Includes interest expense. Without this expense the ratio of net expenses would have been 0.95% and the ratio of gross expenses would have been 2.06%. |
(h) | Includes interest expense. Without this expense the ratio of net expenses would have been 0.95% and the ratio of gross expenses would have been 2.04%. |
(i) | Includes interest expense. Without this expense the ratio of net expenses would have been 0.95% and the ratio of gross expenses would have been 1.82%. |
(j) | Includes interest expense. Without this expense the ratio of net expenses would have been 0.95% and the ratio of gross expenses would have been 6.46%. |
(k) | Includes interest expense. Without this expense the ratio of net expenses would have been 0.95% and the ratio of gross expenses would have been 94.12%. |
Gateway Equity Call Premium Fund
Mirova Global Sustainable Equity Fund (“Global Sustainable Equity Fund”)
Mirova International Sustainable Equity Fund (“International Sustainable Equity Fund”)
2023 Distributions | |||
Fund | Ordinary Income | Long-Term Capital Gains | Total |
Gateway Fund | $56,998,901 | $ — | $56,998,901 |
Gateway Equity Call Premium Fund | 2,335,902 | — | 2,335,902 |
Global Green Bond Fund | 851,455 | — | 851,455 |
Global Sustainable Equity Fund | 6,294,056 | — | 6,294,056 |
International Sustainable Equity Fund | 206,456 | — | 206,456 |
Gateway Fund | Gateway Equity Call Premium Fund | Global Green Bond Fund | Global Sustainable Equity Fund | International Sustainable Equity Fund | |
Capital loss carryforward: | |||||
Short-term: | |||||
No expiration date | $(1,117,008,869 ) | $(12,700,501 ) | $(1,113,901 ) | $(28,441,103 ) | $(329,605 ) |
Long-term: | |||||
No expiration date | — | (10,316,947 ) | (2,929,351 ) | (5,545,087 ) | (790,716 ) |
Total capital loss carryforward* | $(1,117,008,869 ) | $(23,017,448 ) | $(4,043,252 ) | $(33,986,190 ) | $(1,120,321 ) |
Late-year ordinary and post-October capital loss deferrals** | $ — | $ — | $(4,345 ) | $ — | $ — |
* | Under Section 382 of the Internal Revenue Service Code, a portion of the capital loss carryforward for the International Sustainable Equity Fund is subject to certain limitations upon availability, to offset future capital gains, if any. |
** | Under current tax law, capital losses, foreign currency losses, and losses on passive foreign investment companies and contingent payment debt instruments after October 31 or December 31, as applicable, may be deferred and treated as occurring on the first day of the following taxable year. Global Green Bond Fund is deferring foreign currency losses. |
Gateway Fund | Gateway Equity Call Premium Fund | Global Green Bond Fund | Global Sustainable Equity Fund | International Sustainable Equity Fund | |
Federal tax cost | $1,798,012,375 | $214,612,697 | $40,055,958 | $856,485,064 | $15,973,810 |
Gross tax appreciation | $4,859,707,535 | $118,088,725 | $752,114 | $252,339,367 | $1,970,331 |
Gross tax depreciation | (90,507,754 ) | (5,004,437 ) | (4,376,189 ) | (58,425,665 ) | (1,403,306 ) |
Net tax appreciation (depreciation) | $4,769,199,781 | $113,084,288 | $(3,624,075 ) | $193,913,702 | $567,025 |
Gateway Fund | ||||
Asset Valuation Inputs | ||||
Description | Level 1 | Level 2 | Level 3 | Total |
Common Stocks(a) | $6,496,128,868 | $ — | $ — | $6,496,128,868 |
Purchased Options(a) | 27,200,905 | — | — | 27,200,905 |
Short-Term Investments | — | 85,842,729 | — | 85,842,729 |
Total | $6,523,329,773 | $85,842,729 | $ — | $6,609,172,502 |
Liability Valuation Inputs | ||||
Description | Level 1 | Level 2 | Level 3 | Total |
Written Options(a) | $(109,066,045 ) | $ — | $ — | $(109,066,045 ) |
(a) | Details of the major categories of the Fund’s investments are reflected within the Portfolio of Investments. |
Gateway Equity Call Premium Fund | ||||
Asset Valuation Inputs | ||||
Description | Level 1 | Level 2 | Level 3 | Total |
Common Stocks(a) | $324,119,871 | $ — | $ — | $324,119,871 |
Short-Term Investments | — | 5,322,066 | — | 5,322,066 |
Total Investments | $324,119,871 | $5,322,066 | $— | $329,441,937 |
Liability Valuation Inputs | ||||
Description | Level 1 | Level 2 | Level 3 | Total |
Written Options(a) | $(6,246,865 ) | $ — | $ — | $(6,246,865 ) |
(a) | Details of the major categories of the Fund’s investments are reflected within the Portfolio of Investments. |
Global Green Bond Fund | ||||
Asset Valuation Inputs | ||||
Description | Level 1 | Level 2 | Level 3 | Total |
Bonds and Notes(a) | $ — | $35,539,462 | $ — | $35,539,462 |
Short-Term Investments | — | 487,329 | — | 487,329 |
Total Investments | — | 36,026,791 | — | 36,026,791 |
Futures Contracts (unrealized appreciation) | 408,412 | — | — | 408,412 |
Total | $408,412 | $36,026,791 | $ — | $36,435,203 |
Liability Valuation Inputs | ||||
Description | Level 1 | Level 2 | Level 3 | Total |
Futures Contracts (unrealized depreciation) | $(3,320 ) | $ — | $ — | $(3,320 ) |
(a) | Details of the major categories of the Fund’s investments are reflected within the Portfolio of Investments. |
Global Sustainable Equity Fund | ||||
Asset Valuation Inputs | ||||
Description | Level 1 | Level 2 | Level 3 | Total |
Common Stocks | ||||
Belgium | $ — | $9,618,413 | $ — | $9,618,413 |
Denmark | — | 73,623,125 | — | 73,623,125 |
France | — | 38,621,287 | — | 38,621,287 |
Germany | — | 42,362,160 | — | 42,362,160 |
Hong Kong | — | 9,865,887 | — | 9,865,887 |
Japan | — | 30,160,622 | — | 30,160,622 |
Netherlands | — | 43,275,769 | — | 43,275,769 |
Spain | — | 29,678,033 | — | 29,678,033 |
United Kingdom | — | 42,301,329 | — | 42,301,329 |
All Other Common Stocks(a) | 720,037,326 | — | — | 720,037,326 |
Total Common Stocks | 720,037,326 | 319,506,625 | — | 1,039,543,951 |
Short-Term Investments | — | 10,854,815 | — | 10,854,815 |
Total Investments | $720,037,326 | $330,361,440 | $— | $1,050,398,766 |
(a) | Details of the major categories of the Fund’s investments are reflected within the Portfolio of Investments. |
International Sustainable Equity Fund | ||||
Asset Valuation Inputs | ||||
Description | Level 1 | Level 2 | Level 3 | Total |
Common Stocks | ||||
Australia | $ — | $174,736 | $ — | $174,736 |
Belgium | — | 724,777 | — | 724,777 |
Denmark | — | 1,411,745 | — | 1,411,745 |
France | — | 1,978,957 | — | 1,978,957 |
Germany | — | 1,788,575 | — | 1,788,575 |
Hong Kong | — | 320,128 | — | 320,128 |
Ireland | — | 860,828 | — | 860,828 |
Japan | — | 1,664,852 | — | 1,664,852 |
Netherlands | — | 1,284,570 | — | 1,284,570 |
Spain | — | 648,668 | — | 648,668 |
Switzerland | — | 451,214 | — | 451,214 |
United Kingdom | — | 2,761,723 | — | 2,761,723 |
United States | — | 205,038 | — | 205,038 |
All Other Common Stocks(a) | 1,641,490 | — | — | 1,641,490 |
Total Common Stocks | 1,641,490 | 14,275,811 | — | 15,917,301 |
Short-Term Investments | — | 623,534 | — | 623,534 |
Total Investments | $1,641,490 | $14,899,345 | $— | $16,540,835 |
(a) | Details of the major categories of the Fund’s investments are reflected within the Portfolio of Investments. |
Assets | Investments at value1 |
Exchange-traded asset derivatives | |
Equity contracts | $27,200,905 |
Liabilities | Options written at value |
Exchange-traded liability derivatives | |
Equity contracts | $(109,066,045 ) |
1 | Represents purchased options, at value. |
Net Realized Gain (Loss) on: | Investments1 | Options written |
Equity contracts | $(114,920,743 ) | $(254,441,089 ) |
Net Change in Unrealized Appreciation (Depreciation) on: | Investments1 | Options written |
Equity contracts | $(14,779,368 ) | $9,814,512 |
1 | Represents realized loss and change in unrealized appreciation (depreciation), respectively, for purchased options during the period. |
Liabilities | Options written at value |
Exchange-traded liability derivatives | |
Equity contracts | $(6,246,865 ) |
Net Realized Gain (Loss) on: | Options written |
Equity contracts | $(13,794,907 ) |
Net Change in Unrealized Appreciation (Depreciation) on: | Options written |
Equity contracts | $428,497 |
Assets | Unrealized appreciation on futures contracts |
Exchange-traded asset derivatives | |
Foreign exchange contracts | $376,834 |
Interest rate contracts | 31,578 |
Total exchange-traded asset derivatives | $408,412 |
Liabilities | Unrealized depreciation on futures contracts |
Exchange-traded liability derivatives | |
Interest rate contracts | $(3,320 ) |
Net Realized Gain (Loss) on: | Futures contracts |
Interest rate contracts | $(94,709 ) |
Foreign exchange contracts | 377,151 |
Total | $282,442 |
Net Change in Unrealized Appreciation (Depreciation) on: | Futures contracts |
Interest rate contracts | $(143,936 ) |
Foreign exchange contracts | 632,339 |
Total | $488,403 |
Gateway Fund | Call Options Written* | Put Options Purchased* |
Average Notional Amount Outstanding | 99.04 % | 99.04 % |
Highest Notional Amount Outstanding | 99.17 % | 99.17 % |
Lowest Notional Amount Outstanding | 98.92 % | 98.92 % |
Notional Amount Outstanding as of June 30, 2024 | 98.92 % | 98.92 % |
* | Notional amounts outstanding are determined by multiplying option contracts by the contract multiplier by the price of the option’s underlying index, the S&P 500 ® Index. |
Gateway Equity Call Premium Fund | Call Options Written* |
Average Notional Amount Outstanding | 98.92 % |
Highest Notional Amount Outstanding | 99.08 % |
Lowest Notional Amount Outstanding | 98.79 % |
Notional Amount Outstanding as of June 30, 2024 | 98.89 % |
* | Notional amounts outstanding are determined by multiplying option contracts by the contract multiplier by the price of the option’s underlying index, the S&P 500 ® Index. |
Global Green Bond Fund | Futures |
Average Notional Amount Outstanding | 85.44 % |
Highest Notional Amount Outstanding | 88.78 % |
Lowest Notional Amount Outstanding | 81.00 % |
Notional Amount Outstanding as of June 30, 2024 | 87.70 % |
Fund | Purchases | Sales |
Gateway Fund | $265,392,898 | $1,084,940,994 |
Gateway Equity Call Premium Fund | 33,384,024 | 19,842,189 |
Global Green Bond Fund | 3,415,196 | 2,566,046 |
Global Sustainable Equity Fund | 93,139,938 | 200,104,442 |
International Sustainable Equity Fund | 3,817,782 | 3,551,231 |
Percentage of Average Daily Net Assets | |||
Fund | First $5 Billion | Next $5 Billion | Over $10 Billion |
Gateway Fund | 0.60 % | 0.55 % | 0.53 % |
Gateway Equity Call Premium Fund | 0.58 % | 0.58 % | 0.58 % |
Fund | Percentage of Average Daily Net Assets |
Global Green Bond Fund | 0.50 % |
Global Sustainable Equity Fund | 0.80 % |
International Sustainable Equity Fund | 0.80 % |
Expense Limit as a Percentage of Average Daily Net Assets | ||||
Fund | Class A | Class C | Class N | Class Y |
Gateway Fund | 0.94 % | 1.70 % | 0.65 % | 0.70 % |
Gateway Equity Call Premium Fund | 0.93 % | 1.68 % | 0.63 % | 0.68 % |
Global Green Bond Fund | 0.90 % | — % | 0.60 % | 0.65 % |
Global Sustainable Equity Fund | 1.20 % | 1.95 % | 0.90 % | 0.95 % |
International Sustainable Equity Fund | 1.20 % | — % | 0.90 % | 0.95 % |
Gross Management Fees | Contractual Waivers of Management Fees1 | Net Management Fees | Percentage of Average Daily Net Assets | ||
Fund | Gross | Net | |||
Gateway Fund | $18,933,718 | $844,350 | $18,089,368 | 0.59 % | 0.56 % |
Gateway Equity Call Premium Fund | 875,222 | 189,695 | 685,527 | 0.58 % | 0.45 % |
Global Green Bond Fund | 98,598 | 89,552 | 9,046 | 0.50 % | 0.05 % |
Global Sustainable Equity Fund | 4,341,193 | — | 4,341,193 | 0.80 % | 0.80 % |
International Sustainable Equity Fund | 64,563 | 64,563 | — | 0.80 % | — % |
1 | Management fee waivers are subject to possible recovery until December 31, 2025. |
Reimbursement1 | |||||
Class A | Class C | Class N | Class Y | Total | |
Gateway Fund | $72,807 | $ — | $ — | $ — | $72,807 |
Global Sustainable Equity Fund | 7,117 | 2,378 | — | 169,958 | 179,453 |
1 | Management fee waivers are subject to possible recovery until December 31, 2025. |
Service Fees | Distribution Fees | |||
Fund | Class A | Class C | Class C | |
Gateway Fund | $887,450 | $73,245 | $219,735 | |
Gateway Equity Call Premium Fund | 2,970 | 1,452 | 4,355 | |
Global Green Bond Fund | 6,606 | — | — | |
Global Sustainable Equity Fund | 40,188 | 13,468 | 40,403 | |
International Sustainable Equity Fund | 776 | — | — | |
Fund | Administrative Fees |
Gateway Fund | $1,449,881 |
Gateway Equity Call Premium Fund | 67,983 |
Global Green Bond Fund | 8,891 |
Global Sustainable Equity Fund | 244,568 |
International Sustainable Equity Fund | 3,637 |
Fund | Sub-Transfer Agent Fees |
Gateway Fund | $1,956,921 |
Gateway Equity Call Premium Fund | 114,152 |
Global Green Bond Fund | 12,902 |
Global Sustainable Equity Fund | 396,362 |
International Sustainable Equity Fund | 1,876 |
Fund | Reimbursements of Sub-Transfer Agent Fees |
Gateway Fund | $52,752 |
Gateway Equity Call Premium Fund | 3,116 |
Global Green Bond Fund | 327 |
Global Sustainable Equity Fund | 10,238 |
International Sustainable Equity Fund | 37 |
Fund | Commissions |
Gateway Fund | $4,770 |
Gateway Equity Call Premium Fund | 580 |
Global Sustainable Equity Fund | 787 |
Percentage of Net Assets | |
Global Green Bond Fund | |
Natixis Sustainable Future 2015 Fund | 1.71 % |
Natixis Sustainable Future 2020 Fund | 1.58 % |
Natixis Sustainable Future 2025 Fund | 2.31 % |
Natixis Sustainable Future 2030 Fund | 3.90 % |
Natixis Sustainable Future 2035 Fund | 3.15 % |
Natixis Sustainable Future 2040 Fund | 2.59 % |
Natixis Sustainable Future 2045 Fund | 2.07 % |
Natixis Sustainable Future 2050 Fund | 0.98 % |
Natixis Sustainable Future 2055 Fund | 0.73 % |
Natixis Sustainable Future 2060 Fund | 0.61 % |
Natixis Sustainable Future 2065 Fund | 0.14 % |
19.77 % | |
International Sustainable Equity Fund | |
Natixis Sustainable Future 2015 Fund | 1.17 % |
Natixis Sustainable Future 2020 Fund | 1.47 % |
Natixis Sustainable Future 2025 Fund | 2.75 % |
Natixis Sustainable Future 2030 Fund | 6.17 % |
Natixis Sustainable Future 2035 Fund | 8.19 % |
Natixis Sustainable Future 2040 Fund | 10.04 % |
Natixis Sustainable Future 2045 Fund | 10.60 % |
Natixis Sustainable Future 2050 Fund | 11.60 % |
Natixis Sustainable Future 2055 Fund | 9.98 % |
Natixis Sustainable Future 2060 Fund | 8.28 % |
Natixis Sustainable Future 2065 Fund | 1.90 % |
72.15 % |
Reimbursement of Transfer Agency Expenses | |
Fund | Class N |
Gateway Equity Call Premium Fund | $566 |
Global Green Bond Fund | 637 |
Global Sustainable Equity Fund | 3,882 |
International Sustainable Equity Fund | 667 |
Transfer Agent Fees and Expenses | ||||
Fund | Class A | Class C | Class N | Class Y |
Gateway Fund | $250,457 | $20,277 | $6,783 | $1,794,430 |
Gateway Equity Call Premium Fund | 943 | 461 | 566 | 118,430 |
Global Green Bond Fund | 2,439 | — | 637 | 12,318 |
Global Sustainable Equity Fund | 16,100 | 5,389 | 3,882 | 386,669 |
International Sustainable Equity Fund | 423 | — | 667 | 2,704 |
Fund | Number of 5% Non-Affiliated Account Holders | Percentage of Non-Affiliated Ownership | Percentage of Affiliated Ownership (Note 6g) | Total Percentage of Ownership |
Gateway Equity Call Premium Fund | 2 | 56.74 % | — | 56.74 % |
Global Green Bond Fund | 3 | 42.50 % | 19.77 % | 62.27 % |
Global Sustainable Equity Fund | 1 | 23.99 % | — | 23.99 % |
International Sustainable Equity Fund | 1 | 18.89 % | 72.15 % | 91.04 % |
Six Months Ended June 30, 2024 | Year Ended December 31, 2023 | |||
Gateway Fund | Shares | Amount | Shares | Amount |
Class A | ||||
Issued from the sale of shares | 630,579 | $26,434,522 | 2,250,045 | $86,681,548 |
Issued in connection with the reinvestment of distributions | 37,896 | 1,622,336 | 125,258 | 4,809,810 |
Redeemed | (4,650,108 ) | (194,909,020 ) | (7,534,909 ) | (286,159,321 ) |
Net change | (3,981,633 ) | $(166,852,162 ) | (5,159,606 ) | $(194,667,963 ) |
Class C | ||||
Issued from the sale of shares | 44,448 | $1,847,598 | 114,571 | $4,344,276 |
Issued in connection with the reinvestment of distributions | 256 | 10,729 | 895 | 32,579 |
Redeemed | (264,034 ) | (10,929,377 ) | (766,764 ) | (29,081,970 ) |
Net change | (219,330 ) | $(9,071,050 ) | (651,298 ) | $(24,705,115 ) |
Class N | ||||
Issued from the sale of shares | 1,563,811 | $65,283,690 | 8,389,514 | $319,637,421 |
Issued in connection with the reinvestment of distributions | 19,953 | 856,230 | 60,632 | 2,345,713 |
Redeemed | (5,753,564 ) | (242,721,661 ) | (5,712,741 ) | (218,129,967 ) |
Net change | (4,169,800 ) | $(176,581,741 ) | 2,737,405 | $103,853,167 |
Class Y | ||||
Issued from the sale of shares | 8,998,433 | $377,213,276 | 20,635,979 | $787,928,953 |
Issued in connection with the reinvestment of distributions | 391,308 | 16,781,247 | 990,545 | 38,109,137 |
Redeemed | (11,916,815 ) | (498,778,009 ) | (37,090,574 ) | (1,407,466,641 ) |
Net change | (2,527,074 ) | $(104,783,486 ) | (15,464,050 ) | $(581,428,551 ) |
Decrease from capital share transactions | (10,897,837 ) | $(457,288,439 ) | (18,537,549 ) | $(696,948,462 ) |
Six Months Ended June 30, 2024 | Year Ended December 31, 2023 | |||
Gateway Equity Call Premium Fund | Shares | Amount | Shares | Amount |
Class A | ||||
Issued from the sale of shares | 62,633 | $1,117,113 | 84,354 | $1,368,426 |
Issued in connection with the reinvestment of distributions | 343 | 6,272 | 798 | 12,817 |
Redeemed | (46,152 ) | (827,139 ) | (74,070 ) | (1,204,008 ) |
Net change | 16,824 | $296,246 | 11,082 | $177,235 |
Class C | ||||
Issued from the sale of shares | — | $ — | 4,953 | $78,355 |
Issued in connection with the reinvestment of distributions | 7 | 120 | 26 | 383 |
Redeemed | (2,637 ) | (47,201 ) | (3,155 ) | (49,339 ) |
Net change | (2,630 ) | $(47,081 ) | 1,824 | $29,399 |
Class N | ||||
Issued from the sale of shares | 272 | $4,868 | 935 | $15,187 |
Issued in connection with the reinvestment of distributions | 64 | 1,166 | 152 | 2,435 |
Redeemed | (298 ) | (5,328 ) | (1,073 ) | (17,026 ) |
Net change | 38 | $706 | 14 | $596 |
Class Y | ||||
Issued from the sale of shares | 2,895,870 | $51,291,662 | 8,360,297 | $130,743,512 |
Issued in connection with the reinvestment of distributions | 22,766 | 415,777 | 50,292 | 810,357 |
Redeemed | (1,538,861 ) | (27,540,488 ) | (2,062,972 ) | (32,893,310 ) |
Net change | 1,379,775 | $24,166,951 | 6,347,617 | $98,660,559 |
Increase from capital share transactions | 1,394,007 | $24,416,822 | 6,360,537 | $98,867,789 |
Six Months Ended June 30, 2024 | Year Ended December 31, 2023 | |||
Global Green Bond Fund | Shares | Amount | Shares | Amount |
Class A | ||||
Issued from the sale of shares | 82,926 | $696,734 | 169,471 | $1,388,780 |
Issued in connection with the reinvestment of distributions | — | — | 12,026 | 102,943 |
Redeemed | (56,694 ) | (475,125 ) | (226,585 ) | (1,859,391 ) |
Net change | 26,232 | $221,609 | (45,088 ) | $(367,668 ) |
Class N | ||||
Issued from the sale of shares | 182,363 | $1,539,971 | 284,123 | $2,354,569 |
Issued in connection with the reinvestment of distributions | — | — | 18,082 | 155,506 |
Redeemed | (79,720 ) | (672,625 ) | (128,179 ) | (1,053,990 ) |
Net change | 102,643 | $867,346 | 174,026 | $1,456,085 |
Class Y | ||||
Issued from the sale of shares | 236,024 | $1,991,971 | 887,228 | $7,320,787 |
Issued in connection with the reinvestment of distributions | — | — | 59,917 | 514,685 |
Redeemed | (354,580 ) | (2,997,696 ) | (915,050 ) | (7,572,748 ) |
Net change | (118,556 ) | $(1,005,725 ) | 32,095 | $262,724 |
Increase from capital share transactions | 10,319 | $83,230 | 161,033 | $1,351,141 |
Six Months Ended June 30, 2024 | Year Ended December 31, 2023 | |||
Global Sustainable Equity Fund | Shares | Amount | Shares | Amount |
Class A | ||||
Issued from the sale of shares | 115,391 | $2,234,334 | 319,563 | $5,279,594 |
Issued in connection with the reinvestment of distributions | 258 | 5,020 | 3,686 | 64,954 |
Redeemed | (150,703 ) | (2,882,067 ) | (527,507 ) | (8,697,376 ) |
Net change | (35,054 ) | $(642,713 ) | (204,258 ) | $(3,352,828 ) |
Class C | ||||
Issued from the sale of shares | 26,071 | $495,896 | 47,265 | $745,422 |
Issued in connection with the reinvestment of distributions | 74 | 1,363 | 179 | 2,743 |
Redeemed | (83,126 ) | (1,504,624 ) | (202,619 ) | (3,155,603 ) |
Net change | (56,981 ) | $(1,007,365 ) | (155,175 ) | $(2,407,438 ) |
Class N | ||||
Issued from the sale of shares | 1,643,336 | $31,158,160 | 4,330,117 | $73,586,288 |
Issued in connection with the reinvestment of distributions | 3,752 | 73,695 | 85,975 | 1,543,909 |
Redeemed | (1,207,670 ) | (23,624,891 ) | (3,580,470 ) | (59,873,794 ) |
Net change | 439,418 | $7,606,964 | 835,622 | $15,256,403 |
Class Y | ||||
Issued from the sale of shares | 2,984,221 | $57,964,077 | 13,419,204 | $222,142,090 |
Issued in connection with the reinvestment of distributions | 9,211 | 180,912 | 208,375 | 3,736,457 |
Redeemed | (9,076,901 ) | (181,126,925 ) | (13,483,041 ) | (227,342,858 ) |
Net change | (6,083,469 ) | $(122,981,936 ) | 144,538 | $(1,464,311 ) |
Increase (decrease) from capital share transactions | (5,736,086 ) | $(117,025,050 ) | 620,727 | $8,031,826 |
Six Months Ended June 30, 2024 | Year Ended December 31, 2023 | |||
International Sustainable Equity Fund | Shares | Amount | Shares | Amount |
Class A | ||||
Issued from the sale of shares | 6,667 | $82,764 | 19,700 | $225,337 |
Issued in connection with the reinvestment of distributions | 15 | 190 | 534 | 6,318 |
Redeemed | (6,732 ) | (84,300 ) | (38,003 ) | (432,287 ) |
Net change | (50 ) | $(1,346 ) | (17,769 ) | $(200,632 ) |
Class N | ||||
Issued from the sale of shares | 154,201 | $1,876,543 | 267,242 | $3,026,216 |
Issued in connection with the reinvestment of distributions | 295 | 3,652 | 11,672 | 138,982 |
Redeemed | (56,317 ) | (684,240 ) | (100,009 ) | (1,125,587 ) |
Net change | 98,179 | $1,195,955 | 178,905 | $2,039,611 |
Class Y | ||||
Issued from the sale of shares | 83,011 | $1,036,118 | 369,510 | $4,224,686 |
Issued in connection with the reinvestment of distributions | 22 | 273 | 1,027 | 12,197 |
Redeemed | (181,669 ) | (2,111,977 ) | (21,082 ) | (227,343 ) |
Net change | (98,636 ) | $(1,075,586 ) | 349,455 | $4,009,540 |
Increase (decrease) from capital share transactions | (507 ) | $119,023 | 510,591 | $5,848,519 |
One-Year | Three-Year | Five-Year | |
Gateway Fund | 52% | 66% | 80% |
Gateway Equity Call Premium Fund | 19% | 9% | 15% |
Mirova Global Green Bond Fund | 33% | 86% | 89% |
Mirova Global Sustainable Equity Fund | 78% | 43% | 19% |
Mirova International Sustainable Equity Fund | 73% | 97% | 61% |
Visit: im.natixis.com Call: 800-225-5478
Natixis Advisors, LLC
888 Boylston Street, Suite 800
Boston, MA 02199-8197

Exp. 8/30/20255890240.2.1LSAF58SA-0624
Item 8. Changes in and Disagreements with Accountants for Open-End Management Investment Companies
Not applicable.
Item 9. Proxy Disclosures for Open-End Management Investment Companies.
Not applicable.
Item 10. Remuneration Paid to Directors, Officers, and Others of Open-End Management Investment Companies.
The remuneration paid to Directors and Officers are incorporated by reference as part of the Financial Statements and Other Important Information for Open-End Management Investment Companies filed as Item 7 herewith.
Item 11. Statement Regarding Basis for Approval of Investment Advisory Contract.
The statements regarding basis for approval of investment advisory contracts are incorporated by reference as part of the Financial Statements and Other Important Information for Open-End Management Investment Companies filed as Item 7 herewith.
Item 12. Disclosure of Proxy Voting Policies and Procedures for Closed-End Management Investment Companies.
Not applicable.
Item 13. Portfolio Managers of Closed-End Management Investment Companies.
Not applicable.
Item 14. Purchases of Equity Securities by Closed-End Management Investment Companies and Affiliated Purchasers.
Not applicable.
Item 15. Submission of Matters to a Vote of Securities Holders.
There were no material changes to the procedures by which shareholders may recommend nominees to the Registrant’s Board of Trustees.
Item 16. Controls and Procedures.
The Registrant’s principal executive officer and principal financial officer have concluded that the Registrant’s disclosure controls and procedures are sufficient to ensure that information required to be disclosed by the Registrant in this Form N-CSR was recorded, processed, summarized and reported within the time periods specified in the Securities and Exchange Commission’s rules and forms, based upon such officers’ evaluation of these controls and procedures as of a date within 90 days of the filing date of the report.
There were no changes in the Registrant’s internal control over financial reporting that occurred during the period covered by the report that have materially affected, or are reasonably likely to materially affect, the Registrant’s internal control over financial reporting.
Item 17. Disclosure of Securities Lending Activities for Closed-End Management Investment Companies.
Not applicable.
Item 18. Recovery of Erroneously Awarded Compensation.
Not applicable.
Item 19. Exhibits.
| (a) | (1) | Any code of ethics, or amendment thereto, that is the subject of the disclosure required by Item 2, to the extent that the registrant intends to satisfy the Item 2 requirements through filing of an exhibit. Not Applicable. | ||||||
| (a) | (2) | Any policy required by the listing standards adopted pursuant to Rule 10D-1 under the Exchange Act by the registered national securities exchange or registered national securities association upon which the registrants securities are listed. Not Applicable. | ||||||
| (a) | (3) | |||||||
| (a) | (3)(1) | Any written solicitation to purchase securities under Rule 23c-1 under the Act (17 CFR 270.23c-1) sent or given during the period covered by the report by or on behalf of the registrant to 10 or more persons. Not Applicable | ||||||
| (a) | (3)(2) | Changes in the registrant’s independent public accountant. Not Applicable | ||||||
| (b) |
| (101) | Inline Interactive Data File-the instance document does not appear in the Interactive Data File because its XBRL tags are embedded within the inline XBRL document. |
SIGNATURES
Pursuant to the requirements of the Securities Exchange Act of 1934 and the Investment Company Act of 1940, the Registrant has duly caused this report to be signed on its behalf by the undersigned, thereunto duly authorized.
| Gateway Trust | ||
| By: /s/ David L. Giunta | ||
| Name: | David L. Giunta | |
| Title: | President and Chief Executive Officer | |
| Date: | August 21, 2024 | |
Pursuant to the requirements of the Securities Exchange Act of 1934 and the Investment Company Act of 1940, this report has been signed by the following persons on behalf of the Registrant and in the capacities and on the dates indicated.
| By: /s/ David L. Giunta | ||
| Name: | David L. Giunta | |
| Title: | President and Chief Executive Officer | |
| Date: | August 21, 2024 | |
| By: /s/ Matthew J. Block | ||
| Name: | Matthew J. Block | |
| Title: | Treasurer and Principal Financial and Accounting Officer | |
| Date: | August 21, 2024 | |