 Second Quarter 2012 Financial Results August 8, 2012 Exhibit 99.2 Accelerating Value Realization, Growing Through Strategic Investments and Delivering the Greatest Value from Every Acre |
 Notice to Investors 2 This presentation contains “forward-looking statements” within the meaning of the federal securities laws. Forward-looking statements are typically identified by words or phrases such as “will,” “anticipate,” “estimate,” “expect,” “project,” “intend,” “plan,” “believe,” “target,” “forecast,” and other words and terms of similar meaning. These statements reflect management’s current views with respect to future events and are subject to risk and uncertainties. We note that a variety of factors and uncertainties could cause our actual results to differ significantly from the results discussed in the forward-looking statements, including the timing to consummate the proposed merger, the risk that a condition to closing of the proposed merger may not be satisfied; our ability to achieve the synergies and value creation contemplated by the proposed merger; our ability to promptly and effectively integrate Credo’s businesses, and the diversion of management time on merger-related matters. Other factors and uncertainties that might cause such differences include, but are not limited to: general economic, market, or business conditions; changes in commodity prices; the opportunities (or lack thereof) that may be presented to us and that we may pursue; fluctuations in costs and expenses including development costs; demand for new housing, including impacts from mortgage credit availability; lengthy and uncertain entitlement processes; cyclicality of our businesses; accuracy of accounting assumptions; competitive actions by other companies; changes in laws or regulations; and other factors, many of which are beyond our control. Except as required by law, we expressly disclaim any obligation to publicly revise any forward-looking statements contained in this news release to reflect the occurrence of events after the date of this presentation. This presentation includes Non-GAAP financial measures. The required reconciliation to GAAP financial measures can be found on our website at www.forestargroup.com. |
 Second Quarter 2012 Financial Results 3 3 Accelerating Value Realization, Growing Through Strategic Investments and Delivering the Greatest Value from Every Acre |
 Accelerating Value Realization Drives Improved Second Quarter 2012 Financial Results ($ in Millions, except per share data) 2nd Quarter 2012 2nd Quarter 2011 Net Income (Loss) $0.8 ($3.9) Earnings (Loss) Per Share $0.02 ($0.11) Segment Earnings: Mineral Resources $3.9 $3.1 Real Estate 7.7 1.0 Fiber Resources 0.6 0.7 Total Segment Earnings $12.2 $4.8 Second Quarter 2012 Weighted Average Diluted Shares Outstanding were 35.4 million • Q2 2012 results include after-tax expenses of $1.6 million, or $0.05 per share related to pending acquisition of CREDO Petroleum • Q2 2011 results include after-tax expenses of $1.8 million, or $0.05 per share related to withdrawn private debt offerings 4 |
 Continuing to Strengthen Balance Sheet and Liquidity 5 ($ in millions) 2nd Quarter 2012 2nd Quarter 2011 Cash and Cash Equivalents $45 $6 Total Debt $202 $261 Total Debt / Total Capital 28% 34% Liquidity * $189 $115 2012 Significant Transactions: ($ in millions) Timing Cash Debt Reduction Palisades West – sale of 25% interest Q1 2012 $32 -- Light Farms - sale of 800 acres Q2 2012 25 ($31) Multifamily ventures - reimbursements Q2 2012 11 -- Total $68 ($31) * Liquidity = cash + available revolver |
 Second Quarter 2012 Operating Highlights 6 Accelerating Value Realization By Increasing Oil Production and Residential Lot Sales and Growing Net Asset Value by Capitalizing on Strategic Growth and Investment Opportunities |
 Building Momentum - Second Quarter Highlights Oil production up over 120% vs. Q2 2011 Seven additional wells completed – 541 total producing wells Closed venture for development in downtown Austin - Eleven Closed venture for development in Denver Tech Center - 360° Sold 427 residential lots - up over 50% vs. Q2 2011 1,435 lots under option contracts Sold over 105,000 tons of fiber 99% of available land leased for recreation Announced definitive agreement to acquire CREDO Petroleum Sold 800 acres for $56 mm ($3.4 mm gain) - Light Farms ventur $1.1 mm earnings from loan secured by real estate in Houston 7 Note: Wells owned by third-party lessee / operator SINGLE-FAMILY TIMBERLAND MULTIFAMILY FORESTAR MINERALS, O IL & GAS |
 Second Quarter 2012 Minerals – Oil & Gas Highlights Building Momentum By Driving Leasing and Exploration to Increase Production and Reserves 8 |
 Increased Oil Production Driving Higher Royalties Segment Earnings Reconciliation Q2 2011 vs. Q2 2012 9 ($ in millions) Note: Wells owned by third-party lessee / operator * Increased costs principally related to additional staffing and production taxes Mineral Resources $3.1 $2.5 ($0.3) ($1.4) * $3.9 $0.0 $2.0 $4.0 $6.0 Q2 2011 Royalties Leasing, Delay Cost of Sales & Net of Equity Interests Rentals & Other Operating Expenses Q2 2012 Q2 2012 Highlights • Oil production up over 120% vs. Q2 2011 • Royalties up 60% or $2.5 million vs. Q2 2011 • Received over $400,000 in delay rentals • 7 additional wells completed; 541 total producing wells |
 Growth in Drilling Activity Well Count Q1 2011 – Q2 2012 10 Forestar’s Share of Annual Oil Production 2008 – 2012 Strategy Execution Driving Increased Oil Production * Excludes any benefit from Credo acquisition 475 500 525 550 0 50,000 100,000 150,000 200,000 250,000 Note: Includes ventures; wells owned and operated by third party lessees / operators |
 Target Formations 2011-2012 Well Completions East Texas & Louisiana* 11 Acres Leased Available for Lease Held by Production Acres with Option New Oil Wells New Gas Wells Exploration and Drilling Activity Focused on Multiple Basins and Formations * Map excludes 6 wells located in Barnett Shale in North Texas and 9 wells in Colorado |
 Second Quarter 2012 Fiber Resources Highlights 12 Building Momentum Through Sustainable Harvests and Maximizing Recreational Lease Activity |
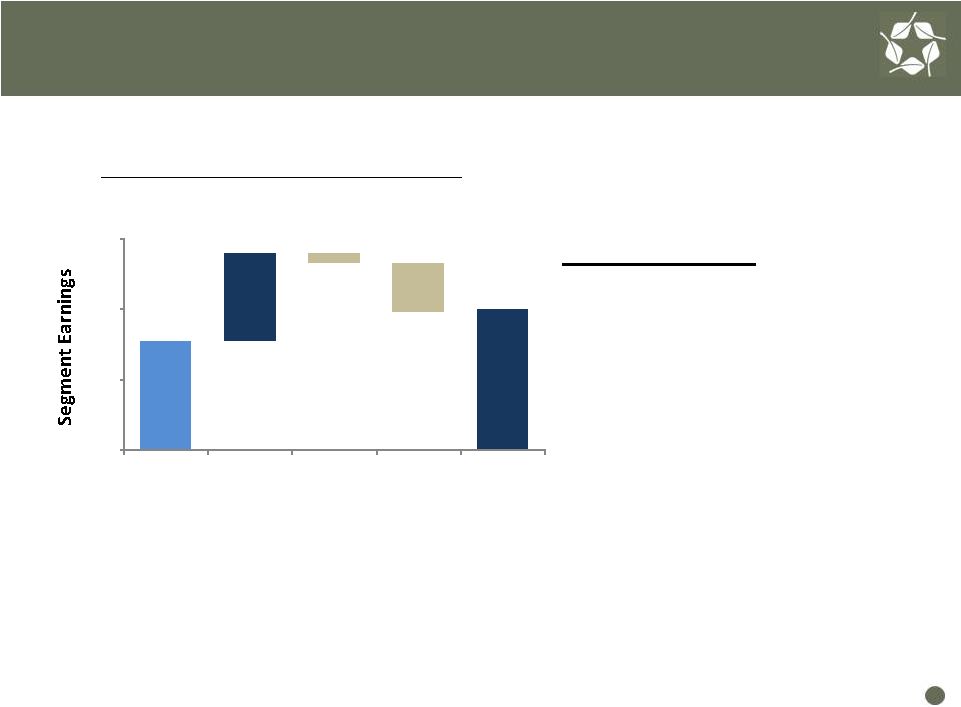
 Stable Fiber Resources Results Segment Earnings Reconciliation Q2 2011 vs. Q2 2012 Q2 2012 Highlights Sold over 105,700 tons of fiber Higher fiber sales principally reflect timing of harvests 99% of land leased for recreation $8.84/acre average price for rec leases Fiber Sales Q2 2011 – Q2 2012 ($ in millions) Fiber Resources $0.7 ($0.2) ($0.2) ($0.1) $0.6 $0.0 $0.5 $1.0 Q2 2011 Fiber Sales Rec Leases Termination of timber lease Costs Q2 2012 83,400 105,700 $10.21 11.66 Fiber Sales (Tons) Average Price / Ton $ $0.4 13 |
 Second Quarter 2012 Real Estate Highlights Building Momentum By Increasing Residential Lot Sales and Capitalizing on Growth Opportunities 14 |
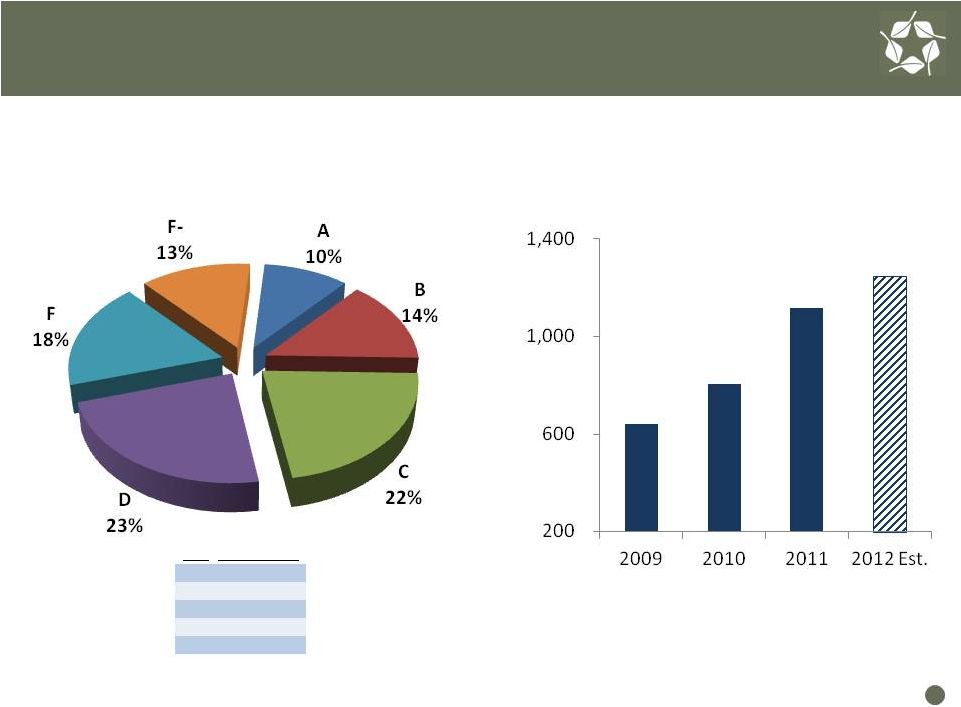 Impending Shortage of Quality Lots Driving Demand In Good Locations 15 Note: Includes ventures Forestar Residential Lot Sales U.S. Housing Markets Vacant Developed Lot Classification Source: MetroStudy Top 40 U.S. Housing Markets Class Starts / Month A +4 B 3 – 4 C 2 – 3 D 1 – 2 F < 1 |
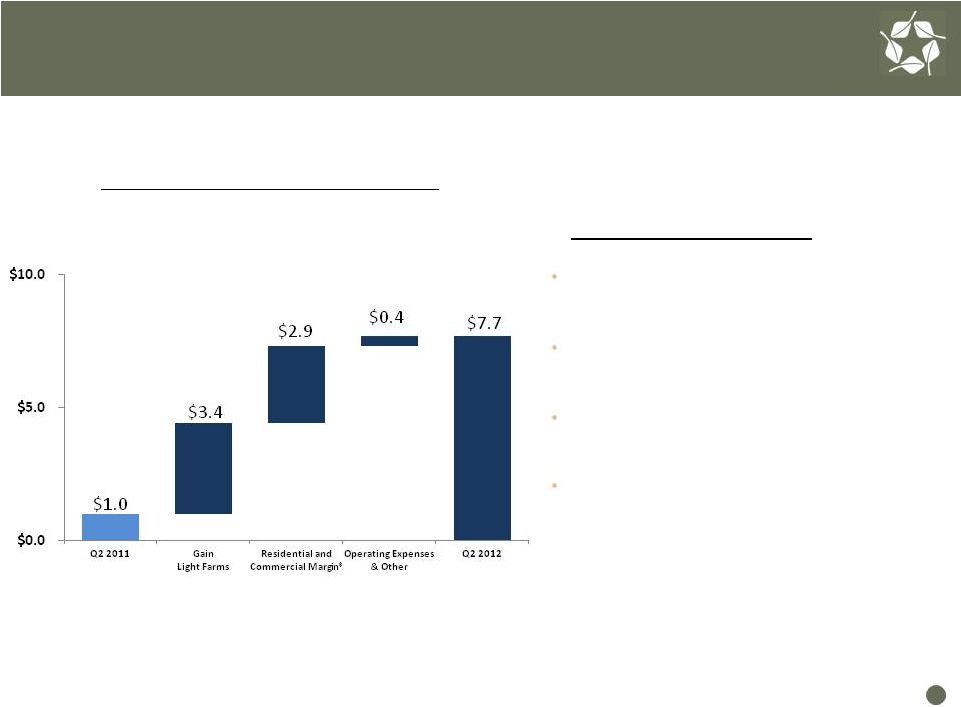 Accelerating Value Realization Driving Improved Second Quarter Results Q2 2012 Highlights Segment Earnings Reconciliation Q2 2011 vs. Q2 2012 16 ($ in millions) Note: Includes Ventures Real Estate *Includes $1.1 million in earnings from loan secured by Discovery at Springs Trails project in Houston Light Farms venture sold 800 acres for $56 million - $3.4 million gain on sale Sold 427 residential lots, up over 50% vs. Q2 2011 109 remaining lots sold at River Plantation for $19,700 per lot Sold 933 acres of undeveloped land for $2.6 million ($2,800 / acre) |
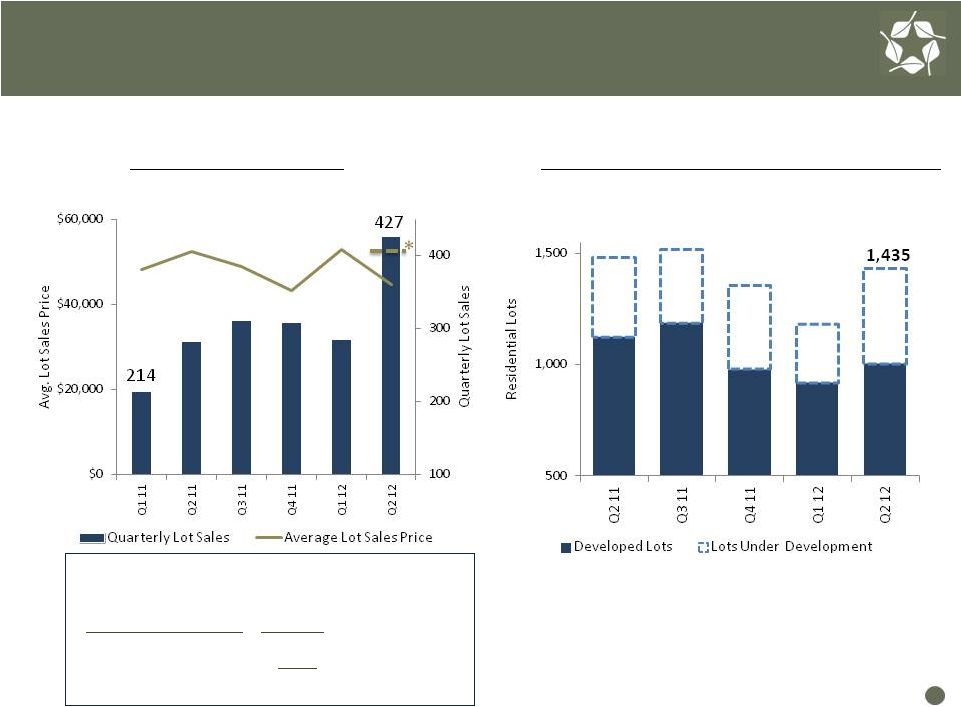 Increased Lot Sales and Strong Backlog Reflect Benefit Of Our Market Position and Lower Inventories in Texas Residential Lot Sales Q1 2011 – Q2 2012 Residential Lots Under Option Contract Q2 2011 – Q2 2012 Note: Includes ventures River Plantation – Tampa, FL Life of Project Economics: ($ in millions ) Total Revenues $30.1 Total Costs (23.3) Project Cash flow $6.8 17 * Q2 2012 avg. lot price is $53,300/lot excluding sale of remaining 109 lots at River Plantation in Tampa for $19,700/lot |
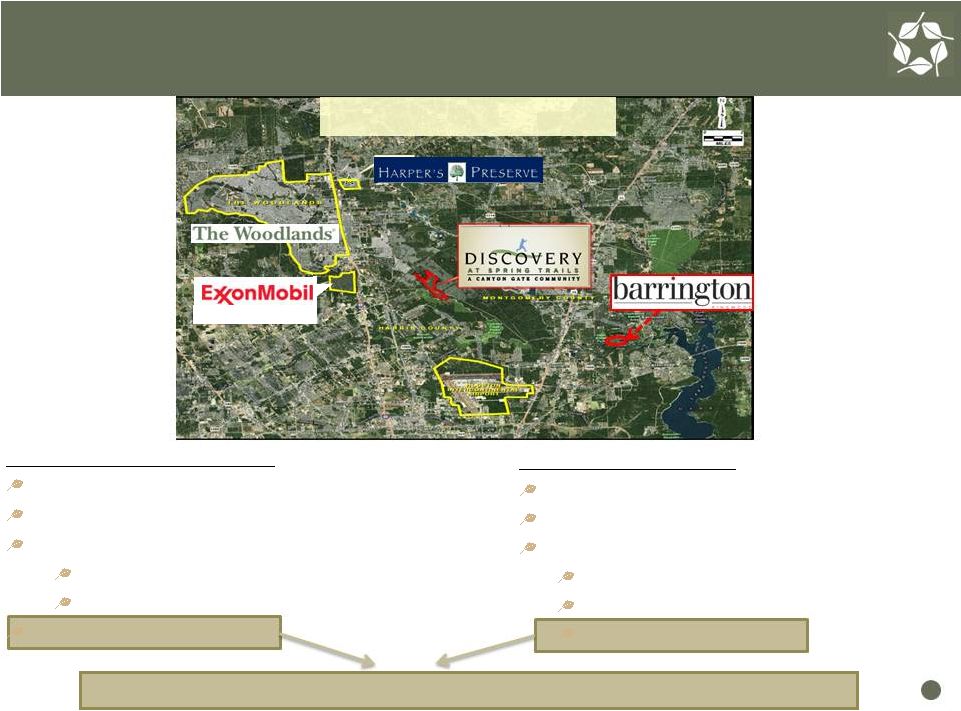 Barrington Kingwood Acquired 180 developed lots (Q3 2011) for $9 million Includes $4 million in reimbursement rights Q2 2012 Sales Activity: 11 lots sold - $102,500 / lot $46,900 / lot avg. margin Gross Profit - $515,600 Discovery at Spring Trails: Acquired non-performing bank loan for $21mm in Q2 2011 Secured by first lien on Discovery at Spring Trails community Previous owner investment - $49mm Equity $17mm Debt $32mm Q2 2012 Earnings = $1.1 million Houston, Texas Campus 18 Real Estate Investments Generating Cash Flow & Earnings These acquisitions generated $1.6 million in earnings in 2nd Quarter 2012 |
 Timely Developing a Low Capital - High Return Multifamily Business 19 Multifamily Projects Ownership Units June 2012 Occupancy NOI * Cap Rates Stabilized Multifamily Assets Broadstone – Houston, TX 100% 401 98% $3.3 million 5.5% - 6.5% Las Brisas – Austin, TX 59% 414 95% $2.4 million 6.0% - 7.0% Under Construction Promesa – Austin, TX 100% 289 39% ** -- Eleven – Austin, TX 25% 257 -- -- 360° – Denver, CO 20% 304 -- -- * Based upon annualized YTD Q2 2012 results ** Represents leased units Business model is to leverage our existing sites and investments with capital from our partners to create and realize value |
 Promesa –Leasing Activity Building Momentum 289-unit Class A multifamily property located in Northwest Austin First units delivered in April 2012; approximately 80% complete 39% leased $29 million total investment at Q2 2012; total investment at completion = $34 million Targeting stabilization in Q2 2013 20 Austin multifamily occupancy rates >96% |
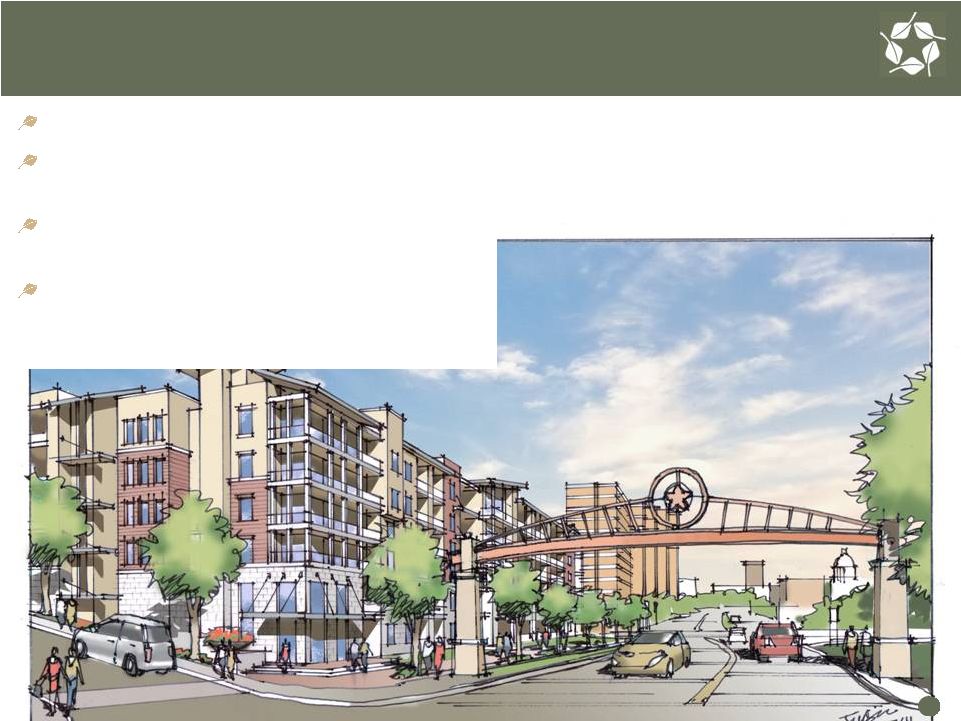 Eleven – Multifamily Venture with Canyon-Johnson 21 21 257-unit Class A multifamily property Designed for certification under Austin Energy Green Building program Construction commenced in June, first units expected Q3 2013 $3.7 million reimbursement of prior investment with 25% ownership + fees & promoted interests |
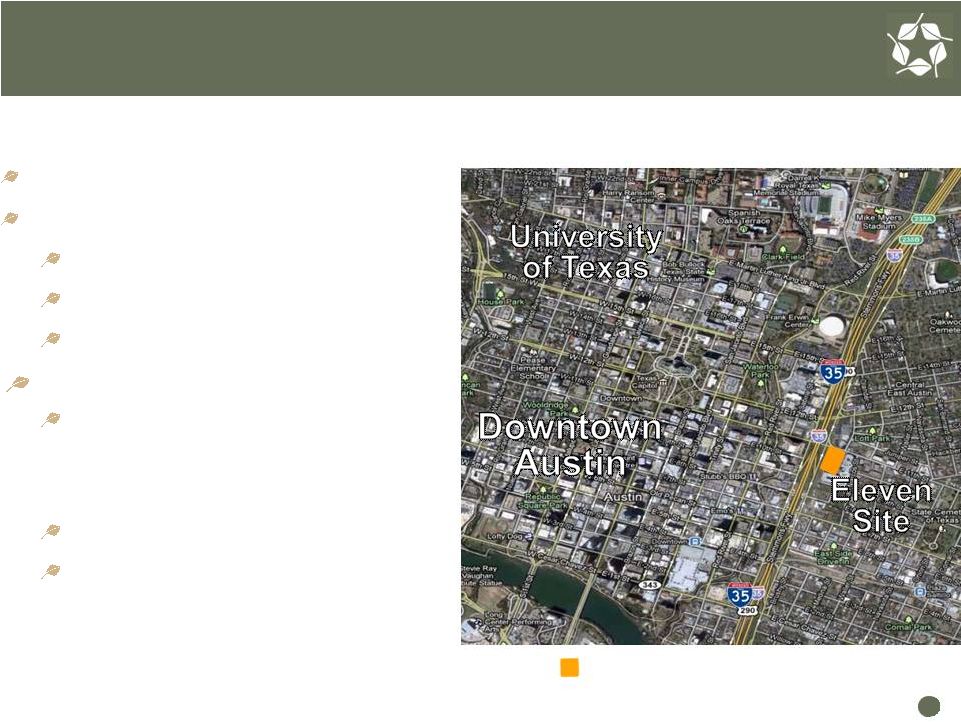 Eleven - Preferred Location in Strong Market 22 22 Located adjacent to downtown Austin Austin multifamily market remains strong: Occupancy rates: 95.6% Annual Rent Growth: 6.1% Job Growth: 3.3% Close proximity to 30,000 jobs in downtown Austin, 24,000 jobs and over 50,000 students at University of Texas, and 69,000 State of Texas employees High visibility Convenient access to cultural and entertainment offerings Eleven Site Location Preferred Location : |
 304-unit Class A multifamily property Designed to obtain Energy Star certification Construction commenced in July with first units expected Q3 2013 $7.2 million reimbursement of prior investment with 20% ownership + fees and promoted interests 360° – Multifamily Venture with Guggenheim Real Estate 23 |
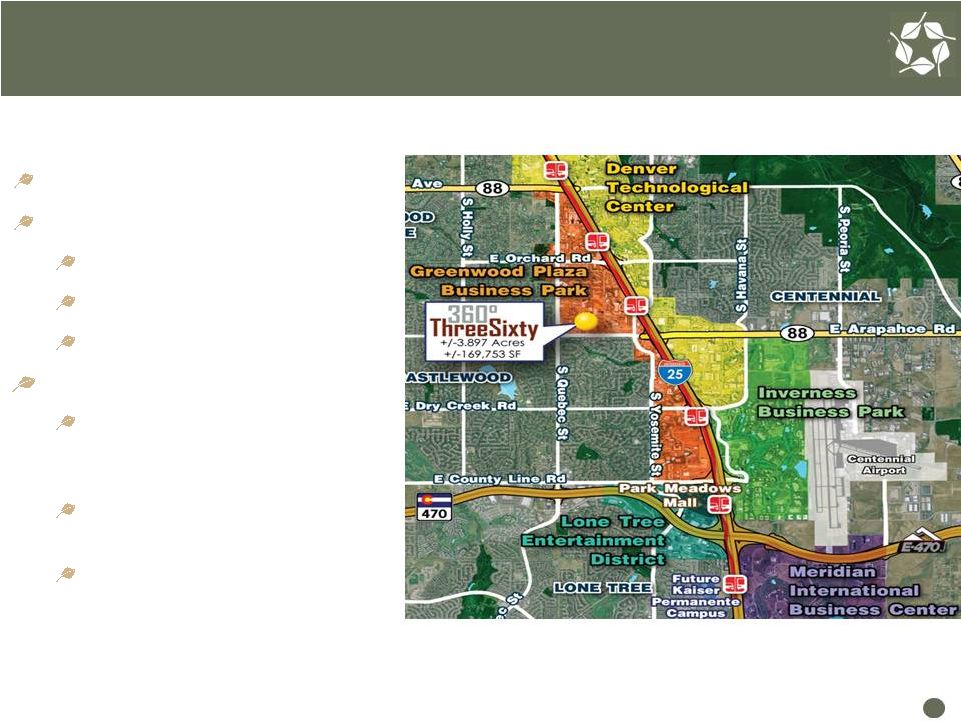 Denver Tech Center submarket Multifamily market remains strong: Occupancy rates: 95.4% Rent Growth: 5.7% Job Growth: 2.0% Close proximity to 30 million sq.ft. of office space and 150,000 employees Convenient access to I-25 and Arapahoe Light Rail station Near Denver cultural and entertainment venues 360°- Excellent Location in Strong Multifamily Market 24 Preferred Location |
 Second Quarter 2012 Strategic Initiatives 25 Accelerating Value Realization, Optimizing Transparency and Raising NAV Through Disciplined Investments |
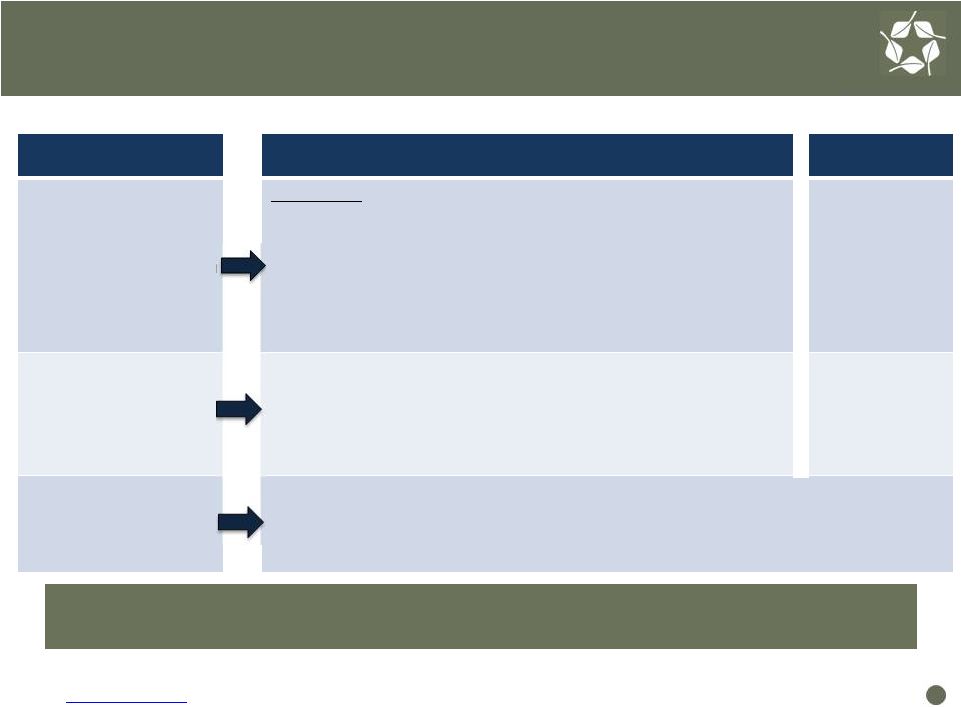
 Our Focus: Triple In FOR 26 Initiatives Q2 - 2012 Activity F ocus on Accelerating Value Realization Triple Residential Lot Sales • Lot sales up over 50% from Q2 2011 levels • Oil production up over 120% from Q2 2011 • Total segment earnings up over 150% from Q2 2011 Triple Oil & Gas Production (Mcfe) Triple Total Segment Earnings O ptimize Transparency & Disclosure Expand Reported Oil and Gas Resource Potential • Acquisition of CREDO Petroleum expands Forestar’s ability to report oil and gas reserve categories Additional Transparency on Water Interests Report Corporate Sustainability Results R aise NAV Through Strategic and Disciplined Investments Growth Opportunities which Prove Up Net Asset Value and Exceed Return Requirements • Announced definitive agreement to acquire CREDO Petroleum • Closed multifamily venture Eleven - Austin, TX • Closed multifamily venture 360 ° - Denver, CO • $1.1 million in earnings from loan secured by Discovery at Spring Trails project in Houston Accelerate Participation in Oil & Gas Working Interests Develop Low-Capital, High-Return Multifamily Business |
 Credo: Compelling Combination Value Drivers Combination creates meaningful scale through production and reserve growth, additional ownership and operations in strategic basins and improves transparency and disclosures Value Drivers 2011 Metrics * CRED FOR Combined Increased Scale / Doubles Production and Reserves Meaningful Ownership and Operations in Prolific Basins Disclosure Benefits Additional transparency on Forestar minerals FOR YE 2011 reserves 98% PDP’s – Yet to report PUD’s ($ in millions) Production (BOE) 301,000 422,200 723,200 Reserves (MMBOE) 4.1 3.0 7.1 % Oil 48% 35% 42% PV-10 ** $62 $81 $143 Undiscounted Future Net Cash Flows ** $116 $134 $250 Net Mineral Acreage *** 125,000 594,000 719,000 Basins 4 5 8 States 9 7 14 * Note: Based on Credo Form 10-K for the year ended 10/31/11 and Forestar Form 10-K for the year ended 12/31/11, before income taxes 27 *** Note: Includes both fee and leasehold interests; Forestar acres as of Q2 2012 ** Represent Non-GAAP financial measures. Forestar’s required reconciliation to GAAP financial measures can be found on our website at www.forestargroup.com, and Credo’s required reconciliation is in its Form 10-K for the year ended 10/31/11. |
 Accelerating Value Realization Increasing oil production and proven reserves Growing lot sales and increasing market share Realizing value from stabilized commercial assets Capitalizing on growth opportunities and investments to generate near-term cash flow and earnings Building Momentum By Accelerating Value Realization, Optimizing Transparency and Growing NAV 28 |
 Anna Torma SVP Corporate Affairs Forestar Group Inc. 6300 Bee Cave Road Building Two, Suite 500 Austin, TX 78746 512-433-5312 annatorma@forestargroup.com 29 |
 Second Quarter 2012 Appendix - Segment KPI’s 30 |
 Q2 2012 Q2 2011 YTD 2012 YTD 2011 Leasing Activity Net Acres Leased - - 2,532 805 7,366 Avg. Bonus / Acre - - $187 $357 $289 Royalties * Oil Produced (Barrels) 61,600 27,900 130,700 59,900 Average Price / Barrel $94.64 $102.23 $96.19 $91.69 Natural Gas Produced (MMCF) 420.4 373.5 872.7 840.3 Average Price / MCF $2.31 $3.92 $2.79 $3.81 Total BOE 131,600 90,200 276,200 199,900 Average Price / BOE $51.65 $47.88 $54.34 $43.46 Segment Revenues ($ in Millions) $7.1 $4.6 $16.6 $11.9 Segment Earnings ($ in Millions)** $3.9 $3.1 $9.8 $8.7 Producing Wells * (end of period) 541 501 541 501 31 MINERAL RESOURCES SEGMENT KPI'S * Includes our share of venture production: 82 MMCf & 172 MMcf in Q2 2012 and YTD Q2 2012; 128 MMCf and 286 MMcf in Q2 2011 and YTD Q2 2011 ** Note: Segment results include costs associated with the development of our water initiatives: $1.0 million in Q2 2012; $0.8 million in Q2 2011; $2.3 million in YTD Q2 2012 and $1.9 million in YTD Q2 2011 |
 Q2 2012 Q2 2011 YTD 2012 YTD 2011 Residential Lot Sales Lots Sold 427 283 712 497 Average Price / Lot $44,700 $52,400 $48,000 $50,600 Gross Profit / Lot $14,800 $20,600 $17,200 $19,700 Commercial Tract Sales Acres Sold 38 4 38 24 Average Price / Acre $47,000 $185,300 $47,000 $157,900 Land Sales Acres Sold 933 781 1,388 3,410 Average Price / Acre $2,800 $3,300 $2,600 $2,500 Segment Revenues ($ in Millions) $26.6 $19.6 $44.6 $40.8 Segment Earnings (Loss) ($ in Millions) $7.7 $1.0 $19.2 $3.6 ** Q2 2012 results include $3.4 million gain on sale of 800 acres from Light Farm venture. *** YTD Q2 2012 results include $11.7 million gain on sale of 25% interest in Palisades West Note: Includes ventures ** *** * Includes 109 residential lots sold at $19,700/lot to closeout River Plantation community in Tampa, Florida * 32 REAL ESTATE SEGMENT KPI' S |
 Q2 2012 Q2 2011 YTD 2012 YTD 2011 Fiber Sales Pulpwood Tons Sold 80,800 70,700 105,200 136,300 Average Pulpwood Price / Ton $9.24 $9.22 $9.46 $9.20 Sawtimber Tons Sold 24,900 12,700 29,300 28,200 Average Sawtimber Price / Ton $19.46 $15.69 $19.47 $16.40 Total Tons Sold 105,700 83,400 134,500 164,500 Average Price / Ton $11.66 $10.21 $11.64 $10.44 Recreational Leases Average Acres Leased 131,800 197,400 131,400 198,800 Average Lease Rate / Acre $8.84 $8.96 $8.82 $8.93 Segment Revenues ($ in Millions) $1.5 $1.3 $2.3 $2.7 Segment Earnings ($ in Millions) $0.6 $0.7 $1.0 $1.3 *Includes $0.2 million gain on termination of timber lease Note: Fiber resources segment earnings negatively impacted by sale of over 74,000 acres of timberland during 2011 * * 33 FIBER RESOURCES SEGMENT KPI'S |
 Anna Torma SVP Corporate Affairs Forestar Group Inc. 6300 Bee Cave Road Building Two, Suite 500 Austin, TX 78746 512-433-5312 annatorma@forestargroup.com 34 |