Fourth Quarter & Full Year 2013 Financial Results February 13, 2014 Building Momentum By Accelerating Value Realization, Optimizing Transparency and Growing Net Asset Value

Notice To Investors This presentation contains “forward-looking statements” within the meaning of the federal securities laws. Forward-looking statements are typically identified by words or phrases such as “will,” “anticipate,” “estimate,” “expect,” “project,” “intend,” “plan,” “believe,” “target,” “forecast,” and other words and terms of similar meaning. These statements reflect management’s current views with respect to future events and are subject to risk and uncertainties. We note that a variety of factors and uncertainties could cause our actual results to differ significantly from the results discussed in the forward-looking statements, including but not limited to: general economic, market, or business conditions; changes in commodity prices; opportunities (or lack thereof) that may be presented to us and that we may pursue; fluctuations in costs and expenses including development costs; demand for new housing, including impacts from mortgage credit rates or availability; lengthy and uncertain entitlement processes; cyclicality of our businesses; accuracy of accounting assumptions; competitive actions by other companies; changes in laws or regulations; and other factors, many of which are beyond our control. Except as required by law, we expressly disclaim any obligation to publicly revise any forward-looking statements contained in this presentation to reflect the occurrence of events after the date of this presentation. This presentation includes Non-GAAP financial measures. The required reconciliation to GAAP financial measures can be found as an exhibit to this presentation and on our website at www.forestargroup.com. 2
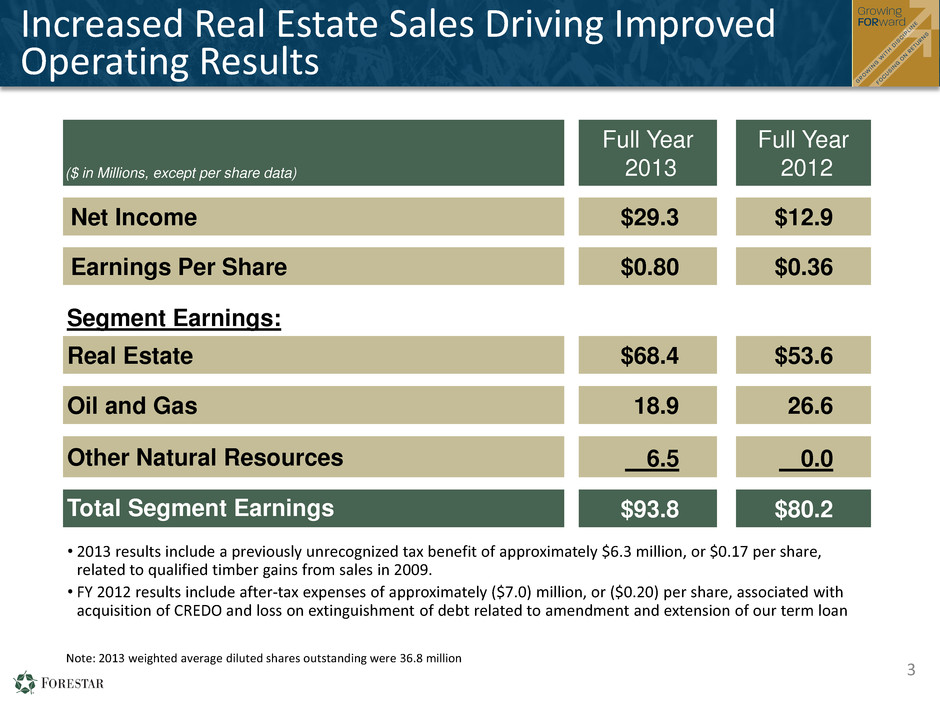
Increased Real Estate Sales Driving Improved Operating Results 3 Note: 2013 weighted average diluted shares outstanding were 36.8 million ($ in Millions, except per share data) Full Year 2013 Full Year 2012 Net Income $29.3 $12.9 Earnings Per Share $0.80 $0.36 Segment Earnings: Real Estate $68.4 $53.6 Oil and Gas 18.9 26.6 Other Natural Resources 6.5 0.0 Total Segment Earnings $93.8 $80.2 • 2013 results include a previously unrecognized tax benefit of approximately $6.3 million, or $0.17 per share, related to qualified timber gains from sales in 2009. • FY 2012 results include after-tax expenses of approximately ($7.0) million, or ($0.20) per share, associated with acquisition of CREDO and loss on extinguishment of debt related to amendment and extension of our term loan
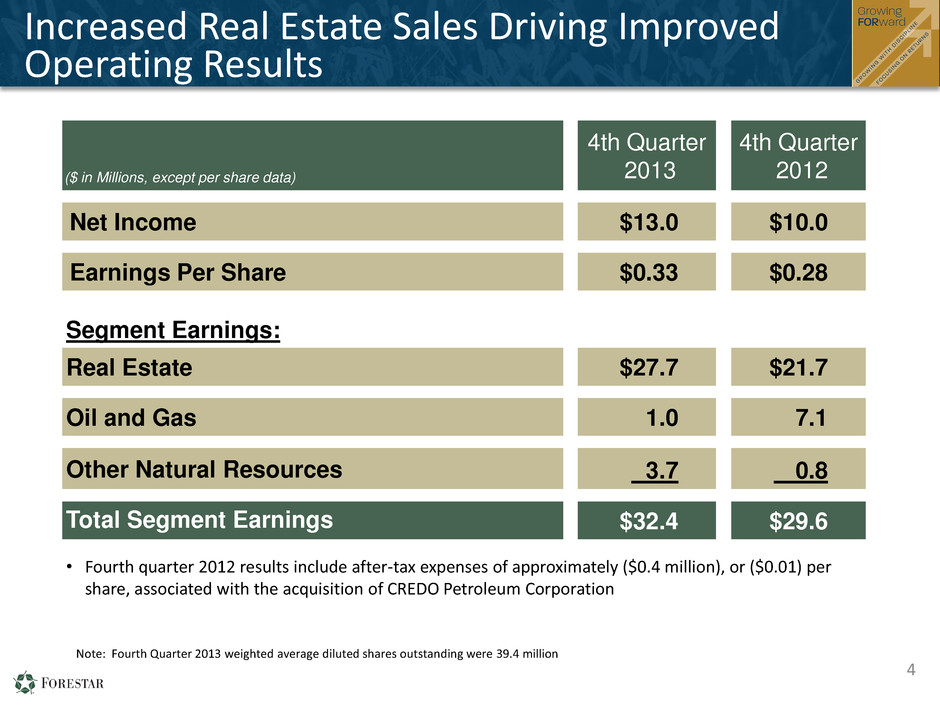
Increased Real Estate Sales Driving Improved Operating Results 4 • Fourth quarter 2012 results include after-tax expenses of approximately ($0.4 million), or ($0.01) per share, associated with the acquisition of CREDO Petroleum Corporation Note: Fourth Quarter 2013 weighted average diluted shares outstanding were 39.4 million ($ in Millions, except per share data) 4th Quarter 2013 4th Quarter 2012 Net Income $13.0 $10.0 Earnings Per Share $0.33 $0.28 Segment Earnings: Real Estate $27.7 $21.7 Oil and Gas 1.0 7.1 Other Natural Resources 3.7 0.8 Total Segment Earnings $32.4 $29.6
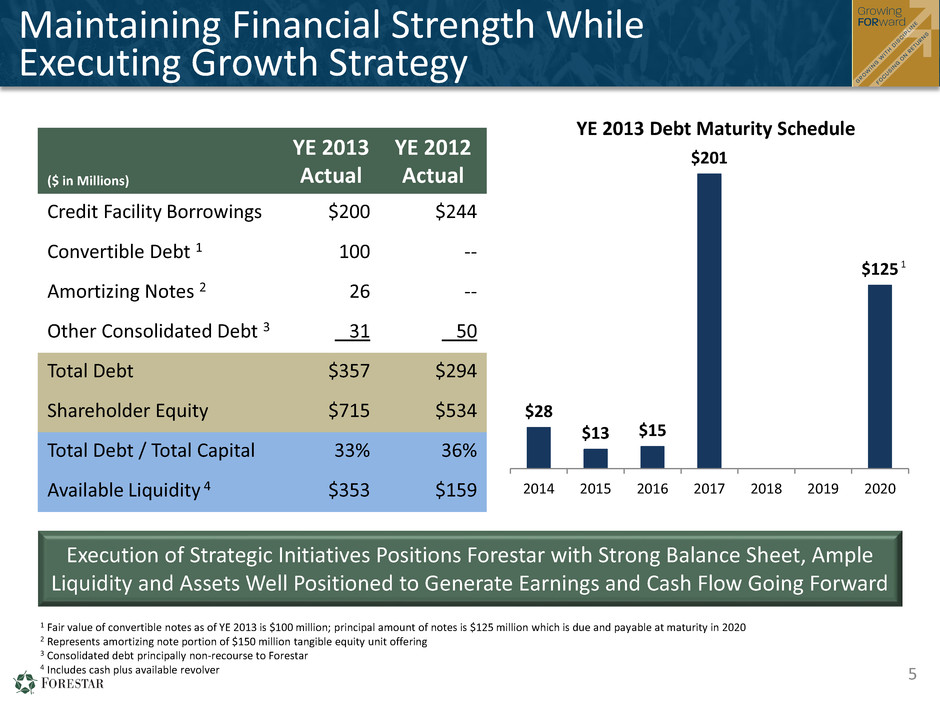
Maintaining Financial Strength While Executing Growth Strategy Execution of Strategic Initiatives Positions Forestar with Strong Balance Sheet, Ample Liquidity and Assets Well Positioned to Generate Earnings and Cash Flow Going Forward 1 Fair value of convertible notes as of YE 2013 is $100 million; principal amount of notes is $125 million which is due and payable at maturity in 2020 2 Represents amortizing note portion of $150 million tangible equity unit offering 3 Consolidated debt principally non-recourse to Forestar 4 Includes cash plus available revolver 5 $28 $13 $15 $201 $125 2014 2015 2016 2017 2018 2019 2020 1 ($ in Millions) YE 2013 Actual YE 2012 Actual Credit Facility Borrowings $200 $244 Convertible Debt 1 100 -- Amortizing Notes 2 26 -- Other Consolidated Debt 3 31 50 Total Debt $357 $294 Shareholder Equity $715 $534 Total Debt / Total Capital 33% 36% Available Liquidity 4 $353 $159 YE 2013 Debt Maturity Schedule

Real Estate Fourth Quarter & Full Year 2013 Highlights Building Momentum By Accelerating Real Estate Sales and Building a Solid Multifamily Pipeline 6
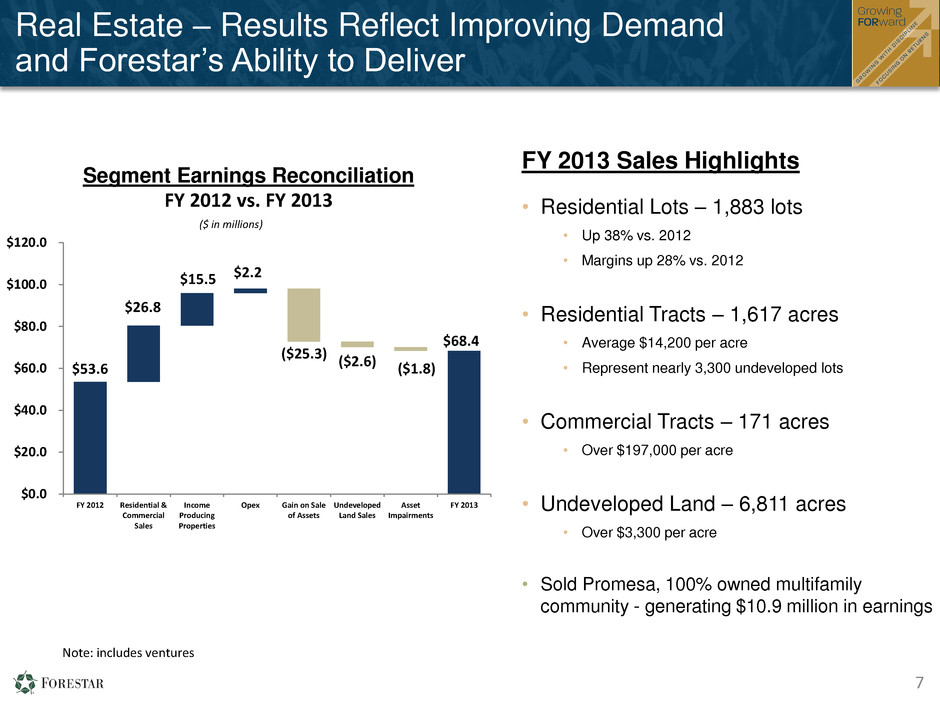
$53.6 $26.8 $15.5 $2.2 ($25.3) ($2.6) ($1.8) $68.4 $0.0 $20.0 $40.0 $60.0 $80.0 $100.0 $120.0 FY 2012 Residential & Commercial Sales Income Producing Properties Opex Gain on Sale of Assets Undeveloped Land Sales Asset Impairments FY 2013 FY 2013 Sales Highlights • Residential Lots – 1,883 lots • Up 38% vs. 2012 • Margins up 28% vs. 2012 • Residential Tracts – 1,617 acres • Average $14,200 per acre • Represent nearly 3,300 undeveloped lots • Commercial Tracts – 171 acres • Over $197,000 per acre • Undeveloped Land – 6,811 acres • Over $3,300 per acre • Sold Promesa, 100% owned multifamily community - generating $10.9 million in earnings Segment Earnings Reconciliation FY 2012 vs. FY 2013 ($ in millions) 7 Note: includes ventures Real Estate – Results Reflect Improving Demand and Forestar’s Ability to Deliver
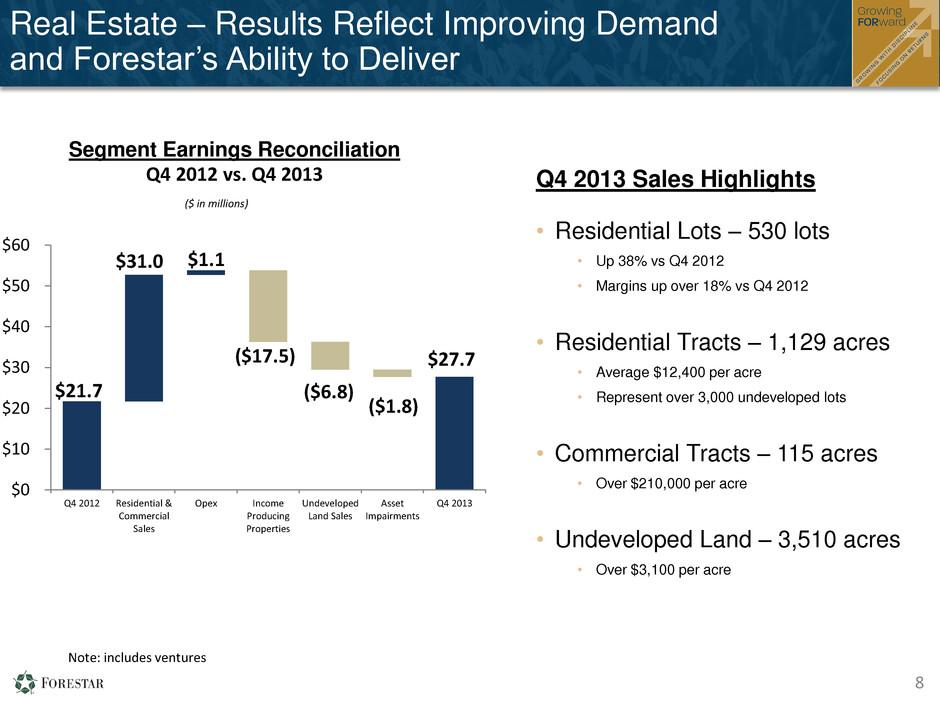
($6.8) ($1.8) $21.7 $31.0 $1.1 ($17.5) $27.7 $0 $10 $20 $30 $40 $50 $60 Q4 2012 Residential & Commercial Sales Opex Income Producing Properties Undeveloped Land Sales Asset Impairments Q4 2013 Q4 2013 Sales Highlights • Residential Lots – 530 lots • Up 38% vs Q4 2012 • Margins up over 18% vs Q4 2012 • Residential Tracts – 1,129 acres • Average $12,400 per acre • Represent over 3,000 undeveloped lots • Commercial Tracts – 115 acres • Over $210,000 per acre • Undeveloped Land – 3,510 acres • Over $3,100 per acre Segment Earnings Reconciliation Q4 2012 vs. Q4 2013 ($ in millions) 8 Note: includes ventures Real Estate – Results Reflect Improving Demand and Forestar’s Ability to Deliver
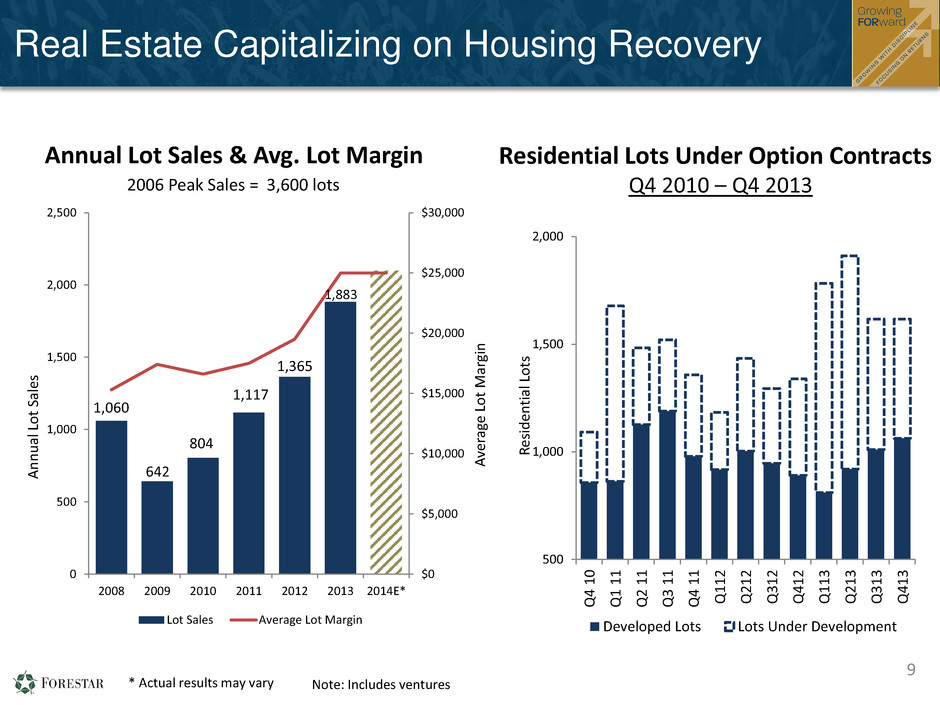
9 * Actual results may vary A n n u al Lo t Sal e s 500 1,000 1,500 2,000 Q4 1 0 Q1 1 1 Q2 1 1 Q3 1 1 Q4 1 1 Q1 1 2 Q2 1 2 Q3 1 2 Q4 1 2 Q1 1 3 Q2 1 3 Q 3 1 3 Q4 1 3 R esi d en tial Lo ts Developed Lots Lots Under Development 2006 Peak Sales = 3,600 lots Residential Lots Under Option Contracts Q4 2010 – Q4 2013 Annual Lot Sales & Avg. Lot Margin 9 Real Estate Capitalizing on Housing Recovery $0 $5,000 $10,000 $15,000 $20,000 $25,000 $30,000 0 500 1,000 1,500 2,000 2,500 2008 2009 2010 2011 2012 2013 2014E* Lot Sales Average Lot Margin 1,365 804 642 A ve ra ge Lo t M ar gi n 1,883 1,060 1,117 Note: Includes ventures
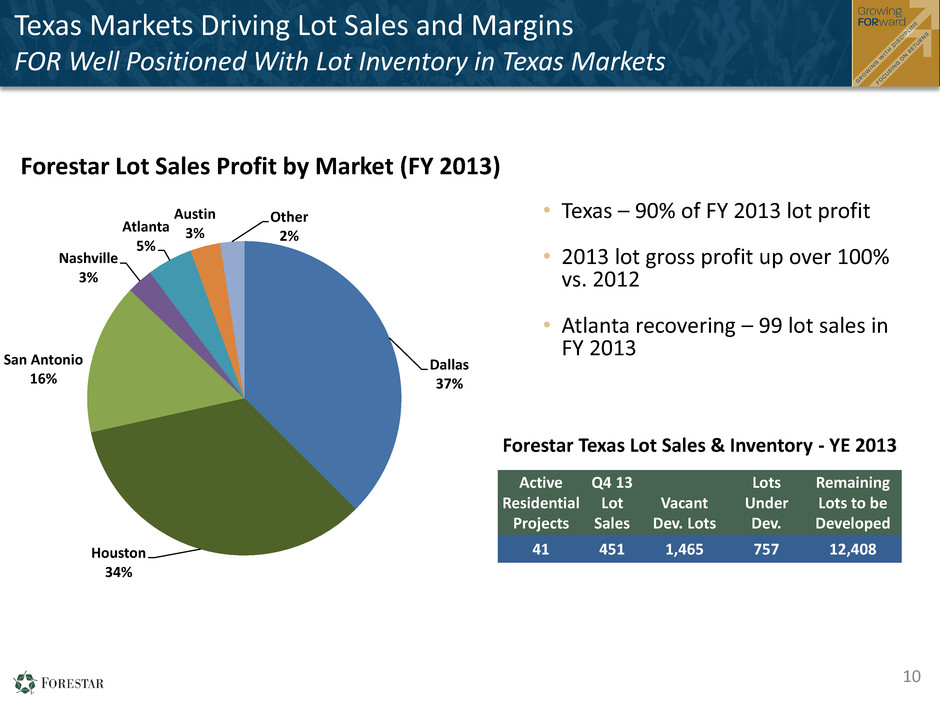
Texas Markets Driving Lot Sales and Margins FOR Well Positioned With Lot Inventory in Texas Markets 10 Active Residential Projects Q4 13 Lot Sales Vacant Dev. Lots Lots Under Dev. Remaining Lots to be Developed 41 451 1,465 757 12,408 Forestar Texas Lot Sales & Inventory - YE 2013 • Texas – 90% of FY 2013 lot profit • 2013 lot gross profit up over 100% vs. 2012 • Atlanta recovering – 99 lot sales in FY 2013 Dallas 37% Houston 34% San Antonio 16% Nashville 3% Atlanta 5% Austin 3% Other 2% Forestar Lot Sales Profit by Market (FY 2013)
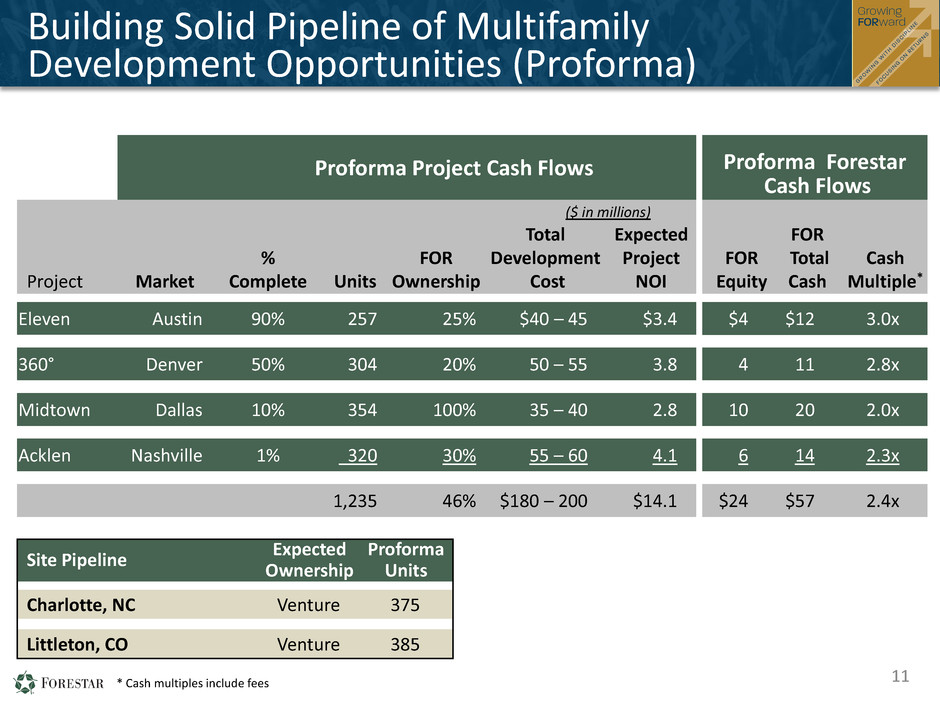
Building Solid Pipeline of Multifamily Development Opportunities (Proforma) Proforma Project Cash Flows Proforma Forestar Cash Flows Project Market % Complete Units FOR Ownership Total Development Cost Expected Project NOI FOR Equity FOR Total Cash Cash Multiple* Eleven Austin 90% 257 25% $40 – 45 $3.4 $4 $12 3.0x 360° Denver 50% 304 20% 50 – 55 3.8 4 11 2.8x Midtown Dallas 10% 354 100% 35 – 40 2.8 10 20 2.0x Acklen Nashville 1% 320 30% 55 – 60 4.1 6 14 2.3x 1,235 46% $180 – 200 $14.1 $24 $57 2.4x * Cash multiples include fees 11 Site Pipeline Expected Ownership Proforma Units Charlotte, NC Venture 375 Littleton, CO Venture 385 ($ in millions)

Real Estate Acquisitions and Investment in Development Generating Earnings & Cash Flow 12 2 Real Estate Acquisition Activity Proforma Returns ($ in millions) Capital Communities Markets Lots/Units Cash Multiple Cash Flow 2013 Acquisitions Single-Family $18.4 5 5 1,346 2.6x $47.8 Multifamily 18.5 2 2 545 2.0x 37.0 Total $36.9 7 7 1,891 2.3x $84.8 2014 Acquisitions Under Contract* Single-Family 31.2 4 4 1,133 Multifamily 33.3 4 2 935 Total $64.5 8 6 2,068 * Represents acquisition opportunities which are currently under contracts; may be subject to additional due diligence
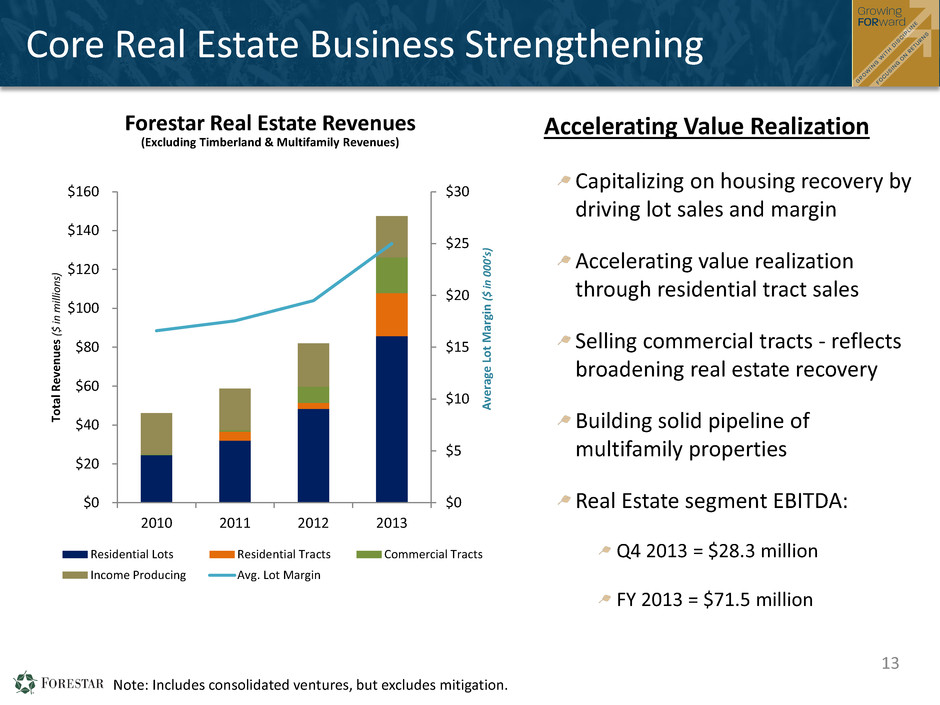
Note: Includes consolidated ventures, but excludes mitigation. Forestar Real Estate Revenues (Excluding Timberland & Multifamily Revenues) Core Real Estate Business Strengthening 13 Capitalizing on housing recovery by driving lot sales and margin Accelerating value realization through residential tract sales Selling commercial tracts - reflects broadening real estate recovery Building solid pipeline of multifamily properties Real Estate segment EBITDA: Q4 2013 = $28.3 million FY 2013 = $71.5 million Accelerating Value Realization $0 $5 $10 $15 $20 $25 $30 $0 $20 $40 $60 $80 $100 $120 $140 $160 2010 2011 2012 2013 A ve ra ge Lo t M ar gi n ( $ i n 000’ s) To tal R e ve n u e s ($ in m ill io n s) Residential Lots Residential Tracts Commercial Tracts Income Producing Avg. Lot Margin

Other Natural Resources Fourth Quarter & Full Year 2013 Highlights Building Momentum Through Sustainable Harvests and Maximizing Recreational Lease Activity 14
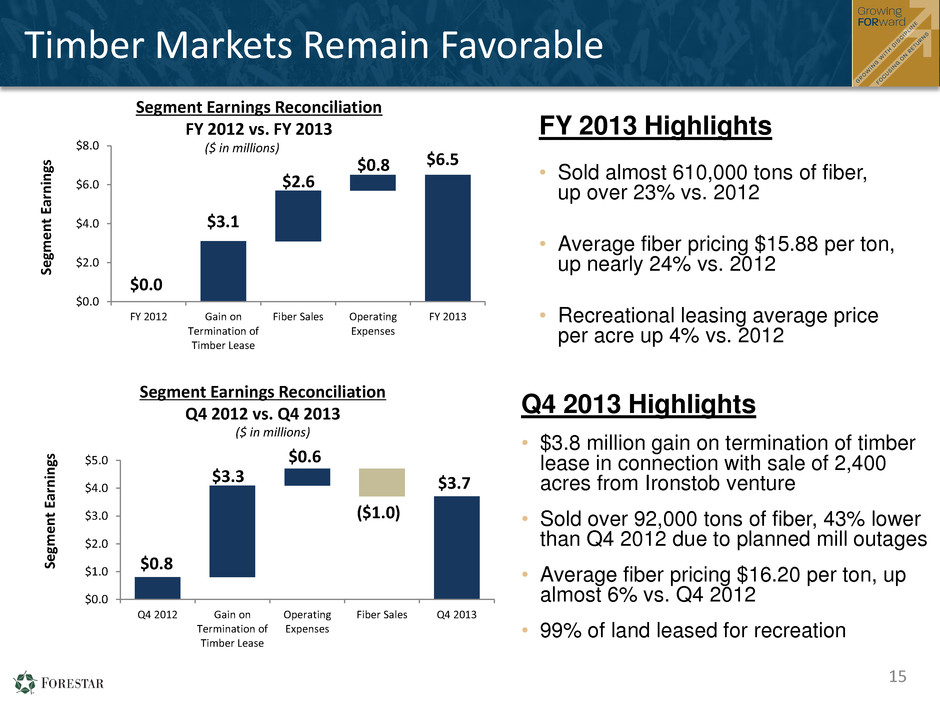
Timber Markets Remain Favorable $0.8 $0.6 ($1.0) $3.7 $3.3 $0.0 $1.0 $2.0 $3.0 $4.0 $5.0 Q4 2012 Gain on Termination of Timber Lease Operating Expenses Fiber Sales Q4 2013 Se gm en t Ea rn in gs Q4 2013 Highlights • $3.8 million gain on termination of timber lease in connection with sale of 2,400 acres from Ironstob venture • Sold over 92,000 tons of fiber, 43% lower than Q4 2012 due to planned mill outages • Average fiber pricing $16.20 per ton, up almost 6% vs. Q4 2012 • 99% of land leased for recreation ($ in millions) Segment Earnings Reconciliation Q4 2012 vs. Q4 2013 $0.0 $2.6 $0.8 $6.5 $3.1 $0.0 $2.0 $4.0 $6.0 $8.0 FY 2012 Gain on Termination of Timber Lease Fiber Sales Operating Expenses FY 2013 Se gm en t Ea rn in gs Segment Earnings Reconciliation FY 2012 vs. FY 2013 ($ in millions) FY 2013 Highlights • Sold almost 610,000 tons of fiber, up over 23% vs. 2012 • Average fiber pricing $15.88 per ton, up nearly 24% vs. 2012 • Recreational leasing average price per acre up 4% vs. 2012 15

Oil and Gas Fourth Quarter & Full Year 2013 Highlights Building Momentum By Driving Leasing and Exploration to Increase Production and Reserves 16
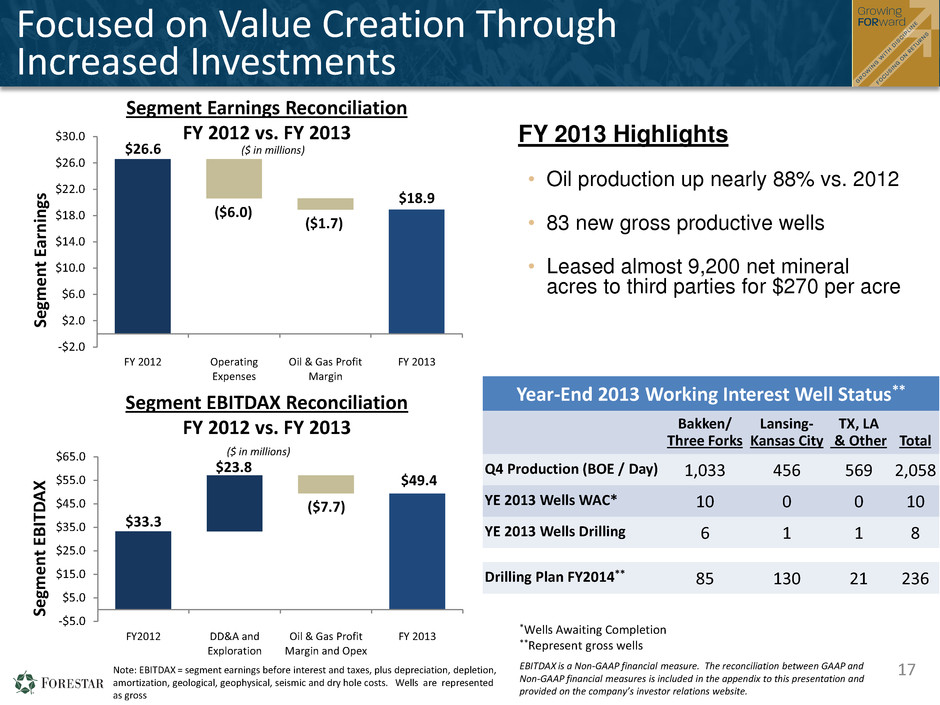
Focused on Value Creation Through Increased Investments $26.6 ($6.0) ($1.7) $18.9 -$2.0 $2.0 $6.0 $10.0 $14.0 $18.0 $22.0 $26.0 $30.0 FY 2012 Operating Expenses Oil & Gas Profit Margin FY 2013 Se gme n t Ea rn ing s FY 2013 Highlights • Oil production up nearly 88% vs. 2012 • 83 new gross productive wells • Leased almost 9,200 net mineral acres to third parties for $270 per acre ($ in millions) 17 Segment Earnings Reconciliation FY 2012 vs. FY 2013 $33.3 $23.8 ($7.7) $49.4 -$5.0 $5.0 $15.0 $25.0 $35.0 $45.0 $55.0 $65.0 FY2012 DD&A and Exploration Oil & Gas Profit Margin and Opex FY 2013 Se gme n t EBIT D A X Segment EBITDAX Reconciliation FY 2012 vs. FY 2013 ($ in millions) Note: EBITDAX = segment earnings before interest and taxes, plus depreciation, depletion, amortization, geological, geophysical, seismic and dry hole costs. Wells are represented as gross EBITDAX is a Non-GAAP financial measure. The reconciliation between GAAP and Non-GAAP financial measures is included in the appendix to this presentation and provided on the company’s investor relations website. Year-End 2013 Working Interest Well Status** Bakken/ Three Forks Lansing- Kansas City TX, LA & Other Total Q4 Production (BOE / Day) 1,033 456 569 2,058 YE 2013 Wells WAC* 10 0 0 10 YE 2013 Wells Drilling 6 1 1 8 Drilling Plan FY2014** 85 130 21 236 *Wells Awaiting Completion **Represent gross wells
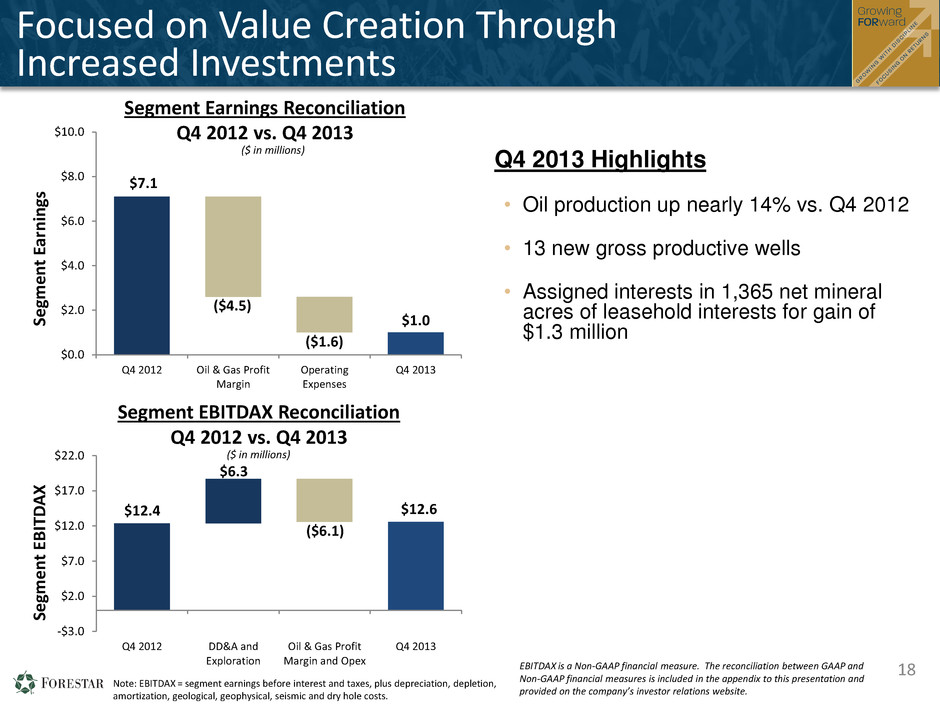
Focused on Value Creation Through Increased Investments $7.1 ($4.5) ($1.6) $1.0 $0.0 $2.0 $4.0 $6.0 $8.0 $10.0 Q4 2012 Oil & Gas Profit Margin Operating Expenses Q4 2013 Se gme n t Ea rn ing s Q4 2013 Highlights • Oil production up nearly 14% vs. Q4 2012 • 13 new gross productive wells • Assigned interests in 1,365 net mineral acres of leasehold interests for gain of $1.3 million ($ in millions) 18 Segment Earnings Reconciliation Q4 2012 vs. Q4 2013 $12.4 $6.3 ($6.1) $12.6 -$3.0 $2.0 $7.0 $12.0 $17.0 $22.0 Q4 2012 DD&A and Exploration Oil & Gas Profit Margin and Opex Q4 2013 Se gme n t EBIT D A X Segment EBITDAX Reconciliation Q4 2012 vs. Q4 2013 ($ in millions) Note: EBITDAX = segment earnings before interest and taxes, plus depreciation, depletion, amortization, geological, geophysical, seismic and dry hole costs. EBITDAX is a Non-GAAP financial measure. The reconciliation between GAAP and Non-GAAP financial measures is included in the appendix to this presentation and provided on the company’s investor relations website.

0 500 1,000 1,500 2,000 2011 2012 2013 B o e / D a y North Dakota Kansas/Nebraska Texas/Louisiana/Other Production Growth Driven by Bakken / Three Forks 19 19 Total Daily Production – Working Interests 0 500 1,000 1,500 2,000 2,500 3,000 2011 2012 2013 Boe / D ay Working Interests Royalty Total Daily Production 44% of 2013 Daily Production from Working Interests Driven by Bakken/Three Forks

20 20 0 200 400 600 800 1,000 1,200 Q1 2013 Q2 2013 Q3 2013 Q4 2013 Q1 2014E Bakken/Three Forks Production (Boe/Day) 0 50 100 150 200 2010 2011 2012 2013 2014E P ro d u ci n g W e lls Bakken/Three Forks Producing Wells Actual Wells Planned Wells +44 +25 +7 +4 +85 * Producing or capable of production at YE 2013 Bakken / Three Forks Leasehold Interests Activity Gross Wells Producers at YE 2013 * 80 Producers Added During 2013 44 Drilling & Awaiting Frac at YE 2013 16 Total Wells Planned 2014 85 2013 Drilling Activity Q1 Q2 Q3 Q4 Avg. Working Interest 4.84% 5.22% 7.03% 8.77% FOR Share of Bakken Well Economics** @500 EUR @600 EUR PV-10 $0.4 $0.7 IRR 24% 39% Bakken / Three Forks Drilling Activity Accelerating Investment and Value Realization * Producing or capable of producing at YE 2013 ** Assuming $90 oil and $3 natural gas average price over life of well. Total costs includes land, drilling and completion, LOE and production severance taxes. Note: Actual results may vary from illustrations
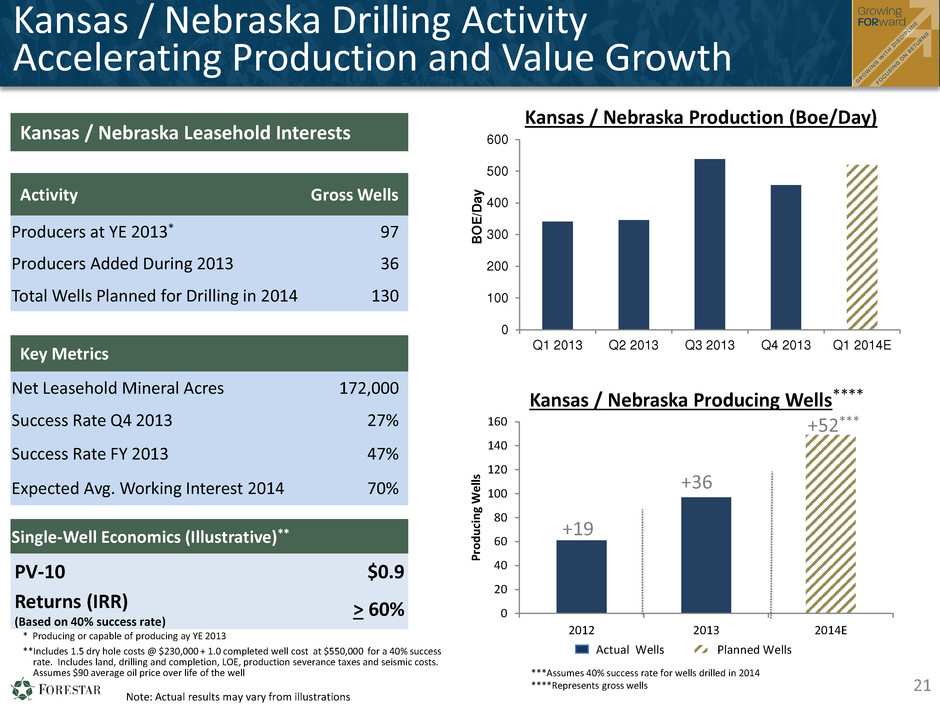
0 20 40 60 80 100 120 140 160 2012 2013 2014E P ro d u ci n g W e lls +36 +52*** Kansas / Nebraska Drilling Activity Accelerating Production and Value Growth 21 21 +19 Kansas / Nebraska Production (Boe/Day) 0 100 200 300 400 500 600 Q1 2013 Q2 2013 Q3 2013 Q4 2013 Q1 2014E B O E /Da y Kansas / Nebraska Producing Wells**** ***Assumes 40% success rate for wells drilled in 2014 ****Represents gross wells Actual Wells Planned Wells Kansas / Nebraska Leasehold Interests Activity Gross Wells Producers at YE 2013* 97 Producers Added During 2013 36 Total Wells Planned for Drilling in 2014 130 Key Metrics Net Leasehold Mineral Acres 172,000 Success Rate Q4 2013 27% Success Rate FY 2013 47% Expected Avg. Working Interest 2014 70% Single-Well Economics (Illustrative)** PV-10 $0.9 Returns (IRR) (Based on 40% success rate) > 60% * Producing or capable of producing ay YE 2013 **Includes 1.5 dry hole costs @ $230,000 + 1.0 completed well cost at $550,000 for a 40% success rate. Includes land, drilling and completion, LOE, production severance taxes and seismic costs. Assumes $90 average oil price over life of the well Note: Actual results may vary from illustrations
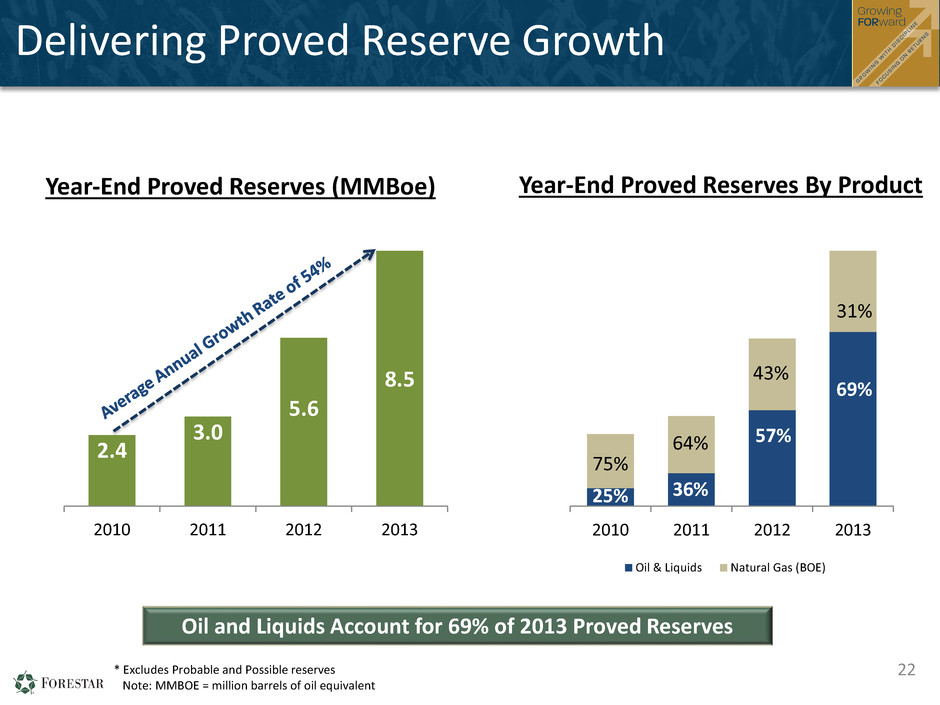
Delivering Proved Reserve Growth 22 2.4 3.0 5.6 8.5 2010 2011 2012 2013 * Excludes Probable and Possible reserves Note: MMBOE = million barrels of oil equivalent 25% 36% 57% 69% 75% 64% 43% 2010 2011 2012 2013 Oil & Liquids Natural Gas (BOE) 31% Year-End Proved Reserves By Product Oil and Liquids Account for 69% of 2013 Proved Reserves Year-End Proved Reserves (MMBoe)

Reserve Growth Driven by Bakken / Three Forks 23 Proven Reserves (MMBoe) Reserve Growth (MMBOE) Production Replaced (MMBOE) Net Reserve Increase (MMBOE) % Oil* ($ in millions) Investment 2013 8.5 4.0 1.1 2.9 69% $99 2012 5.6 3.3 0.7 2.6 57% 173** 2011 3.0 1.0 0.4 0.6 36% 4 2010 2.4 0.7 0.4 0.3 25% - * Includes natural gas liquids ** Includes $152 million associated with acquisition of Credo Petroleum Texas & Louisiana North Dakota Other Kansas & Nebraska Note: Investment includes drilling and completion, seismic and lease acquisition = = = =
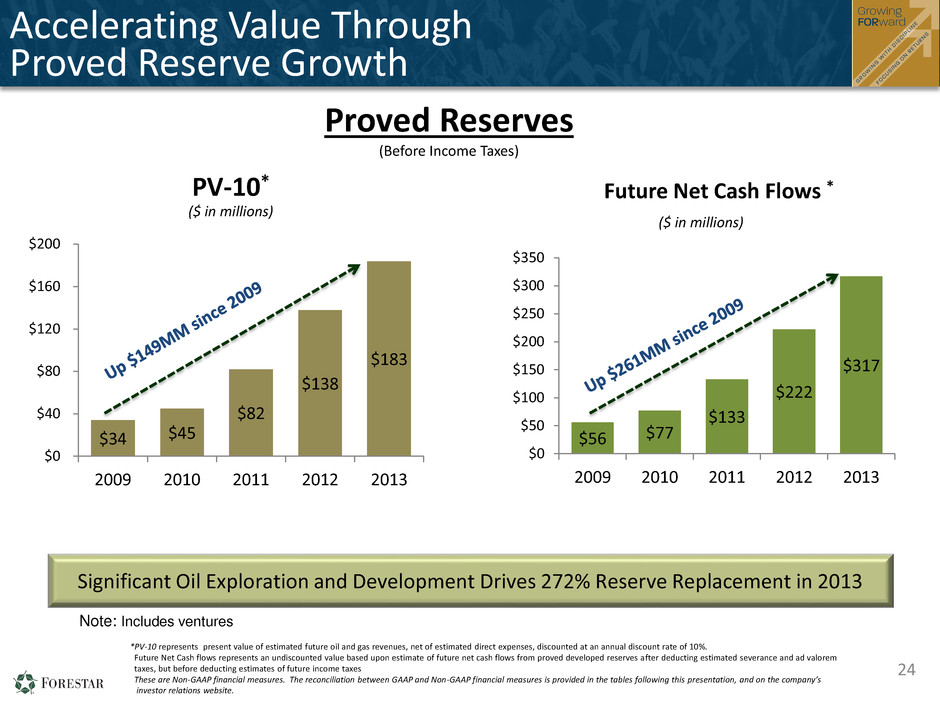
$56 $77 $133 $222 $317 $0 $50 $100 $150 $200 $250 $300 $350 2009 2010 2011 2012 2013 Accelerating Value Through Proved Reserve Growth Note: Includes ventures $34 $45 $82 $138 $183 $0 $40 $80 $120 $160 $200 2009 2010 2011 2012 2013 PV-10* ($ in millions) ($ in millions) Future Net Cash Flows * 24 *PV-10 represents present value of estimated future oil and gas revenues, net of estimated direct expenses, discounted at an annual discount rate of 10%. Future Net Cash flows represents an undiscounted value based upon estimate of future net cash flows from proved developed reserves after deducting estimated severance and ad valorem taxes, but before deducting estimates of future income taxes These are Non-GAAP financial measures. The reconciliation between GAAP and Non-GAAP financial measures is provided in the tables following this presentation, and on the company’s investor relations website. Significant Oil Exploration and Development Drives 272% Reserve Replacement in 2013 Proved Reserves (Before Income Taxes) 24
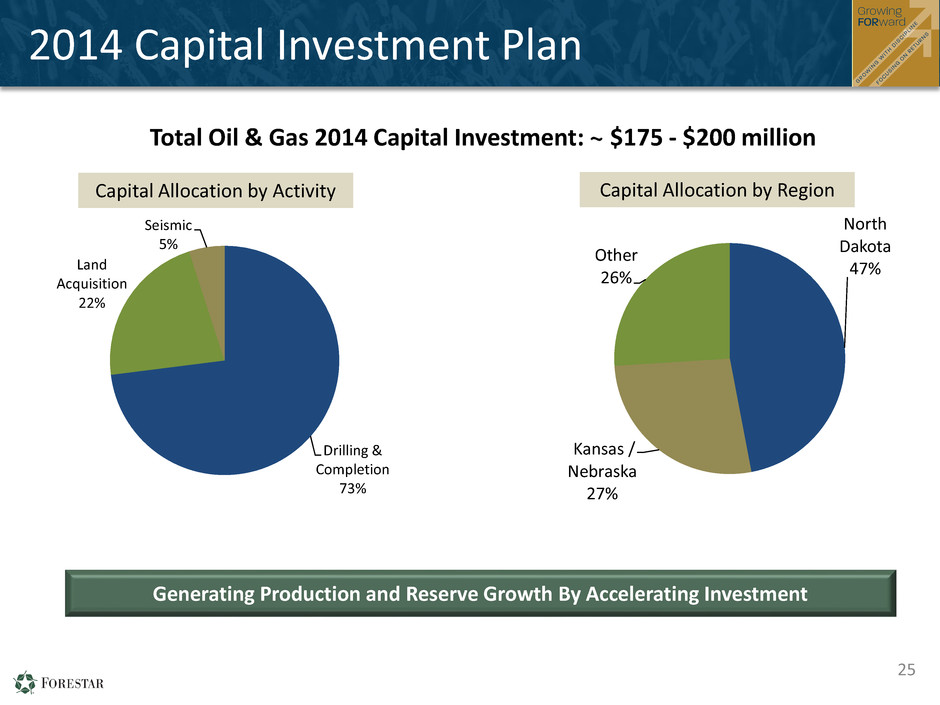
2014 Capital Investment Plan Generating Production and Reserve Growth By Accelerating Investment 25 Total Oil & Gas 2014 Capital Investment: ~ $175 - $200 million Drilling & Completion 73% Land Acquisition 22% Seismic 5% North Dakota 47% Kansas / Nebraska 27% Other 26% Capital Allocation by Activity Capital Allocation by Region
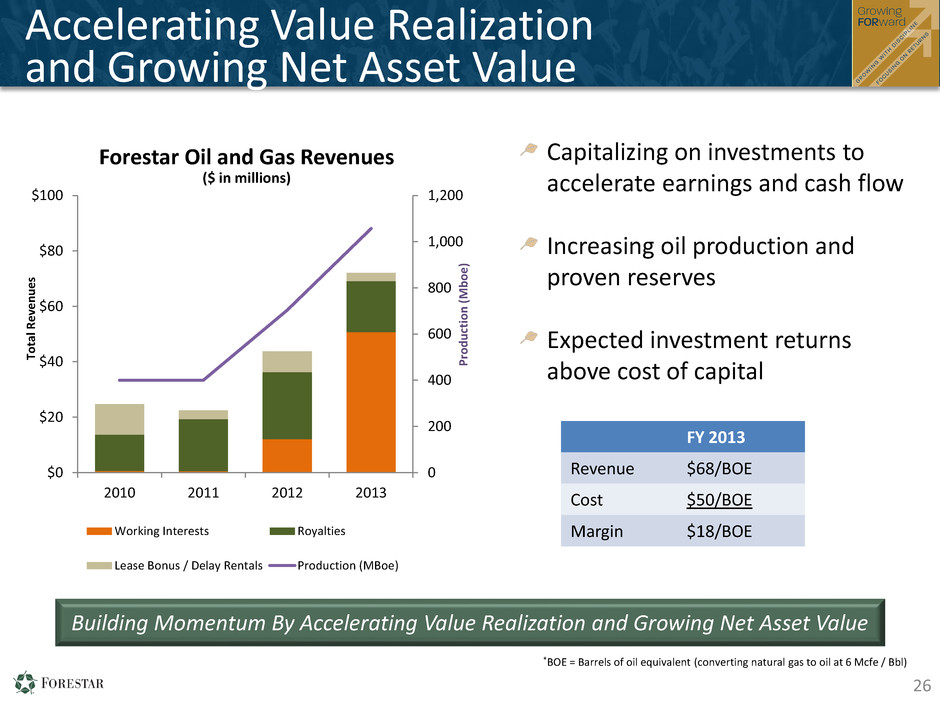
Accelerating Value Realization and Growing Net Asset Value Building Momentum By Accelerating Value Realization and Growing Net Asset Value Capitalizing on investments to accelerate earnings and cash flow Increasing oil production and proven reserves Expected investment returns above cost of capital 26 0 200 400 600 800 1,000 1,200 $0 $20 $40 $60 $80 $100 2010 2011 2012 2013 P ro d u ctio n ( M b o e ) To tal R e ve n u e s Forestar Oil and Gas Revenues ($ in millions) Working Interests Royalties Lease Bonus / Delay Rentals Production (MBoe) *BOE = Barrels of oil equivalent (converting natural gas to oil at 6 Mcfe / Bbl) FY 2013 Revenue $68/BOE Cost $50/BOE Margin $18/BOE

Strategic Initiatives Update February 13, 2014 Building Momentum By Accelerating Value Realization, Optimizing Transparency and Growing Net Asset Value 27
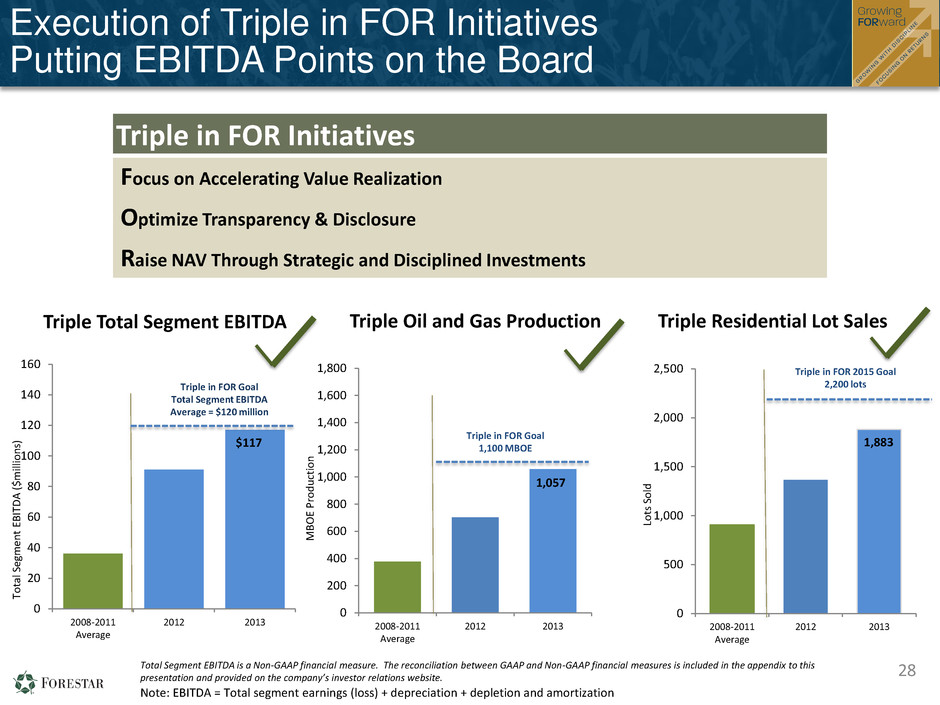
Triple in FOR Initiatives Focus on Accelerating Value Realization Optimize Transparency & Disclosure Raise NAV Through Strategic and Disciplined Investments 28 Triple Residential Lot Sales Triple Oil and Gas Production 0 500 1,000 1,500 2,000 2,500 2008-2011 Average 2012 2013 Lo ts S o ld Triple in FOR 2015 Goal 2,200 lots 0 200 400 600 800 1,000 1,200 1,400 1,600 1,800 2008-2011 Average 2012 2013 Triple in FOR Goal 1,100 MBOE 0 20 40 60 80 100 120 140 160 2008-2011 Average 2012 2013 Triple in FOR Goal Total Segment EBITDA Average = $120 million Triple Total Segment EBITDA Note: EBITDA = Total segment earnings (loss) + depreciation + depletion and amortization Total Segment EBITDA is a Non-GAAP financial measure. The reconciliation between GAAP and Non-GAAP financial measures is included in the appendix to this presentation and provided on the company’s investor relations website. Execution of Triple in FOR Initiatives Putting EBITDA Points on the Board To ta l S eg m en t EB IT D A ( $mi lli o n s) MB O E Pr o d u ct io n 1,057 $117 1,883

Establishing New Strategic Initiatives Growing Long-Term Shareholder Value Growing Through Strategic and Disciplined Investment 2014 Capital Investment = ~$400MM 2013 Capital Investment = ~$200MM Increasing Returns 2016 Target ROA =10.0% 2013 ROA = 6.1% 2008 – 2011 Avg. ROA = (0.1%)* 29 * Excludes gains from strategic timberland sales

Growing Growing Through Disciplined Investment $29 $38 2008-2011 Average 2013 2016 Target Growing Oil and Gas Segment EBITDA $72 2008-2011 Average 2013 2016 Target ($1) Growing Real Estate Segment EBITDA 30 • Real estate acquisition and development • Oil and gas exploration and development • Strategic acquisitions ($ in millions) ($ in millions) * * Excludes gains from strategic timberland sales

FORWARD Focusing on Increasing Returns $36 $117 2008-2011 Average 2013 2016 Target Accelerating Total Segment EBITDA (0.1%) 6.1% 2008-2011 Average 2013 2016 Target Increasing Return on Assets 31 2016 Targets: • Total Segment EBITDA of $200 million • Return on Assets of 10.0% • Reposition $100 Million of Non-Core Assets ($ in millions) * * Excludes gains from strategic timberland sales

Delivering Shareholder Value Through Execution of Strategic Initiatives Delivering Value Through Execution of Strategic Initiatives 2009 Strategic Initiatives • Monetize 175,000 acres of timberland and reduce debt $150 million 2012 Triple in FOR • Triple total segment EBITDA, oil and gas production and lot sales 2014 Growing Forward • Growing segment earnings through strategic and disciplined investments • Focused on increasing returns • Repositioning non-core, non-performing assets 32

Fourth Quarter & Full Year 2013 Financial Results February 13, 2014 For questions, please contact: Anna Torma SVP Corporate Affairs Forestar Group Inc. 6300 Bee Cave Road Building Two, Suite 500 Austin, TX 78746 512-433-5312 annatorma@forestargroup.com 33

Fourth Quarter & Full Year 2013 Financial Results February 13, 2014 Fourth Quarter and Full Year 2013 Appendix - Segment KPI’s - Earnings Reconciliations - Reconciliation of Non-GAAP Financial Measures - Proved Reserves 34
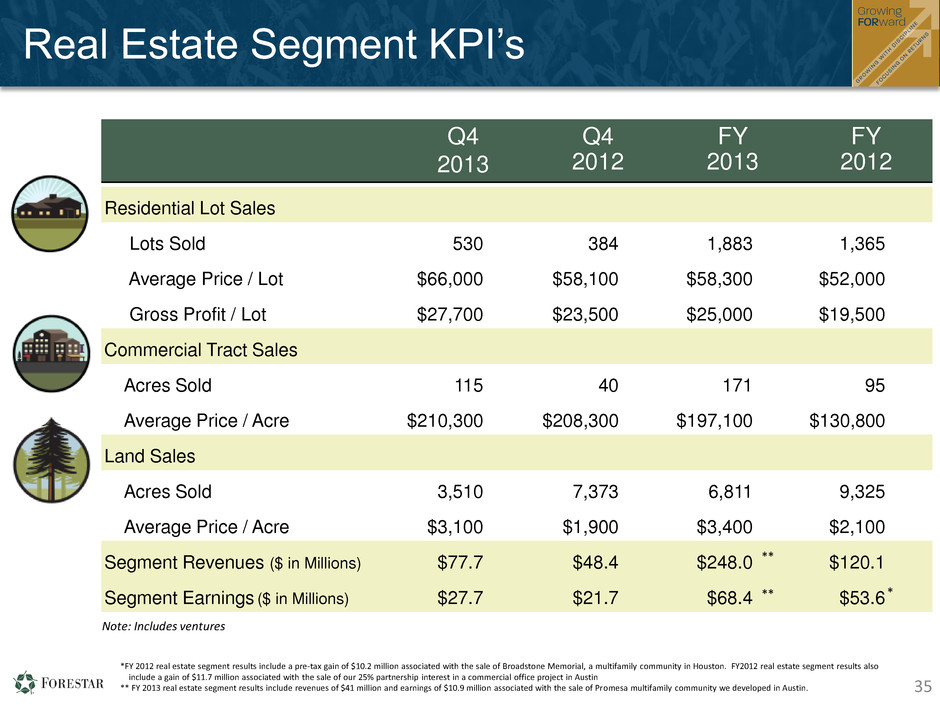
Q4 2013 Q4 2012 FY 2013 FY 2012 Residential Lot Sales Lots Sold 530 384 1,883 1,365 Average Price / Lot $66,000 $58,100 $58,300 $52,000 Gross Profit / Lot $27,700 $23,500 $25,000 $19,500 Commercial Tract Sales Acres Sold 115 40 171 95 Average Price / Acre $210,300 $208,300 $197,100 $130,800 Land Sales Acres Sold 3,510 7,373 6,811 9,325 Average Price / Acre $3,100 $1,900 $3,400 $2,100 Segment Revenues ($ in Millions) $77.7 $48.4 $248.0 $120.1 Segment Earnings ($ in Millions) $27.7 $21.7 $68.4 $53.6 *FY 2012 real estate segment results include a pre-tax gain of $10.2 million associated with the sale of Broadstone Memorial, a multifamily community in Houston. FY2012 real estate segment results also include a gain of $11.7 million associated with the sale of our 25% partnership interest in a commercial office project in Austin ** FY 2013 real estate segment results include revenues of $41 million and earnings of $10.9 million associated with the sale of Promesa multifamily community we developed in Austin. Note: Includes ventures 35 35 35 Real Estate Segment KPI’s ** ** *

Q4 2013 Q4 2012 FY 2013 FY 2012 Fee Leasing Activity Net Fee Acres Leased 828 4,981 9,183 8,910 Avg. Bonus / Acre $306 $299 $271 $597 Total Oil and Gas Interests* Oil Produced (Barrels) 195,100 171,500 697,700 371,300 Average Price / Barrel $86.51 $80.36 $89.40 $85.09 Natural Gas Produced (MMCF) 518.0 689.9 2,158.5 1,989.0 Average Price / MCF $3.61 $2.89 $3.46 $2.71 Total BOE 281,500 286,500 1,057,500 702,800 Average Price / BOE $66.62 $55.07 $66.04 $52.61 Segment Revenues ($ in Millions) $18.9 $17.2 $72.3 $44.2 Segment Earnings ($ in Millions) $1.0 $7.1 $18.9 $26.6 Producing Wells* (end of period) 1,011 936 1,011 936 * Includes our share of venture production: 58MMcf in Q4 2013, 247MMcf FY 2013, 74MMcf in Q4 2012 and 321MMcf FY 2012 36 36 Oil and Gas Segment KPI’s
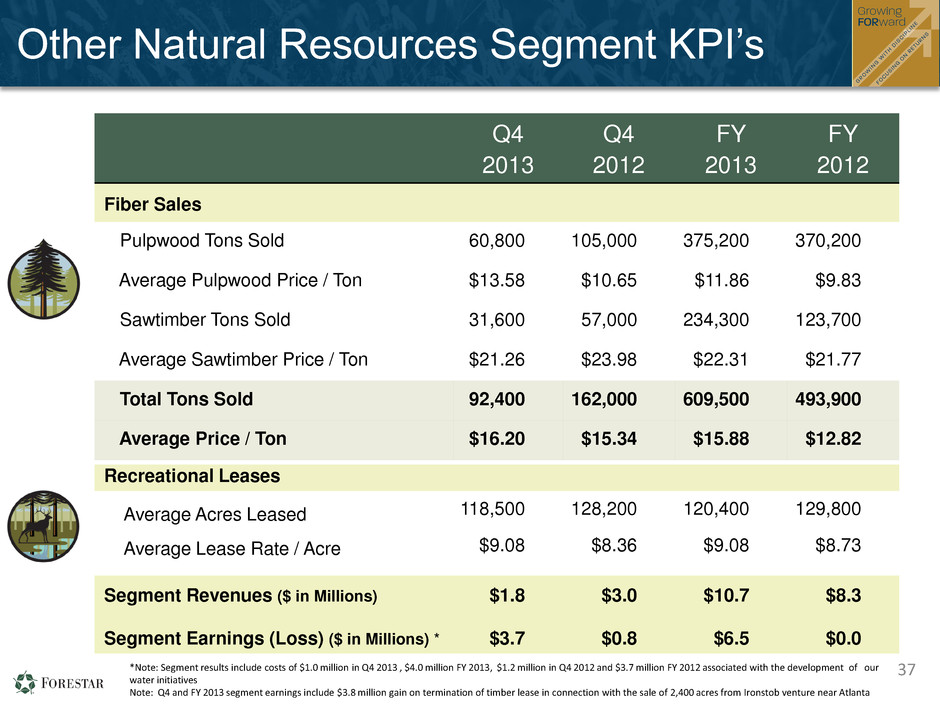
37 Q4 2013 Q4 2012 FY 2013 FY 2012 Fiber Sales Pulpwood Tons Sold 60,800 105,000 375,200 370,200 Average Pulpwood Price / Ton $13.58 $10.65 $11.86 $9.83 Sawtimber Tons Sold 31,600 57,000 234,300 123,700 Average Sawtimber Price / Ton $21.26 $23.98 $22.31 $21.77 Total Tons Sold 92,400 162,000 609,500 493,900 Average Price / Ton $16.20 $15.34 $15.88 $12.82 Recreational Leases Average Acres Leased 118,500 128,200 120,400 129,800 Average Lease Rate / Acre $9.08 $8.36 $9.08 $8.73 Segment Revenues ($ in Millions) $1.8 $3.0 $10.7 $8.3 Segment Earnings (Loss) ($ in Millions) * $3.7 $0.8 $6.5 $0.0 37 37 Other Natural Resources Segment KPI’s *Note: Segment results include costs of $1.0 million in Q4 2013 , $4.0 million FY 2013, $1.2 million in Q4 2012 and $3.7 million FY 2012 associated with the development of our water initiatives Note: Q4 and FY 2013 segment earnings include $3.8 million gain on termination of timber lease in connection with the sale of 2,400 acres from Ironstob venture near Atlanta

FY 2013 Earnings Reconciliation $12.9 $29.3 $5.7 $9.7 $4.2 $3.0 ($5.0) ($1.2) $0.0 $5.0 $10.0 $15.0 $20.0 $25.0 $30.0 $35.0 $40.0 2012 Real Estate Interest, Taxes & Other Expenses Other Natural Resources G&A Oil & Gas Share Based Comp 2013 ($ in millions) 38 $0.36 $0.26 $0.16 $0.11 ($0.14) ($0.03) $0.80 $0.00 $0.20 $0.40 $0.60 $0.80 $1.00 2012 Real Estate Interest, Taxes & Other Expenses Other Natural Resources G&A Oil & Gas Share Based Comp 2013 Net Income Per Share Reconciliation FY 2012 vs. FY 2013 Net Income Reconciliation FY 2012 vs. FY 2013 Note: 2013 weighted average diluted shares outstanding were 36.8 million • 2013 results include a previously unrecognized tax benefit of approximately $6.3 million, or $0.17 per share, related to qualified timber gains from sales in 2009. • FY 2012 results include after-tax expenses of ($7.0) million, or ($0.20) per share, associated with acquisition of CREDO Petroleum and from loss on extinguishment of debt related to amendment and extension of our term loan $0.08

Fourth Quarter 2013 Earnings Reconciliation $10.0 $13.0 $1.9 $4.0 $1.3 $0.0 ($4.0) ($0.2) $0.0 $5.0 $10.0 $15.0 $20.0 Q4 2012 Real Estate Other Natural Resources Share Based Comp G&A Oil & Gas Interest, Taxes & Other Expenses Q4 2013 ($ in millions) 39 $0.28 $0.10 $0.05 $0.03 $0.00 ($0.11) ($0.02) $0.33 $0.00 $0.10 $0.20 $0.30 $0.40 $0.50 Q4 2012 Real Estate Other Natural Resources Share Based Comp G&A Oil & Gas Interest, Taxes & Other Expenses Q4 2013 Net Income Per Share Reconciliation Q4 2012 vs. Q4 2013 Net Income Reconciliation Q4 2012 vs. Q4 2013 Note: Fourth Quarter 2013 weighted average diluted shares outstanding were 39.4 million • Fourth quarter 2012 results include after-tax expenses of approximately ($0.4 million), or ($0.01) per share, associated with the acquisition of CREDO Petroleum Corporation
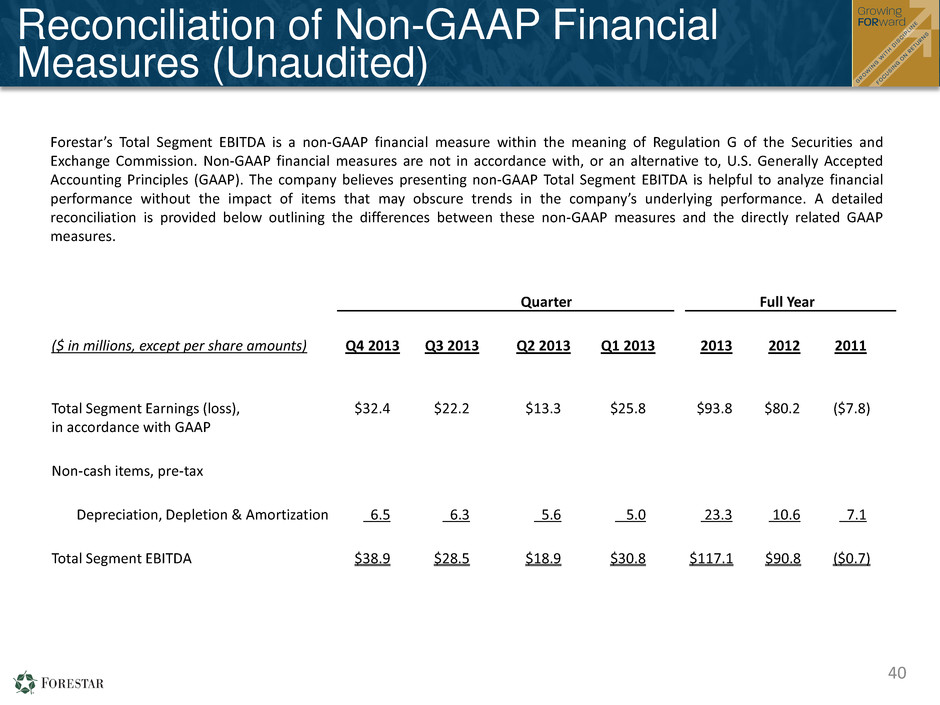
40 Forestar’s Total Segment EBITDA is a non-GAAP financial measure within the meaning of Regulation G of the Securities and Exchange Commission. Non-GAAP financial measures are not in accordance with, or an alternative to, U.S. Generally Accepted Accounting Principles (GAAP). The company believes presenting non-GAAP Total Segment EBITDA is helpful to analyze financial performance without the impact of items that may obscure trends in the company’s underlying performance. A detailed reconciliation is provided below outlining the differences between these non-GAAP measures and the directly related GAAP measures. Quarter Full Year ($ in millions, except per share amounts) Q4 2013 Q3 2013 Q2 2013 Q1 2013 2013 2012 2011 Total Segment Earnings (loss), in accordance with GAAP $32.4 $22.2 $13.3 $25.8 $93.8 $80.2 ($7.8) Non-cash items, pre-tax Depreciation, Depletion & Amortization 6.5 6.3 5.6 5.0 23.3 10.6 7.1 Total Segment EBITDA $38.9 $28.5 $18.9 $30.8 $117.1 $90.8 ($0.7) Reconciliation of Non-GAAP Financial Measures (Unaudited)
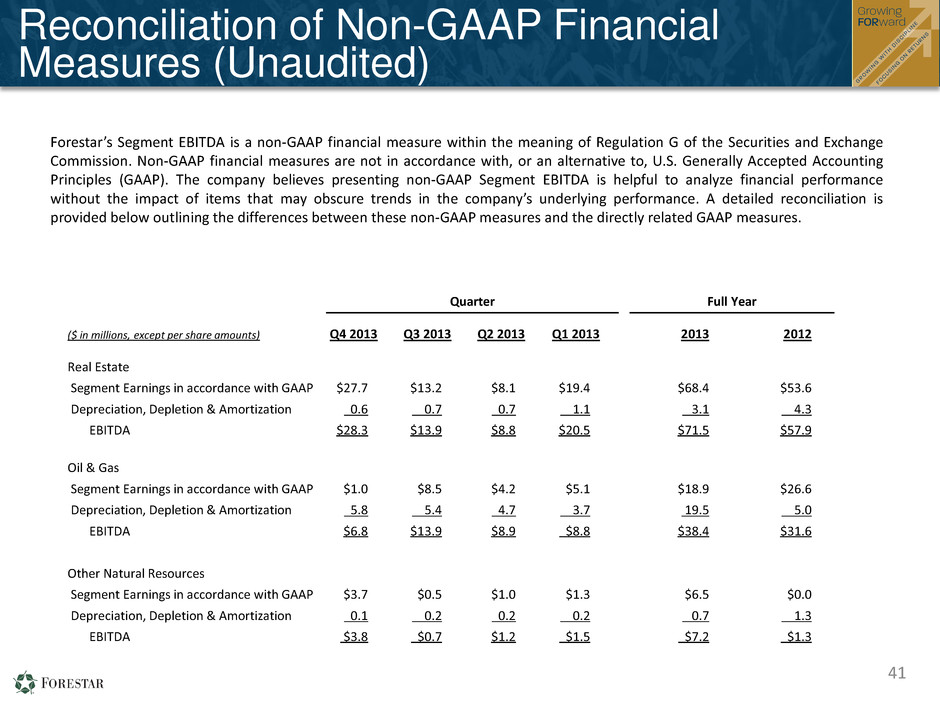
41 Forestar’s Segment EBITDA is a non-GAAP financial measure within the meaning of Regulation G of the Securities and Exchange Commission. Non-GAAP financial measures are not in accordance with, or an alternative to, U.S. Generally Accepted Accounting Principles (GAAP). The company believes presenting non-GAAP Segment EBITDA is helpful to analyze financial performance without the impact of items that may obscure trends in the company’s underlying performance. A detailed reconciliation is provided below outlining the differences between these non-GAAP measures and the directly related GAAP measures. Reconciliation of Non-GAAP Financial Measures (Unaudited) Quarter Full Year ($ in millions, except per share amounts) Q4 2013 Q3 2013 Q2 2013 Q1 2013 2013 2012 Real Estate Segment Earnings in accordance with GAAP $27.7 $13.2 $8.1 $19.4 $68.4 $53.6 Depreciation, Depletion & Amortization 0.6 0.7 0.7 1.1 3.1 4.3 EBITDA $28.3 $13.9 $8.8 $20.5 $71.5 $57.9 Oil & Gas Segment Earnings in accordance with GAAP $1.0 $8.5 $4.2 $5.1 $18.9 $26.6 Depreciation, Depletion & Amortization 5.8 5.4 4.7 3.7 19.5 5.0 EBITDA $6.8 $13.9 $8.9 $8.8 $38.4 $31.6 Other Natural Resources Segment Earnings in accordance with GAAP $3.7 $0.5 $1.0 $1.3 $6.5 $0.0 Depreciation, Depletion & Amortization 0.1 0.2 0.2 0.2 0.7 1.3 EBITDA $3.8 $0.7 $1.2 $1.5 $7.2 $1.3

42 Forestar’s Oil and Gas Segment EBITDAX is a non-GAAP financial measure within the meaning of Regulation G of the Securities and Exchange Commission. Non-GAAP financial measures are not in accordance with, or an alternative to, U.S. Generally Accepted Accounting Principles (GAAP). The company believes presenting non-GAAP Oil and Gas Segment EBITDAX is helpful to analyze financial performance without the impact of items that may obscure trends in the company’s underlying performance. A detailed reconciliation is provided below outlining the differences between these non-GAAP measures and the directly related GAAP measures. Quarter Full Year ($ in millions, except per share amounts) Q4 2013 Q4 2012 2013 2012 Oil and Gas Segment Earnings, in accordance with GAAP $1.0 $7.1 $18.9 $26.6 EBITDAX adjustments, pre-tax Depreciation, Depletion & Amortization 5.8 3.7 19.5 5.0 Geological, Geophysical, Seismic and Dry Hole Costs 5.8 1.6 11.0 1.7 Total Oil and Gas Segment EBITDAX $12.6 $12.4 $49.4 $33.3 Reconciliation of Non-GAAP Financial Measures (Unaudited)

YE 2013 Net Proved Reserves ($ in millions) 2013 2012 2011 2012-2013 % Change 2011-2012 % Change Proved Developed Producing Reserves1 Oil and NGL Reserves MBBL 3,224.6 2,105.2 1,053.7 53% 100% Gas Reserves BCF 13.3 12.2 11.4 9% 7% Future Net Revenues* $222.6 $162.2 $132.7 37% 22% PV-10 3* $140.5 $103.8 $81.0 35% 28% Proved Developed Non-Producing Reserves1 Oil and NGL Reserves MBBL 668.7 311.4 10.7 115% nm Gas Reserves BCF 0.5 0.8 0.1 (38%) nm Future Net Revenues* $35.6 $24.8 $1.0 44% nm PV-10 3* $22.2 $17.2 $0.9 29% nm Proved Undeveloped Reserves1 Oil and NGL Reserves MBBL 1,931.0 803.8 ----- 140% N/A Gas Reserves BCF 2.2 1.3 ----- 69% N/A Future Net Revenues* $58.3 $35.1 ----- 66% N/A PV-10 3* $20.0 $16.6 ----- 20% N/A Total Proved Reserves1 Oil and NGL Reserves MBBL 5,824.5 3,220.4 1,064.4 81% 203% Gas Reserves BCF 16.0 14.3 11.5 12% 24% Reserves MMBoe2 8,484.8 5,602.7 2,978.7 51% 88% Future Net Revenues* $316.5 $222.2 $133.7 42% 66% PV-10 3* $182.8 $137.7 $81.9 33% 68% Note: PV-10 analysis based on 2013 average benchmark prices of $91.45 for oil and $2.98 for natural gas, compared with 2012 average benchmark prices of $89.26 for oil and $3.00 for natural gas compared with 2011 average benchmark prices of $92.71 for oil and $4.12 for natural gas. 1 Includes Forestar’s share of equity method ventures 2 Boe – Barrel of Oil Equivalent (converting oil to natural gas at 6 Mcf / Bbl) 3 PV-10 – Present Value at 10% (before income taxes) *These are Non-GAAP financial measures. The reconciliation between GAAP and Non-GAAP financial measures is provided in the tables following this presentation, and on the company’s investor relations website. 43
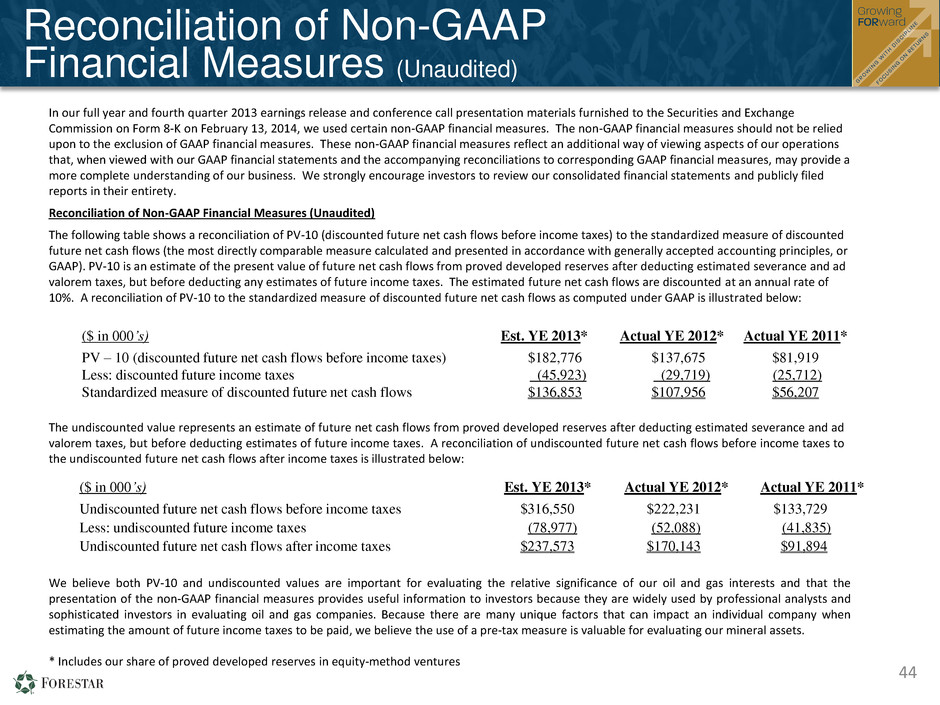
($ in 000’s) Est. YE 2013* Actual YE 2012* Actual YE 2011* Undiscounted future net cash flows before income taxes $316,550 $222,231 $133,729 Less: undiscounted future income taxes (78,977) (52,088) (41,835) Undiscounted future net cash flows after income taxes $237,573 $170,143 $91,894 Reconciliation of Non-GAAP Financial Measures (Unaudited) In our full year and fourth quarter 2013 earnings release and conference call presentation materials furnished to the Securities and Exchange Commission on Form 8-K on February 13, 2014, we used certain non-GAAP financial measures. The non-GAAP financial measures should not be relied upon to the exclusion of GAAP financial measures. These non-GAAP financial measures reflect an additional way of viewing aspects of our operations that, when viewed with our GAAP financial statements and the accompanying reconciliations to corresponding GAAP financial measures, may provide a more complete understanding of our business. We strongly encourage investors to review our consolidated financial statements and publicly filed reports in their entirety. Reconciliation of Non-GAAP Financial Measures (Unaudited) The following table shows a reconciliation of PV-10 (discounted future net cash flows before income taxes) to the standardized measure of discounted future net cash flows (the most directly comparable measure calculated and presented in accordance with generally accepted accounting principles, or GAAP). PV-10 is an estimate of the present value of future net cash flows from proved developed reserves after deducting estimated severance and ad valorem taxes, but before deducting any estimates of future income taxes. The estimated future net cash flows are discounted at an annual rate of 10%. A reconciliation of PV-10 to the standardized measure of discounted future net cash flows as computed under GAAP is illustrated below: ($ in 000’s) Est. YE 2013* Actual YE 2012* Actual YE 2011* PV – 10 (discounted future net cash flows before income taxes) $182,776 $137,675 $81,919 Less: discounted future income taxes (45,923) (29,719) (25,712) Standardized measure of discounted future net cash flows $136,853 $107,956 $56,207 The undiscounted value represents an estimate of future net cash flows from proved developed reserves after deducting estimated severance and ad valorem taxes, but before deducting estimates of future income taxes. A reconciliation of undiscounted future net cash flows before income taxes to the undiscounted future net cash flows after income taxes is illustrated below: We believe both PV-10 and undiscounted values are important for evaluating the relative significance of our oil and gas interests and that the presentation of the non-GAAP financial measures provides useful information to investors because they are widely used by professional analysts and sophisticated investors in evaluating oil and gas companies. Because there are many unique factors that can impact an individual company when estimating the amount of future income taxes to be paid, we believe the use of a pre-tax measure is valuable for evaluating our mineral assets. * Includes our share of proved developed reserves in equity-method ventures 44

Fourth Quarter & Full Year 2013 Financial Results February 13, 2014 For questions, please contact: Anna Torma SVP Corporate Affairs Forestar Group Inc. 6300 Bee Cave Road Building Two, Suite 500 Austin, TX 78746 512-433-5312 annatorma@forestargroup.com 45


