Second Quarter 2015 Financial Results August 5, 2015
Notice to Investors This presentation contains “forward-looking statements” within the meaning of the federal securities laws. Forward-looking statements are typically identified by words or phrases such as “will,” “anticipate,” “estimate,” “expect,” “project,” “intend,” “plan,” “believe,” “target,” “forecast,” and other words and terms of similar meaning. These statements reflect management’s current views with respect to future events and are subject to risk and uncertainties. We note that a variety of factors and uncertainties could cause our actual results to differ significantly from the results discussed in the forward-looking statements, including but not limited to: general economic, market, or business conditions; changes in commodity prices; opportunities (or lack thereof) that may be presented to us and that we may pursue; fluctuations in costs and expenses including development costs; demand for new housing, including impacts from mortgage credit rates or availability; lengthy and uncertain entitlement processes; cyclicality of our businesses; accuracy of accounting assumptions; competitive actions by other companies; changes in laws or regulations; and other factors, many of which are beyond our control. Except as required by law, we expressly disclaim any obligation to publicly revise any forward-looking statements contained in this presentation to reflect the occurrence of events after the date of this presentation. This presentation includes Non-GAAP financial measures. The required reconciliation to GAAP financial measures can be found as an exhibit to this presentation and on our website at www.forestargroup.com. 2
Focused On Increasing Net Asset Value By Growing Core Real Estate Business and Executing Strategic Initiatives 3 • Strategic and Disciplined Investment in Residential and Mixed-Use Communities • Developing Portfolio of Core Multifamily Properties That Generate Recurring Cash Flow • Harvesting Cash Flow From Oil and Gas Business By Significantly Lowering Capital Expenditures and Operating Costs • Transitioning Timberland Into Real Estate Properties Focused On Maintaining Balance Sheet Strength and Solid Growth Platform To Maximize Shareholder Value
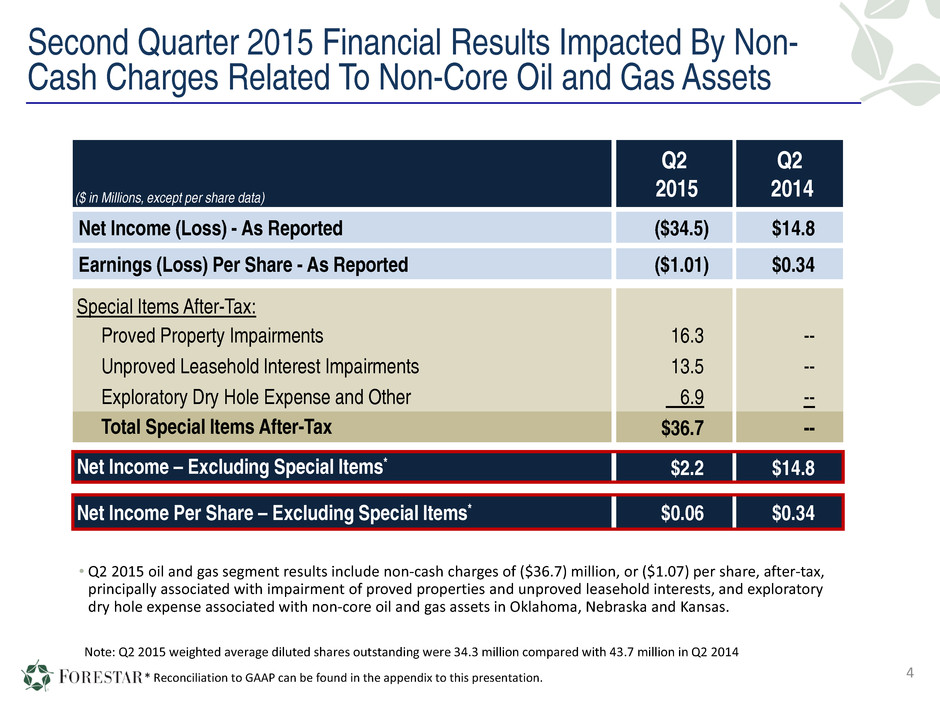
Second Quarter 2015 Financial Results Impacted By Non- Cash Charges Related To Non-Core Oil and Gas Assets 4 ($ in Millions, except per share data) Q2 2015 Q2 2014 Net Income (Loss) - As Reported ($34.5) $14.8 Earnings (Loss) Per Share - As Reported ($1.01) $0.34 Special Items After-Tax: Proved Property Impairments 16.3 -- Unproved Leasehold Interest Impairments 13.5 -- Exploratory Dry Hole Expense and Other 6.9 -- Total Special Items After-Tax $36.7 -- Net Income – Excluding Special Items* $2.2 $14.8 Net Income Per Share – Excluding Special Items* $0.06 $0.34 • Q2 2015 oil and gas segment results include non-cash charges of ($36.7) million, or ($1.07) per share, after-tax, principally associated with impairment of proved properties and unproved leasehold interests, and exploratory dry hole expense associated with non-core oil and gas assets in Oklahoma, Nebraska and Kansas. Note: Q2 2015 weighted average diluted shares outstanding were 34.3 million compared with 43.7 million in Q2 2014 * Reconciliation to GAAP can be found in the appendix to this presentation.

Oil and Gas Segment Results Adversely Impacted By Non- Cash Charges Related to Non-Core Assets 5 ($ in Millions, except per share data) Q2 2015 As Reported Q2 2015 Excluding Special Items* Q2 2014 As Reported Segment Earnings (Loss) Real Estate $15.5 $15.5 $27.3 Oil and Gas (56.9) (0.4) 9.5 Other Natural Resources (0.0) (0.0) 2.1 Total Segment Earnings (Loss) ($41.4) $15.1 $38.9 • Q2 2014 real estate segment results include a $10.5 million gain associated with a non-monetary exchange of leasehold timber rights for 5,400 acres of undeveloped land from the Ironstob venture. • Q2 2015 oil and gas segment results include non-cash charges of approximately ($57) million, pre-tax, principally associated with ($25) million in impairment of proved properties, ($21) million related to impairment of unproved leasehold interests, and approximately ($11) million principally associated with exploratory dry hole costs associated with non-core oil and gas assets in Oklahoma, Nebraska and Kansas. • Q2 2014 other natural resources segment results include earnings of $0.7 million associated with a groundwater reservation agreement and a $0.7 million gain on termination of a timber lease in connection with land sales from the Ironstob venture. * Reconciliation to GAAP can be found in the appendix to this presentation.
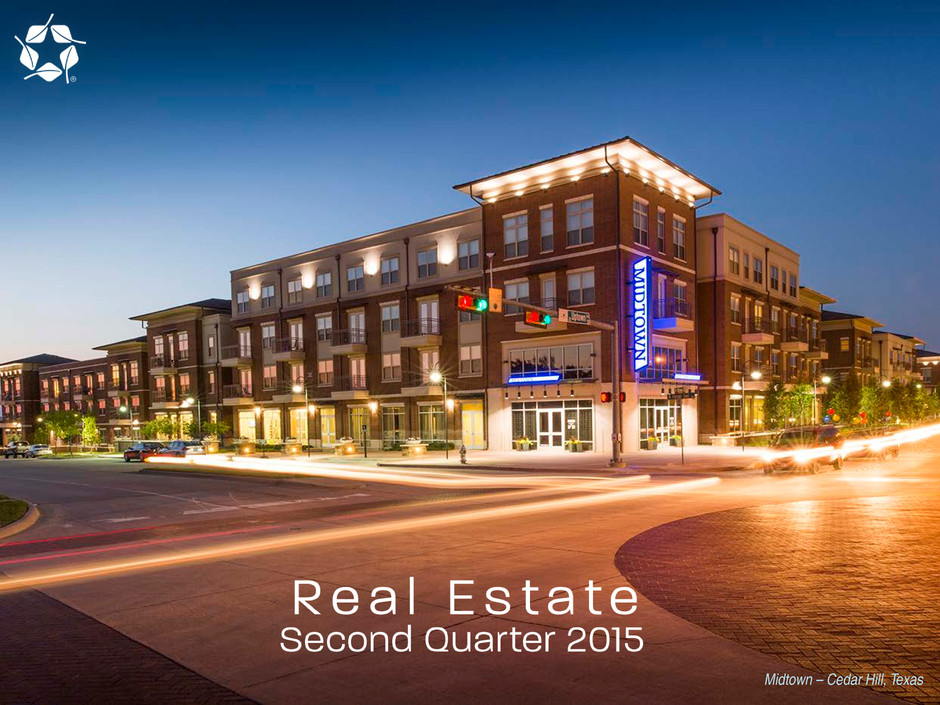
Midtown – Cedar Hill, Texas
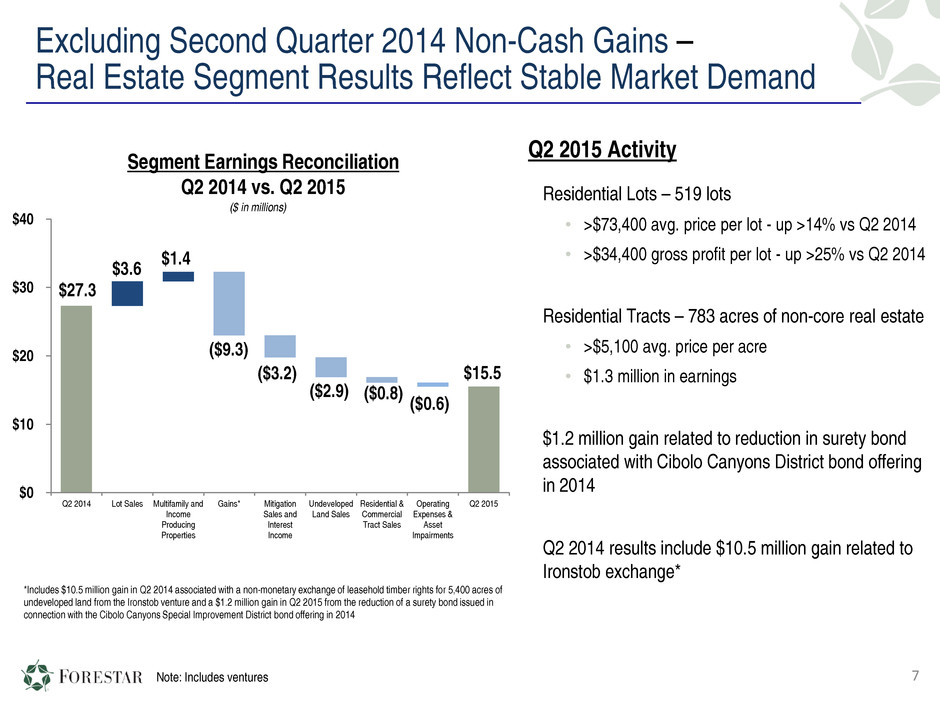
Excluding Second Quarter 2014 Non-Cash Gains – Real Estate Segment Results Reflect Stable Market Demand ($3.2) ($2.9) $27.3 $3.6 $1.4 ($9.3) ($0.8) ($0.6) $15.5 $0 $10 $20 $30 $40 Q2 2014 Lot Sales Multifamily and Income Producing Properties Gains* Mitigation Sales and Interest Income Undeveloped Land Sales Residential & Commercial Tract Sales Operating Expenses & Asset Impairments Q2 2015 Segment Earnings Reconciliation Q2 2014 vs. Q2 2015 ($ in millions) Q2 2015 Activity Residential Lots – 519 lots • >$73,400 avg. price per lot - up >14% vs Q2 2014 • >$34,400 gross profit per lot - up >25% vs Q2 2014 Residential Tracts – 783 acres of non-core real estate • >$5,100 avg. price per acre • $1.3 million in earnings $1.2 million gain related to reduction in surety bond associated with Cibolo Canyons District bond offering in 2014 Q2 2014 results include $10.5 million gain related to Ironstob exchange* 7Note: Includes ventures *Includes $10.5 million gain in Q2 2014 associated with a non-monetary exchange of leasehold timber rights for 5,400 acres of undeveloped land from the Ironstob venture and a $1.2 million gain in Q2 2015 from the reduction of a surety bond issued in connection with the Cibolo Canyons Special Improvement District bond offering in 2014
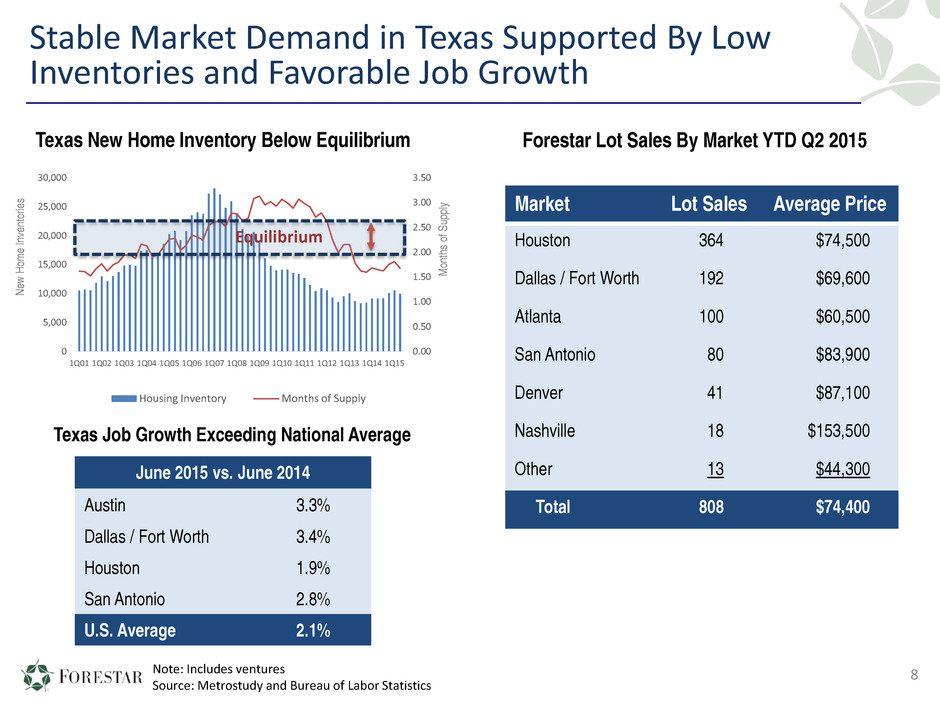
Stable Market Demand in Texas Supported By Low Inventories and Favorable Job Growth 8 Texas New Home Inventory Below Equilibrium 0.00 0.50 1.00 1.50 2.00 2.50 3.00 3.50 0 5,000 10,000 15,000 20,000 25,000 30,000 1Q01 1Q02 1Q03 1Q04 1Q05 1Q06 1Q07 1Q08 1Q09 1Q10 1Q11 1Q12 1Q13 1Q14 1Q15 Housing Inventory Months of Supply Equilibrium M on th s of S up pl y Ne w Ho m e In ve nt or ie s Note: Includes ventures Source: Metrostudy and Bureau of Labor Statistics Texas Job Growth Exceeding National Average June 2015 vs. June 2014 Austin 3.3% Dallas / Fort Worth 3.4% Houston 1.9% San Antonio 2.8% U.S. Average 2.1% Market Lot Sales Average Price Houston 364 $74,500 Dallas / Fort Worth 192 $69,600 Atlanta 100 $60,500 San Antonio 80 $83,900 Denver 41 $87,100 Nashville 18 $153,500 Other 13 $44,300 Total 808 $74,400 Forestar Lot Sales By Market YTD Q2 2015
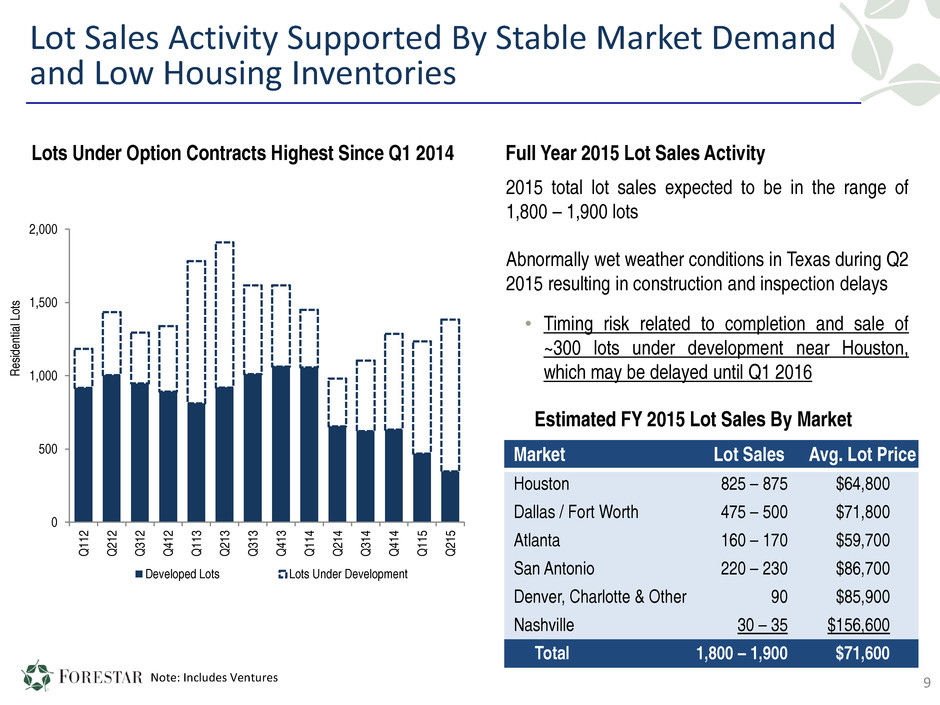
9Note: Includes Ventures Lots Under Option Contracts Highest Since Q1 2014 0 500 1,000 1,500 2,000 Q 11 2 Q 21 2 Q 31 2 Q 41 2 Q 11 3 Q 21 3 Q 31 3 Q 41 3 Q 11 4 Q 21 4 Q 31 4 Q 41 4 Q 11 5 Q 21 5 Re sid en tia l L ot s Developed Lots Lots Under Development 2015 total lot sales expected to be in the range of 1,800 – 1,900 lots Abnormally wet weather conditions in Texas during Q2 2015 resulting in construction and inspection delays • Timing risk related to completion and sale of ~300 lots under development near Houston, which may be delayed until Q1 2016 Full Year 2015 Lot Sales Activity Lot Sales Activity Supported By Stable Market Demand and Low Housing Inventories Estimated FY 2015 Lot Sales By Market Market Lot Sales Avg. Lot Price Houston 825 – 875 $64,800 Dallas / Fort Worth 475 – 500 $71,800 Atlanta 160 – 170 $59,700 San Antonio 220 – 230 $86,700 Denver, Charlotte & Other 90 $85,900 Nashville 30 – 35 $156,600 Total 1,800 – 1,900 $71,600
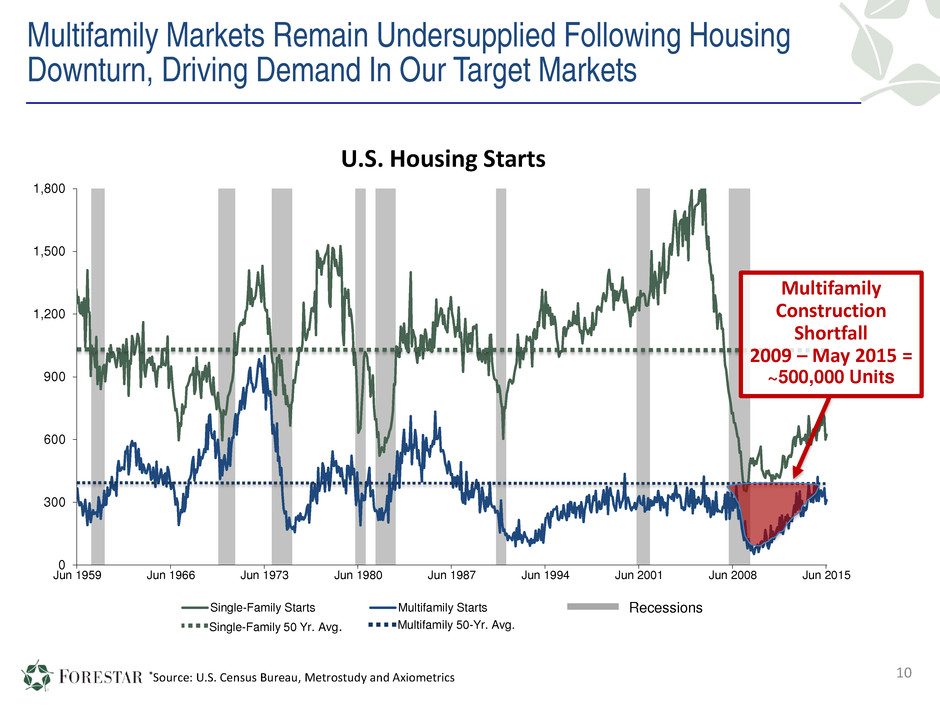
Multifamily Markets Remain Undersupplied Following Housing Downturn, Driving Demand In Our Target Markets 10 0 300 600 900 1,200 1,500 1,800 Jun 1959 Jun 1966 Jun 1973 Jun 1980 Jun 1987 Jun 1994 Jun 2001 Jun 2008 Jun 2015 Single-Family Starts Multifamily Starts U.S. Housing Starts Recessions Multifamily Construction Shortfall 2009 – May 2015 = ~500,000 Units *Source: U.S. Census Bureau, Metrostudy and Axiometrics Single-Family 50 Yr. Avg. Multifamily 50-Yr. Avg.
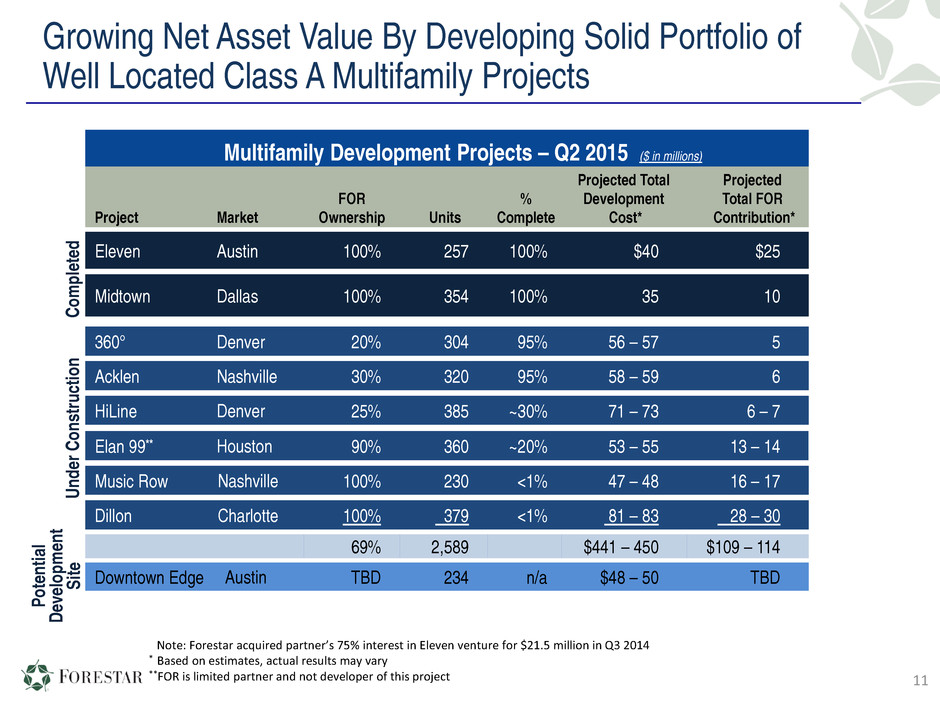
Growing Net Asset Value By Developing Solid Portfolio of Well Located Class A Multifamily Projects Multifamily Development Projects – Q2 2015 ($ in millions) Project Market FOR Ownership Units % Complete Projected Total Development Cost* Projected Total FOR Contribution* Co m pl et ed Eleven Austin 100% 257 100% $40 $25 Midtown Dallas 100% 354 100% 35 10 Un de r C on st ru ct io n 360° Denver 20% 304 95% 56 – 57 5 Acklen Nashville 30% 320 95% 58 – 59 6 HiLine Denver 25% 385 ~30% 71 – 73 6 – 7 Elan 99** Houston 90% 360 ~20% 53 – 55 13 – 14 Music Row Nashville 100% 230 <1% 47 – 48 16 – 17 Dillon Charlotte 100% 379 <1% 81 – 83 28 – 30 69% 2,589 $441 – 450 $109 – 114 Downtown Edge Austin TBD 234 n/a $48 – 50 TBD Note: Forestar acquired partner’s 75% interest in Eleven venture for $21.5 million in Q3 2014 * Based on estimates, actual results may vary **FOR is limited partner and not developer of this project 11 Po te nt ia l De ve lo pm en t Si te
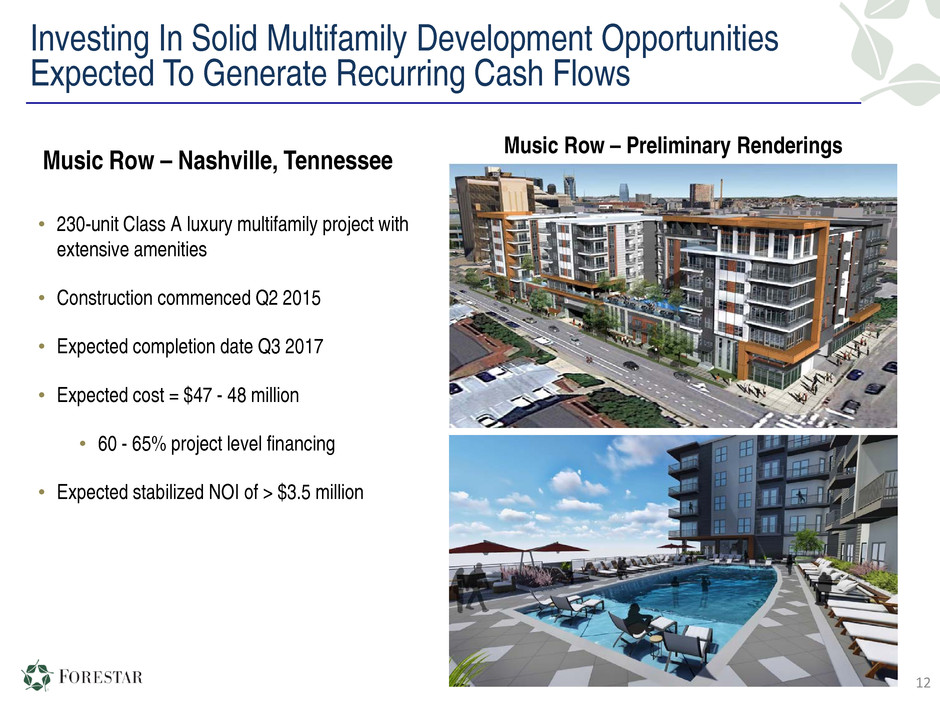
Investing In Solid Multifamily Development Opportunities Expected To Generate Recurring Cash Flows 12 Music Row – Nashville, Tennessee • 230-unit Class A luxury multifamily project with extensive amenities • Construction commenced Q2 2015 • Expected completion date Q3 2017 • Expected cost = $47 - 48 million • 60 - 65% project level financing • Expected stabilized NOI of > $3.5 million Music Row – Preliminary Renderings
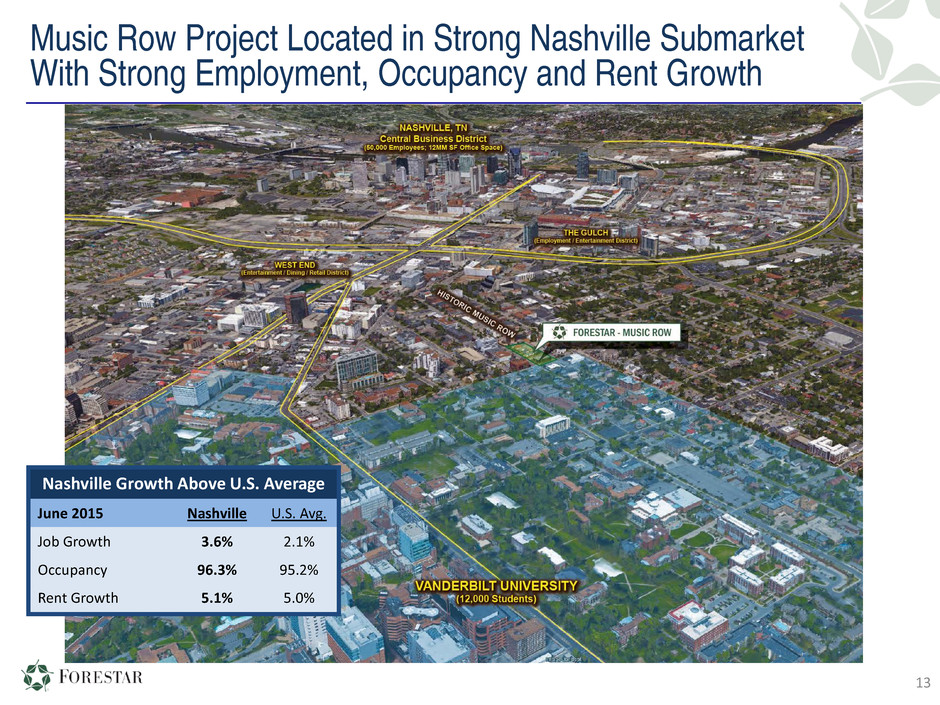
Music Row Project Located in Strong Nashville Submarket With Strong Employment, Occupancy and Rent Growth 13 Nashville Growth Above U.S. Average June 2015 Nashville U.S. Avg. Job Growth 3.6% 2.1% Occupancy 96.3% 95.2% Rent Growth 5.1% 5.0%
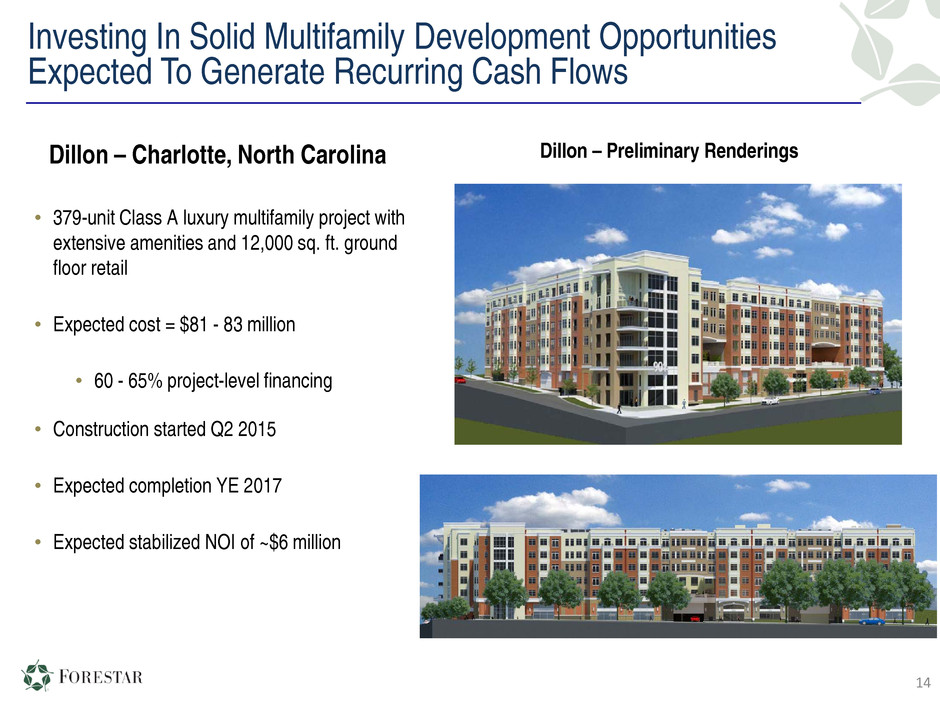
Investing In Solid Multifamily Development Opportunities Expected To Generate Recurring Cash Flows 14 Dillon – Charlotte, North Carolina • 379-unit Class A luxury multifamily project with extensive amenities and 12,000 sq. ft. ground floor retail • Expected cost = $81 - 83 million • 60 - 65% project-level financing • Construction started Q2 2015 • Expected completion YE 2017 • Expected stabilized NOI of ~$6 million Dillon – Preliminary Renderings
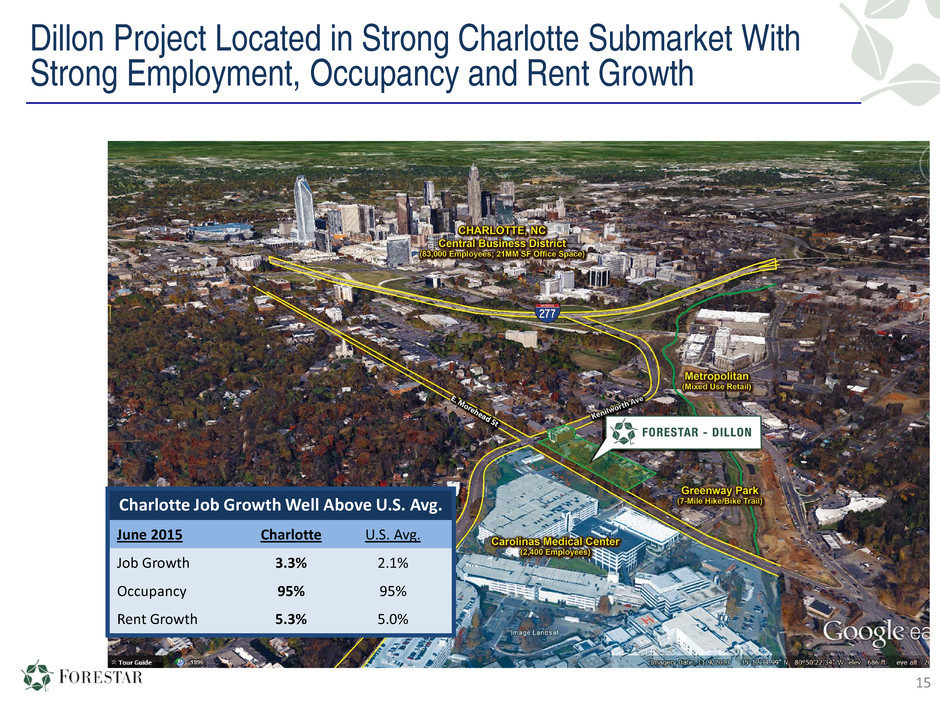
15 Charlotte Job Growth Well Above U.S. Avg. June 2015 Charlotte U.S. Avg. Job Growth 3.3% 2.1% Occupancy 95% 95% Rent Growth 5.3% 5.0% Dillon Project Located in Strong Charlotte Submarket With Strong Employment, Occupancy and Rent Growth
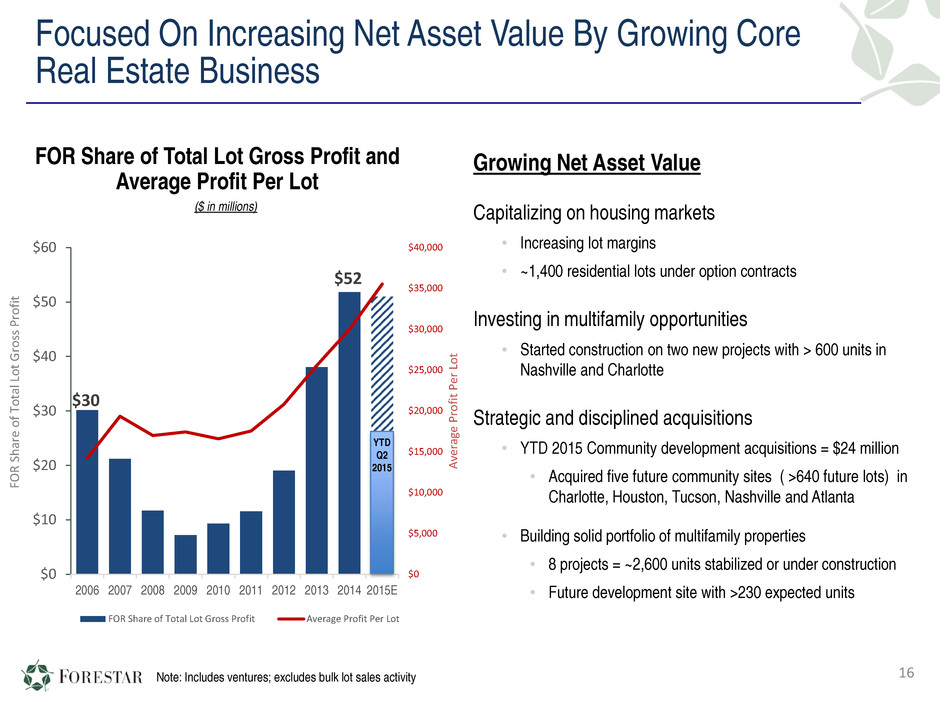
Focused On Increasing Net Asset Value By Growing Core Real Estate Business Growing Net Asset Value Capitalizing on housing markets • Increasing lot margins • ~1,400 residential lots under option contracts Investing in multifamily opportunities • Started construction on two new projects with > 600 units in Nashville and Charlotte Strategic and disciplined acquisitions • YTD 2015 Community development acquisitions = $24 million • Acquired five future community sites ( >640 future lots) in Charlotte, Houston, Tucson, Nashville and Atlanta • Building solid portfolio of multifamily properties • 8 projects = ~2,600 units stabilized or under construction • Future development site with >230 expected units 16 FOR Share of Total Lot Gross Profit and Average Profit Per Lot Note: Includes ventures; excludes bulk lot sales activity $30 $52 $0 $5,000 $10,000 $15,000 $20,000 $25,000 $30,000 $35,000 $40,000 $0 $10 $20 $30 $40 $50 $60 2006 2007 2008 2009 2010 2011 2012 2013 2014 2015E FOR Share of Total Lot Gross Profit Average Profit Per Lot ($ in millions) YTD Q2 2015 FO R Sh ar e of T ot al L ot G ro ss P ro fit A ve ra ge P ro fit P er L ot
East Texas
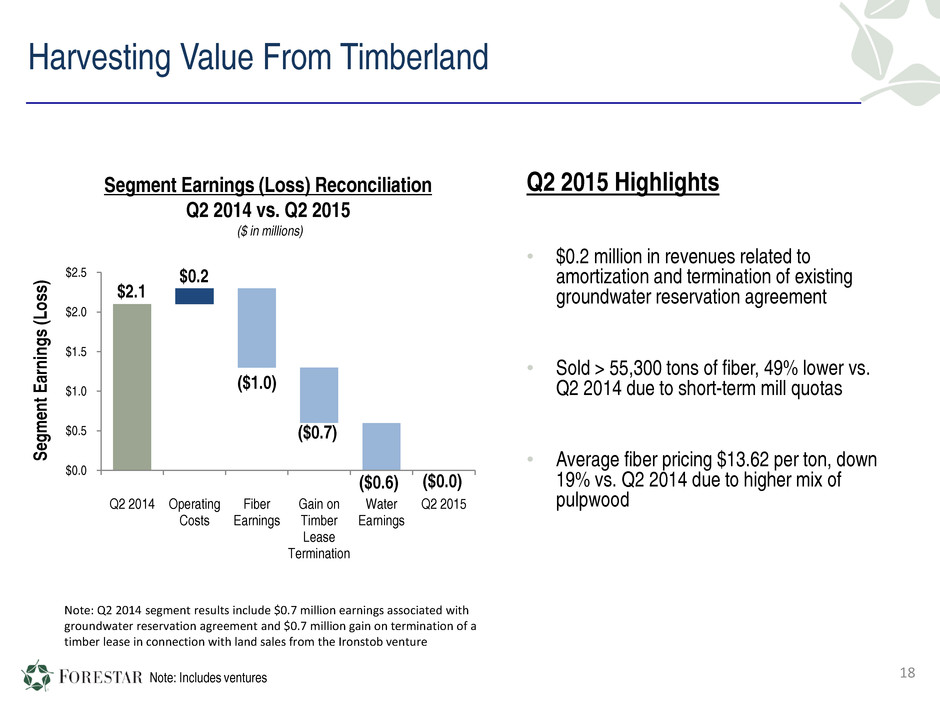
Harvesting Value From Timberland Segment Earnings (Loss) Reconciliation Q2 2014 vs. Q2 2015 ($ in millions) $2.1 ($1.0) ($0.7) ($0.6) $0.2 ($0.0) $0.0 $0.5 $1.0 $1.5 $2.0 $2.5 Q2 2014 Operating Costs Fiber Earnings Gain on Timber Lease Termination Water Earnings Q2 2015 Se gm en t E ar ni ng s (L os s) Q2 2015 Highlights • $0.2 million in revenues related to amortization and termination of existing groundwater reservation agreement • Sold > 55,300 tons of fiber, 49% lower vs. Q2 2014 due to short-term mill quotas • Average fiber pricing $13.62 per ton, down 19% vs. Q2 2014 due to higher mix of pulpwood 18Note: Includes ventures Note: Q2 2014 segment results include $0.7 million earnings associated with groundwater reservation agreement and $0.7 million gain on termination of a timber lease in connection with land sales from the Ironstob venture

Bakken / Three Forks - North Dakota
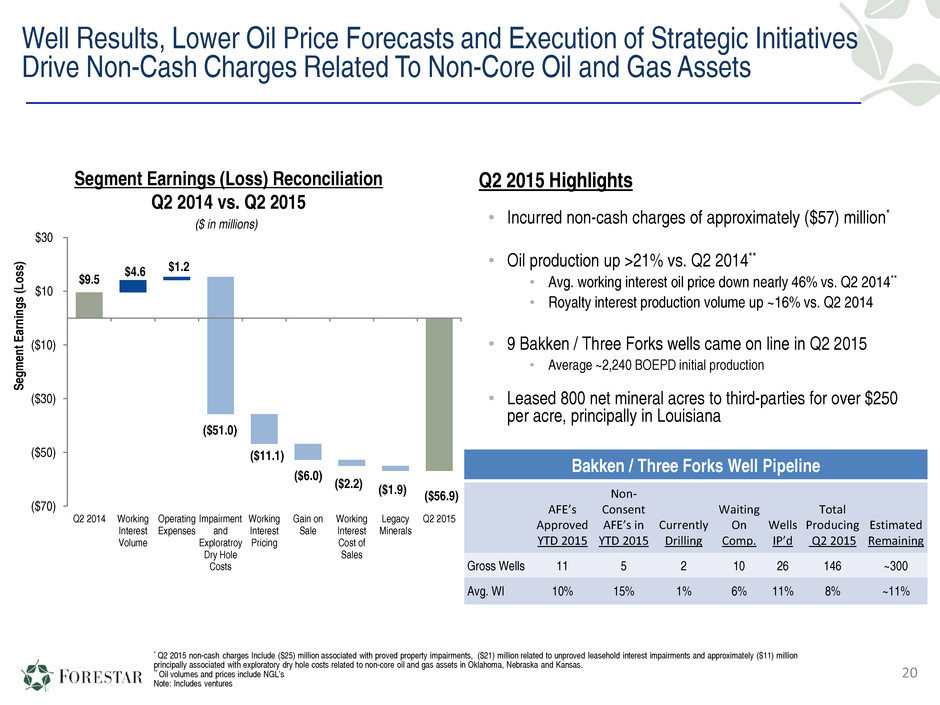
Well Results, Lower Oil Price Forecasts and Execution of Strategic Initiatives Drive Non-Cash Charges Related To Non-Core Oil and Gas Assets $9.5 ($51.0) $1.2 ($2.2) ($1.9) ($11.1) ($56.9) ($70) ($50) ($30) ($10) $10 $30 Q2 2014 Working Interest Volume Operating Expenses Impairment and Exploratroy Dry Hole Costs Working Interest Pricing Gain on Sale Working Interest Cost of Sales Legacy Minerals Q2 2015 Se gm en t E ar ni ng s (L os s) ($6.0) $4.6 Segment Earnings (Loss) Reconciliation Q2 2014 vs. Q2 2015 ($ in millions) Q2 2015 Highlights • Incurred non-cash charges of approximately ($57) million* • Oil production up >21% vs. Q2 2014** • Avg. working interest oil price down nearly 46% vs. Q2 2014** • Royalty interest production volume up ~16% vs. Q2 2014 • 9 Bakken / Three Forks wells came on line in Q2 2015 • Average ~2,240 BOEPD initial production • Leased 800 net mineral acres to third-parties for over $250 per acre, principally in Louisiana 20 * Q2 2015 non-cash charges Include ($25) million associated with proved property impairments, ($21) million related to unproved leasehold interest impairments and approximately ($11) million principally associated with exploratory dry hole costs related to non-core oil and gas assets in Oklahoma, Nebraska and Kansas. ** Oil volumes and prices include NGL’s Note: Includes ventures Bakken / Three Forks Well Pipeline AFE’s Approved YTD 2015 Non- Consent AFE’s in YTD 2015 Currently Drilling Waiting On Comp. Wells IP’d Total Producing Q2 2015 Estimated Remaining Gross Wells 11 5 2 10 26 146 ~300 Avg. WI 10% 15% 1% 6% 11% 8% ~11%
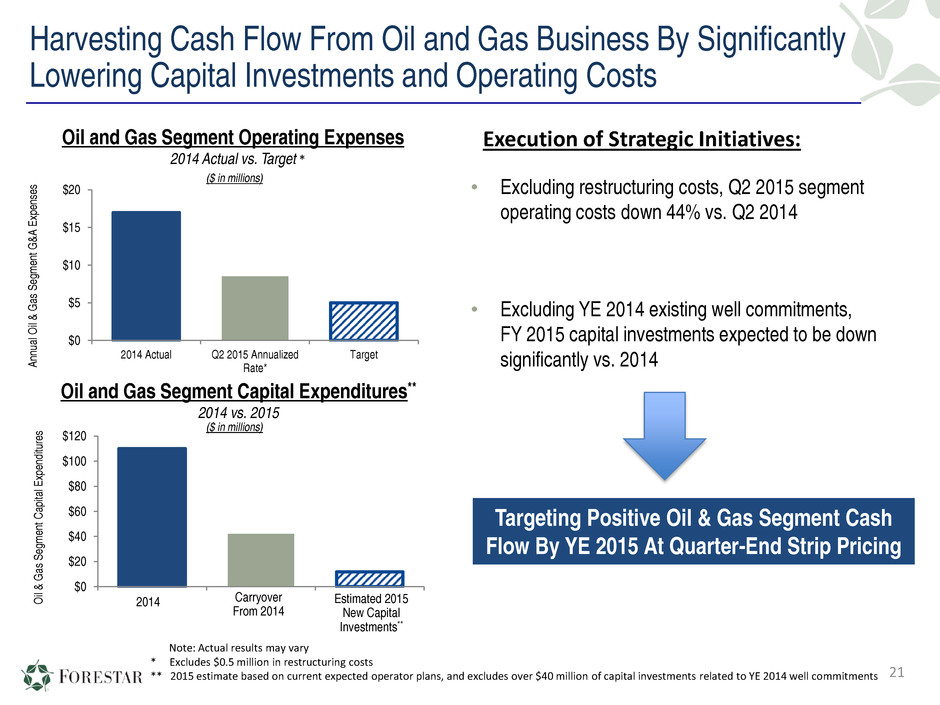
Harvesting Cash Flow From Oil and Gas Business By Significantly Lowering Capital Investments and Operating Costs Execution of Strategic Initiatives: 21 Note: Actual results may vary * Excludes $0.5 million in restructuring costs ** 2015 estimate based on current expected operator plans, and excludes over $40 million of capital investments related to YE 2014 well commitments $0 $5 $10 $15 $20 2014 Actual Q2 2015 Annualized Rate* Target An nu al O il & G as S eg m en t G &A E xp en se s Oil and Gas Segment Operating Expenses 2014 Actual vs. Target • Excluding restructuring costs, Q2 2015 segment operating costs down 44% vs. Q2 2014 • Excluding YE 2014 existing well commitments, FY 2015 capital investments expected to be down significantly vs. 2014 ($ in millions) $0 $20 $40 $60 $80 $100 $120 O il & G as S eg m en t C ap ita l E xp en di tu re s Oil and Gas Segment Capital Expenditures** 2014 vs. 2015 Estimated 2015 New Capital Investments** Carryover From 2014 2014 ($ in millions) * Targeting Positive Oil & Gas Segment Cash Flow By YE 2015 At Quarter-End Strip Pricing

Strategic Initiatives Update 22
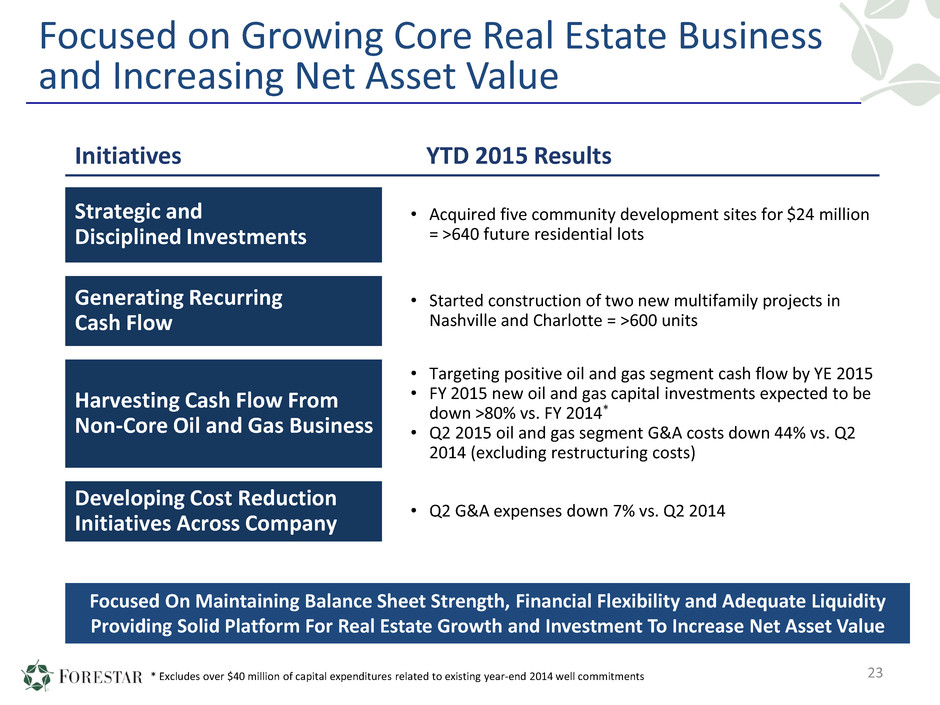
Initiatives YTD 2015 Results Strategic and Disciplined Investments • Acquired five community development sites for $24 million = >640 future residential lots Generating Recurring Cash Flow • Started construction of two new multifamily projects in Nashville and Charlotte = >600 units Harvesting Cash Flow From Non-Core Oil and Gas Business • Targeting positive oil and gas segment cash flow by YE 2015 • FY 2015 new oil and gas capital investments expected to be down >80% vs. FY 2014* • Q2 2015 oil and gas segment G&A costs down 44% vs. Q2 2014 (excluding restructuring costs) Developing Cost Reduction Initiatives Across Company • Q2 G&A expenses down 7% vs. Q2 2014 Focused on Growing Core Real Estate Business and Increasing Net Asset Value 23 Focused On Maintaining Balance Sheet Strength, Financial Flexibility and Adequate Liquidity Providing Solid Platform For Real Estate Growth and Investment To Increase Net Asset Value * Excludes over $40 million of capital expenditures related to existing year-end 2014 well commitments
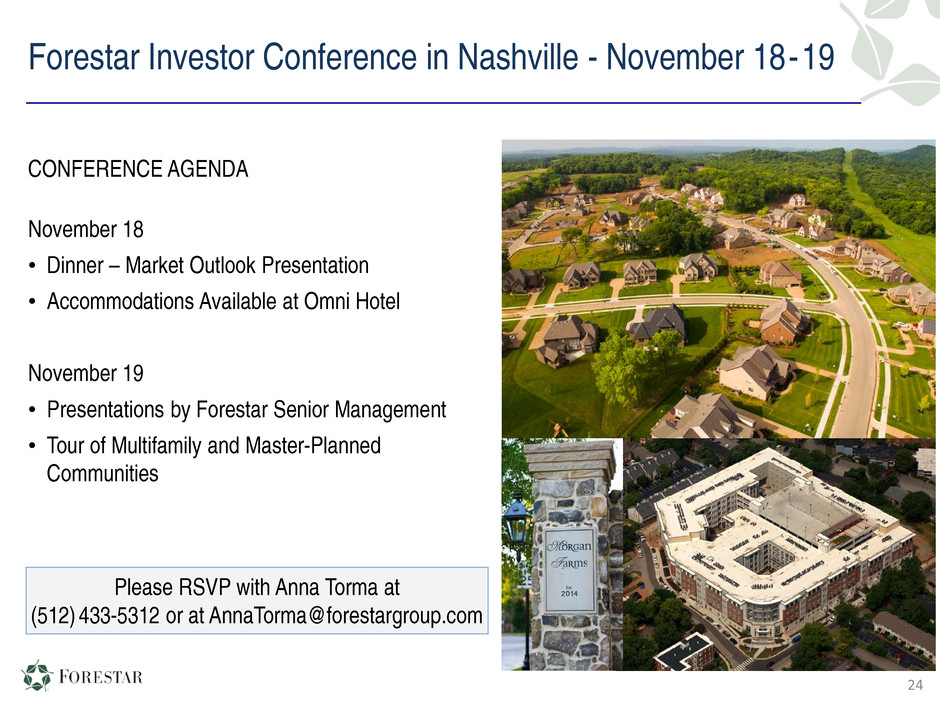
Forestar Investor Conference in Nashville - November 18-19 24 CONFERENCE AGENDA November 18 • Dinner – Market Outlook Presentation • Accommodations Available at Omni Hotel November 19 • Presentations by Forestar Senior Management • Tour of Multifamily and Master-Planned Communities Please RSVP with Anna Torma at (512) 433-5312 or at AnnaTorma@forestargroup.com

25
26
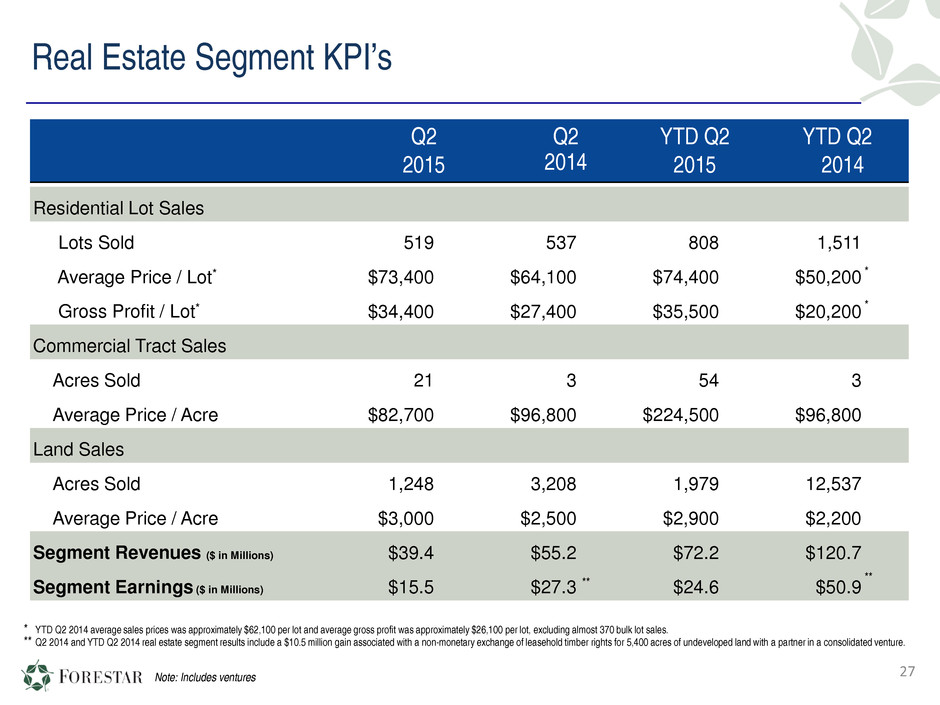
Real Estate Segment KPI’s Q2 2015 Q2 2014 YTD Q2 2015 YTD Q2 2014 Residential Lot Sales Lots Sold 519 537 808 1,511 Average Price / Lot* $73,400 $64,100 $74,400 $50,200 Gross Profit / Lot* $34,400 $27,400 $35,500 $20,200 Commercial Tract Sales Acres Sold 21 3 54 3 Average Price / Acre $82,700 $96,800 $224,500 $96,800 Land Sales Acres Sold 1,248 3,208 1,979 12,537 Average Price / Acre $3,000 $2,500 $2,900 $2,200 Segment Revenues ($ in Millions) $39.4 $55.2 $72.2 $120.7 Segment Earnings ($ in Millions) $15.5 $27.3 $24.6 $50.9 YTD Q2 2014 average sales prices was approximately $62,100 per lot and average gross profit was approximately $26,100 per lot, excluding almost 370 bulk lot sales. Q2 2014 and YTD Q2 2014 real estate segment results include a $10.5 million gain associated with a non-monetary exchange of leasehold timber rights for 5,400 acres of undeveloped land with a partner in a consolidated venture. Note: Includes ventures 27 **** ** * * *

Other Natural Resources Segment KPI’s Q2 2015 Q1 2014 YTD Q2 2015 YTD Q2 2014 Fiber Sales Pulpwood Tons Sold 36,000 58,200 63,500 86,400 Average Pulpwood Price / Ton $9.39 $11.42 $9.06 $10.85 Sawtimber Tons Sold 19,300 49,600 39,400 78,500 Average Sawtimber Price / Ton $21.54 $23.23 $21.52 $22.67 Total Tons Sold 55,300 107,800 102,900 164,900 Average Price / Ton $13.62 $16.86 $13.83 $16.48 Recreational Leases Average Acres Leased 100,100 110,000 101,300 113,200 Average Lease Rate / Acre $9.34 $9.69 $9.30 $9.41 Segment Revenues ($ in Millions) $1.9 $3.5 $3.6 $5.0 Segment Earnings (Loss) ($ in Millions) * ($0.0) $2.1 ($0.4) $1.6 * Note: Segment results include costs of $0.7 million in Q2 2015, $0.8 million in Q2 2014, $1.7 million in YTD Q2 2015 and $2.0 million in YTD Q2 2014 associated with the development of our water initiatives. ** Q2 2014 and YTD Q2 2014 results include earnings of $0.7 million associated with a groundwater reservation agreement and a $0.7 million gain on termination ofatimber lease in connection with theIronstob venture 28 ** **

Oil and Gas Segment KPI’s Q2 2015 ** Q2 2014 YTD Q2 2015 ** YTD Q2 2014 Fee Leasing Activity Net Fee Acres Leased 800 1,380 1,623 3,121 Average Bonus / Acre $254 $352 $297 $347 Total Oil and Gas Interests * Oil Produced (Barrels) 262,000 225,300 531,900 382,300 Average Price / Barrel $53.37 $95.38 $46.68 $93.75 NGL Produced (Barrels) 27,200 12,000 50,900 27,000 Average Price / Barrel $17.54 $43.24 $18.35 $43.17 Natural Gas Produced (MMCF) 559.0 459.9 1,079.4 946.4 Average Price / MCF $2.65 $4.50 $2.91 $4.43 Total BOE 382,300 313,900 762,700 567,000 Average Price / BOE $41.70 $76.70 $37.89 $72.66 Segment Revenues ($ in Millions) $16.2 $24.4 $29.4 $41.9 Segment Earnings (Loss) ($ in Millions) * ($56.9) $9.5 ($59.8) $10.3 Gross Producing Wells (end of period) 942 948 942 948 29 * Includes our share of venture production: 40.1 MMcf in Q2 2015, 50.5 MMcf in Q2 2014, 82.4 MMcf in YTD Q2 2015 and 103.2 MMcf in YTD Q2 2014. ** Q2 2015 oil and gas segment results include approximately $57 million in non-cash charges principally related to impairment of proved properties and leasehold interests, and dry hole expense associated with non-core oil and gas assets in Oklahoma, Nebraska and Kansas. YTD Q2 2015 oil and gas segment results also include $3.3 million in restructuring costs associated with termination of Fort Worth office lease, retention bonus awards and employee severance costs and $0.9 million in gains associated with the sale of approximately 17,168 net acres of oil and gas leasehold interests in Nebraska and North Dakota and the disposition of 2 gross (1 net) producing oil and gas wells in Nebraska and Oklahoma.
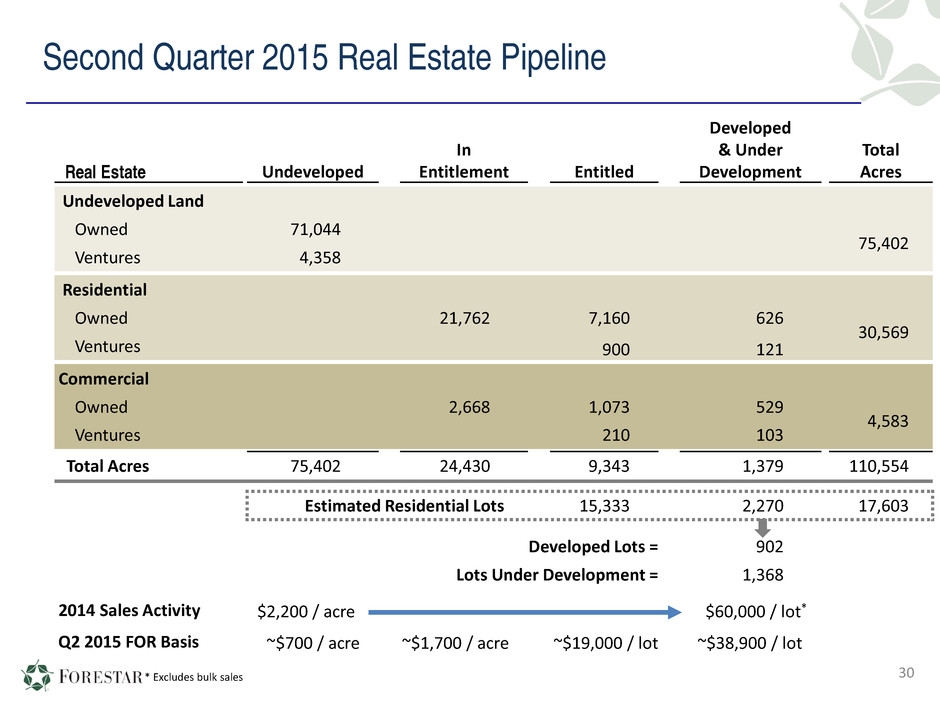
Second Quarter 2015 Real Estate Pipeline 30 Real Estate Undeveloped In Entitlement Entitled Developed & Under Development Total Acres Undeveloped Land Owned 71,044 75,402 Ventures 4,358 Residential Owned 21,762 7,160 626 30,569 Ventures 900 121 Commercial Owned 2,668 1,073 529 4,583 Ventures 210 103 Total Acres 75,402 24,430 9,343 1,379 110,554 Estimated Residential Lots 15,333 2,270 17,603 Developed Lots = 902 Lots Under Development = 1,368 2014 Sales Activity $2,200 / acre $60,000 / lot* Q2 2015 FOR Basis ~$700 / acre ~$1,700 / acre ~$19,000 / lot ~$38,900 / lot * Excludes bulk sales
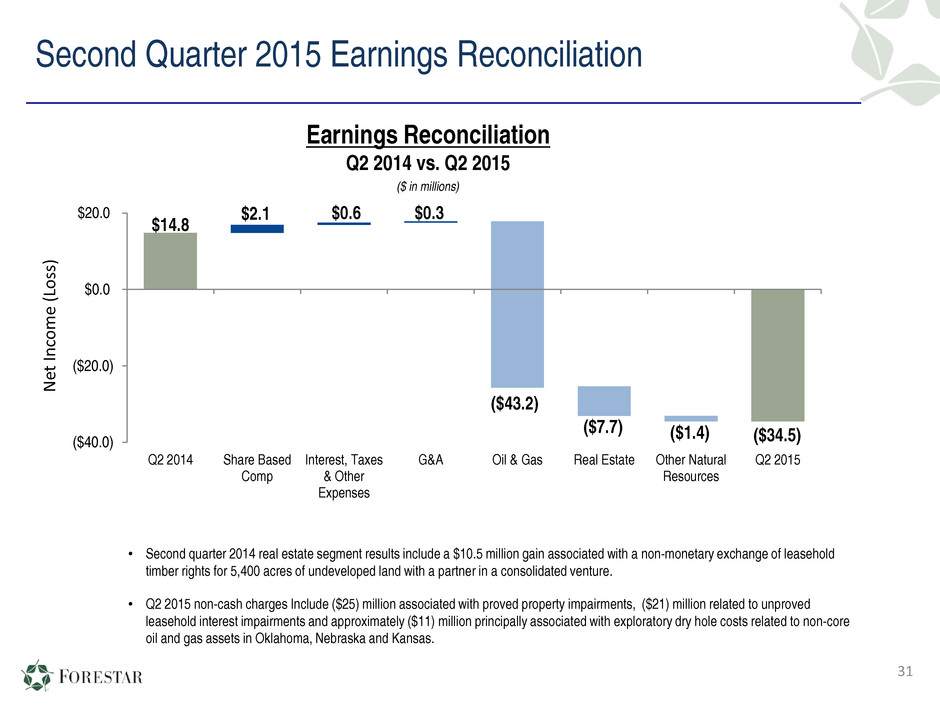
Second Quarter 2015 Earnings Reconciliation $14.8 ($34.5) $0.6$2.1 $0.3 ($43.2) ($7.7) ($1.4) ($40.0) ($20.0) $0.0 $20.0 Q2 2014 Share Based Comp Interest, Taxes & Other Expenses G&A Oil & Gas Real Estate Other Natural Resources Q2 2015 N et In co m e (L os s) Earnings Reconciliation Q2 2014 vs. Q2 2015 ($ in millions) 31 • Second quarter 2014 real estate segment results include a $10.5 million gain associated with a non-monetary exchange of leasehold timber rights for 5,400 acres of undeveloped land with a partner in a consolidated venture. • Q2 2015 non-cash charges Include ($25) million associated with proved property impairments, ($21) million related to unproved leasehold interest impairments and approximately ($11) million principally associated with exploratory dry hole costs related to non-core oil and gas assets in Oklahoma, Nebraska and Kansas.
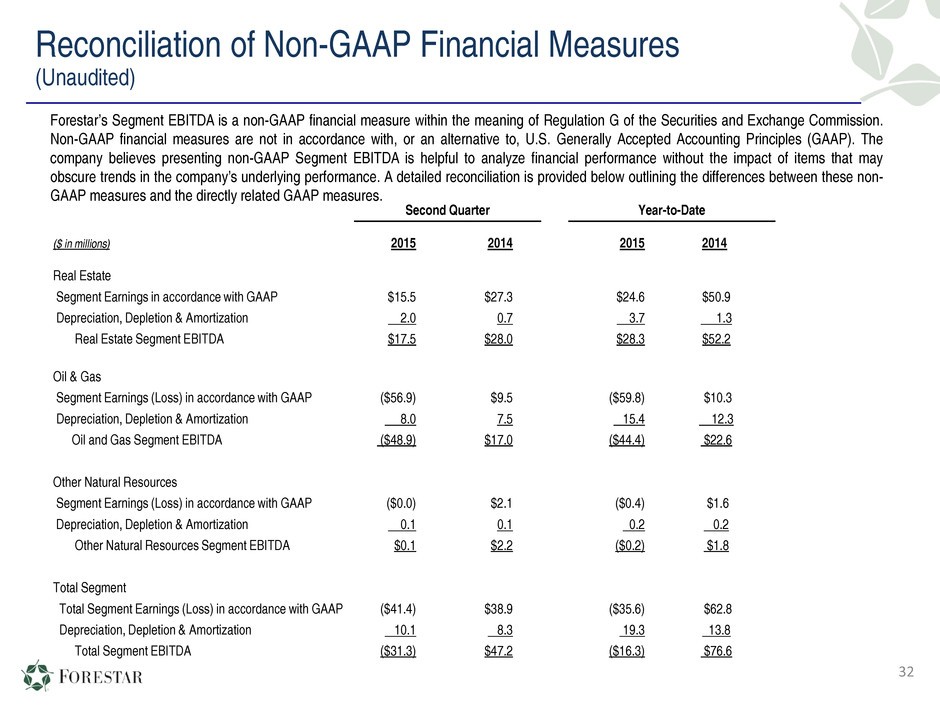
Reconciliation of Non-GAAP Financial Measures (Unaudited) Forestar’s Segment EBITDA is a non-GAAP financial measure within the meaning of Regulation G of the Securities and Exchange Commission. Non-GAAP financial measures are not in accordance with, or an alternative to, U.S. Generally Accepted Accounting Principles (GAAP). The company believes presenting non-GAAP Segment EBITDA is helpful to analyze financial performance without the impact of items that may obscure trends in the company’s underlying performance. A detailed reconciliation is provided below outlining the differences between these non- GAAP measures and the directly related GAAP measures. Second Quarter Year-to-Date ($ in millions) 2015 2014 2015 2014 Real Estate Segment Earnings in accordance with GAAP $15.5 $27.3 $24.6 $50.9 Depreciation, Depletion & Amortization 2.0 0.7 3.7 1.3 Real Estate Segment EBITDA $17.5 $28.0 $28.3 $52.2 Oil & Gas Segment Earnings (Loss) in accordance with GAAP ($56.9) $9.5 ($59.8) $10.3 Depreciation, Depletion & Amortization 8.0 7.5 15.4 12.3 Oil and Gas Segment EBITDA ($48.9) $17.0 ($44.4) $22.6 Other Natural Resources Segment Earnings (Loss) in accordance with GAAP ($0.0) $2.1 ($0.4) $1.6 Depreciation, Depletion & Amortization 0.1 0.1 0.2 0.2 Other Natural Resources Segment EBITDA $0.1 $2.2 ($0.2) $1.8 Total Segment Total Segment Earnings (Loss) in accordance with GAAP ($41.4) $38.9 ($35.6) $62.8 Depreciation, Depletion & Amortization 10.1 8.3 19.3 13.8 Total Segment EBITDA ($31.3) $47.2 ($16.3) $76.6 32
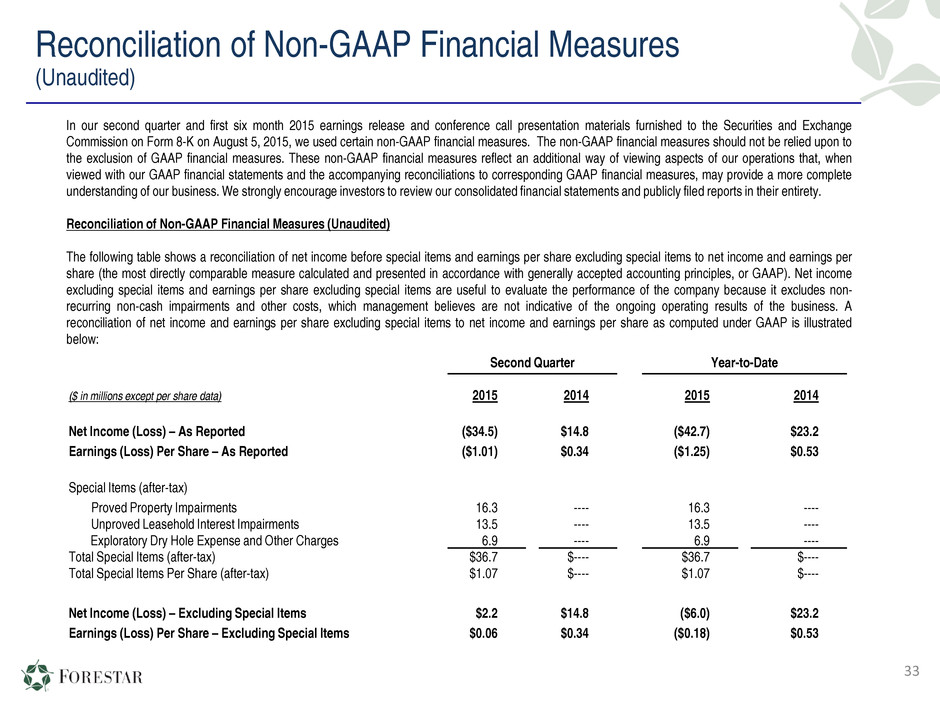
Reconciliation of Non-GAAP Financial Measures (Unaudited) 33 In our second quarter and first six month 2015 earnings release and conference call presentation materials furnished to the Securities and Exchange Commission on Form 8-K on August 5, 2015, we used certain non-GAAP financial measures. The non-GAAP financial measures should not be relied upon to the exclusion of GAAP financial measures. These non-GAAP financial measures reflect an additional way of viewing aspects of our operations that, when viewed with our GAAP financial statements and the accompanying reconciliations to corresponding GAAP financial measures, may provide a more complete understanding of our business. We strongly encourage investors to review our consolidated financial statements and publicly filed reports in their entirety. Reconciliation of Non-GAAP Financial Measures (Unaudited) The following table shows a reconciliation of net income before special items and earnings per share excluding special items to net income and earnings per share (the most directly comparable measure calculated and presented in accordance with generally accepted accounting principles, or GAAP). Net income excluding special items and earnings per share excluding special items are useful to evaluate the performance of the company because it excludes non- recurring non-cash impairments and other costs, which management believes are not indicative of the ongoing operating results of the business. A reconciliation of net income and earnings per share excluding special items to net income and earnings per share as computed under GAAP is illustrated below: Second Quarter Year-to-Date ($ in millions except per share data) 2015 2014 2015 2014 Net Income (Loss) – As Reported ($34.5) $14.8 ($42.7) $23.2 Earnings (Loss) Per Share – As Reported ($1.01) $0.34 ($1.25) $0.53 Special Items (after-tax) Proved Property Impairments 16.3 ---- 16.3 ---- Unproved Leasehold Interest Impairments 13.5 ---- 13.5 ---- Exploratory Dry Hole Expense and Other Charges 6.9 ---- 6.9 ---- Total Special Items (after-tax) $36.7 $---- $36.7 $---- Total Special Items Per Share (after-tax) $1.07 $---- $1.07 $---- Net Income (Loss) – Excluding Special Items $2.2 $14.8 ($6.0) $23.2 Earnings (Loss) Per Share – Excluding Special Items $0.06 $0.34 ($0.18) $0.53
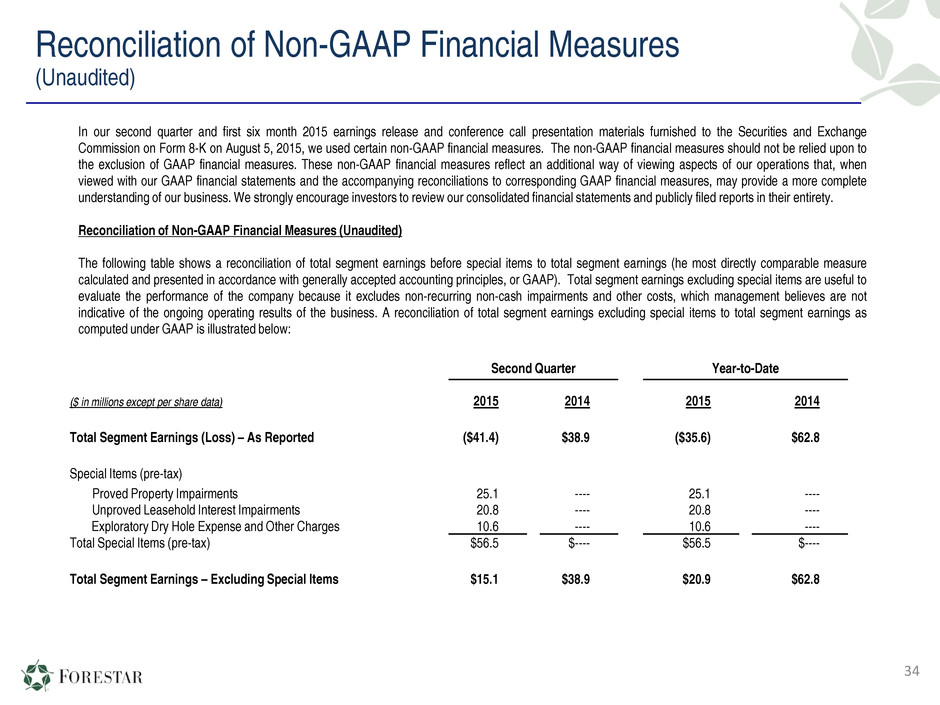
Reconciliation of Non-GAAP Financial Measures (Unaudited) 34 In our second quarter and first six month 2015 earnings release and conference call presentation materials furnished to the Securities and Exchange Commission on Form 8-K on August 5, 2015, we used certain non-GAAP financial measures. The non-GAAP financial measures should not be relied upon to the exclusion of GAAP financial measures. These non-GAAP financial measures reflect an additional way of viewing aspects of our operations that, when viewed with our GAAP financial statements and the accompanying reconciliations to corresponding GAAP financial measures, may provide a more complete understanding of our business. We strongly encourage investors to review our consolidated financial statements and publicly filed reports in their entirety. Reconciliation of Non-GAAP Financial Measures (Unaudited) The following table shows a reconciliation of total segment earnings before special items to total segment earnings (he most directly comparable measure calculated and presented in accordance with generally accepted accounting principles, or GAAP). Total segment earnings excluding special items are useful to evaluate the performance of the company because it excludes non-recurring non-cash impairments and other costs, which management believes are not indicative of the ongoing operating results of the business. A reconciliation of total segment earnings excluding special items to total segment earnings as computed under GAAP is illustrated below: Second Quarter Year-to-Date ($ in millions except per share data) 2015 2014 2015 2014 Total Segment Earnings (Loss) – As Reported ($41.4) $38.9 ($35.6) $62.8 Special Items (pre-tax) Proved Property Impairments 25.1 ---- 25.1 ---- Unproved Leasehold Interest Impairments 20.8 ---- 20.8 ---- Exploratory Dry Hole Expense and Other Charges 10.6 ---- 10.6 ---- Total Special Items (pre-tax) $56.5 $---- $56.5 $---- Total Segment Earnings – Excluding Special Items $15.1 $38.9 $20.9 $62.8

35


