Exhibit 99.2
January 28, 2020
Fellow Calix stockholders:
Our mission is to connect everyone and everything. Calix platforms empower our customers to build new business models, rapidly deploy new services and make the promise of the smart, connected home and business a reality.
The fourth quarter brought a fitting close to 2019, a pivotal year in our transformation. Beginning with significant headwinds from certain of our medium and large customers and a tariff accelerated redesign of our supply chain, 2019 saw us returning to year-over-year revenue growth in the fourth quarter. We look forward to continued growth as we build Calix into the all platform leader.
Coming off our 2019 ConneXions conference in October, the value of our all platform offerings continues to resonate, and demand for our platforms continues to grow. Our expanding addressable market was demonstrated yet again this quarter as we added 20 new customers. As has been the trend over the past several quarters, most of these new customers came from emerging customer verticals. This continued expansion of our customer base is fundamental to our transformation and will create a foundation for predictable, profitable growth for years to come.
Riding the Wave of Disruption
Our vision is focused on providing the platforms and services that enable innovative service providers to create services at a DevOps pace and provide their subscribers with an exceptional experience.
Service providers achieve this objective by building their infrastructure and service offerings on platforms. The ongoing wave of disruption sweeping across the communications space remains unprecedented in our experience. We continue to see traditional business models being disrupted as service providers of all types learn to adapt to the demands of the device-enabled subscriber. As the market continues to disrupt, the gap between subscriber needs and service provider supply continues to grow. New service providers are being created to address this unmet need, and capital is being formed to support them. We see this investment accelerating in the market, and it is well aligned with our mission; and we see the pace of existing service providers transforming to address this need hastening as well. As these service providers realign their investments, we are finding areas where our platforms can help them grow. In short, when a service provider of any type chooses to own the subscriber experience, we are well positioned to help them succeed.
Continued Transformation to an All Platform Company
Our relentless focus on the transformation of Calix into a communications cloud and software platform business yielded further progress in the fourth quarter. As we stated in our prior letters to stockholders, we continue to believe this transformation will manifest in improved financial performance across four measurable metrics over the long term:
| |
| • | Disciplined operating expense investment |
| |
| • | Deliberate revenue growth |
| |
| • | Increased predictability |
In the fourth quarter of 2019, we made progress on these metrics, and we expect these metrics will continue to improve as our platforms increase as a percentage of our total business. Examples of our progress made in the quarter were:
| |
| • | Added 20 new customers in the quarter bringing our 2019 total to 101 new customers from all segments of the market. |
| |
| • | Calix Cloud continued its rapid growth more than tripling revenue in the quarter and quadrupling revenue year over year. |
| |
| • | Launched the Revenue Edge Solution leveraging our EXOS systems and Calix Cloud, integrating real-time subscriber insights with new EDGE suites to help CSPs manage, secure and monetize the increasingly complex smart, connected home. |
| |
| • | AXOS everyPON leads the market with 75 customers deploying our 10G PON solutions. |
| |
| • | Success Services enabled our customers to achieve exceptional business outcomes such as reducing support costs by up to 66%, generating up to 9-fold improvements in campaign response rates and growing revenue by up to 23%. |
Our focus remains on finding like-minded customers regardless of their type, size or location. We are motivated by the ramp of our all platform offerings and excited by the level of customer engagement coming off our 2019 ConneXions conference. Furthermore, we remain committed to aligning our investments to our strategy and maintaining strong discipline over our operating expenses. Over the long term, we believe this focus will drive continuous improvement in our financial performance.
Fourth Quarter 2019 Financial Results
|
| | | |
| Actual GAAP | Actual Non-GAAP | Guidance Non-GAAP |
| Revenue | $120.2M | $120.2M | $117M - $121M |
| Gross margin | 45.5% | 47.2%(1) | 45.0% - 47.0%(1) |
| Operating expenses | $53.2M | $50.7M(1) | $49.0M - $51.0M(1) |
| Net income per diluted common share | $0.01 | $0.09(1) | $0.06 - $0.10(1) |
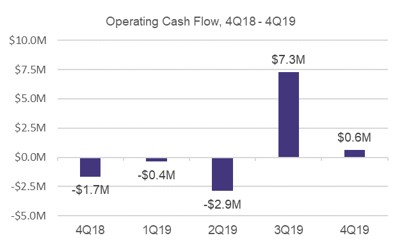
| Operating cash flow | $0.6M | Positive | Positive |
(1) Non-GAAP excludes items such as stock-based compensation, U.S. tariff and tariff-related costs and intangible asset amortization. See GAAP to non-GAAP reconciliations beginning on page 14.
Overall results for the fourth quarter of 2019 were solidly within our financial guidance for the quarter. Total revenue returned to year-over-year growth and increased 4% compared to the year-ago quarter as another strong quarter of demand for our platforms, ramp of new offerings and increased customer diversity more than offset declines among a subset of customers within our large and medium-sized customer base. Non-GAAP gross margin was above the upper end of our guidance owing to favorable customer and product mix, while operating expenses were within our guidance range due to our continued focus on maintaining financial discipline.
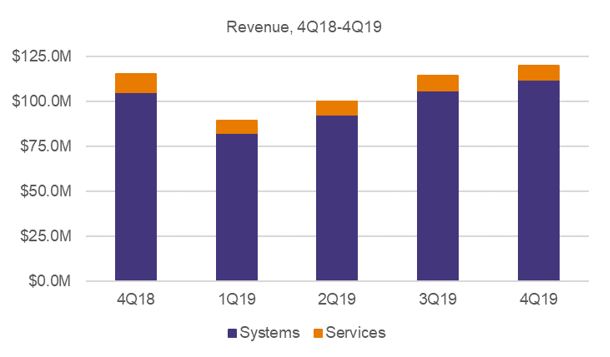
Systems revenue for the fourth quarter of 2019 increased 7% compared to the year ago period due to demand for our Calix Cloud, EXOS and AXOS platforms partially offset by continued pressure on our legacy systems revenue. Compared to the prior quarter, systems revenue increased sequentially by 6% due to positive seasonality. Services revenue decreased 21% compared to the year ago quarter as the continued ramp in our next generation service offerings was more than offset by lower professional services related to CAF deployments. Compared to the prior quarter, services revenue decreased 3% due to lower professional services. We continued to align our services business with our all-platform model through the creation of higher differentiated-value services.
Domestic revenue was 86% of total revenue for the quarter and decreased 2% compared to the year ago period as stronger demand for our platforms was offset by lower demand for our legacy products predominantly within our large and medium size customer base. International revenue was 14% of total revenue and increased 65% year-over-year due to the timing of network builds by several customers.
A new addition to this letter is a breakdown of revenue by customer segment. The purpose is to help our stockholders better understand the underlying shift in our customer base. Our segmentation divides revenue into small, medium and large customers. Small customers have less than 250,000 broadband subscribers. Medium customers have between 250,000 to less than 2,500,000 broadband subscribers. And, large customers have 2,500,000 or more broadband subscribers. We are including an annual breakdown for this metric for 2017, 2018 and 2019 along with a quarterly breakdown for the trailing five quarters. We are providing the annual breakdown in this letter to give context for the initial disclosure. Going forward, we will include only the quarterly breakdown using this same trailing five-quarter format.
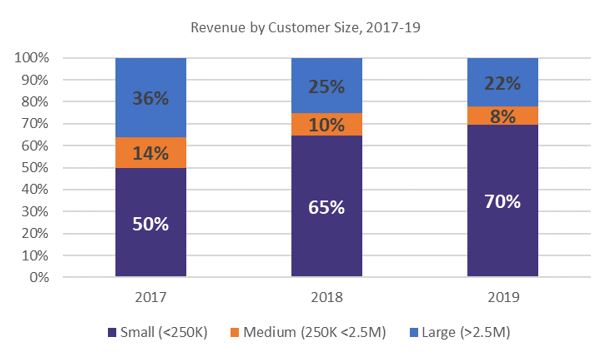
For 2019, revenue from large customers was 22% of total revenue and declined 15% compared to the year ago period due to lower shipments to CenturyLink and Frontier resulting from pressure to reduce their capital expenditures and a pending asset divestment. In addition, CenturyLink had lower CAF-related services revenue. These decreases were partially offset primarily by higher shipments to Verizon as they continue to build out their next generation network. Revenue from medium-sized customers was 8% of total revenue for 2019 and declined 24% compared to the year ago period as this group continued to reduce capital investments in response to broadband subscriber losses. Revenue from small customers was 70% of total revenue in 2019 and increased 3% as compared to a year ago on continued momentum with our platform offerings and the addition of new customers more than offset a decline in legacy product revenue.
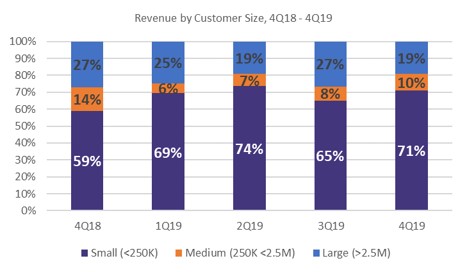
Revenue from large customers was 19% of total revenue in the fourth quarter and decreased by 25% compared to the year ago period primarily due to lower shipments to CenturyLink. We had one greater than 10% of revenue customer in the quarter – CenturyLink at 14%. Revenue from medium-sized customers was 10% of total revenue in the fourth quarter and decreased 26% compared to the year ago period due to continuing challenges impacting a number of these customers. Revenue from small customers was 71% of total revenue in the fourth quarter and increased 24% as compared to the year ago quarter as continued strength in Calix Cloud and AXOS platforms more than offset lower legacy product shipments. We will continue to focus on finding strategically aligned customers for our all-platform business.
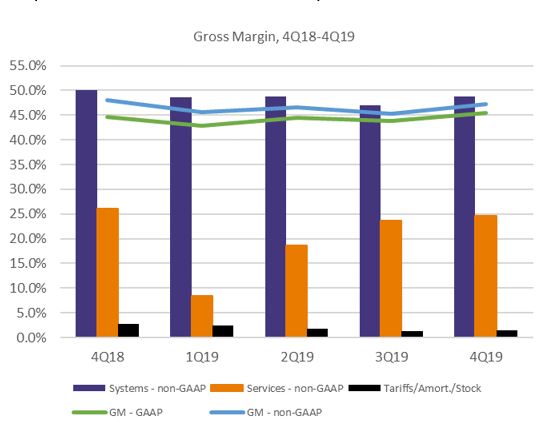
Despite continued growth in our all-platform offering, both GAAP and non-GAAP gross margin, adjusted for the costs of tariff and tariff-related costs, intangible amortization and stock-based compensation, declined in the fourth quarter of 2019 relative to the year-ago period. Specifically, non-GAAP gross margin declined 80 basis points year over year. This decline was primarily due to unfavorable customer and regional mix compared to the year ago quarter. Systems gross margin on a GAAP basis increased 60 basis points compared to the year ago quarter due to lower U.S. tariff and tariff-related costs. U.S. tariff and tariff-related costs and intangible asset amortization costs were 150 basis points of systems gross margin compared to 300 basis points in the year ago quarter. Non-GAAP systems gross margin decreased approximately 140 basis points year-over-year. The principal drivers of the year-over-year decrease in systems gross margin were customer and regional mix partially offset by continued growth in our all-platform offerings. Sequentially, non-GAAP systems gross margin increased by 180 basis points mainly due to favorable customer and product mix. GAAP services gross margin decreased 150 basis points compared to the year ago quarter due to lower revenue, primarily for CAF-related deployment services and investments in customer success personnel, only partially offset by increased activity in our higher gross margin support services. Sequentially, GAAP services gross margin increased this quarter by 70 basis points due to higher revenue from support services, which generally have a higher gross margin as compared to deployment services. See GAAP to non-GAAP reconciliation on page 14.
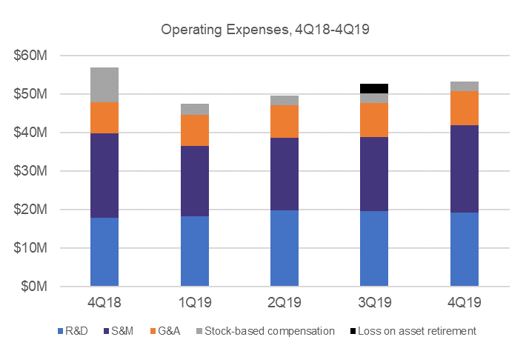
Operating expenses on a GAAP basis for the fourth quarter of 2019 decreased by 6% compared to the year ago quarter due to lower stock-compensation expense. On a non-GAAP basis, operating expenses were higher by $2.7 million as compared to the year ago period primarily due to higher incentive compensation. Sequentially, non-GAAP operating expenses increased by $2.7 million in the fourth quarter primarily due to normal seasonal fourth quarter expenses associated with our annual ConneXions customer and partner conference and higher commission costs on the higher quarterly revenue. As demonstrated this quarter, we expect to maintain our operating expense leverage, while maintaining our pace of innovation. See GAAP to non-GAAP reconciliation on page 14.
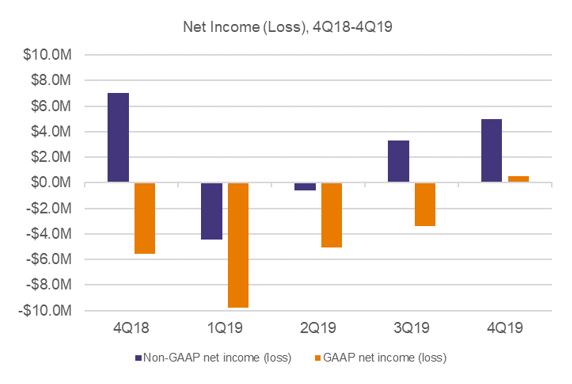
We reported net income on both a GAAP and non-GAAP basis in the quarter. Our GAAP bottom line increased by $6.1 million year-over-year from a net loss of $5.6 million to a net income of $0.5 million. Our GAAP net income for the fourth quarter of 2019 included stock-based compensation of $2.7 million, U.S. tariff and tariff-related costs of $1.1 million and intangible asset amortization of $0.7 million. Despite quarterly revenue increasing 4% compared with the year ago quarter, our non-GAAP net income for the fourth quarter of 2019 decreased compared with the year ago quarter as higher gross profit was more than offset primarily by higher operating expenses. See GAAP to non-GAAP reconciliation on page 14.
Balance Sheet and Cash Flow
We ended the fourth quarter of 2019 with cash of $46.8 million, a sequential increase of $9.3 million. The sequential increase in our cash was primarily the result of higher borrowings on our line of credit of $5.7 million, proceeds from equity-based employee benefit plans of $4.4 million as well as positive operating cash flow of $0.6 million partially offset by capital expenditures of $1.0 million. Compared to the year ago quarter, our cash decreased by $2.8 million primarily due to capital investments in 2019 of $13.4 million and payments under financing arrangements of $2.7 million offsetting positive operating cash flow of $4.7 million and proceeds from equity-based employee benefit plans of $8.4 million. The sequential decrease in operating cash flow in the fourth quarter of 2019 of $6.7 million was primarily due to the lower level of accounts payable of $13.4 million due to vendor payment timing and a $6.2 million inventory decrease.
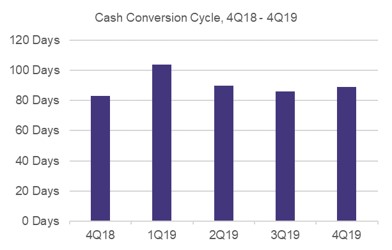
Our team remains focused on operational excellence and customer satisfaction. During the fourth quarter of 2019, our supply chain performed according to plan. Days sales outstanding at quarter end was 36 days, down 3 days from the prior quarter and down 17 days from the prior year. Inventory turns were 4.7 at quarter end, compared to 4.6 turns in the prior quarter and 5.1 turns in the year ago quarter as we continue to drive inventory levels lower from the atypical high level reported in the year ago quarter. Days payable outstanding at quarter end was 25 days down 7 days from the prior quarter and down 17 days from the year ago quarter. Our cash conversion cycle increased to 89 days compared to 86 days in the prior quarter and increased from 83 days in the year ago quarter owing to lower days payable outstanding.
First Quarter 2020 Guidance
|
| | |
| |
Guidance Non-GAAP | Guidance Reconciled to GAAP |
| Revenue | $99M - $103M | $99M - $103M |
| Gross margin | 45.0% - 47.0% (1) | 43.6% - 45.6% |
| Operating expenses | $48.5M - $50.5M (1) | $51.2M - $53.2M |
Net loss per diluted common share(2) | ($0.08) - ($0.04) (1) | ($0.15) - ($0.11) |
| Operating cash flow | Negative | Negative |
| |
| (1) | Non-GAAP excludes items such as stock-based compensation, U.S. tariff and tariff-related costs and intangible asset amortization. See GAAP to non-GAAP reconciliation on page 14. |
| |
| (2) | Based on 56.5 million weighted-average diluted common shares outstanding. |
Our guidance for the first quarter of 2020 reflects our expectations as of the date of this letter and which reflects the normal seasonality in our business.
Our non-GAAP gross margin guidance for the first quarter of 2020 reflects lower systems revenue for the quarter, our view of product and regional revenue mix and continued growth of our platform offerings.
Our non-GAAP operating expense guidance for the first quarter of 2020 reflects the resumption of expensing personnel expenses related to our ERP implementation that were previously capitalized as well as the increase in depreciation from our new ERP system as it went live at the beginning of 2020. Consistent with past quarters, we remain focused on operating expense investment discipline.
Finally, we expect negative operating cash flow next quarter from lower sequential profitability and payment of 2019 incentive compensation during the first quarter of 2020.
Importantly, we remain committed to improved financial performance over the long term. As Calix continues to transform to an all platform company, we plan to provide an update to our long-term financial model at our 2020 investor day on March 4, 2020.
Summary
Strong demand for our platforms along with rapid expansion of our customer base continues to demonstrate the progress we made towards our mission in the fourth quarter. As we remain focused on executing on our market opportunity, we expect to see our performance over the long term continue to improve. The fourth quarter marked a milestone in our transformation as we returned to year-over-year revenue growth in the quarter ... and as 2019 progressed we dramatically improved our predictability. All this bodes well for the years ahead.
Based on a solid backlog exiting 2019 and a strong pipeline of platform opportunities entering 2020, we are excited to project double-digit, year-over-year revenue growth for the first quarter.
We see many innovative service providers looking to Calix to provide the solutions and services to enable them to improve their subscribers’ experience, thereby driving their revenue higher, lowering their churn and increasing their return on investment. With an expanding pipeline of opportunities spanning service providers of every type, we believe we are well placed to continue building Calix … an all platform company … that is positioned in front of the largest wave of disruption our industry has experienced. We remain committed to our vision, and we sincerely thank our employees, customers and stockholders for their continued support as we capitalize on this opportunity.
Sincerely,
|
| |
Carl Russo President & CEO |
Cory Sindelar CFO |
Conference Call
In conjunction with this announcement, Calix will host a conference call tomorrow, January 29, 2019, at 5:30 a.m. Pacific Time (8:30 a.m. Eastern Time) to answer questions regarding our fourth quarter 2019 financial results. A live audio webcast and replay of the call will be available in the Investor Relations section of the Calix website at http://investor-relations.calix.com.
Live call access information: Dial-in number: (877) 407-4019 (U.S.) or (201) 689-8337 (outside the U.S.)
The conference call and webcast will include forward-looking information.
Investor Inquiries
Thomas J. Dinges, CFA
Director of Investor Relations
408-474-0080
Tom.Dinges@calix.com
About Calix
Calix, Inc. (NYSE: CALX) - Innovative communications service providers rely on Calix platforms to help them master and monetize the complex infrastructure between their subscribers and the cloud. Calix is the leading global provider of the cloud and software platforms, systems and services required to deliver the unified access network and smart premises of tomorrow. Our platforms and services help our customers build next generation networks by embracing a DevOps operating model, optimize the subscriber experience by leveraging big data analytics and turn the complexity of the smart, connected home and business into new revenue streams.
Forward-Looking Statements
Statements made in this stockholder letter and the earnings call referencing the stockholder letter that are not statements of historical fact are forward-looking statements. Forward-looking statements are subject to the “safe harbor” provisions of the Private Securities Litigation Reform Act of 1995. Forward-looking statements relate to, but are not limited to, statements about potential customer or market opportunities, growth and pipeline opportunities, statements about customer anticipated purchase trends, expected customer and product mix or anticipated adoption of our platforms, systems or services offerings, industry, market and customer trends, opportunities with existing and prospective customers, the ongoing management of our global supply-chain, the performance of our recently implemented ERP system, the future impact, financial or otherwise, of the U.S. tariffs or any other tariffs or trade regulations that may be imposed whether by the United States or other countries, as well as our ability to effectively mitigate such impacts, and future financial performance (including the outlook for the first quarter of 2020). Forward-looking statements are subject to risks and uncertainties that could cause actual results to differ materially from expectations, including but not limited to fluctuations in the Company’s financial and operating results, the capital spending decisions of its customers, changes and disruptions in the market and industry, changes in regulations and/or government sponsored programs, competition, its ability to achieve market acceptance of new systems and solutions, its ability to grow its customer base, fluctuations in costs associated with its systems and services including higher costs due to project delays and changes, third-party dependencies for production and resource management associated with our global supply-chain that may cause delays in production and unavailability of systems to meet customer orders, which may be substantial, cost overruns and other unanticipated factors, as well as the risks and uncertainties described in its annual reports on Form 10-K and its quarterly reports on Form 10-Q, each as filed with the SEC and available at www.sec.gov, particularly in the sections titled “Risk Factors.” Forward-looking statements speak only as of the date the statements are made and are based on information available to the Company at the time those statements are made and/or management’s good faith belief as of that time with respect to future events. Calix assumes no obligation to update forward-looking statements to reflect actual performance or results, changes in assumptions or changes in other factors affecting forward-looking information, except to the extent required by applicable securities laws. Accordingly, investors should not place undue reliance on any forward-looking statements.
Use of Non-GAAP Financial Information
The Company uses certain non-GAAP financial measures in this stockholder letter to supplement its consolidated financial statements, which are presented in accordance with GAAP. These non-GAAP measures include non-GAAP gross margin, non-GAAP operating expenses, non-GAAP net income (loss) and non-GAAP net income (loss) per diluted common share. These non-GAAP measures are provided to enhance the reader’s understanding of the Company’s operating performance as they primarily exclude certain non-cash charges for stock-based compensation, intangible asset amortization, restructuring benefit,
U.S. tariff and tariff-related costs and loss on asset retirement, which the Company believes are not indicative of its core operating results. Management believes that the non-GAAP measures used in this stockholder letter provide investors with important perspectives into the Company’s ongoing business performance and management uses these non-GAAP measures to evaluate financial results and to establish operational goals. The presentation of these non-GAAP measures is not meant to be a substitute for results presented in accordance with GAAP, but rather should be evaluated in conjunction with those GAAP results. A reconciliation of the non-GAAP results to the most directly comparable GAAP results is provided in this stockholder letter. The non-GAAP financial measures used by the Company may be calculated differently from, and therefore may not be comparable to, similarly titled measures used by other companies.
|
| | | | | | | | | | | | | | | | | | | |
| Calix, Inc. |
| Condensed Consolidated Statements of Operations |
| (Unaudited, in thousands, except per share data) |
| | | | | | | | | | | | |
| | | | | Three Months Ended | | Year Ended | |
| | | | | December 31, | | December 31, | |
| | | | | 2019 | | 2018 | | 2019 | | 2018 | |
| Revenue: | | | | | | | |
| | Systems | | $ | 111,978 |
| | $ | 105,077 |
| | $ | 393,231 |
| | $ | 405,923 |
| |
| | Services | | 8,213 |
| | 10,439 |
| | 31,099 |
| | 35,397 |
| |
| | | Total revenue | | 120,191 |
| | 115,516 |
| | 424,330 |
| | 441,320 |
| |
| Cost of revenue: | | | | | | | | | |
| | Systems (1) | | 59,289 |
| | 56,179 |
| | 211,309 |
| | 216,529 |
| |
| | Services (1) | | 6,190 |
| | 7,713 |
| | 25,096 |
| | 27,409 |
| |
| | | Total cost of revenue | | 65,479 |
| | 63,892 |
| | 236,405 |
| | 243,938 |
| |
| Gross profit | | 54,712 |
| | 51,624 |
| | 187,925 |
| | 197,382 |
| |
| Operating expenses: | | | | | | | | | |
| | Research and development (1) | | 20,264 |
| | 21,215 |
| | 81,184 |
| | 89,963 |
| |
| | Sales and marketing (1) | | 23,357 |
| | 25,282 |
| | 82,553 |
| | 86,432 |
| |
| | General and administrative (1) | | 9,597 |
| | 10,553 |
| | 37,115 |
| | 40,500 |
| |
| | Loss on asset retirement | | — |
| | — |
| | 2,474 |
| | — |
| |
| | Restructuring charge (benefit) | | — |
| | (271 | ) | | — |
| | 5,705 |
| |
| | Gain on sale of product line | | — |
| | — |
| | — |
| | (6,704 | ) | |
| | | Total operating expenses | | 53,218 |
| | 56,779 |
| | 203,326 |
| | 215,896 |
| |
| Income (loss) from operations | | 1,494 |
| | (5,155 | ) | | (15,401 | ) | | (18,514 | ) | |
| Interest and other income (expense), net: | | | | | | | | | |
| | Interest expense, net | | (437 | ) | | (102 | ) | | (958 | ) | | (632 | ) | |
| | Other income (expense), net | | (258 | ) | | (144 | ) | | (173 | ) | | 378 |
| |
| | | Total interest and other income (expense), net | | (695 | ) | | (246 | ) | | (1,131 | ) | | (254 | ) | |
| Income (loss) before provision for income taxes | | 799 |
| | (5,401 | ) | | (16,532 | ) | | (18,768 | ) | |
| Provision for income taxes | | 302 |
| | 177 |
| | 1,162 |
| | 530 |
| |
| Net income (loss) | | $ | 497 |
| | $ | (5,578 | ) | | $ | (17,694 | ) | | $ | (19,298 | ) | |
| Net income (loss) per common share: | | | | | | | | | |
| | | Basic and diluted | | $ | 0.01 |
| | $ | (0.10 | ) | | $ | (0.32 | ) | | $ | (0.37 | ) | |
| Weighted average number of shares used to compute net income (loss) per common share: | | | | | | | | |
| | | Basic | | 55,787 |
| | 53,425 |
| | 54,993 |
| | 52,609 |
| |
| | | Diluted | | 56,257 |
| | 53,425 |
| | 54,993 |
| | 52,609 |
| |
(1) | Includes stock-based compensation as follows: | | | | | | | | | |
| | Cost of revenue: | | | | | | | | | |
| | | Systems | | $ | 99 |
| | $ | 508 |
| | $ | 507 |
| | $ | 885 |
| |
| | | Services | | 104 |
| | 107 |
| | 389 |
| | 363 |
| |
| | Research and development | | 991 |
| | 3,373 |
| | 3,913 |
| | 5,970 |
| |
| | Sales and marketing | | 763 |
| | 3,322 |
| | 3,415 |
| | 5,787 |
| |
| | General and administrative | | 748 |
| | 2,364 |
| | 2,957 |
| | 4,469 |
| |
|
| | | | | | | | |
| Calix, Inc. |
| Condensed Consolidated Balance Sheets |
| (Unaudited, in thousands) |
| | | | | |
| | | December 31, |
| | | 2019 | | 2018 |
| ASSETS |
| Current assets: | | | | |
| Cash and cash equivalents | | $ | 46,829 |
| | $ | 49,646 |
|
| Restricted cash | | 628 |
| | 628 |
|
| Accounts receivable, net | | 46,509 |
| | 67,026 |
|
| Inventory | | 40,153 |
| | 50,151 |
|
| Prepaid expenses and other current assets | | 9,698 |
| | 7,306 |
|
| Total current assets | | 143,817 |
| | 174,757 |
|
| Property and equipment, net | | 21,527 |
| | 24,945 |
|
| Right-of-use operating leases | | 15,864 |
| | — |
|
| Goodwill | | 116,175 |
| | 116,175 |
|
| Other assets | | 19,440 |
| | 1,203 |
|
| | | $ | 316,823 |
| | $ | 317,080 |
|
| LIABILITIES AND STOCKHOLDERS’ EQUITY |
| Current liabilities: | | | | |
| Accounts payable | | $ | 10,789 |
| | $ | 40,209 |
|
| Accrued liabilities | | 57,546 |
| | 57,869 |
|
| Deferred revenue | | 17,158 |
| | 15,600 |
|
| Line of credit | | 30,000 |
| | 30,000 |
|
| Total current liabilities | | 115,493 |
| | 143,678 |
|
| Long-term portion of deferred revenue | | 18,340 |
| | 17,496 |
|
| Operating leases | | 14,337 |
| | — |
|
| Other long-term liabilities | | 14,625 |
| | 3,972 |
|
| Total liabilities | | 162,795 |
| | 165,146 |
|
| Stockholders’ equity: | | | | |
| Common stock | | 1,545 |
| | 1,482 |
|
| Additional paid-in capital | | 895,899 |
| | 876,073 |
|
| Accumulated other comprehensive loss | | (854 | ) | | (753 | ) |
| Accumulated deficit | | (702,576 | ) | | (684,882 | ) |
| Treasury stock | | (39,986 | ) | | (39,986 | ) |
| Total stockholders’ equity | | 154,028 |
| | 151,934 |
|
| | | $ | 316,823 |
| | $ | 317,080 |
|
|
| | | | | | | | |
| Calix, Inc. |
| Condensed Consolidated Statements of Cash Flows |
| (Unaudited, in thousands) |
| | | | | |
| | | Year Ended December 31, |
| | | 2019 | | 2018 |
| Operating activities: | | | | |
| Net loss | | $ | (17,694 | ) | | $ | (19,298 | ) |
| Adjustments to reconcile net loss to net cash provided by operating activities: | | | | |
| Stock-based compensation | | 11,181 |
| | 17,473 |
|
| Depreciation and amortization | | 9,306 |
| | 9,187 |
|
| Loss on asset retirements | | 2,636 |
| | 326 |
|
| Amortization of intangible assets | | 1,010 |
| | — |
|
| Gain on sale of product line | | — |
| | (6,704 | ) |
| Changes in operating assets and liabilities: | | | | |
| Accounts receivable, net | | 20,517 |
| | 13,858 |
|
| Inventory | | 9,998 |
| | (20,639 | ) |
| Prepaid expenses and other assets | | (63 | ) | | 3,579 |
|
| Accounts payable | | (29,440 | ) | | 4,596 |
|
| Accrued liabilities | | (1,836 | ) | | 2,791 |
|
| Deferred revenue | | 2,401 |
| | (1,426 | ) |
| Other long-term liabilities | | (3,362 | ) | | (183 | ) |
| Net cash provided by operating activities | | 4,654 |
| | 3,560 |
|
| Investing activities: | | | | |
| Purchases of property and equipment | | (13,353 | ) | | (10,426 | ) |
| Proceeds from sale of product line | | — |
| | 10,350 |
|
| Net cash used in investing activities | | (13,353 | ) | | (76 | ) |
| Financing activities: | | | | |
| Proceeds from exercise of stock options | | 442 |
| | 384 |
|
| Proceeds from employee stock purchase plans | | 8,433 |
| | 7,297 |
|
| Taxes paid for awards vested under equity incentive plan | | (167 | ) | | (72 | ) |
| Payments related to financing arrangements | | (2,737 | ) | | — |
|
| Proceeds from line of credit | | 143,300 |
| | 557,915 |
|
| Repayment of line of credit | | (143,300 | ) | | (557,915 | ) |
| Payments to originate or amend the line of credit | | — |
| | (115 | ) |
| Net cash provided by financing activities | | 5,971 |
| | 7,494 |
|
| Effect of exchange rate changes on cash, cash equivalents and restricted cash | | (89 | ) | | (479 | ) |
| Net increase (decrease) in cash, cash equivalents and restricted cash | | (2,817 | ) | | 10,499 |
|
| Cash, cash equivalents and restricted cash at beginning of period | | 50,274 |
| | 39,775 |
|
| Cash, cash equivalents and restricted cash at end of period | | $ | 47,457 |
| | $ | 50,274 |
|
|
| | | | | | | | | | | | | | | | | | | | | | | | | | | | | | |
| Calix, Inc. |
| Reconciliation of GAAP to Non-GAAP Systems Gross Margin and Gross Margin |
| (Unaudited) |
| | | Three Months Ended |
| | | December 31, 2019 | | September 28, 2019 | | June 29, 2019 | | March 30, 2019 | | December 31, 2018 |
| | | Systems Gross Margin | | Gross Margin | | Systems Gross Margin | | Gross Margin | | Systems Gross Margin | | Gross Margin | | Systems Gross Margin | | Gross Margin | | Systems Gross Margin | | Gross Margin |
| GAAP amount | | 47.1 | % | | 45.5 | % | | 45.4 | % | | 43.9 | % | | 46.6 | % | | 44.5 | % | | 45.8 | % | | 42.9 | % | | 46.5 | % | | 44.7 | % |
| Adjustments to GAAP amount: | | | | | | | | | | | | | | | | | | | | |
| Stock-based compensation | | 0.1 |
| | 0.2 |
| | 0.1 |
| | 0.2 |
| | 0.1 |
| | 0.2 |
| | 0.2 |
| | 0.3 |
| | 0.6 |
| | 0.5 |
|
| Intangible asset amortization | | 0.5 |
| | 0.5 |
| | 0.3 |
| | 0.2 |
| | — |
| | — |
| | — |
| | — |
| | — |
| | — |
|
| U.S. tariff and tariff-related costs | | 1.0 |
| | 1.0 |
| | 1.1 |
| | 1.0 |
| | 2.0 |
| | 1.9 |
| | 2.6 |
| | 2.4 |
| | 3.0 |
| | 2.8 |
|
| Non-GAAP amount | | 48.7 | % | | 47.2 | % | | 46.9 | % | | 45.3 | % | | 48.7 | % | | 46.6 | % | | 48.6 | % | | 45.6 | % | | 50.1 | % | | 48.0 | % |
|
| | | | | | | | | | | | |
| Calix, Inc. |
| Reconciliation of GAAP to Non-GAAP Operating Expenses |
| (Unaudited, in thousands) |
| | | |
| | | Three Months Ended |
| | | December 31, 2019 | | September 28, 2019 | | December 31, 2018 |
| GAAP operating expenses | | $ | 53,218 |
| | $ | 53,053 |
| | $ | 56,779 |
|
| Adjustments to GAAP amount: | | | | | | |
| Stock-based compensation | | (2,502 | ) | | (2,539 | ) | | (9,059 | ) |
| Loss on asset retirement | | — |
| | (2,474 | ) | | — |
|
| Restructuring benefit | | — |
| | — |
| | 271 |
|
| Non-GAAP operating expenses | | $ | 50,716 |
| | $ | 48,040 |
| | $ | 47,991 |
|
|
| | | | | | | | | | | | | | | | | | | | | |
| Calix, Inc. |
| Reconciliation of GAAP to Non-GAAP Net Income (Loss) |
| (Unaudited, in thousands) |
| | | | |
| | | Three Months Ended | |
| | | December 31, | | September 28, | | June 29, | | March 30, | | December 31, | |
| | | 2019 | | 2019 | | 2019 | | 2019 | | 2018 | |
| GAAP net income (loss) | | $ | 497 |
| | $ | (3,379 | ) | | $ | (5,045 | ) | | $ | (9,767 | ) | | $ | (5,578 | ) | |
| Adjustments to GAAP amount: | | | | | | | | | | | |
| Stock-based compensation | | 2,705 |
| | 2,762 |
| | 2,569 |
| | 3,145 |
| | 9,674 |
| |
| Intangible asset amortization | | 658 |
| | 352 |
| | — |
| | — |
| | — |
| |
| Restructuring benefit | | — |
| | — |
| | — |
| | — |
| | (271 | ) | |
| U.S. tariff and tariff-related costs | | 1,138 |
| | 1,097 |
| | 1,855 |
| | 2,151 |
| | 3,195 |
| |
| Loss on asset retirement | | — |
| | 2,474 |
| | — |
| | — |
| | — |
| |
| Non-GAAP net income (loss) | | $ | 4,998 |
| | $ | 3,306 |
| | $ | (621 | ) | | $ | (4,471 | ) | | $ | 7,020 |
| |
| | | | | | | | | | | | |
|
| | | | |
| Calix, Inc. |
| Reconciliation of GAAP to Non-GAAP Net Income Per Diluted Common Share |
| (Unaudited) |
| | | Three Months Ended December 31, 2019 |
| | |
| GAAP net income per diluted common share | | $ | 0.01 |
|
| Adjustments to GAAP amount: | | |
| Stock-based compensation | | 0.05 |
|
| Intangible asset amortization | | 0.01 |
|
| U.S. tariff and tariff-related costs | | 0.02 |
|
Non-GAAP net income per diluted common share (1) | | $ | 0.09 |
|
(1) Based on 56.3 million weighted-average diluted common shares outstanding.
|
| | | | | | | | | | |
| Calix, Inc. |
| Reconciliation of GAAP to Non-GAAP Guidance |
| (Unaudited, dollars in thousands, except per share data) |
| Three Months Ending March 28, 2020 |
| | | | | | | | | | | |
| | GAAP | | Stock-Based Compensation | | U.S. Tariff and Tariff-related Costs | | Intangible
Asset Amortization | | Non-GAAP |
| Gross margin | | 43.6% - 45.6% | | 0.2% | | 0.5% | | 0.7% | | 45.0% - 47.0% |
| Operating expenses | | $ 51,200 - $ 53,200 | | $ (2,700) | | $ - | | $ - | | $ 48,500 - $ 50,500 |
Net loss per diluted common share(1) | | $ (0.15) - $ (0.11) | | $ 0.05 | | $ 0.01 | | $ 0.01 | | $ (0.08) - $ (0.04) |
(1) Based on 56.5 million weighted-average diluted common shares outstanding.