Exhibit 99.2
July 26, 2021
Fellow Calix stockholders:
As vaccinations continue to rollout, economies around the world are starting the process of reopening and attempting to return to some semblance of pre-pandemic activity. For some industries, there likely may not be a return to pre-pandemic or normal activity. While for other industries, the new normal will likely look a lot like the near-term normal. While vaccinations remain on an upward trajectory, we are still far from levels needed to resume all normal social activity across the globe. The challenge of balancing the pace of reopening of the global economy with the pace of vaccinations has been felt across nearly every industry. Shortages of labor and materials have caused prices for both to increase and supply availability to be challenged. We have been directly impacted by these effects; however, our team continues to execute well in order to meet the needs of our customers.
Our view remains unchanged regarding the benefits of the new hybrid work environment, and we have aligned our real estate, investments in business systems and human resources accordingly. We shifted to a work from anywhere model one year ago, and despite many of the challenges stemming from the pandemic, our team has executed well throughout this past year and continued to do so this quarter. For Calix, our focus remains on the health and welfare of our employees and their families so that they may, in turn, execute on our mission and support our customers through these challenging times.
As we discussed last quarter, our business is driven by the secular change in the communications space, and our All Platform offerings are the basis for our growth. Our results in the second quarter reinforced this fact.
Our mission is to enable our broadband service provider (BSP) customers of all types and sizes to simplify their business, excite their subscribers and grow their value. As our BSP customers utilize the greater capabilities of our All Platform offerings and grow the value of their businesses, we believe over the long-term they will share a portion of that value with us. This will increase our revenue visibility and create a more valuable business for Calix. BSP customers deploying our All Platform offerings have reported dramatic improvements in key metrics, including increased average revenue per user, lower subscriber churn, reduced truck rolls and increased net promoter scores, thanks to our Intelligent Access Edge and Revenue Edge platforms. We continued to add new BSP customers of all types this quarter, setting a second quarter record and nearly eclipsing the all-time new customer adds for a single quarter. As the economy continues to reopen, we will expand our customer engagement and further increase our ability to demonstrate the value of our All Platform offerings.
Increasing customer adoption of our product and service offerings enabled us to deliver record second quarter revenue that was up nearly 42% from last year. Performance in the quarter was led by strength in our small- and medium-size customers with growth across our All Platform offerings and legacy systems products. For the third consecutive quarter, no customer accounted for greater than 10% of revenue in the quarter, reflecting the growing diversity of our revenue and increasing robustness of our business. Despite higher component and logistics costs, we delivered record second quarter gross margin as our All Platform offerings continued to increase as a percentage of our overall revenue. We maintained our disciplined operating expense investments while at the same time making targeted investments to capitalize on the opportunity ahead of us by adding key talent to the organization. This combination of higher revenue, increased gross margin and disciplined operating expense investments led to record second quarter GAAP net income. We start the third quarter of 2021 in the strongest financial position in our history and believe we are perfectly placed to execute on the opportunity ahead.
As a communications cloud and software platform business, we continue to believe our financial performance improvement will manifest across four measurable metrics over the long term:
•Deliberate revenue growth
•Gross margin expansion
•Disciplined operating expense investment
•Increased predictability
Examples of our progress made in the quarter were:
•Added 43 new BSP customers of all types in the quarter.
•Set a new second quarter record for new Calix Marketing Cloud customers with total customers increasing by 70% compared to the year ago quarter.
•Record quarter for the EXOS platform with revenue up more than 275% compared to the year ago quarter as both new and existing customers accelerated deployments of the Revenue EDGE solution.
•AXOS platform revenue increased by more than 75% compared to the year ago quarter driven by both new and existing customers’ continued adoption of the platform.
•Enhanced Calix Premier Success Services for Marketing, helping our BSP customers improve marketing campaign ROI through more effective use of social media and digital marketing channels.
Our near-term focus is on serving the needs of our BSP customers, while our long-term focus remains on finding like-minded BSP customers regardless of their type, size or location. Furthermore, we remain committed to aligning our investments to our mission, vision and strategy and maintaining strong discipline over our operating expenses. Over the long term, we believe this focus will drive continued improvement in our financial performance.
Second Quarter 2021 Financial Results
| | | | | | | | | | | |
| Actual GAAP | Actual Non-GAAP | Guidance Non-GAAP |
| Revenue | $168.7M | $168.7M | $157M – $163M |
| Gross margin | 53.1% | 52.8%(1) | 51.0% – 53.0%(1) |
| Operating expenses | $69.1M | $63.2M(1) | $64.0M – $67.0M(1) |
| Net income per diluted common share | $0.30 | $0.38(1) | $0.24 – $0.28(1) |
Free cash flow(2) | | $21.8M | Positive |
| | | | | | | |
| (1) | Non-GAAP excludes items such as stock-based compensation, U.S. tariff refunds and intangible asset amortization. See GAAP to non-GAAP reconciliations beginning on page 16. | | |
| (2) | Free cash flow defined as operating cash flow minus purchases of property and equipment. | | |
| | | |
| | | |
| | | |
| | | |
| | | |
| | | |
| | | |
| | | |
Results for the second quarter of 2021 broke a number of second quarter records and were better than our financial guidance provided last quarter. Overall demand was robust, and our supply chain outperformed despite the continued challenging global environment for component sourcing and supply chain logistics. Total revenue, which was above the high end of our guidance range, increased 42% compared to the year ago quarter. This strong performance was driven by demand for our All Platform offerings along with an increase in purchases of our legacy system products. Revenue growth was again led by our small customers along with a continued recovery in investment by our medium customers, which more than offset the lower second quarter revenue among our large customers. Non-GAAP gross margin was near the high-end of our guidance owing to favorable product and customer mix. Meanwhile, our non-GAAP operating expenses were below the low-end of our guidance. The combination of the above resulted in record second quarter net income per diluted common share on both a GAAP and non-GAAP basis. Finally, our continuing focus on balance sheet discipline resulted in the fourth consecutive quarter of positive free cash flow, and the highest reported cash balance in our history.
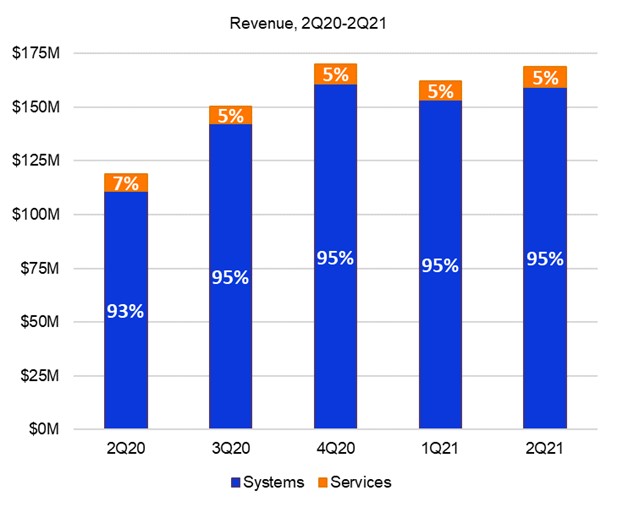
Systems revenue for the second quarter of 2021 increased 44% compared to the year ago quarter with continued strong demand for our All Platform offerings along with increased purchases of our legacy systems as service providers continue to respond to higher demand for bandwidth on their networks. Compared to the prior quarter, systems revenue increased 4%, as we saw increased demand and our supply chain team outperformed expectations. Services revenue increased 11% compared to the year ago quarter and 4% compared to the prior quarter due to the continued ramp of our next generation services. We continue to align our services business with our All Platform model through the introduction of higher differentiated-value services.
Domestic revenue was 79% of total revenue in the second quarter and increased 23% compared to the year ago quarter due to strong demand for our platforms and increased shipments of legacy systems. Sequentially, domestic revenue was essentially flat as strong demand for our platforms was offset by a decline in purchases of our legacy systems. International revenue was 21% of total revenue in the second quarter and increased more than 220% compared to the year ago quarter due to program ramps with specific customers across multiple regions as well as demand carried over from the first quarter due to logistical challenges and component supply limitations. Sequentially, international revenue increased 28% due to program ramps with specific customers across multiple regions as well as demand carried over from the first quarter due to logistical challenges and component supply limitations.
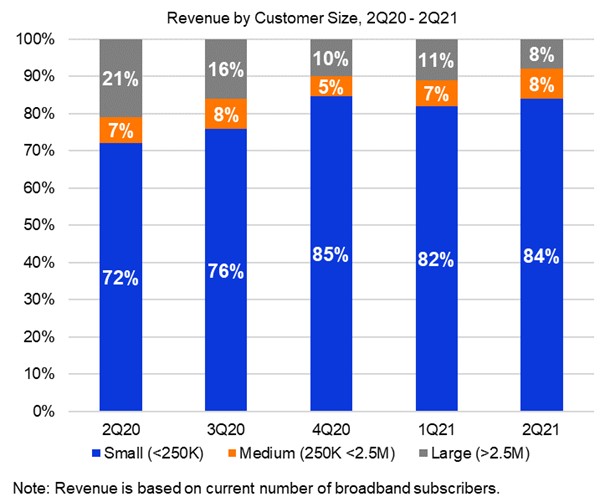
Revenue from small customers was 84% of total revenue in the second quarter of 2021 and up from 72%, or an increase of 64% in absolute dollars, compared to the year ago quarter due to strength in demand for our All Platform offerings along with increased purchases of our legacy systems. Revenue from medium-sized customers was 8% of total revenue in the second quarter of 2021 and up from 7%, or an increase of 60% in absolute dollars, compared to the year ago quarter reflecting a continued rebound in investment across this customer base. Revenue from large customers was 8% of total revenue in the second quarter of 2021 and down from 21% of total revenue, or a decrease of 42% in absolute dollars, compared to the year ago quarter primarily due to lower shipments to Lumen Technologies. We will continue to focus on finding strategically aligned customers of all types and sizes for our All Platform offerings.
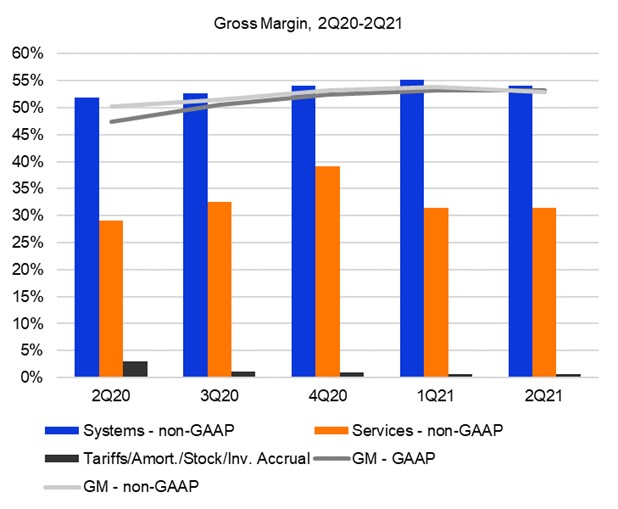
Driven by favorable product and customer mix, both GAAP and non-GAAP gross margin set second quarter records. Specifically, GAAP gross margin increased 570 basis points year over year to 53.1%, and non-GAAP gross margin increased 260 basis points year over year to 52.8%. On a GAAP basis, systems gross margin increased 570 basis points compared to the year ago quarter due to favorable product and customer mix as well as a credit for previously paid U.S. import tariffs, refundable due to the subsequent export of the tariffed products from the U.S. Sequentially, systems gross margin on a GAAP basis was essentially unchanged as higher component and logistics costs were offset by the U.S. tariff refunds. On a non-GAAP basis, systems gross margin of 54.0% reached a second quarter record and reflects an increase of approximately 220 basis points year-over-year. The principal drivers of the year-over-year increase in non-GAAP systems gross margin were the
continued growth in our All Platform offerings as a percent of revenue along with favorable product, customer and regional mix. Sequentially, systems gross margin on a non-GAAP basis declined 110 basis points as higher component and logistics costs more than offset favorable product and customer mix. Services gross margin on a GAAP and non-GAAP basis increased 210 and 280 basis points, respectively, compared to the year ago quarter primarily due to improved mix towards our higher gross margin support services versus lower gross margin deployment services along with higher revenue. Sequentially, services gross margin on a GAAP and non-GAAP basis were essentially flat as higher quarterly revenue helped offset the costs of an increase in customer success personnel.
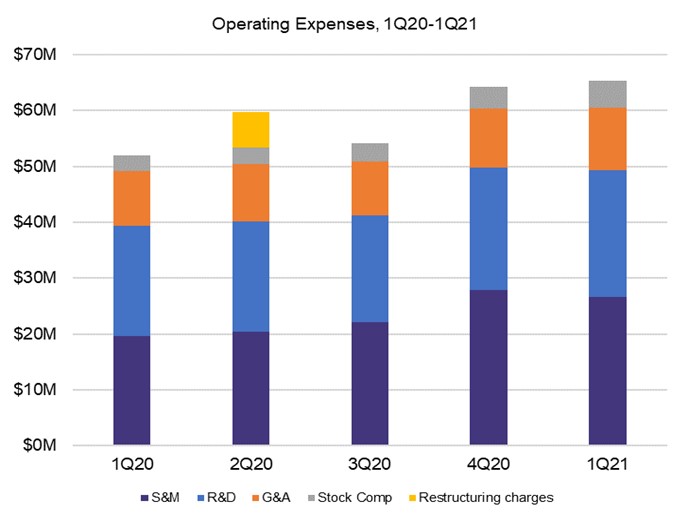
Compared to the year ago quarter, GAAP operating expenses increased by 16%, and non-GAAP operating expenses increased by 25%, primarily due to investments and headcount increases in sales and marketing as we add personnel primarily in the U.S. along with a higher level of investments in research and development programs. Sequentially, GAAP operating expenses increased 6%, and non-GAAP operating expenses increased 4%, primarily due to increased headcount in sales and marketing along with investments in research and development. Non-GAAP operating expenses were at the low-end of our guidance range due to the timing of headcount additions during the quarter. Relative to our non-GAAP target financial model, sales and marketing investments were 17% of revenue, which aligns with our target financial model range of 16 to 18% of revenue but is below the 18% we are currently driving towards, research and development investments were 28% of systems gross profit, which is just under our target financial model level of 30% of systems gross profit, and general and administrative investments were 7% of revenue, below our target financial model level of 9% of revenue. While we expect to maintain our operating expense leverage, we intend to align our investments with our target financial model in 2021 and beyond to capitalize on the opportunity ahead.
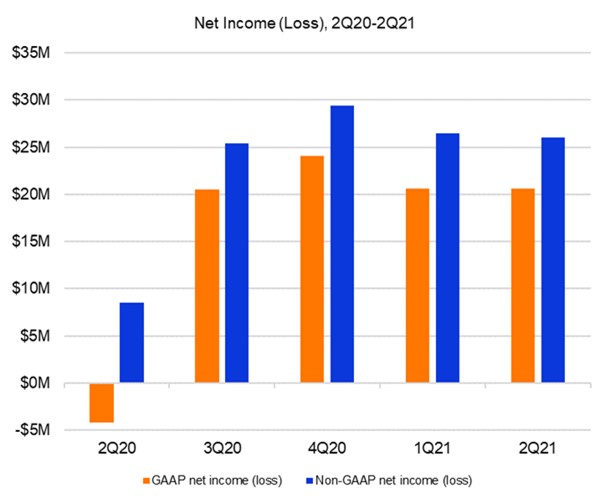
Driven by higher revenue, product and customer mix along with disciplined operating expense investment, we reported record second quarter net income on both a GAAP and a non-GAAP basis. On a GAAP basis, our net income increased $24.7 million year-over-year from a net loss of $4.2 million to a net income of $20.5 million. Our GAAP net income for the second quarter of 2021 included stock-based compensation of $6.2 million, a refund of previously paid U.S. import tariffs of $1.5 million and intangible asset amortization of $0.7 million. Our non-GAAP net income for the second quarter of 2021 increased $17.3 million from a net income of $8.5 million to a net income of $25.8 million.
Balance Sheet and Cash Flow
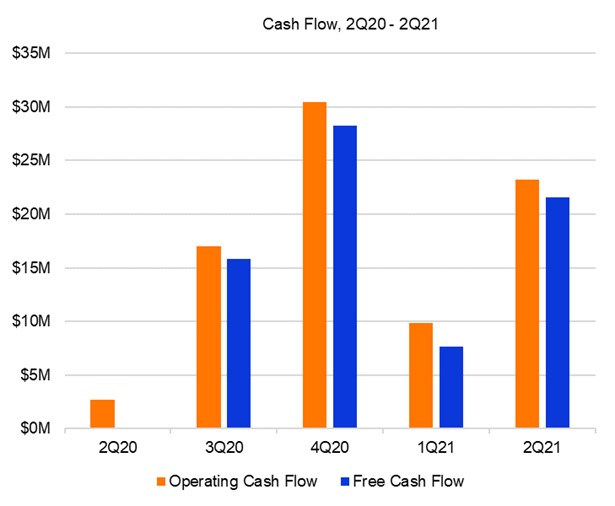
We ended the second quarter of 2021 with cash, cash equivalents and marketable securities of $175.8 million, a sequential increase of $25.8 million. The sequential increase was primarily the result of positive free cash flow of $21.8 million and the proceeds from equity-based employee benefit plans of $4.2 million. We generated positive operating cash flow for the eighth consecutive quarter and positive free cash flow for the fourth consecutive quarter. We expect this trend will continue for the foreseeable future. The positive operating and free cash flow generation this quarter was net of continued investment in inventory to improve our responsiveness to customer needs and reduce supply chain risks. We increased inventory 7% sequentially, or $4.9 million, and we expect our inventory levels to decrease in the third quarter of 2021 as it will be harder to replace inventory given the supply gap created by key silicon component lead times extending out to 52 weeks from 30 weeks earlier this year. Compared to the year ago quarter, our cash, cash equivalents and marketable securities increased by $125.3
million primarily due to proceeds from our follow-on equity offering of $60.1 million, positive free cash flow of $73.6 million and proceeds from equity-based employee benefit plans of $20.6 million partially offset by the repayment of borrowings under our line of credit of $26.0 million. As of the end of the second quarter of 2021, our $35 million line of credit remains undrawn and fully available to us to support our growth if needed.
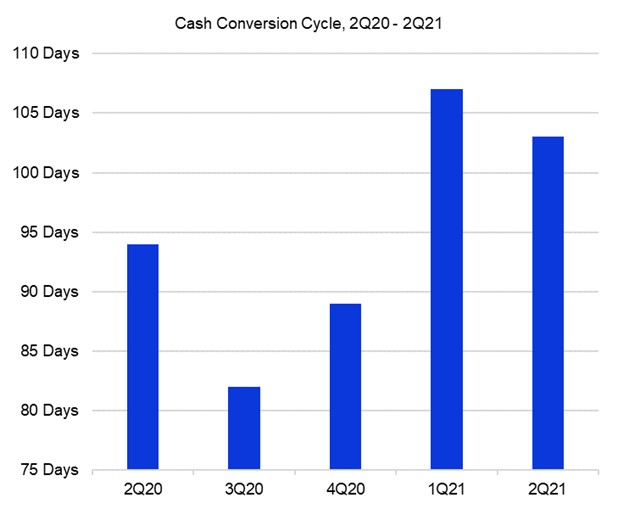
Our team remains focused on operational excellence and customer satisfaction. During the second quarter of 2021, our supply chain team outperformed despite continued challenges in component supply and logistics. Lead times remain extended, port congestion remains challenging and airfreight costs remain elevated. We continue to qualify new suppliers, incur higher component and expediting costs and adjust to extended component delivery lead times. Our days sales outstanding (DSO) at quarter end was 43 days, unchanged from the prior quarter and down 2 days from the prior year. Our target financial model remains for DSO to be between 35 and 45 days. Inventory turns were 3.8 at quarter end, compared to 4.1 turns in the prior quarter and 5.9 turns in the year ago quarter. Our near-term goal remains for inventory turns to be between 3 and 4 to better support the needs of our customers with our long-term target financial model remaining between 4 and 5 turns. The year-over-year decrease in inventory turns in the quarter were the result of a higher level of inventory. Days payable outstanding (DPO) at quarter end was 37 days, up 12 days from the prior quarter and up 25 days from the year ago quarter. Our target financial model for DPO remains to be between 20 and 30 days. Our cash conversion cycle was 103 days compared to 107 days in the prior quarter as the increase in DPO more than offset the decrease in inventory turns. Compared to the year ago quarter, our cash conversion cycle increased 9 days as higher DPO and improved DSO were more than offset by lower inventory turns. Our target financial model remains for our cash conversion cycle to be between 85 and 95 days.
We believe our existing cash, cash equivalents and marketable securities and expected positive free cash flow will provide us with sufficient liquidity for our business.
Third Quarter 2021 Guidance
| | | | | | | | |
|
Guidance Non-GAAP | Guidance Reconciled to GAAP |
| Revenue | $164M – $170M | $164M – $170M |
| Gross margin | 50.5% – 52.5%(1) | 49.9% – 51.9% |
| Operating expenses | $65.0M – $68.0M(1) | $70.9M – $73.9M |
Net income per diluted common share(2) | $0.26 – $0.30(1) | $0.16 – $0.20 |
Free cash flow(3) | Positive | |
| | | | | | | |
| (1) | Non-GAAP excludes items such as stock-based compensation and intangible asset amortization. See GAAP to non-GAAP reconciliation on page 16. | | |
| (2) | Based on 68.0 million weighted-average diluted common shares outstanding. | | |
| (3) | Free cash flow defined as operating cash flow minus purchases of property and equipment. Starting with the third quarter 2021 letter to stockholders, we will no longer provide free cash flow guidance. | | |
| | | |
| | | |
| | | |
| | | |
| | | |
| | | |
| | | |
| | | |
Our guidance for the third quarter ending October 2, 2021 reflects our expectations as of the date of this letter. These expectations reflect our current estimate of the global impacts from the coronavirus pandemic on our business and assessment of supply chain and logistical challenges.
Our revenue guidance for the third quarter of 2021 is for an increase of between 9% and 13% compared to the year ago quarter, which at the mid-point is above the upper end of our target financial model range of 5% to 10%. While we expect another strong quarter of demand for our All Platform offerings, we expect our revenue will continue to be impacted by supply chain constraints and logistical challenges.
Our non-GAAP gross margin guidance for the third quarter of 2021 at the mid-point represents essentially flat gross margin relative to the year ago quarter. This reflects expectations of a positive benefit from the continued increase of our All Platform offerings as a percent of total revenue offset by higher component and logistics costs. Compared to the prior quarter, non-GAAP gross margin is expected to benefit from the continued increase in our All Platform offerings as a percent of total revenue but we expect this benefit will be more than offset by higher costs for components and logistics. Over the long-term, we expect the increase in our All Platform offerings as a percent of total revenue to positively benefit non-GAAP gross margin.
Our non-GAAP operating expense guidance for the third quarter of 2021 generally reflects alignment with our target financial model as we remain focused on disciplined operating expense investment. We forecast investments in sales and marketing at the high end of our target range of 16 to 18% of revenue due to increased hiring as well as investments in marketing programs. We forecast research and development investments at our target of 30% of systems gross profit. We forecast general and administrative investments at 8% of revenue, below our target level of 9% of revenue.
Summary
Even though vaccinations are on the rise and many regions and countries across the globe have started the process of reopening major segments of their economies, the pandemic continues to affect how we live, work, learn and play. There is much work left to be done to put this pandemic behind us and we intend to do our part and keep our employees and customers safe. This allows us to remain focused on our mission to help our customers simplify, excite and grow.
As the economy strengthens, it is clear that we are on the front end of an enormous secular opportunity. Winning BSPs have demonstrated that they can deploy our platforms for effect and build an entirely new business model on top of it. In our view, this approach drives higher value for those BSPs providing an exceptional service for their subscribers and broadband investments will continue to expand to support this new reality. It is just as clear that we have the right platforms, solutions and services to achieve our mission and help BSPs of all types and sizes succeed. We have a solid financial foundation on which to build. We have a fantastic set of customers and prospective customers to expand with. And, most importantly, we remain focused on adding incredible talent to our industry-leading team as we execute on our vision.
We sincerely thank our employees, customers, partners, vendors and stockholders for their continued support as we pursue our future.
Sincerely,
| | | | | |
Carl Russo Chairman and CEO |
Cory Sindelar CFO |
Conference Call
In conjunction with this announcement, Calix will host a conference call tomorrow, July 27, 2021, at 5:30 a.m. Pacific Time (8:30 a.m. Eastern Time) to answer questions regarding our second quarter 2021 financial results. A live audio webcast and replay of the call will be available in the Investor Relations section of the Calix website at http://investor-relations.calix.com.
Live call access information: Dial-in number: (877) 407-4019 (U.S.) or (201) 689-8337 (outside the U.S.)
The conference call and webcast will include forward-looking information.
Investor Inquiries
Thomas J. Dinges, CFA
Director of Investor Relations
408-474-0080
Tom.Dinges@calix.com
About Calix
Calix cloud and software platforms enable service providers of all types and sizes to innovate and transform. Our customers utilize the real-time data and insights from Calix platforms to simplify their businesses and deliver experiences that excite their subscribers. The resulting growth in subscriber acquisition, loyalty and revenue creates more value for their businesses and communities. This is the Calix mission; to enable broadband service providers of all sizes to simplify, excite and grow.
Forward-Looking Statements
Statements made in this stockholder letter and the earnings call referencing the stockholder letter that are not statements of historical fact are forward-looking statements. Forward-looking statements are subject to the “safe harbor” provisions of the Private Securities Litigation Reform Act of 1995. Forward-looking statements relate to, but are not limited to, statements about the impact of the coronavirus pandemic, potential customer or market opportunities, growth and pipeline opportunities, customer demand or the sustainability of continued demand, anticipated customer purchase trends, expected customer and product mix or anticipated adoption or deployment of our platforms, systems or services offerings, industry, market and customer trends, opportunities with existing and prospective customers, the ongoing management of our global supply chain and logistics, free cash flow and liquidity, and future financial performance (including the outlook for the third quarter of 2021). Forward-looking statements are subject to risks and uncertainties that could cause actual results to differ materially from expectations, including but not limited to fluctuations in our financial and operating results, the capital spending decisions of our customers, changes and disruptions in the market and industry, availability of capital in the market, changes in and impacts of regulations and/or government sponsored programs, competition, our ability to achieve market acceptance of our platforms, systems and solutions, our ability to grow our customer base, fluctuations in costs associated with our systems and services including higher costs, third-party dependencies for production and resource management associated with our global supply chain that may cause delays in production, protracted product shortages and unavailability of systems to meet customer orders, which may be substantial, cost overruns, disruptions in global trade and relations, sustained or additional economic disruptions due to the COVID-19 pandemic, social unrest and political uncertainties and other unanticipated factors, as well as the risks and uncertainties described in our annual reports on Form 10-K and our quarterly reports on Form 10-Q, each as filed with the SEC and available at www.sec.gov, particularly in the sections titled “Risk Factors.” Forward-looking statements speak only as of the date the statements are made and are based on information available to us at the time those statements are made and/or management’s good faith belief as of that time with respect to future events. Calix assumes no obligation to update forward-looking statements to reflect actual performance or results, changes in assumptions or changes in other factors affecting forward-looking information, except to the extent required by applicable securities laws. Accordingly, investors should not place undue reliance on any forward-looking statements.
Use of Non-GAAP Financial Information
The Company uses certain non-GAAP financial measures in this stockholder letter to supplement its consolidated financial statements, which are presented in accordance with U.S. GAAP. These non-GAAP measures include non-GAAP gross margin, non-GAAP operating expenses, non-GAAP net income (loss), non-GAAP net income per diluted common share and non-GAAP free cash flow. These non-GAAP measures are provided to enhance the reader’s understanding of the Company’s operating performance as they primarily exclude restructuring charges, non-cash charges for stock-based compensation, component inventory accrual associated with our reduction and consolidation of legacy product lines, intangible asset amortization and U.S. tariff and tariff-related costs (refunds), which the Company believes are not indicative of its core operating results. Management believes that the non-GAAP measures used in this stockholder letter provide investors with
important perspectives into the Company’s ongoing business performance and management uses these non-GAAP measures to evaluate financial results and to establish operational goals. The presentation of these non-GAAP measures is not meant to be a substitute for results presented in accordance with GAAP, but rather should be evaluated in conjunction with those GAAP results. A reconciliation of the non-GAAP results to the most directly comparable GAAP results is provided in this stockholder letter. The non-GAAP financial measures used by the Company may be calculated differently from, and therefore may not be comparable to, similarly titled measures used by other companies.
| | | | | | | | | | | | | | | | | | | | | | | | | | | | | | | | |
| Calix, Inc. |
| Condensed Consolidated Statements of Operations |
| (Unaudited, in thousands, except per share data) |
| | | | | | | | | | |
| | | | Three Months Ended | | Six Months Ended |
| | | | July 3, | | June 27, | | July 3, | | June 27, |
| | | | 2021 | | 2020 | | 2021 | | 2020 |
| Revenue: | | | | | | |
| Systems | | $ | 159,553 | | | $ | 110,841 | | | $ | 312,855 | | | $ | 205,350 | |
| Services | | 9,117 | | | 8,182 | | | 17,889 | | | 15,355 | |
| | Total revenue | | 168,670 | | | 119,023 | | | 330,744 | | | 220,705 | |
| Cost of revenue: | | | | | | | | |
| Systems | | 72,673 | | | 56,721 | | | 142,336 | | | 107,429 | |
| Services | | 6,378 | | | 5,897 | | | 12,547 | | | 11,247 | |
| | Total cost of revenue | | 79,051 | | | 62,618 | | | 154,883 | | | 118,676 | |
| Gross profit | | 89,619 | | | 56,405 | | | 175,861 | | | 102,029 | |
| Operating expenses: | | | | | | | | |
| Sales and marketing | | 29,710 | | | 21,343 | | | 57,761 | | | 41,967 | |
| Research and development | | 25,716 | | | 20,921 | | | 50,080 | | | 41,592 | |
| General and administrative | | 13,664 | | | 11,193 | | | 26,689 | | | 21,862 | |
| Restructuring charges | | — | | | 6,286 | | | — | | | 6,286 | |
| | | | | | | | | |
| | Total operating expenses | | 69,090 | | | 59,743 | | | 134,530 | | | 111,707 | |
| Income (loss) from operations | | 20,529 | | | (3,338) | | | 41,331 | | | (9,678) | |
| Interest and other income (expense), net: | | | | | | | | |
| Interest expense, net | | (119) | | | (617) | | | (244) | | | (907) | |
| Other income (expense), net | | 255 | | | (109) | | | 343 | | | (94) | |
| | Total interest and other income (expense), net | | 136 | | | (726) | | | 99 | | | (1,001) | |
| Income (loss) before provision for income taxes | | 20,665 | | | (4,064) | | | 41,430 | | | (10,679) | |
| Provision for income taxes | | 207 | | | 148 | | | 357 | | | 477 | |
| Net income (loss) | | $ | 20,458 | | | $ | (4,212) | | | $ | 41,073 | | | $ | (11,156) | |
| Net income (loss) per common share: | | | | | | | | |
| | Basic | | $ | 0.32 | | | $ | (0.07) | | | $ | 0.65 | | | $ | (0.20) | |
| | Diluted | | $ | 0.30 | | | $ | (0.07) | | | $ | 0.61 | | | $ | (0.20) | |
| Weighted average number of shares used to compute net income (loss) per common share: | | | | | | | |
| | Basic | | 63,042 | | | 57,261 | | | 62,795 | | | 56,906 | |
| | Diluted | | 67,634 | | | 57,261 | | | 67,347 | | | 56,906 | |
| | | | | | | | | | |
| | | | | | | | | | | | | | |
| Calix, Inc. |
| Condensed Consolidated Balance Sheets |
| (Unaudited, in thousands) |
| | | | |
| | July 3, | | December 31, |
| | 2021 | | 2020 |
| ASSETS |
| Current assets: | | | | |
| Cash and cash equivalents | | $ | 58,590 | | | $ | 80,807 | |
| Marketable securities | | 117,259 | | | 52,982 | |
| Accounts receivable, net | | 80,164 | | | 69,419 | |
| Inventory | | 77,136 | | | 52,268 | |
| Prepaid expenses and other current assets | | 17,449 | | | 11,414 | |
| Total current assets | | 350,598 | | | 266,890 | |
| Property and equipment, net | | 19,663 | | | 20,381 | |
| Right-of-use operating leases | | 10,983 | | | 11,741 | |
| Goodwill | | 116,175 | | | 116,175 | |
| Other assets | | 10,416 | | | 12,165 | |
| | $ | 507,835 | | | $ | 427,352 | |
| LIABILITIES AND STOCKHOLDERS’ EQUITY |
| Current liabilities: | | | | |
| Accounts payable | | $ | 34,971 | | | $ | 13,115 | |
| Accrued liabilities | | 58,627 | | | 68,736 | |
| Deferred revenue | | 23,951 | | | 19,189 | |
| Total current liabilities | | 117,549 | | | 101,040 | |
| Long-term portion of deferred revenue | | 21,307 | | | 19,904 | |
| Operating leases | | 11,920 | | | 12,946 | |
| Other long-term liabilities | | 11,421 | | | 13,137 | |
| Total liabilities | | 162,197 | | | 147,027 | |
| Stockholders’ equity: | | | | |
| Common stock | | 1,580 | | | 1,553 | |
| Additional paid-in capital | | 972,259 | | | 948,055 | |
| Accumulated other comprehensive loss | | (182) | | | (191) | |
| Accumulated deficit | | (628,019) | | | (669,092) | |
| Total stockholders’ equity | | 345,638 | | | 280,325 | |
| | $ | 507,835 | | | $ | 427,352 | |
| | | | | | | | | | | | | | |
| Calix, Inc. |
| Condensed Consolidated Statements of Cash Flows |
| (Unaudited, in thousands) |
| | | | |
| | Six Months Ended |
| | July 3, | | June 27, |
| | 2021 | | 2020 |
| Operating activities: | | | | |
| Net income (loss) | | $ | 41,073 | | | $ | (11,156) | |
| Adjustments to reconcile net income (loss) to net cash provided by operating activities: | | | | |
| Stock-based compensation | | 11,394 | | | 6,225 | |
| Depreciation and amortization | | 7,737 | | | 7,006 | |
| Asset retirements and write-downs | | — | | | 3,749 | |
| | | | |
| | | | |
| | | | |
| Changes in operating assets and liabilities: | | | | |
| Accounts receivable, net | | (10,745) | | | (12,082) | |
| Inventory | | (24,868) | | | 3,494 | |
| | | | |
| Prepaid expenses and other assets | | (6,390) | | | 1,175 | |
| Accounts payable | | 21,918 | | | (671) | |
| Accrued liabilities | | (10,184) | | | 7,868 | |
| Deferred revenue | | 6,164 | | | (947) | |
| Other long-term liabilities | | (2,742) | | | (726) | |
| Net cash provided by operating activities | | 33,357 | | | 3,935 | |
| Investing activities: | | | | |
| Purchases of property and equipment | | (3,928) | | | (4,480) | |
| Purchases of marketable securities | | (147,277) | | | — | |
| Maturities of marketable securities | | 83,000 | | | — | |
| Net cash used in investing activities | | (68,205) | | | (4,480) | |
| Financing activities: | | | | |
| Proceeds from common stock issuances related to employee benefit plans | | 12,837 | | | 10,319 | |
| | | | |
| | | | |
| | | | |
| | | | |
| Payments related to financing arrangements | | (212) | | | (1,529) | |
| Proceeds from line of credit | | — | | | 30,000 | |
| Repayments of line of credit | | — | | | (34,000) | |
| Payments to originate the line of credit | | — | | | (285) | |
| Net cash provided by financing activities | | 12,625 | | | 4,505 | |
| Effect of exchange rate changes on cash and cash equivalents | | 6 | | | (237) | |
| Net increase (decrease) in cash and cash equivalents | | (22,217) | | | 3,723 | |
| Cash and cash equivalents at beginning of period | | 80,807 | | | 47,457 | |
| Cash and cash equivalents at end of period | | $ | 58,590 | | | $ | 51,180 | |
| | | | | | | | | | | | | | | | | | | | | | | | | | | | | | | | | | | | | | | | | | | | | | | | | | | | | | | | | | | | | | |
| Calix, Inc. |
| Reconciliation of GAAP to Non-GAAP Systems Gross Margin and Gross Margin |
| (Unaudited) |
| | Three Months Ended |
| | July 3,
2021 | | April 3,
2021 | | December 31,
2020 | | September 26,
2020 | | June 27,
2020 |
| | Systems Gross Margin | | Gross Margin | | Systems Gross Margin | | Gross Margin | | Systems Gross Margin | | Gross Margin | | Systems Gross Margin | | Gross Margin | | Systems Gross Margin | | Gross Margin |
| GAAP amount | | 54.5 | % | | 53.1 | % | | 54.6 | % | | 53.2 | % | | 53.2 | % | | 52.4 | % | | 51.6 | % | | 50.5 | % | | 48.8 | % | | 47.4 | % |
| Adjustments to GAAP amount: | | | | | | | | | | | | | | | | | | | | |
| Stock-based compensation | | 0.1 | | | 0.2 | | | 0.1 | | | 0.2 | | | 0.1 | | | 0.2 | | | 0.1 | | | 0.2 | | | 0.1 | | | 0.1 | |
| Intangible asset amortization | | 0.4 | | | 0.4 | | | 0.4 | | | 0.4 | | | 0.4 | | | 0.3 | | | 0.5 | | | 0.4 | | | 0.6 | | | 0.6 | |
| U.S. tariff and tariff-related costs (refund) | | (1.0) | | | (0.9) | | | — | | | — | | | 0.3 | | | 0.3 | | | 0.4 | | | 0.4 | | | 0.7 | | | 0.6 | |
| Component inventory accrual | | — | | | — | | | — | | | — | | | — | | | — | | | — | | | — | | | 1.6 | | | 1.5 | |
| Non-GAAP amount | | 54.0 | % | | 52.8 | % | | 55.1 | % | | 53.8 | % | | 54.0 | % | | 53.2 | % | | 52.6 | % | | 51.5 | % | | 51.8 | % | | 50.2 | % |
| | | | | | | | | | | | | | | | | | | | | | | | | | | | | | | | |
| Calix, Inc. |
| Reconciliation of GAAP to Non-GAAP Operating Expenses |
| (Unaudited, in thousands) |
| | | | | | |
| | Three Months Ended |
| | July 3, | | April 3, | | December 31, | | September 26, | | June 27, |
| | 2021 | | 2021 | | 2020 | | 2020 | | 2020 |
| GAAP operating expenses | | $ | 69,090 | | | $ | 65,440 | | | $ | 64,241 | | | $ | 54,225 | | | $ | 59,743 | |
| Adjustments to GAAP amount: | | | | | | | | | | |
| Stock-based compensation | | (5,881) | | | (4,859) | | | (3,835) | | | (3,312) | | | (3,025) | |
| Restructuring charges | | — | | | — | | | — | | | — | | | (6,286) | |
| Non-GAAP operating expenses | | $ | 63,209 | | | $ | 60,581 | | | $ | 60,406 | | | $ | 50,913 | | | $ | 50,432 | |
| | | | | | | | | | | | | | | | | | | | | | | | | | | | | | | | |
| Calix, Inc. |
| Non-GAAP Free Cash Flow Reconciliation |
| (Unaudited, in thousands) |
| | | | | | |
| | Three Months Ended |
| | July 3, | | April 3, | | December 31, | | September 26, | | June 27, |
| | 2021 | | 2021 | | 2020 | | 2020 | | 2020 |
| Net cash provided by operating activities | | $ | 23,459 | | | $ | 9,898 | | | $ | 30,473 | | | $ | 17,000 | | | $ | 2,687 | |
| Purchases of property and equipment | | (1,654) | | | (2,274) | | | (2,202) | | | (1,138) | | | (2,750) | |
| Non-GAAP free cash flow | | $ | 21,805 | | | $ | 7,624 | | | $ | 28,271 | | | $ | 15,862 | | | $ | (63) | |
| | | | | | | | | | | | | | | | | | | | | | | | | | | | | | | | | | | |
| Calix, Inc. |
| Reconciliation of GAAP Net Income (Loss) to Non-GAAP Net Income |
| (Unaudited, in thousands) |
| | Three Months Ended | |
| | July 3, | | April 3, | | December 31, | | September 26, | | June 27, | |
| | 2021 | | 2021 | | 2020 | | 2020 | | 2020 | |
| GAAP net income (loss) | | $ | 20,458 | | | $ | 20,615 | | | $ | 24,102 | | | $ | 20,538 | | | $ | (4,212) | | |
| Adjustments to GAAP amount: | | | | | | | | | | | |
| Stock-based compensation | | 6,223 | | | 5,171 | | | 4,160 | | | 3,574 | | | 3,241 | | |
| Intangible asset amortization | | 658 | | | 658 | | | 658 | | | 658 | | | 658 | | |
| U.S. tariff and tariff-related costs (refund) | | (1,494) | | | — | | | 520 | | | 621 | | | 723 | | |
| Restructuring charges | | — | | | — | | | — | | | — | | | 6,286 | | |
| Component inventory accrual | | — | | | — | | | — | | | — | | | 1,793 | | |
| Non-GAAP net income | | $ | 25,845 | | | $ | 26,444 | | | $ | 29,440 | | | $ | 25,391 | | | $ | 8,489 | | |
| | | | | | | | | | | |
| | | | | | | | |
| Calix, Inc. |
| Reconciliation of GAAP to Non-GAAP Net Income Per Diluted Common Share |
| (Unaudited) |
| | Three Months Ended July 3, 2021 |
| |
| GAAP net income per diluted common share | | $ | 0.30 | |
| Adjustments to GAAP amount: | | |
| Stock-based compensation | | 0.09 | |
| Intangible asset amortization | | 0.01 | |
| U.S. tariff refund | | (0.02) | |
Non-GAAP net income per diluted common share (1) | | $ | 0.38 | |
(1) Based on 67.6 million weighted-average diluted common shares outstanding.
| | | | | | | | | | | | | | | | | | | | | | | | | | |
| Calix, Inc. |
| Reconciliation of GAAP to Non-GAAP Guidance |
| (Unaudited, dollars in thousands, except per share data) |
| Three Months Ending October 2, 2021 |
| | GAAP | | Stock-Based Compensation | | Intangible
Asset Amortization | | Non-GAAP |
| Gross margin | | 49.9% - 51.9% | | 0.2% | | 0.4% | | 50.5% - 52.5% |
| Operating expenses | | $ 70,900 - $ 73,900 | | $ (5,900) | | $ - | | $ 65,000 - $ 68,000 |
Net income per diluted common share(1) | | $ 0.16 - $ 0.20 | | $ 0.09 | | $ 0.01 | | $ 0.26 - $ 0.30 |
(1) Based on 68.0 million weighted-average diluted common shares outstanding.