Exhibit 99.2
July 25, 2022
Fellow Calix stockholders:
For the second quarter of 2022, the Calix team executed with excellence as we delivered record quarterly revenue despite the ongoing global supply challenge. Moreover, the power of our All Platform model continued to drive robust demand in the form of strong bookings and an acceleration in our transformation. Demand for our All Platform software, systems and services comprised more than 80% of our total bookings in the quarter, up from 70% just one quarter ago. We are seeing an increasing number of service providers of all types and sizes looking to become Broadband Service Providers (BSPs) simplifying their businesses, exciting their subscribers and growing their value. The secular disruption moving through the service provider marketplace is gaining momentum and will continue for at least the next decade. Our unique All Platform model positions us perfectly to help the next generation of BSPs succeed.
Our All Platform strategy enables us to focus our investments for the benefit of our BSP customers and their subscribers. Our relentless cadence of agile innovation yields continuous advancements, which enables our BSP customers to be recognized as the technology leaders by their subscribers. Furthermore, our focused product offerings allow us to continue to outperform in a very challenging supply environment. Our supply chain team again performed with excellence as we strive to meet subscriber demand for our BSP customers’ service offerings. To be clear, we do not believe the supply chain will normalize at any time in the foreseeable future, and we remain resolute in our focus in this difficult environment.
Our mission is to enable our BSP customers of all types and sizes to simplify their business, excite their subscribers and grow their value. We continued to make progress on our mission this quarter with an increasing number of BSP customers leveraging the full capabilities of our platforms to grow their businesses. In addition, our platforms continue to be recognized by the technology industry. A few of our recent awards include:
•Cloud Computing Magazine named Calix Operations Cloud the 2022 Cloud Computing Product of the Year.
•Cyber Defense Magazine’s 2022 Global InfoSec Award recognized ProtectIQ® home network cybersecurity for “Best in Anti-Phishing, Network Security and Management.”
•The Broadband Multimedia Marketing Association has recognized Calix with a 2022 Best-in-Class Marketing Award for its Market Activation Program, marking the fifth year in a row the company has taken the top prize in this category.
•The Fiber Broadband Association presented to Calix Best Community Impact Award for its “Deliver a Superior Subscriber Experience in a Rapidly Changing Environment” proof of concept.
As a broadband cloud and software platform business, we are confident our financial performance improvement will manifest across four measurable objectives over the long term:
•Deliberate revenue growth
•Gross margin expansion
•Disciplined operating expense investment
•Increased predictability
Examples of our progress made in the quarter were:
•Added 34 new BSP customers in the quarter.
•Cloud customer count continues to increase with total Calix Marketing Cloud customers increasing by 38% compared with the year ago quarter.
•Record quarter for the EXOS platform with revenue up more than 129% compared with the year ago quarter as both new and existing customers continue to accelerate deployments of the Revenue EDGE solution.
•Record quarter for the AXOS platform with revenue increased by 73% compared with the year ago quarter driven by the technology upgrade cycle to XGS PON.
Our near-term focus is on serving the needs of our BSP customers, while our long-term focus remains on finding like-minded BSP customers regardless of their type, size or location. Furthermore, we remain committed to aligning our investments to our mission, vision and strategy and maintaining strong discipline over our operating expenses. Over the long term, we believe this focus will drive continued improvement in our financial performance.
Second Quarter 2022 Financial Results
| | | | | | | | | | | |
| Actual GAAP | Actual Non-GAAP | Guidance Non-GAAP(1) |
| Revenue | $202.0m | $202.0m | $192m – $198m |
| Gross margin | 49.6% | 50.1%(2) | 49.0% – 51.0%(2) |
| Operating expenses | $90.5m | $81.1m(2) | $79.0m – $82.0m(2) |
| Net income per diluted common share | $0.11 | $0.22(2) | $0.15 – $0.20(2) |
| | | | | | | |
| (1) | Guidance provided on April 25, 2022 | | |
| (2) | Non-GAAP excludes items such as stock-based compensation, intangible asset amortization and a U.S. tariff refund as well as the income tax impact of these items. See GAAP to non-GAAP reconciliations beginning on page 14. | | |
| | | |
| | | |
| | | |
| | | |
| | | |
| | | |
| | | |
| | | |
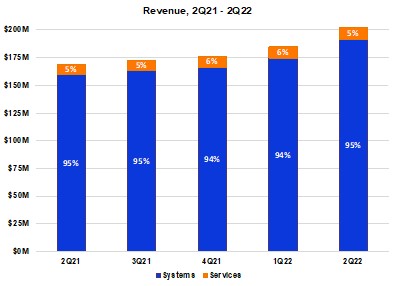
Demand was robust throughout the second quarter of 2022, and our supply chain team outperformed expectations despite the continued challenging global environment for component sourcing and supply chain logistics. Total revenue was above the high end of our guidance and increased 20% compared with the year ago quarter. Systems revenue for the second quarter of 2022 increased 20% compared with the year ago quarter with continued strong demand for our All Platform offerings, more than offsetting the decreased purchases of our legacy systems, as service providers continue to respond to higher subscriber demand for improved and next-generation services. Compared with the prior quarter, systems revenue increased 10% as our supply chain team was able to meet increased demand. Services revenue increased 19% compared with the year ago quarter due to the continued ramp of our next generation services. Compared with the prior quarter, services revenue increased 3%. We continue to align our services business with our All Platform model through the introduction of higher differentiated-value services.
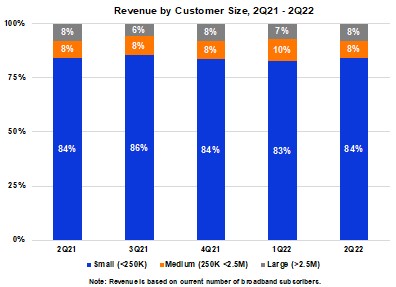
Revenue from small customers was 84% of total revenue in the second quarter of 2022 and consistent with the year ago period but increased 20% in absolute dollars due to strength in demand for our All Platform offerings offsetting decreased purchases of our legacy systems. Revenue from medium-sized customers was 8% of total revenue in the second quarter of 2022 and the same as the year ago period, but increased 24% in absolute dollars, reflecting a classification shift for several customers due to subscriber growth and mergers. Revenue from large customers was 8% of total revenue in the second quarter of 2022 and consistent with the year ago period but increased 14% in absolute dollars, primarily
due to greater shipments to a couple customers. We continue to focus on finding strategically aligned customers of all types and sizes for our All Platform offerings.U.S. revenue was 91% of total revenue in the second quarter of 2022 and increased 33% compared with the year ago quarter and increased 11% sequentially. This increase is primarily due to continued sales and marketing investments in the U.S. to address the significant opportunity ahead. International revenue was 9% of total revenue in the second quarter and decreased 40% compared with the year ago quarter and decreased 6% sequentially primarily due to lower shipments to a European customer.
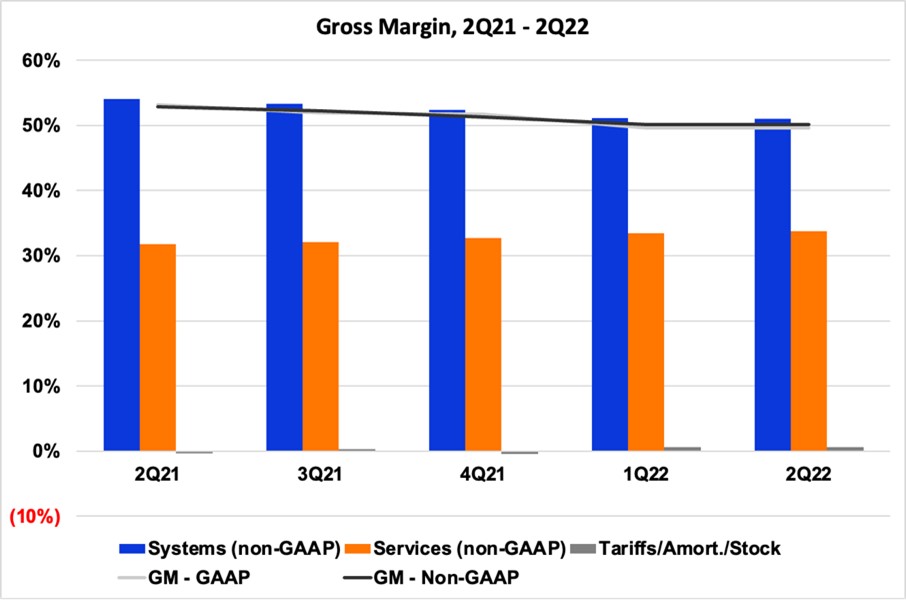
Supply chain challenges continue to impact our GAAP and non-GAAP gross margin. While we achieved another quarter of growth in our All Platform offerings, this positive trend was offset by significantly higher component and logistics costs in the quarter. Specifically, GAAP gross margin decreased 350 basis points year over year to 49.6%, and non-GAAP gross margin decreased 270 basis points to 50.1%. On a GAAP basis, systems gross margin decreased 390 basis points compared with the year ago quarter, and 10 basis points sequentially, to 50.6% due to higher component and logistics costs. On a non-GAAP basis, systems gross margin of 51.0% decreased 300 basis points year-over-year due to higher component and logistics costs, which more than offset the benefit from continued growth in our All Platform offerings as a percent of revenue. Sequentially, systems gross margin on a non-GAAP basis decreased 10 basis points due to higher component and logistics costs. Services gross margin on a GAAP and non-GAAP basis increased 170 and 200 basis points, respectively, compared with the year ago quarter primarily due to the continued ramp of services in support of our All Platform offerings. Sequentially, services gross margin on a GAAP basis increased 50 basis points and on a non-GAAP basis increased 30 basis points, respectively, due to higher revenue and the continued ramp of our next generation services.
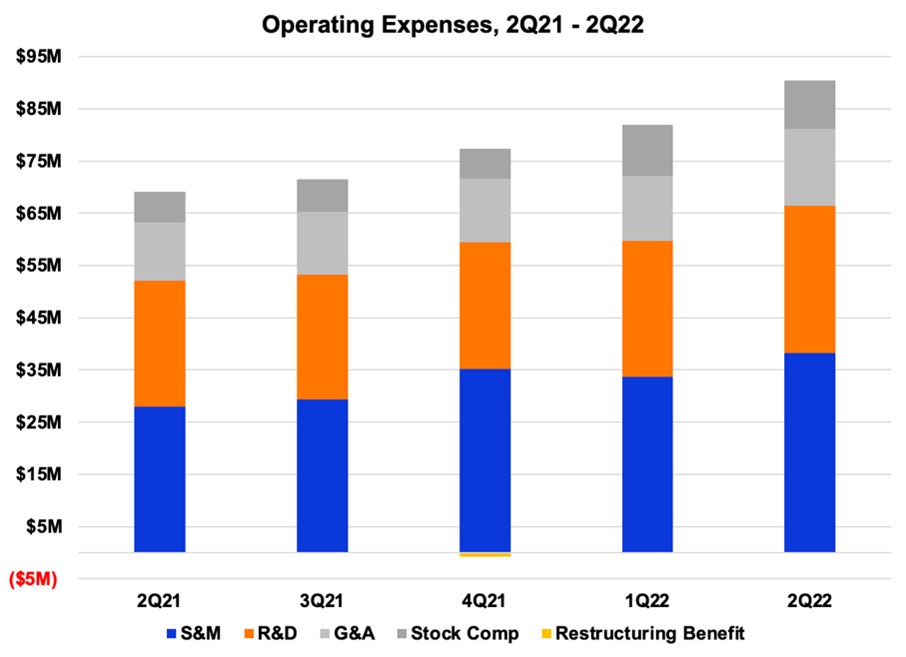
Compared with the year ago quarter, GAAP and non-GAAP operating expenses increased by 31% and 28%, respectively, primarily due to headcount increases in sales and marketing, a higher level of investments in research and development programs and continued investments in our IT systems. Sequentially, GAAP and non-GAAP operating expenses increased by 10% and 13%, respectively, primarily due to increased headcount.
Non-GAAP operating expenses were at the high-end of our guidance range primarily due to higher headcount during the quarter. Relative to our non-GAAP target financial model, sales and marketing investments were 19% of revenue, which is at the high end of our target financial model range of 17% to 19% primarily due to higher headcount. Research and development investments were 29% of systems gross profit, which is just under our target financial model level of 30%. General and administrative investments were 7% of revenue, below our target financial model level of 8%. We expect to maintain our operating expense discipline and align our investments with our target financial model to capitalize on the opportunity ahead.
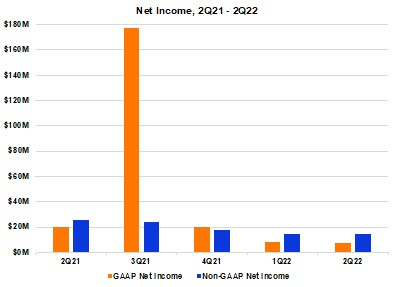
On a GAAP basis, our net income of $7.5 million for the second quarter of 2022 decreased $12.9 million year-over-year due primarily to our investments in operating expenses being consistent with our target financial model in the current period versus falling short in the year ago period, lower gross margin from supply chain headwinds and increases in stock-based compensation and income taxes. Compared with the prior quarter, our GAAP net income was lower by $0.6 million primarily because of higher income taxes. Our GAAP net income for the second quarter of 2022 included stock-based compensation of $10.0 million, intangible asset amortization of $0.7 million and a U.S. tariff refund of $0.3 million partially offset by the income tax effect of these items of $3.1 million. Compared with the year ago period, our non-GAAP net income for the second quarter of 2022 decreased $11.0 million to a net income of $14.8 million from a net income of $25.8 million primarily due to higher income taxes of $5.1 million as we began providing for income taxes in 2022 as our valuation allowance reversed in the third quarter of 2021 and lower gross margin as a result of increased component and logistics costs. We are also now investing at
a rate more consistent with our target financial model. Compared with the prior quarter, our non-GAAP net income decreased $0.3 million from $15.0 million.
Balance Sheet and Cash Flow
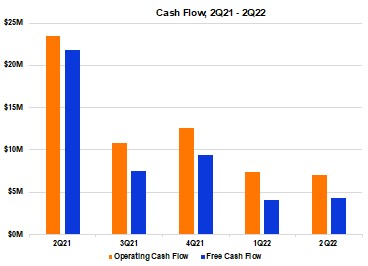
We ended the quarter with record cash and investments of $224.9 million, a sequential increase of $11.8 million. The increase was primarily the result of the proceeds from equity-based employee benefit plans of $8.5 million and positive non-GAAP free cash flow of $4.4 million. We continued to generate positive operating and non-GAAP free cash flow and expect this trend will continue. Given a challenging supply chain environment, our inventory remains elevated to improve our responsiveness to customer demand. Compared with the year ago quarter, our cash and investments increased by $49.0 million primarily due to positive free cash flow of $25.4 million and proceeds from equity-based employee benefit plans of $27.3 million.
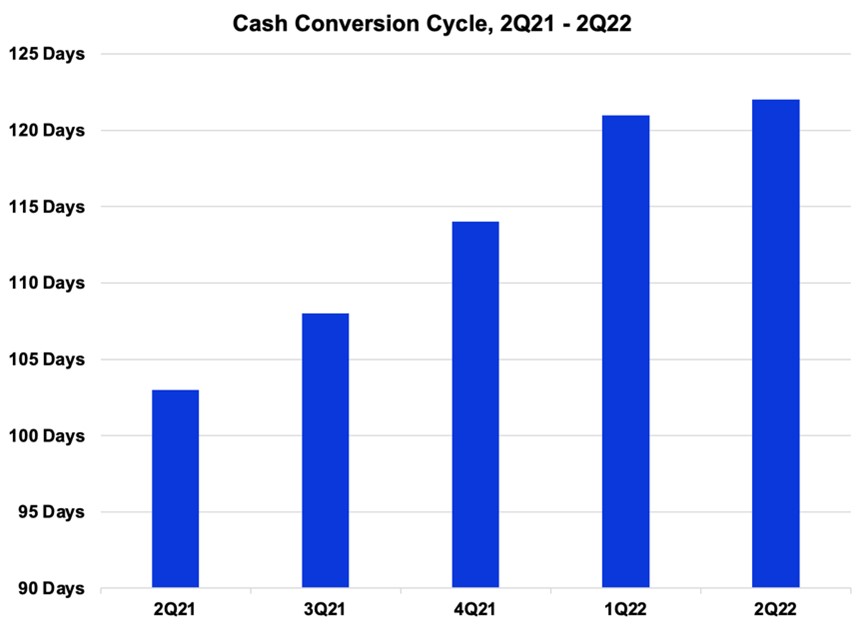
Our team remains focused on operational excellence and customer satisfaction. During the second quarter of 2022, our supply chain team outperformed expectations despite continued challenges in component supply and logistics. Costs remain elevated, lead times remain extended, port congestion continued and de-commits, while fewer, were still challenging. In response, we continue to qualify new suppliers, incur higher component and expediting costs and adjust to extended component delivery lead times and end-of-sales notifications, including the design of products with alternative components. Our days sales outstanding (DSO) at quarter end was 39 days, which was five days lower than the prior quarter and 4 days lower than the prior year, reflecting solid shipment linearity during the quarter despite ongoing supply chain disruptions. Our target financial model for DSO remains between 35 and 45 days. Inventory turns were 3.5 at quarter end, up slightly from the prior quarter’s 3.3 turns and down from 3.8 turns in the year ago quarter. This aligns with our target financial model for inventory turns to be between
3 and 4 to better support the needs of our customers. The year-over-year decrease in inventory turns in the quarter were the result of a higher level of inventory. Days payable outstanding (DPO) at quarter end was 22 days, down 11 days from the prior quarter and down 15 days from the year ago quarter. Our target financial model for DPO is to be between 25 and 35 days. Our cash conversion cycle was 122 days compared with 121 days in the prior quarter mostly due to lower DPO offset by lower DSO. Compared with the year ago quarter, our cash conversion cycle increased 19 days as the lower DPO and inventory turns more than offset the lower DSO. Our target financial model remains for our cash conversion cycle to be between 100 and 130 days.
We believe our existing cash and investments and expected positive non-GAAP free cash flow will provide us with sufficient liquidity for our business. While we will continue to maintain a strong balance sheet to ensure our growth, our Board of Directors has authorized a one-year stock repurchase program to purchase up to $100 million of our common stock.
Third Quarter 2022 Guidance
| | | | | | | | |
|
Guidance Non-GAAP | Guidance Reconciled to GAAP |
| Revenue | $211m – $217m | $211m – $217m |
| Gross margin | 49.0% – 51.0%(1) | 48.4% – 50.4% |
| Operating expenses | $85.0m – $88.0m(1) | $95.3m – $99.3m |
Net income per diluted common share(2) | $0.18 – $0.24(1) | $0.04 – $0.10 |
| | | | | | | |
| (1) | Non-GAAP excludes items such as stock-based compensation and intangible asset amortization as well as the income tax impact of these items. See GAAP to non-GAAP reconciliation on page 15. | | |
| (2) | Based on 68.7 million weighted-average diluted common shares outstanding. | | |
| | | |
| | | |
| | | |
| | | |
| | | |
| | | |
| | | |
| | | |
Our guidance for the third quarter of 2022 ending October 1, 2022, reflects our expectations as of the date of this letter. These expectations reflect our current inventory level and assessment of supply chain and logistical challenges.
Our revenue guidance for the third quarter of 2022 at the mid-point is for a sequential increase of 6% and a year-over-year increase of approximately 24%.
Our non-GAAP gross margin guidance for the third quarter of 2022 at the mid-point represents a decrease of approximately 220 basis points relative to the year ago quarter. This reflects expectations of product mix and higher component and logistics costs only partially offset by a positive benefit from the continued increase of our All Platform offerings as a percent of total revenue. Non-GAAP gross margin continues to be burdened by increasing costs for components and logistics that will continue to flow through inventory for the foreseeable future. Compared with the prior quarter, we continue to expect our non-GAAP gross margin will remain close to 50% for all of 2022. While over the long-term, we expect the increase in our All Platform offerings as a percent of total revenue to positively benefit non-GAAP gross margin by 100 to 200 basis points per year starting next year.
Summary
Every day the magnitude of the opportunity becomes clearer while at the same time growing ever larger. Our relentless focus on seizing this opportunity begins with helping our customers succeed by enabling them to simplify, excite and grow.
Our All Platform software, cloud, associated systems and services offerings are resonating with customers of all types and sizes as evidenced by our 20% year-over-year revenue growth this quarter in spite of an incredibly challenging supply sourcing environment. Given our remaining performance obligations grew 77% year over year, it remains clear that we have the right platforms, solutions and services to achieve our mission and help BSPs of all types and sizes succeed.
We are in the early stages of an enormous secular opportunity, and our focus on executing the fundamentals to capture this opportunity will bring value to our customers and their subscribers and to our employees and stockholders. We sincerely thank our employees, customers, partners, vendors and stockholders for their continued support as we pursue our future.
Sincerely,
| | | | | | | | |
Carl Russo Chairman and CEO | Michael Weening President and COO |
Cory Sindelar CFO |
Conference Call
In conjunction with this announcement, Calix will host a conference call tomorrow, July 26, 2022, at 5:30 a.m. Pacific Time (8:30 a.m. Eastern Time) to answer questions regarding our second quarter 2022 financial results. A live audio webcast and replay of the call will be available in the Investor Relations section of the Calix website at http://investor-relations.calix.com.
Live call access information: Dial-in number: (877) 407-4019 (U.S.) or (201) 689-8337 (outside the U.S.) ID# 13730701
The conference call and webcast will include forward-looking information.
Investor Inquiries
Jim Fanucchi,
Darrow Associates, Inc.
investorrelations@calix.com
(408) 404-5400
About Calix
Calix cloud and software platforms enable service providers of all types and sizes to innovate and transform. Our customers utilize the real-time data and insights from Calix platforms to simplify their businesses and deliver experiences that excite their subscribers. The resulting growth in subscriber acquisition, loyalty and revenue creates more value for their businesses and communities. This is the Calix mission; to enable broadband service providers of all sizes to simplify, excite and grow.
Forward-Looking Statements
Statements made in this stockholder letter and the earnings call referencing the stockholder letter that are not statements of historical fact are forward-looking statements. Forward-looking statements are subject to the “safe harbor” provisions of the Private Securities Litigation Reform Act of 1995. Forward-looking statements relate to, but are not limited to, component and logistics costs, statements about the impact of the coronavirus pandemic, potential customer or market opportunities, growth and pipeline opportunities, customer demand or the sustainability of continued demand, anticipated customer purchase trends, expected customer and product mix or anticipated adoption or deployment of our platforms, systems or services offerings, industry, market and customer trends, opportunities with existing and prospective customers, free cash flow and liquidity, and future financial performance (including the outlook for the third quarter of 2022 and future periods and performance against our target financial model). Forward-looking statements are subject to risks and uncertainties that could cause actual results to differ materially from expectations, including but not limited to fluctuations in our financial and operating results, the capital spending decisions of our customers, changes and disruptions in the market and industry, availability of capital in the market, changes in and impacts of regulations and/or government sponsored programs, competition, our ability to achieve market acceptance of our platforms, systems and solutions, our ability to grow our customer base, fluctuations in costs associated with our systems and services including higher costs, dependence on third-parties for production and resource management associated with our global supply chain that may cause delays in production, protracted product shortages and unavailability of systems to meet customer orders (which may be substantial), cost overruns, disruptions in global trade and relations, social unrest and political uncertainties and other unanticipated factors, as well as the risks and uncertainties described in our annual reports on Form 10-K and our quarterly reports on Form 10-Q, each as filed with the SEC and available at www.sec.gov, particularly in the sections titled “Risk Factors.” Forward-looking statements speak only as of the date the statements are made and are based on information available to us at the time those statements are made and/or management’s good faith belief as of that time with respect to future events. Calix assumes no obligation to update forward-looking statements to reflect actual performance or results, changes in assumptions or changes in other
factors affecting forward-looking information, except to the extent required by applicable securities laws. Accordingly, investors should not place undue reliance on any forward-looking statements.
Use of Non-GAAP Financial Information
The Company uses certain non-GAAP financial measures in this stockholder letter to supplement its consolidated financial statements, which are presented in accordance with U.S. GAAP. These non-GAAP measures include non-GAAP gross margin, non-GAAP operating expenses, non-GAAP net income, non-GAAP net income per diluted common share and non-GAAP free cash flow. These non-GAAP measures are provided to enhance the reader’s understanding of the Company’s operating performance as they primarily exclude non-cash charges for stock-based compensation, intangible asset amortization, U.S. tariff refunds, restructuring benefit and impact from changes in income taxes, which the Company believes are not indicative of its core operating results. Management believes that the non-GAAP measures used in this stockholder letter provide investors with important perspectives into the Company’s ongoing business performance and management uses these non-GAAP measures to evaluate financial results and to establish operational goals. The presentation of these non-GAAP measures is not meant to be a substitute for results presented in accordance with GAAP, but rather should be evaluated in conjunction with those GAAP results. A reconciliation of the non-GAAP results to the most directly comparable GAAP results is provided in this stockholder letter. The non-GAAP financial measures used by the Company may be calculated differently from, and therefore may not be comparable to, similarly titled measures used by other companies.
| | | | | | | | | | | | | | | | | | | | | | | | | | | | | | | | |
| Calix, Inc. |
| Condensed Consolidated Statements of Income |
| (Unaudited, in thousands, except per share data) |
| | | | | | | | | | |
| | | | Three Months Ended | | Six Months Ended |
| | | | July 2, | | July 3, | | July 2, | | July 3, |
| | | | 2022 | | 2021 | | 2022 | | 2021 |
| Revenue: | | | | | | |
| Systems | | $ | 191,195 | | | $ | 159,553 | | | $ | 365,621 | | | $ | 312,855 | |
| Services | | 10,847 | | | 9,117 | | | 21,369 | | | 17,889 | |
| | Total revenue | | 202,042 | | | 168,670 | | | 386,990 | | | 330,744 | |
| Cost of revenue: | | | | | | | | |
| Systems | | 94,448 | | | 72,673 | | | 180,361 | | | 142,336 | |
| Services | | 7,414 | | | 6,378 | | | 14,657 | | | 12,547 | |
| | Total cost of revenue | | 101,862 | | | 79,051 | | | 195,018 | | | 154,883 | |
| Gross profit | | 100,180 | | | 89,619 | | | 191,972 | | | 175,861 | |
| Operating expenses: | | | | | | | | |
| Sales and marketing | | 41,138 | | | 29,710 | | | 77,229 | | | 57,761 | |
| Research and development | | 30,430 | | | 25,716 | | | 60,247 | | | 50,080 | |
| General and administrative | | 18,911 | | | 13,664 | | | 34,942 | | | 26,689 | |
| | | | | | | | | |
| | | | | | | | | |
| | Total operating expenses | | 90,479 | | | 69,090 | | | 172,418 | | | 134,530 | |
| Operating income | | 9,701 | | | 20,529 | | | 19,554 | | | 41,331 | |
| Interest and other income (expense), net: | | | | | | | | |
| Interest income (expense), net | | 240 | | | (119) | | | 275 | | | (244) | |
| Other income (expense), net | | (272) | | | 255 | | | (340) | | | 343 | |
| | Total interest and other income (expense), net | | (32) | | | 136 | | | (65) | | | 99 | |
| Income before income taxes | | 9,669 | | | 20,665 | | | 19,489 | | | 41,430 | |
| Income taxes | | 2,148 | | | 207 | | | 3,849 | | | 357 | |
| Net income | | $ | 7,521 | | | $ | 20,458 | | | $ | 15,640 | | | $ | 41,073 | |
| Net income per common share: | | | | | | | | |
| | Basic | | $ | 0.12 | | | $ | 0.32 | | | $ | 0.24 | | | $ | 0.65 | |
| | Diluted | | $ | 0.11 | | | $ | 0.30 | | | $ | 0.23 | | | $ | 0.61 | |
| Weighted average number of shares used to compute net income per common share: | | | | | | | |
| | Basic | | 64,836 | | | 63,042 | | | 64,662 | | | 62,795 | |
| | Diluted | | 68,169 | | | 67,634 | | | 68,285 | | | 67,347 | |
| | | | | | | | | | |
| | | | | | | | | | | | | | |
| Calix, Inc. |
| Condensed Consolidated Balance Sheets |
| (Unaudited, in thousands) |
| | | | |
| | July 2, | | December 31, |
| | 2022 | | 2021 |
| ASSETS |
| Current assets: | | | | |
| Cash and cash equivalents | | $ | 51,516 | | | $ | 51,333 | |
| Marketable securities | | 173,369 | | | 153,002 | |
| Accounts receivable, net | | 86,128 | | | 85,219 | |
| Inventory | | 98,324 | | | 88,880 | |
| Prepaid expenses and other current assets | | 51,505 | | | 30,811 | |
| Total current assets | | 460,842 | | | 409,245 | |
| Property and equipment, net | | 22,029 | | | 21,783 | |
| Right-of-use operating leases | | 10,962 | | | 12,182 | |
| Deferred tax assets | | 167,928 | | | 168,962 | |
| Goodwill | | 116,175 | | | 116,175 | |
| Other assets | | 14,876 | | | 13,685 | |
| | $ | 792,812 | | | $ | 742,032 | |
| LIABILITIES AND STOCKHOLDERS’ EQUITY |
| Current liabilities: | | | | |
| Accounts payable | | $ | 22,951 | | | $ | 29,061 | |
| Accrued liabilities | | 74,782 | | | 71,597 | |
| Deferred revenue | | 33,511 | | | 27,478 | |
| Total current liabilities | | 131,244 | | | 128,136 | |
| Long-term portion of deferred revenue | | 24,709 | | | 22,016 | |
| Operating leases | | 10,584 | | | 12,376 | |
| Other long-term liabilities | | 9,146 | | | 11,076 | |
| Total liabilities | | 175,683 | | | 173,604 | |
| Stockholders’ equity: | | | | |
| Common stock | | 1,631 | | | 1,607 | |
| Additional paid-in capital | | 1,032,833 | | | 997,855 | |
| Accumulated other comprehensive loss | | (2,261) | | | (320) | |
| Accumulated deficit | | (415,074) | | | (430,714) | |
| Total stockholders’ equity | | 617,129 | | | 568,428 | |
| | $ | 792,812 | | | $ | 742,032 | |
| | | | | | | | | | | | | | |
| Calix, Inc. |
| Condensed Consolidated Statements of Cash Flows |
| (Unaudited, in thousands) |
| | | | |
| | Six Months Ended |
| | July 2, | | July 3, |
| | 2022 | | 2021 |
| Operating activities: | | | | |
| Net income | | $ | 15,640 | | | $ | 41,073 | |
| Adjustments to reconcile net income to net cash provided by operating activities: | | | | |
| Stock-based compensation | | 20,475 | | | 11,394 | |
| Depreciation and amortization | | 7,671 | | | 7,737 | |
| Deferred income taxes | | 1,034 | | | — | |
| | | | |
| | | | |
| | | | |
| Changes in operating assets and liabilities: | | | | |
| Accounts receivable, net | | (909) | | | (10,745) | |
| Inventory | | (9,445) | | | (24,868) | |
| Prepaid expenses and other assets | | (23,268) | | | (6,390) | |
| Accounts payable | | (6,060) | | | 21,918 | |
| Accrued liabilities | | 4,222 | | | (10,184) | |
| Deferred revenue | | 8,725 | | | 6,164 | |
| Other long-term liabilities | | (3,721) | | | (2,742) | |
| Net cash provided by operating activities | | 14,364 | | | 33,357 | |
| Investing activities: | | | | |
| Purchases of property and equipment | | (5,866) | | | (3,928) | |
| Purchases of marketable securities | | (103,286) | | | (147,277) | |
| Maturities of marketable securities | | 81,452 | | | 83,000 | |
| Net cash used in investing activities | | (27,700) | | | (68,205) | |
| Financing activities: | | | | |
| Proceeds from common stock issuances related to employee benefit plans | | 14,527 | | | 12,837 | |
| Payments related to financing arrangements | | (632) | | | (212) | |
| Net cash provided by financing activities | | 13,895 | | | 12,625 | |
| Effect of exchange rate changes on cash and cash equivalents | | (376) | | | 6 | |
| Net increase (decrease) in cash and cash equivalents | | 183 | | | (22,217) | |
| Cash and cash equivalents at beginning of period | | 51,333 | | | 80,807 | |
| Cash and cash equivalents at end of period | | $ | 51,516 | | | $ | 58,590 | |
| | | | | | | | | | | | | | | | | | | | | | | | | | | | | | | | | | | | | | | | | | | | | | | | | | | | | | | | | | | | | | |
| Calix, Inc. |
| Reconciliation of GAAP to Non-GAAP Systems Gross Margin and Gross Margin |
| (Unaudited) |
| | Three Months Ended |
| | July 2,
2022 | | April 2,
2022 | | December 31,
2021 | | October 2,
2021 | | July 3,
2021 |
| | Systems Gross Margin | | Gross Margin | | Systems Gross Margin | | Gross Margin | | Systems Gross Margin | | Gross Margin | | Systems Gross Margin | | Gross Margin | | Systems Gross Margin | | Gross Margin |
| GAAP amount | | 50.6 | % | | 49.6 | % | | 50.7 | % | | 49.6 | % | | 52.9 | % | | 51.7 | % | | 53.2 | % | | 52.0 | % | | 54.5 | % | | 53.1 | % |
| Adjustments to GAAP amount: | | | | | | | | | | | | | | | | | | | | |
| Stock-based compensation | | 0.2 | | | 0.3 | | | 0.2 | | | 0.3 | | | 0.1 | | | 0.2 | | | 0.1 | | | 0.1 | | | 0.1 | | | 0.2 | |
| Intangible asset amortization | | 0.3 | | | 0.3 | | | 0.4 | | | 0.4 | | | 0.4 | | | 0.4 | | | 0.4 | | | 0.4 | | | 0.4 | | | 0.4 | |
| U.S. tariff refunds | | (0.1) | | | (0.1) | | | (0.2) | | | (0.2) | | | (1.0) | | | (1.0) | | | (0.4) | | | (0.3) | | | (1.0) | | | (0.9) | |
| Non-GAAP amount | | 51.0 | % | | 50.1 | % | | 51.1 | % | | 50.1 | % | | 52.4 | % | | 51.3 | % | | 53.3 | % | | 52.2 | % | | 54.0 | % | | 52.8 | % |
| | | | | | | | | | | | | | | | | | | | | | | | | | | | | | | | |
| Calix, Inc. |
| Reconciliation of GAAP to Non-GAAP Operating Expenses |
| (Unaudited, in thousands) |
| | | | | | |
| | Three Months Ended |
| | July 2, | | April 2, | | December 31, | | October 2, | | July 3, |
| | 2022 | | 2022 | | 2021 | | 2021 | | 2021 |
| GAAP operating expenses | | $ | 90,479 | | | $ | 81,939 | | | $ | 76,617 | | | $ | 71,502 | | | $ | 69,090 | |
| Adjustments to GAAP amount: | | | | | | | | | | |
| Stock-based compensation | | (9,357) | | | (9,852) | | | (5,759) | | | (6,273) | | | (5,881) | |
| Restructuring benefit | | — | | | — | | | 786 | | | — | | | — | |
| Non-GAAP operating expenses | | $ | 81,122 | | | $ | 72,087 | | | $ | 71,644 | | | $ | 65,229 | | | $ | 63,209 | |
| | | | | | | | | | | | | | | | | | | | | | | | | | | | | | | | |
| Calix, Inc. |
| Non-GAAP Free Cash Flow Reconciliation |
| (Unaudited, in thousands) |
| | | | | | |
| | Three Months Ended |
| | July 2, | | April 2, | | December 31, | | October 2, | | July 3, |
| | 2022 | | 2022 | | 2021 | | 2021 | | 2021 |
| Net cash provided by operating activities | | $ | 6,999 | | | $ | 7,365 | | | $ | 12,619 | | | $ | 10,817 | | | $ | 23,459 | |
| Purchases of property and equipment | | (2,635) | | | (3,231) | | | (3,192) | | | (3,343) | | | (1,654) | |
| Non-GAAP free cash flow | | $ | 4,364 | | | $ | 4,134 | | | $ | 9,427 | | | $ | 7,474 | | | $ | 21,805 | |
| | | | | | | | | | | | | | | | | | | | | | | | | | | | | | | | | | | |
| Calix, Inc. |
| Reconciliation of GAAP Net Income to Non-GAAP Net Income |
| (Unaudited, in thousands) |
| | Three Months Ended | |
| | July 2, | | April 2, | | December 31, | | October 2, | | July 3, | |
| | 2022 | | 2022 | | 2021 | | 2021 | | 2021 | |
| GAAP net income | | $ | 7,521 | | | $ | 8,119 | | | $ | 19,881 | | | $ | 177,424 | | | $ | 20,458 | | |
| Adjustments to GAAP amount: | | | | | | | | | | | |
| Stock-based compensation | | 10,008 | | | 10,467 | | | 6,175 | | | 6,661 | | | 6,223 | | |
| Intangible asset amortization | | 658 | | | 658 | | | 658 | | | 658 | | | 658 | | |
| U.S. tariff refunds | | (274) | | | (367) | | | (1,749) | | | (621) | | | (1,494) | | |
| Restructuring benefit | | — | | | — | | | (786) | | | — | | | — | | |
| Impact from changes in income taxes | | — | | | — | | | (6,361) | | | (160,232) | | | — | | |
| Income tax effect of non-GAAP adjustments | | (3,128) | | | (3,834) | | | — | | | — | | | — | | |
| Non-GAAP net income | | $ | 14,785 | | | $ | 15,043 | | | $ | 17,818 | | | $ | 23,890 | | | $ | 25,845 | | |
| | | | | | | | | | | |
| | | | | | | | |
| Calix, Inc. |
Reconciliation of GAAP to Non-GAAP Net Income Per Diluted Common Share (1) |
| (Unaudited) |
| | Three Months Ended
July 2, 2022 |
| |
| GAAP net income per diluted common share | | $ | 0.11 | |
| Adjustments to GAAP amount: | | |
| Stock-based compensation | | 0.15 | |
| Intangible asset amortization | | 0.01 | |
| U.S. tariff refund | | (0.01) | |
| Income tax effect of non-GAAP adjustments | | (0.04) | |
| Non-GAAP net income per diluted common share | | $ | 0.22 | |
(1) Based on 68.2 million weighted-average diluted common shares outstanding.
| | | | | | | | | | | | | | | | | | | | | | | | | | |
| Calix, Inc. |
| Reconciliation of GAAP to Non-GAAP Guidance |
| (Unaudited, dollars in thousands, except per share data) |
| Three Months Ending October 1, 2022 |
| | GAAP | | Stock-Based Compensation | | Intangible
Asset Amortization | | Non-GAAP |
| Gross margin | | 48.4% - 50.4% | | 0.3% | | 0.3% | | 49.0% - 51.0% |
| Operating expenses | | $94,700 - $98,700 | | $(9,700) | | $ — | | $85,000 - $88,000 |
Net income per diluted common share(1) | | $0.04 - $0.10 | | $0.13 (2) | | $0.01 (2) | | $0.18 - $0.24 |
(1) Based on 68.7 million weighted-average diluted common shares outstanding.
(2) Net of income taxes.