Exhibit 99.2
July 19, 2023
Fellow Calix stockholders:
In the second quarter of 2023, the Calix team executed our ninth consecutive quarter of sequential revenue growth and the fourth consecutive quarter of sequential gross margin expansion, once again demonstrating predictability due to the unique strength of our platform and managed services model, delivering record revenue of $261.0 million and non-GAAP gross margin of 52.8%. The demand from Calix-partnered Broadband Service Providers (BSPs) remains strong, with innovators like ALLO successfully securing $650 million in sustainable financing (a “green” bond) supported by the Calix platform’s unique environmental capabilities, as they take advantage of this once in a generation opportunity to connect communities, homes and businesses.
The strength of the team’s disciplined execution was once again illustrated by our stellar balance sheet metrics, including days sales outstanding (DSO) of 34, no debt and record cash and marketable securities of $264.1 million. Our balance sheet continues to be a strong foundation for our team as we pursue our mission of enabling BSPs of all sizes to simplify, excite and grow.
With an adequate supply of components, less than 260 active SKUs to manage and inventory turns of around 3, we no longer anticipate being impacted by abnormal supply chain issues even though silicon lead times remain extended when compared with pre-pandemic levels. The ongoing improvements in the supply chain frees the product and supply-chain teams to focus their energies on partner optimization, expansion of processes that leverage the data and visibility that our platform provides and cost reductions.
With regards to BSP inventory, the Calix platform model continues to uniquely advantage us and our customers. As systems check into Calix cloud when they are installed, we are able to support BSP inventory management by understanding deployment rates to optimize their inventory levels. Furthermore, the Revenue Edge systems run all solutions (SmartHome, SmartTown and SmartBiz), enabling BSPs to dramatically simplify their inventory as they do not need to carry different products for each solution.
Most important, as a trusted go-to-market partner, we directly impact the BSP’s ability to reduce churn, drive upsell and acquire new subscribers, thereby increasing the BSP’s rate of inventory consumption and revenue, through our platform and managed services model with the Customer Success teams in the field with BSP’s contributing to their long-term success.
As we define in our mission statement, we enable BSPs to simplify their operations, which yields the lowest costs and quickest time to market, and excite subscribers through incredible managed experiences, that yield the highest subscriber loyalty and revenue per user, enabling the BSP to grow. Examples from this quarter include:
•Simplify time to market by pre-integrating partner solutions into the platform, thereby enabling a BSP to launch a new service in days versus years. ALLO demonstrated the power of this capability when they launched Bark as a marketing project, with no engineering support, in days.
•Excite subscribers through the adoption of our platform and managed services, such as Tombigbee Fiber who is leveraging our portfolio of managed services, including SmartBiz, SmartHome and SmartTown, expanding across 13 municipalities, 10 football stadiums, 9 high
schools and a college, which supports their enviable 91 Net Promoter Score (NPS), in markets where legacy incumbent NPS scores are often negative or single digit.
•Grow for their community and members/investors with the Calix platform, managed services and Customer Success team, as evidenced by Minnesota-based Consolidated Telephone Company, which doubled subscriber growth, reduced unnecessary truck rolls by 50% and achieved an NPS of 69.
The industry continues to acknowledge the Calix purpose-driven culture and the strength of our innovative platform and managed services through awards including:
•Calix Ranked #1 on the Top 50 List for most inspiring places to work in North America as our trusted platform and managed services model transforms communities.
•Calix Named #1 Best Place to Work in the Bay Area, With Culture, Company Outlook, and Teams Ranked Top 20 Globally by Comparably.
•Calix Achieves 3rd Great Place to Work Certification with Purpose-Driven, Remote Culture That Supercharges Customer Success and Corporate Growth.
•Shane Eleniak Named a Top 20 Chief Product Officer Worldwide, once again demonstrating that Calix is attracting the top talent across any industry as we enable the broadband industry to transform.
•Calix Marketing Cloud named 2023 Best in Class Marketing Award by the Broadband Multimedia Marketing Association for demonstrating innovation or excellence in marketing broadband services and was also named the 2023 Product of the Year Award Winner by Internet Telephony and Cloud Computing Magazines.
•Calix Support Cloud was awarded the 2023 Best in Class Call Center Award by the Customer Experience & Telco Sales Association recognizing excellence in call center products and services.
As the only end-to-end platform company enabling BSPs to maximize the once-in-a-generation opportunity presented by the disruption of the communications industry, our leadership team is confident that our financial performance will continue to improve across four measurable objectives:
•Deliberate sequential revenue growth
•Gross margin expansion
•Disciplined operating expense investment
•Ongoing predictability
The Calix team has executed with excellence and remains committed to enabling our customers to transform their businesses and dominate their markets.
We will continue to align our investments to support our mission, vision and strategy while maintaining our operating expense discipline and are confident our model will deliver consistent improvement in our financial performance over many years.
Second Quarter 2023 Financial Results
| | | | | | | | | | | |
| Actual GAAP | Actual Non-GAAP | Guidance Non-GAAP 1 |
| Revenue | $261.0m | $261.0m | $255.0m – $261.0m |
| Gross margin | 52.3% | 52.8% 2 | 51.0% – 53.0% 1 |
| Operating expenses | $124.7m | $107.6m 2 | $105.0m – $108.0m 1 |
| Net income per diluted common share | $0.13 | $0.36 2 | $0.28 – $0.34 1 |
| | | | | | | |
| 1 | Non-GAAP guidance provided on April 19, 2023. | | |
| 2 | Non-GAAP excludes stock-based compensation and intangible asset amortization as well as the income tax impact of these items. See GAAP to non-GAAP reconciliations beginning on page 15. | | |
| | | |
| | | |
| | | |
| | | |
| | | |
| | | |
| | | |
| | | |
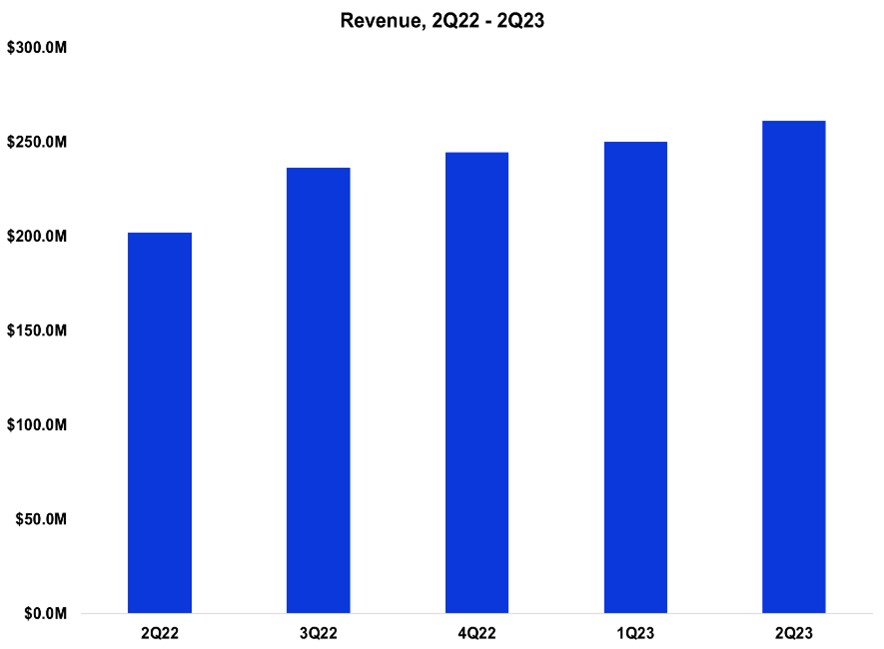
Strong demand for our platform and managed service offerings led to our ninth quarter of sequential revenue growth. Revenue was a record $261.0 million, representing an increase of 4% from the prior quarter and 29% compared with the same quarter a year ago.
Revenue EDGE revenue increased by 17% from the prior quarter due to higher system shipments and was up 35% compared with the year ago quarter as both new and existing customers continued to add subscribers.
We achieved another record quarter for the Intelligent Access EDGE with revenue up 14% from the prior quarter and increasing by 107% compared with the year ago quarter, driven by the technology upgrade cycle to consolidated networks and 10 Gigabit PON.
U.S. revenue was 89% of revenue in the second quarter of 2023, compared with 91% of revenue in the first quarter of 2023. U.S. revenue increased 2% in absolute dollars sequentially, and 26% compared with the year ago quarter. International revenue was 11% of revenue in the second quarter of 2023, increasing sequentially by 30% in absolute dollars primarily due to higher shipments to Americas customers outside of the United States and European customers to a lesser extent, and 58% compared with the year ago period, primarily due to higher shipments to European customers.
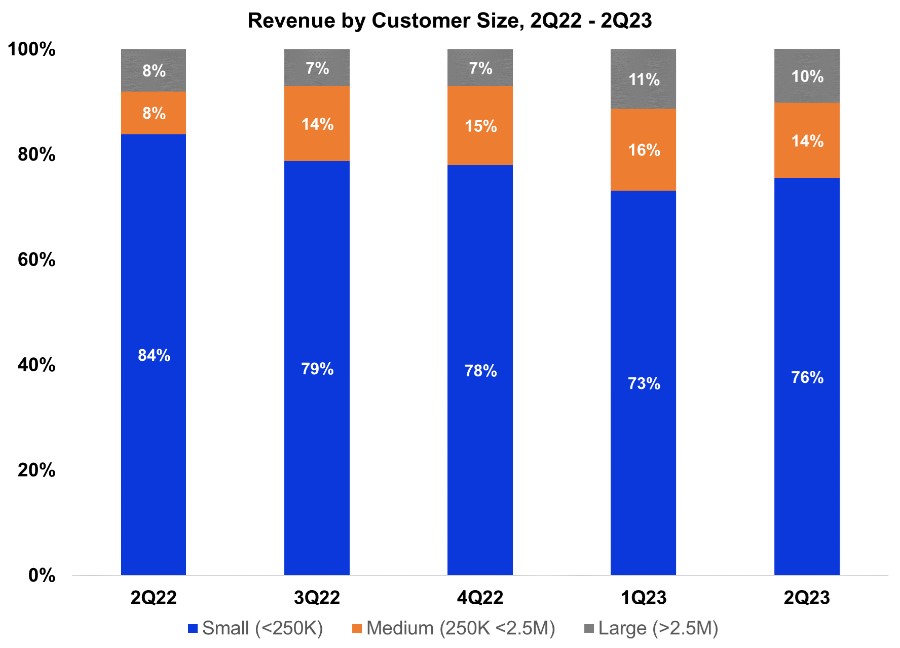
We continue to focus on finding strategically aligned customers of all types and sizes that recognize the need for business transformation enabled by our platform and managed service offerings.
In the second quarter of 2023, we added 16 new BSP customers, bringing our year-to-date additions to 27.
As we have discussed previously, technology disruptions start with small customers and eventually work their way up to large customers. Revenue from small customers was 76% of revenue in the second quarter of 2023, up from 73% in the prior quarter, and increased 8% in absolute dollars led by increased sales of our platform and managed services offerings across this customer base. Furthermore, in the second quarter of 2023, we had one customer grow into the medium-sized category, shifting 1% of revenue from small to medium. Revenue from medium-sized customers was 14% of revenue in the second quarter of 2023, down from 16% in the prior quarter, and decreased 4% in absolute dollars as we saw shipments decline across many of the medium-sized customers as they adjust their deployment plans. Revenue from large customers was 10% of revenue in the second quarter of 2023, a decrease from 11% in the prior quarter and down 5% in absolute dollars from the prior quarter. Shipments were generally lower across our large customer base with the notable exception of the continued strength from the same customer we noted last quarter.
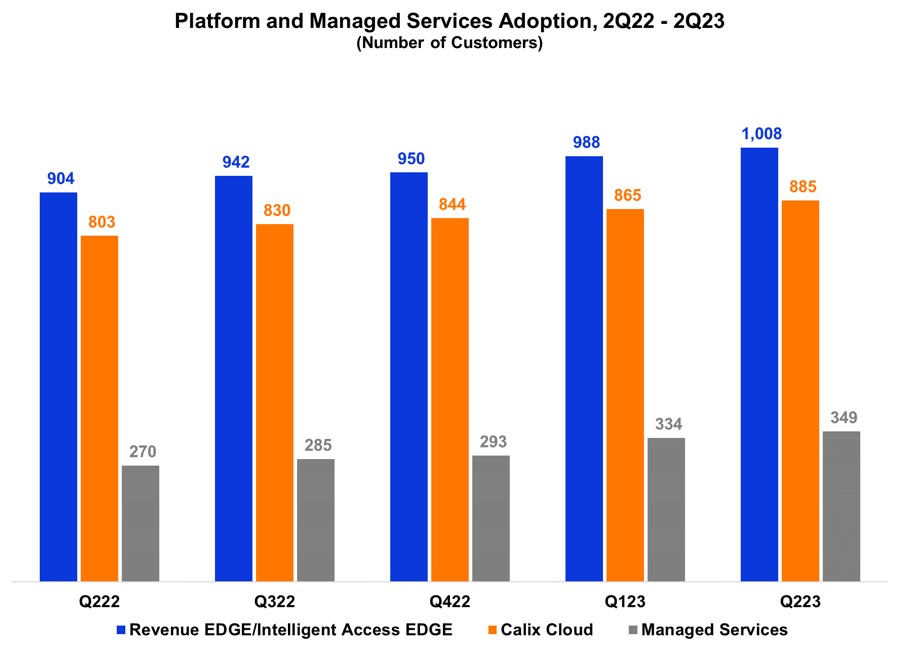
Greater customer adoption of our platform and managed services was again evidenced by the
continued increase in all three metrics compared with the prior quarter. As we have noted previously, our platform and managed services monetize based on subscriber count, and the growth in subscribers and on-going adoption of our platform and managed services form the “expand” in our “land and expand” strategy. Over time, the recurring revenue from continued platform and managed services adoption will drive higher gross margin.
Our platform consists of Revenue EDGE, Intelligent Access EDGE and Calix Cloud. We added 20 new Revenue EDGE and/or Intelligent Access EDGE customer deployments in the second quarter of 2023. By deploying the Revenue EDGE, BSPs can quickly implement and sell managed services, thereby increasing their average revenue per user at the highest possible margin with the greatest levels of subscriber satisfaction.
We added 20 new Calix Cloud deployments, which include Marketing Cloud, Support Cloud and/or Operations Cloud in the second quarter of 2023. Calix Cloud allows our BSPs to benefit from the power of data-driven insights to drive best-in-class net promoter scores.
And our Managed Services showed continued growth as we added 15 new deployments in the second quarter of 2023. We currently offer 9 managed services consisting of Wi-FiIQ, CommandIQ, ProtectIQ, ExperienceIQ, Arlo Secure, Bark, Servify, SmartBiz and SmartTown.
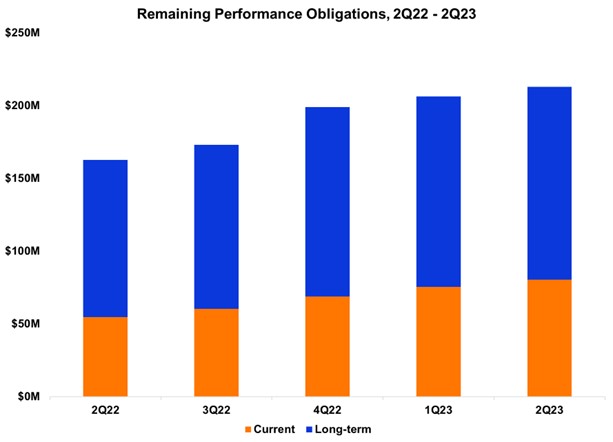
Remaining performance obligations, or RPOs, result from long-term commitments made by our customers and consist mainly of Calix Cloud, managed services, extended warranties and support/ maintenance agreements, while excluding licensed software, usage-based models and true-ups. These commitments generally have an initial term of three years. In the second quarter of 2023, our RPOs were $213.0 million, which is an increase of $6.8 million, or 3%, from the prior quarter and represents another quarter of sequential growth. The second quarter RPO result is also an increase of $50.2 million, or 31%, from the same quarter a year ago. The increases reflect the continued adoption of our platform offerings by an increasing number of our BSP customers. Our expectation is that we will see RPO growth every quarter for the foreseeable future, albeit these quarterly increases will vary.
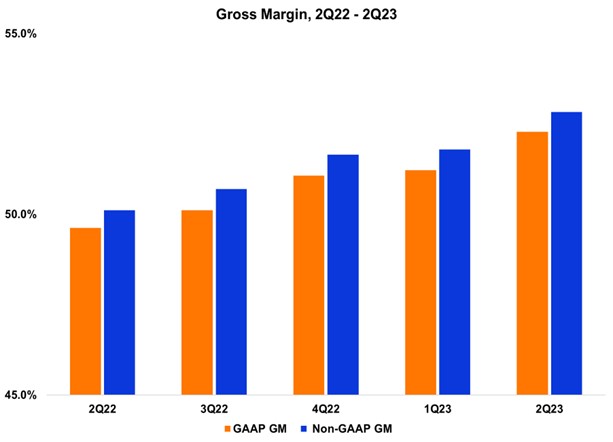
For the fourth consecutive quarter, gross margin moved higher as our platform solutions grew and the supply chain continued to improve. GAAP gross margin increased 110 basis points sequentially, and 270 basis points year-over-year, to 52.3%. Included in GAAP gross margin is stock-based compensation and intangible asset amortization. Excluding these items, our non-GAAP gross margin was 52.8% for the second quarter of 2023, representing an increase of 100 basis points sequentially and 270 basis points from the year ago period. The improvement was primarily due to platform and managed services revenue as we continue to grow our platform model, product mix and the easing of expedite fees and excessive prices to acquire components in the secondary market. Our expectation is the long-term trend for our gross margin on an annual basis will continue to increase with varied rates on a quarterly basis.

We continue to invest within our target financial model to capitalize on the once-in-a-generation opportunity ahead. Our GAAP and non-GAAP operating expenses for the second quarter of 2023 were
$124.7 million and $107.6 million, representing 47.8% and 41.2% of revenue, respectively. Sequentially, GAAP and non-GAAP operating expenses increased by 5.5% and 4.8%, respectively, primarily due to increased headcount. Compared with the year ago quarter, GAAP and non-GAAP operating expenses increased by 37.8% and 32.6%, respectively, primarily due to ongoing investments in headcount across our organization. These investments are needed to support the current and future demand for our platform offerings. Non-GAAP sales and marketing investments were 19.0% of revenue, in the middle of our target financial model range of 18% to 20%. Non-GAAP research and development investments were 29.4% of gross profit, which is ahead of our target financial model of 29% and is primarily due to the increased hiring. Non-GAAP general and administrative investments were 6.7% of revenue and again below our target financial model of 7%.
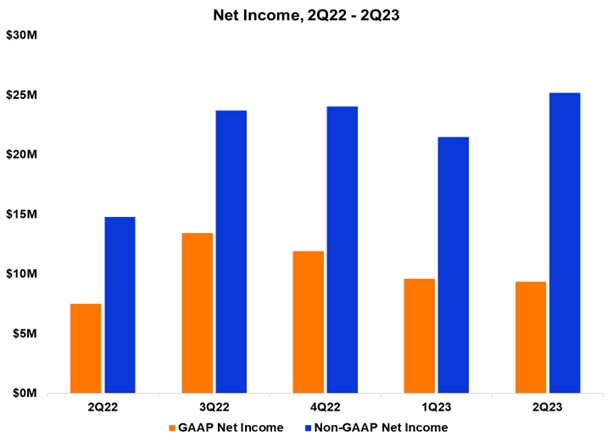
GAAP net income of $9.4 million for the second quarter of 2023 decreased by approximately $0.2 million sequentially, primarily due to higher stock-based compensation. GAAP net income was up $1.9 million compared with the same quarter a year ago. GAAP net income for the second quarter of 2023 included stock-based compensation of $17.8 million and intangible asset amortization of $0.7 million, partially offset by the income tax effect for these items of $2.7 million. Our non-GAAP net income for the second quarter of 2023 was $25.2 million, an increase of $3.7 million when compared with $21.5 million in the prior quarter and an increase of $10.4 million when compared with $14.8 million in the same quarter a year ago. The increases are mainly due to the higher revenue, strong gross margin performance, and continued operating expense discipline.
Balance Sheet and Cash Flow

Our pristine balance sheet continued to strengthen. Our DSO at the end of the second quarter 2023 was 34 days, the same as the prior quarter and down 5 days from the same quarter a year ago. Our target financial model for DSO remains between 35 and 45 days. Inventory turns were 3.0, up from 2.9 in the prior quarter, and down from 3.5 turns at the end of the second quarter a year ago. The decrease in inventory turns from the year ago period was the result of building more inventory to support BSP subscriber demand. Inventory turns for the second quarter of 2023 were at the low end of our target financial model of 3 to 4 turns. In addition, we increased our support to our contract and original design manufacturers with additional inventory deposits of $16.0 million to cover excess component materials, bringing our total inventory deposits to $51.4 million. With the supplier lead times normalizing, we expect over the next six quarters our inventory turns will adjust to the middle of the target financial model range and the suppliers’ excess components will diminish. Days payable outstanding (DPO) at the end of the second quarter was 25 days, the same as the prior quarter and up 3 days from the year ago quarter. Our target financial model for DPO is to be between 25 and 35 days. Our cash conversion cycle was 131 days compared with 135 days in the prior quarter and 122 days in the same quarter last year. Our target financial model remains for our cash conversion cycle to be between 100 and 130 days.
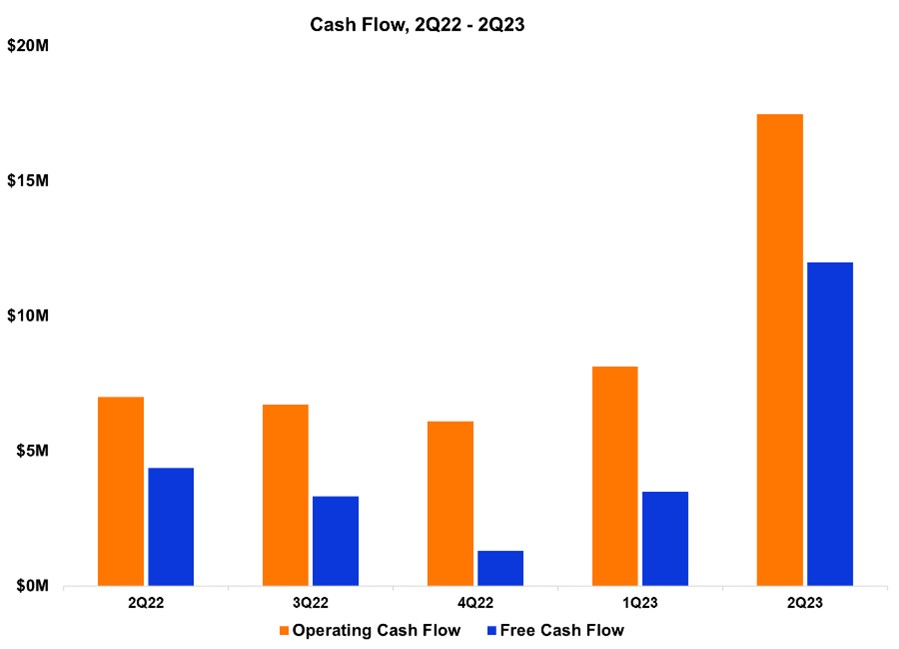
We ended the second quarter of 2023 with record cash and investments of $264.1 million, a sequential increase of $7.1 million. The increase was primarily the result of proceeds from positive non-GAAP free cash flow of $12.0 million and equity-based employee benefit plans of $5.8 million. During the second
quarter of 2023, we also repurchased $8.8 million of our common stock at an average price of $44.10. Over the past year, our cash and investments increased by $39.2 million due primarily to proceeds from equity-based employee benefit plans of $31.4 million and positive free cash flow of $20.1 million. This was partially offset by $10.0 million in stock repurchases. Over the next year, we expect both operating and free cash flow to remain strong due to continued profitable growth and improved inventory turns and return of supplier inventory deposits as our supply chain continues to return to normal.
Third Quarter 2023 Guidance
| | | | | | | | |
| Guidance Non-GAAP | Guidance Reconciled to GAAP |
| Revenue | $260.0m – $265.0m | $260.0m – $265.0m |
| Gross margin | 52.5% – 54.5% 1 | 52.0% – 54.0% |
| Operating expenses | $108.5m – $111.5m 1 | $126.5m – $129.5m |
Net income per diluted common share 2 | $0.32 – $0.38 1 | $0.10 – $0.16 |
| | | | | | | |
| 1 | Non-GAAP excludes stock-based compensation and intangible asset amortization as well as the income tax impact of these items. See GAAP to non-GAAP reconciliation on page 16. | | |
| 2 | Based on 69.9 million weighted-average diluted common shares outstanding. | | |
| | | |
| | | |
| | | |
| | | |
| | | |
| | | |
| | | |
| | | |
Our guidance for the third quarter of 2023, ending September 30, 2023, reflects our expectations as of the date of this letter.
Our revenue guidance for the third quarter of 2023, at the mid-point, is for revenue to be up approximately 1% compared with the prior quarter as we continue to see strong demand for our platform and managed services as our BSP continue to grow their deployment rates while at the same time helping them manage their inventory levels as supplier lead times normalize.
Our non-GAAP gross margin guidance for the third quarter of 2023, at the midpoint, represents an increase of 70 basis points compared with the prior quarter. As our platform offerings continue growing as a percentage of revenue, product mix and with the supply chain continuing to normalize, we now expect our 2023 non-GAAP gross margin to increase by 200 to 250 basis points.
Our non-GAAP operating expense guidance for the third quarter of 2023 represents our intention to invest fully to our target model to address the opportunity in front of us.
We now expect our 2023 non-GAAP effective income tax rate to be in the range of 23% to 25%, which is an improvement from our previous guidance range of 24% to 26% that we provided in our last stockholder letter.
Summary
We remain in the early stages of a once-in-a-generation disruption of the telecommunications industry. Our BSP customers are making significant investments to build an exceptional service for their subscribers. BSPs leveraging the Calix platform and managed services are gaining market share against the legacy “dumb-pipe” incumbents, improving their financial performance and growing the value delivered to the communities they serve every day.
The foundation for our growth continues to be based on three vectors:
•New subscribers: BSP customers leverage our clouds, software and managed services to differentiate in their markets thereby adding subscribers.
•Existing subscribers: BSP customers adopt new clouds, software and managed services to reduce their operational costs and grow revenue per subscriber.
•New BSPs: New BSPs: We sign new strategically aligned service providers who recognize that our platform enables their team to transform their business as they simplify their operational costs and time to market and excite their subscribers with market differentiating managed services to grow for their members/investors and the community(s) they serve.
Our financial position is getting stronger each quarter due to the success our customers’ experience when partnering with Calix. Furthermore, by leveraging our pristine balance sheet that is seeing cash balances increase quarterly, we will continue our financial discipline in making operational investments to further the needs of our customers, which we believe will deliver quarter-on-quarter revenue growth and gross margin expansion in a predictable manner for the long-term.
We sincerely thank our employees, customers, partners, vendors and stockholders for their
continued support.
Sincerely,
| | | | | | | | |
Michael Weening President and CEO | | Cory Sindelar CFO |
Conference Call
In conjunction with this announcement, Calix will host a conference call tomorrow, July 20, 2023, at 5:30 a.m. Pacific Time / 8:30 a.m. Eastern Time to answer questions regarding our second quarter 2023 financial results. A live audio webcast and replay of the call will be available in the Investor Relations section of the Calix website at http://investor-relations.calix.com.
Live call access information: Dial-in number: (877) 407-4019 (U.S.) or (201) 689-8337 (outside the U.S.) ID# 13739355.
The conference call and webcast will include forward-looking information.
Investor Inquiries
Jim Fanucchi
VP, Investor Relations
InvestorRelations@calix.com
(408) 404-5400
About Calix
Calix, Inc. (NYSE: CALX) — Broadband service providers of all sizes leverage the Calix platform and teams to simplify their business and excite their subscribers to grow the value of their business and for their communities for generations. The democratizing power of the platform and portfolio of managed services enables them to operate efficiently, acquire subscribers, and deliver exceptional experiences. Calix is dedicated to driving continuous improvement in partnership with our growing ecosystem to support the transformation of our customers and their communities.
Forward-Looking Statements
Statements made in this stockholder letter and the earnings call referencing the stockholder letter that are not statements of historical fact are forward-looking statements. Forward-looking statements are subject to the “safe harbor” provisions of the Private Securities Litigation Reform Act of 1995. Forward-looking
statements relate to, but are not limited to, component and logistics costs, potential customer or market opportunities, growth and future opportunities, customer demand or the sustainability of continued demand, anticipated customer purchase trends, expected customer and product mix or anticipated adoption or deployment of our platform, systems or services offerings, industry, market and customer trends, opportunities with existing and prospective customers, free cash flow and liquidity, and future financial performance (including the outlook for the third quarter of 2023 and future periods and performance against our target financial model). Forward-looking statements are subject to risks and uncertainties that could cause actual results to differ materially from expectations, including but not limited to fluctuations in our financial and operating results, the capital spending decisions of our customers, changes and disruptions in the market and industry, availability of capital in the market, changes in and impacts of regulations and/or government sponsored programs, competition, our ability to achieve market acceptance of our platform, systems and solutions, our ability to grow our customer base, fluctuations in costs associated with our systems and services including higher costs, dependence on third-parties for production and resource management associated with our global supply chain that may cause delays in production, protracted product shortages and unavailability of systems to meet customer orders, cost overruns, disruptions in global trade and relations, social unrest and political uncertainties and other unanticipated factors, as well as the risks and uncertainties described in our annual reports on Form 10-K and our quarterly reports on Form 10-Q, each as filed with the SEC and available at www.sec.gov, particularly in the sections titled “Risk Factors.” Forward-looking statements speak only as of the date the statements are made and are based on information available to us at the time those statements are made and/or management’s good faith belief as of that time with respect to future events. Calix assumes no obligation to update forward-looking statements to reflect actual performance or results, changes in assumptions or changes in other factors affecting forward-looking information, except to the extent required by applicable securities laws. Accordingly, investors should not place undue reliance on any forward-looking statements.
Use of Non-GAAP Financial Information
The Company uses certain non-GAAP financial measures in this stockholder letter to supplement its consolidated financial statements, which are presented in accordance with U.S. GAAP. These non-GAAP measures include non-GAAP gross margin, non-GAAP operating expenses, non-GAAP net income, non-GAAP net income per diluted common share and non-GAAP free cash flow. These non-GAAP measures are provided to enhance the reader’s understanding of the Company’s operating performance as they primarily exclude non-cash charges for stock-based compensation, intangible asset amortization, U.S. tariff refunds and impact from changes in income taxes, which the Company believes are not indicative of its core operating results. Management believes that the non-GAAP measures used in this stockholder letter provide investors with important perspectives into the Company’s ongoing business performance and management uses these non-GAAP measures to evaluate financial results and to establish operational goals. The presentation of these non-GAAP measures is not meant to be a substitute for results presented in accordance with GAAP, but rather should be evaluated in conjunction with those GAAP results. A reconciliation of the non-GAAP results to the most directly comparable GAAP results is provided in this stockholder letter. The non-GAAP financial measures used by the Company may be calculated differently from, and therefore may not be comparable to, similarly titled measures used by other companies.
Net Promoter®, NPS®, NPS Prism® and the NPS-related emoticons are registered trademarks of Bain & Company, Inc., Satmetrix Systems, Inc. and Fred Reichheld. Net Promoter Score℠ and Net Promoter System℠ are service marks of Bain & Company, Inc., Satmetrix Systems, Inc. and Fred Reichheld.
| | | | | | | | | | | | | | | | | | | | | | | | | | | | | | | | |
| Calix, Inc. |
| Condensed Consolidated Statements of Income |
| (Unaudited, in thousands, except per share data) |
| | | | | | | | | | |
| | | | Three Months Ended | | Six Months Ended |
| | | | July 1, | | July 2, | | July 1, | | July 2, |
| | | | 2023 | | 2022 | | 2023 | | 2022 |
| | | | | | |
| Revenue | | $ | 261,016 | | | $ | 202,042 | | | $ | 511,024 | | | $ | 386,990 | |
| Cost of revenue | | 124,546 | | | 101,862 | | | 246,503 | | | 195,018 | |
| Gross profit | | 136,470 | | | 100,180 | | | 264,521 | | | 191,972 | |
| Operating expenses: | | | | | | | | |
| Sales and marketing | | 54,596 | | | 41,138 | | | 106,461 | | | 77,229 | |
| Research and development | | 45,341 | | | 30,430 | | | 88,514 | | | 60,247 | |
| General and administrative | | 24,722 | | | 18,911 | | | 47,799 | | | 34,942 | |
| | Total operating expenses | | 124,659 | | | 90,479 | | | 242,774 | | | 172,418 | |
| Operating income | | 11,811 | | | 9,701 | | | 21,747 | | | 19,554 | |
| Interest income and other income (expense), net: | | | | | | | | |
| Interest income, net | | 2,255 | | | 240 | | | 3,895 | | | 275 | |
| Other income (expense), net | | 163 | | | (272) | | | (4) | | | (340) | |
| | Total interest income and other income (expense), net | | 2,418 | | | (32) | | | 3,891 | | | (65) | |
| Income before income taxes | | 14,229 | | | 9,669 | | | 25,638 | | | 19,489 | |
| Income taxes | | 4,856 | | | 2,148 | | | 6,667 | | | 3,849 | |
| Net income | | $ | 9,373 | | | $ | 7,521 | | | $ | 18,971 | | | $ | 15,640 | |
| Net income per common share: | | | | | | | | |
| | Basic | | $ | 0.14 | | | $ | 0.12 | | | $ | 0.29 | | | $ | 0.24 | |
| | Diluted | | $ | 0.13 | | | $ | 0.11 | | | $ | 0.27 | | | $ | 0.23 | |
| Weighted average number of shares used to compute net income per common share: | | | | | | | |
| | Basic | | 66,271 | | | 64,836 | | | 66,157 | | | 64,662 | |
| | Diluted | | 69,657 | | | 68,169 | | | 69,684 | | | 68,285 | |
| | | | | | | | | | |
| | | | | | | | | | | | | | |
| Calix, Inc. |
| Condensed Consolidated Balance Sheets |
| (Unaudited, in thousands) |
| | | | |
| | July 1, | | December 31, |
| | 2023 | | 2022 |
| ASSETS |
| Current assets: | | | | |
| Cash and cash equivalents | | $ | 90,187 | | | $ | 79,073 | |
| Marketable securities | | 173,941 | | | 162,642 | |
| Accounts receivable, net | | 96,980 | | | 93,804 | |
| Inventory | | 153,394 | | | 149,160 | |
| Prepaid expenses and other current assets | | 84,782 | | | 62,691 | |
| Total current assets | | 599,284 | | | 547,370 | |
| Property and equipment, net | | 28,836 | | | 25,834 | |
| Right-of-use operating leases | | 10,754 | | | 9,283 | |
| Deferred tax assets | | 166,331 | | | 167,031 | |
| Goodwill | | 116,175 | | | 116,175 | |
| Other assets | | 20,388 | | | 19,142 | |
| | $ | 941,768 | | | $ | 884,835 | |
| LIABILITIES AND STOCKHOLDERS’ EQUITY |
| Current liabilities: | | | | |
| Accounts payable | | $ | 35,358 | | | $ | 41,407 | |
| Accrued liabilities | | 85,275 | | | 90,474 | |
| Deferred revenue | | 41,814 | | | 33,541 | |
| Total current liabilities | | 162,447 | | | 165,422 | |
| Long-term portion of deferred revenue | | 25,425 | | | 25,072 | |
| Operating leases | | 9,504 | | | 8,442 | |
| Other long-term liabilities | | 2,622 | | | 6,332 | |
| Total liabilities | | 199,998 | | | 205,268 | |
| Stockholders’ equity: | | | | |
| Common stock | | 1,658 | | | 1,644 | |
| Additional paid-in capital | | 1,112,434 | | | 1,070,100 | |
| Accumulated other comprehensive loss | | (1,589) | | | (2,473) | |
| Accumulated deficit | | (370,733) | | | (389,704) | |
| Total stockholders’ equity | | 741,770 | | | 679,567 | |
| | $ | 941,768 | | | $ | 884,835 | |
| | | | | | | | | | | | | | |
| Calix, Inc. |
| Condensed Consolidated Statements of Cash Flows |
| (Unaudited, in thousands) |
| | | | |
| | Six Months Ended |
| | July 1, | | July 2, |
| | 2023 | | 2022 |
| Operating activities: | | | | |
| Net income | | $ | 18,971 | | | $ | 15,640 | |
| Adjustments to reconcile net income to net cash provided by operating activities: | | | | |
| Stock-based compensation | | 34,064 | | | 20,475 | |
| Depreciation and amortization | | 7,915 | | | 7,671 | |
| Deferred income taxes | | 884 | | | 1,034 | |
| Net accretion of available-for-sale securities | | (1,897) | | | — | |
| Changes in operating assets and liabilities: | | | | |
| Accounts receivable, net | | (3,176) | | | (909) | |
| Inventory | | (4,234) | | | (9,445) | |
| Prepaid expenses and other assets | | (26,123) | | | (23,268) | |
| Accounts payable | | (6,305) | | | (6,060) | |
| Accrued liabilities | | (502) | | | 4,222 | |
| Deferred revenue | | 8,626 | | | 8,725 | |
| Other long-term liabilities | | (2,647) | | | (3,721) | |
| Net cash provided by operating activities | | 25,576 | | | 14,364 | |
| Investing activities: | | | | |
| Purchases of property and equipment | | (10,107) | | | (5,866) | |
| Purchases of marketable securities | | (105,888) | | | (103,286) | |
| Maturities of marketable securities | | 97,223 | | | 81,452 | |
| Net cash used in investing activities | | (18,772) | | | (27,700) | |
| Financing activities: | | | | |
| Proceeds from common stock issuances related to employee benefit plans | | 18,284 | | | 14,527 | |
| Repurchases of common stock | | (10,000) | | | — | |
| Payments related to financing arrangements | | (4,088) | | | (632) | |
| Net cash provided by financing activities | | 4,196 | | | 13,895 | |
| Effect of exchange rate changes on cash and cash equivalents | | 114 | | | (376) | |
| Net increase in cash and cash equivalents | | 11,114 | | | 183 | |
| Cash and cash equivalents at beginning of period | | 79,073 | | | 51,333 | |
| Cash and cash equivalents at end of period | | $ | 90,187 | | | $ | 51,516 | |
| | | | | | | | | | | | | | | | | | | | | | | | | | | | | | | | |
| Calix, Inc. |
| Reconciliation of GAAP to Non-GAAP Gross Margin |
| (Unaudited) |
| | Three Months Ended |
| | July 1,
2023 | | April 1,
2023 | | December 31,
2022 | | October 1,
2022 | | July 2,
2022 |
| GAAP gross margin | | 52.3 | % | | 51.2 | % | | 51.1 | % | | 50.1 | % | | 49.6 | % |
| Adjustments to GAAP amount: | | | | | | | | | | |
| Stock-based compensation | | 0.3 | | | 0.3 | | | 0.3 | | | 0.3 | | | 0.3 | |
| Intangible asset amortization | | 0.2 | | | 0.3 | | | 0.2 | | | 0.3 | | | 0.3 | |
| U.S. tariff refunds | | — | | | — | | | — | | | — | | | (0.1) | |
| Non-GAAP gross margin | | 52.8 | % | | 51.8 | % | | 51.6 | % | | 50.7 | % | | 50.1 | % |
| | | | | | | | | | | | | | | | | | | | | | | | | | | | | | | | |
| Calix, Inc. |
| Reconciliation of GAAP to Non-GAAP Operating Expenses |
| (Unaudited, in thousands) |
| | | | | | |
| | Three Months Ended |
| | July 1, | | April 1, | | December 31, | | October 1, | | July 2, |
| | 2023 | | 2023 | | 2022 | | 2022 | | 2022 |
| GAAP operating expenses | | $ | 124,659 | | | $ | 118,115 | | | $ | 111,833 | | | $ | 98,567 | | | $ | 90,479 | |
| Stock-based compensation | | (17,064) | | | (15,420) | | | (12,590) | | | (10,329) | | | (9,357) | |
| Non-GAAP operating expenses | | $ | 107,595 | | | $ | 102,695 | | | $ | 99,243 | | | $ | 88,238 | | | $ | 81,122 | |
| | | | | | | | | | | | | | | | | | | | | | | | | | | | | | | | |
| Calix, Inc. |
| Non-GAAP Free Cash Flow Reconciliation |
| (Unaudited, in thousands) |
| | | | | | |
| | Three Months Ended |
| | July 1, | | April 1, | | December 31, | | October 1, | | July 2, |
| | 2023 | | 2023 | | 2022 | | 2022 | | 2022 |
| Net cash provided by operating activities | | $ | 17,464 | | | $ | 8,112 | | | $ | 6,105 | | | $ | 6,714 | | | $ | 6,999 | |
| Purchases of property and equipment | | (5,489) | | | (4,618) | | | (4,807) | | | (3,394) | | | (2,635) | |
| Non-GAAP free cash flow | | $ | 11,975 | | | $ | 3,494 | | | $ | 1,298 | | | $ | 3,320 | | | $ | 4,364 | |
| | | | | | | | | | | | | | | | | | | | | | | | | | | | | | | | | | | |
| Calix, Inc. |
| Reconciliation of GAAP Net Income to Non-GAAP Net Income |
| (Unaudited, in thousands) |
| | Three Months Ended | |
| | July 1, | | April 1, | | December 31, | | October 1, | | July 2, | |
| | 2023 | | 2023 | | 2022 | | 2022 | | 2022 | |
| GAAP net income | | $ | 9,373 | | | $ | 9,598 | | | $ | 11,927 | | | $ | 13,443 | | | $ | 7,521 | | |
| Adjustments to GAAP amount: | | | | | | | | | | | |
| Stock-based compensation | | 17,844 | | | 16,220 | | | 13,325 | | | 11,027 | | | 10,008 | | |
| Intangible asset amortization | | 658 | | | 658 | | | 658 | | | 658 | | | 658 | | |
| U.S. tariff refunds | | — | | | — | | | — | | | — | | | (274) | | |
| Income tax effect of non-GAAP adjustments | | (2,672) | | | (4,978) | | | (1,857) | | | (1,362) | | | (3,128) | | |
| Non-GAAP net income | | $ | 25,203 | | | $ | 21,498 | | | $ | 24,053 | | | $ | 23,766 | | | $ | 14,785 | | |
| | | | | | | | | | | |
| | | | | | | | |
| Calix, Inc. |
Reconciliation of GAAP to Non-GAAP Net Income Per Diluted Common Share 1 |
| (Unaudited) |
| | Three Months Ended
July 1, 2023 |
| |
| GAAP net income per diluted common share | | $ | 0.13 | |
| Adjustments to GAAP amount: | | |
| Stock-based compensation | | 0.26 | |
| Intangible asset amortization | | 0.01 | |
| | |
| Income tax effect of non-GAAP adjustments | | (0.04) | |
| Non-GAAP net income per diluted common share | | $ | 0.36 | |
| | | | | | | |
| 1 | Based on 69.7 million weighted-average diluted common shares outstanding. | | |
| | | |
| | | |
| | | |
| | | |
| | | |
| | | |
| | | |
| | | |
| | | | | | | | | | | | | | | | | | | | | | | | | | |
| Calix, Inc. |
| Reconciliation of GAAP to Non-GAAP Guidance |
| (Unaudited, dollars in thousands, except per share data) |
| Three Months Ending September 30, 2023 |
| | GAAP | | Stock-Based Compensation | | Intangible
Asset Amortization | | Non-GAAP |
| Gross margin | | 52.0% - 54.0% | | 0.3% | | 0.2% | | 52.5% - 54.5% |
| Operating expenses | | $126,500 - $129,500 | | $(18,000) | | $ — | | $108,500 - $111,500 |
Net income per diluted common share 1 | | $0.10 - $0.16 | | $0.21 2 | | $0.01 2 | | $0.32 - $0.38 |
| | | | | | | |
| 1 | Based on 69.9 million weighted-average diluted common shares outstanding. | | |
| 2 | Net of income taxes. | | |
| | | |
| | | |
| | | |
| | | |
| | | |
| | | |
| | | |
| | | |