Exhibit 99.1
Technical Report on the Shahuindo Heap Leach Project
Cajabamba, Peru
Prepared for:
SULLIDEN GOLD CORPORATION, LTD
 Prepared by:

Report Date: 9 November 2012
Effective Date of Resources: 17 May 2012
Technical Report Effective Date: 26 September 2012
Authors:
Carl Defilippi
Thomas L. Dyer, PE
Paul Tietz, CPG
| |
 | 
MINE DEVELOPMENT ASSOCIATES |
TABLE OF CONTENTS
| | | | |
| 1.0 SUMMARY | 1 |
| 1.1 | Terms of Reference | 1 |
| 1.2 | Introduction and Project Overview | 1 |
| 1.3 | Reliance on Other Experts | 2 |
| 1.4 | Property Description & Location | 2 |
| 1.5 | Access, Climate, Local Resources and Physiography | 3 |
| | 1.5.1 | Access | 3 |
| | 1.5.2 | Climate | 3 |
| | 1.5.3 | Local Resources | 4 |
| | 1.5.4 | Physiography | 4 |
| 1.6 | History | 4 |
| 1.7 | Geologic Setting and Mineralization | 5 |
| 1.8 | Deposit Types | 7 |
| 1.9 | Exploration | 7 |
| 1.10 | Drilling | 7 |
| 1.11 | Sample Preparation, Analysis and Security | 8 |
| 1.12 | Data Verification | 9 |
| 1.13 | Mineral Processing and Metallurgical Testing | 10 |
| 1.14 | Mineral Resource Estimate | 10 |
| 1.15 | Mineral Reserve Estimate | 12 |
| 1.16 | Mining Methods | 12 |
| 1.17 | Recovery Methods | 15 |
| 1.18 | Infrastructure | 16 |
| 1.19 | Market Studies and Contracts | 17 |
| 1.20 | Environmental Studies, Permitting and Social or Community Impact | 17 |
| | 1.20.1 | Studies and Permitting | 17 |
| | 1.20.2 | Reclamation and Closure | 18 |
| | 1.20.3 | Social Impact | 19 |
| 1.21 | Capital and Operating Costs | 20 |
| 1.22 | Economic Analysis | 21 |
| 1.23 | Adjacent Properties | 26 |
| 1.24 | Other Relevant Data and Information | 26 |
| | 1.24.1 | Geotechnical Issues | 26 |
| | 1.24.2 | Hydrology | 26 |
| | 1.24.3 | Mine Pit Dewatering | 27 |
| | |
| November 2012 | Shahuindo Project | i |
| |
|
MINE DEVELOPMENT ASSOCIATES |
| | | | |
| | 1.24.4 | Project Development Schedule | 28 |
| | 1.24.5 | Opportunities and Risks | 29 |
| 1.25 | Interpretation and Conclusions | 31 |
| 1.26 | Recommendations | 32 |
| 2.0 INTRODUCTION | 34 |
| 2.1 | Project Scope and Terms of Reference | 34 |
| 2.2 | Units and Abbreviations | 36 |
| 3.0 RELIANCE ON OTHER EXPERTS | 38 |
| 4.0 PROPERTY DESCRIPTION AND LOCATION | 40 |
| 4.1 | Location | 40 |
| 4.2 | Property Description | 40 |
| 4.3 | Agreements – Settlement of Shahuindo Litigation | 43 |
| 4.4 | Mineral Claims | 45 |
| 4.5 | Surface Rights | 49 |
| 4.6 | Informal Mining Activity | 49 |
| 4.7 | Environmental Considerations | 50 |
| | 4.7.1 | Environmental Regulations | 50 |
| | 4.7.2 | Permits | 52 |
| | 4.7.3 | Existing Environmental Conditions | 54 |
| 5.0 ACCESSIBILITY, CLIMATE, LOCAL RESOURCES, AND PHYSIOGRAPHY | 55 |
| 5.1 | Accessibility | 55 |
| 5.2 | Climate | 58 |
| 5.3 | Local Resources & Infrastructure | 58 |
| 5.4 | Physiography | 59 |
| 5.5 | Seismology | 60 |
| 6.0 HISTORY | 61 |
| 6.1 | Historic Mineral Resource Estimates | 62 |
| 6.2 | Previous Mineral Resource Estimates for Sulliden | 63 |
| 6.3 | Prior Mining | 66 |
| 7.0 GEOLOGICAL SETTING | 67 |
| 7.1 | Regional Geology | 67 |
| 7.2 | Property Geology | 70 |
| | 7.2.1 | Lithologies | 73 |
| | 7.2.2 | Structure | 74 |
| 7.3 | Alteration | 76 |
| 7.4 | Gold-Silver Mineralization | 77 |
| 7.5 | Mineral Corridors | 80 |
| 8.0 DEPOSIT TYPES | 82 |
| 8.1 | Shahuindo Deposit | 82 |
| | |
| November 2012 | Shahuindo Project | ii |
| |
|
MINE DEVELOPMENT ASSOCIATES |
| | | | |
| 9.0 EXPLORATION | 98 |
| 9.1 | Geologic Mapping | 98 |
| 9.2 | Topographic Control | 99 |
| 9.3 | Geophysics | 99 |
| 9.4 | Geochemistry | 100 |
| 9.5 | Exploration Potential | 101 |
| 10.0 DRILLING | 104 |
| 10.1 | Drilling Methods and Equipment | 107 |
| 10.2 | Collar Surveys | 108 |
| 10.3 | Down-Hole Surveys | 109 |
| 10.4 | Drill Logging | 110 |
| 10.5 | Drill Database | 110 |
| 10.6 | Core Recovery | 111 |
| 10.7 | Comparison of Core and Reverse Circulation Drilling | 115 |
| 10.8 | Deposit Drilling | 118 |
| 11.0 SAMPLE PREPARATION, ANALYSIS AND SECURITY | 120 |
| 11.1 | Drill Sampling | 120 |
| | 11.1.1 | Diamond Drill Core Sampling | 120 |
| | 11.1.2 | Reverse Circulation Chip Sampling | 120 |
| | 11.1.3 | Sample Storage | 121 |
| 11.2 | Sample Preparation and Analysis | 122 |
| 11.3 | Specific Gravity Determinations | 123 |
| 11.4 | Sample Security | 124 |
| 11.5 | Quality Assurance/Quality Control | 125 |
| | 11.5.1 | Asarco’s Drilling Program | 125 |
| | 11.5.2 | Other Drilling Programs Prior to Sulliden | 125 |
| | 11.5.3 | Sulliden’s Drilling Program | 125 |
| 11.6 | Summary Statement | 127 |
| 12.0 DATA VERIFICATION | 128 |
| 12.1 | AMEC 2009 Database Audit and Verification | 128 |
| 12.2 | MDA Database Audit | 129 |
| | 12.2.1 | Drill-Collar Audit | 130 |
| | 12.2.2 | Down-Hole Survey Audit | 131 |
| | 12.2.3 | Assay Data Audit | 131 |
| | 12.2.4 | Geological Data Audit | 131 |
| | 12.2.5 | Core Recovery and RQD Data | 132 |
| 12.3 | MDA Independent Verification of Mineralization | 132 |
| | 12.3.1 | Site Visits | 132 |
| 12.4 | MDA Analyses of QA/QC Data | 134 |
| | |
| November 2012 | Shahuindo Project | iii |
| |
|
MINE DEVELOPMENT ASSOCIATES |
| | | | |
| | 12.4.1 | Standards | 134 |
| | 12.4.2 | Blanks | 136 |
| | 12.4.3 | Duplicate Samples | 139 |
| 12.5 | Summary Statement on Data Verification | 144 |
| 13.0 METALLURGICAL TESTING & MINERAL PROCESSING | 146 |
| 13.1 | Metallurgical Testing Summary | 146 |
| | 13.1.1 | HLC Test Program Summary | 148 |
| | 13.1.2 | KCA Test Program Summary | 148 |
| 13.2 | Heap Leach Consultants - 2003-2004 | 150 |
| 13.3 | Kappes, Cassiday & Associates – 2009-2012 | 155 |
| | 13.3.1 | KCA Bottle Roll Leach Test Results | 155 |
| | 13.3.2 | Kappes, Cassiday & Associates Column Tests | 162 |
| | 13.3.3 | Agglomeration Tests | 168 |
| | 13.3.4 | Detoxification Test Work | 169 |
| | 13.3.5 | Acid-Base Accounting and Humidity Cell Test Work | 169 |
| | 13.3.6 | Acid-Base Accounting | 170 |
| | 13.3.7 | Humidity Cell Test Work | 171 |
| 13.4 | Comminution Tests | 172 |
| 14.0 MINERAL RESOURCE | 173 |
| 14.1 | Introduction | 173 |
| 14.2 | Drill Database | 173 |
| 14.3 | Geology Pertinent to the Resource Model and Estimation | 174 |
| 14.4 | Resource Models | 176 |
| | 14.4.1 | Lithologic Model | 176 |
| | 14.4.2 | Oxidation Model | 177 |
| | 14.4.3 | Silicification Model | 178 |
| | 14.4.4 | Gold Mineral Domain Model | 179 |
| | 14.4.5 | Silver Mineral Domain Model – Mixed and Sulfide Material Only | 186 |
| 14.5 | Density Values for Model | 187 |
| 14.6 | Sample Coding and Capping | 189 |
| 14.7 | Assay Compositing | 191 |
| 14.8 | Block Model Coding | 192 |
| 14.9 | Grade Estimation | 193 |
| 14.10 | Mineral Resources | 195 |
| | 14.10.1 | Resource Model Comments | 206 |
| 15.0 Mineral Reserve | 207 |
| 15.1 | Pit Optimization | 207 |
| | 15.1.1 | Economic Parameters | 208 |
| | 15.1.2 | Slope Parameters | 209 |
| | |
| November 2012 | Shahuindo Project | iv |
| |
|
MINE DEVELOPMENT ASSOCIATES |
| | | | |
| | 15.1.3 | Pit-Optimization Results | 209 |
| | 15.1.4 | Pit-Shell Selection for Ultimate Pit Limit | 212 |
| 15.2 | Pit Designs | 212 |
| | 15.2.1 | Bench Height | 213 |
| | 15.2.2 | Pit Design Slopes | 213 |
| | 15.2.3 | Haulage Roads | 214 |
| | 15.2.4 | Barrow Pit | 215 |
| | 15.2.5 | Ultimate Pit | 215 |
| | 15.2.6 | Pit Phasing | 217 |
| 15.3 | Cutoff Grade | 223 |
| 15.4 | Dilution | 224 |
| 15.5 | Reserves and In-pit Inferred Resources | 224 |
| | 15.5.1 | Bench Reserves | 227 |
| | 15.5.2 | In-pit Inferred Resources | 234 |
| 16.0 MINE OPERATIONS | 236 |
| 16.1 | Mining Method | 236 |
| 16.2 | Mine Material Type Definition | 236 |
| 16.3 | Mine-Waste Facilities | 237 |
| 16.4 | Mine-Production Schedule | 239 |
| 16.5 | Equipment Selection and Productivities | 242 |
| 16.6 | Mine Pit Dewatering Plan | 247 |
| 17.0 RECOVERY METHODS | 251 |
| 17.1 | Process Description Summary | 252 |
| 17.2 | Crushing | 256 |
| 17.3 | Ore Reclamation | 258 |
| 17.4 | Agglomeration | 258 |
| 17.5 | Stacking | 258 |
| 17.6 | Solution Application and Leaching | 259 |
| | 17.6.1 | Leaching Concepts | 259 |
| | 17.6.2 | Leach System Description | 260 |
| 17.7 | Leach Pad | 261 |
| 17.8 | Solution Storage | 262 |
| 17.9 | Solution Management | 263 |
| | 17.9.1 | Excess Solution Impoundment | 264 |
| | 17.9.2 | Pregnant Solution Pond | 265 |
| | 17.9.3 | Waste Dump Seepage Pond | 265 |
| | 17.9.4 | Water Storage Impoundments | 265 |
| | 17.9.5 | Pit Dewatering Water Treatment | 266 |
| 17.10 | Process Water Balance | 267 |
| | |
| November 2012 | Shahuindo Project | v |
| |
|
MINE DEVELOPMENT ASSOCIATES |
| | | | |
| | 17.10.1 | Precipitation Data | 267 |
| | 17.10.2 | Water Balances | 267 |
| 17.11 | ADR Recovery Plant | 273 |
| | 17.11.1 | Adsorption | 273 |
| | 17.11.2 | Carbon Acid Wash | 273 |
| | 17.11.3 | Desorption | 274 |
| | 17.11.4 | Electrowinning | 275 |
| | 17.11.5 | Carbon Thermal Regeneration | 277 |
| | 17.11.6 | Refining and Smelting | 277 |
| 17.12 | ADR Reagent Mixing and Handling Systems | 279 |
| | 17.12.1 | Cyanide | 279 |
| | 17.12.2 | Sodium Hydroxide | 280 |
| 17.13 | Carbon Handling | 280 |
| 17.14 | Process Solution and Makeup Water | 281 |
| 17.15 | Process Reagents and Consumables | 282 |
| | 17.15.1 | Usage and Storage Requirements | 282 |
| | 17.15.2 | Cement | 282 |
| | 17.15.3 | Cyanide | 283 |
| | 17.15.4 | Carbon | 283 |
| | 17.15.5 | Hydrochloric Acid | 284 |
| | 17.15.6 | Diesel Fuel | 284 |
| | 17.15.7 | Antiscalant | 284 |
| | 17.15.8 | Fluxes | 284 |
| | 17.15.9 | Hydrogen Peroxide | 285 |
| | 17.15.10 | Copper Sulfate | 285 |
| | 17.15.11 | Sulfuric Acid | 285 |
| | 17.15.12 | Crusher Liners | 286 |
| 18.0 PROJECT INFRASTRUCTURE | 287 |
| 18.1 | Introduction | 287 |
| 18.2 | Access Roads and Port Access | 288 |
| 18.3 | Power Supply | 289 |
| | 18.3.1 | Estimated Electric Power Consumption | 289 |
| | 18.3.2 | Emergency Power | 290 |
| 18.4 | Water Supply | 290 |
| | 18.4.1 | Operations and Construction Water Balance | 291 |
| | 18.4.2 | Raw Water | 292 |
| | 18.4.3 | Potable Water | 294 |
| | 18.4.4 | Fire Water | 294 |
| 18.5 | Project Buildings | 294 |
| | |
| November 2012 | Shahuindo Project | vi |
| |
|
MINE DEVELOPMENT ASSOCIATES |
| | | | |
| | 18.5.1 | Administration Building | 294 |
| | 18.5.2 | Laboratory | 294 |
| | 18.5.3 | Process Buildings | 295 |
| | 18.5.4 | Mine Shop | 296 |
| | 18.5.5 | Mine Warehouse and Workshop | 296 |
| | 18.5.6 | Powder Magazine | 296 |
| | 18.5.7 | Construction / Permanent Operations Camp | 297 |
| | 18.5.8 | Dining Facilities | 297 |
| 18.6 | Diesel Fuel Delivery and Storage | 298 |
| 18.7 | Security | 298 |
| 18.8 | First Aid | 298 |
| 18.9 | Communications | 298 |
| 18.10 | Transportation | 298 |
| 18.11 | Waste Disposal | 299 |
| | 18.11.1 | Sewage | 299 |
| | 18.11.2 | Solid Wastes | 299 |
| 19.0 MARKET STUDIES AND CONTRACTS | 302 |
| 20.0 ENVIRONMENTAL STUDIES, PERMITTING AND SOCIAL OR COMMUNITY IMPACT | 303 |
| 20.1 | Environmental Studies and Regulations | 303 |
| | 20.1.1 | Permits | 305 |
| | 20.1.2 | Existing Environmental Conditions | 307 |
| 20.2 | Social Impact | 307 |
| | 20.2.1 | Location of the Study Area | 307 |
| | 20.2.2 | Social Baseline Study | 307 |
| | 20.2.3 | Public Consultation and Engagement Plan | 310 |
| | 20.2.4 | Community Development Program | 310 |
| 20.3 | Reclamation and Closure | 311 |
| | 20.3.1 | Reclamation of Open Pits | 313 |
| | 20.3.2 | Reclamation of Waste Rock Facility | 313 |
| | 20.3.3 | Reclamation of Water Storage Ponds | 315 |
| | 20.3.4 | Reclamation of Heap Leach Facility | 315 |
| | 20.3.5 | Ore Neutralization | 316 |
| | 20.3.6 | Passive Treatment of Heap Leach Effluent | 317 |
| | 20.3.7 | Reclamation of Ancillary Facilities | 317 |
| | 20.3.8 | Reclamation of Roads | 318 |
| 21.0 CAPITAL AND OPERATING COSTS | 319 |
| 21.1 | Capital Costs Summary | 320 |
| 21.2 | Mining Capital Costs | 322 |
| | |
| November 2012 | Shahuindo Project | vii |
| |
|
MINE DEVELOPMENT ASSOCIATES |
| | | | |
| | 21.2.1 | Major Mining Equipment | 326 |
| | 21.2.2 | Mine Support | 327 |
| | 21.2.3 | Maintenance | 327 |
| | 21.2.4 | Mine Facilities | 327 |
| | 21.2.5 | Light Vehicles | 328 |
| | 21.2.6 | Other Capital | 328 |
| 21.3 | Process Capital Costs | 329 |
| | 21.3.1 | Process Cost Basis | 329 |
| | 21.3.2 | Freight | 329 |
| | 21.3.3 | Duties and Customs Fees | 330 |
| | 21.3.4 | Installation | 330 |
| | 21.3.5 | Major Earthworks | 330 |
| | 21.3.6 | Liner | 331 |
| | 21.3.7 | Civils | 331 |
| | 21.3.8 | Structural Steel | 331 |
| | 21.3.9 | Platework | 332 |
| | 21.3.10 | Mechanical Equipment | 332 |
| | 21.3.11 | Piping, Electrical and Instrumentation | 332 |
| 21.4 | Infrastructure Capital Costs | 332 |
| | 21.4.1 | Indirect Costs | 334 |
| | 21.4.2 | Vendor Representatives | 335 |
| | 21.4.3 | Spare Parts | 335 |
| | 21.4.4 | Initial Fills Inventory | 335 |
| | 21.4.5 | Engineering, Procurement and Construction Management | 336 |
| | 21.4.6 | Contingency | 337 |
| 21.5 | Sustaining Capital Costs | 337 |
| 21.6 | Owner’s Costs | 337 |
| 21.7 | Working Capital | 338 |
| 21.8 | Exclusions | 338 |
| 21.9 | Operating Costs Summary | 339 |
| 21.10 | Mining Operating Costs | 341 |
| | 21.10.1 | Drilling Costs | 343 |
| | 21.10.2 | Blasting Costs | 343 |
| | 21.10.3 | Loading Costs | 343 |
| | 21.10.4 | Haulage Costs | 343 |
| | 21.10.5 | Mine-Support Costs | 343 |
| | 21.10.6 | Mine-Maintenance Costs | 343 |
| | | 21.10.7 | Mine General Services, Engineering, and Geology Costs | 343 |
| | 21.10.8 | Mine Dewatering Costs | 344 |
| | |
| November 2012 | Shahuindo Project | viii |
| |
|
MINE DEVELOPMENT ASSOCIATES |
| | | | |
| | 21.10.9 | Mine Personnel and Staffing | 344 |
| 21.11 | Process and Support Services Operating Cost | 348 |
| | 21.11.1 | Process Personnel and Staffing | 350 |
| | 21.11.2 | Power | 352 |
| | 21.11.3 | Consumable Items | 353 |
| | 21.11.4 | Mobile Equipment | 356 |
| | 21.11.5 | Repair Materials | 357 |
| 21.12 | General Administrative | 357 |
| 22.0 ECONOMIC ANALYSIS | 358 |
| 22.1 | Summary | 358 |
| 22.2 | Methodology | 360 |
| 22.3 | General Assumptions | 360 |
| 22.4 | Capital Cost Estimates | 362 |
| 22.5 | Operating Cost Estimates | 363 |
| 22.6 | Financial Model and Cash Flow | 364 |
| 22.7 | Sensitivity Analysis | 368 |
| 23.0 ADJACENT PROPERTIES | 371 |
| 24.0 OTHER RELEVANT DATA AND INFORMATION | 372 |
| 24.1 | Geotechnical Issues | 372 |
| | 24.1.1 | Pit Slope Stability Analysis | 372 |
| | 24.1.2 | Heap Leach Facilities Geotechnical | 375 |
| 24.2 | Hydrology | 378 |
| | 24.2.1 | Field Investigations | 379 |
| | 24.2.2 | Climate and Meteorology | 380 |
| 24.3 | Hydrology | 380 |
| | 24.3.1 | Hydrography | 380 |
| | 24.3.2 | Surface Runoff | 381 |
| | 24.3.3 | Replacement Flows | 382 |
| | 24.3.4 | Water Uses | 382 |
| | 24.3.5 | Water Quality | 383 |
| | 24.3.6 | Surface Water | 385 |
| | 24.3.7 | Water designated for Human Consumption | 385 |
| | 24.3.8 | Underground Water | 385 |
| 24.4 | Hydrogeology | 385 |
| | 24.4.1 | Background | 385 |
| | 24.4.2 | Field Investigation | 386 |
| | 24.4.3 | Groundwater Modeling | 389 |
| | 24.4.4 | Mine Pit Dewatering | 391 |
| 24.5 | Project Implementation | 391 |
| | |
| November 2012 | Shahuindo Project | ix |
| |
|
MINE DEVELOPMENT ASSOCIATES |
| | | | |
| | 24.5.1 | Detailed Design | 392 |
| | 24.5.2 | Procurement | 393 |
| | 24.5.3 | Construction Period | 394 |
| | 24.5.4 | Project Schedule | 395 |
| | 24.5.5 | Schedule Comments | 396 |
| 24.6 | Opportunities and Risks | 397 |
| | 24.6.1 | Production Expansion | 397 |
| | 24.6.2 | Mineral Resource Growth and Mineral Resource Conversion | 398 |
| | 24.6.3 | Access to Electrical Power | 398 |
| | 24.6.4 | Pit Geotechnical and Mine Planning | 399 |
| | 24.6.5 | Metallurgy and Processing | 399 |
| | 24.6.6 | Water Management | 400 |
| | 24.6.7 | Heap Leach Design and Operation | 400 |
| | 24.6.8 | Social Opposition | 401 |
| | 24.6.9 | Informal Miners | 401 |
| | 24.6.10 | Land Acquisition & Resettlement | 402 |
| | 24.6.11 | Political Situation | 402 |
| 25.0 INTERPRETATIONS AND CONCLUSIONS | 403 |
| 26.0 RECOMMENDATIONS | 408 |
| 26.1 | Deposit Expansion and Exploration Activities | 408 |
| 26.2 | Pit Slope Stability | 409 |
| 26.3 | Geotechnical Recommendations | 410 |
| 26.4 | Hydrology | 410 |
| 26.5 | Hydrogeology | 411 |
| 27.0 REFERENCES | 413 |
| 28.0 AUTHORS’ CERTIFICATES | 418 |
| | |
| November 2012 | Shahuindo Project | x |
| |
|
MINE DEVELOPMENT ASSOCIATES |
LIST OF TABLES
| | |
| Table 1-1 | Project Statistics | 2 |
| Table 1-2 | Shahuindo Gold and Silver Reported Resource | 11 |
| Table 1-3 | Ultimate Pit Proven and Probable Reserves | 12 |
| Table 1-4 | Annual Mine Production Schedule Summary | 14 |
| Table 1-5 | Shahuindo Project Capital Cost Summary | 21 |
| Table 1-6 | Shahuindo Project Operating Cost Summary | 21 |
| Table 1-7 | Life-of-Mine Summary | 23 |
| Table 4-1 | Mineral Title Summary | 46 |
| Table 4-2 | Summary of Environmental Requirements for Mining Exploration Programs | 52 |
| Table 5-1 | Summary of Parameters for Seismic Design | 60 |
| Table 6-1 | Summary of Exploration Activities on the Shahuindo Property | 61 |
| Table 6-2 | Historic Mineral Resource Estimates for Shahuindo | 63 |
| Table 6-3 | 2004 Mineral Resource Estimate for Shahuindo by Met-Chem | 63 |
| Table 6-4 | 2005 Mineral Resource Estimate for Shahuindo by Met-Chem | 64 |
| Table 6-5 | 2009 Mineral Resource Estimate for Shahuindo by AMEC | 64 |
| Table 6-6 | 2011 Mineral Resource by MDA | 66 |
| Table 7-1 | Major and Trace Element Geochemistry Associated with Mineralization and Oxidation from Multi-Element Analyses | 79 |
| Table 8-1 | Shahuindo Deposit Zones | 91 |
| Table 9-1 | Summary of Sulliden Exploration Activities on the Shahuindo Property .98 |
| Table 10-1 | Drilling Campaigns | 104 |
| Table 10-2 | Core and RC Gold Analyses | 115 |
| Table 10-3 | Pairs Analyses - Core and Closest RC Sample | 117 |
| Table 10-4 | Drill Hole Intercept Summary Table | 119 |
| Table 12-1 | MDA 2010 Verification Sampling – Rock Chip | 133 |
| Table 12-2 | MDA 2010 Verification Sampling – Core | 134 |
| Table 12-3 | Summary of Results Obtained for Standards | 136 |
| Table 12-4 | Summary of Types of Duplicates | 139 |
| Table 12-5 | Summary of Duplicate Results | 143 |
| Table 13-1 | Summary of HLC Column Leach Tests | 148 |
| Table 13-2 | Summary of KCA Column Leach Tests | 150 |
| Table 13-3 | Summary of KCA Bottle Roll Leach Tests | 150 |
| Table 13-4 | HLC Sample Designations and Average Head Grades | 151 |
| Table 13-5 | Summary of HLC Column Leach Test Results | 152 |
| Table 13-6 | Summary of HLC Bottle Roll Leach Test Results | 153 |
| Table 13-7 | Summary of KCA Coarse Ore Bottle Roll Leach Test Results | 156 |
| | |
| November 2012 | Shahuindo Project | xi |
| |
|
MINE DEVELOPMENT ASSOCIATES |
| | |
| Table 13-8 | Summary of KCA Pulverized Bottle Roll Leach Test Results | 158 |
| Table 13-9 | Summary of KCA Bottle Roll Recoveries According to Sulfide Level | 161 |
| Table 13-10 | Summary of KCA Crushed Ore Column Test Results | 164 |
| Table 13-11 | Summary of KCA ROM Column Test Results | 165 |
| Table 13-12 | Summary of KCA Screened Material Column Test Results | 165 |
| Table 13-13 | Summary of Detoxification Test Results – Total & WAD Cyanide | 169 |
| Table 13-14 | Summary of Detoxification Test Results – Total & WAD Cyanide | 169 |
| Table 13-15 | Samples Utilized in ABA Testing | 170 |
| Table 13-16 | Bulk Sample Work Index Results | 172 |
| Table 14-1 | Descriptive Statistics of Shahuindo Density Values by Rock Type | 188 |
| Table 14-2 | Descriptive Statistics by Gold Mineral Domain – All Gold Samples | 190 |
| Table 14-3 | Descriptive Statistics by Gold Mineral Domain – Silver Oxide Samples Only | 190 |
| Table 14-4 | Descriptive Statistics by Silver Mineral Domain – Silver Mixed and Sulfide Samples Only | 191 |
| Table 14-5 | Descriptive Statistics by Gold Mineral Domain – All Gold Composites | 191 |
| Table 14-6 | Descriptive Statistics by Gold Mineral Domain – Silver Oxide Composites Only | 192 |
| Table 14-7 | Descriptive Statistics by Silver Mineral Domain – Silver Mixed and Sulfide Composites Only | 192 |
| Table 14-8 | Shahuindo Estimation Parameters | 194 |
| Table 14-9 | Shahuindo Search Ellipse Orientations | 194 |
| Table 14-10 | Shahuindo Mineral Domain Search Restrictions | 195 |
| Table 14-11 | Criteria for Shahuindo Resource Classification | 198 |
| Table 14-12 | Shahuindo Gold and Silver Reported Resource | 200 |
| Table 14-13 | Shahuindo Gold and Silver Resources | 201 |
| Table 15-1 | Scenario Economic Parameters | 208 |
| Table 15-2 | Metallurgical Recoveries | 209 |
| Table 15-3 | 10K TPD – 0.30 g Au/t Cutoff Optimization Results | 210 |
| Table 15-4 | Pit Optimization Results using Final Feasibility Costs | 212 |
| Table 15-5 | Pit Design Slope Parameters | 214 |
| Table 15-6 | Reserve Cutoff Grades (g Au/t) | 223 |
| Table 15-7 | Ultimate Pit Proven and Probable Reserves | 226 |
| Table 15-8 | Proven and Probable Reserves by Phase | 227 |
| Table 15-9 | Phase 1 Proven and Probable Bench Reserves | 228 |
| Table 15-10 | Phase 1B Proven and Probable Bench Reserves | 229 |
| Table 15-11 | Phase 2 Proven and Probable Bench Reserves | 230 |
| Table 15-12 | Phase 3 Proven and Probable Bench Reserves | 231 |
| Table 15-13 | Phase 4 Proven and Probable Bench Reserves | 232 |
| | |
| November 2012 | Shahuindo Project | xii |
| |
|
MINE DEVELOPMENT ASSOCIATES |
| | |
| Table 15-14 | Phase 5 Proven and Probable Bench Reserves | 233 |
| Table 15-15 | Total Proven and Probable Bench Reserves | 234 |
| Table 15-16 | In-Pit Inferred Resources | 235 |
| Table 16-1 | In-Pit Mineralized Waste by Phase | 237 |
| Table 16-2 | Waste by Material Type and Phase | 237 |
| Table 16-3 | Waste Storage | 238 |
| Table 16-4 | Annual Mine Production Schedule | 240 |
| Table 16-5 | Annual Long Term Stockpile Balance | 241 |
| Table 16-6 | Maximum Loader Productivity Estimate | 242 |
| Table 16-7 | Annual Load and Haul Equipment Requirements | 245 |
| Table 16-8 | Annual Mine Equipment Requirements (Number of Units) | 246 |
| Table 17-1 | Processing Design Criteria Summary | 251 |
| Table 17-2 | Crushing Circuit Set Points | 257 |
| Table 17-3 | Water Impoundment and Solution Storage Capacities | 264 |
| Table 17-4 | Peru Discharge Standards Liquid Effluents from Mining Activities* | 267 |
| Table 17-5 | Projected Annual Reagents and Consumables | 282 |
| Table 18-1 | Shahuindo Heap Leach Power Demand | 290 |
| Table 18-2 | Reservoirs and Impoundment Capacities | 293 |
| Table 18-3 | Downstream User Compensation Flow Required by Stream (L/s) | 293 |
| Table 21-1 | Shahuindo Project Capital Cost Summary | 319 |
| Table 21-2 | Shahuindo Project Operating Cost Summary | 319 |
| Table 21-3 | Summary of Pre-Production Capital Costs | 321 |
| Table 21-4 | Pre-Production Mining Fleet & Costs | 323 |
| Table 21-5 | Estimated Mine Capital by Year | 325 |
| Table 21-6 | Major Earthworks Unit Rates | 331 |
| Table 21-7 | Buildings | 333 |
| Table 21-8 | Field Indirect Costs | 335 |
| Table 21-9 | Initial Fills | 336 |
| Table 21-10 | Shahuindo Project Operating Cost Summary | 339 |
| Table 21-11 | Annual Mine Operating Costs | 342 |
| Table 21-12 | Mine Personnel Requirements | 345 |
| Table 21-13 | Mine Annual Personnel Costs ($000’s USD) | 347 |
| Table 21-14 | Shahuindo Operating Cost Summary (US$/t) – By Year | 349 |
| Table 21-15 | Shahuindo Project Staffing Levels | 351 |
| Table 21-16 | Process Power and Consumption – By Year | 353 |
| Table 21-17 | Process Consumable Items | 354 |
| Table 22-1 | Life-of-Mine Summary | 359 |
| Table 22-2 | Capital Cost to Completion | 363 |
| Table 22-3 | LOM Operating and G&A Costs | 364 |
| | |
| November 2012 | Shahuindo Project | xiii |
| |
|
MINE DEVELOPMENT ASSOCIATES |
| | |
| Table 22-4 | Key Financial Parameters | 365 |
| Table 22-5 | Cash Flow Analysis | 366 |
| Table 22-6 | Sensitivity Analysis | 368 |
| Table 24-1 | Crushing Area Carrying Capacities and Ground Settling Results | 375 |
| Table 24-2 | Processing Area Carrying Capacities and Ground Settling Results | 376 |
| Table 24-3 | Water and Excess Solution Ponds Analysis of Stability Results | 378 |
| Table 24-4 | Procurement Lead Times | 394 |
| Table 26-1 | Exploration Recommendations and Associated Costs | 409 |
| | |
| November 2012 | Shahuindo Project | xiv |
| |
|
MINE DEVELOPMENT ASSOCIATES |
LIST OF FIGURES
| | |
| Figure 1-1 | After-Tax IRR vs. Gold Price, Capital Cost, and Operating Cash Cost | 24 |
| Figure 1-2 | NPV @ 0% vs. Gold Price, Capital Cost, and Operating Cash Cost | 25 |
| Figure 1-3 | NPV @ 5% vs. Gold Price, Capital Cost, and Operating Cash Cost | 25 |
| Figure 4-1 | Shahuindo Project Location Map | 42 |
| Figure 4-2 | Mineral Claim Location Map | 47 |
| Figure 4-3 | Mineral Claim Location Map Detail Showing Deposit Area | 48 |
| Figure 5-1 | Shahuindo Road Route from Cajamarca | 56 |
| Figure 5-2 | Shahuindo Access Road Upgrade Cruce Pomabomba to Shahuindo Site | 57 |
| Figure 7-1 | Shahuindo Property Regional Geologic Map | 68 |
| Figure 7-2 | Regional Stratigraphy with Location of Some Deposits in the District | 69 |
| Figure 7-3 | Geologic Map of the Shahuindo Concession | 71 |
| Figure 7-4 | Shahuindo Project Cross-section A-A’ | 72 |
| Figure 7-5 | Shahuindo Mineral Corridors | 81 |
| Figure 8-1 | West Zone Geologic Cross-section W150 | 84 |
| Figure 8-2 | Central Zone Geologic Cross-section E500 | 86 |
| Figure 8-3 | Sub-Corridor A Geologic Cross-section E200 | 87 |
| Figure 8-4 | East Zone Geologic Cross-section E1150 | 89 |
| Figure 8-5 | East Zone Geologic Cross-section E1500 | 90 |
| Figure 8-6 | West Zone Geologic Cross-section W150 | 93 |
| Figure 8-7 | Central Zone Geologic Cross-section E500 | 94 |
| Figure 8-8 | Sub-Corridor A Geologic Cross-section E200 | 95 |
| Figure 8-9 | East Zone Geologic Cross-section E1150 | 96 |
| Figure 8-10 | Moyan Alto Zone Geologic Cross-section E1500 | 97 |
| Figure 9-1 | Exploration Targets | 103 |
| Figure 10-1 | Drill-Hole Location Plan | 106 |
| Figure 10-2 | Core Recovery and Gold Grades - >0.2 g Au/t Samples Only | 112 |
| Figure 10-3 | Core Recovery and Gold Grades - >0.7 g Au/t Samples Only | 113 |
| Figure 10-4 | Core Recovery and Gold Grades – Mineral Domains 200, 300, and400 | 113 |
| Figure 10-5 | RQD and Gold Grades | 115 |
| Figure 10-6 | Quantile Plot of Core and RC Assays | 116 |
| Figure 10-7 | Core and RC Sample Pairs – 5 meter search | 117 |
| Figure 12-1 | Control Chart for ST1100006 | 135 |
| Figure 12-2 | Results for Blank ST1100007 | 137 |
| Figure 12-3 | Gold in Blank ST1100007 vs. Preceding Sample | 138 |
| Figure 12-4 | Gold Pulp Check Analysis vs. Original | 140 |
| | |
| November 2012 | Shahuindo Project | xv |
| |
|
MINE DEVELOPMENT ASSOCIATES |
| | |
| Figure 12-5 | Gold Pulp Check Analyses - Relative Percent Difference | 141 |
| Figure 12-6 | Gold Pulp Check Analyses – Absolute Value of Relative Percent Difference | 141 |
| Figure 12-7 | Gold Pulp Check Analyses - Relative Percent Difference (Filtered) | 142 |
| Figure 13-1 | Location of Metallurgical Drill Holes and Samples | 147 |
| Figure 13-2 | Summary Results of HLC Size vs. Recovery | 154 |
| Figure 13-3 | KCA Bottle Roll Tests at 19 mm, % Sulfide Content and Gold Recovery | 161 |
| Figure 13-4 | Bottle Roll Test Results vs. Average Interval Depth, Composites Containing <0.1% Sulfide Sulfur | 162 |
| Figure 13-5 | KCA Crushed Ore Column Leach Tests, % Gold Recovery vs. P80Crush Size, <0.1% Sulfide | 166 |
| Figure 13-6 | KCA Crushed Ore Column Leach Tests, <0.1% Sulfides, % Gold Recovery vs. Au Head Grade | 167 |
| Figure 13-7 | KCA Crushed Ore Column Tests, % Sulfide Content vs. Gold Recovery | 168 |
| Figure 14-1 | Shahuindo Deposit Drilling with Resource Zones and Cross-section Locations | 182 |
| Figure 14-2 | Shahuindo Deposit West Zone Cross Section 150W Showing Gold Mineral Domains | 183 |
| Figure 14-3 | Shahuindo Deposit Central Zone Cross Section -500E Showing GoldMineral Domains | 184 |
| Figure 14-4 | Shahuindo Deposit East Zone Cross Section -1150E Showing Gold Mineral Domains | 185 |
| Figure 14-5 | Gold Equivalent Block Model Grades in Shahuindo Deposit West Zone Cross Section 150W | 203 |
| Figure 14-6 | Gold Equivalent Block Model Grades in Shahuindo Deposit Central Zone Cross Section -500E | 204 |
| Figure 14-7 | Gold Equivalent Block Model Grades in Shahuindo Deposit East Zone Cross Section -1150E | 205 |
| Figure 15-1 | Graph of Whittle Results | 211 |
| Figure 15-2 | Pit Design Slope Parameters by Sector | 214 |
| Figure 15-3 | Shahuindo Ultimate Pit and Dump Design | 216 |
| Figure 15-4 | Phase 1 and Phase 1B Pit Designs | 218 |
| Figure 15-5 | Phase 2 Pit Design | 219 |
| Figure 15-6 | Phase 3 Pit Design | 220 |
| Figure 15-7 | Phase 4 Pit Design | 221 |
| Figure 15-8 | Phase 5 Pit Design | 222 |
| Figure 17-1 | Shahuindo Project General Arrangement | 254 |
| | |
| November 2012 | Shahuindo Project | xvi |
| |
|
MINE DEVELOPMENT ASSOCIATES |
| | |
| Figure 17-2 | Heap Leaching Flow Sheet | 255 |
| Figure 17-3 | Average Year Daily Water Balance Schematic | 270 |
| Figure 17-4 | 100 Year Wet Year Daily Water Balance Schematic | 271 |
| Figure 17-5 | Dry Year Daily Water Balance Schematic | 272 |
| Figure 18-1 | Project Location and Access – Surrounding Region | 289 |
| Figure 20-1 | Location of Direct Influence Area | 309 |
| Figure 22-1 | After-Tax IRR vs. Gold Price, Capital Cost, and Operating Cash Cost | 369 |
| Figure 22-2 | NPV @ 0% vs. Gold Price, Capital Cost, and Operating Cash Cost | 369 |
| Figure 22-3 | NPV @ 5% vs. Gold Price, Capital Cost, and Operating Cash Cost | 370 |
| Figure 24-1 | Pit Slope Stability Sectors and Section Locations | 374 |
| Figure 24-2 | Installed Piezometer Locations | 388 |
| | |
| November 2012 | Shahuindo Project | xvii |
| |
|
MINE DEVELOPMENT ASSOCIATES |
Sulliden Gold Corporation Ltd. (Sulliden) commissioned Kappes, Cassiday & Associates (KCA) in conjunction with Mine Development Associates (MDA) to prepare a feasibility study for the Shahuindo Project, located in Peru, near Cajamarca. This project consists of an open pit mine and processing of ore by standard heap leaching methods. This Technical Report summarizes the results of the feasibility study.
This Technical Report has been prepared in compliance with the disclosure and reporting requirements set forth in the Canadian Securities Administrators’ National Instrument 43-101, Companion Policy 43-101CP, and Form 43-101F1 (NI 43-101), as well as with the Canadian Institute of Mining, Metallurgy and Petroleum’s “CIM Definition Standards - For Mineral Resources and Reserves, Definitions and Guidelines” (CIM Standards) adopted by the CIM Council on December 2000 and modified in 2005 and 2010.
| |
| 1.2 | Introduction and Project Overview |
The Shahuindo Project is located approximately 80 kilometers southeast of the town of Cajamarca, and 15 kilometers west of the town of Cajabamba. Shahuindo is 100% owned by Sulliden. The project contains Reserves of 1.02 million ounces of gold and 11.56 million ounces of silver in 37.85 million tonnes of oxide and mixed ore and represents approximately 40% of the reported resource. The 72.3 million tonnes of waste to be mined results in a waste to ore ratio is 1.91:1. Metallurgical testing has demonstrated the project is amenable to cyanidation using heap leaching with average projected field recoveries of 85.8% for the gold and 15% for silver. An overview of the production statistics is presented in Table 1-1.
| | |
| November 2012 | Shahuindo Project | 1 |
| |
|
MINE DEVELOPMENT ASSOCIATES |
| |
| Table 1-1 | Project Statistics |
| |
| Item | Value |
| Tonnes of Ore Treated | 37,847,000 t |
| Average Gold Grade | 0.84 g/t |
| Average Silver Grade | 9.50 g/t |
| Average Gold Equivalent Grade | 1.02 g/t |
| Recoverable Gold Ounces | 876,000 oz |
| Recoverable Silver Ounces | 1,734,000 oz |
| Recoverable Gold Equivalent Ounces | 909,500 oz |
| Waste Tons | 72.267,000 t |
| Strip Ratio | 1.91:1 |
Note: Reserve definition uses a variable cut-off scheme to enhance the project value.
See Section 15.3 for details.
| |
| 1.3 | Reliance on Other Experts |
The authors of this report, state that the information, opinions, estimates, and conclusions contained herein are based on:
Information available at the time of preparing this report
Assumptions, conditions, and qualifications as set forth in this report
Data, reports, and other information supplied by Sulliden and other third partysources
The authors of this report have relied on the following in preparation of this report:
| | | | |
| | ● | Pit Slope Stability Analyses: | Golder Associates | |
| ● | Pit Dewatering Parameters: | Ausenco | |
| ● | Hydrology: | Ausenco | |
| ● | Heap Leach Geotechnical Analyses: | Ausenco | |
| ● | Property Description, Ownership Issues, Permits: | Sulliden | |
| |
| 1.4 | Property Description & Location |
The Shahuindo Project is situated at latitude 7 degrees 25 minutes south, longitude 78 degrees 25 minutes west (Universal Transverse Mercator (UTM) coordinates 9,158,000-North and 807,000-East Zone 17S, datum PSAD 56), approximately 80 kilometers southeast of Cajamarca.
| | |
| November 2012 | Shahuindo Project | 2 |
| |
|
MINE DEVELOPMENT ASSOCIATES |
Sulliden entered into a Transfer of Mineral Rights and Properties Contract with Compania Minera Algamarca S.A. and Exploraciones Algmarca S.A. (collectively Algamarca) in 2002. The contract covered 26 mineral claims and 41 surface rights. In 2003, legal proceedings against Sulliden commenced which concluded with a Settlement Agreement in 2009 giving Sulliden 100 percent ownership of the project. Sulliden’s title to the mineral claims is registered in the Peruvian Public Registry.
Sulliden has accumulated the 26 mineral rights in one new right named ACUMULACION SHAHUINDO. The title of ACUMULACION SHAHUINDO has been granted by the competent governmental agency on March 12, 2012 and is registered in Peruvian Public Registry (Registro Público de Minería).
| |
| 1.5 | Access, Climate, Local Resources and Physiography |
The Shahuindo Project is located in Northern Peru approximately 970 kilometers by road north-north west of Lima. The project site can be accessed from Lima by traveling north on Highway 1 (the Pan-American Highway) to Ciudad de Dios, then east on Highway 8 to Cajamarca. The site is approximately 115 km from Cajamarca via asphalt-paved highway (100 km on Highway 3N), and gravel and dirt roads. Travel time from Cajamarca is about 3½ hours by road, including approximately 2½ hours from Cajamarca via asphalt paved Highway 3N to Cruce Pomabomba, and an additional hour from the junction with Highway 3N to the project site on gravel and dirt roads.
The port sites for project development support are the Port of Callao (Lima) and the Port of Paita in the north. The project site can be accessed from the Port of Callao by traveling north from Lima as described above. From the Port of Paita, the project site can be accessed by traveling south on Highway 1 to Ciudad de Dios, then to site via Cajamarca as indicated earlier. Ciudad de Dios is approximately 350 km south of Paita. Cajamarca is roughly 180 km from Ciudad de Dios.
The climate is humid during the wet season and cold and dry during the dry season: a typical climate of the sierra region. The wet season occurs during the months of October through April and the dry season occurs during the months of May through September. The average annual rainfall is 999.7 mm.
| | |
| November 2012 | Shahuindo Project | 3 |
| |
|
MINE DEVELOPMENT ASSOCIATES |
Temperatures range from 15.7 to 23.1oC during the day decreasing to 7.5oC overnight.Wind speeds range from 0 to 3.1 m/s with a prevailing east by northeast direction.
The Shahuindo Project is located in an economically depressed area where subsistence agriculture is the main activity.
Manning requirements for the project will come from the local area and surrounding communities including Cajabamba whenever possible.
The main power supply to the site will be from the Peruvian Carhuamayo-Paragsha-Conococha Kiman Ayllu-Cajamarca Norte-Cerro Corona-Carhuaquero Trans-national 220 kV transmission line which was recently completed. This transmission line passes within 3 km of the site. It is currently planned to connect to this power line to supply grid power to the project site.
The Shahuindo Project will require a water supply for mining, processing and other supporting activities (including outside users and compensation flows). The make-up water required by the heap leach system during the dry season, particularly during abnormally dry years, will be met from storage ponds and pit dewatering drains and wells.
The Shahuindo site is located on the west side of the Condebamba River valley. The topography varies from rolling hillsides to steep ravines. Elevation across the project varies from 2,400 m above sea level to 3,600 m above sea level. The project area is classified as neo-tropical Peruvian “Yungas” by the World Wildlife Fund.
The first mining activities on the Shahuindo Project were conducted by the Spanish after their conquest of the Inca Empire in the 1530’s. These comprised multiple small-scale adits of very limited length.
Algamarca commenced exploitation of the Algamarca mine in the 1940’s and mined 1.5 Mt through 1989. In the 1980s, Algamarca conducted limited small-scale mining of gold-silver mineralization from the San José and Shahuindo mines located on the northeast limb of the Algamarca anticline.
| | |
| November 2012 | Shahuindo Project | 4 |
| |
|
MINE DEVELOPMENT ASSOCIATES |
From 1990 to 1998, Alta Tecnología e Inversión Minera y Metalúrgica S.A. (Atimmsa), Asarco LLC (Asarco), and Southern Peru Copper Corp. (Southern Peru) explored the Shahuindo Project area. Work by Asarco and Southern Peru led to identification of four major low-grade gold-silver zones at Shahuindo – San José, Porphyry, South Contact, and East Zone, which are now part of the resource area.
Sulliden acquired the property and commenced exploration activity in 2002. Sulliden’s work since acquisition has comprised an initial technical review of all available data collected prior to 2002; numerous geophysical surveys; detailed geochemical sampling and geologic mapping; trenching; metallurgical testing; and extensive exploration and geotechnical drilling. .
Mineral resources were estimated in 2004, 2005, 2009, 2011 and updated in 2012. A preliminary economic assessment was completed for Sulliden by AMEC in 2010. Prior to the current feasibility study, though, no mineral reserves had been estimated for the Shahuindo property.
| |
| 1.7 | Geologic Setting and Mineralization |
The Shahuindo Project lies in the Western Cordillera of the Peruvian Andes within a regional fold and thrust belt of predominantly Mesozoic sedimentary rocks that have been cut by intrusions provisionally dated at 25 Ma and 16 Ma. The Lower Cretaceous Goyllarisquizga Group is the predominant unit exposed on the property, consisting of six formations of orthoquartzite, shale, siltstones, sandstones, and marine carbonate rocks. These rocks have been intruded by weakly altered to unaltered diorite porphyry, altered dacite porphyry, and variably-altered quartz diorite porphyry.
The Algamarca anticline, a prominent west-northwest-trending structural and topographic feature, is located along the southwestern part of the property. A sub-parallel fault set, interpreted to be imbricated thrust faults, lies to the north, parallel to the hinge of the anticline. These imbricate faults are cut at high angles by late, mostly normal faults.
The Shahuindo property has been divided into three sub-parallel mineral corridors which occur within the west-northwest-striking thrust fault set: the Central Mineralized Corridor (CMC), North Mineralized Corridor (NMC), and Southern Mineralized Corridor (SMC).
| | |
| November 2012 | Shahuindo Project | 5 |
| |
|
MINE DEVELOPMENT ASSOCIATES |
The NMC encompasses the adits and workings occurring along a strike length of 500 to 700 meters in the historic Shahuindo mine area. Gold mineralization in outcrops has been noted at intermittent intervals along the entire strike length of the NMC, which is defined by a 1.2 square kilometer gold-in-soil anomaly. An initial exploration program recently conducted on the NMC was successful in demonstrating the presence of near-surface oxide mineralization that is similar to that of the Central Corridor. The SMC consists of mineralization along strike from the Cerro Redondo prospect. A surface gold anomaly has been noted along a 3 kilometer-long trend and includes northeast-trending veins found on top of the Algamarca anticline.
The CMC is defined by mineralization over a 6-kilometer strike length along the northeast limb of the Algamarca anticline. The Shahuindo resource lies within the CMC. The resource has been sub-divided along strike, due to variations in geology and mineralization, into four resource zones: the West, Central, East, and Moyan Alto zones.
For the Shahuindo deposit, the most important characteristic is the relatively continuous, near-surface mineralization extending over a strike length of more than 4 kilometers. Within the large, continuous lower-grade mineralized shell, higher-grade gold and silver mineralization is related to generally near-vertical to southwest-dipping structures hosted within variably silicified sedimentary rocks, primarily the Carhuaz Formation, or along sedimentary rock/porphyry intrusive contacts. Within the Central area of the resource, the mineralized bedrock is covered by a colluvial overburden horizon that is up to 70 meters thick. The overburden contains weakly mineralized debris, a portion of which is included in the current resource.
Supergene weathering and oxidation occur to variable depths ranging from 15 meters to over 200 meters below the topographic surface. In the oxide facies, gold and silver are associated with jarosite and hematite. In the sulfide facies, gold is typically extremely fine grained; the mineral species have not been identified. Fine-grained pyrite forms a close association with gold mineralization and occurs as disseminations, veinlets, and semi-massive replacement bodies. Silver is usually found in sulfo-salts.
Deposit-wide, the silver to gold ratio averages 12:1 within the oxide portion of the deposit, 35:1 within the sulfide facies, and approximately 50:1 within the transitional “mixed” zone that occurs at the base of oxidation of the deposit. The metal ratios reflect the strong leaching of silver from the near-surface oxide material with subsequent supergene enrichment at the base of the zone of oxidation.
| | |
| November 2012 | Shahuindo Project | 6 |
| |
|
MINE DEVELOPMENT ASSOCIATES |
Field evidence suggests that the Shahuindo mineralization belongs to the epithermal type of gold-silver deposit (Guilbert and Park, 1986; Hedenquistet al.,1999, 2000; White and Hedenquist, 1995; and Taylor, 2007), although earlier work by Montoyaet al.(1995) suggested the mineralization could be Carlin type.
The Shahuindo deposit consists of four major zones, interpreted to be down-faulted blocks (east-side down) along the strike of the deposit. Each of the four zones is bounded by transect faults, and each zone has distinct geological characteristics. Common to all of them is that high-grade mineralized shoots (1-5 meters wide of >1.0 g Au/t material) are structurally controlled and are surrounded by a large halo of low-grade material (0.2 g Au/t). Hydrothermal alteration consists mostly of muscovite and silicification (Hodder 2010a). In a general way, “vuggy silica” facies and “lithocap” facies are found along the strike of the deposit, with the former more prevalent in the western part of the deposit. The intensity of hydrothermal alteration may be assessed by the composition of Fe/K and Na/K ratios in the muscovite. Minute amounts of acidic clays (pyrophyllite, alunite, diaspore) have also been identified in open fractures in the lithocap facies. Quartz veining is rare.
Prior to 1990, exploration was conducted by Algamarca on the Shahuindo property though no public records are available to provide details of Algamarca’s work. From 1990 to 1998, Alta Tecnología e Inversión Minera y Metalúrgica S.A. (Atimmsa), Asarco LLC (Asarco), and Southern Peru Copper Corp. (Southern Peru) explored the Shahuindo Project area, completing mapping, geochemical sampling, and reverse circulation (RC) and core drilling.
Sulliden’s work since acquisition in 2002 has comprised an initial technical review of all available historic data; grid establishment; survey of historic drill-hole collars where such could be identified; resistivity, induced polarization (IP) and magnetic geophysical surveys; detailed soil sampling; geological mapping and outcrop sampling; trenching; adit sampling; metallurgical testing; and drilling of 390 core holes and 252 RC holes for exploration purposes.
Through 2011, a total of 827 holes have been drilled by Atimmsa, Asarco, Southern Peru, and Sulliden within the current Shahuindo Project area. The drill-hole database
| | |
| November 2012 | Shahuindo Project | 7 |
| |
|
MINE DEVELOPMENT ASSOCIATES |
used for the 2012 resource estimate includes 826 of 827 holes drilled at Shahuindo; one Asarco core hole was not used because the collar location was uncertain. Of the 827 holes drilled, 453 were core, and 374 were RC; 629 of the 827 holes were drilled by Sulliden.
The majority of project drill holes have been collared at azimuths around 35 degrees or 215 degrees to intersect the main structural trend of the deposit at a high angle. Results of down-hole surveys are available for 576 of the holes drilled. Drill-core recovery during the 2003 through 2011 Sulliden programs was generally good, averaging 89 percent for all drill holes. Within the five resource zones, average core recovery for the mineralized intervals ranges from 77 percent in the Moyan Alto area to 89 percent in the Central area. The West and East zones average between 85 and 87 percent core recovery.
For the 826 drill holes in the Shahuindo Project assay database, there is a total of 94,441 gold assays, 93,073 silver assays, 69,103 total-sulfur analyses, and 9,800 sulfide-sulfur analyses.
Approximately 90 percent of the project drill data (378 core and 372 RC holes for a total meterage of 131,905.1 meters) are within or adjacent to the current mineral resource area and were used in the creation of the geologic models and subsequent resource estimation.
The current drill-hole database includes all holes drilled by Sulliden through the end of 2011. Sulliden drilling has continued into the first half of 2012 with the completion of 13 core holes. The 2012 drilling is primarily outside the current resource area and has not been evaluated; its effect on the resource has not been quantified.
| |
| 1.11 | Sample Preparation, Analysis and Security |
During the Sulliden drill programs, core was logged and sampled at the Shahuindo exploration camp. Drill holes were sampled entirely and the core split into two equal parts using a rotary saw.
Sulliden maintains a secure centralized storage facility in Cajamarca with all drill core, reverse circulation chip trays, coarse rejects, and pulps. All are organized, labeled, and racked for ready retrieval.
Previous operators used the following established laboratories for sample analyses: Skyline Laboratories, Inc. (now Skyline Assayers & Laboratories), SGS, CIMM Peru
| | |
| November 2012 | Shahuindo Project | 8 |
| |
|
MINE DEVELOPMENT ASSOCIATES |
S.A., and Actlabs, Inc. Sample certificates are available for the drill campaigns in 1994, 1995, 1996, 1997, and 1998 and some details about the analytical procedures can be established from the historic certificates. During the Asarco drill programs, all drill hole samples were analyzed by fire assay (one ton standard) for both gold and silver. Assay certificates from the 1997 and 1998 campaigns show that samples were analyzed by CIMM laboratories in Lima for gold and silver plus copper, lead, zinc, molybdenum, arsenic, bismuth, antimony, and mercury.
During the Sulliden campaigns, sampling and sample dispatch for the Shahuindo Project have been carried out under the supervision of Sulliden staff. Samples are sent to ALS Minerals (ALS; formerly known as ALS Chemex) in Lima for sample preparation and analysis. Certificates are issued by ALS digitally and on paper. The ALS laboratory in Lima is ISO 9001:2008 and ISO 17025:2005 certified.
For Sulliden’s samples, gold has been assayed with a 50-gram fire assay (FA) with atomic absorption (AA) finish. For samples with greater than 10 grams per tonne gold in the initial FA-AA assay, the fire assay is repeated using a gravimetric finish. In 2003 and 2004, silver was assayed from a 5-gram split, which was digested by aqua regia and read by AA. Since 2007, a separate split was taken and digested in aqua regia for analysis with inductively coupled plasma atomic emission spectroscopy to determine 31 major and trace elements including silver, copper, arsenic, bismuth, and antimony. For samples having greater than 100 g Ag/t, a silver assay was carried out from another 5-gram split, which was digested in aqua regia and read by AA. For samples having greater than 1,000 g Ag/t, silver was assayed by a 50-gram fire assay and a gravimetric finish.
MDA is of the opinion that the sampling methods, security, and analytical procedures are adequate for mineral resource estimation. The authors are not aware of any sampling or assaying factors that may materially impact the mineral resources.
The data verification programs undertaken on the data collected from the project support the geological interpretations, and the analytical and database quality. Therefore the Shahuindo database is adequate for use in estimating and classifying a Mineral Resource. Principal findings from the data verification are:
| | |
| November 2012 | Shahuindo Project | 9 |
| |
|
MINE DEVELOPMENT ASSOCIATES |
The drill data support the geologic interpretations and style of mineralization usedin the resource model.
The QA/QC data indicate that the assay data are sufficiently accurate for use inMineral Resource estimation, although the observed low bias in the ALS assaystandard sample and pulp duplicate results, as compared to the SGS values,indicates a possible conservatism in the estimate.
| |
| 1.13 | Mineral Processing and Metallurgical Testing |
Metallurgical testing of the ore from the Shahuindo ore bodies have been conducted by Heap Leach Consultants in Lima, and Kappes, Cassiday & Associates in Reno, Nevada, USA. The results of the testing programs indicate excellent gold recoveries at a moderate crush size with low to moderate reagent requirements, implying amenability to heap leaching. Gold estimated field recovery is 86% on oxide ore and 50% on transition ore. Silver recovery is low, with estimated field recovery of 15% on both the oxide and transition ore. Cyanide consumption is estimated to be 0.27 kg/t, and cement for agglomeration is estimated to be 6 kg/t.
| |
| 1.14 | Mineral Resource Estimate |
The mineral resource estimate is based on drilling completed through the end of 2011 and the subsequent drill information provided to MDA by Sulliden up through May 17, 2012. The resource estimates were finalized July 13, 2012.
The gold and silver resources at Shahuindo were modeled and estimated by evaluating the drill data statistically, utilizing the geologic interpretations provided by Sulliden to interpret mineral domains on 83 unique cross sections spaced at 50-meter intervals (except for the three westernmost sections, which are spaced 100 meters apart), rectifying the mineral domain interpretations on level plans spaced at 8-meter intervals, analyzing the modeled mineralization statistically to establish estimation parameters, and interpolating grades into a three-dimensional block model. Lithology, oxidation, silicification, and gold and silver mineral-domain models were created for the Shahuindo Project. All modeling of the Shahuindo resources was performed using Gemcom Surpac® mining software.
The stated resource is fully diluted to 8 meters by 8 meters by 4 meters blocks and tabulated on gold-equivalent (AuEq) grade cutoffs that are reasonable for deposits of this nature and for the expected mining conditions and methods. The block dimensions were chosen as practical sizes for open-pit mining a deposit of this kind. The AuEq
| | |
| November 2012 | Shahuindo Project | 10 |
| |
|
MINE DEVELOPMENT ASSOCIATES |
grade is calculated using the individual gold and silver grades of each block, along with a gold price of $1,300.00 per ounce gold and a silver price of $25 per ounce silver. For the oxide and mixed resource estimates, the AuEq grade calculation includes a 5:1 difference in gold versus silver recovery in the proposed heap-leach processing scenario.
The formulas used to calculate the AuEq grade are:
| | | |
| Oxide Material: | g AuEq/t = g Au/t + (g Ag/t x 0.003846) | |
| Mixed Material: | g AuEq/t = g Au/t + (g Ag/t x 0.006410) | |
| Sulfide Material: | g AuEq/t = g Au/t + (g Ag/t x 0.019231) | |
Shahuindo Reported Resources are presented in Table 1-2.
| |
| Table 1-2 | Shahuindo Gold and Silver Reported Resource |
| | | | | | | |
| Class | Cutoff
(g AuEq/t) | Tonnes | g AuEq/t | g Ag/t | oz Ag | g Au/t | oz Au |
| Measured-Oxide | 0.200 | 40,500,000 | 0.619 | 8.1 | 10,530,000 | 0.588 | 766,000 |
| Measured-Mixed | 0.350 | 780,000 | 0.964 | 33.7 | 850,000 | 0.748 | 19,000 |
| Measured Total | variable | 41,280,000 | 0.626 | 8.6 | 11,380,000 | 0.591 | 785,000 |
| | | | | | | | |
| Indicated-Oxide | 0.200 | 104,840,000 | 0.506 | 6.3 | 21,080,000 | 0.482 | 1,624,000 |
| Indicated-Mixed | 0.350 | 1,190,000 | 0.919 | 23.8 | 910,000 | 0.766 | 29,000 |
| Indicated Total | variable | 106,030,000 | 0.511 | 6.5 | 21,990,000 | 0.485 | 1,653,000 |
| | | | | | | | |
| Meas. + Ind. Total | variable | 147,310,000 | 0.543 | 7.1 | 33,370,000 | 0.515 | 2,438,000 |
| | | | | | | | |
| Inferred-Oxide | 0.200 | 9,570,000 | 0.419 | 4.3 | 1,330,000 | 0.402 | 124,000 |
| Inferred-Mixed | 0.350 | 20,000 | 0.762 | 12.2 | 10,000 | 0.684 | - |
| Inferred-Sulfide | 0.500 | 61,410,000 | 1.202 | 22.9 | 45,220,000 | 0.762 | 1,504,000 |
| Inferred-Total | variable | 71,000,000 | 1.096 | 20.4 | 46,560,000 | 0.713 | 1,628,000 |
Note: rounding may cause apparent inconsistenciesThere are Measured, Indicated, and Inferred resources within the Shahuindo deposit. Measured resources are restricted to well-defined oxide and mixed mineralization. Sulfide resources are restricted to Inferred, primarily due to: a) limited metallurgical characterization of this material type; and b) some spatial and geologic uncertainty in the model. The mineralized overburden is restricted to Indicated and Inferred due to the uncertainties in grade continuity.
| | |
| November 2012 | Shahuindo Project | 11 |
| |
|
MINE DEVELOPMENT ASSOCIATES |
The informal mining activity by local small miners in the west half of the West zone has created some uncertainty in the resource tonnes and total ounces. As a result, MDA has decided to classify all material within the area of informal mining as Inferred. Because this restriction affects only one to two percent of the total resource, MDA does not consider the effects of the informal mining materially significant to the overall resource.
| |
| 1.15 | Mineral Reserve Estimate |
MDA has used Measured and Indicated resources as the basis to define reserves. Reserve definition is done by first identifying ultimate pit limits using economic parameters and pit optimization techniques. The resulting optimized pit shells were then used for guidance in pit design to allow access for equipment and personnel. Several phases of mining were defined to enhance the economics of the project, and MDA used the phased pit designs to define the production schedule to be used for cash-flow analysis for the feasibility study.
Table 1-3 presents the Proven and Probable reserves. These reserves are shown to be economically viable based on cash-flows provided by KCA. MDA has reviewed the cash-flows and believes that they are reasonable for the statement of Proven and Probable reserves.
| |
| Table 1-3 | Ultimate Pit Proven and Probable Reserves |
| | | | | | | | | |
| | Proven | Probable | Proven & Probable |
| | Oxide | Mixed | Total | Oxide | Mixed | Total | Oxide | Mixed | Total |
| K Tonnes | 14,994 | 165 | 15,159 | 22,595 | 93 | 22,688 | 37,589 | 258 | 37,847 |
| g Au/t | 0.90 | 0.71 | 0.90 | 0.80 | 0.87 | 0.80 | 0.84 | 0.76 | 0.84 |
| K Ozs Au | 434 | 4 | 437 | 582 | 3 | 584 | 1,015 | 6 | 1,022 |
| g Ag/t | 10.4 | 17.6 | 10.5 | 8.8 | 21.3 | 8.9 | 9.4 | 18.9 | 9.5 |
| K Ozs Ag | 5,008 | 93 | 5,102 | 6,396 | 64 | 6,459 | 11,404 | 157 | 11,561 |
| g AuEq/t | 0.91 | 0.72 | 0.91 | 0.81 | 0.89 | 0.81 | 0.85 | 0.78 | 0.85 |
| K Ozs AuEq | 438 | 4 | 441 | 588 | 3 | 591 | 1,026 | 6 | 1,032 |
Note: Proven and Probable Reserves are stated based on variable cutoff grades in g Au/t where:
Oxide: 0.35, 0.35, 0.30, 0.35, 0.30, 0.30 for Phases 1, 1B, 2, 3, 4, and 5 respectively; and
Mixed: 0.35, 0.35, 0.33, 0.35, 0.33, 0.33 for Phases 1, 1B, 2, 3, 4, and 5 respectively.
The Shahuindo Project has been planned as an open pit truck and front end loader operation. The truck and loader method provides reasonable cost benefits and selectivity for this type of deposit. Mine production is achieved using up to four front loaders with 6.9 cubic-meter buckets. The proposed truck fleet will consist of conventional trucks with a 22 cubic-meter end dump bed.
| | |
| November 2012 | Shahuindo Project | 12 |
| |
|
MINE DEVELOPMENT ASSOCIATES |
For production scheduling, material types were classified into either ore or waste categories. Ore consists of only Measured or Indicated material, which includes oxide or transition material. All Inferred material is considered waste. Note that there are no sulfide Measured or Indicated resources, thus all sulfide material is considered to be waste.
Waste material was defined as all material inside of the pit designs that did not meet Proven and Probable reserve classifications. This includes Inferred material. Among the waste material is approximately 21 million tonnes of mineralized material that is above the economic cutoff grade, however, since the material was below the operational cutoff grades, the material is considered waste and is not included in Proven and Probable reserves or in the production schedule.
Pit dewatering will be required to meeting pit slope stability criteria. Recommendations for pit dewatering were provided by Ausenco.
The annual mine production schedule is summarized in Table 1-4.
| | |
| November 2012 | Shahuindo Project | 13 |
| |
|
MINE DEVELOPMENT ASSOCIATES |
| |
| Table 1-4 | Annual Mine Production Schedule Summary |
| | | | | | | | | | | | | | |
| | | Pre-
Prod | Yr 1 | Yr 2 | Yr 3 | Yr 4 | Yr 5 | Yr 6 | Yr 7 | Yr 8 | Yr 9 | Yr 10 | Yr 11 | Total |
Total Ore
Mined | K Tonnes | 792 | 3,305 | 3,253 | 4,435 | 5,500 | 4,443 | 5,228 | 3,660 | 3,226 | 3,650 | 352 | - | 37,847 |
| g Au/t | 0.82 | 0.98 | 1.08 | 0.94 | 0.89 | 0.69 | 0.67 | 0.91 | 0.86 | 0.63 | 0.82 | - | 0.84 |
| K Ozs Au | 21 | 104 | 113 | 135 | 158 | 99 | 112 | 107 | 89 | 73 | 9 | - | 1,022 |
| g Ag/t | 15.3 | 11.5 | 11.0 | 13.0 | 7.4 | 7.5 | 6.8 | 8.8 | 9.4 | 10.7 | 14.1 | - | 9.5 |
| K Ozs Ag | 390 | 1,217 | 1,154 | 1,856 | 1,308 | 1,075 | 1,137 | 1,039 | 973 | 1,252 | 160 | - | 11,561 |
| Total Waste | K Tonnes | 2,517 | 8,587 | 9,682 | 8,193 | 9,170 | 11,474 | 10,828 | 4,277 | 4,788 | 2,641 | 111 | - | 72,267 |
| Total Mined | K Tonnes | 3,309 | 11,892 | 12,935 | 12,629 | 14,670 | 15,917 | 16,056 | 7,937 | 8,015 | 6,291 | 463 | - | 110,114 |
| | |
| November 2012 | Shahuindo Report | 14 |
| |
|
MINE DEVELOPMENT ASSOCIATES |
Processing will take place at a rate of 10,000 tonnes of ore per day. The Shahuindo Project is projected to have a 10.4 year mine life with a Proven and Probable reserve of 37.5 million tonnes of ore. Ore will be delivered to a modular-style 2-stage crushing plant near the pit. The product size will be 100% passing 32 mm. The final product from the crusher circuit discharges to a kidney shaped stockpile, which is reclaimed from beneath the stockpile and is transported to the heap leach pad using overland conveyors. Cement and dilute cyanide are added to the ore on the final conveyor and is discharged to a mobile stacking system.
Stacked ore is leached using a sprinkler irrigation system for solution application. After percolating through the ore, the gold and silver bearing solution drains to a pregnant (PLS) pond where it is collected and pumped to an activated carbon adsorption-desorption-recovery (ADR) plant.
Adsorption will takes place in a single train of five gravity-cascade carbon columns. Barren solution discharge from the final columns flows by gravity to a barren tank and is then pumped to the heap for further leaching. High strength cyanide solution will be injected into the barren solution to maintain the cyanide concentration in leach solution at the desired level.
Desorption of gold and silver from the carbon utilizes a pressurized elution column followed by recovery of gold and silver from pregnant eluant solution in electrolytic cells containing stainless steel cathodes. Loaded cathodes are washed and the resulting precious metal sludge is retorted to remove and recover mercury followed by smelting in a diesel-fired crucible furnace to produce a doré final product
Enhanced evaporation will be required to maintain process water balance during average precipitation years. A series of land mounted evaporation units will be used to evaporate solution as required. During 100-year wet years, treatment and discharge of solutions will be required.
There is a pit dewatering treatment plant included to remove heavy metals and adjust pH as required from any water transferred out of the pit that cannot be used in processing.
| | |
| November 2012 | Shahuindo Project | 15 |
| |
|
MINE DEVELOPMENT ASSOCIATES |
The principle access to the Shahuindo property is via paved and dirt and gravel roads from Cajamarca. Approximately 15 km of dirt and gravel roads on the route from Cruce Pomabomba (between Cajamarca and Project site) require upgrades for access to the Shahuindo site. Power will be supplied to the project site by connecting to the existing trans-national 220 kV power line which passes within three kilometers of the site. Diesel-fired backup generators are present to supply emergency power to critical areas and to the man camp in the event of a power failure.
Water required for the project will be met from several potential sources:
Solution previously stored in the storm water excess solution pond
Well water and/or water from pit dewatering
Water from the water catchment ponds
Fire water storage tanks and pumping systems will be installed in the process plant area, in the camp area, and in the mine shop area. Bottled water will be supplied for drinking water.
Sewage treatment systems will be installed in the camp and process areas on site. Solid wastes will be transported off site as per Peruvian regulations.
Project buildings are summarized below. Where possible, the buildings are expected to be a combination of prefabricated modular buildings and local concrete masonry unit construction.
Administration Building (exists)
Dining Facilities (exists)
Mine Shop
Mine Warehouse and Workshop
Process Maintenance and Warehouse Area
Process Area Office
Locker Rooms
ADR Facility, including Refinery and Reagent Storage
Construction and Permanent Man Camp (expansion of existing facilities required)
| | |
| November 2012 | Shahuindo Project | 16 |
| |
|
MINE DEVELOPMENT ASSOCIATES |
| |
| 1.19 | Market Studies and Contracts |
There were no market studies conducted or contracts considered as gold and silver can easily be sold on the world market.
| |
| 1.20 | Environmental Studies, Permitting and Social or Community Impact |
The operation is designed to comply with Peruvian environmental requirements and Sulliden Gold Corporation’s environmental policy. The project has been designed to industry “best practice” standards.
| |
| 1.20.1 | Studies and Permitting |
The General Mining Law of Peru is the primary body of law with regard to environmental regulation of exploration and mining activities. The General Mining Law is administered by the Ministry of Energy and Mines.
Generally, the Ministry of Energy and Mines requires exploration and mining companies to prepare an Environmental Impact Statement (DIA) – Category I, Environmental Impact Study Semi Detailed (EIAsd) – Category II, an Environmental Impact Assessment, a Program for Environmental Management and Adjustment, and a mine closure plan. The category II EIAsd has been completed while the other documents are currently in progress. Mining companies are also subject to annual environmental audits of operations by the Organismo de Evaluación y Fiscalización Ambiental (OEFA).
Besides the relevant local and national exploration permits, additional permits will be required for Project development. Key permits identified that could impact either development or construction timetables include:
Certificate for the Inexistence of Archaeological Remains (CIRA)
Environmental Impact Assessment (EIA)
Mine Closure Plan
Establishment of a financial guarantee for closure
Beneficiation Concession
Mining Transportation Concession
Permanent Power Concession
Water Usage Permits
| | |
| November 2012 | Shahuindo Project | 17 |
| |
|
MINE DEVELOPMENT ASSOCIATES |
Easements and Rights-of-way
District and Provincial Municipality Licenses
Construction and Operation Permits
| |
| 1.20.2 | Reclamation and Closure |
The Shahuindo Project has been designed to meet and comply with the environmental standards and legislated closure requirements of Peru.
In accordance with Peruvian requirements, company standards, and accepted industry practices, the development, operation, and conceptual reclamation plans have been proposed to accomplish:
Protection of public health and safety.
Minimization or elimination of environmental damage.
Return of the land to a state fit for its original use or an acceptable alternativeuse.
The conceptual closure and reclamation plan proposes that the following actions be taken:
The open pits will remain as permanent features, berms will be installed and roads closed to prevent public access. Any potential acid generating materials on the pit floor will be covered with non-acid generating waste. It is expected that the pit will eventually fill with water, form a pit lake and overflow.
The heap leach will be rinsed to remove trace cyanide to adequate discharge levels. The heap will undergo minor re-contouring, a low-permeability soil capping will be placed over the facility and it will be re-vegetated.
The solution ponds will be closed with the procedures established in the approved closure plan. These procedures will include conversion of the
| | |
| November 2012 | Shahuindo Project | 18 |
| |
|
MINE DEVELOPMENT ASSOCIATES |
Work is well underway on the Social Baseline Study, which is a critical component of Sulliden’s social impact assessment. This study describes the people and locations within the area of influence of the project, which may experience either positive and or negative effects from the future development of the mine. The Area of Influence has been further divided into the Direct and Indirect Areas of Influence. The Direct Area of Influence is defined as those people and or places, which may directly experience either positive or negative social effects from the project in varying degrees. The Indirect Area of Influence is composed of people and or places that may experience positive social
| | |
| November 2012 | Shahuindo Project | 19 |
| |
|
MINE DEVELOPMENT ASSOCIATES |
impacts and reduced negative social impacts than those located in the direct area of influence.
Sulliden is committed to proactive and transparent engagement with the communities, public institutions and government agencies located within the project’s area of influence. The company also recognizes its role to contribute to local sustainable development by utilizing its ability to mobilize technical and financial resources, to support the implementation of local initiatives for local development during the construction and operational stages.
| |
| 1.21 | Capital and Operating Costs |
Capital and operating costs for the Shahuindo Project were estimated by MDA and KCA with input from Sulliden on pre-production owner’s costs and general and administrative operating costs. The estimated capital and operating costs are considered to have an accuracy of +/-15%.
The required capital expenditures include the estimation of costs for all mining equipment, pre-production mining, process facilities, and infrastructure for the project. The capital costs have been estimated primarily by KCA with input from MDA on mine pre-production and equipment costs. Capital cost estimates have been made primarily using budgetary supplier quotes for all major and most minor equipment items. All capital cost estimates are based on the purchase of equipment quoted new from the manufacturer, or estimated to be fabricated new.
Operating costs for the project have been estimated from first principals using labor cost, material consumptions and costs. Labor costs are estimated using project specific staffing, salary, wage, and benefit requirements. Unit consumption of materials, supplies, power, water, and delivered supply costs are also estimated.
The operating costs were determined by year. They are based upon ownership of all project production equipment and site facilities, as well as the Owner employing and directing all operating, maintenance, and support personnel. The operating costs have been estimated and are presented without any added contingency allowances.
All costs are presented in 2ndquarter 2012 US dollars (US$). Where prices were supplied in Peruvian Nuevo Soles (PNS), an average conversion rate of 2.65 PNS per US dollar was used. These costs do not include IGV (Value Added Tax).
| | |
| November 2012 | Shahuindo Project | 20 |
| |
|
MINE DEVELOPMENT ASSOCIATES |
The total capital cost is US$ 188.2 million. The total life of mine (LOM) operating cost for the Shahuindo Project is US$ 11.94 per tonne of ore. Table 1-5 and Table 1-6 present the capital and operating cost requirements for the project.
| |
| Table 1-5 | Shahuindo Project Capital Cost Summary |
| |
| Description | Cost (USD) |
| Pre-Production Capital | $132,746,000 |
| Working Capital (60 days) | $7,637,000 |
| Sustaining (Future) Capital | $47,789,000 |
| Total | $188,172,000 |
| |
| Table 1-6 | Shahuindo Project Operating Cost Summary |
| |
| Description | LOM Cost
(USD / t ore) |
| Mine | $5.66 |
| Process | $4.00 |
| Service & Support | $0.51 |
| Site G & A | $1.76 |
| Total | $11.94 |
Note – differences in totals due to rounding.
Based on the estimated production parameters, capital costs, and operating costs, a cash flow model was prepared by KCA for the economic analysis of the Shahuindo Project. The project economics were evaluated using a discounted cash flow (DCF) method, which measures the Net Present Value (NPV) of future cash flow streams. The final economic model was developed by KCA, with input from Sulliden, using the following assumptions:
Period of Analysis of 16 years (includes two years of pre-production andinvestment), 10.4 years of production, and 3.6 years for closure and reclamation
Three year trailing average (as at August 31, 2012) gold price of US$ 1,415/ozand silver price of US$ 27.00/oz
Processing rate of 10,000 tpd ore
Heap leach recoveries of 86% and 15% for gold and silver, respectively, for oxideore and recoveries of 50% and 15% for gold and silver for the transition ore.
| | |
| November 2012 | Shahuindo Project | 21 |
| |
|
MINE DEVELOPMENT ASSOCIATES |
Capital and operating costs used for this model as developed in Section 21 ofthis report.
IGV tax, the Peruvian value added tax, is recovered in the year it was incurredduring the production phase. IGV rebate during pre-production is delayed 90days.
The project economics based on these criteria from the cash flow model are summarized in Table 1-7.
| | |
| November 2012 | Shahuindo Project | 22 |
| |
|
MINE DEVELOPMENT ASSOCIATES |
| |
| Table 1-7 | Life-of-Mine Summary |
| |
| Financial Analysis | |
| Internal Rate of Return (IRR), Pre-Tax | 52.2% |
| Internal Rate of Return (IRR), After-Tax | 37.8% |
| Average Annual Cash Flow (Pre-Tax)1 | $ 70.1 M |
| NPV @ 5% (Pre-Tax) | $ 382.9 M |
| Average Annual Cash Flow (After-tax)1,2 | $ 52.1 M |
| NPV @ 5% (After-Tax) | $ 248.6 M |
| Gold Price Assumption (US$/Ounce) | $1,415 |
| Silver Price Assumption (US$/Ounce) | $27 |
| Pay Back Period (Years based on After-tax) | 2.2 Years |
| Capital Costs (Excluding IGV Tax) | |
| Initial Capital | $ 131.8 M |
| Working Capital and Initial Fills | $ 8.5 M |
| Sustaining Capital (life of mine)3 | $ 47.8 M |
| Operating Costs (Average Life of Mine) | |
| Mining | $ 5.66/Tonne |
| Processing & Support | $ 4.51/Tonne |
| G&A | $ 1.77/Tonne |
| Total Operating Cost/Tonne Ore4 | $ 11.94/Tonne |
| Cash Operating Costs (per ounce of gold)5 | $ 552/Ounce |
| Production Data | |
| Life of Mine | 10.4 Years |
| Mine Throughput (Ore) | 3.65 M TPY / 10,000 TPD |
| Metallurgical Recovery Au (Avg) | 85.8% |
| Average Annual Gold Production | 84,500 Ounces |
| Metallurgical Recovery Ag (Avg) | 15% |
| Average Annual Silver Production | 167,200 Ounces |
| Total Gold Produced (AuEq) | 909,500 Ounces |
| Average LOM Strip Ratio (waste:ore) | 1.91:1 |
| | |
| Notes: | 1) | Average annual cash flow is defined as the total cash flow generated over the 10.4 years of production divided by 10.4 |
| 2) | After-tax values calculated using the new royalty and tax regime implemented by the Peruvian Government in October 2011 |
| 3) | Reclamation, closure, and salvage value are not included in sustaining capital. |
| 4) | Does not include Au/Ag refining charges or Peruvian government royalty and 8% workers profit sharing |
| 5) | Silver sales have been treated as an operating cost byproduct credit for the Cash Operating Costs per ounce gold calculation |
| | |
| November 2012 | Shahuindo Project | 23 |
| |
|
MINE DEVELOPMENT ASSOCIATES |
A sensitivity analysis was performed on the project economics. Figures 1-1 through 1-3 are charts showing the relative sensitivity to a number of parameters. The economics are most sensitive to changing gold price and recovery.
| |
| Figure 1-1 | After-Tax IRR vs. Gold Price, Capital Cost, and Operating Cash Cost |

| | |
| November 2012 | Shahuindo Project | 24 |
| |
|
MINE DEVELOPMENT ASSOCIATES |
Figure 1-2 NPV @ 0% vs. Gold Price, Capital Cost, and Operating Cash Cost

| |
| Figure 1-3 | NPV @ 5% vs. Gold Price, Capital Cost, and Operating Cash Cost |
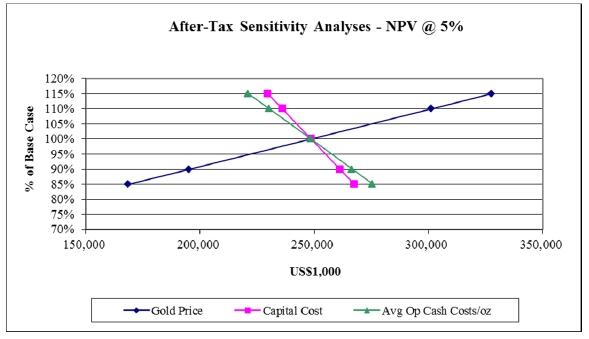
| | |
| November 2012 | Shahuindo Project | 25 |
| |
|
MINE DEVELOPMENT ASSOCIATES |
There are no adjacent properties.
| |
| 1.24 | Other Relevant Data and Information |
Other relevant data for the feasibility study includes pit slope stability analyses, heap leach facility geotechnical evaluations, hydrology, pit dewatering, project development and project opportunities and risks.
| |
| 1.24.1 | Geotechnical Issues |
| |
| 1.24.1.1 | Pit Slope Stability Analyses |
Golder Associates completed a pit slope stability analyses. Pit slopes are expected to be controlled by a combination of low rock mass strength and structural control. Several sectors of the pit will be developed in weak rock or soil, and will be limited by the low shear strength of the solid units. Pit slopes in other sections will be comprised of a larger proportion of competent rock than slopes in the other areas, and will be subject to structural control, and also possibly to limitations by low rock mass strength, depending on the distribution of the soil units in the slopes.
The analyses resulted in factors of safety of 1.2 or greater. Slope stability will be sensitive to the presence of groundwater pressures and effective depressurizing of slopes will be required throughout the project life.
| |
| 1.24.1.2 | Heap Leach Facilities Stability Analyses |
Ausenco conducted stability analyses of various structures including the process facilities, heap leach pad, waste rock dump, water storage ponds and process solution storage ponds. All facilities as designed met Ausenco’s criteria including factors of safety, seismology and ground conditions.
The arrangement of the Project facilities will restrict the availability of the water resources designated for different uses by the local populations (for livestock or population), given the decrease in the average flows availability. The Project facilities are primarily located in the Shahuindo, Higuerón and El Pacae sub-basins, in which agricultural and domestic purposes are the main uses of water.
| | |
| November 2012 | Shahuindo Project | 26 |
| |
|
MINE DEVELOPMENT ASSOCIATES |
The preliminary evaluation of the total annual replacement flows indicated that 42,416 m3is required for domestic supply; 101,216 m3for agricultural supply and 86,674 m3for environmental flows. The total annual replacement volume is preliminarily estimated at 230,306 m3annually.
Ausenco has conducted water quality monitoring on the water sources in the Shahuindo Project area during 2009, 2010, 2011 and 2012. The presence of informal mining has been identified in the area of study, localized around the mineralized area, in addition to the environmental liabilities corresponding to previous mining activities carried out by Compañía Minera Algamarca. The latter is located mainly along the Cañaris River to the west of the Project.
The surface waters are characterized by high turbidity levels and pH levels which vary between circumneutral to alkaline. Likewise, in the case of water designated for domestic use, these are characterized by low to null total suspended solids (TSS) values and pH levels that vary between circumneutral to alkaline. The underground water presents pH levels that vary from acidic to alkaline. In all cases, electrical conductivity is proportional to the quantity of dissolved solids. The conductivity and hardness, increases as the TDS increases, for surface water and water designated for human consumption.
Elevated concentrations of total and dissolved metals were found in the sampled water. Some of these waters currently do not comply with the water quality standards corresponding to the ECA categories: 1-A1 (domestic use), 3 (irrigation and drinking water for animals), and 4 (preservation of aquatic life in lagoons and rivers).
The high presence of metals in some surface water monitoring points and in riverbed sediments can be explained by the presence of tailings, waste, and the upstream pithead from informal upstream mining.
| |
| 1.24.3 | Mine Pit Dewatering |
To facilitate dewatering of the mine pit and maintain slope stability along the western pit wall, Ausenco performed analytical calculations and mine pit dewatering simulations to determine the approximate number of groundwater interceptor wells, dewatering wells and horizontal drains to depress the groundwater phreatic surface to depths that met the slope stability criteria provided by Golder Associates as outlined in Ausenco’sMine Pit Dewatering Plan(Memorandum, 21 September 2012, Email).
| | |
| November 2012 | Shahuindo Project | 27 |
| |
|
MINE DEVELOPMENT ASSOCIATES |
Due to the limitations of available data, the actual number of interceptor wells, dewatering wells and horizontal drains will most likely deviate from the plan based on field conditions. Monitoring of the hydraulic heads in the pit area, both from VWPs and existing stand-pipe piezometers, plus recorded flow rates from horizontal drains will be key parameters that will actually determine successive well and drain locations during the course of mining. Based on these issues, Ausenco suggested the dewatering plan as presented in Section 16.6 could be optimized.
Additional optimization is ongoing, but was not complete as of the date of this Report. Therefore, the number of wells and horizontal drains may vary from the initial optimization.
| |
| 1.24.4 | Project Development Schedule |
Project development is expected to require 24 months for engineering and construction. The design phase is currently scheduled to start early in January 2013. A majority of the construction is scheduled to start after approval of the EIA and permit approvals, which is currently estimated to happen at the beginning of September 2013. The target date for completion of construction and first gold pour is December 2014.
To meet the schedule, major earthworks must begin in September 2013 and construction equipment and crews must be onsite and support tasks such as internal site roads must be started in late August. The EIA documents and other long term permit applications must be submitted in the fourth quarter of 2012 to meet the September issuance of permits. Final design of long lead time items must be completed early on in the design phase.
An important aspect of the project schedule is ordering the major equipment items with long lead times during February to April 2013 and initiating field construction work by late August 2013. The present schedule would have mobilization on-site completed in August with start of crushing by late September 2014. The completion of the upper fresh water storage pond prior to the start of the wet season of 2013 / 2014 is critical to the schedule as this pond will provide water for construction activities and operations.
The schedule has been developed based on the assumption that all permits have been issued or will be issued and that no delays will occur due to local permitting or social issues.
| | |
| November 2012 | Shahuindo Project | 28 |
| |
|
MINE DEVELOPMENT ASSOCIATES |
| |
| 1.24.5 | Opportunities and Risks |
There are potential opportunities and risks that have been identified in various areas of the project. These opportunities and risks pertain to production and resource expansion, access to power, mine operations, processing, water management, social and political issues and land acquisition.
Major potential opportunities include:
Production Expansion – the production schedule reflects Sulliden’s preference topresent a financially disciplined capital cost project. The mineral resource hasthe ability to support a much larger operation.
Mineral Resource Growth and Mineral Resource Conversion - three mainexploration targets have currently been identified on the Shahuindo concession,which together present opportunities for short and medium term mineral resourcegrowth. There is also an opportunity to address insufficiently drilled Inferredmineral resources on the property and convert them to Measured or Indicatedcategories.
Access to Electrical Power - a main North-South running national high-tensionelectric transmission line was installed within the east side of the Shahuindoproperty. The Company is planning to construct a multi-bay electrical switchyardthat will have the capacity of providing additional power for expanded oxidemining scenarios as well as the potential future exploitation of sulphidemineralization. The switchyard and electrical infrastructure for the ShahuindoProject will also benefit the local people and the state. The new multi-bayswitchyard will provide the local power company, Hidrandina, the possibility of anew connection point to improve the quality of power to the towns of Cajabambaand Huamachuco among others, as well as other operating mines and futuremining operations. Should other users require access to electrical power,Sulliden will be reimbursed on a proportional basis for its capital cost investment.
Pit Geotechnical - Pit slope angles have been estimated based on relatively highfragmented ore material. During detailed design and actual mining, these slopesdesign parameters may be steepended; thus reducing the strip ratio and wastematerial generation.
Mining Costs – Mine cost esimates assume reduced blasting requirements insome of the softer more fragmented soil like material. This may be furtherreduced based on operational experience during mining.
| | |
| November 2012 | Shahuindo Project | 29 |
| |
|
MINE DEVELOPMENT ASSOCIATES |
Water Management - optimizing leach pad management, including stagedreclamation, may eliminate or minimize the need for late project phase waterevaporation thereby reducing future capital and operating costs.
Potential areas of risk include:
Production Expansion - the funding of the expanded mining scenario by internallygenerated cash flow assumes a gold commodity price of $1,415 per ounce.
Metal prices fluctuate and if they significantly declined it could negatively impactthe internal cash flow generated by the Project and the Company’s ability to self-fund a future expansion.
Mineral Resource Growth and Mineral Resource Conversion - the threeproposed mineral targets require additional drilling and the Company’sexpectations may not coincide with actual results. An area to the northeast of themain mineralized corridor containing Inferred material would require thewithdrawal of a small number of informal miners in order for the Company to drilland upgrade the mineral resource category.
Pit Geotechnical and Mine Planning – The geotechnical slope parametersassume that pit walls can be effectively depressurized. Depressurization isassumed to be accomplished using vertical dewatering wells and horizontaldrains. Should the depressuization efforts not be successful, then it wouldrequire either additional depressurization efforts or further flattening of pit slopes.
The additional depressurization would require additional operational and capitalcosts. Further flattening of slopes could increase the strip ratio and or reduce theavailable reserves for mining.
Water Management - excess water in the project’s later years of operation, mayexceed the capacity of the evaporation system requiring additional expense formore evaporators, an increase in water treatment or additional diversionstructures. The formation of a pit lake could add to the closure costs, dependingon timing of the pit to fill and pit lake water quality.
Social Opposition - some mines in the area have been and continue to be subjectto adverse social-political situations. Resistance towards mining activities by thelocal population could delay or impede the development and operation of theShahuindo Project.
Land Acquisition & Resettlement - although land purchase and relocationstrategies are in place, a delay or failure in obtaining all surface rights couldimpede or prevent the development of the project.
| | |
| November 2012 | Shahuindo Project | 30 |
| |
|
MINE DEVELOPMENT ASSOCIATES |
Political Situation - in July 2011, Ollanta Humala was elected as Peru’s newPresident for a five-year term. Although he openly supports the development ofmining projects and foreign investment, these projects have also created heatedsocial conflicts and the political climate has potential to affect both the projectdelivery and the outcome.
| |
| 1.25 | Interpretation and Conclusions |
The Shahuindo Project demonstrates technical and financial viability based on the evaluations, studies, and analyses conducted to-date. A significant Measured, Indicated and Inferred epithermal gold-silver resource and Proven and Probable Reserve have been outlined on the Shahuindo property.
MDA believes that the data provided by Sulliden, as well as the geological interpretations Sulliden has derived from the data, are generally an accurate and reasonable representation of the Shahuindo deposit. Total Measured and Indicated resources were estimated to be 147.3 million tonnes with gold and silver grades of 0.515 g/t and 7.1 g/t, respectively. The Proven and Probable reserves based on project economics and metal recoveries were estimated to be 37.85 million tonnes of ore at gold and silver grades of 0.84 g/t and 9.5 g/t, respectively. The reserve reflects Sulliden’s preference to present a financially disciplined capital cost project as the mineral resource has the ability to support a much larger operation.
The metallurgical testing results indicate that Shahuindo material is amenable to processing by heap leaching methods. Gold recoveries are high, and the rates of recoveries are fairly rapid for oxide material. Reagent requirements are low to moderate.
The capital expenditures required include $131.8 million for pre-preproduction, $8.5 million for working capital and initial fills and $47.8 million for sustaining capital. The operating cost is $11.94/t ore. The project produces 872,000 ounces of gold and 1,725,000 ounces of silver at a cash operating cost of $552 per gold ounce. The project has an after tax NPV @ 5% of $248.6 million. The after tax Internal Rate of Return is 37.8%.
Other primary findings of the Technical Report are:
| | |
| November 2012 | Shahuindo Project | 31 |
| |
|
MINE DEVELOPMENT ASSOCIATES |
No allowance is included for inflation or escalation or other changes as a result ofchanging economic conditions in Peru.
The project has opportunities to extend mine life and improve operating costs.
The project has potential risks including social issues, water management, pitdewatering, pit lake formation and political uncertainty.
The project is economically robust. The project’s economics are more sensitiveto gold prices/gold recovery variations than to changes in capital and operatingcosts.
The work that has been completed to date has demonstrated that Shahuindo is a project of merit and justifies additional work as described in this Section.
A significant Measured, Indicated and Inferred epithermal gold-silver resource has been outlined on the Shahuindo property. The potential open-pit, heap-leach oxide resource can be expanded along both width and strike, while the current Inferred-only sulfide resource is open at depth and along strike. Both targets warrant additional drilling. Sulliden has also identified highly prospective exploration targets on the Shahuindo property that need to be drill tested. On the North Corridor target, follow-up drilling on various mineralized drilled intercepts needs to be conducted. Additional expenditures are clearly warranted to further explore the potential associated with the Shahuindo deposit.
The recommended drill program to be completed in 2013 is an additional 35,000 meters of drilling that should focus on the following objectives:
The expansion of existing oxide resources by drilling both width and strikeextensions and sub-parallel corridors immediately to the north and south of theCentral Corridor hosting the resource in Shahuindo;
Deep drilling to expand the sulfide resource;
Grade-assessment drilling (twin program); and
Exploration drilling of the North Corridor and other additional targets elsewhereon the property.
| | |
| November 2012 | Shahuindo Project | 32 |
| |
|
MINE DEVELOPMENT ASSOCIATES |
Additional geophysics, primarily IP, and surface geochemical sampling are recommended to assist in the delineation of drill targets within the North Corridor and also along the northwest extension of the resource within the Central Corridor.
Ausenco recommends the installation of a meteorological and hydrological monitoring network in the Project area during the operational period. This network will allow for controlling assumptions made in the study, and shall provide a solid basis for future hydrological reevaluations (with emphasis on water balance predictions for operation and closure, the commitments to flow replacement and other aspects that must be established in the closure plan).
Detailed engineering should be started and design and costing of long lead time items finalized to meet the project development schedule. Detailed evaluations of the handing pit lake formation and possible treatment should begin early on in the engineering phase.
The costs of the recommendations are presented in Section 26.0.
| | |
| November 2012 | Shahuindo Project | 33 |
| |
|
MINE DEVELOPMENT ASSOCIATES |
Kappes, Cassiday & Associates (KCA) and Mine Development Associates (MDA) have prepared this Technical Report on the Shahuindo Project, located in the province of Cajabamba, Peru, at the request of Sulliden Gold Corporation Ltd. (Sulliden), a Montreal-based company listed on the TSX Venture Exchange.
This Technical Report, the updated Resource estimate, the Reserve estimate and the project economics have been prepared in compliance with the disclosure and reporting requirements set forth in the Canadian Securities Administrators’ National Instrument 43-101, Companion Policy 43-101CP, and Form 43-101F1 (NI 43-101), as well as with the Canadian Institute of Mining, Metallurgy and Petroleum’s “CIM Definition Standards - For Mineral Resources and Reserves, Definitions and Guidelines” (CIM Standards) adopted by the CIM Council on December 2000 and modified in 2005 and 2010.
| |
| 2.1 | Project Scope and Terms of Reference |
The purpose of this report is to provide a technical summary of the feasibility study conducted on the Shahuindo Project, including project development, mineable Reserves and project economics prepared by KCA and MDA. The feasibility study is intended to provide the project economics and to give guidance for the implementation of the Shahuindo Gold project.
The scope of work for the feasibility study included the following major areas:
Review of Pertinent Data
Land Ownership, Property Description and Local Demographics
Geology, Exploration and Mineral Resources
Hydrology and Hydrogeology
Pit and Heap Leach Geotechnical Analyses
Mineral Reserves and Mining
Metallurgy and Process
Water Supply
Infrastructure
Waste Management
Environmental Issues, Permitting and Social and Community Impacts
| | |
| November 2012 | Shahuindo Project | 34 |
| |
|
MINE DEVELOPMENT ASSOCIATES |
The mineral Resources were discussed in detail in the Technical Report titled “Updated Technical Report on the Shahuindo Project, Cajabamba, Peru” dated 15 October 2012 by Mr. Paul Tietz and Mr. Carl Defilippi. Items 7 through 12 and 14 of this Report were taken from the 15 October Resource Report. No new information was added and they are included in this Report in their entirety.
The mineral Resources were estimated and classified under the supervision of Paul Tietz, Senior Geologist for MDA. The mineable Reserves, mine design and mine costs were produced by Thomas Dyer, Senior Mine Engineer for MDA. The process and infrastructure design and costing and project economics were supervised by Carl Defilippi, Project Manager for KCA. All three of these individuals are qualified persons under NI 43-101 and have no affiliations with Sulliden except that of independent consultant/client relationship. The mineral Resources and Reserves reported herein for the Shahuindo Project were estimated to the standards and requirements stipulated in NI 43-101.
This Technical Report was prepared under the supervision of Mr. Defilippi, Mr. Dyer and Mr. Tietz. Stéphane Amireault (Vice President of Exploration for Sulliden) contributed the geology and exploration information presented in Sections 7.0, Section 8.0, and Section 9.0. Joe Milbourne (Vice President of Technical Services for Sulliden) supplied information pertaining to land ownership, owner’s costs and permitting issues. Mr. Amireault and Mr. Milbourne are not independent of the issuer.
Pit geotechnical analyses were performed by Golder Associates of Reno, Nevada. Heap leach geotechnical analyses and hydrology and hydrogeology studies were conducted by Ausenco of Lima, Peru. References used for this report are listed in Section 27. KCA and MDA have relied on the data and information provided by Sulliden, Golder Associates and Ausenco for the completion of this report.
Mr. Defilippi, Mr. Tietz, Mr. Dyer, and Peter Ronning (P.Eng., MDA associate) visited the Shahuindo Project on May 4 through 7, 2010. Mr. Defilippi also visited the property on April 6 through 8, 2010. Mr. Tietz conducted two further site visits on September 14 through 18, 2011 and March 8 through 11, 2012. The purpose of the visits was to review the project geology, conduct various aspects of data verification, conduct a tour
| | |
| November 2012 | Shahuindo Project | 35 |
| |
|
MINE DEVELOPMENT ASSOCIATES |
of the property and existing facilities, gather information in support of the feasibility study and provide recommendations concerning drill planning and data compilation for the 2011 and 2012 resource models.
The Effective Date of this Technical Report is 26 September 2012. The effective date of the resource information is 17 May 2012.
| |
| 2.2 | Units and Abbreviations |
All costs are in United States dollars. Units of measurement are metric. Only common and standard abbreviations were used wherever possible. A list of abbreviations used is as follows:
| | |
| Distances: | mm | – millimeter |
| | cm | – centimeter |
| | m | – meter |
| | km | – kilometer |
| | m bgl | – meters below ground level |
| Areas: | m2or sqm | – square meter |
| | ha | – hectare |
| | km2 | – square kilometer |
| Weights: | oz | – troy ounces |
| | Koz | – 1,000 troy ounces |
| | g | – grams |
| | kg | – kilograms |
| | T or t | – tonne (1000 kg) |
| | Kt | – 1,000 tonnes |
| | Mt | – 1,000,000 tonnes |
| Time: | min | – minute |
| | h or hr | – hour |
| | op hr | – operating hour |
| | d | – day |
| | yr | – year |
| | Ma | – Mega-annum (one million years) |
| Volume/Flow: | m3or cu m | – cubic meter |
| | m3/h | – cubic meters per hour |
| | L/s | – liters per second |
| Assay/Grade: | g/t | – grams per tonne |
| | g Au/t | – grams gold per tonne |
| | |
| November 2012 | Shahuindo Project | 36 |
| |
|
MINE DEVELOPMENT ASSOCIATES |
| | |
| | g Ag/t | – grams silver per tonne |
| | g Cu/t | – grams copper per tonne |
| | ppm | – parts per million; |
| | ppb | – parts per billion |
| Other: | TPD or tpd | – metric tonnes per day |
| | m3/h/m2 | – cubic meters per hour per square meter |
| | L/s/km2 | – liters per second per square kilometers |
| | g/L | – grams per liter |
| | Ag | – silver |
| | Au | – gold |
| | Hg | – mercury |
| | US$ or $ | – United States dollar |
| | NaCN | – sodium cyanide |
| | TSS | – total suspended solids |
| | TDS | – total dissolved solids |
| | DDH | – diamond drill boreholes |
| | |
| November 2012 | Shahuindo Project | 37 |
| |
|
MINE DEVELOPMENT ASSOCIATES |
| |
| 3.0 | RELIANCE ON OTHER EXPERTS |
The authors of this report, state that the information, opinions, estimates, and conclusions contained herein are based on:
Information available at the time of preparing this report
Assumptions, conditions, and qualifications as set forth in this report
Data, reports, and other information supplied by Sulliden and other third partysources
The authors are not experts in legal matters, such as the assessment of the legal validity of mining concessions, private lands, mineral rights, and property agreements in Peru. The authors did not conduct any investigations of the environmental or social-economic issues associated with the Shahuindo Project, and the authors are not experts with respect to these issues.
The authors rely on information provided by Sulliden as to the title of the property comprising the Shahuindo Project, the terms of property agreements, and the existence of applicable royalty obligations, as well as all information concerning environmental issues and permitting. KCA and MDA have also relied on Sulliden to provide full information concerning the legal status of Sulliden Gold Corporation Ltd. and related companies, as well as current legal title, material terms of all agreements, and material environmental and permitting information that pertain to the Shahuindo property.
Besides the above provided by Sulliden, the authors of this report have also relied on the following in preparation of this report:
Geotechnical Analyses by Ausenco:
“Estudio Geotécnico de la Planta de Procesos, Área de Chancado, Presa de Agua y Poza de Excesos de Solución”,October 2012
“Análisis de Estabilidad de Taludes del Pad de Lixiviación – Proyecto Shahuindo”,Technical Memorandum 14, 8 November 2012
| | |
| November 2012 | Shahuindo Project | 38 |
| |
|
MINE DEVELOPMENT ASSOCIATES |
Hydrology by Ausenco:
“Feasibility Study, Hydrogeology Report”, October 2012“Shahuindo Geochemical Pit Lake Model Report”,26 October 2012
| | |
| November 2012 | Shahuindo Project | 39 |
| |
|
MINE DEVELOPMENT ASSOCIATES |
| |
| 4.0 | PROPERTY DESCRIPTION AND LOCATION |
The Shahuindo Project is located in the district of Cachachi, province of Cajabamba, department and region of Cajamarca, Peru. It is situated approximately 80 kilometers southeast of the town of Cajamarca and 15 kilometers west of the town of Cajabamba. The project is located at latitude 7 degrees 25 minutes south, longitude 78 degrees 25 minutes west (Universal Transverse Mercator (UTM) coordinates 9,158,000-North and 807,000-East, Zone 17S, datum PSAD56). The location of the project site is presented in Figure 4-1.
The initial tenements were obtained by Compañia Minera Algamarca S.A. (Algamarca) during the 1980s. In 1996, Asarco LLC (Asarco) leased the project from Algamarca and in 1998 transferred the project to its Peruvian subsidiary, Southern Peru Copper Corp. (Southern Peru). Southern Peru ceased work on the project following the merger of Asarco, the parent company, with Grupo Mexico SAB, and the project reverted to Algamarca in 2000.
Sulliden entered into a Transfer of Mineral Rights and Properties Contract, named “Contracto de Transferencia de Propiedades Mineras” (the Definitive Agreement), with Compañia Minera Algamarca S.A. and Exploraciones Algamarca S.A covering 26 mineral claims and 41 surface rights, which was formalized by public deed dated November 11, 2002. Sulliden agreed to pay a total of US$4,130,000 in escalating installments every six months over a two-year period, which terminated in November 2004. Each payment was subject to an interest rate of five percent per year. Under the agreement, no royalties or other payments were required or provided to any other parties.
Subsequently the Vendors (Compañia Minera Algamarca SA and Exploraciones Algamarca SA), controlled by new stockholders and other companies of the same group, challenged the Definitive Agreement and launched a number of judicial proceedings against Sulliden Shahuindo. Sulliden Shahuindo also commenced legal proceedings to carry out the Definitive Agreement and a number of other judicial proceedings to protect its title to the Shahuindo property. During this period of time, the Vendors transferred 13 of the mineral rights: eight to Minera Pilacones S.A. and the other five to Inversiones Mineras Sudamericanas S.A.; the third parties also transferred and mortgaged the
| | |
| November 2012 | Shahuindo Project | 40 |
| |
|
MINE DEVELOPMENT ASSOCIATES |
mineral rights to other Panamanian companies. The Vendors also transferred most of the 41 surface rights to Alta Tecnología e Inversión Minera y Metalúrgica S.A. (Atimmsa) by 30 public deeds dated November 2003. Sulliden Shahuindo challenged all these judiciary proceedings.
An Arbitration Award was rendered in Peru on July 19, 2006 by the Sulliden-Algamarca Arbitration Board. The settlement was confirmed and formalized by public deed on February 27, 2009 in Peru and approved on March 27, 2009 by the Judge of the 29thCircuit of Lima and the arbitration tribunal. The Arbitration Award was then declaredres adjudictaby the Sulliden-Algamarca Arbitration Board on July 30, 2009. A second settlement agreement was signed in Panama with all the Panamanian companies on February 27, 2009. The agreements have been fully executed, with no remaining obligations between the parties. As a result of the Award and Agreement, all challenges against Sulliden in relation to the project ceased, and Sulliden has been confirmed to hold 100 percent of the project. The mining rights and surface rights are registered under the name of Sulliden in the government title registry office (SUNARP).
| | |
| November 2012 | Shahuindo Project | 41 |
| |
|
MINE DEVELOPMENT ASSOCIATES |
| |
| Figure 4-1 | Shahuindo Project Location Map |
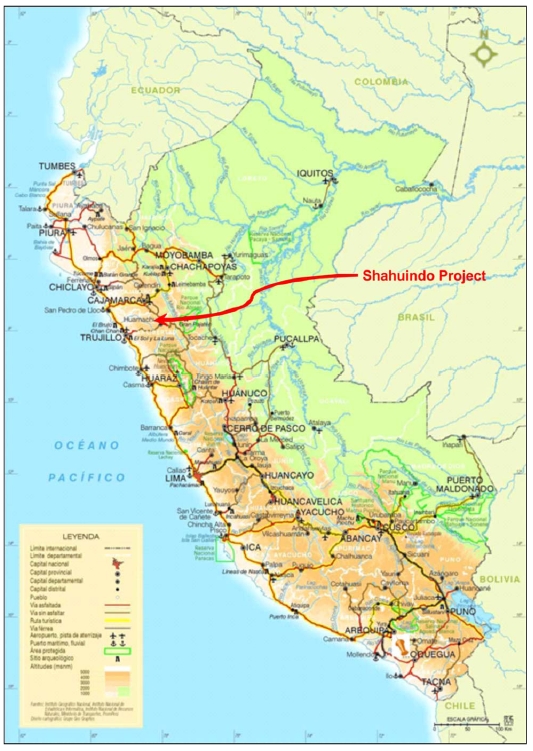
| | |
| November 2012 | Shahuindo Project | 42 |
| |
|
MINE DEVELOPMENT ASSOCIATES |
| |
| 4.3 | Agreements – Settlement of Shahuindo Litigation |
In February 2009, Sulliden reached agreements to settle all outstanding issues in the disputes and litigation surrounding the Shahuindo gold/silver property in Peru. The agreements secured Sulliden’s ownership of Shahuindo.
| |
| a) | Sulliden entered into a Settlement Agreement with Compañia Minera Algamarca S.A. and its subsidiary, Compañia de Exploraciones Algamarca S.A. (collectively Algamarca), under which Algamarca has agreed to ratify and confirm the 2002 Transfer Contract and to acknowledge the transfer of the Shahuindo mining concessions, surface lands, and mining assets to Sulliden effective as of the original date of the Transfer Contract. Algamarca agreed to withdraw and abandon all process and appeals and to abandon all legal proceedings that have been brought against Sulliden, its employees, officers, and directors, and to surrender and transfer to Sulliden the ownership and possession of the surface lands, mining concessions, and mining assets. Sulliden agreed to abandon all legal proceedings and appeals that have been brought against the Algamarca Group and to refrain from being a party to any other legal proceedings. |
| |
| b) | Sulliden also entered into a separate Settlement Agreement with Compañia Minera Andina S.A. and various other Panamanian companies, including Inversiones Mineras Sudamericana SA, Andean Mining Gold SA, and Import Export A.C.D.S.A, and their shareholders, whereby these companies have agreed to withdraw and abandon all claims and legal actions that these companies have made against Sulliden or the Shahuindo property, including the purported transfer of five concessions to Inversiones Mineras Sudamericana SA and eight concessions to Andean Mining Gold SA, the mortgage of US$50 million in favor of Import Export, and the mortgage of US$80 million in favor of Inversiones Mineras Sudamericana. In consideration of these companies withdrawing all claims and discontinuing all legal actions against Sulliden, its employees, officers, and directors, or relating to Shahuindo, Sulliden agreed to: |
| (1) | Make payments, in installments, to a total US$ 13.5 million, such installments to be made payable as follows: |
| | | |
| | February 27, 2009 | US $1,250,000 | |
| | May 27, 2009 | $ 250,000 | |
| | August 27, 2009 | $1,000,000 | |
| April 27, 2010 | $7,500,000 | |
| | |
| November 2012 | Shahuindo Project | 43 |
| |
|
MINE DEVELOPMENT ASSOCIATES |
| | | |
| May 27, 2010 | $1,000,000 | |
| August 27, 2010 | $1,000,000 | |
| November 27, 2010 | $1,000,000 | |
| February 27, 2011 | $500,000 | |
The Company made all of the required installment payments on their due dates and the US$ 13.5 million has been paid in-full.
The payment of US$ 7,500,000 made in fiscal 2010 was secured by a charge on the Shahuindo property, which was released providing the Company with 100% unencumbered ownership of Shahuindo.
| (2) | Issue 9,575,000 common shares of the Company at a deemed issue price of $0.50 per share. |
In 2009, as part of the settlement, the Company issued 9,575,000 common shares of the Company at a deemed value of $0.50 per share for a total deemed value of $4,787,500.
| (3) | Grant a royalty equal to 1.5 percent of Net Smelter Returns (the 1.5% NSR), payable upon production from the Shahuindo property, provided that the Company has the right for a period of three years to buy-back the 1.5% NSR at a price of US$ 10 million if exercised within one year, and at a price of US$ 10 million plus interest at LIBOR plus 5 percent, if such buy-back right is exercised between the thirteenth and thirty-sixth month; and further provided that if, during the first three years from date of Agreement, the Company sells Shahuindo, or the Board of Directors of Sulliden approves the transfer or issue of more than 52% of its shares, to a third party, the Company must buy back the 1.5% NSR. |
The 1.5% NSR Agreement provides that if Shahuindo does not start operations within a period of three years from the date of the Agreement an advance NSR royalty in the amount of US$ 500,000 per year becomes payable in installments of US$ 125,000 per quarter until the start of operations, with any such advance payments credited as advance payments on account of the NSR, subject to force majeure including a material drop in the price of gold or silver, social commotion, strikes, or any other event that could be qualified as an act of God.
| | |
| November 2012 | Shahuindo Project | 44 |
| |
|
MINE DEVELOPMENT ASSOCIATES |
Sulliden exercised the right to buy back the 1.5% NSR royalty on December 2011, for the price of US$ 11,027,024 that includes the US$ 10 million plus the interest.
| |
| c) | The Company also entered into an exploration option agreement with a related private Peruvian company which holds 13 mining concessions partly adjoining the Shahuindo property. During the option period, the Company may carry out exploration on the 13 mining concessions and has the option, for a period of three years, to purchase the properties for US$ 5,000,000, subject to a 3% net smelter return (NSR) royalty. |
The option agreement was extended on 1 March 2012 for three additional years. A payment of US$ 250,000 was made that will be discounted from the purchase price if Sulliden decide to exercise the option. A second payment will be made in 2013 if Sulliden decides to continue with the option. This new payment will also be discounted off the purchase price. The mining concessions of the option have been increased from 13 to 17 partly adjoining the Shahuindo property. During the option period, Sulliden may carry out exploration on the 17 mining concessions and has the option, for the period of three years, to purchase the properties for a purchase price of US$ 5,000,000, subject to a 3% NSR royalty.
No exploration has commenced to date on the ATIMMSA concessions. However, as they are contiguous and may contain strike extents of mineralization that is known to be hosted on Sulliden ground, the options have exploration potential to add to the mineralization delineated in the Shahuindo area.
Sulliden Shahuindo has accumulated the 26 mineral rights into one new right named ACUMULACION SHAHUINDO. The title of ACUMULACION SHAHUINDO has been granted by the competent governmental agency on 12 March 2012 and is registered in Peruvian Public Registry (Registro Público de Minería).
The project comprises one mineral right: ACUMULACION SHAHUINDO, including 26 mineral titles1100% controlled by Sulliden, which has an approximate area of 7,338.91 hectares. Table 4-1 summarizes Sulliden’s mineral claims that are included in the new
_________________________________
1In accordance with Supreme Decree 014-92-EM, the Accumulation is a procedure approved by INGEMMET (a State-owned company focused on the exploration, development and management of properties and mining companies in Peru) where mineral concessions can be accumulated into one group only when these mineral concessions are adjacent to one another and owned by the same owner. The Accumulation which in this case is called "Acumulacion Shahuindo" is the newly created concession which includes the 26 original mining concessions.
| | |
| November 2012 | Shahuindo Project | 45 |
| |
|
MINE DEVELOPMENT ASSOCIATES |
mineral right named ACUMULACION SHAHUINDO. The mineral claims and the ATIMMSA concessions are shown on Figure 4-2. The deposit in relation to Sulliden’s 26 mineral claims is shown in Figure 4-3.
| |
| Table 4-1 | Mineral Title Summary |
| | | | |
| Name | Application Area
(hectares) | Actual Size
(hectares) | Application
Method | Date of Grant |
| San Jose | 2.83 | 2.83 | Stake-based | July 2, 1917 |
| Puma Shahuindo | 2.33 | 2.33 | Stake-based | July 5, 1917 |
| Pilacones 8 | 601.59 | 58.66 | Grid-based | January 29, 1998 |
| Pilacones 7 | 300.80 | 3.45 | Grid-based | November 18, 1996 |
| Pilacones 6 | 1002.62 | 401.38 | Grid-based | ApriI 9, 1999 |
| Pilacones 5 | 701.82 | 492.35 | Grid-based | April 21, 2003 |
| Pilacones 4 | 100.26 | 20.93 | Grid-based | April 1, 1996 |
| Pilacones 3 | 902.36 | 571.15 | Grid-based | August 31, 1997 |
| Pilacones 2 | 701.85 | 246.85 | Grid-based | December 30, 1997 |
| Perdida 3 | 601.96 | 548.65 | Stake-based | November 30, 1994 |
| Perdida 2 | 391.11 | 357.92 | Stake-based | August 24, 1995 |
| Perdida 1 | 601.72 | 570.00 | Stake-based | November 30, 1994 |
| Nltrogeno | 2.00 | 2.00 | Stake-based | August 7, 1922 |
| Moyan 3 | 280.78 | 280.78 | Stake-based | November 30, 1994 |
| Moyan 2 | 201.36 | 201.36 | Stake-based | November 30, 1994 |
| Moyan 1 | 541.48 | 541.48 | Stake-based | February 16, 1995 |
| Malvas | 250.68 | 250.68 | Stake-based | September 26, 1959 |
| Malvas 92 | 701.904 | 295.07 | Stake-based | August 6, 1999 |
| Descubridora | 4.25 | 4.25 | Stake-based | June 19, 1917 |
| Antimonlo | 2.00 | 2.00 | Stake-based | June 2, 1921 |
| Algamarca 4 | 993.17 | 980.00 | Stake-based | March 8, 1991 |
| Algamarca 2B | 20.33 | 20.34 | Stake-based | February 16, 1995 |
| Algamarca 2 | 200.56 | 200.56 | Stake-based | October 31, 1994 |
| Algamarca 1 | 501.35 | 501.35 | Stake-based | April 23, 1991 |
| Accumulaclon | 802.15 | 797.90 | Stake-based | March 31, 1987 |
| Algamarca Selenlo | 4.01 | 4.01 | Stake-based | August 22, 1981 |
| | |
| November 2012 | Shahuindo Project | 46 |
| |
|
MINE DEVELOPMENT ASSOCIATES |
| |
| Figure 4-2 | Mineral Claim Location Map |
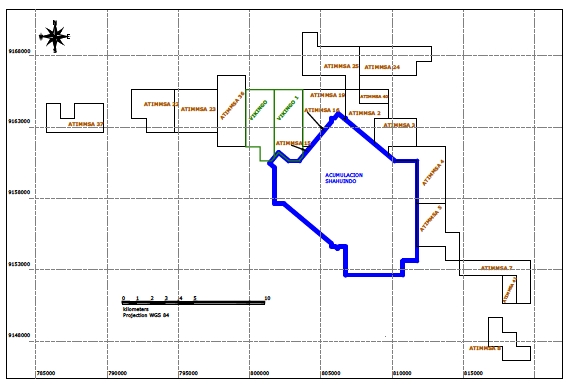
| | |
| November 2012 | Shahuindo Project | 47 |
| |
|
MINE DEVELOPMENT ASSOCIATES |
| |
| Figure 4-3 | Mineral Claim Location Map Detail Showing Deposit Area |

Sulliden’s title to the mineral claims and their accumulation is registered in the Peruvian Public Registry (Registro Público de Minería), and the registration prevails over any transfer or other act made by Algamarca or any third party that was registered later than November 11, 2002.
| | |
| November 2012 | Shahuindo Project | 48 |
| |
|
MINE DEVELOPMENT ASSOCIATES |
The mining claims have no expiry date. All concessions are subject to an annual payment of $3 per hectare to the Peruvian government. All claims were in good standing as of the effective date of this report.
Sulliden has acquired 204 surface rights within the Shahuindo Project area to date, covering a total area of about 1,675.1039 hectares. Sulliden has registered its title to 144 surface land rights in the Peruvian Public Registry of Cajamarca, and the registration of the remaining 60 is pending.
Sulliden has been acquiring additional surface rights to accommodate the project infrastructure as envisioned in future studies. These rights are held by a combination of governmental departments and private individuals. Sulliden expects that any land acquisition plan would be developed in consultation with local communities, so as to consider the aspirations, interests, and concerns of local stakeholders.
While consultation with existing surface rights holders and acquisition of additional surface rights may take time, it a reasonable expectation that the additional surface rights required to support the project can be acquired.
| |
| 4.6 | Informal Mining Activity |
There are informal mining activities within the project area, primarily in the Algamarca anticline and La Chilca hill areas. The far west end of the current resource area lies beneath La Chilca hill; the presence of the informal mining activity on the current resource is discussed in Section 14.0.
The majority of the informal miners come from local communities and live in shanty-style accommodation on the workings. Sulliden has filed both administrative and court processes against the informal mining activity. Regarding the administrative process, the Regional Mining Office of Cajamarca (DREM) issued two resolutions protecting Sulliden’s mining properties and requesting the police to stop all the illegal activities of informal miners in the area. Concerning the court process, the environmental prosecutor of Cajabamba opened a criminal process against the illegal miners, as well as requesting an injunction to the court to stop all the illegal activities in the area. The expectation is that the illegal miners will retire peacefully as a consequence of a decrease in their activities; but if necessary, the resolutions can be enforced.
| | |
| November 2012 | Shahuindo Project | 49 |
| |
|
MINE DEVELOPMENT ASSOCIATES |
Sulliden is one of the few companies in Peru trying to formally stop illegal mining activities. The local government does not support illegal mining activities. Since the company took control of the project, after the settlement with Algamarca, no new areas of illegal miners have appeared. The company is strengthening its community relations and social sustainability programs, which are considered an important stage in the mine development, as important as the technical development.
In early 2012, the Peruvian government approved five legislative decrees that oppose illegal mining activities and implemented steps to formalize them. The regional government of Cajamarca and the office of the director of DREM in Cajamarca are working on a social initiative for the informal miners to convert their illegal mining activities into other forms of legal work.
| |
| 4.7 | Environmental Considerations |
| |
| 4.7.1 | Environmental Regulations |
The General Mining Law of Peru is the primary body of law with regard to environmental regulation of exploration and mining activities. The General Mining Law is administered by the Ministry of Energy and Mines. A detailed description of Peru’s environmental regulations is found on the Ministry of Energy and Mines website. Generally, the Ministry of Energy and Mines requires exploration and mining companies to prepare an Environmental Impact Statement (DIA)– Category I, Environmental Impact Study Semi Detailed (EIAsd)–Category II (Table 4-2), an Environmental Impact Assessment, a Program for Environmental Management and Adjustment, and a mine closure plan. The category II EIAsd has been completed while the other documents are currently in progress. Mining companies are also subject to annual environmental audits of operations by the Organismo de Evaluación y Fiscalización Ambiental (OEFA).
According to Peruvian regulations (D.S. 020-2008-EM y la R.M. 167-2008-MEM-DM) a DIA–Category I cover drilling of less than 20 drill platforms within a 10 hectare area. An EIAsd–Category II is applicable to mining and exploration programs with either more than 20 drill platforms, exploration areas greater than 10 hectares, or construction of more than 50 meters of tunnels. Both classifications require development of public community involvement processes, which are administered under regulations D.S. 028-2008-EM and R.M. 304-2008-MEM-DM. Sulliden has applied for and received the proper permits for all exploration activities.
The Ministry of Energy and Mines typically gives automatic approval of DIA–Category I studies, and turnaround is of the order of 10 days. An EIAsd–Category II study typically
| | |
| November 2012 | Shahuindo Project | 50 |
| |
|
MINE DEVELOPMENT ASSOCIATES |
can take several months for approval, due to notification periods and public community participation processes.
A mining company that has completed its exploration stage work program must submit an Environmental Impact Assessment (EIA) or a modified Environmental Impact Assessment either when applying for a new mining or processing concession, increasing the size of existing processing operations by more than 50 percent; or executing any other changes to an existing mining project that results in a greater than 50 percent change in the mining rate or expected profit (DS 016-93-EM. Cap III, Art 20)
A new Environmental Impact Assessment must be developed when additional, previously un-mined areas are proposed to be added to an operation (DS 016-93-EM, D.S. 028-2008-EM and R.M. 304-2008-MEM-DM, review articles 15 and 16), and must include preparation of an executive summary and scheduling of workshops and public community participation.
The Environmental Impact Assessment must incorporate planned expenditure on environmental programs at a rate that is no less than one percent of the value of annual production of the planned operation. The Ministry of Energy and Mines must review and make a decision on the project within 120 days, including initial notification, and the initial stage of the public consultation process. The process of actual project approval may take 8–12 months. Within this period the applicant company must organize hearings and workshops to present project data and coordinate the dates and locations of such hearings with the Ministry of Energy and Mines.
| | |
| November 2012 | Shahuindo Project | 51 |
| |
|
MINE DEVELOPMENT ASSOCIATES |
| |
| Table 4-2 | Summary ofEnvironmentalRequirementsforMiningExploration Programs |
| | | | |
| Classification | Description | Application
Requirements | Application
Fees | Approval
Time |
| Category I –Environmental Impact Statement - DIA | Mineral exploration with less than 20 drill platforms within a 10 ha area | Required information as shown in Art. 5 of Environmental Regulations for Mining Exploration | 5% of Unit Tax
Unit is ~US $1,000
Tax = US $50 | 10 days |
| Category II –Environmental Impact Study Semi-Detailed – EIAsd | Mineral exploration with more than 20 drill platforms, exploration areas greater than 10 ha, and/or construction of more than 50 m of
tunnels | Prepare an Environmental Evaluation (EA) report as
per Appendix 2 of Environmental Regulations
for Mining Exploration | 40% of Unit Tax
Unit is ~US $1,000
Tax = US $400 | 30 days |
In the proposed project, if there is less than a 50 percent change in the mining rate or expected profit, the changes to the existing Environmental Impact Assessment may be accepted, subject to informational workshops and public hearings being held. The Ministry of Energy and Mines must review and make a decision on the existing project’s Environmental Impact Assessment within 30 days, including initial notification, and the initial stage of the public consultation process. The approvals process may take 6–8 months.
A mining company must also prepare and submit a closure plan (Plan de Cierre de Minas) for each component of its operation. The closure plan must outline what measures will be taken to protect the environment over the short-, medium- and long-term from solids, liquids and gases generated by the mining operation.
The General Mining Law of Peru has in place a system of sanctions or financial penalties that can be levied against a mining company which is not in compliance with the environmental regulations.
Exploration work conducted to-date has been performed under the relevant local and national permits.
| | |
| November 2012 | Shahuindo Project | 52 |
| |
|
MINE DEVELOPMENT ASSOCIATES |
Additional permits will be required for Project development. Key permits identified that could impact either development or construction timetables include:
Certificate for the Inexistence of Archaeological Remains (CIRA).During 2003 and 2007, archaeological surveys were conducted in the Project area to support granting of the appropriate environmental permits for exploration programs. The surveys indicated the presence of sites of potential archaeological significance.As part of Project development, Sulliden is undertaking an Archaeological Evaluation (PEA in the Spanish acronym). The Archaeological Evaluation results would determine whether a “Certificate for the Inexistence of Archaeological Remains” can be granted. Having “Certificate for the Inexistence of Archaeological Remains” clearance is currently an informal pre-requisite for Ministry of Energy and Mining to evaluate environmental assessment studies.
Environmental Impact Assessment (EIA).See Section 4.7.1.
Mine Closure Plan. The mine closure plan must be presented before the General Directorate of Mining Environmental Affairs (DGAAM) within the year following the approval of the Environmental Impact Assessment, and, as stated above, it must be approved before starting operations for the project.
Establishment of a financial guarantee for closure. A company is required to pay the first annual installment of the execution guarantee of the Mining Closure Plan, which will be defined with the approval of the Environmental Impact Assessment, in the period after Environmental Impact Assessment approval and up to the first twelve working days of the year following approval.
Beneficiation Concession. Such a permit is required prior to commencement of extraction, metallurgical processing or refining activities, and is dependent on an approved Environmental Impact Assessment.
Mining Transportation Concession. This permit is required for construction of items such as overland conveyors or pipelines. It is also dependent on the applicant having an approved Environmental Impact Assessment.
Permanent Power Concession. Following the approval from COES (Comité de Operación Económica del Sistema Interconectado Nacional), the completion of the required environmental and social studies and construction approval, the power concession will be granted to operate the line and substation.
Water usage permits.These will be required, principally for potable water consumption.
Easements and rights-of-way.Easements to accommodate subsidiary power lines to the Project will be required. Sulliden may also have to apply for approval to have Project roads cross local, regional or national roads; the final location of many of the internal Project roads has yet to be determined.
| | |
| November 2012 | Shahuindo Project | 53 |
| |
|
MINE DEVELOPMENT ASSOCIATES |
District and Provincial municipality licenses.The number and type of provincial and municipality permits to support Project development and construction would be identified and reviewed during any feasibility-level studies conducted on the Project.
Construction and Operation permits.These include required permits for mine operations, civil defense, fuel storage, reagent storage and use, powder magazines, explosives handling and use, and waste disposal.
| |
| 4.7.3 | Existing Environmental Conditions |
There are surface disturbances associated with informal mining activity within the project area, primarily in the Algamarca anticline and La Chilca hill areas. The majority of the informal miners come from Huamachuco, Trujillo, and Cajamarca, and live in shanty-style accommodation on the workings. There is an expectation that environmental contamination will be associated with these sites.
The presence of informal miners in some numbers may also create a safety issue for both the miners and Shahuindo personnel.
With a perceived exhaustion of easily-mineable mineralization in the Algamarca anticline area, there may be a risk of the informal miners moving to exploit other areas of Sulliden’s concessions. An inventory of the existing environmental conditions was submitted as part of the EIAsd for the Category II exploration permit.
| | |
| November 2012 | Shahuindo Project | 54 |
| |
|
MINE DEVELOPMENT ASSOCIATES |
| |
5.0 | ACCESSIBILITY, CLIMATE, LOCAL RESOURCES, AND PHYSIOGRAPHY |
The Shahuindo Project is located in Northern Peru approximately 970 kilometers by road north-north west of Lima. The project site can be accessed from Lima by traveling north on Highway 1 (the Pan-American Highway) to Ciudad de Dios, then east on Highway 8 to Cajamarca. The site is approximately 115 km from Cajamarca via asphalt-paved highway (100 km on Highway 3N), and gravel and dirt roads. Travel time from Cajamarca is about 3½ hours by road, including approximately 2½ hours from Cajamarca via Highway 3N to Cruce Pomabomba, and an additional hour from the junction with Highway 3N to the project site on gravel and dirt roads. The route from Cruce Pomabomba requires upgrades to about 15 km of local gravel and dirt roads to accommodate construction and mine activities. An access route study was conducted that evaluated various alternatives, and the route from Cajamarca was selected.
The route from Cajamarca to site is shown in Figure 5-1 and Figure 5-2.
The port sites for project development support are the Port of Callao (Lima) and the Port of Paita in the north. The project site can be accessed from the Port of Callao by traveling north from Lima as described above. From the Port of Paita, the project site can be accessed by traveling south on Highway 1 to Ciudad de Dios, then to site via Cajamarca as indicated earlier. Ciudad de Dios is approximately 680 km north of Lima and about 350 km south from Paita. Cajamarca is roughly 180 km from Ciudad de Dios.
There are daily flights between Lima and Cajamarca and between Lima and Trujillo on Peruvian national airlines.
| | |
| November 2012 | Shahuindo Project | 55 |
| |
|
MINE DEVELOPMENT ASSOCIATES |
| |
| Figure 5-1 | Shahuindo Road Route from Cajamarca |
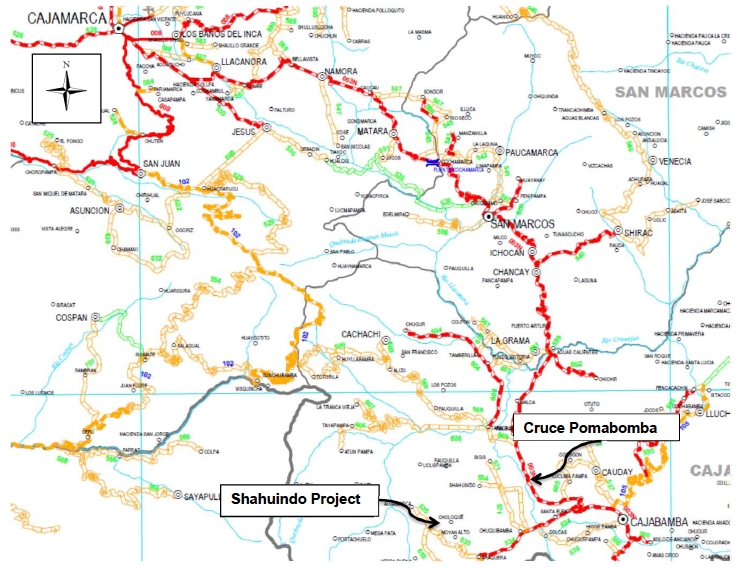
| | |
| November 2012 | Shahuindo Project | 56 |
| |
|
MINE DEVELOPMENT ASSOCIATES |
| |
| Figure 5-2 | Shahuindo Access Road Upgrade Cruce Pomabomba to Shahuindo Site |

| | |
| November 2012 | Shahuindo Project | 57 |
| |
|
MINE DEVELOPMENT ASSOCIATES |
Climate in the area is typical of the sierra region. It is cold and dry during the dry season and humid during the rainy season. Rains typically fall between October and April (wet season), but have been known to fall in the form of sporadic showers in the other months. The dry season months are May through September. The average annual rainfall is 999.7 mm with an extreme wet year having a rainfall of 1,550.0 mm and an extreme dry year receiving 449.0 mm.
The average daily temperature is 15.7ºC, reaching 23.1ºC during the day and decreasing to 7.5ºC in the night. The average minimum temperature is 9.7ºC and the average maximum temperature is 22.3ºC.
The prevailing wind direction is east by northeast with speeds ranging from 0 to 3.1 m/s.
Exploration and mining can be conducted year round with minimal impacts from the weather.
| |
| 5.3 | Local Resources & Infrastructure |
The Shahuindo Project is located in an economically depressed area, where subsistence agriculture is the main activity.
Manning requirements for the project will come from the local area and surrounding communities including Cajabamba whenever possible. More experienced and technical personnel will first be recruited from Cajamarca, then throughout Peru. No expatriates are currently included.
The main power supply to the site will be from the Peruvian Carhuamayo-Paragsha-Conococha Kiman Ayllu-Cajamarca Norte-Cerro Corona-Carhuaquero Trans-national 220 kV transmission line which was recently completed. This transmission line passes within 3 km of the site. It is currently planned to connect to this power line to supply line power to the project site. Diesel-fired generators will be utilized for emergency back–up to power critical pieces of equipment during power outages. The project will consume up to a maximum of approximately 29 million kWh of power per year. Maximum total attached power for the project is approximately 7 MW.
| | |
| November 2012 | Shahuindo Project | 58 |
| |
|
MINE DEVELOPMENT ASSOCIATES |
The Shahuindo heap leach project will require a water supply for mining, processing and other supporting activities (including outside users and compensation flows). Water demand will be highest during the dry season.
The make-up water required by the heap leach system during the dry season, particularly during abnormally dry years, will be met from three sources:
Solution previously stored in the storm water excess solution pond; and, afterthat is exhausted;
Pit dewatering drains and wells; then
Fresh water from two surface water collection reservoirs.
The Shahuindo property is located on the west side of the Condebamba River valley. The topography varies from rolling hillsides to steep ravines. Elevation across the project varies from 2,400 m above sea level to 3,600 m above sea level.
The project area is classified as neo-tropical Peruvian “Yungas” by the World Wildlife Fund, and includes sub-zones such as:
Very humid tropical mountain forest. May be present in isolated inaccessibleareas, but original vegetation has currently not been identified. The sub-zone ischaracterized by secondary successive-stage colonist species that havereplaced the original forest.
Humid tropical mountain forest. Covers 60 percent of the project area. Originalvegetation is remnant, and confined to ravines and steep hillsides. The majorityof the sub-zone has been cleared for cultivation of potatoes, oca, mashua, tarwi,barley, broad beans, and green beans, and for cattle grazing.
Low, dry, tropical mountain forest. Covers 40 percent of the project area, themajority of which falls within the lower part of the Shahuindo gorges, in the areanear the Condebamba River. The areas are typically cultivated using irrigation.
Crops include corn, potatoes, broad beans, wheat, green beans, vegetables andfruits.
Valley inhabitants anecdotally report the presence of deer, foxes, rabbits, vizcachas (rodents), and skunks. A more detailed faunal evaluation is currently being compiled.
| | |
| November 2012 | Shahuindo Project | 59 |
| |
|
MINE DEVELOPMENT ASSOCIATES |
Peru is an area with high seismic and tectonic activity with earthquakes being more intense near the coastal regions and decreasing gradually towards the mountains and jungle regions.
According to the seismic zoning map of Peru's National Building Regulations the Shahuindo Project is located in Zone 3 which corresponds to moderately high seismic activity. Ausenco is estimating a maximum expected acceleration of 0.32g for this particular zone, based on “Mapa de Isoaceleraciones” (Castillo y Alva 1993) when considering a 50 year useful life with a return period of 475 years and 10% of overage. The classification of the ground at the foundation level is of Type C according to the standards of the International Building Code (IBC, 2006).
For pseudo-static analysis of slopes Ausenco recommends to use as seismic coefficient±= 0.16, which is 50% more than the maximum expected acceleration in this particular zone. This value is consistent to that obtained in the “Estudio de Peligro Sísmico” developed by Ausenco (2009) for the project "La Arena" located in Huamachuco - La Libertad, located in the same region as the project area for Shahuindo. Additionally, it is recommended that the following design parameters presented in Table 5-1 are utilized for the seismic design of structures:
| |
| Table 5-1 | Summary of Parameters for Seismic Design |
| | | | |
| Structure | Zone 3
(Z) | Ground
Type | Tp* | Safety
Factor |
| Crushing Area | 0.4 | S2 | 0.6 | 1.2 |
Processing Plant,
Water Pond,
Excess Solution Pond | 0.4 | S1 | 0.4 | 1.0 |
*Seismic Amplification factor (C) is calculated as follows: |
|
| | |
| November 2012 | Shahuindo Project | 60 |
| |
|
MINE DEVELOPMENT ASSOCIATES |
The first mining activities on the Shahuindo Project were conducted by the Spanish after their conquest of the Inca Empire in the 1530s. These consisted of multiple small-scale adits of very limited length. Table 6-1 summarizes modern exploration activities on the Shahuindo property prior to Sulliden’s involvement.
| |
| Table 6-1 | Summary of Exploration Activities on the Shahuindo Property |
| | |
| (Modified from Wrightet al., 2010b) | |
| Period | Operator | Activities |
| 1945 – 1989 | Minera Algamarca SA | Exploration leading to the discovery and operation of an underground Cu-Ag-(Au) mine consisting of 5 adits at Algamarca. Some limited small-scale mining (Au) in the Shahuindo and San José communities. No public records of exploration activities. |
| Circa 1990 | Atimmsa | Geologic mapping, 11 reverse circulation and 6 diamond drill holes. Assays and drill logs available for the reverse circulation program. |
| 1994 – 1996 | Asarco LLC | Detailed and regional mapping, soil and rock geochemical sampling, 31 reverse circulation and 58 diamond drill holes, initial metallurgical testing. Drill exploration data available. |
| 1997 – 1998 | Southern Peru Copper Corporation | Limited surface sampling, 18 diamond drill holes, 80 reverse circulation holes, initial economic evaluation of the property. Drill exploration data available. |
Compañia Minera Algamarca S.A. and Exploraciones Algamarca S.A. (Algamarca) commenced exploitation of the Algamarca mine in the 1940s and continued mining and exploration work on the Shahuindo property until 1989. Algamarca’s exploration activities during the 1980s led to the discovery of mineralization and mining of the San José and Shahuindo mines. Most of the Cu-Ag-(Au) vein deposits exploited by Algamarca were on the southwestern limb of the Algamarca anticline (the Algamarca mine), but several small veins and breccia zones on the northeast limb of the Algamarca anticline were also explored and mined by Algamarca (the San José and Shahuindo small-scale Au mines).
From about 1990 to 1998, three companies explored the Shahuindo Project area – Alta Tecnología e Inversión Minera y Metalúrgica S.A. (Atimmsa), Asarco LLC (Asarco), and
| | |
| November 2012 | Shahuindo Project | 61 |
| |
|
MINE DEVELOPMENT ASSOCIATES |
Southern Peru Copper Corporation (Southern Peru). Atimmsa, Asarco, and Southern Peru completed geological mapping; soil, outcrop, and rock chip sampling; and RC and core drilling. Work by Asarco and Southern Peru led to identification of four major low-grade gold-silver zones at Shahuindo – San José, Porphyry, South Contact, and East Zone, which are now part of the resource area. Southern Peru stopped work on the property in 1998 when its parent company, Asarco, merged with Grupo Mejico (Saucier and Poulin, 2004), and the property reverted to Algamarca in 1999 (Wrightet al., 2010b).
Sulliden acquired the property and commenced exploration activity in 2002. Their work is described in Section 9.
| |
| 6.1 | Historic Mineral Resource Estimates |
Two historic resource estimates were prepared for the Shahuindo property by prior operators. Asarco completed an unclassified resource estimate for the property in 1996 before transferring the project to its Peruvian subsidiary, Southern Peru, at the end of 1996 (Saucier and Poulin, 2004). Asarco used a specific gravity value of 2.5 for their estimate and delineated auriferous zones by 0.3 g Au/t envelopes interpreted on sections. Southern Peru made an unclassified resource estimate in 1998 that included Atimmsa, Asarco data, and their own 98 drill holes and used the same parameters as Asarco (Saucier and Poulin, 2004). Both historic estimates are shown in Table 6-2. These estimates pre-dated NI 43-101 reporting requirements. A qualified person has not done sufficient work to classify these historic estimates as mineral resources, and Sulliden is not treating these historic estimates as current mineral resources. They are presented here in the interest of historic completeness and are superseded by MDA’s updated resource estimate described in Section 14 of this report.
| | |
| November 2012 | Shahuindo Project | 62 |
| |
|
MINE DEVELOPMENT ASSOCIATES |
| |
| Table 6-2 | Historic Mineral Resource Estimates for Shahuindo |
(From Saucier and Poulin, 2004; cutoff grade of 0.3 g Au/t)
| | | |
| Date | Company | Tonnage | Grade
g Au/t |
| 1996 | Asarco | 17,706,000 | 1.14 |
| 1998 | Southern Peru | 29,410,000 | 0.88 |
| |
| 6.2 | Previous Mineral Resource Estimates for Sulliden |
Mineral resources were estimated for Sulliden by Met-Chem in 2004 and 2005, updated by AMEC in 2009, and by MDA in 2011; all were presented in previous Technical Reports. These estimates are presented in the interest of historic completeness and are superseded by MDA’s latest updated resource estimate described in Section 14 of this report.
In 2004, Met-Chem estimated a resource for four mineralized zones of the Shahuindo Project based on Sulliden’s 2003 drilling program as well as data from Asarco and Southern Peru’s programs (Table 6-3) (Saucier and Poulin, 2004). This estimate used data from 223 drill holes spaced from 25 meters to 100 meters apart. A total of 67 geologic cross sections spaced 50 meters apart were used and grades were interpolated using various search ellipsoids. A three-dimensional block model was constructed, using 10 meters (north-south) by 10 meters (east-west) by 5 meters (elevation) blocks. Tonnage calculations were based on the following specific gravity values: San Jose (2.21), Porphyry (1.86), East Zone (2.38), and South Contact (2.40). Grade interpolation was performed using the inverse distance squared method.
| |
| Table 6-3 | 2004 Mineral Resource Estimate for Shahuindo by Met-Chem |
(From Saucier and Poulin, 2004; cutoff grade of 0.3 g Au/t)
| | | | | |
| Classification | Tonnage
tonnes | Gold
Grade
g Au/t | Silver
Grade
g Ag/t | Gold
Content
oz | Silver
Content
oz |
| Indicated | 25,817,075 | 1.07 | 23.97 | 890,240 | 19,898,241 |
| Inferred | 8,569,150 | 0.92 | 22.54 | 253,836 | 6,210,567 |
| Total | 34,386,225 | 1.03 | 23.61 | 1,144,076 | 26,108,808 |
Met-Chem updated their resource estimate in 2005, including Sulliden’s 2004 drilling of 56 core holes (Table 6-4) (Saucier and Buchanan, 2005). A total of 279 holes drilled by
| | |
| November 2012 | Shahuindo Project | 63 |
| |
|
MINE DEVELOPMENT ASSOCIATES |
Asarco, Southern Peru, and Sulliden, and spaced from 25 meters to 100 meters apart, were used for this estimate. Auriferous zones were delineated by envelopes of 0.3 g Au/t. A block model was constructed using the same dimensions as in Met-Chem’s 2004 estimate, described above, and interpolation was by the same method as in 2004. Different search ellipsoids were used for each zone and sub-zone to reflect variations in data density and geometric configuration.
| |
| Table 6-4 | 2005 Mineral Resource Estimate for Shahuindo by Met-Chem |
(From Saucier and Buchanan, 2005; cutoff grade of 0.3 g Au/t)
| | | |
| Classification | Tonnage | Gold Grade
g Au/t | Silver Grade
g Ag/t |
| Indicated | 38,009,500 | 0.95 | 22.99 |
| Inferred | 17,159,200 | 0.62 | 12.83 |
AMEC updated Met-Chem’s mineral resource estimate in October and November 2009 as part of a preliminary assessment (Table 6-5) (Wrightet al.,2010a, 2010b). This estimate was based on assays from 320 drill holes. The AMEC estimate used a 10 meters by 10 meters by 5 meters block model with the long dimensions oriented horizontally at azimuth 125° and azimuth 35°. The gold model was estimated using two passes of inverse anisotropic distance weighting to the fourth power, and a model for silver was estimated using the same composite search strategy and interpolation power as for the gold model. AMEC estimated open-pit resources using a cutoff grade of 0.23 g AuEq/t, with a marginal cutoff grade of 0.17 g AuEq/t, for oxide mineralization, and a cutoff grade of 0.63 g AuEq/t, with a marginal cutoff grade of 0.57 g AuEq/t, for mixed and sulfide mineralization. They used prices of $890 per ounce for gold and $13.25 per ounce for silver in their estimation and variable recoveries ranging from 80 to 85% for gold and 15 to 70% for silver.
| |
| Table 6-5 | 2009 Mineral Resource Estimate for Shahuindo by AMEC |
(From Wrightet al.,2010a, 2010b)
| | | | | |
| Classification | Tonnage
tonnes | Gold Grade
g Au/t | Silver Grade
g Ag/t | Gold
Content
oz | Silver
Content
oz |
| Indicated | 51,800,000 | 0.63 | 17.9 | 1,050,000 | 29,800,000 |
| Inferred | 18,000,000 | 0.50 | 6.1 | 290,000 | 3,500,000 |
| | |
| November 2012 | Shahuindo Project | 64 |
| |
|
MINE DEVELOPMENT ASSOCIATES |
MDA completed an updated mineral resource estimate in 2011 (Tietz and Kappes, 2011). Their estimate included only Indicated and Inferred resources within the deposit. There were no Measured resources due to a) limited density and QA/QC data; b) moderate core recovery resulting in uncertainty in localized metal grades; and c) some uncertainty with regards to the localized metallurgical characteristics within the deposit. Sulfide resources were restricted to Inferred primarily due to a) limited metallurgical characterization of this material type and b) some spatial and geologic uncertainty in the model. The mineralized overburden was restricted to Inferred due to the uncertainties in grade continuity.
The informal mining activity by local small miners on a small hill in the west side of the West Zone (known as “La Chilca” hill) created some uncertainty in the resource tonnes and total ounces. As a result, MDA decided to classify all material within the area of informal mining as Inferred. This restriction affected about 38,000 ounces of gold in the oxide and mixed zones. Since the informal mining represented less than two percent of the total Indicated resource, MDA did not consider the effects of the informal mining materially significant.
The stated resource was fully diluted to 8 meters by 8 meters by 4 meters blocks and tabulated on gold-equivalent (AuEq) grade cutoffs that were reasonable for deposits of this nature and for the expected mining conditions and methods. The block dimensions were chosen as practical sizes for open-pit mining a deposit of this kind. The AuEq grade was calculated using the individual gold and silver grades of each block, along with a gold price of $1,200.00 per ounce gold and a silver price of $18.75 per ounce silver. For the oxide and mixed resource estimates, the AuEq grade calculation included a 5:1 difference in gold versus silver recovery in the proposed heap-leach processing scenario.
The formulas used to calculate the AuEq grade were:
| | | |
| | Oxide and Mixed Material: | g AuEq/t = g Au/t + (g Ag/t x 0.003125) | |
| Sulfide Material: | g AuEq/t = g Au/t + (g Ag/t x 0.015625) | |
The MDA 2011 gold and silver reported resources, tabulated by reporting cutoffs, are shown in Table 6-6. At the reportable resource cutoffs, approximately 58 percent of the total resource was classified as Indicated. Approximately 89 percent of the oxide and mixed resource considered for potential open-pit, heap-leach mining was classified as Indicated.
| | |
| November 2012 | Shahuindo Project | 65 |
| |
|
MINE DEVELOPMENT ASSOCIATES |
| |
| Table 6-6 | 2011 Mineral Resource by MDA |
(from Tietz and Kappes, 2011)
| | | | | | | |
| Class | Cutoff
(g AuEq/t) | Tonnes | g AuEq/t | g Ag/t | oz Ag | g Au/t | oz Au |
| Indicated-Oxide | 0.20 | 111,430,000 | 0.514 | 6.0 | 21,350,000 | 0.496 | 1,776,000 |
| Indicated-Mixed | 0.35 | 7,750,000 | 0.864 | 26.6 | 6,630,000 | 0.781 | 195,000 |
| Indicated-Total | variable | 119,180,000 | 0.537 | 7.3 | 27,980,000 | 0.515 | 1,971,000 |
| | | | | | | | |
| Inferred-Oxide | 0.200 | 19,390,000 | 0.377 | 3.6 | 2,270,000 | 0.365 | 228,000 |
| Inferred-Mixed | 0.350 | 710,000 | 0.719 | 10.7 | 240,000 | 0.685 | 16,000 |
| Inferred-Sulfide | 0.500 | 42,730,000 | 1.278 | 26.3 | 36,070,000 | 0.868 | 1,192,000 |
| Inferred-Total | variable | 62,830,000 | 0.994 | 19.1 | 38,580,000 | 0.711 | 1,436,000 |
Note: rounding may cause apparent inconsistencies
The Algamarca mine, located on the southwest side of the Algamarca anticline, produced 1.5 million tonnes grading 2.0% Cu, 680 g Ag/t, and “some gold” over a period of 45 years; the underground operations closed in 1989 (Saucier and Poulin, 2004; Wrightet al., 2010a, 2010b). Compania Minera Algamarca SA was the operator.
On the northeast limits of the Algamarca anticline, Algamarca mined 8,000 tonnes of gold-silver ore from three adits in the Cuerpo San José area in 1988 (Saucier and Poulin, 2004; Saucier and Buchanan, 2005; Wrightet al., 2010a, citing Fletcher, 1997). Algamarca also exploited narrow gold-silver veins producing 12,000 tonnes at the Shahuindo mine from 1987 to 1989 (Saucier and Poulin, 2004; Saucier and Buchanan, 2005; Wrightet al., 2010a, citing Fletcher, 1997). AMEC’s Technical Reports (Wrightet al., 2010a, 2010b, citing Montoyaet al., 1995) also reference production from underground stopes and a small open pit totaling 70,000 tonnes at an unknown grade from San José and Shahuindo in the 1980s or 1990s. Although this appears to be the same mining described in the Met-Chem reports (Saucier and Poulin, 2004; Saucier and Buchanan, 2005), MDA cannot account for the difference in tonnages.
Mining is currently being undertaken by two groups of informal miners, one at the Algamarca anticline and one at La Chilca hill, the latter located at the west end of the current resource area.
| | |
| November 2012 | Shahuindo Project | 66 |
| |
|
MINE DEVELOPMENT ASSOCIATES |
The Shahuindo Project lies in the Western Cordillera of the Peruvian Andes. The regional geology is characterized by Cretaceous sedimentary rocks, which were deposited in the deeper portions of the Western Peruvian Trough back-arc basin (Scherrenberg et.al 2012). The Shahuindo Project is located near a major bend in a fold-thrust belt whose structural elements formed during the Incaic orogeny (Mégard 1984). In the project area, the regional structural fabric is dominated by tight northwest-southeast-verging folds and southwest-dipping thrust faults.
The Shahuindo Project is located along a localized belt of intrusive rocks that is mostly parallel to the dominant structural fabric in the fold-thrust belt. The intrusive rocks consist mostly of hypabyssal dacite and granular diorite dikes and sills. Age dating of a dacite (Hodder 2011) yielded an age of 16 My (Middle Miocene), which is contemporaneous to the Calipuy volcanic rocks. The Calipuy volcanic rocks extend to the southwest of the project area, where they are the host rock for part of Barrick Gold Corporation’s Lagunas Norte deposit. The Calipuy volcanic rocks are also found to the north of the project area in the Yanacocha district, where they predate mineralization (Longo et.al., 2010).
Figure 7-1 shows a plan view of the regional geology in the project area, whereas Figure 7-2 is a lithologic column of the major rock units color-coded to match the geology as shown in Figure 7-1. The property 100 percent controlled by Sulliden is outlined in blue in Figure 7-1, and the ground under option is indicated in red.
| | |
| November 2012 | Shahuindo Project | 67 |
| |
|
MINE DEVELOPMENT ASSOCIATES |
| |
| Figure 7-1 | Shahuindo Property Regional Geologic Map |
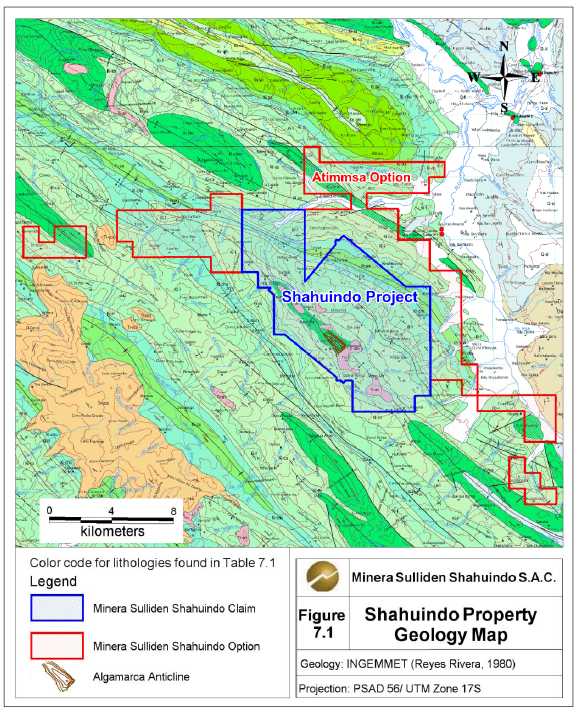
| | |
| November 2012 | Shahuindo Project | 68 |
| |
|
MINE DEVELOPMENT ASSOCIATES |
| |
| Figure 7-2 | Regional Stratigraphy with Location of Some Deposits in the District |
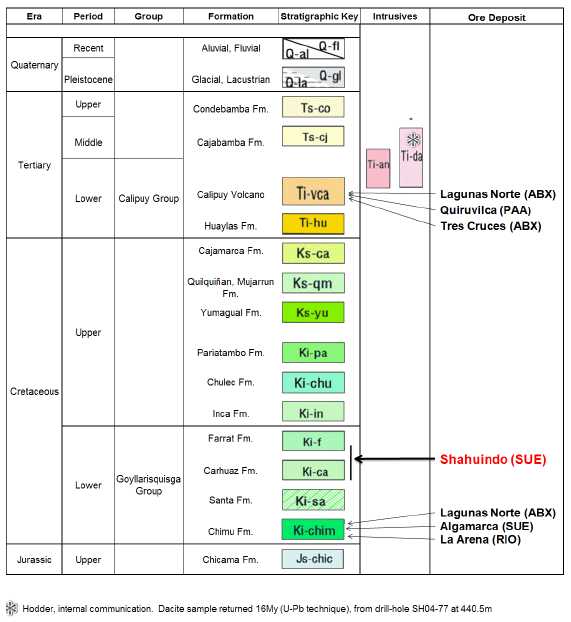
| | |
| November 2012 | Shahuindo Project | 69 |
| |
|
MINE DEVELOPMENT ASSOCIATES |
The Shahuindo Project is located within a regional fold and thrust belt of predominantly Mesozoic sedimentary rocks. Lithologies of the Shahuindo property are dominated by a clastic sedimentary sequence (Lower Cretaceous Goyllarisquizga Group) representing continental and shallow marine facies. Cenozoic intrusive rocks are also present.
Figure 7-3 shows the localized geology within the Shahuindo concession, while Figure 7-4 displays a generalized northeast-southwest cross-section with lithologic descriptions through the center of the project area. The location of the cross-section is noted on geologic map as line A-A’.
| | |
| November 2012 | Shahuindo Project | 70 |
| |
|
MINE DEVELOPMENT ASSOCIATES |
| |
| Figure 7-3 | Geologic Map of the Shahuindo Concession |

| | |
| November 2012 | Shahuindo Project | 71 |
| |
|
MINE DEVELOPMENT ASSOCIATES |
| |
| Figure 7-4 | Shahuindo Project Cross-section A-A’ |

| | |
| November 2012 | Shahuindo Project | 72 |
| |
|
MINE DEVELOPMENT ASSOCIATES |
The Goyllarisquizga Group is the predominant unit on the property and consists of six distinct geological formations, from oldest to youngest (Rivera 1980):
Chimu Formation: The unit consists of white orthoquartzite with intercalations ofcarbonaceous shale in exposures in the Algamarca anticline.
Santa Formation: Dominant pyritic black to grey shale, minor lenticularsiltstones, and a calcareous matrix at the base comprise the formation. Itcontains one to ten percent pyrite regionally.
Carhuaz Formation: The unit dominantly comprises grey siltstones, lesseramounts of impure white to cream-colored sandstones that have a fine-grained tosugary texture, and minor grey shale. The formation is highly lenticular. Bedsare massive and are 0.1 meter to one meter thick with little internal structure.
Farrat Formation: Sandstones and quartzite, typically clean and yellow-white incolor, with minor interbeds of lenticular siltstones, are characteristic of theformation.
Inca Formation: The unit consists of pyritic black shale with minor siltstones andsandstones, occasionally with a calcareous matrix.
Chulec Formation: Marine carbonate sequence outcropping north of theShahuindo mine.
Extending from the core of the Algamarca anticline, the formations generally become younger from southwest to northeast across the project.
The sedimentary rocks have been cut by intrusive rocks. The oldest intrusions in the district were mostly emplaced as concordant bodies parallel to bedding in folded units of the Goyllarisquizga Group. Later intrusive phases, including the quartz diorite porphyry and foliated quartz diorite porphyry, were emplaced as discordant bodies in the form of dikes, stocks, or plugs. From oldest to youngest, the intrusive rocks are (Bussey and Nelson 2011):
Diorite porphyry, locally named andesite. It is characterized by large (8 mmdiameter) biotite phenocrysts, a lack of quartz, and no evidence of hydrothermalalteration where seen in the field. In addition to biotite, it has a high percentageof large plagioclase and hornblende phenocrysts. An isotopic age determinationis reported to have been made on this intrusion and yielded an age of ~26 Ma(Grigorita, in preparation).
| | |
| November 2012 | Shahuindo Project | 73 |
| |
|
MINE DEVELOPMENT ASSOCIATES |
Dacite porphyry, locally named “porphyry.” It is the most widespread intrusion inthe Shahuindo district and is argillically altered wherever observed. The dacite ischaracterized by 1-centimeter bipyramidal quartz phenocrysts, with biotite andplagioclase phenocrysts in an aphanititc groundmass. The large dacite porphyrybody in the north part of the resource area splays to the southeast into a series ofdikes that narrow and disappear. An isotopic age determination (zircon U-Pb)yielded an age of ~16 Ma (Hodder 2011).
Quartz diorite porphyry is characterized by 1-centimeter bipyramidal quartzphenocrysts along with biotite and plagioclase phenocrysts. It is very similar tothe dacite porphyry in terms of grain-size and phenocryst type and content, butthis rock is unaltered. It was noted in the North Corridor area. Clasts of altereddacite porphyry in the heterolithic breccia suggest that the quartz diorite porphyryis a younger intrusion.
Foliated quartz diorite porphyry is characterized by about 50% phenocrysts ofquartz and 5 millimeter-diameter biotite and plagioclase phenocrysts in a fine-grained groundmass. Where unaltered, the rock is magnetic due todisseminated accessory magnetite. It was recognized only in the northwest partof the concession where it occurs along a prominent northwest-trending ridge.
Foliation is defined by alignment of biotite phenocrysts and, to a lesser extent,plagioclase phenocrysts. Where observed in outcrop, the foliation has variableorientation but is often steep and parallel to the margin of the igneous matrixmegabreccia, which it surrounds.
Coarse colluvial material reaching from one to over 50 meters thick is present in various part of the concession. The central portion of the deposit is covered by a colluvial blanket derived in part from weathering of the underlying bedrock and in part from material derived from the Algamarca Anticline.
The structural context described in this section is mostly taken from Bussey and Nelson (2011) and Hodder (2010b).
Although most structural elements of the fold-thrust belt formed during the Incaic II orogeny at ~43 Ma, geochronological data and field relationships suggest that mineralization occurred in the Miocene beginning at ~16 Ma. The Shahuindo deposit occurs along a localized belt of intrusive rocks that is mostly parallel to the dominant structural grain in the fold-thrust belt and is located between two large-amplitude regional-scale folds; the Algamarca and the Minas Azules anticlines (see Figure 7-4).
| | |
| November 2012 | Shahuindo Project | 74 |
| |
|
MINE DEVELOPMENT ASSOCIATES |
Four structural domains are defined in the Shahuindo district based on field mapping and district-scale structural features. From southwest to northeast, the domains are:
Algamarca anticline
San José Anticline
Northeast dip domain
Minas Azules anticline
Algamarca anticline domain
This domain is characterized by the huge Chimú-cored anticline, which has historic mine workings on a number of strike-parallel and transverse veins. The Algamarca anticline has an amplitude of at least 400m and is an upright (generally vertical axial plane), symmetrical, fold. The Algamarca anticline axis is sub-horizontal and trends to the west-northwest. This same trend is observed in the fold limbs of the anticline. The Algamarca anticline occurs only northwest of the northeast-trending La Cruz fault. Vertical displacement on the fault, at the cliff-face exposing the anticline, is at least 600 meters.
San José anticline domain
The Shahuindo resource occurs within this domain, which is associated spatially with the lower amplitude San José anticline. The domain continues to the southeast of the La Cruz transverse fault. Along the anticline is found the northwest-trending San Jose fault zone. The fault zone, which is considered to be a major control on Shahuindo mineralization, consists of a series of parallel and anastomosing structures which are steeply-dipping to the southwest.
This domain is also characterized by short wavelength (<150 meters) folds within the Carhuaz Formation. As with the San José anticline, second-order folds can be upright (vertical axial surface) or inclined. Many of these anticlines and some synclines have breccia dikes along their axial surfaces.
Northeast dip domain
This domain is characterized by generally homoclinal northeast-dipping strata (Carhuaz and Farrat formations). Strata in this domain have been injected by a number of dacitic sills.
Minas Azules Anticline domain
This domain consists of the overturned fold limb of the Minas Azules fold. The Minas Azules fault-propagation fold has amplitude of at least 300 meters and is an asymmetric,
| | |
| November 2012 | Shahuindo Project | 75 |
| |
|
MINE DEVELOPMENT ASSOCIATES |
overturned, northeast-vergent fold with nearly recumbent, low-angle dip (15°-20°) axial surface.
Northeast-trending lineaments inferred to be tear faults dissect the resource area. They include the Choloque, La Cruz, and Los Alisos faults. Although not well exposed at the surface, they are thought to have steep southeasterly dips. These tear faults do not seem to have regional extension but do separate the resource in “zones” of distinct characteristics (see Section 7.5 below).
Map-able evidence of mineralization in oxidized and weathered rocks is observed at the surface. A list of field observations is found below and taken from Bussey and Nelson (2011):
Jarosite (KFe3+3(OH)6(SO4)2): Jarosite forms in acidic environments usually due to oxidation of pyrite-rich rocks in the near-surface environment. At Shahuindo, jarosite occurs in veins and as breccia matrix, and there is a good correlation between known mineralization and the presence of jarosite.
Scorodite (FeAsO4·2H2O): Scorodite was noted in the east-southeast part of the resource area.
Quartz: Mineralization in the main corridor of the Shahuindo property is characterized by millimetric quartz veinlets that locally grade into narrow breccia zones which can have euhedral quartz druse lining cavities. Euhedral quartz druse correlates with gold mineralization but extends beyond the resource area. Quartz veinlets cross-cut pure pyrite veinlets, indicting they formed during a later stage of mineralization. Silicification in the form of quartzite-like texture is only observed in sandstone, and this is thought to be a function of the original porosity and permeability of this lithology.
Studies of hydrothermal clay-like alteration minerals have also been conducted on the project. A petrographic study followed by Pima on thin sections was completed by Hodder (2010a). Also, a Terraspec study was conducted by Sanchez (Sanchez R., in
| | |
| November 2012 | Shahuindo Project | 76 |
| |
|
MINE DEVELOPMENT ASSOCIATES |
preparation) on drill-hole sample pulps from four traverses along the mineralized trend.
The main conclusions are:
Hydrothermal alteration seems to generate a transformation of micas from a Fe-Mg-bearing mica (phengite) to sodium mica (paragonite) to potassium mica (illite-muscovite).
A suite of aluminous minerals (pyrophyllite, diaspore, and alunite) are alsopresent with muscovite in the southeastern part of the deposit.
Trending from southeast to northwest through the deposit, there is an alterationvector of the following assemblages in the sediment package: silica-pyrophyllite,silica-paragonite, and illite-muscovite-paragonite. These assemblages areindicative of a general trend of lesser temperature and higher pH from southeastto northwest.
A trend of lesser temperature/higher pH going from the core of mineralizationoutward exists in the southeast part of the deposit.
The intrusion shows an assemblage consisting of illite-kaolinite.
| |
| 7.4 | Gold-Silver Mineralization |
Mineralization delineated to date displays a combination of structural and stratigraphic controls. It is typically best developed in brecciated sedimentary rocks of the Carhuaz Formation, often at their contact with altered dacite porphyries.
In the oxide facies, which is interpreted to be the result of weathering processes, gold and silver are associated with the presence of jarosite and hematite. In the sulfide facies, gold is typically extremely fine grained; the mineral species have not been identified. Fine-grained pyrite forms a close association with gold mineralization and occurs as disseminations, veinlets, and semi-massive replacement bodies. Tetrahedrite, sphalerite, galena, arsenopyrite, stibnite, and covellite have also been reported in minute blebs adhering to zoned pyrite (Hodder 2010a). Although native silver has been identified at San José and in the historic Shahuindo mine, silver is usually found in sulfo-salts in Shahuindo.
Deposit-wide, the silver to gold ratio averages 12:1 within the oxide portion of the deposit, 35:1 within the sulfide facies, and approximately 50:1 within the transitional “mixed” material that occurs at the base of oxidation of the deposit. The metal ratios reflect the strong leaching of silver from the near-surface oxide material with subsequent supergene-enrichment at the base of oxidation. Where encountered in drilling, the oxide
| | |
| November 2012 | Shahuindo Project | 77 |
| |
|
MINE DEVELOPMENT ASSOCIATES |
zone typically shows an increase in gold and silver grades about five meters above the oxide-zone boundary, copper and silver grades increasing at the oxide contact, and elevated gold, silver, lead, and zinc grades immediately below the oxide contact.
Traces of arsenopyrite, chalcopyrite, sphalerite, and galena have been noted and appear to be best developed along the supergene-enriched zone at the base of oxidation.
Table 7-1 lists average grades for high-grade, mid-grade, low-grade, and non-mineralized samples from the drill-hole database of the project for oxidized, and mixed and sulfurized samples.
Samples in the oxidized part of the deposit are depleted in silver, cadmium, cobalt, copper, iron, manganese, nickel, sulfur, and zinc. On the other hand, there are enriched in barium, chrome, scandium, strontium, and vanadium.
Hydrothermal alteration causes strong enrichment in gold, silver, and antimony. Enrichment is also noted for arsenic, bismuth, cadmium, copper, iron, mercury, lead, sulfur, tungsten, and zinc. Depletion of aluminum, barium, manganese, and vanadium is observed for mineralized samples.
Trends in geochemical signatures and inter-element correlations are consistent with epithermal gold-silver mineralization of possibly intermediate sulfidation state discussed in Section 8 of this report.
| | |
| November 2012 | Shahuindo Project | 78 |
| |
|
MINE DEVELOPMENT ASSOCIATES |
| |
| Table 7-1 | Major and Trace Element Geochemistry AssociatedwithMineralization and Oxidation from Multi-Element Analyses |
| | | | | | | | | |
| | High
Grade | Mid grade | Low grade | Waste
rock | | High
Grade | Mid grade | Low grade | Waste
rock |
Oxidation
state | Oxidized | Oxidized | Oxidized | Oxidized | | Mixed
and
sulfide | Mixed and
sulfide | Mixed and
sulfide | Mixed &
sulfide |
Grade
Range
(Au) | >2.7ppm | 0.7-2.7ppm | 0.1-0.7ppm | <0.1ppm | | >2.7ppm | 0.7-2.7ppm | 0.1-0.7ppm | <0.1ppm |
Number
of
samples | 504 | 3068 | 20062 | 20449 | | 197 | 1242 | 9045 | 13693 |
| Au (ppm) | 6.03 | 1.21 | 0.27 | 0.04 | | 5.82 | 1.21 | 0.26 | 0.03 |
| Ag (ppm) | 52.2 | 15.6 | 4.2 | 1.5 | | 226.6 | 37.0 | 9.8 | 1.9 |
| Al (%) | 0.29 | 0.26 | 0.32 | 0.54 | | 0.24 | 0.26 | 0.30 | 0.65 |
| As (ppm) | 3668 | 1793 | 803 | 280 | | 5035 | 2232 | 814 | 227 |
| Ba (ppm) | 128 | 87 | 58 | 68 | | 17 | 15 | 15 | 26 |
| Bi (ppm) | 46 | 15 | 4 | 2 | | 56 | 15 | 5 | 2 |
| Cd (ppm) | 1 | 1 | 1 | 1 | | 72 | 26 | 12 | 9 |
| Co (ppm) | 1 | 1 | 1 | 3 | | 18 | 20 | 19 | 17 |
| Cr (ppm) | 19 | 17 | 16 | 11 | | 4 | 4 | 4 | 5 |
| Cu (ppm) | 151 | 83 | 59 | 68 | | 11257 | 2553 | 902 | 242 |
| Fe (%) | 8.76 | 7.22 | 5.22 | 3.21 | | 14.05 | 11.41 | 7.58 | 3.78 |
| Hg (ppm) | 3 | 2 | 1 | 0 | | 13 | 3 | 1 | 0 |
| K (%) | 0.39 | 0.30 | 0.22 | 0.19 | | 0.14 | 0.15 | 0.14 | 0.17 |
| Mn (ppm) | 33 | 25 | 41 | 247 | | 74 | 97 | 149 | 868 |
| Ni (ppm) | 1 | 1 | 1 | 3 | | 21 | 27 | 29 | 23 |
| P (ppm) | 643 | 410 | 318 | 317 | | 174 | 214 | 177 | 329 |
| Pb (ppm) | 3897 | 811 | 327 | 96 | | 3527 | 697 | 239 | 135 |
| S (%) | 0.76 | 0.52 | 0.30 | 0.16 | | 9.25 | 8.62 | 7.12 | 3.30 |
| Sb (ppm) | 943 | 240 | 69 | 12 | | 1522 | 299 | 56 | 9 |
| Sc (ppm) | 5 | 3 | 2 | 3 | | 1 | 1 | 1 | 2 |
| Sr (ppm) | 32 | 18 | 14 | 28 | | 12 | 12 | 9 | 17 |
| V (ppm) | 28 | 27 | 25 | 21 | | 5 | 6 | 5 | 9 |
| W (ppm) | 23 | 16 | 11 | 10 | | 21 | 17 | 11 | 10 |
| Zn (ppm) | 25 | 17 | 21 | 87 | | 7435 | 1766 | 885 | 611 |
| | |
| November 2012 | Shahuindo Project | 79 |
| |
|
MINE DEVELOPMENT ASSOCIATES |
Mineralization on the Shahuindo Project occurs along geological features (anticline, intrusions, thrust splays) mostly parallel to the dominant northwest structural grain in the fold-thrust belt. Mineralization tends to have a general northwest-elongated shape on surface. The Shahuindo property has been divided into the Central Mineralized Corridor (CMC), North Mineralized Corridor (NMC), and Southern Mineralized Corridor (SMC) as shown in Figure 7-5.
The NMC encompasses the adits and workings occurring along a strike length of 500 to 700 meters in the historic Shahuindo mine area. Gold mineralization in outcrops has been noted at intermittent intervals along the entire strike length of the NMC, which is defined by a 1.2 square kilometers gold-in-soil anomaly. An initial exploration program recently conducted on the NMC was successful in demonstrating the presence of near-surface oxide mineralization that is similar to the Central Corridor. Results are discussed in Section 9.5.
The SMC is ill defined and consists of mineralization along strike from the Cerro Redondo prospect. A surface gold anomaly has been noted along a 3-kilometer-long trend and includes northeast-trending veins found on top of the Algamarca anticline.
The CMC is defined by mineralization over a 6-kilometer strike length along the northeast limb of the Algamarca anticline; this zone was referred to as the “Main Mineralized Corridor” in AMEC’s Technical Report (Wrightet al., 2010a). The CMC encompasses all of the Shahuindo deposit zones for which a mineral resource had been estimated: the West, Central, East, and Moyan Alto zones. See Section 8.1 for additional details on the deposit zones.
There is exploration potential along strike from the currently defined resource. The Northwest Anomaly is a 3-kilometer-long target at the northwest end of the CMC. The exploration target has been defined by magnetics and reconnaissance soil and rock geochemistry, which show a distinct base-metal plus gold signature. To the southeast, the exploration target is defined by rock geochemistry and an induced polarization (IP) anomaly. The IP anomaly, which is spatially associated with gold mineralization in the Moyan Zone, extends for 700 meters away from the last drill holes at the southeast tip of the resource. Only reconnaissance-level work at the extremity of the resource area has been carried out in the area to date, but these areas warrant drill testing.
| | |
| November 2012 | Shahuindo Project | 80 |
| |
|
MINE DEVELOPMENT ASSOCIATES |
| |
| Figure 7-5 | Shahuindo Mineral Corridors |
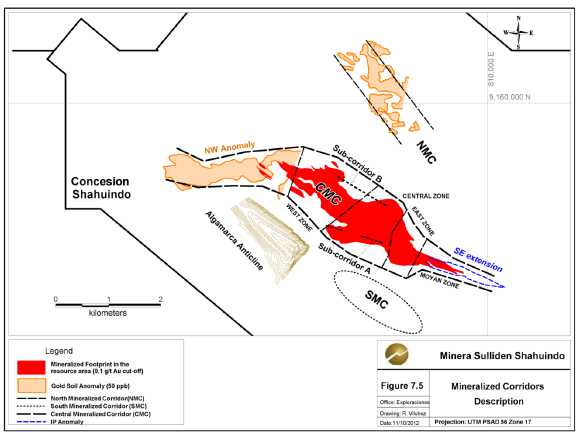
| | |
| November 2012 | Shahuindo Project | 81 |
| |
|
MINE DEVELOPMENT ASSOCIATES |
Field evidence suggests that the Shahuindo mineralization belongs to the epithermal type of gold-silver deposit (Guilbert and Park, 1986; Hedenquistet al.,1999, 2000; White and Hedenquist, 1995; and Taylor, 2007), although earlier work by Montoyaet al.(1995) suggested the mineralization could be Carlin type.
In general, epithermal gold-silver deposits are composed of structurally or stratigraphically controlled disseminations or veins that form in a shallow environment (less than or about 1.5 kilometers) and are hosted by volcanic or sedimentary rocks. The mineralization is dominated by gold and silver but can contain variable amounts of copper, lead, and zinc.
Epithermal gold deposits can be placed on a continuum between:
High sulfidation, characterized by quartz-kaolinite-alunite-kaolinite, enargite-gold,or high sulfur (Ashley, 1982; Hedenquist, 1987; Bonham, 1988) and
Low sulfidation, characterized by adularia-sericite.
The setting, alteration, and mineralization characteristics of the Shahuindo deposit are consistent with an intermediate- or high-sulfidation epithermal system (Hedenquistet al., 2000). Alteration generally occurs as quartz and muscovite, though minor occurrences of alteration minerals indicative of a high-sulfidation system have been observed (Hodder, 2010a). The deposit lacks the characteristic enargite of the high-sulfidation systems and does not have the adularia diagnostic of the low-sulfidation systems.
The Shahuindo deposit lies within the previously described Central Mineralized Corridor and consists of four major zones, interpreted to be down-faulted blocks (east-side down) along the strike of the deposit. Each of the four zones is bounded by transect faults, and each zone has distinct geological characteristics that are summarized below. Common to all of them is that high-grade mineralized shoots (1-5 m wide of >1.0 g Au/t material) are structurally controlled and are surrounded by a large halo of low-grade material (0.2 g Au/t). Hydrothermal alteration consists mostly of muscovite and silicification (Hodder 2010a). In a general way, “vuggy silica” facies and “lithocap” facies are found along the strike of the deposit, with the former more prevalent in the western part of the deposit. The intensity of hydrothermal alteration may be assessed by the composition of Fe/K and Na/K ratios in the muscovite. Minute amounts of acidic clays (pyrophyllite, alunite, and diaspore) have also been identified in open fractures in the lithocap facies. Quartz
| | |
| November 2012 | Shahuindo Project | 82 |
|
| MINE DEVELOPMENT ASSOCIATES |
veining is rare, and to date no significant mineralization has been found to be associated with quartz veining.
The following is a brief description of each of the four zones that make up the Shahuindo deposit (zone locations are shown in Figure 7-3 while geologic cross-sections provided by Sulliden are in Figure 8-1 through Figure 8-5):
The West Zone (Figure 8-1) is the westernmost part of the resource area and is thought to represent the most eroded part of the mineralized system. Mineralization occurs over a strike length of 1.8 km, bounded by the ill-defined La Cruz fault zone on the southeast and the Los Alizos fault on the northwest. A massive, argillized porphyry forms the southwestern wall of the mineralized zone. Most of the mineralization in the West Zone occurs in strongly brecciated Carhuaz Formation (oxidized mineralization) and Santa Formation (sulfide mineralization), often localized along the porphyry/sediment contact. One small portion of the mineralization occurs in porphyry. The contact between the sedimentary rocks and the porphyry dips 70 to 90 degrees to the southwest. The oxide zone varies in thickness from 35 m to 140 m, becoming thicker to the east-southeast. Although silicification is associated with topographic features within the West Zone, silicification is less prevalent here than in other zones within the deposit. About 300 m to the north of the main mineral trend within the West zone is a parallel mineralized structure called “sub-corridor B.”
| | |
| November 2012 | Shahuindo Project | 83 |
| |
|
MINE DEVELOPMENT ASSOCIATES |
| |
| Figure 8-1 | West Zone Geologic Cross-section W150 |
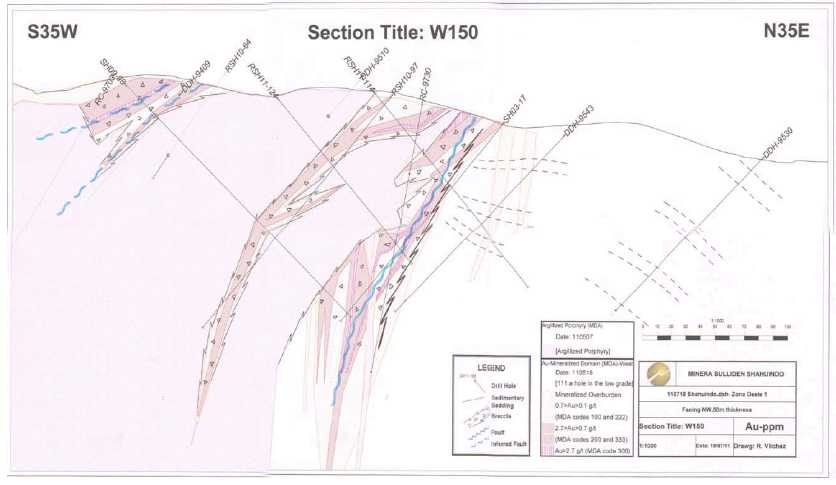
| | |
| November 2012 | Shahuindo Project | 84 |
| |
|
MINE DEVELOPMENT ASSOCIATES |
To the southeast of the West Zone is the Central Zone (Figure 8-2) which has a strike length of 0.8 km. The Central Zone is bounded by the La Cruz fault zone on the northwest and the well-defined Choloque fault on the southeast, and is for the most part covered by an irregular, 1-m- to 50-m-thick layer of overburden. Mineralization occurs as vertical to steeply southwest-dipping shoots in sedimentary rocks that surround argillized porphyries, which occur as vertical to southwest-dipping intrusions 1 m to 10 m thick. As in the West Zone, oxidized mineralization occurs in the Carhuaz Formation, and sulfide mineralization in the Santa Formation. Silicification is common, although it is not associated with topographic features. Oxidation in the Central Zone extends to depths of 150 m and more. Within the Central Zone is a cross-cutting vein corridor that trends northeast.
About 300 m south of the western part of the Central Zone is a sub-parallel zone of mineralization called “sub-corridor A” (Figure 8-3). Within this sub-corridor, stacked lenses of mineralization within the Santa Formation dip at shallow angles to the southwest, perhaps related to a décollement fault. Oxidation extends to depths of 20 m to 70 m within sub-corridor A.
| | |
| November 2012 | Shahuindo Project | 85 |
| |
|
MINE DEVELOPMENT ASSOCIATES |
| |
| Figure 8-2 | Central Zone Geologic Cross-section E500 |
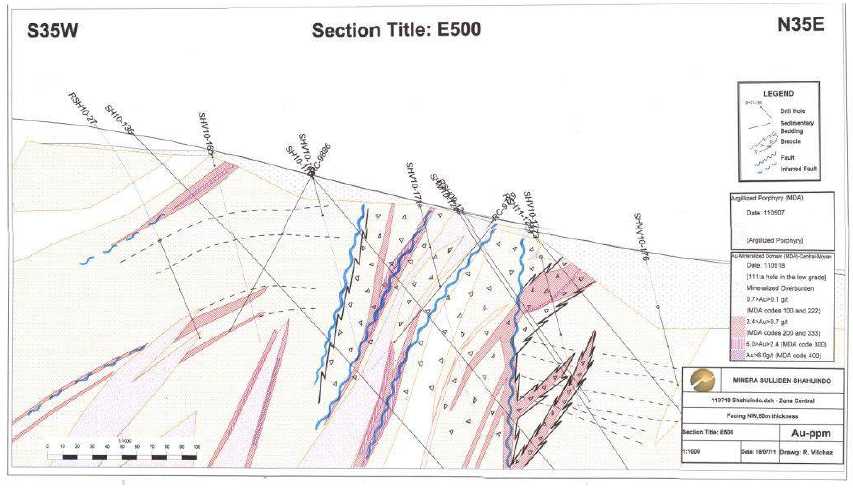
| | |
| November 2012 | Shahuindo Project | 86 |
| |
|
MINE DEVELOPMENT ASSOCIATES |
| |
| Figure 8-3 | Sub-Corridor A Geologic Cross-section E200 |
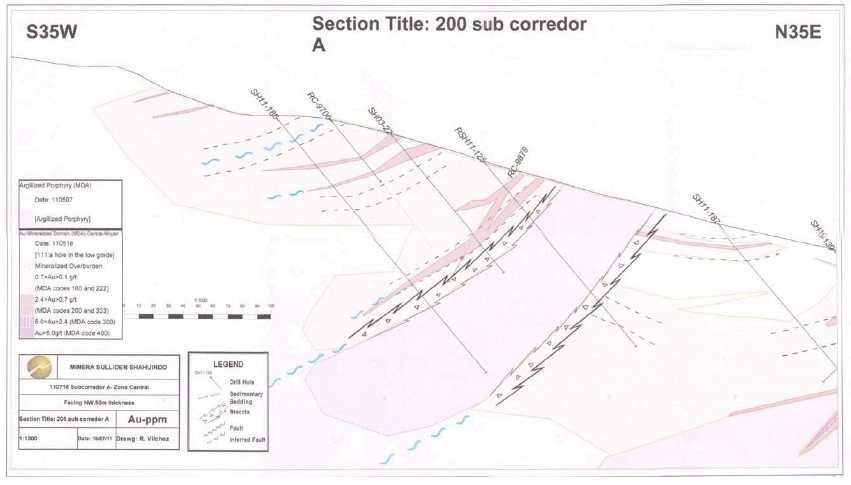
| | |
| November 2012 | Shahuindo Project | 87 |
| |
|
MINE DEVELOPMENT ASSOCIATES |
The East Zone, lying southeast of the Central Zone, is bounded by the Choloque fault on the northwest and by the intersection of a possible décollement fault with topography to the southeast. The East Zone (Figure 8-4) has a strike length of 0.4 km. The Carhuaz Formation appears to host both oxidized and sulfide mineralization in the East Zone, and no porphyries have been identified within this zone. The mineralization has a mushroom-like morphology, with sub-horizontal stratabound mineralization above a possible décollement fault, and two “stems” extending below the décollement.
Mineralized vertical breccia bodies that trend north-south and are from one to three-meters thick about the Choloque fault. Within the East Zone, oxidation reaches to depths of 200 m and more. Silicification is prevalent within healed fractures and occurring as open-space filling.
The fourth and easternmost of the mineralized zones of the Shahuindo deposit is the Moyan Alto Zone (Figure 8-5), which has a strike length of 1 km, although its extension to the southeast is not well defined. As with the East Zone, the Carhuaz Formation appears to host the oxidized and sulfide material in this zone, and there are no porphyries. Mineralization occurs in two en-echelon bodies. Silicification is common within healed fractures and occurring as open-space filling. Oxidation extends to a depth of up to 100 m but becomes shallower from west to east within the Moyan Alto Zone.
| | |
| November 2012 | Shahuindo Project | 88 |
| |
|
MINE DEVELOPMENT ASSOCIATES |
| |
| Figure 8-4 | East Zone Geologic Cross-section E1150 |
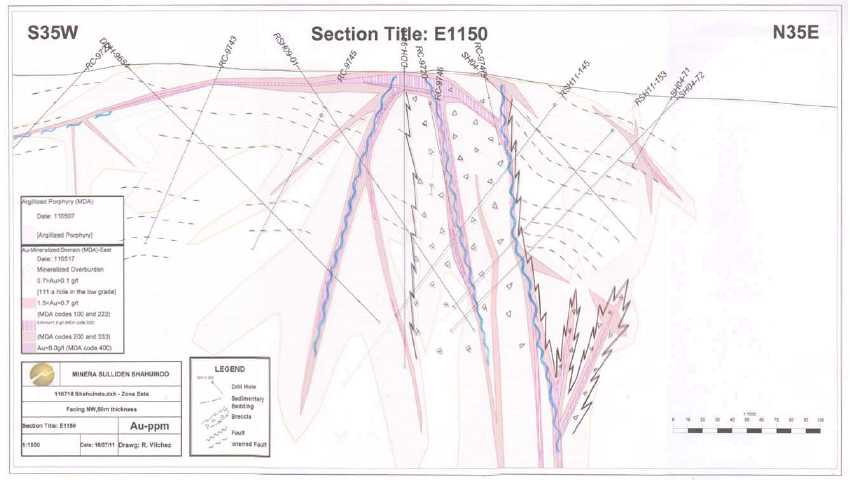
| | |
| November 2012 | Shahuindo Project | 89 |
| |
|
MINE DEVELOPMENT ASSOCIATES |
| |
| Figure 8-5 | East Zone Geologic Cross-section E1500 |
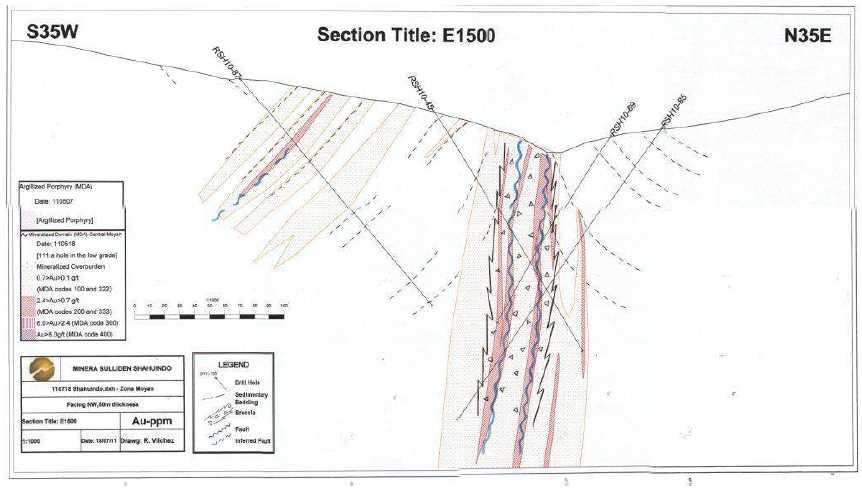
| | |
| November 2012 | Shahuindo Project | 90 |
| |
|
MINE DEVELOPMENT ASSOCIATES |
The Shahuindo deposit lies within the previously described Central Corridor and consists of four major zones, interpreted to be down-faulted blocks (east-side down) along the strike of the deposit. Each of the four zones is bounded by transect faults, and each zone has distinct geological characteristics that are summarized in Table 8-1 and discussed further in the text below. Common to all of them is that high-grade mineralized shoots (1-5 meters wide of >1.0 g Au/t material) are structurally controlled and are surrounded by a large halo of low-grade material (0.2 g Au/t). Hydrothermal alteration consists mostly of muscovite and silicification (Hodder 2010a). In a general way, “vuggy silica” facies and “lithocap” facies are found along the strike of the deposit, with the former more prevalent in the western part of the deposit. The intensity of hydrothermal alteration may be assessed by the composition of Fe/K and Na/K ratios in the muscovite. Minute amounts of acidic clays (pyrophyllite, alunite, and diaspore) have also been identified in open fractures in the lithocap facies. Quartz veining is rare.
| |
| Table 8-1 | Shahuindo Deposit Zones |
| | | | |
| Zone from SE to NW | Moyan | East | Central | West |
| Geology |
| Host Formation | Farrat
Carhuaz | Farrat
Carhuaz | Carhuaz | Carhuaz
Santa |
| Dacite porphyry | Absent | One dike | Multiple
dikes | Large stock |
| Alteration |
| Silicification | Higher ← Volume of rock silicified → Lower |
| Clay assemblage | Pyrophyllite-
diaspore | Pyrophyllite-
diaspore | Paragonite | Illite-
Muscovite |
| Mineralization |
| Mineralization style | More ← Mineralized volume → Less |
| Grade in sulfide | Higher ← Average grade for assays>2.7g/t Au → Lower |
The observations listed in Table 8-1 are compatible with a mineralizing system being more preserved within the southeast portion of the resource.
The following is a brief description of each of the four zones that make up the Shahuindo deposit (zone locations are shown in Figure 7-3, while geologic cross-sections provided by Sulliden are in Figure 8-6 through Figure 8-10).
| | |
| November 2012 | Shahuindo Project | 91 |
| |
|
MINE DEVELOPMENT ASSOCIATES |
The West Zone (Figure 8-6) is the westernmost part of the resource area and is thought to represent the most eroded part of the mineralized system. Mineralization occurs over a strike length of 1.8 kilometers, bounded by the ill-defined La Cruz fault zone on the southeast and the Los Alizos fault on the northwest. A massive, argillized porphyry forms the southwestern wall of the mineralized zone. Most of the mineralization in the West Zone occurs in strongly brecciated Carhuaz Formation (oxidized mineralization) and Santa Formation (sulfide mineralization), often localized along the structurally controlled porphyry/sedimentary rock contact. One small portion of the mineralization occurs in porphyry. The contact between the sedimentary rocks and the porphyry dips 70 to 90 degrees to the southwest. The oxide zone varies in thickness from 35 meters to 140 meters, becoming thicker to the east-southeast. Although silicification is associated with topographic features within the West Zone, silicification is less prevalent here than in other zones within the deposit. About 300 meters to the north of the main mineral trend within the West zone is a parallel mineralized structure called “sub-corridor B.”
| | |
| November 2012 | Shahuindo Project | 92 |
| |
|
MINE DEVELOPMENT ASSOCIATES |
| |
| Figure 8-6 | West Zone Geologic Cross-section W150 |
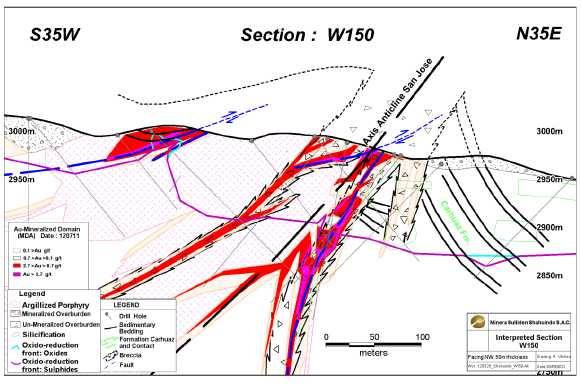
To the southeast of the West Zone is the Central Zone (Figure 8-7), which has a strike length of 0.8 kilometer. The Central Zone is bounded by the La Cruz fault zone on the northwest and the well-defined Choloque fault on the southeast. The Central Zone is for the most part covered by an irregular, 1-meter- to 50-meter-thick layer of overburden. Mineralization occurs as vertical to steeply southwest-dipping shoots in a structurally interlayered sequence of sedimentary rocks and vertical to southwest-dipping, 1-meter-to 10-meter-thick argillized porphyry intrusions. The overburden contains a variable thickness of predominantly low-grade mineralization that was shed from the underlying mineralized bedrock. As in the West Zone, oxidized mineralization occurs in the Carhuaz Formation, and sulfide mineralization in the Santa Formation. Silicification is common, although it is not associated with topographic features. Oxidation in the Central Zone extends to depths of 150 meters and more. Within the Central Zone, a cross-cutting vein corridor has been detected that trends northeast.
| | |
| November 2012 | Shahuindo Project | 93 |
| |
|
MINE DEVELOPMENT ASSOCIATES |
| |
| Figure 8-7 | Central Zone Geologic Cross-section E500 |
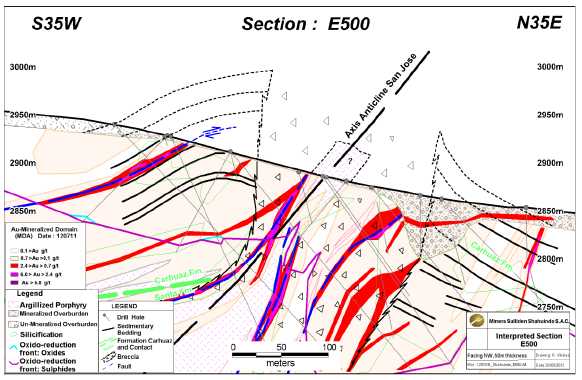
About 300 meters south of the western part of the Central Zone is a sub-parallel zone of mineralization called “sub-corridor A” (Figure 8-8). Within this sub-corridor, stacked lenses of mineralization within the Santa Formation dip at shallow angles to the southwest, perhaps related to a décollement fault. Oxidation extends to depths of 20 meters to 70 meters within sub-corridor A.
| | |
| November 2012 | Shahuindo Project | 94 |
| |
|
MINE DEVELOPMENT ASSOCIATES |
| |
| Figure 8-8 | Sub-Corridor A Geologic Cross-section E200 |
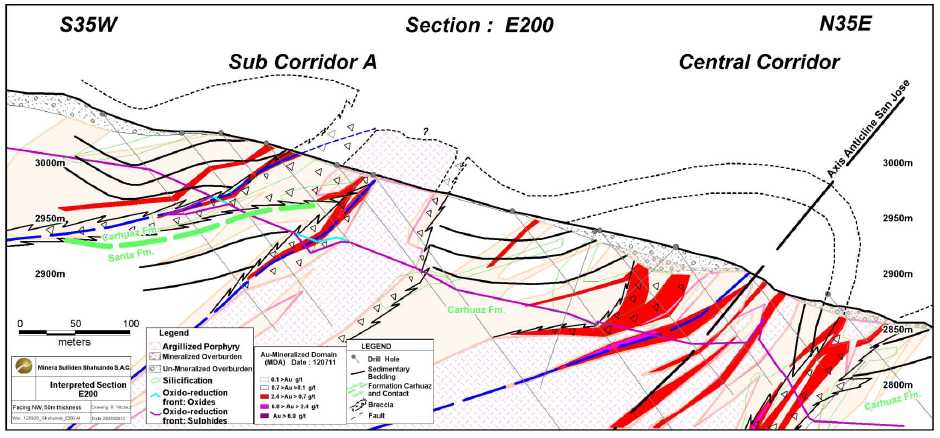
| | |
| November 2012 | Shahuindo Project | 95 |
| |
|
MINE DEVELOPMENT ASSOCIATES |
The East Zone, lying southeast of the Central Zone, is bounded by the Choloque fault on the northwest and by the farthest southeastern extension of a near-surface, 10 to 30-meter-thick, mineralized stratabound horizon. The East Zone (Figure 8-9) has a strike length of 0.4 kilometer. The Farrat Formation appears to host the low-dipping, stratabound mineralization, while mineralization is found in the Carruaz Formation at depth. The East Zone mineralization has a mushroom-like morphology, with the Farrat Formation sub-horizontal stratabound mineralization overlying two west-northwest-trending mineralized “stems” extending below into the Carruaz Formation. Extending north from the East Zone is a sequence of one- to three-meter-thick, north-trending mineralized vertical breccia bodies that abut the Choloque fault. Within the East Zone, oxidation reaches to depths of 200 meters and more. Silicification is prevalent within healed fractures and also occurs as open-space filling.
| |
| Figure 8-9 | East Zone Geologic Cross-section E1150 |
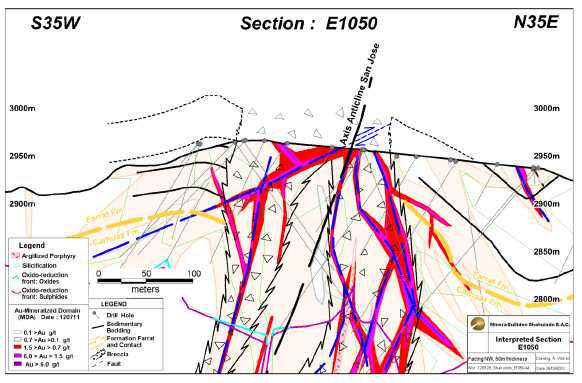
| | |
| November 2012 | Shahuindo Project | 96 |
| |
|
MINE DEVELOPMENT ASSOCIATES |
The fourth and easternmost of the mineralized zones of the Shahuindo deposit is the Moyan Alto Zone (Figure 8-10), which has a strike length of 1 kilometer, although its extension to the southeast is not well defined. As with the East Zone, the Carhuaz Formation appears to host the oxidized and sulfide material in this zone, and there are no porphyries. Mineralization occurs in two en-echelon bodies. Silicification is common within healed fractures and also occurs as open-space filling. Oxidation extends to a depth of up to 100 meters but becomes shallower from west to east within the Moyan Alto Zone.
| |
| Figure 8-10 | Moyan Alto Zone Geologic Cross-section E1500 |
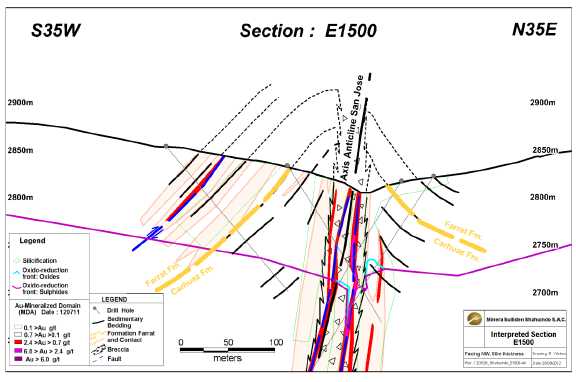
| | |
| November 2012 | Shahuindo Project | 97 |
| |
|
MINE DEVELOPMENT ASSOCIATES |
Exploration by prior operators is described in Section 6.0. Table 9-1 summarizes exploration activities by Sulliden on the Shahuindo property. Drilling is described in more detail in Section 10.0.
| |
| Table 9-1 | SummaryofSullidenExplorationActivitiesontheShahuindoProperty |
| |
| 2002 | Preliminary geophysical surveys (magnetometer and induced polarization), re-survey of previous drill collars |
| 2003 | 27 diamond drill holes. Geologic mapping and trenching, soil survey, surface rock sampling, geophysical surveys (magnetometer and induced polarization), preliminary metallurgical testing, re-survey of previous drill collars |
| 2004 | 56 diamond drill holes. Geological mapping, soil survey, trenching, surface rock sampling, adit sampling, magnetometer survey |
| 2007 | 14 diamond drill holes on targets outside of the main mineralized area. Re-establishment of grid, magnetometer surveys, soil sampling |
| 2009 | 12 diamond drill holes and 25 reverse circulation holes. Acquisition of digital 2-m topography, location of previous hole collars, trenching, drill-hole re-sampling program, soil sampling (mobile metal ion survey), metallurgical test work, preliminary economic assessment |
| 2010 | 79 diamond drill holes, 82 reverse circulation holes. Mapping, rock sampling, soil sampling, geophysical surveys (magnetometer, induced polarization, down-hole IP), metallurgical test work, geotechnical evaluation162 exploration diamond drill holes and 145 reverse circulation holes. |
| 2011 | Geotechnical drilling and evaluation .Mapping, rock sampling, soil sampling. Resource estimation. |
| 2012 | 13 exploration diamond drill holes (not included in this resource estimation). Geotechnical drilling and evaluation. Mapping, rock sampling, soil sampling. Geophysical surveys (magnetometer, induced polarization, down-hole IP) |
The following information has been based on the AMEC PEA report dated February 19, 2010 (Wrightet al., 2010b) with updated information provided by Sulliden.
Current surface geology maps for the project have been compiled from historic work and mapping of trenches and outcrops by Sulliden at a scale of 1:500 to cover the Central Mineralized Corridor, the North Mineralized Corridor, and the areas of possible infrastructure location.
| | |
| November 2012 | Shahuindo Project | 98 |
| |
|
MINE DEVELOPMENT ASSOCIATES |
Sulliden has established an exploration grid with a base line along azimuth 125 degrees and origin at UTM 807,479.37 meters East, 9,157,980.00 meters North. The project UTM grid uses the PSAD 56 datum for zone 17. The grid’s base line runs near the Central corridor of the mineralization, and cross lines have been established from 62,000 meters west to 58,000 meters east of the central cross line, which runs through the grid origin and has an azimuth of 35 degrees. The resource extends from 17,000 meters west to 23,000 meters east and sits within 500 meters of the base line.
Val d’Or Geofisica del Peru (VDG) in 2002 and 2003 surveyed the grid lines with a differential total station global positioning system instrument (GPS), and stations have been established on the cross-lines at 50-meter intervals (VDG, 2002, 2003).
In 2009, an aerial survey was conducted by Horizons South America S.A.C. (Horizons) to produce a high-definition, 2-meter-contour topographic map of most of the concession. A network of surveyed ground points was established to anchor the survey. Drill-hole collar locations have been surveyed using these ground points since 2010, and positive check surveys were done to ensure compatibility with the older DGPS-derived collars. Elevation for all collars was derived from the 2m-contour topographic map.
VDG conducted magnetic and induced polarization (IP) geophysical surveys in 2002, 2003, 2007, 2009, 2010, 2011, and 2012.
The magnetic surveys eventually covered most of the concession and comprised about 550 line-kilometers of data. The surveys indicated that the San José porphyritic intrusion has a magnetic print, extends to the east and below the East and Moyan Alto zones, and can be traced west-northwest to the project boundary. Magnetic anomalies that may reflect additional porphyry bodies were found in the Minas Azules and Cerro Redondo areas.
Over 160 line-kilometers of various pole-dipole IP surveys were conducted with various electrode spacing over prospective area on the Shahuindo concession.
| | 1. | Chargeability anomalies were spatially related to the West and Sub-corridor A zones. |
| | | |
| | |
| November 2012 | Shahuindo Project | 99 |
| |
|
MINE DEVELOPMENT ASSOCIATES |
| | |
| | 2. | Anomalies indicating the presence of disseminated sulfides and silica concentrations that could be associated with mineralization under the Quaternary deposit were also located above the Central Zone. |
| 3. | Another IP anomaly was found to be coincident with the Moyan Alto Zone, with an additional 800-meter strike-length anomaly extending on strike with the Moyan Alto Zone to the southeast. |
| 4. | Two strong chargeability/low resistivity anomalies were found in the North Corridor area, trending in a general 325 degree direction. |
Soil, channel, and rock sampling, both surface and underground, have been used to evaluate mineralization potential and generate targets for diamond drilling since the beginning of exploration activities on the Shahuindo property.
A total of approximately 10,800 rock samples were taken on the property and consisted mostly of trench samples, with a subordinate number of grab and individual channel samples. Trenching was undertaken between 2003 and 2005 and again in 2009. More than 25 kilometers of trenches were excavated. Excavation went to bedrock, or a maximum depth of 1.8 meters. Trenches were sampled either horizontally or vertically, depending on trench geology. Horizontal channel samples were typically located at the base of the trench wall. Where bedding was horizontal, vertical channel samples were taken from the top to the base of the wall. Sample lengths were variable, being three meters, five meters, or ten meters, depending on geology.
Most accessible adit entries located on the concession were sampled, and where possible, samples were taken from the adit portal and along the accessible portion of the tunnel. Most samples were vertical and non-continuous. Approximately 140 small adits were sampled for a total of 600 samples.
Detailed soil sampling was completed by Sulliden in 2003, 2004, 2007, 2008, 2010, 2011, and 2012. Approximately 9,400 samples were taken, covering most of the Shahuindo concession. A series of continuous, parallel gold anomalies were delineated along the Central and North corridors. Base metal anomalies were found to the northwest and to the southeast of the concession.
In 2009, a mobile metal ion (MMI) sampling program was initiated on the property. An orientation survey consisting of 500 samples was carried out over the Central Zone and other areas. Results confirmed the gold-in-soil analyses.
| | |
| November 2012 | Shahuindo Project | 100 |
| |
|
MINE DEVELOPMENT ASSOCIATES |
Several exploration targets are found on the concessions. Targets may be divided in three categories:
Aggregation of mineralization to the known area of resource
Several exploration targets are available to expand the known mineralization outside but close to the known resource. These targets require additional drilling to establish the limits and geological continuity of the mineralized bodies, allowing for the construction of a new grade shell and additional projection of the mineralization. They consist of:
Northwest extension to the Main Mineralized Corridor (MMC). This target ishighlighted by a 1,600 meters (strike length) soil anomaly.
Southeast extension to the MMC. This target is highlighted by a 800 meters(strike length) IP chargeability anomaly.
Sub-Corridor B. A parallel structure named Sub-Corridor B was foundapproximately 400 meters to the north of the baseline. It was drill defined in twostretches of 300 meters of strike length each. They are separated by 800 metersof strike length that is undrilled.
Sub-corridor A. A parallel structure named Sub-Corridor A was foundapproximately 400 meters to the south of the baseline. It is drill defined for 500meters, and its extension to the southeast where it could merge with the bulk ofthe mineralization is not drill tested.
Definition of new gold-silver mineralization
Encouraging drill results were found in the North Mineralized Corridor, which may be traced for more 2 kilometers on surface. Highlights from this 5,227 meter, 22 drill-holes program include:
| 1. | Hole SHN11-335: At 60.1 meters, intersection of 1.44 g/t gold and 26.2 g/t silver over 18.0 meters, including 3.19 g/t gold and 62.2 g/t silver over 6.0 meters |
| 2. | Hole SHN11-330: At 119.5 meters, intersection of 0.40 g/t gold and 8.7 g/t silver over 60.0 meters, including 1.07 g/t gold and 5.1 g/t silver over 4.5 meters |
| 3. | Hole SHN11-329: At 109.7 meters, intersection of 1.19 g/t gold and 33.5 g/t silver over 12.0 meters, including 2.02 g/t gold and 67.4 g/t silver over 4.5 meters |
| 4. | Hole SHN11-328: At 2.2 meters, intersection of 0.85 g/t gold and 71.4 g/t silver over 53.8 meters, including 1.27 g/t gold and 108.0 g/t silver over 33.3 meters |
| | | |
| | |
| November 2012 | Shahuindo Project | 101 |
| |
|
MINE DEVELOPMENT ASSOCIATES |
| 5. | Hole SHN11-320: At 222.4 meters, intersection of 0.63 g/t gold and 19.5 g/t silver over 22.0 meters |
| | 6. | Hole SHN11-307: At beginning of hole, intersection of 1.24 g/t gold and 34.8 g/t silver over 8.2 meters. |
This target needs additional follow-up drilling that would aim to generate continuity in the mineralization to define mineralized volume.
Evaluation of new deposit types
In the northwest part of the Shahuindo concession, near the Algamarca mine, a base metal anomaly may point to a different deposit type.
An overview of the exploration targets is shown in Figure 9-1.
| | |
| November 2012 | Shahuindo Project | 102 |
| |
|
MINE DEVELOPMENT ASSOCIATES |
| |
| Figure 9-1 | Exploration Targets |
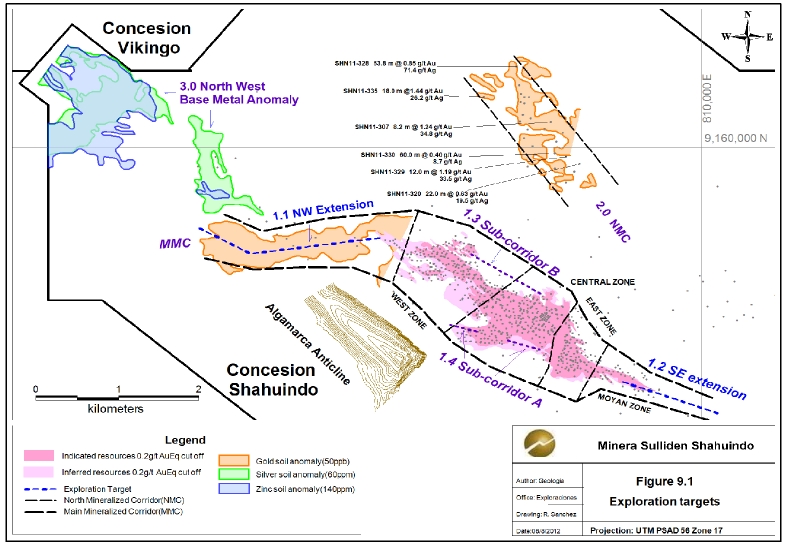
| | |
| November 2012 | Shahuindo Project | 103 |
| |
|
MINE DEVELOPMENT ASSOCIATES |
The information presented in this section concerning pre-2010 drilling has been largely based on the AMEC PEA report dated February 19, 2010 (Wrightet al., 2010b), with additional information as cited and with updated drilling information provided by Sulliden.
A total of 827 holes have been drilled by Atimmsa, Asarco, Southern Peru, and Sulliden within the current Shahuindo Project area, although one Asarco hole was not used within the current drill-hole database because the collar location was uncertain (Table 10-1). Reverse circulation (RC) (374 holes) and diamond drilling (453 holes) have both been carried out on the property.
| |
| Table 10-1 | Drilling Campaigns |
| | | | | | | |
| Operator | Year | core | RC | Total |
| | | # of holes | meters | # of holes | meters | # of holes | meters |
| Atimmsa | 1992 | | | 11 | 744.0 | 11 | 744.0 |
| Asarco | 1994-1996 | 58* | 8,658.2 | 31 | 3,681.0 | 89 | 12,339.2 |
| Southern Peru | 1997-1998 | 18 | 1,905.3 | 80 | 9,755.0 | 98 | 11,660.3 |
| Sulliden | 2003-2011 | 377 | 78,387.4 | 252 | 42,884.5 | 629 | 121,271.9 |
| Total | | 453 | 88,950.9 | 374 | 57,064.5 | 827 | 146,015.4 |
| * | includes one core hole (DDH-9517 ) not included in Sulliden or MDA database due to uncertain collar location. |
The current drill-hole database includes all holes drilled by Sulliden through the end of 2011. Included in this total are 173 core holes and 83 RC holes completed by Sulliden in the second half of 2011, after the effective date of the previous 2011 resource estimate. Sulliden core drilling has continued into the first half of 2012 with the completion of 13 core holes. The 2012 drilling is primarily outside the current resource area and its effect on the resource has not been quantified.
Approximately 90 percent of the project drill data (378 core and 372 RC holes for a total meterage of 131,905.1 meters) are within or adjacent to the current mineral resource area and were used in the creation of the geologic models and subsequent resource estimation.
Figure 10-1 shows a plan view of drill-hole collar locations and the current resource outline in relation to the Sulliden mineral claim boundary and the Algamarca anticline.
| | |
| November 2012 | Shahuindo Project | 104 |
| |
|
MINE DEVELOPMENT ASSOCIATES |
| | |
| November 2012 | Shahuindo Project | 105 |
| |
|
MINE DEVELOPMENT ASSOCIATES |
| |
| Figure 10-1 | Drill-Hole Location Plan |
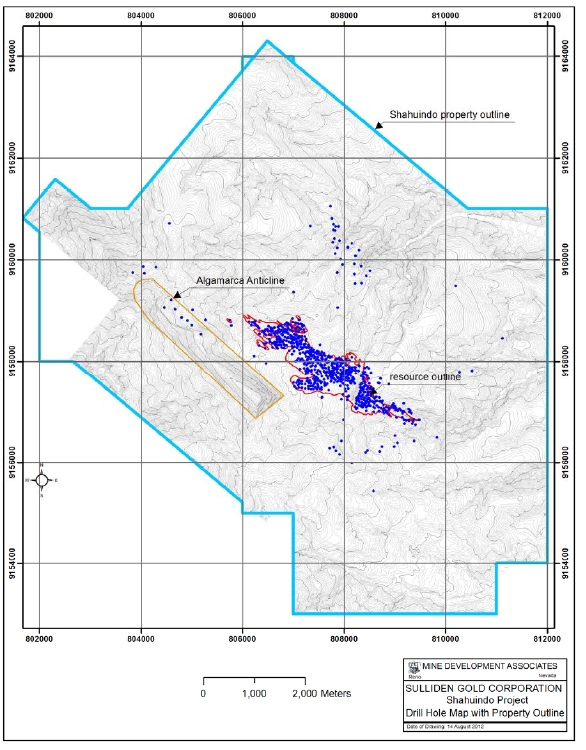
Drill programs have been completed primarily by contract drill crews, supervised by the geological staff of the project operator at the time. Where programs are referred to by
| | |
| November 2012 | Shahuindo Project | 106 |
| |
|
MINE DEVELOPMENT ASSOCIATES |
company name, that company was the project operator at the time of drilling and was responsible for data collection.
| 10.1 | Drilling Methods and Equipment |
MDA has no information on Atimmsa’s drill contractor or the type of equipment used in the 1992 drill campaign.
Asarco retained Geotec S.A. (Geotec) for their diamond drill program in 1994, 1995, and 1996. Geotec used a standard Longyear wireline diamond drill, drilling HQ (63.5-millimeter core diameter) and NQ (47.6-millimeter) core. Recovery was said to be consistently better than 90% (Fletcher, 1997, cited by Saucier and Poulin, 2004). For Asarco’s RC drilling, holes were generally drilled dry and also had good recovery (Saucier and Poulin, 2004); MDA has no information on Asarco’s RC drill contractor or the type of rig used.
Andes Drilling and Podiur were the RC and diamond drill contractors, respectively, retained by Southern Peru in 1997 and 1998. Southern Peru drilled HQ core, reducing to NQ in 1998. MDA has no information on the type of rigs used.
Forage Orbit S.A. drilled for Sulliden in 2003 and 2004, using a skid-mounted rig. In 2007, Sulliden’s drill contractor was MDH Bradley SAC (MDH Bradley), who employed a skid-mounted rig. From 2009 to the end of 2011, MDH Bradley and AK Drilling International (AK Drilling) were the drill contractors for the Shahuindo Project. MDH Bradley conducted all the diamond drilling, using a variety of skid and track-mounted electric-hydraulic diamond drill rigs (mostly LF70 rigs). AK Drilling used a Foremost Prospector 750 Buggy with auxiliary booster and compressor to complete the RC drill program.
Sulliden’s core holes were generally drilled using HQ rods, but some 2003 and 2004 holes, as a result of ground conditions, were drilled at NQ size. In 2010 and 2011, limited PQ drilling (85.5 millimeters) was done for metallurgical and twinning purposes.
The potential for loss of gold in fines and resulting grade loss has been a subject of concern for Sulliden, and measures to limit the grade loss have been taken in drilling and sampling procedures.
Sulliden used a variety of RC hammers that ranged from 4 ½ inches to 5 ½ inches in diameter. Dry samples were preferred over wet samples, and generally a frontal
| | |
| November 2012 | Shahuindo Project | 107 |
| |
|
MINE DEVELOPMENT ASSOCIATES |
hammer was used to retrieve dry samples. Conventional hammers were used for wet samples; a tricone was sometimes necessary when ground condition were very poor.
Prior operators placed core into corrugated plastic core trays with depth markers to denote every drill run. Sulliden’s HQ and NQ core was placed into wooden boxes with wooden blocks to denote every drill run. Since 2007, a liner has been fitted into the wooden boxes to help retain all the material produced by drilling. PQ core was placed into plastic boxes with plastic separators. Boxes contain either three meters of HQ core, four meters of NQ core, or two meters of PQ core. Core boxes were securely sealed and delivered once a day, by truck, to core-logging facilities at the exploration camp in San José.
Prior operators bagged RC cuttings in the field, and a reference chip tray was collected, at two-meter intervals. Sulliden RC cuttings were sampled on 1.5-meter intervals. Thirty percent of the cuttings of each individual sample were bagged and sent to the lab. The remaining 70 percent of the sample cuttings were bagged and kept as rejects. Two reference chip trays, one with a complete sample and the other with a sieved sample (1-millimeter mesh), were collected at the same 1.5-meter interval.
Drill-collar Northing and Easting coordinates are located in relation to a surveyed exploration grid. In 2002 and 2003, VDG surveyed the exploration grid line with a differential GPS and established stations on the cross-lines at 50 meters intervals. In addition to establishing the exploration grid, VDG also relocated and resurveyed drill-collar locations from historic campaigns. Since 2003, proposed drill holes have been located by chaining distances along compass azimuths from the 50-meters survey stations. Upon completion of the 2003 through August 2010 drilling, the drill-hole collars were surveyed by VDG using differential GPS. Starting in September 2010, completed drill holes were located by Sulliden using a total station survey based on the aerial survey points established by Horizon in 2009. The difference between differential GPS and total station data is usually less than 5 meters.
The collar elevations of all pre-2009 drill holes were back-interpolated (pressed) to the 2-meter-contour topographic map created by Horizon in 2009. From 2009 on, the drill pads were constructed in such a way that the collar point would not deviate from the undisturbed topographic surface.
| | |
| November 2012 | Shahuindo Project | 108 |
| |
|
MINE DEVELOPMENT ASSOCIATES |
Results of down-hole surveys are available for 576 core and RC holes, corresponding to approximately 70 percent of the number of holes in the database used for this report. Survey data are not available for the 198 drill holes completed between 1992 and 1998 and for 53 of the 629 drill holes completed by Sulliden from 2003 until the present. For Sulliden’s drilling from 2003 to 2007, surveying consisted mostly of acid tests with minor use of Tropari and Sperry Sun tools. Since 2009, surveying was generally done by Flex-it, with minor surveying done by Reflex Easy-Shot and Maxibore II tools.
The unsurveyed 1992 through 1998 pre-Sulliden drill holes are, in general, quite short, averaging about 125 meters drill depth; down-hole deviation is not likely to cause much uncertainty in the position of data points along the drill-hole trace. The Sulliden holes are, in general, deeper drill holes with an average depth of 185 meters. Down-hole survey readings were taken at approximate 65 meters drill depth intervals with the first reading within 20 meters of the collar.
Sulliden core holes usually have two to three survey readings per hole with the bottom readings usually within 50 meters of the total drill depth. The depth intervals between survey readings are often variable depending on the total depth of the core hole; the maximum interval between survey readings is 100 meters.
Almost all Sulliden RC holes have just two survey readings at regular 15 meters and 75 meters drill depths. The RC holes have an average drill depth of 180 meters with a maximum depth of 309 meters, so for most RC holes the bottom 100 meters to 200 meters are not surveyed.
AMEC reported (Wrightet al., 2010b) that a deflection study was carried out based on Flexit, Reflex, and Maxibore II data from 28 core and 10 RC drill holes drilled in the 2003, 2007, and 2009 campaigns. The average deflection of the diamond drill holes was 1.8 meters of deflection per 100 meters down hole, and the average deflection of the RC holes was 4.8 meters deflection per 100 meters down hole. A more comprehensive deflection study completed by MDA on all 2009 through May 2011 RC and core holes indicates an average deflection for every 100 meters down hole of 2.9 meters and 9.4 meters for the core and RC holes, respectively. As indicated in the above paragraph, the RC deflection data are based on two readings per hole spaced at a regular 60 meters down-hole interval, so the 9.4 meters average value is an extrapolated value that might not be indicative of the true deflection at greater drill depths.
| | |
| November 2012 | Shahuindo Project | 109 |
| |
|
MINE DEVELOPMENT ASSOCIATES |
Most core and RC drill holes drilled by previous operators have been re-logged by Sulliden and checked against assay certificates.
Since 2003, Sulliden has logged sampling intervals, alteration, mineralization, and rock-type data in digital spreadsheet forms. Logs recorded lithologies, fracture orientation, oxidation, sulfide mineralization types and intensities, and alteration type and intensity. Recovery percentages were also recorded. Since 2007, rock quality designation (RQD) has also been recorded. In 2010, the use of logging software (Geotic) was implemented. Information from the pre-2010 drill programs has been integrated into the drill-log database generated by Geotic.
Since the 2003 Sulliden drill campaign, all drill core has been photographed.
Project data are stored in various digital files and have been compiled and re-compiled since 2003. In June 2009, Sulliden re-compiled paper data for drill-hole collars, down-hole surveys, assays, and oxidation state for data from operators prior to Sulliden.
As described above, Sulliden has implemented the use of logging software. At the same time, all core and RC chips from drilling prior to that of Sulliden have been re-logged with the view of adding coherence to the geological database based on evolving understanding of the deposit.
Digital data are regularly backed up in compliance with internal company control procedures. Original hard-copy data are stored in Sulliden’s Lima office.
Sulliden provided all drill data to MDA in digital form. The database used by MDA for the current resource estimation was finalized on May 17, 2012 and includes all drill data up through RC hole RSH11-252 and core hole SH11-345. The project database has a total of 94,441 gold assays, 93,073 silver assays, 69,103 total-sulfur analyses, and 9,800 sulfide-sulfur analyses. The database also includes a 31-element suite of trace element analyses for almost all Sulliden holes drilled from 2007 to the present. Excluded from the final database are 17 sample intervals from RC drill hole RSH10-29, due to apparent down-hole contamination.
| | |
| November 2012 | Shahuindo Project | 110 |
| |
|
MINE DEVELOPMENT ASSOCIATES |
The database also includes down-hole geology, core recovery data, and RQD for the 2003 through 2011 project core holes, and 1,411 specific gravity measurements collected from drill core. Sulliden is currently updating the RQD data for many of the 2011 drill holes. As a result, the RQD database is not as extensive as the core recovery data.
MDA considers the database to be of good quality (see data verification in Section 12.0) and acceptable for use in resource estimation.
Drill-core recovery during the 2003 through 2011 Sulliden programs was generally good, averaging 89 percent for all project drill holes. Core recovery for those mineralized drill intervals assaying greater than 0.2 g Au/t is 87 percent. Within the four resource zones, average core recovery for the mineralized intervals ranges from a low of 77 percent in the Moyan Alto zone to 89 percent in the Central zone. The East and West zones average 85 and 87 percent core recovery, respectively.
There is a relationship between recovery and core size. The HQ-size core, which makes up approximately 90 percent of the drill meterage, averages 87 percent core recovery, while the limited amount of NQ-size and PQ-size core averages 76 and 93 percent core recovery, respectively.
The core is generally highly fractured within the mineralized horizons, and RQD measurements are typically low, averaging about 16 percent. Average RQD values range from 30 percent in the West zone to 15 percent in the Central and East zones.
Poor core recovery may have an impact on grade assessment, as gold mineralization is believed to be hosted in secondary porosity in the form of veinlets and fractures in the quartzites. Sulliden identified in the drill log those mineralized intervals with poor recovery by adding this comment: “Testigo lavado.”
MDA analyzed the drill data to determine if there was a deposit-wide relationship between poor recovery intervals and decreasing gold grades. Figure 10-2 shows the gold grades (blue vertical bars) and the number “Count” of intervals (light blue line with orange data points) plotted in the vertical axis, while core recovery is plotted along the horizontal axis. The figure includes those mineralized intervals assaying 0.2 g Au/t or greater, with the very high-grade (>10 g Au/t) outliers excluded due to their tendency to skew the statistics. The core-recovery data have been separated into distinct bins for
| | |
| November 2012 | Shahuindo Project | 111 |
| |
|
MINE DEVELOPMENT ASSOCIATES |
each 10 percent increase in recovery. So the “70” value in the horizontal axis contains all data points which have core-recovery values between 70 and 79 percent. The high data count in the “100” recovery bin reflects the large number of intervals with recoveries of exactly 100 percent.
| |
| Figure 10-2 | Core Recovery and Gold Grades - >0.2 g Au/t Samples Only |
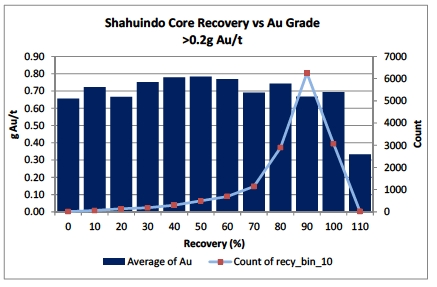
Gold grades within the mineralized material, in general, are relatively unchanged, though there is some evidence for a small increase in grade in the 30 percent through 70 percent recovery range. Gold grades decrease for intervals with recoveries less than 30 percent, but the small sample population at the very low recoveries creates some uncertainty about any interpretations.
There is a general correlation throughout the deposit between higher gold grades and more highly fractured/brecciated core intervals. To test whether possible core loss within these intervals has an effect on gold grade, MDA first looked at those intervals assaying greater than 0.7 g Au/t (Figure 10-3) and then analyzed the core-recovery data a second time after filtering by the mineral-domain coding used in the resource model (Figure 10-4). [Mineral domains are spatial populations of low-, medium-, high-, and very high-grade gold mineralization that correspond to geologic characteristics within the deposit. For Shahuindo, the medium-, high-, and very high-grade domains (codes 200, 300, and 400), in general, correlate with the more strongly fractured and brecciated mineralized structures. See Section 14.0 for a more thorough explanation of mineral domains.]
| | |
| November 2012 | Shahuindo Project | 112 |
| |
|
MINE DEVELOPMENT ASSOCIATES |
| |
| Figure 10-3 | Core Recovery and Gold Grades - >0.7 g Au/t Samples Only |
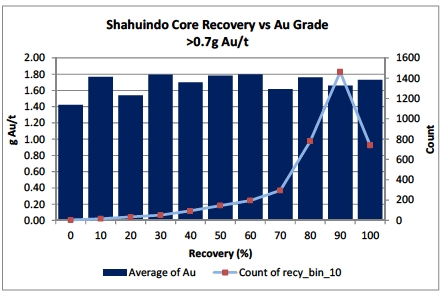
| |
| Figure 10-4 | Core Recovery and Gold Grades – Mineral Domains 200, 300, and 400 |

Gold grades in Figure 10-3 are similar to the trends in Figure 10-2; the grades are relatively unchanged, though there is some evidence for decreasing gold grades below 30 percent core recovery. Within the mineral-domain data shown in Figure 10-4, the grades above 60 percent core recovery are more variable though remain relatively unchanged, while below 60 percent core recovery, except for the one higher grade spike at 10 percent core recovery, there is a consistent drop in gold grades as one steps down
| | |
| November 2012 | Shahuindo Project | 113 |
| |
|
MINE DEVELOPMENT ASSOCIATES |
through the core recovery ranges. As in the deposit-wide data (Figure 10-2), the small sample populations at the very low recoveries create some uncertainty in any interpretation.
It is unclear to MDA whether the observed decrease in grade at lower core recoveries is due to the preferential loss of the gold-bearing fine and /or fracture-fill material, or whether it is evidence for an inherent relationship, contrary to what is generally expected, between lower-grade material and strongly fractured (post-mineral?) core intervals. The data do suggest that, if present, this grade loss is limited to a small sample population and would not have a significant impact on the resource estimate.
Figure 10-5 has the same format as the previous figures, but RQD replaces the core recovery data, thereby showing the relationship between rock quality and gold grade. (As indicated in Section 10.5, the 2011 RQD data are still being assembled, so the RQD discussion is limited to the data available as of July 2011.) The “Count” line clearly indicates the very low RQD values prevalent within the deposit, with the greatest number of intervals having RQD values within the 0 to 10 percent RQD bin. The gold grades show a little more variation than in Figure 10-2, with a pronounced increase in grade below 90 percent RQD (though confidence in this change is tempered by the very small number of data points having greater than 80 percent RQD). Gold grades drop about 10 percent at RQD values below 70 percent, and then remain relatively flat for all lower RQD values.
| | |
| November 2012 | Shahuindo Project | 114 |
| |
|
MINE DEVELOPMENT ASSOCIATES |
| |
| Figure 10-5 | RQD and Gold Grades |
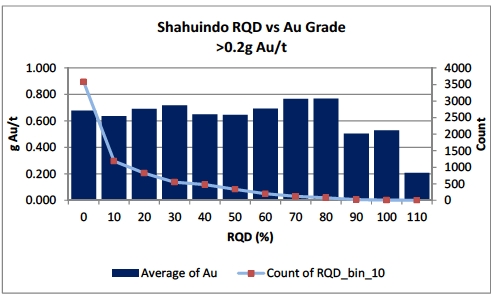
| 10.7 | Comparison of Core and Reverse Circulation Drilling |
AMEC, in 2010, reported that no statistically significant sampling bias exists between the RC drilling and diamond drilling (Wrightet al., 2010b). AMEC had compared both paired-sample plots for RC-diamond drill sample pairs within 5 meters and 10 meters and Q-Q plots of RC versus diamond drill assays (Wrightet al.,2010b).
MDA completed an analysis of the core and RC data using the current drill database and came to a similar conclusion as the AMEC studies. Both the comparative statistics (Table 10-2) and the quantile distribution plots (Figure 10-6) of drill data from within the mineral resource boundary indicate little to no global difference between the core and RC data. The average gold values are very similar, though there is slightly more variation within the core versus the RC data, as indicated by the higher standard deviation (Std.Dev.) and coefficient of variation (CV) values.
| |
| Table 10-2 | Core and RC Gold Analyses |
| | | | | | | |
| | Count | Mean | Median | Std.Dev. | CV | Min. | Max. |
| Core | 28521 | 0.492 | 0.225 | 1.241 | 2.535 | 0.000 | 50.900 |
| RC | 19790 | 0.460 | 0.235 | 1.040 | 2.261 | 0.000 | 44.300 |
| | |
| November 2012 | Shahuindo Project | 115 |
| |
|
MINE DEVELOPMENT ASSOCIATES |
| |
| Figure 10-6 | Quantile Plot of Core and RC Assays |

MDA also completed a paired-sample comparison of core and RC samples to evaluate localized differences in gold grade between sample types. Using the core sample as the control, the paired study searched for the closest RC sample within a 5-meter maximum search distance. As was indicated in the AMEC paired-sample study, the results show a poor correlation between individual pairs as shown in Figure 10-7.
| | |
| November 2012 | Shahuindo Project | 116 |
| |
|
MINE DEVELOPMENT ASSOCIATES |
| |
| Figure 10-7 | Core and RC Sample Pairs – 5 meter search |
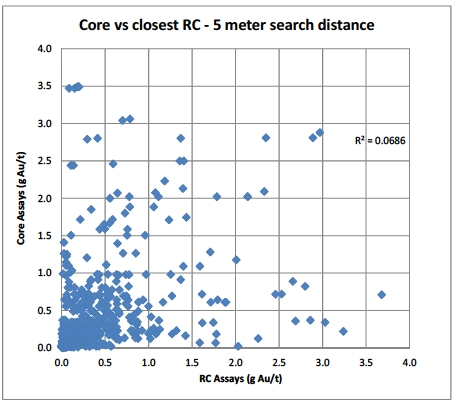
An analysis of the sample-pair populations, using only sample pairs with mean values greater than 0.2 g Au/t (Table 10-3), indicates the high variability in gold grade between the sample pairs, as shown in the absolute value of the relative difference between pairs in the last two columns. The data also indicate a grade difference between the sample pairs, with the RC sample grades on average higher grade than the core. The mean grade of the RC sample-pair population is 18 percent higher than the mean grade of the core population. The relative difference values for the individual sample pairs also indicate higher RC gold grades, with average mean and median relative difference values of 23 percent and 12 percent, respectively.
| |
| Table 10-3 | Pairs Analyses - Core and Closest RC Sample |
| | | | | | | |
| # of Pairs | Mean Grade (g Au/t) | Pairs Relative Diff.* | Pairs Abs. Rel. Diff.* |
| >0.2 g Au/t | Core | RC | Diff. % | Mean | Median | Mean | Median |
| 392 | 0.663 | 0.781 | 18% | 23% | 12% | 179% | 104% |
| * | Individual sample pair differences values capped at +/-500%. |
| | | |
| November 2012 | Shahuindo Project | 117 |
| |
|
MINE DEVELOPMENT ASSOCIATES |
The difference in gold grade between the core and RC sample pairs reflects a potential bias in the drilling and sampling methods. It is not known whether the RC sampling is biased high due to the preferential recovery of higher-grade material, or conversely whether the lower gold grades in the core reflect a loss of gold-bearing material due to decreasing core recovery. As discussed in Section 10.6, the core recovery data show some support for the latter idea. If the core gold grades are biased low, this would impart a conservative aspect to the current resource estimate.
MDA believes that both the RC sampling and the diamond drill core sampling conducted on the Shahuindo property are reliable methods to develop an assay database and that the core and RC results are acceptable for use in mineral resource estimation.
Drill spacing is about 50 meters by 50 meters throughout all four resource zones (West, Central, East, and Moyan Alto zones). Drill spacing is wider in the areas outside the resource boundary.
The longest hole drilled on the property is SHD11-257, which was drilled to 616.6 meters depth in order to test deeper stratigraphy. In general, holes were drilled to test oxide mineralization and were shorter, averaging approximately 175 meters.
The majority of drill holes have been collared at azimuths around 35 degrees or 215 degrees to intersect the main structural trend of the deposit at a high angle. In the East Zone and other exploration targets away from the main mineralized zone, holes are drilled at a variety of azimuths to attempt to intersect local structural features at high angles or due to topographic restrictions on drill-site locations.
Approximately 25 vertical drill holes were drilled in the 1992 to 1998 drill programs by Atimmsa, Asarco, and Southern Peru. Approximately 175 core and RC drill holes have been drilled at minus 45 degrees inclination; remaining holes have been drilled at between minus 45 degrees and minus 90 degrees.
The relationship between true widths, drill intercepts, lithologies, and gold grades for drill-hole intervals is shown on cross-sections within Figure 14-2 through Figure 14-4 in Section 14.0 of this report.
Sulliden’s 2010-2011 drill program consisted of step-out drilling from existing mineralized holes along the strike length of the resource along the Central Corridor and also followed
| | |
| November 2012 | Shahuindo Project | 118 |
| |
|
MINE DEVELOPMENT ASSOCIATES |
up previously defined geochemical anomalies. In addition, some infill drilling was completed. Drill activities continued into 2012 past the December 31, 2011 drill cut-off used for this Technical Report.
Selected drill intercepts are summarized in Table 10-4 and are illustrative of the nature of the mineralization within the area of the resource. The selected drill holes contain oxide and sulfide intersections and areas of higher grade in lower-grade intervals.
| |
| Table 10-4 | Drill Hole Intercept Summary Table |
| | | | | | |
| Hole | From | To | Length | Au | Ag |
| | (m) | (m) | (m) | (g/t) | (g/t) |
| | | Diamond Drill Holes | | |
| DDH-9406 | 21.6 | 150.0 | 128.4 | 0.72 | 9.2 |
| DDH-9519 | 0.0 | 116.0 | 116.0 | 0.68 | 3.6 |
| DDH-9658 | 0.0 | 172.0 | 172.0 | 1.02 | 10.3 |
| DDH-9803 | 34.0 | 134.8 | 100.8 | 0.61 | 82.7 |
| SH03-08 | 37.0 | 102.4 | 65.4 | 1.49 | 158.6 |
| SH04-59 | 96.3 | 164.2 | 67.9 | 0.59 | 23.5 |
| SH09-99 | 17.2 | 147.0 | 129.8 | 0.52 | 6.5 |
| SH10-143 | 39.0 | 158.1 | 119.1 | 0.94 | 53.8 |
| SH11-189 | 93.0 | 118.9 | 25.9 | 0.70 | 5.1 |
| | | Reverse Circulation Holes | | |
| RDH-9204 | 0.0 | 30.0 | 30.0 | 0.86 | 5.7 |
| RCD-9610 | 66.0 | 108.0 | 42.0 | 0.82 | 7.8 |
| RC-9707 | 0.0 | 72.0 | 72.0 | 0.71 | 10.2 |
| RC-9864 | 12.0 | 110.0 | 98.0 | 0.46 | 9.4 |
| RSH09-03 | 55.5 | 225.0 | 169.5 | 0.63 | 6.9 |
| RSH10-92 | 52.5 | 168.0 | 115.5 | 0.54 | 2.3 |
| RSH11-165 | 49.5 | 73.5 | 24.0 | 1.64 | 5.6 |
| | |
| November 2012 | Shahuindo Project | 119 |
| |
|
MINE DEVELOPMENT ASSOCIATES |
| 11.0 | SAMPLE PREPARATION, ANALYSIS AND SECURITY |
The information presented in this section concerning pre-2010 sampling and analysis has been largely based on the AMEC PEA report dated February 19, 2010 (Wright et al., 2010b), with additional information as cited and with updated drilling information provided by Sulliden.
| 11.1.1 | Diamond Drill Core Sampling |
Asarco’s core samples were split lengthwise using a standard manual Longyear-type splitter. MDA has no further information on Asarco’s sampling procedures.
In 1998, Southern Peru drilled 18 core holes. MDA has no details about their sampling procedures.
Since 2003, Sulliden’s core holes are usually sampled from collar to toe. Competent core is split lengthwise with a rotary saw with a diamond carbide blade. Disaggregated core is sampled using a spatula to take half of the sample. Sample lengths are typically 1.5 meters but are reduced to break samples at lithological contacts or changes in oxidation state. Where core is completely disaggregated, sample lengths are changed to coincide with drill runs to minimize mixing between samples of different core recoveries.
| 11.1.2 | Reverse Circulation Chip Sampling |
MDA has no information on sampling procedures for the 1992 Atimmsa drill program.
Fletcher (1997) mentions that during the Asarco RC drill campaigns, drilling was mostly dry and with good recovery. RC samples were collected and bagged on-site, and samples were split through a standard Jones-type riffle splitter multiple times down to a three- to four-kilogram sample for shipment to the sample preparation facility.
In 1998, Southern Peru drilled 80 RC holes. Sample length was set at 2 meters. MDA has no other details about their sampling.
For Sulliden’s 2009, 2010, and 2011 RC drilling campaigns, the sample interval was 1.5 meters. Different drilling and sampling procedures were used for dry versus wet ground
| | |
| November 2012 | Shahuindo Project | 120 |
| |
|
MINE DEVELOPMENT ASSOCIATES |
as described below. Drilling in dry ground was preferred, and over 80% of the meterage was drilled dry.
Drilling in dry ground. In most cases, a 5¼-inch TRC545 frontal recuperation hammer drill was used with pressurized air. In exceptional cases, a conventional 5¼-inch SD5 hammer was used based on ground conditions. Samples were reduced using a riffle splitter. The reject (70%) was retained for check-assay sampling. Samples were collected in polyethylene bags and were identified with the corresponding sample number. Each sample was sealed after inserting the laboratory tag number.
Drilling in wet ground. When intersecting ground water, argillaceous material in contact with water, or heavily fractured ground, pressurized air with minimal water was used with a conventional 5¼-inch SD5 hammer. Alternatively, a tricone bit was used where the recovery of cuttings was poor. A gyratory splitter was used to reduce sample size to a 30/70 split. Samples were collected with filter bags in truncated buckets in order to avoid spills or contamination.
A double-bagging system was incorporated for samples to be forwarded to the lab. A cloth bag with low filtration capacity was used inside a micro-porous cloth bag with high filtration capacity. If the bags were filled to capacity, both were tied-off separately, tagged, left for filtering, and dried prior to transportation to the primary assay laboratory. The rejects were received in a cloth bag and left for filtering and drying prior to being bagged in a polyethylene bag, tagged, and stored. Where reject samples were too large for a single bag, more than one sample was often obtained. The resulting additional bags filled with the corresponding samples and water from the same drilled interval were filtered and dried before being combined in one polyethylene bag, which was then identified and stored.
An effort was made at all times to extract samples of the largest quantity and in the best condition possible. All the sample and check sample bags were identified and marked using indelible ink. In addition, a ticket with the corresponding sample number was stapled to the bag before being sent to the laboratory.
Sulliden maintains two secure core-storage facilities in the city of Cajamarca. Work to centralize the storage of all existing core at the facilities in Cajamarca was completed in 2009. Since 2009, all exploration core generated on the project has been being sent to Cajamarca for storage.
| | |
| November 2012 | Shahuindo Project | 121 |
| |
|
MINE DEVELOPMENT ASSOCIATES |
Archived drill core is stored in wooden and corrugated plastic boxes under cover at the core-storage facilities. Core boxes are in racks and stacked by hole number.
RC and laboratory coarse rejects and pulps are stored at the project site in a secure metal building. Coarse rejects are stored in labeled plastic bags and organized by hole and campaign. Pulps are stored in envelopes in cardboard boxes.
Stored coarse rejects and pulps are in varying condition. Some materials from previous operators have been reorganized and transferred to new plastic bags by Sulliden to prolong their useful life and make locating individual samples more convenient. An inventory of project materials including certificates, core, coarse rejects, and pulps was compiled in 2009.
| 11.2 | Sample Preparation and Analysis |
MDA has limited information about sample preparation and analyses for the drill programs prior to Sulliden’s.
Atimmsa used SGS as their primary laboratory for their 1992 drilling. MDA has no further details.
During Asarco’s drill programs, all drill-hole samples were analyzed for gold and silver by one-assay-ton fire assay. Asarco used SGS to analyze their 1994 samples. For their 1995 drilling, Asarco used Skyline Laboratories, Inc. (Skyline), SGS, CIMM Peru S.A. (CIMM), and Actlabs, Inc. (Actlabs). For Asarco’s 1996 drilling, SGS was the primary lab. SGS, Skyline and Actlabs are currently ISO/IEC 17025 certified, but MDA has no way to determine laboratory certification at the time of Asarco’s work.
MDA has no details about sample preparation or analysis for Southern Peru’s drilling. Assay certificates from the 1997 and 1998 campaigns show that samples were analyzed by CIMM in Lima for gold and silver plus copper, lead, zinc, molybdenum, arsenic, bismuth, antimony, and mercury (Wright et al., 2010b). Southern Peru also re-assayed five drill holes from Asarco’s 1994 drilling at CIMM in Lima.
Since 2003, Sulliden’s sampling and sample dispatch for the Shahuindo Project have been carried out under the supervision of Sulliden staff. Samples are sent to ALS Minerals (ALS; formerly known as ALS Chemex) in Lima for sample preparation and analysis. Certificates are issued by ALS digitally and on paper. The ALS laboratory in Lima is ISO 9001:2008 and ISO 17025:2005 certified.
| | |
| November 2012 | Shahuindo Project | 122 |
| |
|
MINE DEVELOPMENT ASSOCIATES |
Samples are received at ALS, entered into the laboratory information management system, and weighed. Samples are dried and crushed to 70 percent passing plus two millimeters. Crushed samples are split with a riffle splitter to obtain 250-gram sub-samples. The sub-sample is pulverized using a ring mill to 85 percent passing 75 micrometers.
Since 2003, gold has been assayed with a 50-gram fire assay (FA) with atomic absorption (AA) finish (ALS method Au AA24). For samples with greater than 10 grams per tonne gold in the initial FA-AA assay, the fire assay is repeated using a gravimetric finish (ALS method Au GRA22).
In 2003 and 2004, silver was assayed from a 5-gram split, which was digested by aqua regia and read by AA (ALS method AA47); ALS method AA46 was used for samples with assay values exceeding 100 g Ag/t (Saucier and Poulin, 2004; Saucier and Buchanan, 2005). Since 2007, a separate split was taken and digested in aqua regia for analysis with inductively coupled plasma atomic emission spectroscopy (ICP-AES) to determine 31 major and trace elements including silver, copper, arsenic, bismuth, and antimony (Wright et al., 2010b). For samples having greater than 100 g Ag/t, a silver assay was carried out from another 5-gram split, which was digested in aqua regia and read by AA. For samples having greater than 1,000 g Ag/t, silver was assayed by a 50-gram fire assay and a gravimetric finish. Mercury was analyzed with the cold vapor/AA method.
For the 2003 drilling, a total of 2,435 samples were assayed for gold, and pulps for each gold sample above 0.3 g Au/t in mineralized zones were re-assayed for silver (Saucier and Poulin, 2004). Starting with the 2004 drilling, silver was assayed for all mineralized intersections (Saucier and Buchanan, 2005).
For soil samples and some surface rock assays, a suite of elements including silver, arsenic, bismuth, copper, lead, antimony, and zinc was analyzed by ICP-AES and cold vapor for mercury (Wright et al., 2010b).
| 11.3 | Specific Gravity Determinations |
The Shahuindo Project database contains 1,411 specific gravity measurements. The measurements were completed during various drill campaigns on drill core from throughout the deposit. Samples for measurement have been collected from all significant rock types and from all four deposit zones along the length of the deposit.
| | |
| November 2012 | Shahuindo Project | 123 |
| |
|
MINE DEVELOPMENT ASSOCIATES |
In 2004 and 2005, a total of 89 drill core samples were collected and sent to ALS in Lima for specific gravity determination (Saucier and Poulin, 2004; Saucier and Buchanan, 2005). The analyses were completed on drill core from 49 different core holes from the 1998, 2003, and 2004 drill campaigns. The current database includes just 87 of these determinations due to incomplete information on two samples.
In 2010, an additional 353 core samples were sent to KCA in Reno, Nevada for specific gravity measurements. The KCA measurements were from 12 core holes from Sulliden’s 2009 and 2010 drill campaigns.
In 2011 and 2012, 971 core samples from all core campaigns executed on the project were sent for density determination. Laboratories selected were KCA and ACME in 2011 (580 samples) and ACME and SGS in 2012 (391 samples). The ACME and SGS laboratories are both in Lima, Peru.
MDA has no information on the methods used in the specific gravity determinations conducted by ALS in 2004 and 2005. The 2010, 2011, and 2012 drill-core specific gravity measurements conducted by KCA, ACME, and SGS used the coated immersion/water displacement method.
The specific gravity measurements are from all four deposit zones, although the data are concentrated in the West, Central, and East zones. There are only two density measurements within the westernmost 1,000 meters of the deposit’s strike length and 14 density measurements within the Moyan Alto zone.
See Section 14.5 for a discussion of the specific gravity test results and the assignment of density values into the resource model.
From 2003 through 2009, all drill samples collected on the Shahuindo Project were under direct supervision of Sulliden’s staff up to the moment they were shipped by bus from Cajamarca to the ALS sample preparation facility. Since 2010, samples are shipped directly from the camp to the lab facilities.
Chain of custody procedures consist of filling out sample submittal forms that are sent to the laboratory with sample shipments to make certain that all samples are received by the laboratory.
| | |
| November 2012 | Shahuindo Project | 124 |
| |
|
MINE DEVELOPMENT ASSOCIATES |
| 11.5 | Quality Assurance/Quality Control |
| |
| 11.5.1 | Asarco’s Drilling Program |
According to Saucier and Poulin (2004), Asarco included standards prepared internally by them with every batch of drill samples for most of their drilling, and the standards had highly reproducible gold and silver values. MDA has no details on those standards. According to Fletcher (1997, cited by Saucier and Poulin, 2004), “[The laboratory] generally has very good precision…in their assays, but their results are typically 5-7% low for gold, and 11-15% low for silver relative to the standards. This discrepancy is probably due to matrix effects in the standards which have carbonate content, versus the routine drill samples which have none.”
A total of 1,835 duplicate samples were prepared and sent to a separate laboratory as a check assay. According to Fletcher (1997, cited by Saucier and Poulin, 2004), in general, the check assays validated the original assay values.
MDA cannot verify Fletcher’s (1997) analysis and conclusions about Asarco’s assay data because there is no record of the results for Asarco’s standards or check assays.
| 11.5.2 | Other Drilling Programs Prior to Sulliden |
MDA has no information on quality control or quality assurance (QA/QC) that may have been used by Atimmsa or Southern Peru.
| 11.5.3 | Sulliden’s Drilling Program |
For Sulliden’s 2003 drilling, no blanks, duplicates, or standards were used to check the original assay results. However, 200 pulps taken randomly within the mineralized intervals were sent to SGS for re-assay for gold. These pulps were assayed for gold by fire assay with AA finish, with gravimetric finish for gold grades over 5 g/t. Silver was assayed by multi-acid digestion with an AA finish. Saucier and Poulin (2004) reported that there was a “good correlation” between the original and check assays.
No blanks, site duplicates, or standards were used to check the results of Sulliden’s original assays from their 2004 drill program (Saucier and Buchanan, 2005). However, 355 pulps were randomly selected from within mineralized intervals by Sulliden’s geologists and sent to Actlabs in Lima for check assaying for gold and silver. Saucier
| | |
| November 2012 | Shahuindo Project | 125 |
| |
|
MINE DEVELOPMENT ASSOCIATES |
and Buchanan (2005) reported that “a fairly good correlation could be found between the original values and the reanalysis.”
AMEC reported that except for the reject check program in 2003 and 2004, Sulliden did not apply QA/QC procedures until their 2009 drill program (Wright et al., 2010b). In 2009, Sulliden instituted analysis of commercially prepared standard reference materials, fine blanks, field duplicates for RC drilling, core duplicates for diamond drilling, and coarse-crush reject and pulp duplicates. The following information for Sulliden’s 2009-2010 drilling programs is summarized from the 2010 AMEC report (Wright et al., 2010b), to which the reader is referred for additional detail.
For the first stage of their 2009-2010 core and RC drill programs, Sulliden analyzed 110 RC field duplicates, 38 core duplicates, 99 coarse-crush reject duplicates, and 99 check assays performed at SGS in Lima, in addition to fine blanks and four commercial standards included with sample batches. AMEC concluded that based on analysis of the results of standards and check assays, the accuracy of the gold assays was “excellent,” whereas based on analysis of the check assays, the accuracy of silver assays was not as good as the accuracy of the gold assays (Wright et al., 2010b).
Based on analysis of RC and core field duplicates, AMEC concluded that the sampling precision for gold was acceptable for the resource estimate used for feasibility-level analysis (Wright et al., 2010b). Silver grades were not analyzed for the core and RC field duplicates. Analysis of the gold results of coarse-crush duplicates indicated that sub-sampling precision was better than generally accepted limits. Silver grades of coarse reject duplicates were not assayed.
Analytical precision is generally established by the analysis of pulp duplicates, two splits of the same pulp analyzed during the same time period, with the same analysis method at the same laboratory. No pulp duplicates were analyzed as part of the 2009 Sulliden drill program.
Analysis of 80 blank samples found only two minor issues above “a practical detection limit” of 0.02 g Au/t, and a plot of grade of blanks versus previous sample grade showed no correlation (Wright et al., 2010b).
Sulliden completed a comprehensive QA/QC testing program in 2011 and 2012, which included the analysis of commercially prepared standard reference materials, fine blanks, field duplicates for RC drilling, core duplicates for diamond drilling, and coarse-crush reject and pulp duplicates. The laboratory analyses for the standards, fine blanks,
| | |
| November 2012 | Shahuindo Project | 126 |
| |
|
MINE DEVELOPMENT ASSOCIATES |
RC field duplicates and core duplicates were completed at ALS while the analysis of the pulp duplicates were completed at SGS. MDA’s analysis of Sulliden’s QA/QC data from 2009 through 2012 is in Section12.4.
MDA is of the opinion that the sampling methods, security, and analytical procedures are adequate for mineral resource estimation. The authors are not aware of any sampling or assaying factors that may materially impact the mineral resources discussed in Section 14.0.
A continuing program of specific gravity measurements is recommended due to the importance of bulk-density in the determination of resource tonnage. Combined with more detailed geologic modeling, as discussed in Section 14.5, the additional measurements would bring greater precision to the resource estimate.
Cyanide-soluble gold assays should also be collected to assess the adequacy of the current oxidation logging and to aid in the interpretation of the oxide-mixed-sulfide zones within the model.
| | |
| November 2012 | Shahuindo Project | 127 |
| |
|
MINE DEVELOPMENT ASSOCIATES |
MDA completed an audit of the drill-hole database in preparation for the current mineral resource estimate discussed in Section 14. The 2012 MDA audit follows and serves as a compliment to both the AMEC audit completed in 2009 in preparation for the AMEC 2010 mineral resource estimate and preliminary economic assessment (Wright et al., 2010a and 2010b) and the previous MDA audit completed in 2011 for the 2011 mineral resource estimate (Tietz and Kappes, 2011). Other previous data verification procedures were conducted by Met-Chem in 2003 and 2004 (Saucier and Poulin, 2004; Saucier and Buchanan, 2005).
The current MDA drill-hole database includes all holes that were available to AMEC in 2009 plus the additional holes drilled by Sulliden in 2010 and 2011.
| 12.1 | AMEC 2009 Database Audit and Verification |
The following information comes primarily from the AMEC PEA report dated February 19, 2010 (Wright et al., 2010b), with other references as cited. It is presented to provide the reader a summary of previous data verification work, all of which was in preparation for mineral resource estimates done for Sulliden.
AMEC personnel visited the Shahuindo property and collected 14 samples to verify original assays. The sample suite consisted of core, assay pulp, and surface outcrop and float samples. Comparison to the original assays showed general agreement for both gold and silver, but some pairs were significantly different. Due to the small number of check samples, no inferences about the previous sampling and assaying were made.
Met-Chem reviewed and audited the drill database against available hard-copy drill assay and geologic logs in 2003, while site visits were conducted in 2003 and 2004 (Saucier and Buchanan, 2005). In 2003, a total of 27 samples were taken from split core, and 43 coarse crushed rejects were sent to a secondary laboratory for check assays. [The Met-Chem report does not state the identity of the second lab]. In 2004, Met-Chem took a total of 22 core twin samples from the 2004 drill program and sent them to Actlabs in Lima for confirmatory analysis. The 2003 and 2004 check assays showed minor variation on average with the occasional high variation (>30 percent) between individual samples. On the basis of the confirmatory analyses, Met-Chem found that the drill results were acceptable and that the observed variations would not affect the overall value of the resource estimation (Saucier and Buchanan, 2005).
| | |
| November 2012 | Shahuindo Project | 128 |
| |
|
MINE DEVELOPMENT ASSOCIATES |
AMEC worked with Sulliden in 2009 to ensure that the project mineral resource database was of suitable quality for use in mineral resource estimation and subsequent preliminary economic assessment. Data verification consisted of a database audit, a review of project geology, including core drill-hole logs and interpretations, a site visit in which drill collar locations were field checked and surface geology reviewed, and a check assay program which consisted of 286 analyses of pulp rejects, duplicate pulps, coarse crushed rejects, and field duplicates from reverse circulation cuttings from the 1994-2007 drill programs. As stated in AMEC’s report,
“Principal findings from the data verification are as follows:
The collected sample data collected adequately reflects deposit dimensions, truewidths of mineralization, and the style of deposit.
Drill collar data were verified prior to data entry into the database by checking thesurveyed collar position against the planned collar position.
Validation of down-hole survey data was completed.
AMEC’s and Met-Chem’s independent sampling of outcrop and drill coreintervals, with assaying by an independent laboratory (selected by theconsultants and not previously used on the project) generally confirms the goldand silver grades reported by Sulliden.
Hole locations were confirmed by the AMEC audit and site visits.
The data verification programs undertaken on the data collected from the project support the geological interpretations, and the analytical and database quality. Therefore the collected data can support mineral resource estimation.”
MDA completed an initial audit of the Shahuindo Project drill database in April 2011 in preparation for the 2011 mineral resource estimate. This audit was conducted in three phases, starting with an audit of the pre-2010 data in June 2010, a second audit of the first-half 2010 drilling in November 2010, and the final audit of the remaining 2010 and spring 2011 drilling in April 2011. For the remainder of the 2011 drilling, all of which is included in the current resource estimate, MDA conducted an initial audit in the fall of 2011 and a final audit in March 2012.
The focus of MDA’s various audits was on the drill-hole collar, down-hole survey, and assay data. A rigorous audit of the geology and geotechnical data was not completed, but these data were reviewed for completeness, reasonableness, and often spot-
| | |
| November 2012 | Shahuindo Project | 129 |
| |
|
MINE DEVELOPMENT ASSOCIATES |
checked against the core photos and drill logs in the process of building the geologic model. Any corrections, changes, or additions to the database were communicated to Sulliden immediately after the completion of each audit. The resulting Shahuindo database is considered to be of high quality and can support the resource estimate and classification discussed in Section 14.
The MDA audits were conducted on the digital drill data, provided by Sulliden in “.csv” spreadsheet format, which formed the basis for the Access-format project database used by MDA in the resource modeling and estimation. MDA used pdf copies of drill logs, collar surveys, and assay certificates (for the pre-2010 drilling), drill-core photos, and other data provided by Sulliden to verify the drill data. Original assay certificates downloaded directly by MDA from the ALS laboratory website were used to conduct a complete digital audit of the 2010-2011 drill assay data.
MDA verified approximately 15 percent of the pre-2010 drill data to serve as a confirmation of the AMEC 2009 audit. If any discrepancies were identified, MDA checked additional holes from the same drill campaign.
All of the collar, down-hole survey, and geology data were also checked spatially when plotted on cross-sections and plan view. This 3-D spatial check included plotting and comparing all drill collars against the 2m-contour topographic surface.
As indicated in Section 14, ASARCO drill hole DDH-9517 is not included in the current drill database due to uncertainty in the drill-hole location.
| 12.2.1 | Drill-Collar Audit |
The AMEC audit was verified by checking the hole collars for 53 drill holes against the original VDG collar-coordinate survey data. If survey data were not available, the coordinates were checked against the drill-log coordinates. No errors were found in the Northing and Easting coordinates. No errors were noted in the elevation data when checked against the available digital or hard-copy drill data, although when plotting the drill holes, the hole collars for RSH10-27 and RSH10-35 were significantly above the topography. The elevations for these holes, both located to the south of the central mineralized corridor, were adjusted to match the existing topography.
The 2010 and 2011 Sulliden drill collars were checked against the VDG (2010) and Sulliden (2011) collar survey data. A total of 197 hole collars were verified against the original survey data, while the remaining holes were checked against the drill logs or project digital files. No errors were found in the collar coordinates.
| | |
| November 2012 | Shahuindo Project | 130 |
| |
|
MINE DEVELOPMENT ASSOCIATES |
Minor discrepancies (all <1m) were found in the total drill-depth data for holes DDH-9622, DDH-9658, and SHM10-131. The collar database was changed to reflect the revised drill depths.
| 12.2.2 | Down-Hole Survey Audit |
Approximately 15 percent of the down-hole survey data were checked against the azimuth, dip, and drill-depth information noted on the drill logs. MDA conducted the audit by both randomly selecting drill holes and also by checking all azimuth or dip readings that differed by more than 5 degrees from an adjacent down-hole survey. Changes were made to nine azimuth readings; four were transcription errors, while five readings were considered spurious due to down-hole variations. The latter five were changed after consulting with Sulliden.
No original down-hole survey data (driller’s or surveyor’s notes, field books, or other means of data transcription) were available to MDA, though the database does include the instrument type used to determine the down-hole survey readings. None of the pre-2003 drill holes were surveyed down-hole so the collar orientation was used over the length of the hole. The majority of the 2003 and 2004 Sulliden down-hole surveys were by acid-tube, so no down-hole azimuth reading is available for those drill holes.
The pre-2007 gold and silver assay data were checked against pdf copies of the assay certificates, and no errors were detected after reviewing about 14 percent of the data.
MDA downloaded digital assay data directly from ALS for all of the 2007 through 2011 drilling. A complete audit of the Shahuindo drill-hole assay data was achieved in an automated fashion using a computer script. No significant errors were found. There were a number of errors in converting “less than detection” values to the correct conversion value for use in the database, but these are not considered material to the resource estimate.
| 12.2.4 | Geological Data Audit |
Sulliden provided MDA with lithology, structure-type, structural-orientation (core only), and oxidation data files for all project drill holes. The geology data files were checked for reasonableness, completeness, and consistency in naming convention. A detailed audit was not completed, but many holes were spot-checked against the drill logs and core photos in the course of building the geologic model. MDA’s focus was on the recognition
| | |
| November 2012 | Shahuindo Project | 131 |
| |
|
MINE DEVELOPMENT ASSOCIATES |
of the porphyry and overburden material, since these rock types are important in both localizing mineralization and determining resource model densities. The oxidation data were also spot checked against the drill logs and core photos to aid in creating the oxide model used in determining resource cut-off grades and in classification.
| 12.2.5 | Core Recovery and RQD Data |
MDA reviewed the core recovery and RQD data for completeness and checked for any errors in the interval data and in the calculations of the core recovery and RQD data. Minor changes were made to the data sets, none of which are considered significant to the resource estimate. An analysis of the core recovery and RQD data is presented in Section 14.
| 12.3 | MDA Independent Verification of Mineralization |
| |
Paul Tietz, along with Thomas Dyer (Senior Engineer, MDA) and Peter Ronning (P.Eng., MDA associate) visited the Shahuindo Project on May 4 through 7, 2010. Mr. Tietz conducted two further site visits on September 14 through 18, 2011 and March 8 through 11, 2012. The purpose of the visits was to review the project geology, conduct various aspects of data verification, and determine what data and information were to be provided to MDA for the 2011 and 2012 resource models and associated Technical Reports. In addition, potential mine facility sites to be considered in a proposed feasibility study were reviewed. During all three site visits, Mr. Tietz visited the Cajamarca facility where Sulliden stores much of the drill core and some of the reverse circulation chip trays and sample rejects. Most of the reverse circulation materials have been transferred to the new storage warehouses at the project site.
Data verification procedures conducted by MDA while on site included:
Geology Verification- Comparisons of core and RC chip samples with drill-loggeology, sample intervals, and assay data found no significant discrepancies.MDA also conducted a thorough review of the geology cross-sections preparedby Sulliden and was in agreement with the geologic interpretations.
Drill-Site Verification– In 2010 and 2012, MDA used a hand-held GPS to checkthe locations of a total of 47 drill sites accounting for 49 drill holes. The hand-held GPS cannot achieve survey-level accuracy, but it serves to verify that ingeneral terms drill holes are where the database indicates they should be. MDAdid not identify any discrepancies in the locations of drill holes.
| | |
| November 2012 | Shahuindo Project | 132 |
| |
|
MINE DEVELOPMENT ASSOCIATES |
2010 Mineralization Verification- MDA, with the assistance of Sullidenemployees, collected five continuous chip samples of varying lengths frommineralized outcrops and trenches. MDA also collected six quarter-core samplesfrom six different drill holes stored in Sulliden’s Cajamarca warehouse. Thesamples were sent directly to the ALS lab in Lima, Peru. The purpose of MDA’ssampling was solely to confirm the presence of gold in concentrations of similartenor to those reported by Sulliden. The results of the rock chip sampling areshown in Table 12-1, while the quarter-core results, along with the originalSulliden gold and silver values, are shown in Table 12-2.
| |
| Table 12-1 | MDA 2010 Verification Sampling – Rock Chip |
| | | | |
| MDA Sample ID | Gold (g Au/t) | Silver (g Ag/t) | Location | Rock Type |
| MDA-01 | 0.239 | 1.1 | Far West | Porphyry |
| MDA-02 | 0.543 | 0.7 | Far West | Silstone-porphyry contact |
| MDA-03 | 1.965 | 1.5 | Far West | Silstone-porphyry contact |
| MDA-04 | 12.3 | 394 | East | Silicified quartzite |
| MDA-05 | 12.3 | 256 | East | Silicified quartzite |
| | |
| November 2012 | Shahuindo Project | 133 |
| |
|
MINE DEVELOPMENT ASSOCIATES |
| |
| Table 12-2 | MDA 2010 Verification Sampling – Core |
| | | | | | | |
| MDA Sample ID | Hole ID | From | To | Gold (g Au/t) | Silver (g Ag/t) |
| Original | MDA | Original | MDA |
| MDA-06 | SH09-101 | 66.0 | 67.5 | 0.972 | 0.774 | 1.1 | 1.6 |
| MDA-07 | SH04-75 | 51.0 | 52.5 | 0.352 | 0.425 | 2.0 | 3.1 |
| MDA-08 | SH04-33 | 45.0 | 46.1 | 0.550 | 0.366 | 3.0 | 7.6 |
| MDA-09 | SH03-07 | 42.0 | 43.5 | 0.271 | 0.402 | 2.0 | 2.7 |
| MDA-10 | DDH-9540 | 26.0 | 28.0 | 0.352 | 0.466 | 5.4 | 4.5 |
| MDA-11 | DDH-9806 | 16.0 | 18.0 | 0.250 | 0.210 | 0.7 | 0.5 |
MDA had no significant concerns with the status of the drill-hole database or general geologic knowledge as they pertained to the development of a gold and silver mineral model(s) and the resulting resource estimate.
| 12.4 | MDA Analyses of QA/QC Data |
The Shahuindo database contains QA/QC data that include analyses of standards, blanks, and various types of duplicates. All of the data described herein date from 2010 through 2011, and the discussions in these sections apply only to that time period. ALS was the primary lab used by Sulliden during this time period, and unless otherwise noted, all QA/QC analyses discussed below were conducted by ALS.
Previous QA/QC work was conducted by ASARCO and in 2003 and 2004 by Sulliden. This work is discussed in Section 11.5. None of the ASARCO or pre-2009 Sulliden QA/QC analyses are available to MDA. Limited QA/QC analyses were completed by Sulliden in 2009. The 2009 results were presented in summary fashion in the 2010 AMEC report (Wright et al., 2010b) and discussed briefly in the 2011 MDA report (Tietz and Kappes, 2011). MDA is showing just a representative sampling of the 2010 through 2011 QA/QC results to provide the reader a general picture of the analytical procedures, results, and interpretations.
Sulliden provided MDA with the results of analyses of standards that were included in shipments of samples to the primary lab. Five separate standards were inserted a total of 2,599 times. All of the standards were prepared, characterized, and certified for Sulliden by SGS del Perú S.A.C. (SGS). The identifiers for the standards, their expected values, and the number of times each was inserted into the sample stream.
| | |
| November 2012 | Shahuindo Project | 134 |
| |
|
MINE DEVELOPMENT ASSOCIATES |
Sulliden prepared control charts for each standard, similar to the commonly-used Shewhart charts. Figure 12-1 for standard ST1100006 is presented as an example. MDA modified Sulliden’s chart to fit the present page format, but the figure is substantially the work of Sulliden.
Table 12-3 summarizes the results obtained for each of the standards.
| |
| Figure 12-1 | Control Chart for ST1100006 |
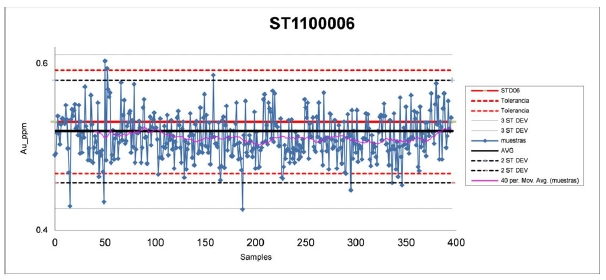
| Notes: | Red lines indicate the expected value and control limits specified by the supplier of the standard. |
| | The solid black line represents the average of the analyses obtained by Sulliden; the dashed black lines represent the average ± 2 standard deviations, and the dotted black lines represent the average ± 3 standard deviations. |
| | Results are plotted in order by the date of the analytical certificate on which they appear. |
| | |
| November 2012 | Shahuindo Project | 135 |
| |
|
MINE DEVELOPMENT ASSOCIATES |
| |
| Table 12-3 | Summary of Results Obtained for Standards |
| | | | | | | | | |
| | Au ppm | Count of | Bias | Bias | Failure Counts by Spec | Failure Counts by Data |
| ID | Expected | Insertions | Percent | Significant? | High | Low | High | Low |
| ST900037 | 0.297 | 433 | -5.5 | Yes | 0 | 1 | 1 | 2 |
| ST900038 | 1.028 | 457 | -4.1 | Yes | 0 | 0 | 6 | 0 |
| ST1000054 | 0.794 | 659 | -2.8 | No | 0 | 0 | 2 | 1 |
| ST1100006 | 0.530 | 396 | -3.4 | Yes | 2 | 13 | 2 | 2 |
| ST1100005 | 0.485 | 532 | -7.4 | yes | 0 | 157 | 1 | 1 |
| | |
| Notes: | “Bias” is calculated as | 100*(average obtained - expected value)
expected value |
| |
| | A bias is considered “Significant” if the average obtained in Sulliden’s analyses falls outside the 95% confidence limits for the mean value, determined using the supplier’s round-robin analyses. It is only an indication as to whether the bias is significant in terms of statistical mathematics, not a judgment as to the effect of the bias on the resource estimate. |
| | “Failure Counts by Spec” list the number of high and low failures determined using the supplier’s specification for the standard. |
| | “Failure Counts by Data” list the number of high and low failures where a failure is considered to be an analysis falling outside the mean ± 3 standard deviations, using the statistics of the analyses obtained by Sulliden. |
In Table 12-3 it is evident that the results obtained by Sulliden for the standards are all biased low compared to the expected values determined by the supplier, SGS. In four out of five cases for the complete data sets, the low bias is considered “significant,” according to the criteria described in the notes to the table.
MDA has no information as to whether Sulliden followed up any of the failures in analyzing standards. However, the number of failures is few, relative to the large number of analyses of the standards. Overall the analyses of standards suggest that Sulliden’s gold analyses may be, in aggregate, very slightly conservative.
The QA/QC data set provided to MDA by Sulliden includes results for 1,843 analyses of gold in three different blanks. The blanks are labeled ST1100007, ST900026, and ST1000053. They were prepared and certified for Sulliden by SGS.
For each of the blanks, Sulliden prepared charts similar to the example shown in Figure 12-2. Additionally, for two of the blanks, ST1100007 and ST1000053, MDA charted the analyses of blanks vs. the analyses of immediately preceding samples on the same
| | |
| November 2012 | Shahuindo Project | 136 |
| |
|
MINE DEVELOPMENT ASSOCIATES |
certificates, to look for evidence of contamination from high-grade samples in the lab. The comparison chart for ST1100007 appears in Figure 12-3 as an example.
| |
| Figure 12-2 | Results for Blank ST1100007 |
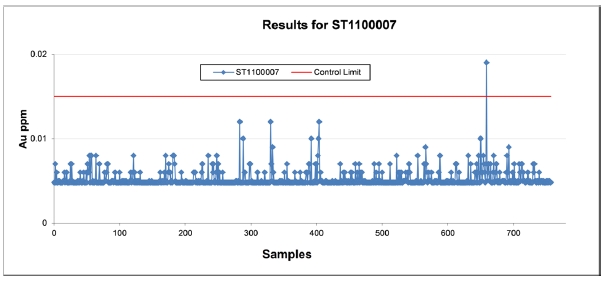
| Note: | Chart prepared by Sulliden, and modified by MDA to fit this page format. |
| | “Control Limit” is arbitrarily set at three times the detection limit of 0.005 ppm Au. |
| | |
| November 2012 | Shahuindo Project | 137 |
| |
|
MINE DEVELOPMENT ASSOCIATES |
| |
| Figure 12-3 | Gold in Blank ST1100007 vs. Preceding Sample |
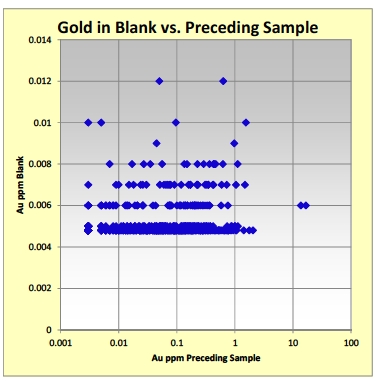
| |
| Note: | Scale on x-axis is logarithmic for legibility. |
The blanks used by Sulliden have expected grades that SGS determined to be at or below the detection limit for gold, 0.005 ppm Au. Consequently, control limits defined using statistical parameters cannot be rigorously established. One common convention is to use some low multiple of the detection limit as an arbitrary detection limit. On Figure 12-2, MDA has added a “control limit” of three times the detection limit. Using this criterion, of the 1,843 analyses of blank material, only two count as failures. If the arbitrary control limit were to be increased to four times the detection limit, none of the analyses would qualify as failures.
Figure 12-3 and the corresponding chart for ST1000053 show no indication that the analyses of blanks are influenced by the grades of preceding samples.
The large number of analyses of blanks in the Sulliden data set does not reveal any causes for concern.
| | |
| November 2012 | Shahuindo Project | 138 |
| |
|
MINE DEVELOPMENT ASSOCIATES |
Analyses are available for four types of duplicates: core duplicates, RC duplicates, coarse reject duplicates, and pulp duplicates. For the first three types, both the original samples and the duplicates were analyzed at the primary lab, ALS. The pulp duplicates were analyzed at ALS, and then the pulps that ALS had prepared were sent to SGS for check analyses.
MDA’s review of the QA/QC data included a determination of the relative percent difference between original/duplicate analytical pairs, which measures analytical and/or sampling bias, and the absolute value of the relative difference between pairs, which is a measure of sample variability. It would be expected that pulp duplicates would show the least variability. The RC rig and quarter-core duplicates test the reproducibility and bias for the entire sampling system thereby showing total sampling variance.
Descriptions of the duplicates collected during the 2011-2012 program are summarized in Table 12-4 below.
| |
| Table 12-4 | Summary of Types of Duplicates |
| |
| Type of Duplicate | Description |
| Core duplicate | The original sample is a half-core cut. The duplicate is a quarter-core cut from the half core remaining in the box. |
| RC duplicates (dry) | Dry RC samples were split using a Jones riffle splitter. The original sample represents 30% of the cuttings. The duplicate sample is a quarter split from the rejects collected from the opposite side of the splitter. More than 80% of the RC samples were dry. |
| RC duplicates (wet) | Wet RC samples were split using a rotary splitter. The original sample is 30% and the duplicate is a quarter split of the reject from the other side of the splitter. |
Coarse reject duplicate
(preparation duplicate) | These were duplicates prepared and analyzed at the primary lab, ALS. A second split was taken from the coarse reject material, crushed, pulverized, and analyzed in the same way as the original split. |
Pulp duplicate
(check analysis) | The original pulp prepared by ALS was sent to SGS, who analyzed it for gold using their nearest equivalent procedure to ALS. |
For each type of duplicate, MDA prepared scatterplots and relative percent difference charts. Figure 12-4 through Figure 12-7 are the charts for the pulp duplicates or check analyses, shown here as examples of the types of charts done for all four types of duplicates.
| | |
| November 2012 | Shahuindo Project | 139 |
| |
|
MINE DEVELOPMENT ASSOCIATES |
| |
| Figure 12-4 | Gold Pulp Check Analysis vs. Original |
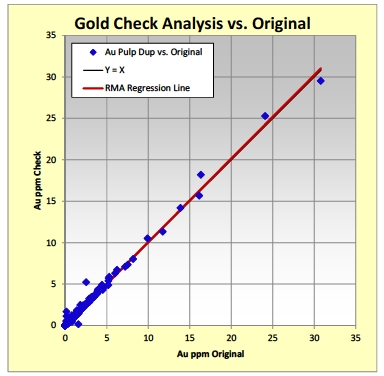
| |
| Notes: | RMA regression equation isy = 0.008 + 1.015x |
| (y = duplicate assay; x = original assay) |
| | |
| November 2012 | Shahuindo Project | 140 |
| |
|
MINE DEVELOPMENT ASSOCIATES |
| |
| Figure 12-5 | Gold Pulp Check Analyses - Relative Percent Difference |
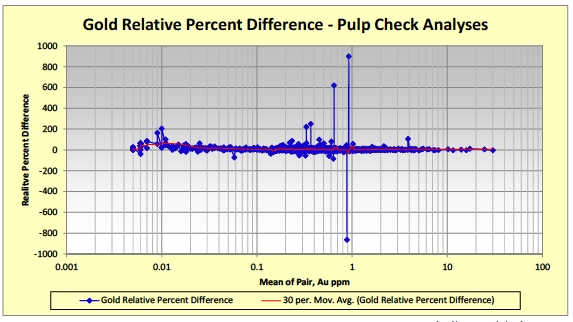
| | | | |
| Notes: | Relative Percent Difference is calculated as: | 100 * | duplicate-original | |
| | | | lesser of (duplicate,original). | |
| | This yields a “worst case” relative percent difference, useful for highlighting extreme differences. |
| | The scale on the x axis is logarithmic for legibility. |
| |
| Figure 12-6 | Gold Pulp Check Analyses – Absolute Value of Relative Percent Difference |
| | |
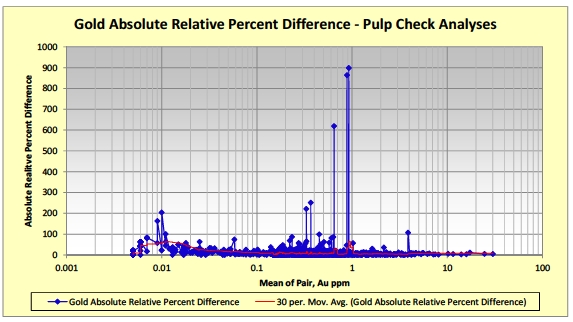
| | |
| November 2012 | Shahuindo Project | 141 |
| |
|
MINE DEVELOPMENT ASSOCIATES |
It is evident in Figure 12-5 and Figure 12-6 that some extreme differences exist between the original and check assays on pulps. MDA has no explanation for the extreme differences; they could be due to record-keeping errors, real analytical differences, or some unknown cause. Sulliden and MDA suspect that they are due to record-keeping errors.
The extreme differences apparent in Figure 12-5 and Figure 12-6 are outliers that obscure the underlying relationship between the original and duplicate assays. In order to see the underlying relationship, MDA applied a filter, removing all pairs in which either analysis is at or below 0.005 ppm Au (the lower detection limit), and removing all cases where the relative percent difference exceeds 100 %. This produces the relative percent difference chart in Figure 12-7, without the unlikely extreme values that distort Figure 12-5.
| |
| Figure 12-7 | Gold Pulp Check Analyses - Relative Percent Difference (Filtered) |
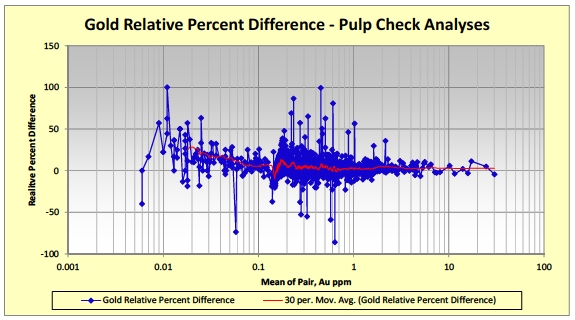
MDA prepared charts and evaluated the analytical results for all four data sets of duplicates, using both the complete data sets and filtered data sets. The results are summarized in Table 12-5.
| | |
| November 2012 | Shahuindo Project | 142 |
| |
|
MINE DEVELOPMENT ASSOCIATES |
| |
| Table 12-5 | Summary of Duplicate Results |
| | | | | | | | |
| Unfiltered Data |
| | | Grade Averages, Au ppm | Relative Difference
Averages, percent | |
| Material Type | Count | Au Original | Au Dup | Au MOP | Au Diff | Rel Diff | Abs Rel Diff | Filter Description |
| Core duplicates | 1,881 | 0.408 | 0.421 | 0.415 | 0.013 | 9.4 | 32.4 | all data |
| RC duplicates | 1,253 | 0.353 | 0.357 | 0.356 | 0.004 | 16.7 | 27.2 | all data |
| Coarse rejects | 2,522 | 0.446 | 0.451 | 0.449 | 0.004 | 0.2 | 11.1 | all data |
| Pulp duplicates | 2,541 | 0.446 | 0.461 | 0.454 | 0.015 | 5.3 | 8.2 | all data |
| Filtered Data |
| | | Grade Averages, Au ppm | Relative Difference
Averages, percent | |
| Material Type | Count | Au Original | Au Dup | Au MOP | Au Diff | Rel Diff | Abs Rel Diff | Filter Description |
| Core duplicates | 1,696 | 0.448 | 0.463 | 0.455 | 0.015 | 4.5 | 25.5 | both Au > 0.005 and abs value of
relative pct difference <= 500% |
| RC duplicates | 1,148 | 0.383 | 0.388 | 0.386 | 0.005 | 2.6 | 13.2 | both Au > 0.005 and abs value of
relative pct difference <= 500% |
| Coarse rejects | 2,360 | 0.477 | 0.481 | 0.479 | 0.005 | 1.7 | 8.3 | both Au > 0.005 and abs value of
relative pct difference <= 500% |
| Pulp duplicates | 2,325 | 0.485 | 0.499 | 0.492 | 0.014 | 4.2 | 6.8 | both Au > 0.005 and abs value of
relative pct difference <= 100% |
| | | |
| Notes: | Except for those in the “Count” column, all numbers represent the arithmetic average for the data set. |
| | Relative Percent Difference is calculated as:100 * | duplicate-original | This yields a “worst case” relative percent difference, useful for highlighting extreme differences. |
| | | lessor of (duplicate,original). | |
| | |
| November 2012 | Shahuindo Project | 143 |
| |
|
MINE DEVELOPMENT ASSOCIATES |
MDA believes that the results in Table 12-5 for the unfiltered data include outliers that distort the statistical relationships between the pairs of duplicate sample sets. The reasons for the existence of the outliers are not known with certainty, but Sulliden and MDA suspect that many of the apparent outliers are due to record-keeping errors.
The results for the filtered data in Table 12-5 probably represent the relationships between the original analyses and the duplicates better than those for the unfiltered data. In all cases for the filtered data, the average differences and average relative differences fall in ranges that MDA considers acceptable. As expected, the core duplicates, which incorporate natural geological variability, show the greatest average differences and relative differences. RC field duplicates show, on average, smaller differences, and coarse reject duplicate differences are smaller still.
The pulp duplicate average differences and average relative differences are almost as great as those for core duplicates. This would be surprising had the pulp duplicates been run at the same lab. The pulp duplicate analyses are check analyses done at a second lab, so the differences reflect a bias between the primary lab (ALS) and the second check lab (SGS). The degree of bias between the two labs is not unusual, so MDA considers the check analyses to corroborate the original analyses.
While the average differences between the pulp duplicates are similar to the average differences between the core duplicates, the dispersion, spread, or range of the differences (not shown in Table 12-5) is much greater in the core duplicates, as would be expected.
MDA considers that, some outliers notwithstanding, the results from the several types of duplicate samples reveal no issues that preclude the use of the original assays for resource estimation.
| 12.5 | Summary Statement on Data Verification |
The authors are of the opinion that the data verification procedures support the geologic interpretations and confirm the database quality. Therefore, the Shahuindo database is adequate for use in estimating and classifying a Mineral Resource. Principal findings from the data verification are:
The collar, down-hole survey, and assay databases are of high quality with onlyminor errors noted and corrected.
The drill data support the geologic interpretations and style of mineralization usedin the resource model.
| | |
| November 2012 | Shahuindo Project | 144 |
| |
|
MINE DEVELOPMENT ASSOCIATES |
The QA/QC data indicate that the assay data are sufficiently accurate for use inMineral Resource estimation, although the observed low bias in the ALS assaystandard sample and pulp duplicate results, as compared to the SGS values,indicates a possible conservatism in the estimate.
| | |
| November 2012 | Shahuindo Project | 145 |
| |
|
MINE DEVELOPMENT ASSOCIATES |
| 13.0 | METALLURGICAL TESTING & MINERAL PROCESSING |
| |
| 13.1 | Metallurgical Testing Summary |
Cyanidation and flotation testing programs have been conducted on composite samples from Shahuindo by various companies starting in about 1996.
Results from cyanidation tests conducted by KCA in 2010 and 2011 on drill hole composites were mainly used in the development of the recoveries for use in the feasibility study. The results of the testing program indicate excellent gold recoveries at a moderate crush size with low to moderate reagent requirements implying amenability to heap leaching. Silver recoveries are generally low. Column leach test results on surface bulk samples by Heap Leach Consultants (HLC) generally support these conclusions.
The projected field gold and silver recoveries, reagent consumptions, leach time and crush size based on the available test work results are summarized as follows:
| | | |
| • | % Au Recovery: | 86% (Oxide) |
| | | |
| • | % Au Recovery: | 50% (Transition) |
| | | |
| • | % Ag Recovery: | 15% (Oxide and Transition) |
| | | |
| • | NaCN: | 0.27 kg/t |
| | | |
| • | Cement: | 6 kg/t |
| | | |
| • | Leach Time: | 75 days |
| | | |
| • | Crush Size: | 100% passing 32 mm |
Figure 13-1 presents the locations of the drill holes and HLC surface samples that were used for the metallurgical test work. As shown the samples spatially represent the ore body.
| | |
| November 2012 | Shahuindo Project | 146 |
| |
|
MINE DEVELOPMENT ASSOCIATES |
| |
| Figure 13-1 | Location of Metallurgical Drill Holes and Samples |
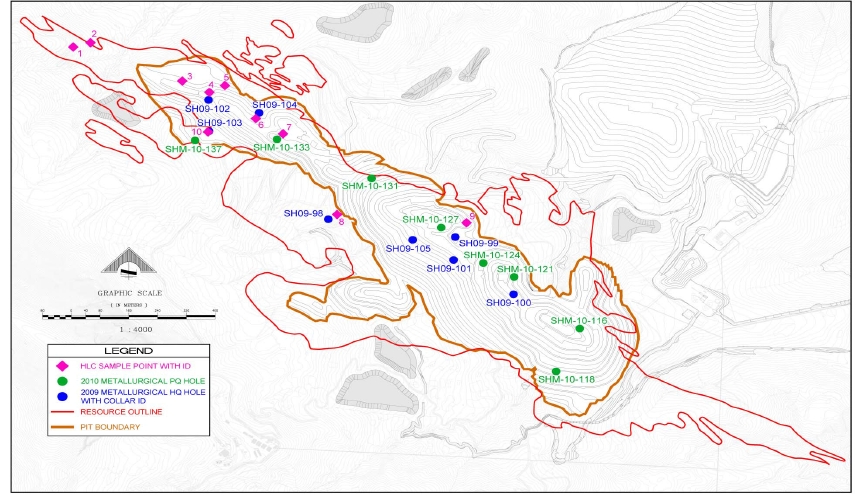
| | |
| November 2012 | Shahuindo Project | 147 |
| |
|
MINE DEVELOPMENT ASSOCIATES |
| 13.1.1 | HLC Test Program Summary |
Heap Leach Consultants conducted column leach tests and bottle roll tests on oxide surface bulk samples mainly taken from the northwestern half of the ore body. The column leach tests were conducted on samples at sizes ranging from “as-received” (run-of-mine or ROM) to minus 25 mm.
Gold recoveries in the HLC column tests ranged from 17% to 91%. The average test recoveries and reagent consumptions by crush size are summarized in Table 13-1. Eight tests failed due to permeability issues. These results are not included in the summary table below.
| |
| Table 13-1 | Summary of HLC Column Leach Tests |
| | | | | | | |
Crush
Size, mm | Calc. Head
g Au/t | Calc. Head
g Ag/t | Extraction
Au, % | Extraction
Ag, % | NaCN
Consumption,
kg/t | Lime
kg/t | Cement
kg/t |
|
|
|
|
| ROM | 1.14 | 5.8 | 27 | 5 | 0.20 | 2.4 | 0 |
| -150 | 1.18 | 6.1 | 40 | 7 | 0.30 | 0.94 | 3 |
| -100 | 0.99 | 6.2 | 81 | 14 | 0.34 | 0.31 | 4.4 |
| -25 | 1.41 | 5.6 | 67 | 14 | 0.63 | 2.35 | 0 |
Sodium cyanide consumptions in the column tests ranged from 0.2 to 0.8 kg/t. In the tests that were agglomerated, 3 to 5 kg cement per tonne of ore was added.
Gold recoveries in the bottle roll tests conducted by HLC at minus 0.15 mm (100 Tyler mesh) ranged from 75% to 93% while silver recoveries ranged from 13% to 39%.
| 13.1.2 | KCA Test Program Summary |
KCA’s cyanidation tests were conducted on composites made from HQ and PQ drill core intervals taken in 2009 and 2010 and on bulk surface samples taken in 2011. The composites were made from core intervals ranging from surface to a depth of about 160 meters. The surface bulk samples were mainly used for coarse material column leach tests to simulate leaching of samples at ROM sizes.
There were a total of 21 column leach tests that were conducted on composites crushed from P80sizes of 15 mm up to 36 mm. The coarse ore leach tests were conducted on composites with material up to 240 mm in size. A total of approximately 82 bottle roll leach tests were conducted on pulverized and coarse crushed composites.
| | |
| November 2012 | Shahuindo Project | 148 |
| |
|
MINE DEVELOPMENT ASSOCIATES |
Gold recoveries in the crushed ore column leach tests ranged from 79% to 94%. Average gold recovery at an average P80crush size of 22 mm was 89%. Gold recovery appears to be more related to sulfide sulfur content than crush size in the size ranges tested. The tests on crushed composites with an approximate sulfide sulfur content of 0.5% averaged 83% gold recovery. Silver recoveries in the crushed material column tests were generally low and ranged from 7% to 21% and averaged 17%.
A series of column leach tests utilizing various levels of agglomeration polymer at two solution application rates on splits of a single composite sample crushed to 21 mm were conducted by KCA. Gold recovery ranged from 89% to 91% and averaged 90.6% with no obvious differences in final recoveries due to polymer addition or application rate.
Sodium cyanide consumptions in the crushed material column tests ranged from 0.38 to 1.17 kg/t and averaged 0.82 kg/t. All composites tested except one at a crush size of minus 36 mm were agglomerated with an average of 6 kg Portland Type II cement per tonne. The test on the 36-mm crushed composite used hydrated lime at a 3.1 kg/t addition rate.
Coarse material leach tests were conducted on the bulk surface samples. The tests were conducted on as-received composites and on screened fractions of the composites: +100mm, -100+50mm and -50mm. The +100 and -100+50mm tests were conducted under flooding conditions. The gold and silver recoveries on the as-received composites averaged 77% and 25%, respectively. The test results on the screened composites varied greatly, partially due to permeability issues in several of the tests since the material tested was not agglomerated with cement.
The average results of the ROM and crushed ore column leach tests and on the screened fractions are summarized in Table 13-2.
| | |
| November 2012 | Shahuindo Project | 149 |
| |
|
MINE DEVELOPMENT ASSOCIATES |
| |
| Table 13-2 | Summary of KCA Column Leach Tests |
| | | | | |
| Sample Description | Avg. Crush/Screen
Size, mm | Avg. Calc’d
Head
g Au/t | Avg.
Extraction
Au, % | Avg. NaCN
Consumption,
kg/t | Avg. %
Sulfide |
| ROM | 129 | 0.41 | 77 | 0.28 | 0.06 |
| Crushed Ore – All | 22 | 1.04 | 89 | 0.88 | 0.11 |
| Crushed Ore (<0.1% Sulfide) | 22 | 1.15 | 90 | 0.81 | 0.05 |
| Crushed Ore (>0.1% Sulfide) | 21 | 1.49 | 83 | 0.86 | 0.49 |
| +100 mm Screened Fraction | +100 | 0.49 | 54 | 0.44 | 0.08 |
| -100+50 mm Screened Fraction | -100+50 | 0.52 | 71 | 0.38 | 0.08 |
| -50 mm Screened Fraction | -50 | 0.53 | 85 | 0.42 | 0.08 |
The KCA bottle roll test program included tests on pulverized and crushed composite samples. Gold recoveries in the pulverized bottle roll tests ranged from 73% to 95% while silver recoveries ranged from 19% to 77%. Coarse bottle roll tests were conducted on composite samples crushed at nominal sizes of minus 90, 37.5, 25 and 19 mm. Gold recoveries ranged from 3% to 91% while silver recoveries ranged from 3% to 66%. Results from the bottle roll test program are summarized in Table 13-3.
| |
| Table 13-3 | Summary of KCA Bottle Roll Leach Tests |
| | | | | | |
| Test Description | Avg. P80
Crush Size,
mm | Avg. Calc.
Head
g Au/t | Avg.
Extraction
Au, % | Avg.
Extraction
Ag, % | Avg. NaCN
Consumption,
kg/t | Avg. %
Sulfide |
| Pulverized | 0.075 | 0.99 | 87 | 42 | 0.44 | 0.13 |
| nominal -90 mm | 41.5 | 0.44 | 59 | 5 | 0.36 | 0.01 |
| nominal -37.5 mm | 24.7 | 1.42 | 76 | 12 | 0.43 | 0.04 |
| nominal - 25 mm | 19.0 | 1.05 | 69 | 21 | 0.53 | 0.51 |
| nominal -19 mm | 13.0 | 1.48 | 79 | 14 | 0.34 | 0.04 |
| All Coarse Tests, >0.1% S* | 19.2 | 1.75 | 55 | 16 | 0.79 | 1.02 |
| Minus 25 mm, >0.1% S* | 18.9 | 1.46 | 52 | 19 | 0.86 | 1.20 |
| Minus 25 mm, <0.1% S* | 17.8 | 0.71 | 75 | 22 | 0.28 | 0.02 |
| 13.2 | Heap Leach Consultants - 2003-2004 |
HLC conducted column leach tests and bottle roll tests on oxide surface bulk samples mainly taken from the northwestern half of the ore body. The column leach tests were conducted on samples at sizes ranging from “as-received” to minus 25 mm. The sample designations with average head grades are presented in Table 13-4.
A global summary of the HLC column and bottle roll test results are shown in Tables 13-5 and 13-6.
| | |
| November 2012 | Shahuindo Project | 150 |
| |
|
MINE DEVELOPMENT ASSOCIATES |
| |
| Table 13-4 | HLC Sample Designations and Average Head Grades |
| | | | |
| Sample | Location ID
Number | Sample ID | Overall Average
Head Grade, g Au/t | Overall Average
Head Grade, g Ag/t |
|
|
| Chilca | 1& 2 | CH | 1.20 | 9.97 |
| Coshpio | 3, 4, & 5 | CO | 0.93 | 4.28 |
| Alto Redondo | 6& 7 | AR | 0.96 | 3.16 |
| Rumilanche | 8 | RU | 0.74 | 7.80 |
| La Vieja | 9 | LV | 1.28 | 4.74 |
| San Jose | 10 | SJ | 1.48 | 9.54 |
| | |
| November 2012 | Shahuindo Project | 151 |
| |
|
MINE DEVELOPMENT ASSOCIATES |
| |
| Table 13-5 | Summary of HLC Column Leach Test Results |
| | | | | | | | | | | | | |
| Sample ID | Column
Size | Crush
Size,
mm | Calc.
Head
g Au/t | Calc.
Head
g Ag/t | Extraction
Au, % | Extraction
Ag, % | NaCN
Consumption,
kg/t | Lime
kg/t | Cement
kg/t | Remark | Column
Dia., m | Column
Height,
m | Days
Leached |
| CH | Medium | -150 | 1.51 | 9.48 | 28.5 | 4.2 | 0.23 | 2.5 | 0.0 | | 0.76 | 6 | 61 |
| CH | Small | -100 | 1.28 | 10.34 | 72.0 | 6.7 | 0.23 | 0.0001 | 5.0 | | 0.30 | 6 | 61 |
| CO | Small | -100 | | | | | | | 0.0 | Failed | 0.30 | 6 | |
| CO | Small | -25 | 1.42 | 4.17 | 57.6 | 15.5 | 0.65 | 2.4 | 0.0 | | 0.15 | 1.8 | 45 |
| CO | Small | -100 | 0.86 | 4.01 | 68.0 | 12.2 | 0.35 | 0.0001 | 5.0 | | 0.30 | 6 | 39 |
| CO | Small | -100 | 0.93 | 4.14 | 70.1 | 11.4 | 0.34 | 0.0001 | 5.0 | Failed | 0.30 | 5.5 | 39 |
| SJ | Small | -100 | | | | | | | 0.0 | Failed | 0.30 | 6 | |
| SJ | Small | -25 | 1.54 | 8.14 | 57.9 | 6.2 | 0.47 | 2.05 | 0.0 | | 0.20 | 1.8 | 38 |
| SJ | Small | -100 | | | | | | | 5.0 | Failed | 0.30 | 6 | |
| SJ | Small | -100 | | | | | | | 5.0 | Failed | 0.30 | 5.5 | |
| AR | Medium | -150 | 0.97 | 3.91 | 36.2 | 4.9 | 0.24 | 2.2 | 0.0 | | 0.76 | 6 | 61 |
| AR | Small | -100 | 1.05 | 3.60 | 87.7 | 16.8 | 0.24 | 0.001 | 5.0 | | 0.30 | 6 | 52 |
| RU | Small | -100 | 0.74 | 8.30 | 83.4 | 13.7 | 0.28 | 2.76 | 0.0 | | 0.30 | 6 | 60 |
| RU | Small | -100 | 0.72 | 8.15 | 90.9 | 17.8 | 0.59 | 0.001 | 5.0 | | 0.30 | 6 | 39 |
| RU | Small | -100 | 0.74 | 7.87 | 88.4 | 18.5 | 0.43 | 0.001 | 5.0 | | 0.30 | 5.5 | 39 |
| LV | Small | -100 | | | | | | | 0.0 | Failed | 0.30 | 6 | |
| LV | Small | -25 | 1.28 | 4.53 | 86.7 | 19.6 | 0.76 | 2.6 | 0.0 | | 0.30 | 1.9 | 45 |
| LV | Small | -100 | 1.33 | 4.69 | 85.6 | 17.7 | 0.38 | 0.001 | 5.0 | | 0.30 | 6 | 39 |
| LV | Small | -100 | 1.24 | 4.94 | 85.8 | 15.0 | 0.25 | 0.001 | 5.0 | | 0.30 | 5.5 | 39 |
| CO,SJ,AR | Large | ROM | 1.26 | 4.81 | 25.2 | 3.8 | 0.19 | 2.3 | 0.0 | | 1.2 | 6 | 61 |
| CO,SJ,AR | Medium | -150 | | | | | | | 5.0 | Failed | 0.76 | 6 | |
| CO,SJ,AR | Medium | -150 | | | | | | | | Failed | 0.76 | 4.27 | |
| CH,CO,AR | Large | ROM | 1.15 | 5.90 | 17.2 | 2.3 | 0.18 | 2.4 | 0.0 | | 1.2 | 6 | 61 |
| CH,CO,AR | Medium | -150 | 1.02 | 5.90 | 24.9 | 3.1 | 0.31 | 0.001 | 5.0 | | 0.76 | 6 | 33 |
| CH,CO,AR | Medium | -150 | 1.26 | 5.90 | 39.4 | 6.1 | 0.50 | 0.001 | 5.0 | | 0.76 | 4.16 | 28 |
| AR,RU,LV | Large | ROM | 1.05 | 5.59 | 48.6 | 9.2 | 0.22 | 2.5 | 0.0 | | 1.2 | 6 | 61 |
| AR,RU,LV | Medium | -150 | 1.12 | 5.17 | 72.6 | 15.1 | 0.20 | 0.001 | 5.0 | | 0.76 | 6 | 32 |
| CH,CO,SJ,AR,RU,LV | Large | ROM | 1.10 | 6.76 | 18.4 | 2.5 | 0.20 | 2.5 | 0.0 | | 1.2 | 6 | 61 |
| | |
| November 2012 | Shahuindo Project | 152 |
| |
|
MINE DEVELOPMENT ASSOCIATES |
| |
| Table 13-6 | Summary of HLC Bottle Roll Leach Test Results |
| | | | | | | | | |
| Sample ID | Crush Size,
mm | Calc. Head
g Au/t | Calc. Head
g Ag/t | Calc. Head
g Cu/t | Extraction Au,
% | Extraction Ag,
% | Extraction Cu,
% | NaCN Consumption,
kg/t | Lime,
kg/t |
| CH | -25 | 1.09 | 9.65 | 68.88 | 78.0 | 12.5 | 2.3 | 0.81 | 2.57 |
| CH | -0.15 | 1.25 | 9.80 | 67.17 | 79.9 | 21.0 | 5.6 | 0.59 | 3.24 |
| CH | -0.15 | 1.25 | 9.80 | 71.26 | 76.0 | 21.0 | 5.5 | 0.60 | 2.99 |
| CO | -25 | 1.59 | 5.90 | 57.85 | 72.5 | 16.6 | 2.9 | 0.52 | 2.35 |
| CO | -0.15 | 1.05 | 3.82 | 55.77 | 82.8 | 22.7 | 2.7 | 0.40 | 2.44 |
| CO | -0.15 | 1.06 | 3.76 | 54.61 | 81.1 | 25.3 | 4.3 | 0.51 | 2.28 |
| SJ | -25 | 1.44 | 7.82 | 82.02 | 83.8 | 11.7 | 2.3 | 0.70 | 2.20 |
| SJ | -0.15 | 1.65 | 7.75 | 80.68 | 78.8 | 13.5 | 2.3 | 0.46 | 2.29 |
| SJ | -0.15 | 1.71 | 8.73 | 79.66 | 77.2 | 12.9 | 3.2 | 0.48 | 2.15 |
| AR | -25 | 1.06 | 3.23 | 76.18 | 91.5 | 29.3 | 2.2 | 0.45 | 2.15 |
| AR | -0.15 | 1.10 | 2.98 | 68.71 | 92.0 | 34.7 | 2.1 | 0.35 | 2.16 |
| AR | -0.15 | 1.05 | 2.75 | 66.08 | 93.2 | 38.6 | 2.7 | 0.43 | 2.03 |
| RU | -25 | 0.75 | 9.63 | 50.88 | 93.0 | 19.6 | 4.3 | 0.61 | 2.78 |
| RU | -0.15 | 0.79 | 7.69 | 51.00 | 93.8 | 28.6 | 4.1 | 0.42 | 3.14 |
| RU | -0.15 | 0.79 | 7.64 | 50.64 | 94.9 | 31.8 | 4.2 | 0.48 | 2.77 |
| LV | -25 | 1.28 | 4.26 | 44.36 | 89.5 | 35.6 | 6.1 | 0.39 | 2.59 |
| LV | -0.15 | 1.43 | 4.65 | 45.98 | 90.6 | 33.5 | 5.3 | 0.33 | 2.44 |
| LV | -0.15 | 1.39 | 4.90 | 45.75 | 89.2 | 32.6 | 6.2 | 0.34 | 2.27 |
| | |
| November 2012 | Shahuindo Project | 153 |
| |
|
MINE DEVELOPMENT ASSOCIATES |
| |
| Figure 13-2 | Summary Results of HLC Size vs. Recovery |
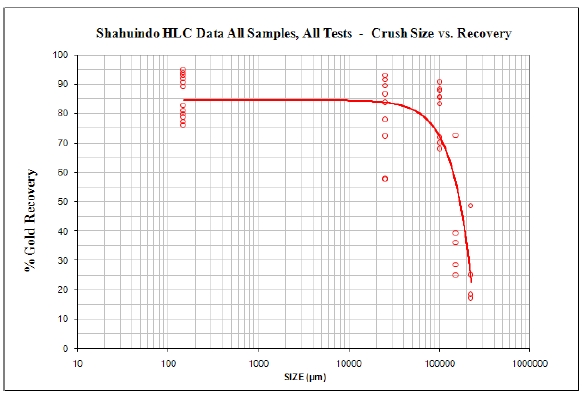
Chilca and Coshpio (both at the northwest end of the deposit) had lower recovery than the others at all sizes including the pulverized bottle rolls, possible indicative of sulfides. Sulfides were not measured in the HLC program. Although the samples were collected from fresh surface cuts and trenches and would be expected to be well oxidized, the data tends to indicate the presence of at least some sulfides. Material from the Chilca is not part of the current reserves.
Considering all of the HLC 25 mm (1-inch or 25,000 μm) crushed data set, including both column and bottle roll leach test results, as can be seen from Figure 13-2 above, an average test recovery of 84% can be expected.
| | |
| November 2012 | Shahuindo Project | 154 |
| |
|
MINE DEVELOPMENT ASSOCIATES |
| 13.3 | Kappes, Cassiday & Associates – 2009-2012 |
KCA conducted bottle roll, column and flood leach tests on composited samples. The results from this series of tests are discussed in the following sections.
| 13.3.1 | KCA Bottle Roll Leach Test Results |
KCA performed various coarse ore and pulverized bottle roll leach tests from May 2010 to December 2011. In total there were 53 coarse ore and 29 pulverized tests. The data from these tests are summarized in Tables 13-7 and 13-8. The coarse ore tests P80crush sizes ranged from 11 to 56 mm while the pulverized tests P80was approximately 0.075 mm.
The coarse ore bottle roll tests were conducted on composites with an average P80size of 23 mm. The average gold and silver recoveries in the coarse tests were 72% and 16% respectively; while the average gold and silver recoveries in the pulverized tests were 87% and 42%. Leaching was slowly continuing in many of the coarse bottle roll tests when they were ended which tends to skew the results somewhat. However, the results are useful in providing an estimate of the relative variability of gold extraction throughout the deposit.
| | |
| November 2012 | Shahuindo Project | 155 |
| |
|
MINE DEVELOPMENT ASSOCIATES |
| |
| Table 13-7 | Summary of KCA Coarse Ore Bottle Roll Leach Test Results |
| | | | | | | | | | |
KCA Test
No. | Description | Drill Hole Intervals, m | P80
Size,
mm | Calc’d
Head
g Au/t | Calc’d
Head
g Ag/t | Extraction
Au, % | Extraction
Ag, % | NaCN
Consumption
kg/t | Lime
Addition
kg/t | % S* |
|
|
|
|
| 45025A | SH09-98 Oxide (Ox) | 0-27 | 19.9 | 1.26 | 45.0 | 81 | 9 | 0.25 | 1.89 | 0.24 |
| 45025B | SH09-98 Ox/Sulfide (S) | 128-135 | 19.1 | 0.72 | 21.7 | 3 | 8 | 3.74 | 4.54 | 5.57 |
| 45025C | SH09-99 Oxide | 17.2-49.5 | 19.2 | 0.74 | 10.2 | 83 | 16 | 0.49 | 2.05 | 0.01 |
| 45025D | SH09-99 Ox/Minor S | 64.5-73.5 | 19.8 | 0.47 | 9.3 | 79 | 13 | 0.37 | 2.05 | 0.04 |
| 45026A | SH09-99 Ox/Minor S | 85.5-130.5 | 19.6 | 0.57 | 14.1 | 73 | 8 | 0.32 | 1.85 | 0.04 |
| 45026B | SH09-100 Oxide | 54-76.5 | 21.6 | 0.72 | 5.8 | 88 | 17 | 0.30 | 1.80 | 0.01 |
| 45026C | SH09-100 Oxide | 105-119.8 | 22.8 | 0.83 | 3.4 | 84 | 20 | 0.33 | 1.56 | 0.01 |
| 45026D | SH09-100 Oxide | 157.6-160.7 | 21.3 | 0.45 | 3.9 | 74 | 26 | 0.18 | 1.29 | 0.01 |
| 45027A | SH09-101 Oxide | 34.5-41.1 | 15.4 | 0.50 | 6.0 | 91 | 15 | 0.32 | 1.32 | 0.02 |
| 45027B | SH09-101 Oxide | 45.8-58.5 | 17.3 | 1.09 | 2.6 | 90 | 26 | 0.31 | 1.28 | 0.01 |
| 45027C | SH09-101 Oxide | 61.9-76.9 | 18.2 | 2.21 | 2.2 | 81 | 14 | 0.15 | 1.58 | 0.01 |
| 45027D | SH09-101 Oxide | 112.5-117 | 21 | 1.31 | 43.9 | 55 | 5 | 0.24 | 1.03 | 0.13 |
| 45028A | SH09-101 Ox/Minor S | 123-133.5 | 20.6 | 0.50 | 2.8 | 68 | 49 | 0.28 | 2.19 | 0.02 |
| 45028B | SH09-102 Oxide | 30-36 | 19.1 | 2.95 | 20.9 | 42 | 5 | 0.40 | 1.58 | 0.32 |
| 45028C | SH09-102 Oxide | 48.6-60 | 12.8 | 0.58 | 4.3 | 73 | 66 | 0.34 | 2.26 | 0.02 |
| 45028D | SH09-103 Oxide | 0-9.4 | 15.8 | 2.51 | 11.3 | 73 | 23 | 0.50 | 2.48 | 0.31 |
| 45029A | SH09-103 Oxide | 15.4-19.9 | 19.5 | 0.52 | 5.2 | 75 | 54 | 0.33 | 2.00 | 0.18 |
| 45029B | SH09-103 Oxide | 36.4-42.4 | 17.3 | 0.49 | 2.5 | 60 | 32 | 0.45 | 2.46 | 0.35 |
| 45029C | SH09-104 Oxide | 16.7-27.9 | 17 | 0.54 | 4.6 | 87 | 24 | 0.26 | 1.61 | 0.02 |
| 45029D | SH09-104 Oxide/Sulfide | 60.2-75.2 | 20.1 | 0.40 | 22.4 | 28 | 28 | 1.61 | 2.08 | 2.81 |
| 45030A | SH09-104 Ox/Minor S | 75.2-108.2 | 16.6 | 1.04 | 72.6 | 63 | 5 | 0.03 | 1.02 | 0.24 |
| 45030B | SH09-104 Oxide/Sulfide | 108.2-138.2 | 20.2 | 3.42 | 84.6 | 44 | 16 | 1.02 | 2.06 | 1.80 |
| 45030C | SH09-105 Oxide | 34.5-62.8 | 21.2 | 0.84 | 8.4 | 79 | 8 | 0.27 | 2.12 | 0.03 |
| 45030D | SH09-105 Oxide | 75-84 | 19.8 | 0.64 | 2.3 | 81 | 26 | 0.21 | 2.05 | 0.01 |
| 45886A | Rock 20 Composite–116 | 141.8 – 162.7 | 41 | 0.93 | 8.6 | 71 | 6 | 0.43 | 0.52 | 0.02 |
| 45886B | Rock 20 Composite–116 | 25 | 1.26 | 5.8 | 79 | 10 | 0.50 | 0.79 | 0.02 |
| 45886C | Rock 20 Composite–116 | 13 | 1.26 | 8.9 | 82 | 11 | 0.55 | 0.78 | 0.02 |
| 45887A | Rock 30 Composite–116 | 8-14.1, 95.6-107.1,
121.9-129.6 | 31 | 0.29 | 4.0 | 76 | 5 | 0.47 | 0.83 | 0.00 |
| 45887B | Rock 30 Composite–116 | 17 | 0.31 | 3.5 | 86 | 8 | 0.55 | 1.23 | 0.00 |
| 45887C | Rock 30 Composite–116 | 11 | 0.37 | 3.7 | 83 | 10 | 0.38 | 1.66 | 0.00 |
| | |
| November 2012 | Shahuindo Project | 156 |
| |
|
MINE DEVELOPMENT ASSOCIATES |
| | | | | | | | | | |
KCA Test
No. | Description | Drill Hole Intervals, m | P80
Size,
mm | Calc’d
Head
g Au/t | Calc’d
Head
g Ag/t | Extraction
Au, % | Extraction
Ag, % | NaCN
Consumption
kg/t | Lime
Addition
kg/t | % S* |
|
|
|
|
| 45887D | Rock 40 Comp-116 (upper) | 14.1-26.4, 36.9-50.4, 57-
95.6 | 53 | 1.02 | 14.2 | 54 | 4 | 0.34 | 0.51 | 0.04 |
| 45888A | Rock 40 Comp-116 (upper) | 28 | 0.76 | 7.9 | 71 | 7 | 0.42 | 0.51 | 0.04 |
| 45888B | Rock 40 Comp-116 (upper) | 15 | 0.85 | 10.7 | 84 | 8 | 0.43 | 0.52 | 0.04 |
| 45888C | Rock 40 Comp-116 (lower) | 107-121.9, 129.6-141.8 | 56 | 0.35 | 6.6 | 59 | 6 | 0.28 | 0.51 | 0.02 |
| 45888D | Rock 40 Comp-116 (lower) | 28 | 0.42 | 5.8 | 66 | 17 | 0.50 | 0.51 | 0.02 |
| 45889A | Rock 40 Comp-116 (lower) | 15 | 0.38 | 6.4 | 63 | 20 | 0.41 | 0.51 | 0.02 |
| 45889B | Hi Grade Composite–116 | 14.1-20.2, 78.8-85,
144.9—150.9, 162.7-
167 | 28 | 3.01 | 24.4 | 65 | 4 | 0.47 | 0.82 | 0.16 |
| 45889C | High Grade Composite–116 | 14 | 3.42 | 28.9 | 73 | 5 | 0.43 | 1.16 | 0.16 |
| 45889D | Rock 20 Composite–118 | 86.3-120.4 | 55 | 0.35 | 7.2 | 76 | 10 | 0.42 | 0.52 | 0.01 |
| 45890A | Rock 20 Composite–118 | 26 | 0.37 | 7.5 | 85 | 16 | 0.49 | 0.51 | 0.01 |
| 45890B | Rock 20 Composite–118 | 13 | 0.46 | 7.3 | 88 | 24 | 0.23 | 0.95 | 0.01 |
| 45890C | Rock 30 Composite–118 | 54.6-65.2, 77.3-86.3,
132.2-144 | 41 | 0.45 | 10.1 | 82 | 7 | 0.42 | 0.85 | 0.01 |
| 45890D | Rock 30 Composite–118 | 25 | 0.55 | 10.1 | 90 | 18 | 0.74 | 0.55 | 0.01 |
| 45891A | Rock 30 Composite–118 | 11 | 0.49 | 14.3 | 87 | 18 | 0.41 | 1.22 | 0.01 |
| 45891B | Rock 40 Composite–118 | 1-54.6, 65.2-77.3 | 55 | 0.13 | 3.1 | 53 | 3 | 0.49 | 0.53 | 0.01 |
| 45891C | Rock 40 Composite–118 | 26 | 0.16 | 3.1 | 63 | 9 | 0.67 | 0.85 | 0.01 |
| 45891D | Rock 40 Composite–118 | 14 | 0.20 | 4.2 | 68 | 10 | 0.59 | 1.18 | 0.01 |
| 45892C | High Grade Composite–118 | 120.4-132.2 | 21 | 7.04 | 8.2 | 80 | 10 | 0.24 | 1.89 | 0.08 |
| 45892D | High Grade Composite–118 | 12 | 6.99 | 12.2 | 78 | 7 | 0.25 | 1.88 | 0.08 |
| 48282A | Rock 20 Code (116 & 118) | 92.1-126.3, 141.8-162.7 | 24 | 1.35 | 8.67 | 78 | 12 | 0.08 | 1.20 | 0.02 |
| 48282B | Rock 20 Code (116 & 118) | 12 | 1.33 | 8.75 | 80 | 15 | 0.04 | 1.75 | 0.02 |
| 48282C | Rock 40 Code (116 & 118) | 6.3-141.8 | 24 | 0.44 | 10.23 | 76 | 16 | 0.06 | 1.20 | 0.02 |
| 48282D | Rock 40 Code (116 & 118) | 13 | 0.52 | 8.06 | 83 | 22 | 0.01 | 1.50 | 0.02 |
| *Sulfide sulfur | | | | | | | | | | |
| | |
| November 2012 | Shahuindo Project | 157 |
| |
|
MINE DEVELOPMENT ASSOCIATES |
| |
| Table 13-8 | Summary of KCA Pulverized Bottle Roll Leach Test Results |
| | | | | | | | | | |
KCA
Sample
No. | Description | P80Size,
mm | Calc’d Head,
g Au/t | Calc’d Head,
g Ag/t | Extraction
Au, % | Extraction
Ag, % | Leach
Time, days | NaCN
Consumption
kg/t | Lime
Addition
kg/t | % S* |
|
|
|
|
| 45071 | Rock 20 Composite | 0.075 | 0.87 | 8.70 | 93 | 38 | 4 | 0.97 | 7.00 | 0.05 |
| 45072 | Rock 30 Composite | 0.075 | 1.01 | 46.50 | 85 | 56 | 4 | 2.13 | 7.00 | 0.49 |
| 45073 | Rock 40 Composite | 0.075 | 0.77 | 5.80 | 95 | 77 | 4 | 1.21 | 7.00 | 0.02 |
| 47115A | Rock 20 Code | 0.075 | 1.12 | 5.80 | 87 | 75 | 2 | 0.46 | 1.50 | 0.01 |
| 47115B | Rock 30 Code | 0.075 | 1.62 | 3.60 | 89 | 15 | 2 | 0.11 | 2.50 | 0.05 |
| 47115C | Rock 40 Code | 0.075 | 0.56 | 9.50 | 83 | 53 | 2 | 0.08 | 1.50 | 0.02 |
| 47129A | All Rock Codes, SHM-10-121. 124,
127 | 0.075 | 0.96 | 1.74 | 89 | 35 | 2 | 0.28 | 3.50 | 0.06 |
| 47129B | All Rock Codes, SHM-10-131, 133,
137 | 0.075 | 0.66 | 1.95 | 82 | 40 | 2 | 0.56 | 4.50 | 0.08 |
| 47129C | Rock Type 10 Codes, SHM-10-118,
121, 124, 131, 133 | 0.075 | 0.26 | 1.24 | 73 | 38 | 2 | 0.21 | 5.00 | 0.01 |
| 47129D | Rock Type 50 Codes, SHM-10-116,
121, 124, 127 | 0.075 | 0.50 | 1.55 | 86 | 41 | 2 | 0.23 | 6.50 | 0.05 |
| 47130A | Available Rock Codes, SHM-10-
116, 118, 121 | 0.075 | 6.19 | 5.44 | 95 | 31 | 2 | 0.73 | 2.50 | 0.09 |
| 47130B | Available Rock Codes, SHM-10-
116, 127, 131, 133 | 0.075 | 3.10 | 16.85 | 84 | 20 | 2 | 0.65 | 4.00 | 0.52 |
| 47130C | Available Rock Codes, SHM-10-
116, 124, 127, 131, 133 | 0.075 | 1.05 | 3.99 | 84 | 22 | 2 | 0.49 | 4.00 | 0.45 |
| 47178A | SHM-10-131, 133 | 0.075 | 0.67 | 6.58 | 89 | 26 | 2 | 0.28 | 4.50 | 0.05 |
| 60954A | Rock Code 20 | 0.075 | 1.11 | 6.78 | 90 | 77 | 2 | 1.04 | 1.50 | NA |
| 60954B | Rock Code 30 | 0.075 | 1.61 | 3.24 | 92 | 26 | 2 | 0.23 | 3.00 | NA |
| 60954C | Rock Code 40 | 0.075 | 0.55 | 9.04 | 86 | 66 | 2 | 0.70 | 1.50 | NA |
| 60938A | A Composite | 0.075 | 0.52 | 6.24 | 94 | 24 | 2 | 0.12 | 5.50 | 0.18 |
| 60938B | B Composite | 0.075 | 1.32 | 2.96 | 90 | 23 | 2 | 0.26 | 3.00 | 0.12 |
| 61607A | P2, Zonal Moyan | 0.075 | 0.01 | 1.75 | 81 | 65 | 3 | 0.55 | 2.00 | 0.01 |
| 61607B | P1, Zona Este, Huangamarca | 0.075 | 0.16 | 1.36 | 89 | 34 | 3 | 0.55 | 3.50 | 0.01 |
| 61629A | L850 W 130N-140N | 0.075 | 0.19 | 1.02 | 84 | 31 | 2 | 0.10 | 6.50 | 0.39 |
| 61629B | L1250E 175N-185N | 0.075 | 1.08 | 1.06 | 83 | 42 | 2 | 0.07 | 5.00 | 0.01 |
| 61629C | L300E 260S-270S | 0.075 | 0.29 | 1.27 | 89 | 45 | 2 | 0.10 | 6.00 | 0.06 |
| | |
| November 2012 | Shahuindo Project | 158 |
| |
|
MINE DEVELOPMENT ASSOCIATES |
| | | | | | | | | | |
KCA
Sample
No. | Description | P80Size,
mm | Calc’d Head,
g Au/t | Calc’d Head,
g Ag/t | Extraction
Au, % | Extraction
Ag, % | Leach
Time, days | NaCN
Consumption
kg/t | Lime
Addition
kg/t | % S* |
|
|
|
|
| 61629D | L250W 90N-100N | 0.075 | 0.86 | 6.91 | 93 | 19 | 2 | 0.11 | 7.00 | 0.02 |
| 61629E | L00E 50N-60N | 0.075 | 0.18 | 12.81 | 86 | 67 | 2 | 0.11 | 7.00 | 0.25 |
| 61630A | L1200E 60S-70S | 0.075 | 0.80 | 17.83 | 85 | 25 | 2 | 0.14 | 7.00 | 0.29 |
| 61630B | L1050E 160N-170N | 0.075 | 0.14 | 1.86 | 78 | 47 | 2 | 0.07 | 5.00 | 0.05 |
| 61630C | L550E 30N-35N | 0.075 | 0.56 | 1.37 | 92 | 55 | 2 | 0.10 | 6.00 | 0.05 |
| | | |
| November 2012 | Shahuindo Project | 159 |
| |
|
MINE DEVELOPMENT ASSOCIATES |
Figure 13-3 graphs the gold recovery versus the sulfide content for the approximate 20 mm KCA bottle roll test results.
This figure indicates that a higher amount of sulfide content in the ore negatively affects the gold recovery. Therefore KCA analyzed the recoveries of both the coarse ore and pulverized tests to determine what the precious metal recoveries were for high sulfide materials (>0.1% sulfide sulfur) compared to lower sulfide materials. The leach times for the coarse ore bottle roll leach tests were 5 days and the leach time for the pulverized bottle roll tests ranged from 2 to 5 days. Table 13-9 summarizes these data.
As shown in Figure 13-3, there is a reduction in gold recovery with higher sulfide content in the composites tested. At essentially the same test conditions (leach time of 5 days, crush size of 18 to 19 mm, NaCN concentration of 1 g/L, etc.), gold recovery dropped by approximately 23 percentage points in the tests with higher sulfide content. Average silver recoveries were only affected a minor amount by the increased sulfide content in these bottle roll tests.
| | |
| November 2012 | Shahuindo Project | 160 |
| |
|
MINE DEVELOPMENT ASSOCIATES |
| |
| Figure 13-3 | KCA BottleRollTestsat19mm,%SulfideContentandGoldRecovery |

| |
| Table 13-9 | Summary of KCA Bottle Roll Recoveries According to Sulfide Level |
| | | | | | |
| Test Description | Avg. P80
Crush Size,
mm | Avg. Calc.
Head
g Au/t | Avg.
Extraction
Au, % | Avg.
Extraction
Ag, % | Avg. NaCN
Consumption,
kg/t | Avg. %
Sulfide |
|
|
| Pulverized, <0.1% Sulfide | 0.075 | 0.93 | 87 | 42 | 0.40 | 0.04 |
| Pulverized, >0.1% Sulfide | 0.075 | 1.02 | 87 | 34 | 0.50 | 0.34 |
| All Coarse Tests, >0.1% Sulfide | 19.2 | 1.75 | 55 | 16 | 0.79 | 1.02 |
| Minus 25 mm, >0.1% Sulfide | 18.9 | 1.46 | 52 | 19 | 0.86 | 1.20 |
| Minus 25 mm, <0.1% Sulfide | 17.8 | 0.71 | 75 | 22 | 0.28 | 0.02 |
The above data also indicate that the higher sulfide containing material had a higher gold content in the composites tested.
The variability of gold recovery with sample depth was also reviewed. Figure 13-4 graphs the average interval depth of the composites with less than 0.1% sulfide sulfur versus the bottle roll recovery of both the pulverized and coarse ore bottle rolls. The graph suggests that there is a minor correlation between the gold recovery and the depth of the sample with gold recovery possibly decreasing slightly with depth.
| | |
| November 2012 | Shahuindo Project | 161 |
| |
|
MINE DEVELOPMENT ASSOCIATES |
| |
| Figure 13-4 | Bottle Roll Test Results vs. AverageIntervalDepth,CompositesContaining <0.1% Sulfide Sulfur |
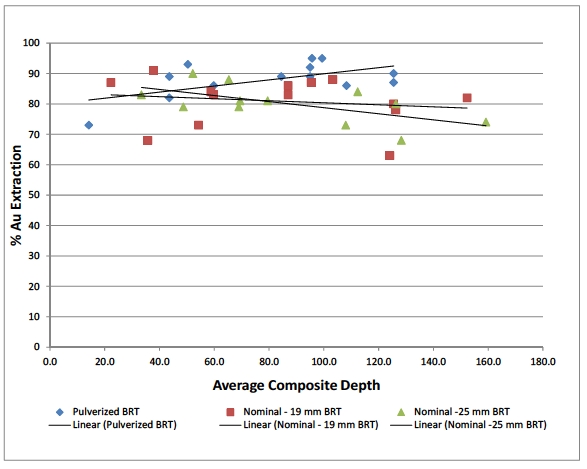
| 13.3.2 | Kappes, Cassiday & Associates Column Tests |
From May 2010 to December 2011, KCA performed multiple series of column leach tests on crushed material and on coarse ore samples. In total there were 21 crushed ore column tests, 3 whole ore coarse leach tests and 12 screened fraction coarse leach tests completed. The results from the crushed ore column leach tests are summarized in Table 13-10 and the results from the coarse ore and screened fraction leach tests are summarized in Tables 13-11 and 13-12.
For the purposes of the study only the column leach test data on crushed composites were used to determine the study criteria. The screen fraction tests included flood leach tests on size fractions including +100 mm and -100+50 mm along with typical column leach tests on screened -50 mm samples. These series of tests were conducted to evaluate ROM or possibly primary crushed ore only leaching of lower grade material.
| | |
| November 2012 | Shahuindo Project | 162 |
| |
|
MINE DEVELOPMENT ASSOCIATES |
These options were eventually dropped due to permeability issues in some of the flood tests.
The twenty-one column leach tests were completed on crush sizes that averaged a P80of 22 mm and the three column leach tests were done at run-of-mine sizes (ROM) that averaged a P80crush size of 129 mm.
The crushed ore column tests on composites with a sulfide sulfur content of less than 0.1% had average calculated head grades of 0.80 g Au/t and 6.5 g Ag/t. Average gold and silver recoveries in this series of tests were 89% and 17%, respectively. The cyanide consumption for these tests averaged 0.82 kg/t. These average results do not include the data from a single very high grade column leach test.
Based on field experience, KCA reduces the column test recoveries by 2-3% for Au and 2-5% for Ag for the field recoveries and by taking 25% to 33% of the column cyanide consumption for the expected field cyanide consumption. Therefore for oxide material, KCA estimates that the field recoveries will be 86% for Au and 15% for Ag.
The minor amount of mixed material (average sulfide sulfur content of 0.81%) in the ore body was conservatively estimated to achieve a gold recovery of 50%, mainly based on the coarse bottle roll test data. Silver recovery of the mixed material will be similar to that achieved on the oxide.
The cyanide consumption estimated to average approximately 0.27 kg/t. Cyanide consumption did not vary between the low sulfide and higher sulfide tests.
The days under leach averaged 57 days, and based on KCA’s field experience for multi-lift heaps plus analyzing the solution applied during the column testing, KCA predicts that the total leach cycle will be 75 days.
The KCA data correlates well with the HLC data from the previous section where similar recoveries were obtained.
| | |
| November 2012 | Shahuindo Project | 163 |
| |
|
MINE DEVELOPMENT ASSOCIATES |
| |
| Table 13-10 | Summary of KCA Crushed Ore Column Test Results |
| | | | | | | | | | | |
KCA
Test
Number | Description | P80
Size,
mm | Calc’d
Head
g Au/t | Calc’d
Head
g Ag/t | Extraction
Au, % | Extraction
Ag, % | NaCN
Cons, kg/t | Lime
kg/t | Cement
kg/t | %
Sulfide | Days
Leached |
|
|
| 45085 | Rock Code 20 | 15 | 0.88 | 8.93 | 93 | 18 | 1.07 | | 6.00 | 0.05 | 63 |
| 45088 | Rock Code 30 (High S) | 16 | 1.09 | 40.01 | 85 | 10 | 0.88 | | 6.00 | 0.49 | 63 |
| 45091 | Rock Code 40 | 17 | 0.77 | 6.74 | 94 | 17 | 0.92 | | 6.00 | 0.02 | 63 |
| 47116 | Rock Code 20 | 24 | 1.30 | 6.90 | 79 | 18 | 0.91 | | 4.00 | 0.01 | 54 |
| 47119 | Rock Code 30 | 22 | 1.45 | 4.26 | 92 | 11 | 0.60 | | 6.00 | 0.05 | 54 |
| 47122 | Rock Code 40 | 25 | 0.52 | 8.15 | 84 | 21 | 0.38 | | 4.00 | 0.02 | 54 |
| 47131 | All Rock Codes, SHM-10-121, 124,
127 | 32 | 1.06 | 5.82 | 92 | 10 | 0.47 | 3.12 | | 0.06 | 63 |
| 47134 | All Rock Codes, SHM-10-121, 124,
127 | 21 | 1.03 | 6.20 | 91 | 15 | 0.75 | | 6.06 | 0.06 | 77 |
| 47137 | All Rock Codes, SHM-10-131, 133,
137 | 20 | 0.60 | 5.13 | 92 | 15 | 0.89 | | 6.49 | 0.08 | 58 |
| 47140 | Rock Type 10 Codes, SHM-10-118,
121, 124, 131, 133 | 15 | 0.23 | 2.58 | 88 | 34 | 1.17 | | 6.46 | 0.00 | 58 |
| 47143 | Rock Type 50 Codes, SHM-10-116,
121, 124, 127 | 22 | 0.39 | 3.84 | 88 | 19 | 0.89 | | 6.37 | 0.05 | 58 |
| 47146 | Available Rock Codes, SHM-10-116,
118, 121 (High Grade) | 24 | 4.91 | 16.23 | 91 | 9 | 0.59 | | 6.19 | 0.09 | 58 |
| 47149 | Available Rock Codes, SHM-10-116,
127, 131, 133 (High S) | 24 | 2.43 | 68.36 | 83 | 7 | 0.82 | | 6.40 | 0.52 | 58 |
| 47152 | Available Rock Codes, SHM-10-116,
124, 127, 131, 133 (High S) | 22 | 0.95 | 17.90 | 82 | 13 | 0.89 | | 6.37 | 0.45 | 58 |
| 47155 | SHM-10-131, 133 | 19 | 0.57 | 6.03 | 91 | 11 | 0.98 | | 6.00 | 0.05 | 71 |
| 47158 | SHM-10-131, 133 | 22 | 0.58 | 4.98 | 89 | 14 | 0.97 | | 6.00 | 0.05 | 53 |
| 47161 | SHM-10-131, 133 | 19 | 0.61 | 5.68 | 91 | 15 | 1.28 | | 6.00 | 0.05 | 71 |
| 47164 | SHM-10-131, 133 | 23 | 0.62 | 5.33 | 91 | 13 | 1.02 | | 6.00 | 0.05 | 53 |
| 47167 | SHM-10-131, 133 | 22 | 0.61 | 5.13 | 90 | 13 | 0.83 | | 6.00 | 0.05 | 53 |
| 47170 | SHM-10-131, 133 | 23 | 0.59 | 5.05 | 91 | 14 | 1.09 | | 6.00 | 0.05 | 53 |
| 47173 | SHM-10-131, 133 | 22 | 0.66 | 5.22 | 91 | 13 | 1.00 | | 6.00 | 0.05 | 53 |
| | |
| November 2012 | Shahuindo Project | 164 |
| |
|
MINE DEVELOPMENT ASSOCIATES |
| |
| Table 13-11 | Summary of KCA ROM Column Test Results |
| | | | | | | | | |
KCA Test
Number | Description | P80Size, mm | Calc’d
Head g
Au/t | Calc’d
Head g
Ag/t | Extraction Au,
% | Extraction Ag,
% | NaCN Cons, kg/t | Cement
kg/t | Days
Leached |
|
|
|
| 60909 | Global Composite A & B | 102 | 0.94 | 3.07 | 85 | 22 | 0.52 | 5.95 | 71 |
| 60978 | P2, Zonal Moyan | 240 | 0.10 | 0.67 | 62 | 27 | 0.10 | 5.74 | 56 |
| 60991 | P1, Zona Este, Huangamarca | 45 | 0.20 | 0.40 | 83 | 25 | 0.22 | 5.97 | 66 |
| |
| Table 13-12 | Summary of KCA Screened Material Column Test Results |
| | | | | | | | | |
KCA Test
Number | Description | P80Size, mm | Calc’d
Head
g Au/t | Calc’d
Head
g Ag/t | Extraction Au,
% | Extraction Ag,
% | NaCN Cons, kg/t | Cement
kg/t | Days
Leached |
|
|
|
|
| 60912 | A Composite* | (1) | 0.54 | 6.72 | 39 | 5 | 0.45 | 6.01 | 25 |
| 60915 | A Composite* | (2) | 0.47 | 9.67 | 75 | 10 | 0.44 | 6.01 | 25 |
| 60918 | A Composite | 20(3) | 0.54 | 5.28 | 95 | 28 | 0.48 | 5.97 | 25 |
| 60921 | B Composite* | (1) | 1.02 | 1.51 | 72 | 21 | 0.09 | 5.97 | 58 |
| 60924 | B Composite* | (2) | 1.35 | 2.24 | 87 | 15 | 0.37 | 5.99 | 58 |
| 60927 | B Composite | 31(3) | 1.29 | 2.70 | 90 | 34 | 0.45 | 5.97 | 58 |
| 60969 | P2, Zonal Moyan* | (1) | 0.08 | 1.90 | 55 | 7 | 0.12 | 6.00 | 56 |
| 60972 | P2, Zonal Moyan* | (2) | 0.10 | 1.14 | 81 | 22 | 0.17 | 6.01 | 56 |
| 60975 | P2, Zonal Moyan | 10(3) | 0.10 | 1.03 | 69 | 31 | 0.33 | 6.07 | 56 |
| 60981 | P1, Zona Este, Huangamarca* | (1) | 0.31 | 0.48 | 48 | 15 | 1.09 | 6.03 | 66 |
| 60984 | P1, Zona Este, Huangamarca* | (2) | 0.17 | 0.55 | 41 | 8 | 0.53 | 6.13 | 66 |
| 60987 | P1, Zona Este, Huangamarca | 26(3) | 0.19 | 0.91 | 84 | 15 | 0.40 | 6.29 | 66 |
| * | Flood Testing |
| (1) | Screened Material @ +100 mm |
| (2) | Screened Material @ -100 +50 mm |
| (3) | Screened Material @ -50 mm |
| | | |
| November 2012 | Shahuindo Project | 165 |
| |
|
MINE DEVELOPMENT ASSOCIATES |
Figures 13-5 and 13-6 present the relationship between % gold recovery and P80crush sizes and calculated gold head grades, respectively, for the twenty-one KCA crushed ore column tests. The figures indicate that the crush size and head grade have minor correlations to gold recovery in the ranges tested.
A series of crushed ore column tests on splits from a single composite crushed to a P80of approximately 21 mm was completed. This series of tests included varying polymer chemical addition rates and solution application rates. The average gold recovery for these polymer addition tests was 90.6%. There were no apparent differences in final recovery or recovery rate between the various tests. Since the results indicate little or no advantage to using the polymer, the polymer addition into heap leach operations is not included.
| |
| Figure 13-5 | KCA Crushed Ore Column Leach Tests, % Gold Recovery vs. P80Crush Size, <0.1% Sulfide |
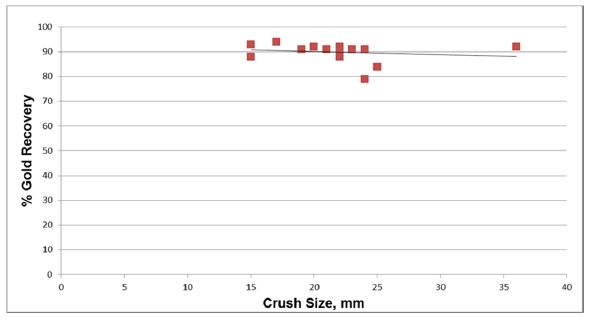
| | |
| November 2012 | Shahuindo Project | 166 |
| |
|
MINE DEVELOPMENT ASSOCIATES |
| |
| Figure 13-6 | KCA Crushed Ore Column Leach Tests, <0.1% Sulfides, % Gold Recovery vs. Au Head Grade |
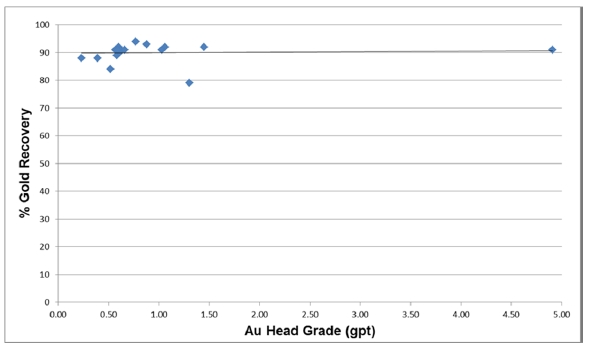
Figure 13-7 shows the % gold recovery versus % sulfide content for all the KCA column tests. The data indicate minor negative effects to gold recovery with sulfide content up to 0.5%. The mineralized material at Shahuindo has approximate average sulfide contents as follows:
| | | |
| • | Oxide | 0.06% |
| | | |
| • | Mixed or Transition | 0.81% |
| | | |
| • | Sulfide | 5.59% |
There is no sulfide material included in the study. The mixed material constitutes less than 1% of the ore body.
| | |
| November 2012 | Shahuindo Project | 167 |
| |
|
MINE DEVELOPMENT ASSOCIATES |
| |
| Figure 13-7 | KCA CrushedOreColumnTests,%SulfideContentvs.GoldRecovery |
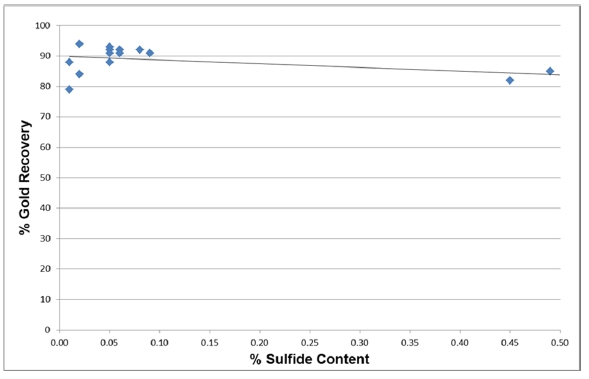
| 13.3.3 | Agglomeration Tests |
Preliminary agglomeration and compacted permeability testing were completed on portions of material and composites that KCA received from Shahuindo. The tests were performed using varying amounts of cement.
Agglomeration tests were evaluated using a set of criteria including percent slump, effluent solution rates and agglomerated pellet breakdown. A test was considered a ‘failure’ if one or more of these criteria did not meet KCA requirements. Other recorded parameters included pH and effluent solution color/clarity. The results of the agglomeration test work indicate that a cement addition of 6 kg/t was sufficient to prevent pellet breakdown and to provide protective alkalinity.
A series of compacted permeability tests were conducted that stimulated the pressures at 114 meters of heap height. The results indicate excellent permeability on two of the three composites tested. A third composite did not pass the test which indicates that blending of material will be required.
| | |
| November 2012 | Shahuindo Project | 168 |
| |
|
MINE DEVELOPMENT ASSOCIATES |
| 13.3.4 | Detoxification Test Work |
A total of three detoxification tests were done on selected column test material after their initial column leach test was completed. The purpose of the detoxification test is to determine the time, and the amount of hydrogen peroxide and copper sulfate needed to achieve acceptable total and WAD cyanide levels discharging from the column material.
The following Tables summarize the data from the detoxification test work.
| |
| Table 13-13 | Summary of Detoxification Test Results – Total & WAD Cyanide |
| | | | | | |
KCA
Sample
No. | Description | Detox.
Period,
Days | Initial Total
Cyanide,
mg/L | Final Total
Cyanide,
mg/L | Initial WAD
Cyanide,
mg/L | Final WAD
Cyanide,
mg/L |
|
|
| 47106B | SHM-10-121, 124, 127 | 29 | 201.47 | 0.53 | 193.86 | 0.11 |
| 47107A | SHM-10-131, 133 | 29 | 137.54 | 0.73 | 128.76 | 0.01 |
| 47107A | SHM-10-131, 133 | 29 | 142.74 | 0.97 | 138.76 | 0.019 |
| |
| Table 13-14 | Summary of Detoxification Test Results – Total & WAD Cyanide |
| | | | | | |
KCA
Sample
No. | Description | Column
Weight,
kg | 35%
H2O2
gms | 10 gpl CuSO4-
5H2O
mls | 100% H2O2
Consumed
g/t | Cu
Consumed,
g/t |
|
|
| 47106B | SHM-10-121, 124, 127 | 39.1 | 51.0 | 260.0 | 456.52 | 16.92 |
| 47107A | SHM-10-131, 133 | 18.3 | 15.5 | 76.0 | 295.8 | 10.55 |
| 47107A | SHM-10-131, 133 | 18.3 | 14.5 | 72.0 | 276.7 | 9.99 |
| 13.3.5 | Acid-Base Accounting and Humidity Cell Test Work |
Spent ore generated from the previously received core material were utilized for acid-base accounting and humidity cell test work. The composite samples were generated from splits of previously crushed material (100% passing 37.5 millimeters) which were combined according to rock type to generate six (6) composite samples weighted by interval length. In addition to the composite samples, a sample of spent ore was utilized for testing. Portions were split from each composite and the spent ore material and utilized for test work. A list of the samples utilized for the test work is presented in Table 13-15.
| | |
| November 2012 | Shahuindo Project | 169 |
| |
|
MINE DEVELOPMENT ASSOCIATES |
| |
| Table 13-15 | Samples Utilized in ABA Testing |
| |
| KCA Sample No. | Description |
| 47179 | Rock Type 10 Waste |
| 47180 | Rock Type 20 Waste |
| 47181 | Rock Type 30 Waste |
| 47182 | Rock Type 40 Waste |
| 47183 | Rock Type 50 Waste |
| 47184 | Sulfide Waste |
| 47185B | Spent Ore |
| 13.3.6 | Acid-Base Accounting |
Acid-base accounting (ABA) is a static test to determine the acid producing or acid neutralizing potential of a material. It is a general analysis for the elements of acid generation and does not indicate the potential rate at which generation or neutralization may occur. ABA tests were conducted on dried portions of each sample pulverized to 100% passing 0.106 millimeters.
The Rock Type 10, 20, 30, 40 and 50 Waste samples performed similarly in the ABA testing. Small sulfur contents were noted as were small neutralization potentials. The pulp pH values indicated some acid generation occurred; however, the acid-base balance did not indicate a strong potential for acid generation or acid neutralization. The accounting indicated the samples might tend toward the acidic side but the quantities of sulfur available to adjust the pH were small.
The Sulfide Waste material indicated a strong potential for acid generation. The potential acid generation largely outweighed the neutralization potential and the pulp pH confirmed acidic tendencies.
The Spent Ore material indicated a potential for acid neutralization. The accounting balance suggested the neutralization potential outweighed the acid generating potential and the pulp pH also suggested neutralization tendencies. There were, however, some quantities of potentially acid generating material though not as abundant as the neutralizing constituents.
| | |
| November 2012 | Shahuindo Project | 170 |
| |
|
MINE DEVELOPMENT ASSOCIATES |
| 13.3.7 | Humidity Cell Test Work |
Kinetic humidity cell tests were completed on the samples. The procedure utilized for each humidity cell test was taken from ASTM D 5744-96.
The Rock Type 10, 30, 40 and 50 Waste samples were inconclusive in ABA testing, potentially showing a slight preference toward acid production. The humidity cell testing confirmed the tendency of the samples to produce effluents with pH values periodically lower than the target guidelines (pH 6 to 9) as set by the International Finance Corporation (IFC). Only periodic values were observed exceeding several of the other target IFC guidelines. From the waste samples, occasional mercury assays exceeded the target limit. Though not specified in the IFC guidelines, the effluents also contained measurable quantities of aluminum and antimony.
The Rock Type 20 Waste material continued to show an overall downward trend in the pH values as leaching progressed. Notable concentrations of arsenic, iron and lead were also detected in the leach solutions.
The Sulfide Waste material was predicted to be acid generated in the ABA test work and, accordingly, the humidity cell testing of the material produced an acidic effluent. Consequently, the effluent also contained high quantities of arsenic, cadmium, chromium, copper, iron, nickel and zinc. Though guidelines were not provided by the IFC, appreciable quantities of aluminum, antimony, beryllium and manganese were also noted.
The Spent Ore material was predicted to be potentially acid neutralizing based on the ABA test work. In the humidity cell testing, the pH of the Spent Ore effluent solution was notably higher than that of the other humidity cell tests, occasionally exceeding the upper IFC guideline limit. The effluent solutions were also high for arsenic, iron, lead and mercury. Though aluminum and antimony were not specified in the IFC guidelines, measurable quantities were noted in the effluent solutions.
Based on the test work, only the Sulfide Waste material is likely to be acid generating. Though the Rock Type 10, 20, 30, 40 and 50 Waste samples have low pH effluents, testing did not suggest that these samples would start producing appreciable quantities of acid. However, these samples will require some pH adjustment to keep the effluents within the IFC guidelines. The Spent Ore material produced effluents with high pH values, neutralizing any acid produced in the cell during testing. The trends in the sulfate and calcium and magnesium productions suggest the neutralizing tendency
| | |
| November 2012 | Shahuindo Project | 171 |
| |
|
MINE DEVELOPMENT ASSOCIATES |
would have continued. Depending on the quantities of waste rock and spent ore, the neutralizing potential of the spent ore may be utilized to buffer the waste rock material effluent.
A series of comminution tests were completed by Phillips Enterprises. The results are summarized in the following Table 13-16. The results indicate soft to medium hard ore with low to medium abrasion indices.
| |
| Table 13-16 | Bulk Sample Work Index Results |
| | | | | |
KCA
Sample
No. | Rock
Code | KCA-
Phillips
I.D | Ball Mill Work
Index kWhr/mt | Crushing Work
Index kWhr/mt | Abrasion Index |
|
|
|
|
| 45040 | 20 | 45049 | 5.33 | 7.76 | 0.0222 |
| 45041 | 30/20 | 45050 | 8.51 | 3.36 | 0.0013 |
| 45042 | 40/30 | 45051 | 10.85 | 6.25 | 0.1267 |
| 45044 | 50 | 45053 | 6.59 | 8.88 | 0.0115 |
| 45045 | 20 | 45054 | 2.14 | 2.61 | 0.0020 |
| 45046 | 20/40 | 45055 | 11.00 | 13.04 | 0.2799 |
| 45048 | 50/20 | 45057 | 10.37 | 13.86 | 0.4026 |
| | | |
| November 2012 | Shahuindo Project | 172 |
| |
|
MINE DEVELOPMENT ASSOCIATES |
Mineral resource estimation described in this Technical Report for the Shahuindo Project follows the guidelines of Canadian National Instrument 43-101 (NI 43-101). The modeling and estimation of gold and silver resources, which were completed in July 2012, were done under the supervision of Paul G. Tietz, a qualified person with respect to mineral resource estimation under NI 43-101. Mr. Tietz is independent of Sulliden by the definitions and criteria set forth in NI 43-101; there is no affiliation between Mr. Tietz and Sulliden except that of an independent consultant/client relationship.
The current mineral resource estimates are an update on the mineral resource estimates completed in 2011 by MDA (Tietz and Kappes, 2011).
Although MDA is not an expert with respect to any of the following factors, except as described below, MDA is not aware of any unusual environmental, permitting, legal, title, taxation, socio-economic, marketing, or political factors that may materially affect the Shahuindo mineral resources as of the date of this report. As described in Section 4.6, Section 4.1.3, and in the following Mineral Resource Section 14.10, a small portion of the resource that lies on Sulliden’s land is currently being mined by illegal or informal local miners, but their activity impacts less than two percent of the resource. MDA cannot assess the possible impact this activity may have on future development of the project by Sulliden.
The mineral resources described in this section are based on drilling completed through the end of 2011 and the subsequent drill information provided to MDA by Sulliden up through the May 17, 2012 effective date of the report. The resource estimates discussed in this section were finalized July 13, 2012.
Sulliden core and RC drilling has continued into the first half of 2012. The new drilling has not been evaluated, and its effect on the resource has not been quantified.
The Shahuindo Project drill data, as well as 2-meter-contour digital topography of the project area, were provided to MDA by Sulliden and incorporated into a digital database. The drill-hole information included collar, down-hole survey, assay, lithology, oxidation, and alteration data.
| | |
| November 2012 | Shahuindo Project | 173 |
| |
|
MINE DEVELOPMENT ASSOCIATES |
The Shahuindo Project assay database contains 827 drill holes and a total of 94,441 gold assays, 93,073 silver assays, 69,103 total-sulfur analyses, and 9,800 sulfide-sulfur analyses. Approximately 90 percent of the drill data are within or directly adjacent to the current resource boundary and was used in the creation of the geologic models and subsequent resource estimation. The details of MDA’s audit and the subsequent changes to the original Sulliden database are provided in Section 12.1.
Drill collars are located in relation to a surveyed exploration grid with a base line along azimuth 125 degrees and origin at UTM 807,479.37 meters East, 9,157,980.00 meters North. The project grid uses the PSAD 56 datum for zone 17. The base-line orientation is approximately perpendicular to the general strike of the deposit. The majority of drill holes are angle holes oriented at azimuths of around 35 degrees or 205 degrees to intersect the main structural trend of the deposit at a high angle.
Approximately 60 percent of the gold assays within the resource area are from diamond core drilling and the remainder from RC drilling. A statistical comparison of the core versus RC assay data, as described in Section 10.7, indicates no significant differences between the drill types. MDA believes both the RC and core data are acceptable for use in the resource estimate.
As discussed in Sections 7.0 and 8.0, the Shahuindo deposit has been sub-divided into four zones due to the unique geologic characteristics of each zone. Moving from west to east along the strike of the deposit, these are the West, Central, East, and Moyan Alto zones. These sub-divisions were used in the analyses of the drill assay data and in the development of resource modeling concepts.
| 14.3 | Geology Pertinent to the Resource Model and Estimation |
Gold and silver mineralization at Shahuindo is controlled by both structure and lithology. Typically best developed in variably silicified, polymictic and monomictic brecciated sandstone and siltstone of the Carhuaz Formation, mineralization also has been encountered within shale and siltstone of the underlying Santa Formation, where drilling has been deep enough to reach this unit. The mineralized breccias developed along moderately southwest-dipping to near-vertical sub-parallel structures that appear to flatten to the southwest at depth. Stratigraphic control is seen in the upper elevations in the East Zone, where mineralization and associated pervasive silicification occur within sub-horizontal sandstone horizons believed to be the Farrat Formation.
| | |
| November 2012 | Shahuindo Project | 174 |
| |
|
MINE DEVELOPMENT ASSOCIATES |
Higher-grade (>0.7 g Au/t) mineralization occurs predominantly within the structural polymictic breccias with the degree of brecciation and mineral grades decreasing outward into the pervasively fractured wall rock. Mineralized structures can be up to 25 meters wide, though widths of 5 meters to 10 meters are more common. Along the northwest-trending core of the deposit, the mineralized structures often are lensoid, both along strike and down-dip. The structures can intersect and sub-divide, with significant mineral grades (>2 g Au/t) forming at the structural intersections and within the more prominent structures. North- and northeast-trending cross-structures have been mapped in the East, West, and Central zones, though many of these structures are not identified in the drilling due to the sub-parallel orientation of the drill pattern. North-trending mineralized structures outcrop on the cliff on the north side of the East Zone. These were encountered in drilling and modeled as unique structures.
Within the West and Central zones, higher-grade mineralization is often localized along contacts with a variably clay-altered quartz-feldspar porphyry intrusive rock. The porphyry intrusion forms a single large intrusive mass bounding the southern edge of the mineralization for much of the West Zone. The intrusion transitions into separate near-vertical or steeply southwest-dipping “dikes” going from the West Zone into the Central Zone, with the easternmost extent of porphyry occurring within the west side of the East Zone. Though the intrusive rocks within the Central Zone have the spatial characteristics of near-vertical dikes, there is some question whether the intrusion has been emplaced along pre-existing structural fabric or whether much of the structural movement post-dates intrusive emplacement and the porphyry units are remnant slices caught between sub-parallel structures. Regardless of its origin, the porphyry appears to be pre-mineral but does not serve as a good host for mineralization with only sporadic, low-grade gold and silver values within the altered porphyry.
In addition to the bedrock mineralization, colluvial “overburden” material containing weak to moderate gold and weak silver mineralization occurs in the West and Central zones. The mineralized overburden directly overlies the mineralized bedrock and also occurs downslope to the north, where it was shed from areas of previously outcropping mineralization.
The Shahuindo deposit contains both shallow oxidized and underlying sulfidic mineralization, with the latter unoxidized material containing up to 10-15 percent pyrite. Surface weathering and associated oxidation occur at variable depths along the strike of the deposit, with the base of oxidation lying within 15 meters of the topographic surface in parts of the West Zone then generally increasing to depths of up to 200 meters in the East Zone. The redox boundary can be fairly sharp with the transition to sulfide-
| | |
| November 2012 | Shahuindo Project | 175 |
| |
|
MINE DEVELOPMENT ASSOCIATES |
dominant material occurring over just a few meters, although in many parts of the deposit the transition zone can be over 50 meters thick. Within this transition zone, a mixture of oxidized, partially oxidized, and sulfidic material can be encountered. Strongly oxidized material is often found below sulfide-dominant material, which is believed to be due to differential oxidation both along preferred stratigraphic horizons and near-vertical structures.
Silver mineralization is strongly leached with a resulting decrease in metal grade within the oxide zone and related enrichment within the transition zone and top of the sulfide zone. Silver values are on average about five times greater in the enriched horizon than in the overlying oxide zone. The transition from leached to enriched silver can be fairly abrupt and has been used by MDA as one of the markers in determining the base of the oxide zone within the deposit.
Lithology, oxidation, silicification, and gold and silver mineral-domain models were created for the Shahuindo Project. These models were used to assign density values, control grade estimation, determine metallurgical rock types, and classify the resource estimate. All models are based on cross-sectional interpretations drawn on 83 unique cross sections oriented perpendicular to the azimuth 125-degree exploration base line. The cross-sections are spaced 50 meters apart except for the three westernmost sections, which are spaced 100 meters apart. The cross sections are oriented perpendicular to the general strike of the deposit. All drill data, which included extensive re-logging of many of the older RC and core holes by Sulliden personnel, were used in the sectional interpretations. All five of the cross-sectional models were further refined in 3-D using 8-meter-spaced level plans. The lithology and mineral domain level-plan models were used to code the block model on a partial percentage basis, while the silicification and oxidation models coded the block model on a block in-block out basis. All modeling of the Shahuindo gold and silver resources was performed using Gemcom Surpac®mining software.
The lithologic model consists of three rock types: the variably altered sedimentary package, the felsic porphyry intrusion, and in the Central and the east end of the West zones, an overburden layer that can be up to 70 meters thick. MDA explicitly modeled the porphyry intrusion and overburden units on the 50-meter-spaced cross-sections, with the sedimentary rocks considered the default unit wallrock to the intrusion and below the overburden where applicable. The porphyry and overburden units were explicitly
| | |
| November 2012 | Shahuindo Project | 176 |
| |
|
MINE DEVELOPMENT ASSOCIATES |
modeled due to their evident control on gold and silver distribution. MDA believes that a unique brecciation model should be developed in the future, since it is likely that this rock type would assist in defining the potentially higher-grade mineralized structures.
The cross-sectional porphyry interpretations were digitized, then sliced at 8-meter vertical intervals, and the resultant slices were transferred to level plans. The porphyry was then re-interpreted on the 8-meter-spaced level plans in order to rectify the geology to the drill-hole data. Level plans, and not solids, were used for the 3-D rendering of the porphyry due to the detailed and often irregular morphology of the intrusive contacts. MDA did not believe that solids that would accurately portray the intrusive material could be constructed in a reasonable time-frame. This portrayal is critical to the deposit, since much of the higher-grade mineralization lies along the intrusive contacts.
Conversely, due to the more continuous, smooth, sub-horizontal nature of the overburden/bedrock contact, the cross-sectional overburden interpretations were first snapped to drill holes to rectify in 3-D, and a solid was then created enclosing the overburden material. The solid was sliced at the same 8-meter intervals as the porphyry, resulting in level plans of the overburden.
The porphyry and overburden level plans were then used to guide the mineral domain interpretations and also code the block model for use in determining block density (see discussions below in Section 14.4.4, Section 14.4.5, and Section 14.5).
An oxidation model of the deposit spatially defined three zones: an oxide-dominant zone, a sulfide-dominant zone, and, for much of the central core of the deposit, a generally thin mixed oxide/sulfide transitional zone. These zones were used primarily to assign general metallurgical characteristics to the mineralization to be used in the determination of resource cut-off grades. The oxidation zones also helped guide the silver domain model and were used in the classification of the resource. Due to a relative lack of metallurgical test work, the sulfide-dominant material is restricted to an Inferred classification. The mixed oxide/sulfide zone can be up to 50 meters thick though is generally less than 10m thick and in much of the deposit is not modeled due to the apparent sharp oxide/sulfide contact.
The oxidation zones are based on cross-sectional interpretations of the drill data, primarily the geologist’s logging of the presence of oxide and sulfide minerals. MDA also used the total sulfur geochemical data and the more limited sulfide-sulfur assay data to
| | |
| November 2012 | Shahuindo Project | 177 |
| |
|
MINE DEVELOPMENT ASSOCIATES |
further define the oxidation model. Bottle-roll and column leach testing by KCA indicates a relationship between sulfide-sulfur and metal recovery (see Section 13.0). The use of the total sulfur data is problematic in portions of the deposit which have sparse sulfide-sulfur data due to the presence of sulfate minerals, primarily jarosite, which can create errors in determining sulfide-content when evaluating high total-sulfur values. The evaluation of the total-sulfur data was always done in concert with the other oxidation factors and often required a review of the core photos and drill logs to aid in the determination of mineral type.
As discussed above, the oxide zone is marked by significant leaching of the silver content with enrichment at the top of the sulfide zone or within the mixed zone. The presence of high silver values, especially in association with increased total sulfur data, often led to a localized re-appraisal of the location of the oxide boundary. MDA recognizes that silver-bearing jarosite (argentojarosite) has been identified in past mineralogical work, so the occurrence of both high silver and total sulfur does not necessarily imply the presence of reduced sulfide-sulfur.
Cross-sectional interpretation of the oxide/mixed and mixed/sulfide boundaries, often guided by lithologic contacts and interpreted structural zones, were created. These boundaries were digitized and then snapped to drill holes to rectify in 3-D. Two solids were created: one enclosing the oxide and the other enclosing the sulfide material. Due to the complexity of the oxide-mixed-sulfide contacts and their importance in controlling both grade estimation and classification, the oxidation solids were further refined in 3-D using 8-meter-spaced level plans. The level plans were used to code the block model on a block in-block out basis. Material not coded into one of these material types was coded as mixed.
| 14.4.3 | Silicification Model |
The sedimentary package is variably silicified, with the silicification believed to be pre-mineral. Due to the different specific gravity measurements observed in the silicified versus unsilicified rock, a silicification model was created to bring further definition to the resource model rock densities (see Section 14.5),
Silicification was modeled on cross-section using the geologist’s logging of the degree and extent of silicification observed in each drill hole. Silicified areas were modeled which represent general areas of moderate to strong silicification. Due to the often variable nature of the degree of silicification, these silicified areas will contain some weakly to unsilicified material.
| | |
| November 2012 | Shahuindo Project | 178 |
| |
|
MINE DEVELOPMENT ASSOCIATES |
The cross-sectional silicification interpretations were digitized, then sliced at 8-meter vertical intervals, and the resultant slices were transferred to level plans. The silicification was then re-interpreted on the 8-meter-spaced level plans in order to rectify to the drill-hole data. The level-plan interpretations were then used to code the block model.
| 14.4.4 | Gold Mineral Domain Model |
MDA modeled the Shahuindo gold mineralization by interpreting mineral-domain polygons on the west-northwest-looking cross sections that span the extent of the resource area. A mineral domain encompasses a volume of ground that ideally is characterized by a single, natural, grade population of a metal that occurs within a specific geologic environment.
In order to define the bedrock mineral domains at Shahuindo, the natural gold populations were first identified on quantile graphs that plot the gold-grade distribution of the drill-hole assays. Unique quantile graphs were created for each of the four resource zones to determine if the gold populations differed between zones. Ultimately, the quantile plots, along with additional spatial and geologic analyses of the resulting gold populations, led to the identification of three separate grade populations (mineral domains) for the West Zone and four separate gold-grade populations for the Central, East, and Moyan Alto zones.
The low-grade (generally <0.7 g Au/t) gold domain (domain 100) in all four zones generally represents mineralization associated with a) fractured and weakly brecciated sedimentary rocks wallrock to the more strongly mineralized structures, or b) altered porphyry along the contact with the mineralized sedimentary rocks. This low-grade domain contains by far the largest gold population and is volumetrically the most prominent gold domain within the deposit. The mid- and high-grade domains (domains 200 and 300), and within the Central and East zones a very high-grade domain (domain 400), all represent mineralization (see discussion below for specific gold grades in each domain) associated with mineralized structures that in most cases are continuous between sections and in general follow the west-northwest strike of the deposit. The gold-grade transition between the low- and mid-grade domains is often gradual over a few meters, though this transition can be very sharp along the sedimentary rock/porphyry contacts. The higher-grade mineralization is generally less continuous and forms thin lenses within the through-going structures. Often, the high-grade
| | |
| November 2012 | Shahuindo Project | 179 |
| |
|
MINE DEVELOPMENT ASSOCIATES |
mineralization is localized along the sedimentary rock/porphyry contacts, indicating a damming effect from the clay-rich intrusive rock.
The West Zone low-grade gold domain (domain 100) is characterized by a range of grades of ~0.1 g Au/t to ~0.5 g Au/t. The lower-grade boundary is gradual with no sharp statistical break with the weakly mineralized material outside of this domain. This boundary correlates with the gradual decrease in associated fracturing and sporadic small structural breccias along the edges of the deposit. MDA set 0.1 g Au/t as a reasonable grade boundary below which there is only minor economic benefit for the inclusion of these lower grades into the resource model. The mid-grade gold domain (domain 200) associated with the mineralized structures is characterized by a range of grades of ~0.5 g Au/t to ~2.0 g Au/t, while the high-grade gold domain (domain 300) is defined by grades generally exceeding ~2 g Au/t.
The Central and Moyan Alto zone gold populations are very similar, and these zones were combined for further statistical analyses and subsequent use in the resource model. The low-grade gold domain (domain 100) is characterized by a range of grades of ~0.1 g Au/t to ~0.7 g Au/t. The lower-grade boundary is marked by a more evident, but still gradual statistical break in the quantile plot, and MDA set 0.1 g Au/t as a reasonable grade boundary. The mid-grade gold domain (domain 200) associated with the mineralized structures is characterized by a range of grades of ~0.7 g Au/t to ~2.4 g Au/t, while the high-grade gold domain (domain 300) is defined by grades of ~2.4 g Au/t to ~6.0 g Au/t. A very high-grade domain is recognized in the Central Zone that contains grades generally exceeding ~6.0 g Au/t. This very high-grade domain was created to restrict the spatial influence of these isolated drill intercepts, while still allowing for the recognition of localized high grades within the deposit.
The East Zone low-grade gold population (domain 100) has the same range of grades of ~0.1 g Au/t to ~0.7 g Au/t as the Central and Moyan Alto zones. The East Zone mid-grade gold domain (domain 200) is characterized by a range of grades of ~0.7 g Au/t to ~1.5 g Au/t, while the high-grade gold domain (domain 300) is defined by grades of ~1.5 g Au/t to ~6.0 g Au/t. As with the Central and Moyan Alto zones, a very high-grade domain is recognized that contains grades generally exceeding ~6.0 g Au/t. The lower boundary (~1.5 g Au/t) of the high-grade domain is primarily associated with the increased stratigraphic control to mineralization seen in the upper elevations of the East Zone. The high-grade material is more continuous within the favorable, silicified sandstone horizon, though the grade boundaries can be more diffuse.
| | |
| November 2012 | Shahuindo Project | 180 |
| |
|
MINE DEVELOPMENT ASSOCIATES |
In addition to these bedrock mineral domains, the colluvial overburden material that overlies or was shed from areas of outcropping mineralization was modeled where the overburden material consistently contains gold. Two gold domains (domains 10 and 12) were modeled within the overburden mineralization. The majority of the overburden mineralization is characterized by low-grade gold mineralization (domain 10) defined by grades of ~0.1 g Au/t to ~0.7 g Au/t. Close-spaced drilling within the Central Zone indicates a second higher-grade portion of the overburden (domain 12) that is characterized by grades exceeding ~0.7 g Au/t. Due to the relatively continuous nature of the overburden mineralization, as shown by the drill program completed by Sulliden in 2011, a resource classification of Indicated is appropriate for the more well-defined areas of overburden mineralization.
Once the mineral domains were determined, the drill-hole traces, topographic profile, and MDA geologic and gold interpretations were plotted on the cross-sections, with gold assays (colored by the grade-domain population ranges) and pertinent structural and oxidation codes plotted along the drill-hole traces. Mineral-domain polygonal envelopes were interpreted on the sections using available and reasonably assumed geologic criteria to encompass gold values that more-or-less correspond to each of the defined grade populations. Cross sections illustrating the gold domains superimposed over the geology are given in Figure 14-2, Figure 14-3, and Figure 14-4 for the West, Central, and East zones, respectively. Locations of these cross-sections and the associated resource zones in plan view are shown in Figure 14-1.
| | |
| November 2012 | Shahuindo Project | 181 |
| |
|
MINE DEVELOPMENT ASSOCIATES |
| |
| Figure 14-1 | Shahuindo Deposit Drilling with Resource Zones and Cross-section Locations |
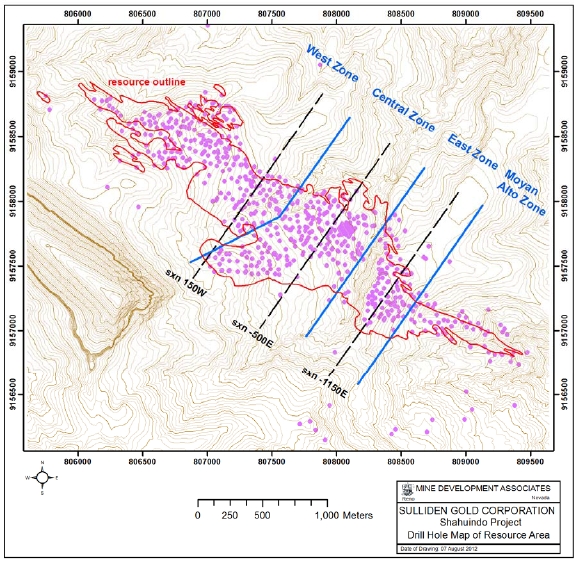
| | |
| November 2012 | Shahuindo Project | 182 |
| |
|
MINE DEVELOPMENT ASSOCIATES |
| |
Figure 14-2 | Shahuindo Deposit West Zone Cross Section 150W Showing Gold Mineral Domains |
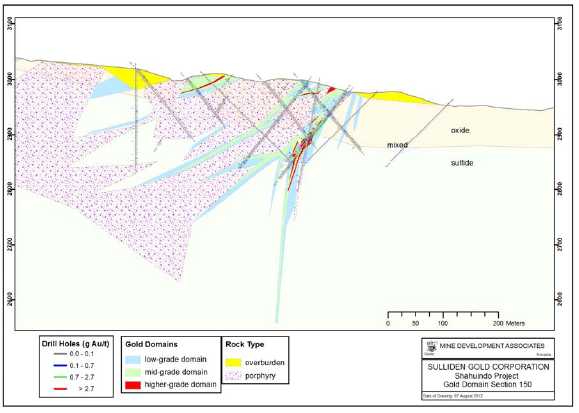
| | |
| November 2012 | Shahuindo Project | 183 |
| |
|
MINE DEVELOPMENT ASSOCIATES |
| |
Figure 14-3 | Shahuindo Deposit Central Zone Cross Section -500E Showing Gold Mineral Domains |
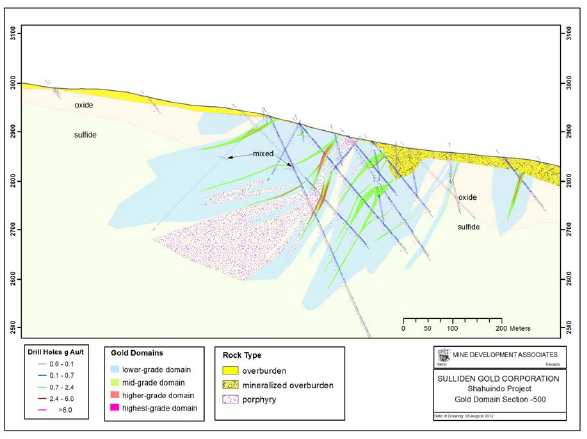
| | |
| November 2012 | Shahuindo Project | 184 |
| |
|
MINE DEVELOPMENT ASSOCIATES |
| |
Figure 14-4 | Shahuindo Deposit East Zone Cross Section -1150E Showing Gold Mineral Domains |
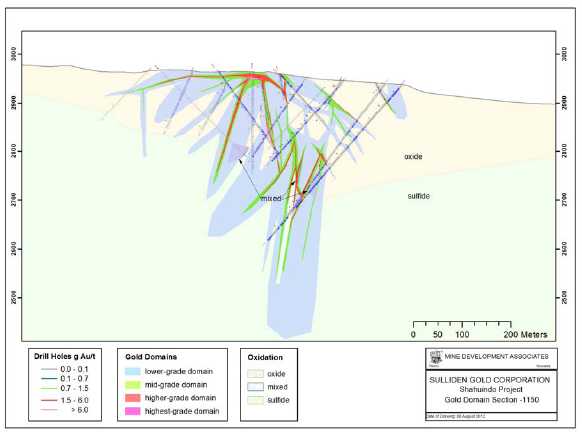
| | |
| November 2012 | Shahuindo Project | 185 |
| |
|
MINE DEVELOPMENT ASSOCIATES |
The cross-sectional mineral-domain envelopes were digitized; the digitized envelopes were sliced at 8-meter vertical intervals; and the resultant slices were transferred to level plans. Using the porphyry and overburden level-plan interpretations as a guide, the mineral domains were then re-interpreted on the 8-meter-spaced level plans in order to rectify the domains to the drill-hole data. The level-plan interpretations were then used to code the block model.
| |
| 14.4.5 | Silver Mineral Domain Model – Mixed and Sulfide Material Only |
Unique silver mineral domains were not modeled within the oxide portion of the deposit due to silver’s minor (<5%) contribution to the potential economic value within the average mined block. This low economic contribution results from the generally low-grade silver assay values combined with the probable 15 to 20 percent recovery of silver in the proposed heap-leach process. The expected silver recovery is about one-fifth of the expected gold recovery. To include the oxide silver value, MDA modeled the oxide silver data using the gold domains, and all statistical analyses, coding, compositing, and estimation of the oxide silver data are controlled by the gold-domain model.
The silver contribution to the mixed and sulfide block values is significantly greater due to increased metal grades within both the mixed and sulfide material plus higher expected silver recoveries for the sulfide-dominant material. The increase in silver recovery in the sulfide results from the proposed change to mill processing in order to economically treat the sulfide-dominant material. For these reasons, MDA created a unique silver model in the mixed and sulfide zones using the same statistical, mineral domain, and level-plan procedures as for the deposit-wide gold domains.
The silver assay data were first coded by oxidation type, and the mixed and sulfide samples were separated out into a single population. Quantile graphs of the silver-grade distribution in the mixed and sulfide samples were analyzed, and, as with the gold data, unique quantile graphs were created for each of the four resource zones. Ultimately, the quantile plots, along with additional spatial and geologic analyses of the resulting silver populations, led to the identification of three separate grade populations (mineral domains) to be used in the silver model. The statistical analysis indicated only minor differences between the four resource zones, so MDA used these same three mineral domains for the full deposit length. The low-grade silver population (domain 100) is characterized by a range of grades of ~10 g Ag/t to ~65 g Ag/t. The mid-grade silver domain (domain 200) is characterized by a range of grades of ~65 g Ag/t to ~200 g Ag/t, while the high-grade gold domain (domain 300) is defined by grades exceeding ~200 g Ag/t.
| | |
| November 2012 | Shahuindo Project | 186 |
| |
|
MINE DEVELOPMENT ASSOCIATES |
Silver mineral-domain polygons were interpreted on the west-northwest-looking cross sections that span the extent of the resource study, though the upper elevations of the polygons were limited by the approximate base of the oxide zone. The cross-sectional interpretation indicates that sulfide silver mineralization is associated with the structurally controlled gold mineralization, though there is irregular development of a sub-horizontal silver enrichment layer at the top of the mixed/sulfide zone. In general, the low-grade silver domain 100 polygons are spatially associated with the gold mid-grade domain 200 polygons and, in similar fashion, the silver mid-grade domains occur with the high-grade gold domains. Due to the above relationship, the low-grade silver domain is often nested within the much larger low-grade gold domain. To allow for the economic consideration of some, albeit low, silver value within the low-grade gold resource blocks that lie outside of the silver domain 100, MDA created an additional silver domain (domain 1) that mimics the low-grade gold domain 100. Silver drill assays and subsequent composites were coded to this domain for use in the resource estimate.
| |
| 14.5 | Density Values for Model |
The Shahuindo density database consists of 1,411 values determined from specific gravity measurements collected in 2004, 2005, 2010, 2011, and 2012 on drill core from the 1998, 2003, 2004, 2009, 2010, and 2011 drill campaigns (See Section 11.3 for a discussion of the testing programs). Samples for measurement have been collected from all significant rock types and from all five deposit zones along the length of the deposit. Seventeen specific gravity measurements were collected from holes outside of the immediate resource areas, and these were not used in determining the resource model density values
MDA used the lithology, oxidation, silicification, and gold mineral-domain models to assign a specific rock type to each density sample. After an analysis of all of the coded data, it was determined that 14 density values, each representing a unique rock type, would be assigned to the model. MDA’s initial analyses of the density data indicated five outlier data points within the oxide portion of the deposit, four with specific gravity values less than 1.4g/cm3and one with a specific gravity value greater than 2.9g/cm3. These sample values were limited (capped) at 1.4g/cm3and 2.9g/cm3, respectively. The general statistics for the modeled density types, are shown in Table 14-1. Due to the often highly fractured nature of the deposit, and the fact that voids resulting from many of the open fractures cannot be accurately reflected in density determinations, the measured density values were factored down by 1.5% to 3% to account for the unavoidable sample-selection bias. The overburden density was factored down by a
| | |
| November 2012 | Shahuindo Project | 187 |
| |
|
MINE DEVELOPMENT ASSOCIATES |
larger percentage due to the few samples collected and the sample bias in collecting representative overburden material. The factored data, shown in the “Model SG” column in Table 14-1, reflect the actual density values assigned to the Shahuindo block model.
| |
| Table 14-1 | Descriptive Statistics of Shahuindo Density Values by Rock Type |
| | | | | | | |
| Rock Type | Model SG
(g/cm3) | Specific Gravity Statistics (g/cm3) |
| Count | Mean | Median | Min. | Max. | Std.Dev. |
| Overburden | 1.80* | 15 | 2.11 | 2.07 | 1.68 | 2.59 | 0.26 |
| Unsilicified Sediment (Oxide) | 2.29 | 127 | 2.31 | 2.33 | 1.69 | 2.69 | 0.17 |
| Silicified Sediment (Oxide) | 2.37 | 57 | 2.37 | 2.45 | 1.83 | 2.59 | 0.20 |
| All Sediment (Mixed) | 2.55 | 36 | 2.57 | 2.61 | 2.09 | 2.91 | 0.18 |
| Unsilicified Sediment (Sulfide) | 2.45 | 125 | 2.50 | 2.49 | 1.40 | 3.40 | 0.30 |
| Silicified Sediment (Sulfide) | 2.58 | 39 | 2.63 | 2.64 | 2.16 | 3.40 | 0.26 |
| Porphyry (Oxide-Mixed) | 2.04 | 132 | 2.06 | 2.09 | 1.45 | 2.64 | 0.25 |
| Porphyry (Sulfide) | 2.25 | 46 | 2.26 | 2.31 | 1.71 | 2.75 | 0.27 |
| | | | | | | | |
| Mineralized Material (Oxide-Mixed only) | | | | | | | |
| Unsilicified Low Grade (~0.1-0.7g Au/t) | 2.15 | 268 | 2.18 | 2.20 | 1.54 | 2.90 | 0.25 |
| Silicified Low Grade | 2.30 | 227 | 2.32 | 2.36 | 1.59 | 2.87 | 0.23 |
| Unsilicified Moderate Grade (~0.7-2.0g Au/t) | 2.13 | 178 | 2.17 | 2.18 | 1.40 | 2.66 | 0.26 |
| Silicified Moderate Grade | 2.25 | 78 | 2.26 | 2.34 | 1.40 | 2.72 | 0.28 |
| Unsilicified High Grade (>2.0g Au/t) | 2.10 | 40 | 2.15 | 2.17 | 1.45 | 2.62 | 0.28 |
| Silicified High Grade | 2.20 | 25 | 2.32 | 2.35 | 1.91 | 2.61 | 0.23 |
* assigned value; density data is not representative
The upper portion of Table 14-4 shows the rock densities assigned to the various rock types based on oxidation and silicification types. The low density value for the porphyry is a reflection of the often pervasive clay alteration observed within this rock type. The increased density within the sulfide-bearing material reflects a pyrite content that is often greater than 10 percent of the rock volume.
Where the sedimentary rock within the oxide and mixed areas of the deposit are mineralized (>0.1 g Au/t), another set of rock densities is assigned based on gold grade (using the gold mineral domains discussed in Section 14.4.4) and silicification. These density values supersede the unmineralized wallrock densities discussed in the previous paragraph. In general, the mineralized rock densities have lower values than the unmineralized material and in all cases the densities increase with silicification.
A continuing program of specific gravity measurements is recommended due to the importance of bulk-density in the determination of resource tonnage.
| | |
| November 2012 | Shahuindo Project | 188 |
| |
|
MINE DEVELOPMENT ASSOCIATES |
| |
| 14.6 | Sample Coding and Capping |
Drill-hole gold and silver assays were coded to the mineral domains using the cross-sectional mineral-domain envelopes. The gold assays for all oxidation types (oxide, mixed, and sulfide) were coded using the gold mineral domains. The silver assay data were first separated for mineral domain coding by oxidation type, using the oxidation model solids discussed in Section 14.4.2, into two sets for coding: oxide samples and combined mixed/sulfide samples. As described in 14.4.5, the drill-hole silver assays within the oxide zone were coded using the gold mineral domains. The combined mixed/sulfide-coded silver assays were coded using the silver mineral domains created specifically for these oxidation zones due to the higher grades and greater metal value of the silver component. Descriptive statistics of the coded assays are provided in Table 14-2, Table 14-3, and Table 14-4.
The use of the gold domains to code the oxide silver assays (Table 14-3) is reflected in the higher variability within domains as indicated by the “CV” (coefficient of variability, which is calculated by Std. Dev./Mean Grade) values, which are consistently over 1.0. In contrast, the gold domains and the mixed and sulfide silver domains have CV’s consistently below 1.0.
The process of determining assay caps included inspection of quantile plots of the coded assays by domain and model zone to determine if multiple populations exist, as well as to identify possible high-grade outliers that might be appropriate for capping. Descriptive statistics of the coded assays by domain and visual reviews of the spatial relationships of the possible outliers and their potential impacts during grade interpolation were also considered. MDA decided to cap 33 gold samples and 62 silver samples for compositing and estimation purposes. The capped samples represent less than 0.1 percent of the gold data and 0.13 percent of the silver data. The effects of the assay caps can be qualitatively evaluated by examination of the descriptive statistics of the capped and uncapped mineral-domain assays in Table 14-2, Table 14-3, and Table 14-4.
In addition to the assay capping, search restrictions within the overburden (domain 10 and 12) and higher-grade portions of the silver oxide domains 100, 200, and 300 along with the silver mixed/sulfide domain 1 and 300 were applied during grade interpolations (discussed below).
| | |
| November 2012 | Shahuindo Project | 189 |
| |
|
MINE DEVELOPMENT ASSOCIATES |
| |
| Table 14-2 | Descriptive Statistics by Gold Mineral Domain – All Gold Samples |
| | | | | | | | |
Gold
Domain | Assays | Count | Mean
(g Au/t) | Median
(g Au/t) | Std. Dev. | CV | Min.
(g Au/t) | Max.
(g Au/t) |
| 10 | Au | 2344 | 0.188 | 0.146 | 0.206 | 1.099 | 0.005 | 6.950 |
| Au Cap | 2344 | 0.185 | 0.146 | 0.154 | 0.829 | 0.005 | 2.000 |
| 12 | Au | 354 | 0.634 | 0.493 | 0.6459 | 1.019 | 0.058 | 6.3 |
| Au Cap | 354 | 0.617 | 0.493 | 0.5241 | 0.849 | 0.058 | 4 |
| 100 | Au | 37040 | 0.244 | 0.192 | 0.199 | 0.815 | 0.000 | 6.560 |
| Au Cap | 37040 | 0.244 | 0.192 | 0.190 | 0.782 | 0.000 | 2.400 |
| 200 | Au | 7110 | 0.933 | 0.809 | 0.572 | 0.613 | 0.000 | 8.150 |
| Au Cap | 7110 | 0.933 | 0.809 | 0.567 | 0.607 | 0.000 | 5.500 |
| 300 | Au | 1360 | 4.007 | 3.010 | 3.649 | 0.911 | 0.125 | 40.100 |
| Au Cap | 1360 | 3.968 | 3.010 | 3.365 | 0.848 | 0.125 | 25.000 |
| 400 | Au | 103 | 12.266 | 8.960 | 8.396 | 0.685 | 1.065 | 50.900 |
| Au Cap | 103 | 12.266 | 8.960 | 8.396 | 0.685 | 1.065 | 50.900 |
| All | Au | 48311 | 0.480 | 0.230 | 1.160 | 2.419 | 0.000 | 50.900 |
| Au Cap | 48311 | 0.478 | 0.230 | 1.129 | 2.364 | 0.000 | 50.900 |
| |
| Table 14-3 | Descriptive StatisticsbyGoldMineralDomain–SilverOxideSamples Only |
| | | | | | | | |
Gold
Domain | Assays | Count | Mean
(g Ag/t) | Median
(g Ag/t) | Std. Dev. | CV | Min.
(g Ag/t) | Max.
(g Ag/t) |
| 10 | Ag | 2336 | 2.3 | 1.6 | 2.9 | 1.27 | 0.00 | 88.4 |
| Ag Cap | 2336 | 2.3 | 1.6 | 2.8 | 1.19 | 0.00 | 50.0 |
| 12 | Ag | 353 | 4.8 | 2.8 | 9.4 | 1.95 | 0.40 | 123.0 |
| Ag Cap | 353 | 4.8 | 2.8 | 9.4 | 1.95 | 0.40 | 123.0 |
| 100 | Ag | 25176 | 4.3 | 1.9 | 12.9 | 3.02 | 0.00 | 1495.0 |
| Ag Cap | 25176 | 4.2 | 1.9 | 8.9 | 2.13 | 0.00 | 175.0 |
| 200 | Ag | 5083 | 13.8 | 5.2 | 35.8 | 2.61 | 0.00 | 1615.0 |
| Ag Cap | 5083 | 13.1 | 5.2 | 24.6 | 1.88 | 0.00 | 250.0 |
| 300 | Ag | 943 | 50.7 | 14.9 | 137.8 | 2.72 | 0.00 | 2020.0 |
| Ag Cap | 943 | 44.0 | 14.9 | 81.9 | 1.86 | 0.00 | 500.0 |
| 400 | Ag | 73 | 68.7 | 32.9 | 103.5 | 1.507 | 2.00 | 714.0 |
| Ag Cap | 73 | 64.4 | 32.9 | 80.7 | 1.252 | 2.00 | 400.0 |
| All | Ag | 33964 | 7.1 | 2.2 | 31.1 | 4.41 | 0.00 | 2020.0 |
| Ag Cap | 33964 | 6.7 | 2.2 | 20.5 | 3.07 | 0.00 | 500.0 |
| | |
| November 2012 | Shahuindo Project | 190 |
| |
|
MINE DEVELOPMENT ASSOCIATES |
| |
Table 14-4 | Descriptive Statistics by Silver Mineral Domain – Silver Mixed and Sulfide Samples Only |
| | | | | | | | |
Silver
Domain | Assays | Count | Mean
(g Ag/t) | Median
(g Ag/t) | Std. Dev. | CV | Min.
(g Ag/t) | Max.
(g Ag/t) |
| 1 | Ag | 9284 | 3.2 | 2.1 | 4.7 | 1.47 | 0.0 | 184.0 |
| Ag Cap | 9284 | 3.2 | 2.1 | 4.5 | 1.40 | 0.0 | 75.0 |
| 100 | Ag | 4293 | 20.1 | 13.7 | 20.3 | 1.01 | 0.0 | 242.0 |
| Ag Cap | 4293 | 20.1 | 13.7 | 20.3 | 1.01 | 0.0 | 242.0 |
| 200 | Ag | 445 | 122.0 | 99.0 | 142.4 | 1.17 | 2.9 | 2670.0 |
| Ag Cap | 445 | 116.3 | 99.0 | 70.6 | 0.61 | 2.9 | 500.0 |
| 300 | Ag | 163 | 485.9 | 370.0 | 445.1 | 0.92 | 45.0 | 8500.0 |
| Ag Cap | 163 | 482.4 | 370.0 | 397.0 | 0.82 | 45.0 | 4000.0 |
| All | Ag | 14185 | 17.8 | 3.9 | 79.0 | 4.43 | 0.0 | 8500.0 |
| Ag Cap | 14185 | 17.6 | 3.9 | 72.1 | 4.10 | 0.0 | 4000.0 |
The capped assays were down-hole composited into 4 meters composites that honor the mineral-domain contacts. The composites were coded by the mineral-domain interpretations, and length-weighted composites were used in the block-model grade estimation. Table 14-5, Table 14-6, and Table 14-7 present the descriptive statistics of the composite database used for gold and silver estimation.
| |
| Table 14-5 | DescriptiveStatisticsbyGoldMineralDomain–AllGoldComposites |
| | | | | | | |
Gold
Domain | Count | Mean
(g Au/t) | Median
(g Au/t) | Std. Dev. | CV | Min.
(g Au/t) | Max.
(g Au/t) |
| 10 | 978 | 0.185 | 0.157 | 0.127 | 0.684 | 0.007 | 1.572 |
| 12 | 149 | 0.617 | 0.521 | 0.397 | 0.644 | 0.102 | 2.539 |
| 100 | 15389 | 0.244 | 0.210 | 0.144 | 0.591 | 0.000 | 2.400 |
| 200 | 3587 | 0.933 | 0.850 | 0.421 | 0.451 | 0.023 | 5.500 |
| 300 | 869 | 3.968 | 3.180 | 2.847 | 0.717 | 0.159 | 25.000 |
| 400 | 65 | 12.266 | 9.482 | 6.613 | 0.539 | 5.620 | 32.900 |
| All | 21037 | 0.478 | 0.246 | 1.045 | 2.187 | 0.000 | 32.900 |
| | |
| November 2012 | Shahuindo Project | 191 |
| |
|
MINE DEVELOPMENT ASSOCIATES |
| |
| Table 14-6 | Descriptive StatisticsbyGoldMineralDomain–SilverOxideComposites Only |
| | | | | | | |
Gold
Domain | Count | Mean
(g Ag/t) | Median
(g Ag/t) | Std. Dev. | CV | Min.
(g Ag/t) | Max.
(g Ag/t) |
| 10 | 973 | 2.3 | 1.6 | 2.3 | 1.0 | 0.0 | 32.0 |
| 12 | 148 | 4.8 | 3.0 | 6.8 | 1.4 | 0.6 | 55.4 |
| 100 | 10532 | 4.2 | 2.1 | 6.9 | 1.7 | 0.0 | 137.5 |
| 200 | 2548 | 13.1 | 6.3 | 20.9 | 1.6 | 0.0 | 250.0 |
| 300 | 614 | 44.0 | 16.4 | 75.1 | 1.7 | 0.0 | 500.0 |
| 400 | 47 | 64.4 | 34.6 | 73.1 | 1.1 | 2.0 | 400.0 |
| All | 14862 | 6.7 | 2.5 | 18.4 | 2.8 | 0.0 | 500.0 |
| |
Table 14-7 | Descriptive Statistics by Silver Mineral Domain – Silver Mixed and Sulfide Composites Only |
| | | | | | | |
Silver
Domain | Count | Mean
(g Ag/t) | Median
(g Ag/t) | Std. Dev. | CV | Min.
(g Ag/t) | Max.
(g Ag/t) |
| 1 | 4004 | 3.2 | 2.5 | 3.2 | 1.0 | 0.0 | 75.0 |
| 100 | 2080 | 20.1 | 16.0 | 14.6 | 0.7 | 0.6 | 138.0 |
| 200 | 284 | 116.3 | 106.1 | 54.4 | 0.5 | 6.8 | 346.0 |
| 300 | 124 | 482.4 | 392.0 | 310.9 | 0.6 | 82.0 | 4000.0 |
| All | 6368 | 44.8 | 18.0 | 106.9 | 2.4 | 0.6 | 4000.0 |
The 8-meter level-plan lithology (porphyry and overburden), oxidation, silicification, and mineral-domain polygons were used to code a three-dimensional block model that is comprised of 4 meters (wide) x 8 meters (long) x 8 meters (high) blocks. The block model is oriented so the long dimension is at a 305 degree azimuth. In order for the block model to better reflect the irregularly shaped limits of the various lithology and mineral domains, as well as to explicitly model block density and mineral grade dilution, the percentage volume of each lithology and mineral domain within each block is stored (the “partial percentages).
The oxidation and silicification level-plan models are used to code the block model in a block in-block out manner based on the location of the block centroid in relation to the level-plan polygons. The percentage of each block that lies below the topographic surface is also stored for use in the calculation of block tonnages.
| | |
| November 2012 | Shahuindo Project | 192 |
| |
|
MINE DEVELOPMENT ASSOCIATES |
A variographic study was performed using the gold composites from each mineral domain, collectively and separately, at various azimuths, dips, and lags. The study was complicated by the fact that the mineralization in localized areas can occur in multiple orientations due to structural complexities. Acceptable variogram models were obtained from composites from gold domain 100, as well as all gold domains together. A maximum range of about 120 meters was obtained in the horizontal direction at an azimuth of 300° with a corresponding range of 80 meters in the -90 degree semi-major direction; these are geologically reasonable orientations for the global strike and dip of the mineralization, respectively. Parameters obtained from the variography study were used in an ordinary krige interpolation and also provided information relevant to both the estimation parameters used in an inverse-distance interpolation and resource classification.
The estimation parameters applied to the gold- and silver-grade estimations at Shahuindo are summarized in Table 14-8. The first-pass search distances take into consideration the results of both the variography and drill-hole spacing. The second and third passes were designed to estimate grade into all blocks coded to the mineral domains that were not estimated in the first pass.
Gold and silver grades were interpolated using inverse distance to the third power, ordinary krige, and nearest-neighbor methods. The mineral resources reported herein were estimated by inverse-distance interpolation, as this technique was judged to provide results superior to those obtained by ordinary kriging. The nearest-neighbor estimation was also completed as a check on the other interpolations.
The estimation passes were performed independently for each of the mineral domains, so that only composites coded to a particular domain were used to estimate grade into blocks coded by that domain. The estimated grades were coupled with the partial percentages of the mineral domains to enable the calculation of a single weight-averaged block-diluted grade for each block. For those blocks along the edge of the deposit, gold grades were estimated into that portion of the block designated as “waste” using gold composites of weakly mineralized drill intervals not previously coded to a gold domain. This resulted in a more realistic grade break along the deposit edge representative of the gold assay population. This procedure was not done for the silver
| | |
| November 2012 | Shahuindo Project | 193 |
| |
|
MINE DEVELOPMENT ASSOCIATES |
block grades due to the very low silver grades and the immaterial contribution the additional silver would add to the block value.
As discussed above in domain modeling, the majority of Shahuindo mineralization has a west-northwest strike and near-vertical dip. There are four other mineral orientations within the deposit, and the presence of multiple mineral orientations necessitated the use of multiple search ellipses. See Table 14-9 for search ellipse parameters.
Multiple populations were captured in the gold and silver overburden domains and in many of the bedrock silver domains. In order to control the higher-grade populations in each of these domains, restrictions on the search distances of the higher-grade population were implemented. See Table 14-10 for search restriction details.
| |
| Table 14-8 | Shahuindo Estimation Parameters |
| |
| All Mineral Domains |
| Description | Parameter |
| Samples: minimum/maximum/maximum per hole | 2 / 9 / 3 |
| Rotation/Dip/Tilt (variogram and searches) | See below |
| First Pass Search (m): major/semi-major/minor (vertical) | 75 / 75 / 35 |
| Second Pass Search (m): major/semi-major/minor (vertical) | 250 / 250 / 200 |
| Third Pass Search (m): major/semi-major/minor (vertical) | Fill domain / isotropic |
| Inverse distance power | 3 |
| High-grade restrictions (grade in g Au/t and distance in m) | See below |
| |
| Table 14-9 | Shahuindo Search Ellipse Orientations |
| | | |
| Estimation Area | Major
Bearing | Plunge | Tilt |
| General Shahuindo Deposit | 300° | 0° | 90° |
| Overburden mineralization | 0° | 0° | 0° |
| Main mineralized corridor within Central and West zones | 300° | 0° | 70° |
| Corridor A mineralization south of Central and West zones | 300° | 0° | 15° |
| Near-surface stratigraphic mineralization within East Zone | 0° | 0° | 0° |
| North-trending structures on north side of East Zone. | 0° | 0° | 90° |
| Southwest-dipping stratigraphic mineralization south of East Zone | 300° | 0° | 45° |
| | |
| November 2012 | Shahuindo Project | 194 |
| |
|
MINE DEVELOPMENT ASSOCIATES |
| |
| Table 14-10 | Shahuindo Mineral Domain Search Restrictions |
| | | |
| Domain | Grade Threshold
(g Au/t or g Ag/t) | Search
Restriction (m) | Estimation
Pass |
| Au 10 | >0.7 | 25 | all |
| Au 12 | >1.2 | 10 | all |
| Ag 10 | >9.0 | 10 | all |
| Ag 12 | >9.0 | 10 | all |
| Ag 100 (oxide) | >20 | 50 | all |
| Ag 200 (oxide) | >100 | 25 | all |
| Ag 300 (oxide) | >200 | 25 | all |
| Ag 1 (M+S)* | >9 | 35 | all |
| Ag 300 (M+S)* | >500 | 50 | all |
* M+S: mixed plus sulfide
MDA classifies resources in order of increasing geological and quantitative confidence into Inferred, Indicated, and Measured categories to be in compliance with the “CIM Definition Standards - For Mineral Resources and Mineral Reserves” (2010) and therefore Canadian National Instrument 43-101. CIM mineral resource definitions are given below in regular type, while the CIM explanatory material is italicized:
Mineral Resource
Mineral Resources are sub-divided, in order of increasing geological confidence, into Inferred, Indicated and Measured categories. An Inferred Mineral Resource has a lower level of confidence than that applied to an Indicated Mineral Resource. An Indicated Mineral Resource has a higher level of confidence than an Inferred Mineral Resource but has a lower level of confidence than a Measured Mineral Resource.
A Mineral Resource is a concentration or occurrence of diamonds, natural solid inorganic material, or natural solid fossilized organic material including base and precious metals, coal, and industrial minerals in or on the Earth’s crust in such form and quantity and of such a grade or quality that it has reasonable prospects for economic extraction. The location, quantity, grade, geological characteristics and continuity of a Mineral Resource are known, estimated or interpreted from specific geological evidence and knowledge.
| | |
| November 2012 | Shahuindo Project | 195 |
| |
|
MINE DEVELOPMENT ASSOCIATES |
The term Mineral Resource covers mineralization and natural material of intrinsic economic interest which has been identified and estimated through exploration and sampling and within which Mineral Reserves may subsequently be defined by the consideration and application of technical, economic, legal, environmental, socio-economic and governmental factors. The phrase ‘reasonable prospects for economic extraction’ implies a judgment by the Qualified Person in respect of the technical and economic factors likely to influence the prospect of economic extraction. A Mineral Resource is an inventory of mineralization that under realistically assumed and justifiable technical and economic conditions might become economically extractable. These assumptions must be presented explicitly in both public and technical reports.
Inferred Mineral Resource
An ‘Inferred Mineral Resource’ is that part of a Mineral Resource for which quantity and grade or quality can be estimated on the basis of geological evidence and limited sampling and reasonably assumed, but not verified, geological and grade continuity. The estimate is based on limited information and sampling gathered through appropriate techniques from locations such as outcrops, trenches, pits, workings and drill holes.
Due to the uncertainty that may be attached to Inferred Mineral Resources, it cannot be assumed that all or any part of an Inferred Mineral Resource will be upgraded to an Indicated or Measured Mineral Resource as a result of continued exploration. Confidence in the estimate is insufficient to allow the meaningful application of technical and economic parameters or to enable an evaluation of economic viability worthy of public disclosure. Inferred Mineral Resources must be excluded from estimates forming the basis of feasibility or other economic studies.
Indicated Mineral Resource
An ‘Indicated Mineral Resource’ is that part of a Mineral Resource for which quantity, grade or quality, densities, shape and physical characteristics can be estimated with a level of confidence sufficient to allow the appropriate application of technical and economic parameters,
| | |
| November 2012 | Shahuindo Project | 196 |
| |
|
MINE DEVELOPMENT ASSOCIATES |
to support mine planning and evaluation of the economic viability of the deposit. The estimate is based on detailed and reliable exploration and testing information gathered through appropriate techniques from locations such as outcrops, trenches, pits, workings and drill holes that are spaced closely enough for geological and grade continuity to be reasonably assumed.
Mineralization may be classified as an Indicated Mineral Resource by the Qualified Person when the nature, quality, quantity and distribution of data are such as to allow confident interpretation of the geological framework and to reasonably assume the continuity of mineralization. The Qualified Person must recognize the importance of the Indicated Mineral Resource category to the advancement of the feasibility of the project. An Indicated Mineral Resource estimate is of sufficient quality to support a Preliminary Feasibility Study which can serve as the basis for major development decisions.
Measured Mineral Resource
A ‘Measured Mineral Resource’ is that part of a Mineral Resource for which quantity, grade or quality, densities, shape, and physical characteristics are so well established that they can be estimated with confidence sufficient to allow the appropriate application of technical and economic parameters, to support production planning and evaluation of the economic viability of the deposit. The estimate is based on detailed and reliable exploration, sampling and testing information gathered through appropriate techniques from locations such as outcrops, trenches, pits, workings and drill holes that are spaced closely enough to confirm both geological and grade continuity.
Mineralization or other natural material of economic interest may be classified as a Measured Mineral Resource by the Qualified Person when the nature, quality, quantity and distribution of data are such that the tonnage and grade of the mineralization can be estimated to within close limits and that variation from the estimate would not significantly affect potential economic viability. This category requires a high level of confidence in, and understanding of, the geology and controls of the mineral deposit.
| | |
| November 2012 | Shahuindo Project | 197 |
| |
|
MINE DEVELOPMENT ASSOCIATES |
MDA reports resources at cutoffs that are reasonable for deposits of this nature given anticipated mining methods and plant processing costs, while also considering economic conditions, because of the regulatory requirements that a resource exists “in such form and quantity and of such a grade or quality that it has reasonable prospects for economic extraction.”
Resource classification considered distance to the nearest sample, number of samples, geologic confidence, and mineral-domain continuity. The criteria for resource classification are given in Table 14-11.
| |
| Table 14-11 | Criteria for Shahuindo Resource Classification |
| |
| Oxide and Mixed Resource – Measured |
| Minimum no. of samples /minimum no. of holes / average distance (m) | 2 / 2 / 20 |
| No Measured within overburden | |
| |
| Oxide and Mixed Resource – Indicated |
| Minimum no. of samples /minimum no. of holes / average distance (m) | 2 / 2 / 50 |
| All material not classified above but lying within the modeled mineralized domains is Inferred |
| |
| Sulfide Resource – All Inferred |
There are Measured, Indicated, and Inferred resources within the Shahuindo deposit. Measured resources are restricted to well-defined oxide and mixed mineralization. Sulfide resources are restricted to Inferred primarily due to a) limited metallurgical characterization of this material type and b) some spatial and geologic uncertainty in the model. The mineralized overburden is restricted to Indicated and Inferred due to some uncertainties in grade continuity.
The informal mining activity by local small miners on a small hill in the west side of the West Zone has created some uncertainty in the resource tonnes and total ounces. As a result, MDA has decided to classify all material within the area of informal mining as Inferred. This restriction affects about 38,000 oz gold in the oxide and mixed zones, the great majority of which would be otherwise classified as Indicated. Because the informal mining represents less than two percent of the total Indicated resource, MDA does not consider the effects of the informal mining materially significant to the overall resource.
The stated resource is fully diluted to 8 meters by 8 meters by 4 meters blocks and tabulated on gold-equivalent (AuEq) grade cutoffs that are reasonable for deposits of this nature and for the expected mining conditions and methods. The block dimensions
| | |
| November 2012 | Shahuindo Project | 198 |
| |
|
MINE DEVELOPMENT ASSOCIATES |
were chosen as practical sizes for open-pit mining a deposit of this kind. The AuEq grade is calculated using the individual gold and silver grades of each block, along with a gold price of $1,300.00 per ounce gold and a silver price of $25 per ounce silver. For the oxide and mixed resource estimates, the AuEq grade calculation includes a 5:1 and 3:1, respectively, difference in gold versus silver recovery in the proposed heap-leach processing scenario (as suggested by the metallurgical test results described in Section 13.0).
The formulas used to calculate the AuEq grade are:
| | | |
| | • | Oxide Material: | g AuEq/t = g Au/t + (g Ag/t x 0.003846) |
| • | Mixed Material: | g AuEq/t = g Au/t + (g Ag/t x 0.006410) |
| • | Sulfide Material: | g AuEq/t = g Au/t + (g Ag/t x 0.019231) |
Although preliminary in nature, MDA believes there is sufficient information to make reasonable estimates of projected economic cutoffs that should not be materially different, under similar economic situations, when more definitive information is obtained.
The Shahuindo gold and silver reported resources, tabulated by reporting cutoffs, are shown in Table 14-12. At the reportable resource cutoffs, approximately 60 percent of the total resource is classified as Measured and Indicated. Approximately 95 percent of the oxide and mixed resource considered for potential open-pit, heap-leach mining is classified as Measured and Indicated.
A tabulation of the Shahuindo resources by oxidation type and classification at various cutoffs is presented in Table 14-12. The block-diluted resources in Table 14-12 are tabulated at various cutoffs in order to provide grade-distribution information, as well as to provide for economic conditions other than those envisioned by the cutoffs used for reporting purposes. The latter reporting cutoffs are highlighted in Table 14-13.
Figure 14-5, Figure 14-6, and Figure 14-7 present cross-section examples of the block model gold equivalent values.
| | |
| November 2012 | Shahuindo Project | 199 |
| |
|
MINE DEVELOPMENT ASSOCIATES |
| |
| Table 14-12 | Shahuindo Gold and Silver Reported Resource |
| | | | | | | |
| Class | Cutoff
(g AuEq/t) | Tonnes | g AuEq/t | g Ag/t | oz Ag | g Au/t | oz Au |
| Measured-Oxide | 0.200 | 40,500,000 | 0.619 | 8.1 | 10,530,000 | 0.588 | 766,000 |
| Measured-Mixed | 0.350 | 780,000 | 0.964 | 33.7 | 850,000 | 0.748 | 19,000 |
| Measured Total | variable | 41,280,000 | 0.626 | 8.6 | 11,380,000 | 0.591 | 785,000 |
| | | | | | | | |
| Indicated-Oxide | 0.200 | 104,840,000 | 0.506 | 6.3 | 21,080,000 | 0.482 | 1,624,000 |
| Indicated-Mixed | 0.350 | 1,190,000 | 0.919 | 23.8 | 910,000 | 0.766 | 29,000 |
| Indicated Total | variable | 106,030,000 | 0.511 | 6.5 | 21,990,000 | 0.485 | 1,653,000 |
| | | | | | | | |
| Meas. + Ind. Total | variable | 147,310,000 | 0.543 | 7.1 | 33,370,000 | 0.515 | 2,438,000 |
| | | | | | | | |
| Inferred-Oxide | 0.200 | 9,570,000 | 0.419 | 4.3 | 1,330,000 | 0.402 | 124,000 |
| Inferred-Mixed | 0.350 | 20,000 | 0.762 | 12.2 | 10,000 | 0.684 | - |
| Inferred-Sulfide | 0.500 | 61,410,000 | 1.202 | 22.9 | 45,220,000 | 0.762 | 1,504,000 |
| Inferred-Total | variable | 71,000,000 | 1.096 | 20.4 | 46,560,000 | 0.713 | 1,628,000 |
Note: rounding may cause apparent inconsistencies
| | |
| November 2012 | Shahuindo Project | 200 |
| |
|
MINE DEVELOPMENT ASSOCIATES |
| |
| Table 14-13 | Shahuindo Gold and Silver Resources |
| | | | | | |
Cutoff
(g AuEq/t) | Shahuindo Measured Resources- Oxide |
| Tonnes | g AuEq/t | g Ag/t | oz Ag | g Au/t | oz Au |
| 0.100 | 54,560,000 | 0.499 | 6.6 | 11,490,000 | 0.474 | 832,000 |
| 0.200 | 40,500,000 | 0.619 | 8.1 | 10,530,000 | 0.588 | 766,000 |
| 0.250 | 33,020,000 | 0.709 | 9.1 | 9,700,000 | 0.674 | 715,000 |
| 0.300 | 26,760,000 | 0.811 | 10.3 | 8,840,000 | 0.771 | 663,000 |
| 0.400 | 17,900,000 | 1.041 | 12.7 | 7,300,000 | 0.992 | 571,000 |
| 0.500 | 13,520,000 | 1.235 | 14.6 | 6,340,000 | 1.179 | 512,000 |
| 0.600 | 11,090,000 | 1.386 | 16.0 | 5,700,000 | 1.325 | 472,000 |
| 0.700 | 9,290,000 | 1.529 | 17.3 | 5,180,000 | 1.462 | 437,000 |
| 0.800 | 7,720,000 | 1.687 | 18.9 | 4,680,000 | 1.615 | 401,000 |
| 1.000 | 5,420,000 | 2.024 | 21.7 | 3,790,000 | 1.941 | 339,000 |
| 1.500 | 2,780,000 | 2.809 | 26.9 | 2,400,000 | 2.705 | 242,000 |
| 2.000 | 1,740,000 | 3.458 | 29.8 | 1,670,000 | 3.343 | 187,000 |
| | | | | | |
Cutoff
(g AuEq/t) | Shahuindo Indicated Resources- Oxide |
| Tonnes | g AuEq/t | g Ag/t | oz Ag | g Au/t | oz Au |
| 0.100 | 149,040,000 | 0.402 | 5.0 | 24,060,000 | 0.383 | 1,835,000 |
| 0.200 | 104,840,000 | 0.506 | 6.3 | 21,080,000 | 0.482 | 1,624,000 |
| 0.250 | 80,120,000 | 0.593 | 7.1 | 18,410,000 | 0.565 | 1,456,000 |
| 0.300 | 59,360,000 | 0.704 | 8.2 | 15,620,000 | 0.673 | 1,284,000 |
| 0.350 | 44,260,000 | 0.835 | 9.3 | 13,190,000 | 0.799 | 1,137,000 |
| 0.400 | 34,320,000 | 0.968 | 10.4 | 11,480,000 | 0.928 | 1,025,000 |
| 0.500 | 24,750,000 | 1.172 | 12.0 | 9,540,000 | 1.126 | 896,000 |
| 0.600 | 20,040,000 | 1.319 | 13.1 | 8,450,000 | 1.269 | 818,000 |
| 0.800 | 13,640,000 | 1.613 | 15.3 | 6,730,000 | 1.554 | 681,000 |
| 1.000 | 9,160,000 | 1.964 | 17.8 | 5,240,000 | 1.896 | 558,000 |
| 1.500 | 4,490,000 | 2.765 | 22.6 | 3,270,000 | 2.678 | 387,000 |
| 2.000 | 2,780,000 | 3.410 | 25.4 | 2,270,000 | 3.313 | 296,000 |
| | | | | | |
Cutoff
(g AuEq/t) | Shahuindo Inferred Resources- Oxide |
| Tonnes | g AuEq/t | g Ag/t | oz Ag | g Au/t | oz Au |
| 0.100 | 15,850,000 | 0.314 | 3.4 | 1,720,000 | 0.301 | 153,000 |
| 0.200 | 9,570,000 | 0.419 | 4.3 | 1,330,000 | 0.402 | 124,000 |
| 0.250 | 6,850,000 | 0.496 | 5.0 | 1,100,000 | 0.477 | 105,000 |
| 0.300 | 4,720,000 | 0.597 | 5.9 | 890,000 | 0.574 | 87,000 |
| 0.350 | 3,260,000 | 0.720 | 6.9 | 720,000 | 0.693 | 73,000 |
| 0.400 | 2,260,000 | 0.872 | 8.5 | 620,000 | 0.840 | 61,000 |
| 0.500 | 1,430,000 | 1.127 | 11.0 | 500,000 | 1.085 | 50,000 |
| 0.600 | 1,120,000 | 1.285 | 12.3 | 440,000 | 1.238 | 45,000 |
| 0.800 | 780,000 | 1.544 | 14.5 | 360,000 | 1.488 | 37,000 |
| 1.000 | 560,000 | 1.797 | 16.4 | 300,000 | 1.734 | 31,000 |
| 1.500 | 250,000 | 2.528 | 22.8 | 180,000 | 2.441 | 20,000 |
| 2.000 | 140,000 | 3.204 | 27.2 | 120,000 | 3.099 | 13,000 |
Note: rounding may cause apparent inconsistencies
| | |
| November 2012 | Shahuindo Project | 201 |
| |
|
MINE DEVELOPMENT ASSOCIATES |
| |
| Table 14-13 | Shahuindo Gold Resources (continued) |
| | | | | | |
Cutoff
(g AuEq/t) | Shahuindo Measured Resources- Mixed |
| Tonnes | g AuEq/t | g Ag/t | oz Ag | g Au/t | oz Au |
| 0.100 | 1,380,000 | 0.646 | 21.6 | 960,000 | 0.507 | 23,000 |
| 0.200 | 1,170,000 | 0.735 | 25.0 | 940,000 | 0.575 | 22,000 |
| 0.250 | 1,040,000 | 0.802 | 27.6 | 920,000 | 0.625 | 21,000 |
| 0.300 | 890,000 | 0.885 | 30.6 | 880,000 | 0.688 | 20,000 |
| 0.350 | 780,000 | 0.964 | 33.7 | 850,000 | 0.748 | 19,000 |
| 0.400 | 690,000 | 1.040 | 36.8 | 820,000 | 0.804 | 18,000 |
| 0.500 | 550,000 | 1.197 | 43.2 | 760,000 | 0.920 | 16,000 |
| 0.600 | 460,000 | 1.319 | 48.4 | 720,000 | 1.008 | 15,000 |
| 0.800 | 340,000 | 1.539 | 58.5 | 640,000 | 1.164 | 13,000 |
| 1.000 | 240,000 | 1.795 | 73.7 | 580,000 | 1.323 | 10,000 |
| 1.500 | 110,000 | 2.456 | 114.9 | 420,000 | 1.719 | 6,000 |
| 2.000 | 70,000 | 2.996 | 157.5 | 330,000 | 1.987 | 4,000 |
| | | | | | |
Cutoff
(g AuEq/t) | Shahuindo Indicated Resources- Mixed |
| Tonnes | g AuEq/t | g Ag/t | oz Ag | g Au/t | oz Au |
| 0.100 | 2,910,000 | 0.506 | 12.9 | 1,210,000 | 0.424 | 40,000 |
| 0.200 | 2,230,000 | 0.614 | 16.0 | 1,140,000 | 0.512 | 37,000 |
| 0.250 | 1,800,000 | 0.708 | 18.6 | 1,080,000 | 0.589 | 34,000 |
| 0.300 | 1,450,000 | 0.814 | 21.3 | 990,000 | 0.678 | 31,000 |
| 0.350 | 1,190,000 | 0.919 | 23.8 | 910,000 | 0.766 | 29,000 |
| 0.400 | 1,000,000 | 1.021 | 26.4 | 850,000 | 0.852 | 27,000 |
| 0.500 | 770,000 | 1.198 | 30.4 | 750,000 | 1.003 | 25,000 |
| 0.600 | 640,000 | 1.324 | 32.8 | 680,000 | 1.114 | 23,000 |
| 0.800 | 480,000 | 1.536 | 37.5 | 580,000 | 1.295 | 20,000 |
| 1.000 | 350,000 | 1.764 | 43.2 | 490,000 | 1.487 | 17,000 |
| 1.500 | 170,000 | 2.387 | 59.2 | 320,000 | 2.008 | 11,000 |
| 2.000 | 80,000 | 3.062 | 81.1 | 220,000 | 2.543 | 7,000 |
| | | | | | |
Cutoff
(g AuEq/t) | Shahuindo Inferred Resources- Mixed |
| Tonnes | g AuEq/t | g Ag/t | oz Ag | g Au/t | oz Au |
| 0.100 | 120,000 | 0.285 | 6.3 | 20,000 | 0.245 | 1,000 |
| 0.200 | 50,000 | 0.468 | 8.6 | 10,000 | 0.412 | 1,000 |
| 0.250 | 40,000 | 0.523 | 9.7 | 10,000 | 0.461 | 1,000 |
| 0.300 | 30,000 | 0.594 | 11.1 | 10,000 | 0.523 | 1,000 |
| 0.350 | 20,000 | 0.762 | 12.2 | 10,000 | 0.684 | 0 |
| 0.400 | 20,000 | 0.812 | 11.4 | 10,000 | 0.739 | 0 |
| 0.500 | 10,000 | 0.947 | 14.6 | 10,000 | 0.854 | 0 |
| 0.600 | 10,000 | 1.086 | 16.3 | 10,000 | 0.982 | 0 |
| 0.800 | 10,000 | 1.247 | 21.0 | 0 | 1.113 | 0 |
| 1.000 | 0 | 1.478 | 26.8 | 0 | 1.306 | 0 |
| 1.500 | 0 | 1.655 | 30.9 | 0 | 1.457 | 0 |
| 2.000 | 0 | 0.000 | 0.0 | 0 | 0.000 | 0 |
Note: rounding may cause apparent inconsistencies
| | |
| November 2012 | Shahuindo Project | 202 |
| |
|
MINE DEVELOPMENT ASSOCIATES |
| |
| Table 14-13 | Shahuindo Gold Resources (continued) |
| | | | | | |
Cutoff
(g AuEq/t) | Shahuindo Inferred Resources- Sulfide |
| Tonnes | g AuEq/t | g Ag/t | oz Ag | g Au/t | oz Au |
| 0.100 | 297,640,000 | 0.470 | 7.1 | 68,410,000 | 0.332 | 3,179,000 |
| 0.200 | 242,070,000 | 0.542 | 8.4 | 65,680,000 | 0.379 | 2,953,000 |
| 0.250 | 199,910,000 | 0.609 | 9.7 | 62,420,000 | 0.422 | 2,711,000 |
| 0.300 | 156,570,000 | 0.701 | 11.6 | 58,280,000 | 0.479 | 2,409,000 |
| 0.350 | 120,720,000 | 0.813 | 14.0 | 54,240,000 | 0.544 | 2,113,000 |
| 0.400 | 92,700,000 | 0.946 | 17.0 | 50,540,000 | 0.620 | 1,848,000 |
| 0.500 | 61,410,000 | 1.202 | 22.9 | 45,220,000 | 0.762 | 1,504,000 |
| 0.600 | 46,040,000 | 1.422 | 27.8 | 41,210,000 | 0.887 | 1,313,000 |
| 0.800 | 31,110,000 | 1.776 | 35.2 | 35,200,000 | 1.099 | 1,099,000 |
| 1.000 | 22,450,000 | 2.117 | 42.5 | 30,690,000 | 1.300 | 938,000 |
| 1.500 | 11,480,000 | 2.985 | 62.9 | 23,210,000 | 1.776 | 656,000 |
| 2.000 | 7,110,000 | 3.765 | 82.6 | 18,870,000 | 2.177 | 497,000 |
Note: rounding may cause apparent inconsistencies
| |
| Figure 14-5 | Gold Equivalent Block Model Grades in Shahuindo Deposit WestZone Cross Section 150W |

| | |
| November 2012 | Shahuindo Project | 203 |
| |
|
MINE DEVELOPMENT ASSOCIATES |
| |
| Figure 14-6 | Gold Equivalent Block Model Grades in Shahuindo Deposit CentralZone Cross Section -500E |
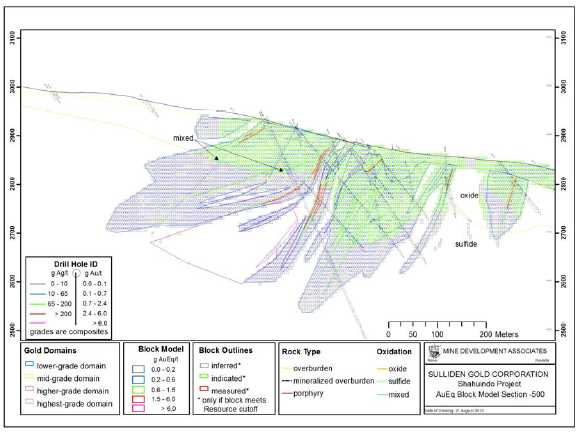
| | |
| November 2012 | Shahuindo Project | 204 |
| |
|
MINE DEVELOPMENT ASSOCIATES |
| |
Figure 14-7 | Gold Equivalent Block Model Grades in Shahuindo Deposit East Zone Cross Section -1150E |

Checks were made on the Shahuindo resource model in the following manner:
| 1. | Cross sections with the mineral domains, drill-hole assays, geology, topography, sample coding, block grades, and block classifications were plotted and reviewed for reasonableness; |
| 2. | Block-model information, such as coding, number of samples, and classification, were checked visually on the computer by domain and lithology on cross sections and long sections; |
| 3. | Nearest neighbour and ordinary kriging interpolations were completed for comparison; |
| 4. | A simple polygonal model was made with the original cross-section domains; and |
| 5. | Quantile-quantile plots of assays, composites, and block-model grades were evaluated. |
| |
| | |
| November 2012 | Shahuindo Project | 205 |
| |
|
MINE DEVELOPMENT ASSOCIATES |
MDA believes that the resource estimate is reasonable, honors the geology, and is supported by the geologic model.
| |
| 14.10.1 | Resource Model Comments |
The Shahuindo gold and silver resource is based on drill-sample analyses, density measurements, logged oxide/sulfide and silicification content, and lithologic and structural geologic contacts. For the Shahuindo deposit, the most important characteristic is the relatively continuous, near-surface mineralization extending over a strike length of more than 4,000 meters. Within the large, continuous lower-grade mineralized shell, higher-grade gold and silver mineralization is related to primarily near-vertical to southwest-dipping structures hosted within variably silicified sedimentary rocks or along sedimentary rock/porphyry intrusive contacts. The mineralized structures occur as zones of strong fracturing and brecciation, which can be up to 25 meters wide, though widths of 5 meters to 10 meters are more common.
The extent of the gold and silver resource to be included in any potential open-pit, heap-leach mining/milling scenario is controlled by the oxidation boundary that occurs at depths ranging from 25 meters to over 200 meters. Approximately 95 percent of this potential open-pit resource is classified as Measured and Indicated. A small portion of the Indicated resource (<50,000 ounces gold) occurs within the overburden directly over the bedrock resource. Any potential open-pit scenario would include removing the mineralized overburden, so it is likely that some economic benefit could be attained by processing this material.
Expansion of the current open-pit oxide and mixed Mineral Resources would be expected by drilling within mineralized structural sub-corridors along the periphery of the current resource or along strike both to the east of the Moyen Alto Zone or to the west within the Northwest Anomaly. Favorable sub-corridor drill targets include the extension of Sub-corridor “A,” located south of the West and Central zones, and Sub-corridor “B” to the north of the West Zone. (Sub-corridor locations and the Northwest Anomaly are shown on Figure 7-5 in Section 7.0). There is also the potential to discover localized areas of higher-grade mineralization along cross-structures and at structural intersections within the current resource boundary. Some modifications to the oxide and mixed resource would also be expected as a result of greater drill definition of the oxide and mixed boundaries. Upgrading of the sulfide Inferred resources requires additional metallurgical study, while an increase in the sulfide resource would be expected with further deep drilling.
| | |
| November 2012 | Shahuindo Project | 206 |
| |
|
MINE DEVELOPMENT ASSOCIATES |
MDA has used Measured and Indicated resources as the basis to define reserves. Reserve definition is done by first identifying ultimate pit limits using economic parameters and pit optimization techniques. The resulting optimized pit shells were then used for guidance in pit design to allow access for equipment and personnel. Several phases of mining were defined to enhance the economics of the project, and MDA used the phased pit designs to define the production schedule to be used for cash-flow analysis for the feasibility study. A cash-flow model has been produced by KCA and MDA has reviewed the cash-flows and determined that the cash-flow is reasonable with respect to statement of reserves for the Shahuindo Project.
The following sections detail the definition of reserves used for the production scheduling. Later sections detail the production schedule and the mining costs used in the KCA cash-flow model.
Pit optimization was done using Gemcom’s Whittle software to define pit limits with input for economic and slope parameters. The optimization used economic parameters for various mining and processing scenarios to define the best operating scenario for the project. Pit optimization used only Measured and Indicated resources for processing. All Inferred material was considered to be waste. Note that no sulfide material was included in Measured or Indicated resources; thus, all sulfide material is considered waste.
One goal of the optimization, as defined by Sulliden, was to provide the best NPV design based on limiting the project to approximately 10 years. Five different throughput rates for processing material were examined: 4,000, 6,000, 8,000, 10,000, and 12,000 tonnes per day, each on a 365 day per year basis.
A pit phasing strategy was developed based on lower gold price pit shells for each scenario. The cutoff grades in each scenario were also elevated to try to maximize the NPV for the project. In consultation with Sulliden, a scenario of processing ore for a period of approximately 10 years at a rate of 10,000 tonnes per day was chosen. The oxide cutoff grade that yielded the best NPV was 0.30 g Au/t. During mine production scheduling, the cutoff grade was increased to a 0.35 g Au/t in some portions of the pit designs to reduce the mine life to the 10 year requirement while further improving the NPV. The final cutoff grades used are defined in later sections on reserves.
| | |
| November 2012 | Shahuindo Project | 207 |
| |
|
MINE DEVELOPMENT ASSOCIATES |
Upon completion of the final feasibility cost estimates, pit optimization was re-run using the final costs to confirm the pits as being economical.
The following sections further discuss the economic and geometric parameters used for pit optimization and the results from the 10,000 tonnes per day pits.
| |
| 15.1.1 | Economic Parameters |
Economic parameters used for the scenario analysis along with the final Feasibility costs are provided in Table 15-1.
| |
| Table 15-1 | Scenario Economic Parameters |
| | | | | | | |
| | Scenario Parameters (Based on Throughput Rates) | Final Costs
Feasibility | |
| | 4K TPD | 6K TPD | 8K TPD | 10K TPD | 12K TPD | |
| Mining Cost | $2.05 | $2.00 | $1.95 | $1.90 | $1.85 | $2.00 | $/t Mined |
| Process Cost | $6.40 | $5.60 | $5.20 | $4.95 | $4.85 | $4.45 | $/t Processed |
| Incremental Cost Ore | $0.25 | $0.25 | $0.25 | $0.25 | $0.25 | NA * | $/t Processed |
| G&A / Year | $5.00 | $5.50 | $6.00 | $6.00 | $6.00 | $6.31 | Millions |
| TPD | 4,000 | 6,000 | 8,000 | 10,000 | 12,000 | 10,000 | t/Day Processed |
| TPY | 1,460 | 2,190 | 2,920 | 3,650 | 4,380 | 3,650 | t/Yr Processed |
| G&A Cost | $3.42 | $2.51 | $2.05 | $1.64 | $1.37 | $1.73 | $/t Processed |
| Gold Refining | $3.00 | $3.00 | $3.00 | $3.00 | $3.00 | $5.50 | $/Oz Au Produced |
| Silver Refining | $0.30 | $0.30 | $0.30 | $0.30 | $0.30 | $0.57 | $/Oz Ag Produced |
* Final Feasibility mining costs include costs for ore haulage
Pit optimizations for all of the scenarios were completed using varying gold and silver prices to better understand the sensitivity of the deposit to metal price. The gold price was incremented from $300 to $2000 per ounce in $25.00 steps. The silver price was allowed to vary with the gold price based on the ratio of $25.00 per ounce of silver to $1300 per ounce of gold. Lower gold price pit shells were analyzed while determining pit phasing.
Final evaluations of each scenario were based on a gold price of $1,300 per ounce and $25.00 per ounce for silver. A payable percentage of gold and silver produced is assumed to be 99.5%. Gold and silver recoveries were estimated by KCA for both oxide and mixed material as shown in Table 15-2. The same recovery was applied to all scenarios.
| | |
| November 2012 | Shahuindo Project | 208 |
| |
|
MINE DEVELOPMENT ASSOCIATES |
| |
| Table 15-2 | Metallurgical Recoveries |
| | |
| | OX | MX |
| Au Rec | 86% | 50% |
| Ag Rec | 15% | 15% |
Mining costs are based on MDA estimates while processing, general and administrative, and refining costs are based on estimates provided by KCA. These costs are within reason compared to the final Feasibility costs.
Based on the final Feasibility costs, the internal cutoff grade is 0.17 g Au/t and 0.30 g Au/t for oxide and mixed materials respectively. The internal cutoff grade assumes the mining cost for an economic open pit is a sunk cost and is not used in the calculation of the cutoff grade. The break-even cutoff grades, which include the mining costs, were calculated to be 0.23 g Au/t and 0.39 g Au/t for oxide and mixed material respectively.
Slope parameters were based on studies provided by Golder Associates. The recommendations were provided in the form of geotechnical sectors and slopes based on depth for each of the sectors. MDA used preliminary pit optimization runs to determine the approximate heights of each sector and used those for slopes in the optimizations. The slopes ranged from 27 to 41 degrees based on their location. For more details, see the pit design sections.
| |
| 15.1.3 | Pit-Optimization Results |
Whittle pit optimizations were run using the economic and slope parameters described in previous sections for each mining and processing scenario. The final scenario chosen for design was the 10,000 tonnes per day optimization using a 0.30 g Au/t cutoff grade. The results for this mining and processing scenario are shown in Table 15-3 using $100 per ounce of gold increments.
Note that at a $1,300 per ounce gold price, the ultimate optimized pit shell has potential ore in the amount of 67 million tonnes. This is a much larger pit shell in comparison to the pit designs used to define Reserves, as the pit designs targeted the first 10 years of mining.
| | |
| November 2012 | Shahuindo Project | 209 |
| |
|
MINE DEVELOPMENT ASSOCIATES |
During design of pits and infrastructure, the larger $2,000 per ounce Au pit shell was used as a boundary to ensure that potential long term resources would not become sterile.
| |
| Table 15-3 | 10K TPD – 0.30 g Au/t Cutoff Optimization Results |
| | | | | | | | | | |
| | | | Material Processed | Waste
K Tonnes | Total
K Tonnes | Strip
Ratio |
| Pit | Au Price | Ag Price | K Tonnes | g Au/t | K ozs Au | g Ag/t | K ozs Ag |
| 1 | $ 300 | $ 5.77 | 1,447 | 2.25 | 105 | 21.98 | 1,022 | 3,078 | 4,524 | 2.13 |
| 5 | $ 400 | $ 7.69 | 3,619 | 1.75 | 203 | 17.79 | 2,070 | 9,341 | 12,960 | 2.58 |
| 9 | $ 500 | $ 9.62 | 8,786 | 1.43 | 404 | 13.77 | 3,888 | 28,539 | 37,324 | 3.25 |
| 13 | $ 600 | $ 11.54 | 22,169 | 1.15 | 822 | 12.05 | 8,588 | 77,925 | 100,094 | 3.51 |
| 17 | $ 700 | $ 13.46 | 31,552 | 0.98 | 997 | 10.86 | 11,021 | 87,325 | 118,876 | 2.77 |
| 21 | $ 800 | $ 15.38 | 43,072 | 0.85 | 1,179 | 9.75 | 13,498 | 97,715 | 140,787 | 2.27 |
| 25 | $ 900 | $ 17.31 | 50,745 | 0.82 | 1,344 | 9.94 | 16,209 | 127,141 | 177,886 | 2.51 |
| 29 | $ 1,000 | $ 19.23 | 57,010 | 0.81 | 1,489 | 9.74 | 17,854 | 162,432 | 219,442 | 2.85 |
| 33 | $ 1,100 | $ 21.15 | 60,786 | 0.80 | 1,571 | 9.66 | 18,875 | 183,571 | 244,356 | 3.02 |
| 37 | $ 1,200 | $ 23.08 | 65,192 | 0.79 | 1,654 | 9.62 | 20,165 | 207,619 | 272,811 | 3.18 |
| 41 | $ 1,300 | $ 25.00 | 67,475 | 0.78 | 1,696 | 9.52 | 20,647 | 221,370 | 288,845 | 3.28 |
| 45 | $ 1,400 | $ 26.92 | 69,670 | 0.77 | 1,734 | 9.45 | 21,161 | 235,033 | 304,703 | 3.37 |
| 49 | $ 1,500 | $ 28.85 | 71,113 | 0.77 | 1,758 | 9.40 | 21,494 | 244,440 | 315,553 | 3.44 |
| 53 | $ 1,600 | $ 30.77 | 72,378 | 0.77 | 1,781 | 9.38 | 21,821 | 254,772 | 327,151 | 3.52 |
| 57 | $ 1,700 | $ 32.69 | 73,082 | 0.76 | 1,793 | 9.35 | 21,975 | 260,974 | 334,056 | 3.57 |
| 61 | $ 1,800 | $ 34.62 | 73,607 | 0.76 | 1,802 | 9.37 | 22,165 | 265,905 | 339,511 | 3.61 |
| 65 | $ 1,900 | $ 36.54 | 73,982 | 0.76 | 1,809 | 9.36 | 22,263 | 270,453 | 344,434 | 3.66 |
| 69 | $ 2,000 | $ 38.46 | 74,573 | 0.76 | 1,820 | 9.36 | 22,437 | 277,693 | 352,266 | 3.72 |
| | |
| November 2012 | Shahuindo Project | 210 |
| |
|
MINE DEVELOPMENT ASSOCIATES |
| |
| Figure 15-1 | Graph of Whittle Results |
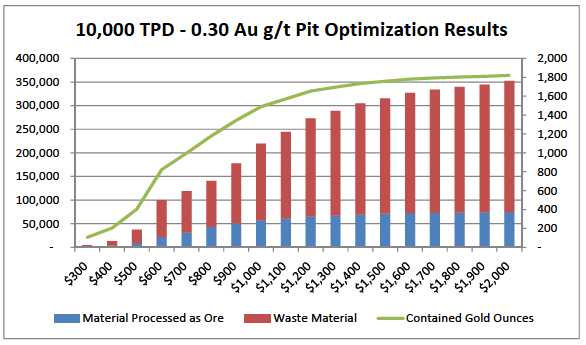
Upon completion of Feasibility costs, the pits were re-optimized to ensure the economic viability of reserves. The results showed slightly better results than those shown in Table 15-3. The pit optimization results using the final Feasibility costs are shown in Table 15-4.
| | |
| November 2012 | Shahuindo Project | 211 |
| |
|
MINE DEVELOPMENT ASSOCIATES |
| |
| Table 15-4 | Pit Optimization Results using Final Feasibility Costs |
| | | | | | | | | | |
| | | | MaterialProcessed | Waste
KTonnes | Total
KTonnes | Strip
Ratio |
| Pit | AuPrice | AgPrice | KTonnes | gAu/t | KozsAu | gAg/t | KozsAg |
| 1 | $ 300 | $ 6.00 | 1,793 | 2.07 | 119 | 20.93 | 1,207 | 3,516 | 5,310 | 1.96 |
| 5 | $ 400 | $ 8.00 | 3,714 | 1.65 | 196 | 17.13 | 2,045 | 7,734 | 11,447 | 2.08 |
| 9 | $ 500 | $ 10.00 | 9,569 | 1.35 | 415 | 13.30 | 4,091 | 27,529 | 37,098 | 2.88 |
| 13 | $ 600 | $ 12.00 | 25,605 | 1.06 | 869 | 11.20 | 9,224 | 75,861 | 101,466 | 2.96 |
| 17 | $ 700 | $ 14.00 | 36,429 | 0.90 | 1,054 | 10.04 | 11,758 | 84,331 | 120,760 | 2.31 |
| 21 | $ 800 | $ 16.00 | 44,808 | 0.84 | 1,208 | 9.70 | 13,968 | 100,612 | 145,420 | 2.25 |
| 25 | $ 900 | $ 18.00 | 51,334 | 0.82 | 1,352 | 9.87 | 16,293 | 127,669 | 179,003 | 2.49 |
| 29 | $ 1,000 | $ 20.00 | 57,581 | 0.81 | 1,497 | 9.73 | 18,014 | 163,463 | 221,044 | 2.84 |
| 33 | $ 1,100 | $ 22.00 | 61,056 | 0.80 | 1,575 | 9.64 | 18,917 | 184,215 | 245,271 | 3.02 |
| 37 | $ 1,200 | $ 24.00 | 65,261 | 0.79 | 1,652 | 9.59 | 20,128 | 206,532 | 271,793 | 3.16 |
| 41 | $ 1,300 | $ 26.00 | 67,630 | 0.78 | 1,698 | 9.51 | 20,688 | 221,556 | 289,186 | 3.28 |
| 45 | $ 1,400 | $ 28.00 | 69,675 | 0.77 | 1,734 | 9.44 | 21,152 | 234,706 | 304,381 | 3.37 |
| 49 | $ 1,500 | $ 30.00 | 71,138 | 0.77 | 1,758 | 9.40 | 21,490 | 244,419 | 315,556 | 3.44 |
| 53 | $ 1,600 | $ 32.00 | 72,095 | 0.77 | 1,775 | 9.39 | 21,754 | 252,043 | 324,138 | 3.50 |
| 57 | $ 1,700 | $ 34.00 | 72,855 | 0.76 | 1,789 | 9.36 | 21,934 | 258,712 | 331,567 | 3.55 |
| 61 | $ 1,800 | $ 36.00 | 73,481 | 0.76 | 1,800 | 9.34 | 22,062 | 264,302 | 337,783 | 3.60 |
| 65 | $ 1,900 | $ 38.00 | 73,946 | 0.76 | 1,808 | 9.36 | 22,253 | 269,702 | 343,648 | 3.65 |
| 69 | $ 2,000 | $ 40.00 | 74,436 | 0.76 | 1,818 | 9.35 | 22,384 | 275,790 | 350,227 | 3.71 |
| |
| 15.1.4 | Pit-Shell Selection for Ultimate Pit Limit |
The ultimate pit limit was chosen to limit the mine life to approximately 10 years. In order to do this, the mine life of the different pits was analyzed using $1,300 gold and $25.00 silver prices per recovered ounce. The 10 year mine life pit is between the $650 and $675 per gold ounce pit shells. Straight line interpretation was done to determine the value and the tonnes and grade of this hypothetical pit for comparison with the other scenarios run. The interpreted tonnes and grade were determined to be: 36.5 million tonnes of ore grading 0.89 g Au/t (1.04 million ounces of gold) and 9.72 g Ag/t (11.4 million ounces of silver).
For the purpose of the ultimate pit design, both the $650 and $675 per ounce gold price pit shells were used as guides. The designs were adjusted to achieve close to the 10 year mine life pit while viewing gold equivalent grades to capture the best value in the design.
Detailed pit design was completed, including an ultimate pit and six internal pits. The ultimate pit was designed to achieve the most economical 10-year mine life pit while providing safe access for people and equipment. The internal pits or phases within the
| | |
| November 2012 | Shahuindo Project | 212 |
| |
|
MINE DEVELOPMENT ASSOCIATES |
ultimate pit were designed to enhance the project by providing higher-value material to leaching operations earlier in the mine life.
Pit designs were created to use 8 meter benches for mining. This corresponds to the resource model block heights, and MDA believes this to be reasonable with respect to dilution and equipment anticipated to be used in mining.
Slope parameters were based on geotechnical studies provided by Golder Associates. The recommended slopes relate to seven different sectors (sectors “A” through “G”) defining varying rock / soil strengths. The recommendations for each sector were provided in the form of curves relating the inner-slope angle to the height of the slope. Due to the nature of the pits to be designed and the current topography, the overall slope heights on the south-west tend to be higher than the north-east side. For this reason, MDA further divided the slope sectors into “South” and “North” based on the longitudinal axis of the optimized pit shells. After examining the overall heights, sectors A, B, C, E, and G had similar slope heights, and no division of the sectors was required. Sectors D and F however did have substantial differences in the slope heights, and the division of these into “North” and “South” areas was used.
Golder Associates further recommended design heights between catch benches and bench-face slope angles for the design. The height between catch benches used was 8 meters for sectors A, B, D, E, and G. Sectors C and F used a catch bench for each 16 meters in height. As per the Golder Associates recommendations, a 63 degree bench-face angle was used in all sectors.
The inner-slope angle used for the design was determined based on the Golder Associates curve data of slope versus bench height. MDA determined the design slope height from the optimized pit shells for each sector, and using the height between catch benches and the bench-face angle, calculated the required catch bench width. The resulting calculations are shown in Fugure 15-4. These are also shown with the ultimate pit design in Figure 15-2. Note that the ultimate design has been limited as a 10-year pit, and subsequently there is no pit design inside of sector G.
| | |
| November 2012 | Shahuindo Project | 213 |
| |
|
MINE DEVELOPMENT ASSOCIATES |
| |
| Table 15-5 | Pit Design Slope Parameters |
| | | | | | | | | | |
| | Sector | |
| | A | B | C | DSouth | DNorth | E | FSouth | FNorth | G | |
| Height Between Catch Benches | 8.0 | 8.0 | 16.0 | 8.0 | 8.0 | 8.0 | 16.0 | 16.0 | 8.0 | meters |
| Bench Face Angle | 63.0 | 63.0 | 63.0 | 63.0 | 63.0 | 63.0 | 63.0 | 63.0 | 63.0 | degrees |
| Catch Bench Width | 10.3 | 8.3 | 10.3 | 10.3 | 10.3 | 8.3 | 13.9 | 10.3 | 8.3 | meters |
| Inner Ramp Angle | 29.0 | 33.0 | 41.0 | 29.0 | 29.0 | 33.0 | 36.0 | 41.0 | 33.0 | degrees |
| |
| Figure 15-2 | Pit Design Slope Parameters by Sector |
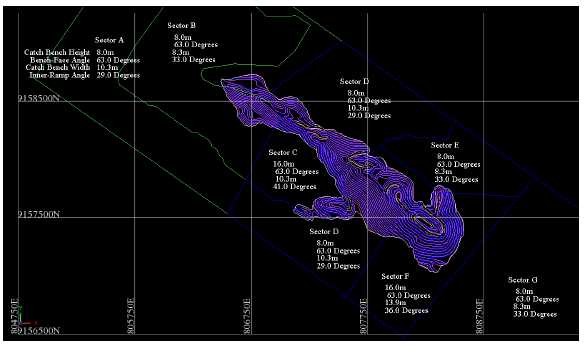
After completion, Golder Associates was given the designs to review. Ausenco was tasked with establishing dewatering requirements using dewatering wells and in-pit horizontal drains. Ausenco developed the resulting phreatic surface for the pit, and with this Golder Associates reviewed the stability. Pit slopes were modified in the phase 2 and phase 4 areas to ensure their stability under the anticipated dewatering scenario. These modifications were then incorporated into the final design.
Haulage roads and ramps were designed to have a maximum centerline gradient of 10%. In areas where the ramps may curve along the outside of the pit, the inside gradient may be up to 11% or 12% for short distances. A majority of the mining will occur in areas where the mining benches are above the lowest crest point in the design. In these areas, haul roads have been designed inside of the ultimate pit footprint and
| | |
| November 2012 | Shahuindo Project | 214 |
| |
|
MINE DEVELOPMENT ASSOCIATES |
ramps are not incorporated into the high-wall design. These haul roads provide access to upper benches and then are consumed by mining of the pit.
Once the pit is advanced below the lowest pit crest, ramp access is carried in the pit design.
The selected haulage fleet utilizes small 35 tonne capacity haul trucks with a 2.53m operating width. The design width for haul roads internal to the pit was 18m with the exception of lower benches where the design was narrowed to 12m. The narrower ramp width will allow for safe 2-way traffic along with safety berms and ditches on either side of the ramp. The wider 18m ramp allows for safety berms, ditches, and 2-way traffic along with an extra wide lane. This has been done due to the relatively high number of trucks that will be required, and to reduce the risk to the efficiency of the operation. Should trucks have un-planned down time on the ramp or road ways, other traffic should be able to flow properly and maintain productivity.
Initial mining will begin with mining of a barrow pit during the pre-production period. The barrow pit is located near the upper crest of the heap leach pad along the process access road, and material mined from the barrow pit will be for used in the construction of the heap leach pad buttress and other leach pad facilities. Currently it is anticipated that approximately 1 million cubic meters of fill material will be needed for construction. The ultimate size of the barrow pit will be determined by construction fill material needs. The location of the barrow pit is shown in Figure 15-3.
After completion, the barrow pit will be used for additional stockpile storage.
As discussed in previous sections, the 10,000 tonne per day – 0.30 g Au/t cutoff Whittle pit shells defining the 10 year mine life pit, which occurs between the $650 and $675 per ounce gold price pit shells, were used for guidance to design the ultimate pit. Slope and ramp designs discussed in previous sections were used in the design. Figure 15-3 shows the ultimate pit design and the resulting ultimate pit Proven and Probable reserves are shown in Table 15-6.
| | |
| November 2012 | Shahuindo Project | 215 |
| |
|
MINE DEVELOPMENT ASSOCIATES |
| |
| Figure 15-3 | Shahuindo Ultimate Pit and Dump Design |

| | |
| November 2012 | Shahuindo Project | 216 |
| |
|
MINE DEVELOPMENT ASSOCIATES |
The ultimate pit is achieved by mining 6 different pit phases. As the first two pit phases require mining approximately at the same time, they have been identified as Phase 1 and Phase 1B. The remaining pit phases are designated as Phase 2 through 5.
The Phase 1 design is located in the central portion of the deposit and Phase 1B is directly to the south of Phase 1. These pit designs are shown in Figure 15-4. Phase 1 start of mining utilizes external roads built to the north side of the pit. Initial waste mined will be used to create fill on the south end of the waste dump in order to build a shorter haul road to the crusher. Prior to completion of that road, all ore will be hauled to the south connecting with the road leading from Phase 1B. Phase 1B waste will also be used as required for road construction fill on the site.
The Phase 2 pit design extends mining to the north-west of Phase 1. This phase will be accessed using the Phase 1 haul roads extended within the footprint of the Phase 2 pit to the upper most benches. The Phase 2 pit design is shown in Figure 15-5.
Phase 3 is shown in Figure 15-6, and has been designed with a separate high wall from the previous pit phases.
Phase 4 mining extends Phase 3 mining to the south-east. This pit phase is shown trimmed with the previous phases in Figure 15-7.
The final phase to achieve the ultimate pit is Phase 5. This phase joins the Phase 1 pits with Phase 3 and 4 pit designs, essentially mining out the material between these pits. Phase 5 pit design is shown in Figure 15-8.
| | |
| November 2012 | Shahuindo Project | 217 |
| |
|
MINE DEVELOPMENT ASSOCIATES |
| |
Figure 15-4 | Phase 1 and Phase 1B Pit Designs |
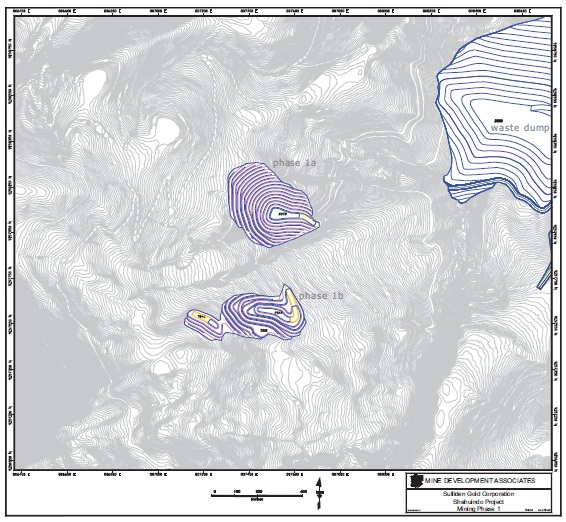
| | |
| November 2012 | Shahuindo Project | 218 |
| |
|
MINE DEVELOPMENT ASSOCIATES |
| |
Figure 15-5 | Phase 2 Pit Design |
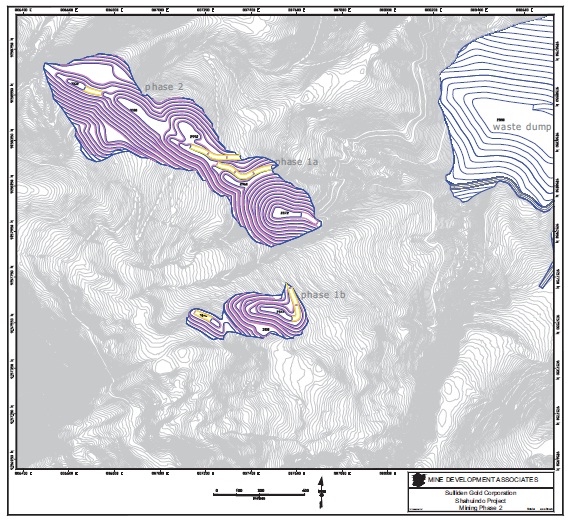
| | |
| November 2012 | Shahuindo Project | 219 |
| |
|
MINE DEVELOPMENT ASSOCIATES |
| |
Figure 15-6 | Phase 3 Pit Design |
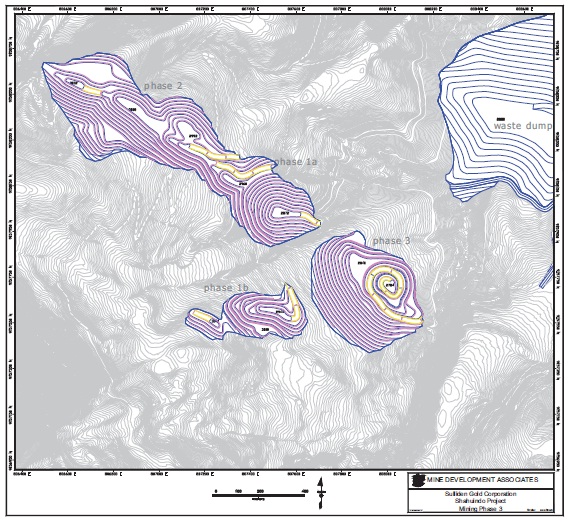
| | |
| November 2012 | Shahuindo Project | 220 |
| |
|
MINE DEVELOPMENT ASSOCIATES |
| |
Figure 15-7 | Phase 4 Pit Design |

| | |
| November 2012 | Shahuindo Project | 221 |
| |
|
MINE DEVELOPMENT ASSOCIATES |
| |
Figure 15-8 | Phase 5 Pit Design |

| | |
| November 2012 | Shahuindo Project | 222 |
| |
|
MINE DEVELOPMENT ASSOCIATES |
Based on the economic parameters, the internal cutoff grade is 0.17 g Au/t and 0.30 g Au/t for oxide and mixed materials respectively. The internal cutoff grade assumes the mining cost for an economic open pit is a sunk cost and is not used in the calculation of the cutoff grade. The break-even cutoff grades, which include the mining costs, were calculated to be 0.23 g Au/t and 0.39 g Au/t for oxide and mixed material respectively.
However, mine planning has been done to establish a 10-year mine life using elevated cutoff grades to improve the project NPV. The pit designs were based on pit optimizations that used a 0.30 g Au/t minimum grade. This was modified for final production schedules to improve the overall project value and reduce the tonnage to near 10 years of capacity. The actual cutoff grades used for reserve definition are shown in Table 15-6.
| |
| Table 15-6 | Reserve Cutoff Grades (g Au/t) |
| | |
| Phase | Oxide | Mixed |
| Phase 1 | 0.35 | 0.35 |
| Phase 1B | 0.35 | 0.35 |
| Phase 2 | 0.30 | 0.33 |
| Phase 3 | 0.35 | 0.35 |
| Phase 4 | 0.30 | 0.33 |
| Phase 5 | 0.30 | 0.33 |
The cutoff grade was applied using an equivalent gold grade (AuEq), which gives each mining block credit for silver grades. The AuEq grade is calculated using the ratio of metal prices and metallurgical recoveries. For the purpose of reserves, the AuEq was calculated as shown in Equation 1.
Equation 1 AuEq Calculation
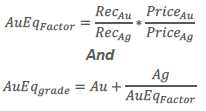
| | |
| November 2012 | Shahuindo Project | 223 |
| |
|
MINE DEVELOPMENT ASSOCIATES |
Where:
AuEqFactor= Gold equivalent factor;
RecAu= Metallurgical recovery for gold;
RecAg= Metallurgical recovery for Silver;
PriceAu= Gold price in $/ounce Au;
PriceAg= Gold price in $/ounce Ag;
AuEqgrade= Gold equivalent grade (g AuEq/t);
Au = Gold grade (g Au/t); and
Ag = Silver grade (g Ag/t);
Based on the economic parameters, the AuEq factors used are 298 and 173 for oxide and mixed material respectively.
The resource model was created using 3-demensional mineralized domains to confine the estimation reporting grade and proportion of each block within the various domains. The domains were then diluted back to the block size based on the contribution of each domain to the block. The resource model contains block dimensions of 8m long by 4m wide by 8m high. The 8m block length is aligned with the general north-west to south-east trend of the deposit to better reflect the mineralization trend.
When mining the Shahuindo pit, it will be important to pay attention to the direction of mining with respect to the mineralization trend. In order to reduce dilution and ore loss, preference should be given to mine perpendicular to the deposit.
As the resource model has been diluted to the block grade, and if proper care is given to the direction of mining, MDA considers the block size to be reasonable and believes that this represents an appropriate amount of dilution for statement of reserves.
| |
| 15.5 | Reserves and In-pit Inferred Resources |
Mineral reserves for the project were developed by applying relevant economic criteria in order to define the economically extractable portions of the resource. MDA developed the reserves to meet NI 43-101 standards. The NI 43-101 standards rely on the CIM Definition Standards on Mineral Resources and Mineral Reserves adopted by the CIM council. CIM standards define Proven and Probable Reserves as:
| | |
| November 2012 | Shahuindo Project | 224 |
| |
|
MINE DEVELOPMENT ASSOCIATES |
Mineral Reserve
Mineral Reserves are sub-divided in order of increasing confidence into Probable Mineral Reserves and Proven Mineral Reserves. A Probable Mineral Reserve has a lower level of confidence than a Proven Mineral Reserve.
A ‘Mineral Reserve’ is the economically mineable part of a Measured or Indicated Mineral Resource demonstrated by at least a Preliminary Feasibility Study. This Study must include adequate information on mining, processing, metallurgical, economic and other relevant factors that demonstrate, at the time of reporting, that economic extraction can be justified. A Mineral Reserve includes diluting materials and allowances for losses that may occur when the material is mined.
Mineral Reserves are those parts of Mineral Resources which, after the application of all mining factors, result in an estimated tonnage and grade which, in the opinion of the Qualified Person(s) making the estimates, is the basis of an economically viable project after taking account of all relevant processing, metallurgical, economic, marketing, legal, environment, socio-economic and government factors. Mineral Reserves are inclusive of diluting material that will be mined in conjunction with the Mineral Reserves and delivered to the treatment plant or equivalent facility. The term ‘Mineral Reserve’ need not necessarily signify that extraction facilities are in place or operative or that all governmental approvals have been received. It does signify that there are reasonable expectations of such approvals.
Probable Mineral Reserve
A ‘Probable Mineral Reserve’ is the economically mineable part of an Indicated, and in some circumstances a Measured Mineral Resource demonstrated by at least a Preliminary Feasibility Study. This Study must include adequate information on mining, processing, metallurgical, economic, and other relevant factors that demonstrate, at the time of reporting, that economic extraction can be justified.
Proven Mineral Reserve
| | |
| November 2012 | Shahuindo Project | 225 |
| |
|
MINE DEVELOPMENT ASSOCIATES |
A ‘Proven Mineral Reserve’ is the economically mineable part of a Measured Mineral Resource demonstrated by at least a Preliminary Feasibility Study. This Study must include adequate information on mining, processing, metallurgical, economic, and other relevant factors that demonstrate, at the time of reporting, that economic extraction is justified.
Application of the Proven Mineral Reserve category implies that the Qualified Person has the highest degree of confidence in the estimate with the consequent expectation in the minds of the readers of the report. The term should be restricted to that part of the deposit where production planning is taking place and for which any variation in the estimate would not significantly affect potential economic viability.
Table 15-7 reports the Proven and Probable reserves based on the pit designs discussed in previous sections. These reserves are shown to be economically viable based on cash-flows provided by KCA. MDA has reviewed the cash-flows and believes that they are reasonable for the statement of Proven and Probable reserves.
| |
| Table 15-7 | Ultimate Pit Proven and Probable Reserves |
| | | | | | | | | |
| | Proven | Probable | Proven&Probable |
| | Oxide | Mixed | Total | Oxide | Mixed | Total | Oxide | Mixed | Total |
| K Tonnes | 14,994 | 165 | 15,159 | 22,595 | 93 | 22,688 | 37,589 | 258 | 37,847 |
| g Au/t | 0.90 | 0.71 | 0.90 | 0.80 | 0.87 | 0.80 | 0.84 | 0.76 | 0.84 |
| K Ozs Au | 434 | 4 | 437 | 582 | 3 | 584 | 1,015 | 6 | 1,022 |
| g Ag/t | 10.4 | 17.6 | 10.5 | 8.8 | 21.3 | 8.9 | 9.4 | 18.9 | 9.5 |
| K Ozs Ag | 5,008 | 93 | 5,102 | 6,396 | 64 | 6,459 | 11,404 | 157 | 11,561 |
| g AuEq/t | 0.91 | 0.72 | 0.91 | 0.81 | 0.89 | 0.81 | 0.85 | 0.78 | 0.85 |
| K Ozs AuEq | 438 | 4 | 441 | 588 | 3 | 591 | 1,026 | 6 | 1,032 |
Note: Proven and Probable Reserves are stated based on variable cutoff grades in g Au/t where:
Oxide: 0.35, 0.35, 0.30, 0.35, 0.30, 0.30 for Phases 1, 1B, 2, 3, 4, and 5 respectively; and
Mixed: 0.35, 0.35, 0.33, 0.35, 0.33, 0.33 for Phases 1, 1B, 2, 3, 4, and 5 respectively.
| | |
| November 2012 | Shahuindo Project | 226 |
| |
|
MINE DEVELOPMENT ASSOCIATES |
| |
| Table 15-8 | Proven and Probable Reserves by Phase |
| | | | | | | | | | |
| | Proven&ProbableOre | Waste
KTonnes | Total
KTonnes | Strip
Ratio |
| | KTonnes | gAu/t | KOzsAu | gAg/t | KOzsAg | gAu Eq/t | KOzsAuEq |
| Ph_1 | 2,053 | 1.01 | 67 | 17.2 | 1,135 | 1.02 | 67 | 4,462 | 6,516 | 2.17 |
| Ph_1b | 1,068 | 0.89 | 30 | 9.2 | 316 | 0.89 | 31 | 2,424 | 3,492 | 2.27 |
| Ph_2 | 6,223 | 1.04 | 208 | 12.5 | 2,502 | 1.05 | 209 | 14,445 | 20,667 | 2.32 |
| Ph_3 | 4,285 | 0.90 | 125 | 5.2 | 717 | 0.91 | 125 | 10,741 | 15,026 | 2.51 |
| Ph_4 | 19,073 | 0.80 | 489 | 8.7 | 5,320 | 0.81 | 495 | 33,802 | 52,875 | 1.77 |
| Ph_5 | 5,144 | 0.62 | 103 | 9.5 | 1,571 | 0.63 | 105 | 6,393 | 11,537 | 1.24 |
| Total | 37,847 | 0.84 | 1,022 | 9.5 | 11,561 | 0.85 | 1,032 | 72,267 | 110,114 | 1.91 |
Note: Proven and Probable Reserves are stated based on variable cutoff grades in g Au/t where:
Oxide: 0.35, 0.35, 0.30, 0.35, 0.30, 0.30 for Phases 1, 1B, 2, 3, 4, and 5 respectively; and
Mixed: 0.35, 0.35, 0.33, 0.35, 0.33, 0.33 for Phases 1, 1B, 2, 3, 4, and 5 respectively.
Proven and Probable bench reserves have been estimated for each phase and are shown in Table 15-9 through Table 15-15. The total Proven and Probable reserves by bench are shown in Table 15-15. Due to rounding issues in reporting, these do not add up exactly to the reserves reported in Table 15-8; however the differences are inconsequential.
| | |
| November 2012 | Shahuindo Project | 227 |
| |
|
MINE DEVELOPMENT ASSOCIATES |
| |
| Table 15-9 | Phase 1 Proven and Probable Bench Reserves |
| | | | | | | | | | | | | | | | | | |
| | Proven&Probable Oxide | Proven&ProbableMixed | TotalProven&Probable | Waste
KTonnes | Total
KTonnes | Strip
Ratio |
| Bench | KTonnes | gAu/t | KOzsAu | gAg/t | KOzsAg | KTonnes | gAu/t | KOzsAu | gAg/t | KOzsAg | KTonnes | gAu/t | KOzsAu | gAg/t | KOzsAg |
| 3016 | - | - | - | - | - | - | - | - | - | - | - | - | - | - | - | 0 | 0 | NA |
| 3008 | 1 | 0.97 | 0 | 9.8 | 0 | - | - | - | - | - | 1 | 0.97 | 0 | 9.8 | 0 | 16 | 17 | 18.22 |
| 3000 | 18 | 0.92 | 1 | 11.5 | 7 | - | - | - | - | - | 18 | 0.92 | 1 | 11.5 | 7 | 87 | 105 | 4.87 |
| 2992 | 37 | 1.10 | 1 | 34.7 | 42 | - | - | - | - | - | 37 | 1.10 | 1 | 34.7 | 42 | 140 | 177 | 3.76 |
| 2984 | 61 | 0.91 | 2 | 27.4 | 54 | - | - | - | - | - | 61 | 0.91 | 2 | 27.4 | 54 | 204 | 265 | 3.34 |
| 2976 | 94 | 0.77 | 2 | 20.7 | 62 | - | - | - | - | - | 94 | 0.77 | 2 | 20.7 | 62 | 214 | 308 | 2.29 |
| 2968 | 113 | 0.89 | 3 | 17.5 | 64 | - | - | - | - | - | 113 | 0.89 | 3 | 17.5 | 64 | 259 | 372 | 2.28 |
| 2960 | 82 | 0.76 | 2 | 7.7 | 20 | - | - | - | - | - | 82 | 0.76 | 2 | 7.7 | 20 | 330 | 412 | 4.03 |
| 2952 | 81 | 0.67 | 2 | 6.1 | 16 | - | - | - | - | - | 81 | 0.67 | 2 | 6.1 | 16 | 391 | 471 | 4.83 |
| 2944 | 94 | 0.69 | 2 | 7.3 | 22 | - | - | - | - | - | 94 | 0.69 | 2 | 7.3 | 22 | 403 | 497 | 4.28 |
| 2936 | 125 | 0.76 | 3 | 13.2 | 53 | - | - | - | - | - | 125 | 0.76 | 3 | 13.2 | 53 | 431 | 557 | 3.45 |
| 2928 | 179 | 0.75 | 4 | 12.6 | 73 | - | - | - | - | - | 179 | 0.75 | 4 | 12.6 | 73 | 390 | 568 | 2.18 |
| 2920 | 221 | 1.00 | 7 | 16.2 | 115 | 4 | 1.05 | 0 | 13.8 | 2 | 225 | 1.00 | 7 | 16.2 | 117 | 354 | 579 | 1.57 |
| 2912 | 209 | 1.32 | 9 | 20.0 | 135 | 2 | 0.59 | 0 | 21.7 | 1 | 211 | 1.31 | 9 | 20.0 | 136 | 318 | 529 | 1.51 |
| 2904 | 193 | 1.48 | 9 | 19.6 | 122 | 1 | 0.83 | 0 | 27.5 | 1 | 194 | 1.48 | 9 | 19.6 | 123 | 298 | 492 | 1.53 |
| 2896 | 137 | 1.35 | 6 | 16.8 | 74 | 5 | 0.42 | 0 | 15.1 | 2 | 142 | 1.32 | 6 | 16.7 | 76 | 281 | 423 | 1.98 |
| 2888 | 138 | 1.04 | 5 | 21.2 | 94 | 1 | 0.65 | 0 | 2.8 | 0 | 140 | 1.04 | 5 | 21.0 | 94 | 206 | 346 | 1.48 |
| 2880 | 141 | 1.02 | 5 | 19.5 | 89 | - | - | - | - | - | 141 | 1.02 | 5 | 19.5 | 89 | 108 | 249 | 0.77 |
| 2872 | 114 | 0.98 | 4 | 24.0 | 88 | 2 | 0.48 | 0 | 4.6 | 0 | 116 | 0.97 | 4 | 23.7 | 88 | 32 | 148 | 0.28 |
| 2864 | - | - | - | - | - | - | - | - | - | - | - | - | - | - | - | - | - | - |
| Total | 2,039 | 1.01 | 66 | 17.2 | 1,128 | 14 | 0.69 | 0 | 14.2 | 7 | 2,053 | 1.01 | 67 | 17.2 | 1,135 | 4,462 | 6,516 | 2.17 |
Note:ProvenandProbable Reservesfor Phase 1 are stated using cutoffgradesof 0.35 g Au/t for Oxide and Mixedmaterial.
| | |
| November 2012 | Shahuindo Project | 228 |
| |
|
MINE DEVELOPMENT ASSOCIATES |
| |
| Table 15-10 | Phase 1B Proven and Probable Bench Reserves |
| | | | | | | | | | | | | | | | | | |
| | Proven&ProbableOxide | Proven&ProbableMixed | TotalProven&Probable | Waste
KTonnes | Total
KTonnes | Strip
Ratio |
| Bench | KTonnes | gAu/t | KOzsAu | gAg/t | KOzsAg | KTonnes | gAu/t | KOzsAu | gAg/t | KOzsAg | KTonnes | gAu/t | KOzsAu | gAg/t | KOzsAg |
| 3080 | - | - | - | - | - | - | - | - | - | - | - | - | - | - | - | - | - | - |
| 3072 | - | - | - | - | - | - | - | - | - | - | - | - | - | - | - | 5 | 5 | NA |
| 3064 | - | - | - | - | - | - | - | - | - | - | - | - | - | - | - | 53 | 53 | NA |
| 3056 | - | - | - | - | - | - | - | - | - | - | - | - | - | - | - | 108 | 108 | NA |
| 3048 | 77 | 1.34 | 3 | 6.4 | 16 | - | - | - | - | - | 77 | 1.34 | 3 | 6.4 | 16 | 59 | 136 | 0.76 |
| 3040 | 22 | 0.78 | 1 | 2.6 | 2 | - | - | - | - | - | 22 | 0.78 | 1 | 2.6 | 2 | 43 | 65 | 2.00 |
| 3032 | 2 | 0.39 | 0 | 0.4 | 0 | - | - | - | - | - | 2 | 0.39 | 0 | 0.4 | 0 | 83 | 85 | 35.49 |
| 3024 | 1 | 0.43 | 0 | 2.6 | 0 | - | - | - | - | - | 1 | 0.43 | 0 | 2.6 | 0 | 121 | 122 | 225.74 |
| 3016 | 5 | 0.49 | 0 | 15.8 | 2 | - | - | - | - | - | 5 | 0.49 | 0 | 15.8 | 2 | 189 | 193 | 41.43 |
| 3008 | 60 | 0.74 | 1 | 23.7 | 46 | - | - | - | - | - | 60 | 0.74 | 1 | 23.7 | 46 | 189 | 248 | 3.16 |
| 3000 | 122 | 0.62 | 2 | 9.5 | 37 | - | - | - | - | - | 122 | 0.62 | 2 | 9.5 | 37 | 216 | 338 | 1.77 |
| 2992 | 112 | 0.83 | 3 | 13.4 | 48 | - | - | - | - | - | 112 | 0.83 | 3 | 13.4 | 48 | 198 | 311 | 1.77 |
| 2984 | 128 | 0.71 | 3 | 9.8 | 40 | - | - | - | - | - | 128 | 0.71 | 3 | 9.8 | 40 | 246 | 374 | 1.91 |
| 2976 | 87 | 0.94 | 3 | 8.0 | 22 | - | - | - | - | - | 87 | 0.94 | 3 | 8.0 | 22 | 279 | 366 | 3.21 |
| 2968 | 156 | 0.91 | 5 | 6.4 | 32 | - | - | - | - | - | 156 | 0.91 | 5 | 6.4 | 32 | 253 | 409 | 1.62 |
| 2960 | 126 | 1.01 | 4 | 6.3 | 26 | - | - | - | - | - | 126 | 1.01 | 4 | 6.3 | 26 | 232 | 358 | 1.84 |
| 2952 | 111 | 0.94 | 3 | 8.3 | 30 | - | - | - | - | - | 111 | 0.94 | 3 | 8.3 | 30 | 132 | 242 | 1.19 |
| 2944 | 60 | 1.04 | 2 | 7.7 | 15 | - | - | - | - | - | 60 | 1.04 | 2 | 7.7 | 15 | 20 | 80 | 0.34 |
| 2936 | - | - | - | - | - | - | - | - | - | - | - | - | - | - | - | - | - | - |
| Total | 1,069 | 0.89 | 30 | 9.2 | 316 | - | - | - | - | - | 1,069 | 0.89 | 30 | 9.2 | 316 | 2,425 | 3,493 | 2.27 |
Note:ProvenandProbable Reservesfor Phase 1B are stated using cutoffgradesof 0.35 g Au/t for Oxide and Mixedmaterial.
| | |
| November 2012 | Shahuindo Project | 229 |
| |
|
MINE DEVELOPMENT ASSOCIATES |
| |
| Table 15-11 | Phase 2 Proven and Probable Bench Reserves |
| | | | | | | | | | | | | | | | | | |
| | Proven&ProbableOxide | Proven&ProbableMixed | TotalProven&Probable | Waste
KTonnes | Total
KTonnes | Strip
Ratio |
| Bench | KTonnes | gAu/t | KOzsAu | gAg/t | KOzsAg | KTonnes | gAu/t | KOzsAu | gAg/t | KOzsAg | KTonnes | gAu/t | KOzsAu | gAg/t | KOzsAg |
| 3144 | - | - | - | - | - | - | - | - | - | - | - | - | - | - | - | - | - | - |
| 3136 | - | - | - | - | - | - | - | - | - | - | - | - | - | - | - | 10 | 10 | NA |
| 3128 | 22 | 0.60 | 0 | 6.1 | 4 | - | - | - | - | - | 22 | 0.60 | 0 | 6.1 | 4 | 38 | 60 | 1.76 |
| 3120 | 38 | 0.58 | 1 | 5.1 | 6 | - | - | - | - | - | 38 | 0.58 | 1 | 5.1 | 6 | 87 | 125 | 2.27 |
| 3112 | 63 | 0.65 | 1 | 4.3 | 9 | - | - | - | - | - | 63 | 0.65 | 1 | 4.3 | 9 | 254 | 317 | 4.03 |
| 3104 | 109 | 0.83 | 3 | 4.9 | 17 | - | - | - | - | - | 109 | 0.83 | 3 | 4.9 | 17 | 556 | 665 | 5.12 |
| 3096 | 140 | 0.84 | 4 | 5.2 | 24 | 8 | 0.49 | 0 | 9.0 | 2 | 147 | 0.82 | 4 | 5.4 | 26 | 755 | 902 | 5.12 |
| 3088 | 161 | 0.95 | 5 | 5.4 | 28 | 7 | 0.71 | 0 | 9.0 | 2 | 168 | 0.94 | 5 | 5.5 | 30 | 1,056 | 1,224 | 6.28 |
| 3080 | 305 | 0.99 | 10 | 5.5 | 54 | 5 | 0.72 | 0 | 7.5 | 1 | 310 | 0.98 | 10 | 5.6 | 55 | 1,335 | 1,645 | 4.31 |
| 3072 | 375 | 1.02 | 12 | 5.4 | 65 | 3 | 0.40 | 0 | 9.1 | 1 | 378 | 1.02 | 12 | 5.4 | 66 | 1,457 | 1,835 | 3.85 |
| 3064 | 445 | 0.94 | 13 | 6.2 | 88 | 1 | 0.34 | 0 | 15.9 | 0 | 446 | 0.94 | 13 | 6.2 | 89 | 1,579 | 2,025 | 3.54 |
| 3056 | 527 | 1.00 | 17 | 7.4 | 125 | - | - | - | - | - | 527 | 1.00 | 17 | 7.4 | 125 | 1,535 | 2,062 | 2.91 |
| 3048 | 522 | 1.14 | 19 | 10.7 | 179 | - | - | - | - | - | 522 | 1.14 | 19 | 10.7 | 179 | 1,311 | 1,833 | 2.51 |
| 3040 | 518 | 1.25 | 21 | 13.9 | 231 | 20 | 1.20 | 1 | 11.6 | 7 | 539 | 1.25 | 22 | 13.8 | 239 | 1,074 | 1,613 | 1.99 |
| 3032 | 486 | 1.28 | 20 | 16.4 | 256 | 33 | 0.75 | 1 | 9.8 | 10 | 518 | 1.25 | 21 | 16.0 | 266 | 855 | 1,373 | 1.65 |
| 3024 | 496 | 1.12 | 18 | 17.4 | 277 | 33 | 0.59 | 1 | 19.2 | 20 | 529 | 1.09 | 19 | 17.5 | 298 | 634 | 1,163 | 1.20 |
| 3016 | 538 | 1.10 | 19 | 19.4 | 335 | 44 | 0.49 | 1 | 17.2 | 25 | 582 | 1.06 | 20 | 19.2 | 359 | 491 | 1,073 | 0.84 |
| 3008 | 433 | 0.93 | 13 | 16.5 | 229 | 14 | 0.48 | 0 | 10.2 | 5 | 446 | 0.91 | 13 | 16.3 | 234 | 379 | 826 | 0.85 |
| 3000 | 364 | 0.96 | 11 | 16.4 | 193 | 8 | 0.67 | 0 | 11.8 | 3 | 372 | 0.95 | 11 | 16.3 | 196 | 363 | 736 | 0.98 |
| 2992 | 253 | 0.98 | 8 | 19.3 | 157 | 2 | 0.62 | 0 | 12.8 | 1 | 255 | 0.98 | 8 | 19.3 | 158 | 257 | 512 | 1.01 |
| 2984 | 117 | 1.13 | 4 | 18.1 | 68 | - | - | - | - | - | 117 | 1.13 | 4 | 18.1 | 68 | 190 | 306 | 1.62 |
| 2976 | 62 | 1.01 | 2 | 16.7 | 33 | - | - | - | - | - | 62 | 1.01 | 2 | 16.7 | 33 | 110 | 172 | 1.77 |
| 2968 | 51 | 0.92 | 2 | 18.0 | 30 | - | - | - | - | - | 51 | 0.92 | 2 | 18.0 | 30 | 74 | 126 | 1.44 |
| 2960 | 23 | 0.94 | 1 | 22.2 | 16 | - | - | - | - | - | 23 | 0.94 | 1 | 22.2 | 16 | 44 | 67 | 1.94 |
| 2952 | - | - | - | - | - | - | - | - | - | - | - | - | - | - | - | - | - | - |
| Total | 6,047 | 1.05 | 204 | 12.5 | 2,424 | 176 | 0.66 | 4 | 13.7 | 77 | 6,223 | 1.04 | 208 | 12.5 | 2,502 | 14,445 | 20,667 | 2.32 |
Note:ProvenandProbable Reservesfor Phase 2 are stated using cutoffgradesof 0.35 g Au/t and 0.30 g Au/t for Oxide and Mixedmaterial respectively.
| | |
| November 2012 | Shahuindo Project | 230 |
| |
|
MINE DEVELOPMENT ASSOCIATES |
| |
| Table 15-12 | Phase 3 Proven and Probable Bench Reserves |
| | | | | | | | | | | | | | | | | | |
| | Proven & Probable Oxide | Proven & Probable Mixed | Total Proven & Probable | Waste
K Tonnes | Total
K Tonnes | Strip
Ratio |
| Bench | K Tonnes | g Au/t | K Ozs Au | gAg/t | K Ozs Ag | K Tonnes | g Au/t | K Ozs Au | g Ag/t | K Ozs Ag | K Tonnes | g Au/t | K Ozs Au | g Ag/t | K Ozs Ag |
| 2960 | - | - | - | - | - | - | - | - | - | - | - | - | - | - | - | - | - | - |
| 2952 | - | - | - | - | - | - | - | - | - | - | - | - | - | - | - | 12 | 12 | NA |
| 2944 | - | - | - | - | - | - | - | - | - | - | - | - | - | - | - | 97 | 97 | NA |
| 2936 | 6 | 0.39 | 0 | 0.6 | 0 | - | - | - | - | - | 6 | 0.39 | 0 | 0.6 | 0 | 232 | 237 | 42.09 |
| 2928 | - | - | - | - | - | - | - | - | - | - | - | - | - | - | - | 394 | 394 | NA |
| 2920 | 24 | 0.62 | 0 | 2.9 | 2 | - | - | - | - | - | 24 | 0.62 | 0 | 2.9 | 2 | 525 | 549 | 21.45 |
| 2912 | 98 | 0.60 | 2 | 2.6 | 8 | - | - | - | - | - | 98 | 0.60 | 2 | 2.6 | 8 | 592 | 689 | 6.06 |
| 2904 | 124 | 0.66 | 3 | 2.9 | 11 | - | - | - | - | - | 124 | 0.66 | 3 | 2.9 | 11 | 733 | 856 | 5.93 |
| 2896 | 130 | 0.66 | 3 | 3.2 | 13 | - | - | - | - | - | 130 | 0.66 | 3 | 3.2 | 13 | 908 | 1,038 | 6.97 |
| 2888 | 286 | 0.56 | 5 | 5.0 | 46 | - | - | - | - | - | 286 | 0.56 | 5 | 5.0 | 46 | 907 | 1,192 | 3.18 |
| 2880 | 292 | 0.74 | 7 | 7.6 | 72 | - | - | - | - | - | 292 | 0.74 | 7 | 7.6 | 72 | 959 | 1,251 | 3.29 |
| 2872 | 308 | 0.83 | 8 | 7.2 | 72 | - | - | - | - | - | 308 | 0.83 | 8 | 7.2 | 72 | 1,002 | 1,310 | 3.26 |
| 2864 | 279 | 0.99 | 9 | 4.8 | 43 | - | - | - | - | - | 279 | 0.99 | 9 | 4.8 | 43 | 1,016 | 1,295 | 3.64 |
| 2856 | 299 | 1.17 | 11 | 4.9 | 47 | - | - | - | - | - | 299 | 1.17 | 11 | 4.9 | 47 | 1,005 | 1,305 | 3.36 |
| 2848 | 510 | 0.96 | 16 | 4.5 | 73 | - | - | - | - | - | 510 | 0.96 | 16 | 4.5 | 73 | 708 | 1,219 | 1.39 |
| 2840 | 535 | 0.97 | 17 | 5.3 | 90 | - | - | - | - | - | 535 | 0.97 | 17 | 5.3 | 90 | 559 | 1,094 | 1.04 |
| 2832 | 385 | 0.82 | 10 | 4.4 | 55 | - | - | - | - | - | 385 | 0.82 | 10 | 4.4 | 55 | 328 | 713 | 0.85 |
| 2824 | 293 | 0.79 | 7 | 4.0 | 38 | - | - | - | - | - | 293 | 0.79 | 7 | 4.0 | 38 | 303 | 596 | 1.04 |
| 2816 | 207 | 0.85 | 6 | 4.5 | 30 | - | - | - | - | - | 207 | 0.85 | 6 | 4.5 | 30 | 200 | 407 | 0.97 |
| 2808 | 210 | 0.93 | 6 | 4.8 | 33 | - | - | - | - | - | 210 | 0.93 | 6 | 4.8 | 33 | 128 | 339 | 0.61 |
| 2800 | 133 | 1.08 | 5 | 6.1 | 26 | - | - | - | - | - | 133 | 1.08 | 5 | 6.1 | 26 | 69 | 202 | 0.52 |
| 2792 | 106 | 1.36 | 5 | 8.0 | 27 | - | - | - | - | - | 106 | 1.36 | 5 | 8.0 | 27 | 51 | 158 | 0.48 |
| 2784 | 61 | 2.65 | 5 | 15.7 | 31 | - | - | - | - | - | 61 | 2.65 | 5 | 15.7 | 31 | 14 | 75 | 0.23 |
| 2776 | - | - | - | - | - | - | - | - | - | - | - | - | - | - | - | - | - | - |
| Total | 4,285 | 0.90 | 125 | 5.2 | 717 | - | - | - | - | - | 4,285 | 0.90 | 125 | 5.2 | 717 | 10,741 | 15,026 | 2.51 |
Note:ProvenandProbable Reservesfor Phase 3 are stated using cutoffgradesof 0.35 g Au/t for Oxide and Mixedmaterial.
| | |
| November 2012 | Shahuindo Project | 231 |
| |
|
MINE DEVELOPMENT ASSOCIATES |
| |
| Table 15-13 | Phase 4 Proven and Probable Bench Reserves |
| | | | | | | | | | | | | | | | | | |
| | Proven & Probable Oxide | Proven & Probable Mixed | Total Proven & Probable | Waste
K Tonnes | Total
K Tonnes | Strip
Ratio |
| Bench | K Tonnes | g Au/t | K Ozs Au | g Ag/t | K Ozs Ag | K Tonnes | g Au/t | K Ozs Au | g Ag/t | K Ozs Ag | K Tonnes | g Au/t | K Ozs Au | g Ag/t | K Ozs Ag |
| 2976 | - | - | - | - | - | - | - | - | - | - | - | - | - | - | - | - | - | - |
| 2968 | 10 | 0.40 | 0 | 6.1 | 2 | - | - | - | - | - | 10 | 0.40 | 0 | 6.1 | 2 | 11 | 21 | 1.14 |
| 2960 | 227 | 1.36 | 10 | 15.2 | 111 | - | - | - | - | - | 227 | 1.36 | 10 | 15.2 | 111 | 194 | 420 | 0.85 |
| 2952 | 581 | 1.14 | 21 | 14.4 | 269 | - | - | - | - | - | 581 | 1.14 | 21 | 14.4 | 269 | 270 | 850 | 0.46 |
| 2944 | 660 | 0.89 | 19 | 9.4 | 200 | - | - | - | - | - | 660 | 0.89 | 19 | 9.4 | 200 | 666 | 1,326 | 1.01 |
| 2936 | 726 | 0.84 | 20 | 9.9 | 232 | - | - | - | - | - | 726 | 0.84 | 20 | 9.9 | 232 | 1,137 | 1,863 | 1.57 |
| 2928 | 860 | 0.70 | 19 | 9.2 | 254 | - | - | - | - | - | 860 | 0.70 | 19 | 9.2 | 254 | 1,418 | 2,277 | 1.65 |
| 2920 | 863 | 0.64 | 18 | 8.2 | 228 | - | - | - | - | - | 863 | 0.64 | 18 | 8.2 | 228 | 1,699 | 2,563 | 1.97 |
| 2912 | 804 | 0.67 | 17 | 8.5 | 221 | - | - | - | - | - | 804 | 0.67 | 17 | 8.5 | 221 | 1,878 | 2,682 | 2.33 |
| 2904 | 743 | 0.68 | 16 | 8.5 | 202 | - | - | - | - | - | 743 | 0.68 | 16 | 8.5 | 202 | 2,071 | 2,814 | 2.79 |
| 2896 | 673 | 0.71 | 15 | 8.6 | 187 | - | - | - | - | - | 673 | 0.71 | 15 | 8.6 | 187 | 1,999 | 2,672 | 2.97 |
| 2888 | 674 | 0.72 | 16 | 7.1 | 153 | - | - | - | - | - | 674 | 0.72 | 16 | 7.1 | 153 | 2,107 | 2,780 | 3.13 |
| 2880 | 689 | 0.67 | 15 | 6.0 | 133 | - | - | - | - | - | 689 | 0.67 | 15 | 6.0 | 133 | 1,983 | 2,672 | 2.88 |
| 2872 | 680 | 0.71 | 15 | 7.7 | 169 | - | - | - | - | - | 680 | 0.71 | 15 | 7.7 | 169 | 2,113 | 2,792 | 3.11 |
| 2864 | 749 | 0.69 | 17 | 7.1 | 170 | - | - | - | - | - | 749 | 0.69 | 17 | 7.1 | 170 | 1,947 | 2,696 | 2.60 |
| 2856 | 830 | 0.66 | 18 | 6.3 | 167 | - | - | - | - | - | 830 | 0.66 | 18 | 6.3 | 167 | 1,961 | 2,790 | 2.36 |
| 2848 | 787 | 0.64 | 16 | 6.2 | 157 | - | - | - | - | - | 787 | 0.64 | 16 | 6.2 | 157 | 1,884 | 2,671 | 2.39 |
| 2840 | 876 | 0.63 | 18 | 6.6 | 187 | - | - | - | - | - | 876 | 0.63 | 18 | 6.6 | 187 | 1,886 | 2,762 | 2.15 |
| 2832 | 948 | 0.67 | 20 | 6.2 | 191 | - | - | - | - | - | 948 | 0.67 | 20 | 6.2 | 191 | 1,657 | 2,605 | 1.75 |
| 2824 | 899 | 0.69 | 20 | 6.5 | 189 | - | - | - | - | - | 899 | 0.69 | 20 | 6.5 | 189 | 1,651 | 2,550 | 1.84 |
| 2816 | 922 | 0.76 | 23 | 7.7 | 229 | - | - | - | - | - | 922 | 0.76 | 23 | 7.7 | 229 | 1,322 | 2,245 | 1.43 |
| 2808 | 961 | 0.84 | 26 | 9.0 | 279 | 1 | 0.40 | 0 | 4.2 | 0 | 962 | 0.84 | 26 | 9.0 | 279 | 1,146 | 2,108 | 1.19 |
| 2800 | 862 | 0.97 | 27 | 8.9 | 246 | - | - | - | - | - | 862 | 0.97 | 27 | 8.9 | 246 | 814 | 1,676 | 0.94 |
| 2792 | 785 | 1.01 | 25 | 9.0 | 227 | - | - | - | - | - | 785 | 1.01 | 25 | 9.0 | 227 | 696 | 1,481 | 0.89 |
| 2784 | 639 | 1.11 | 23 | 10.1 | 208 | 1 | 0.38 | 0 | 2.5 | 0 | 640 | 1.11 | 23 | 10.1 | 208 | 435 | 1,075 | 0.68 |
| 2776 | 557 | 1.11 | 20 | 10.4 | 186 | 1 | 0.80 | 0 | 6.8 | 0 | 558 | 1.11 | 20 | 10.4 | 186 | 411 | 970 | 0.74 |
| 2768 | 377 | 1.02 | 12 | 12.9 | 156 | 1 | 1.67 | 0 | 11.0 | 0 | 378 | 1.02 | 12 | 12.9 | 157 | 237 | 615 | 0.63 |
| 2760 | 296 | 0.98 | 9 | 15.7 | 149 | 2 | 3.38 | 0 | 104.2 | 8 | 299 | 1.00 | 10 | 16.3 | 157 | 134 | 433 | 0.45 |
| 2752 | 161 | 1.13 | 6 | 16.8 | 87 | 1 | 4.77 | 0 | 144.7 | 7 | 162 | 1.17 | 6 | 18.0 | 94 | 49 | 211 | 0.30 |
| 2744 | 136 | 0.98 | 4 | 15.3 | 67 | 0 | 4.65 | 0 | 411.5 | 5 | 136 | 0.99 | 4 | 16.3 | 71 | 19 | 155 | 0.14 |
| 2736 | 91 | 0.96 | 3 | 15.8 | 46 | - | - | - | - | - | 91 | 0.96 | 3 | 15.8 | 46 | 3 | 94 | 0.04 |
| 2728 | - | - | - | - | - | - | - | - | - | - | - | - | - | - | - | - | - | - |
| Total | 19,065 | 0.80 | 489 | 8.6 | 5,300 | 8 | 2.46 | 1 | 77.6 | 20 | 19,073 | 0.80 | 489 | 8.7 | 5,320 | 33,802 | 52,875 | 1.77 |
Note:ProvenandProbable Reservesfor Phase 4 are stated using cutoffgradesof 0.35 g Au/t and 0.30 g Au/t for Oxide and Mixedmaterial respectively.
| | |
| November 2012 | Shahuindo Project | 232 |
| |
|
MINE DEVELOPMENT ASSOCIATES |
| |
| Table 15-14 | Phase 5 Proven and Probable Bench Reserves |
| | | | | | | | | | | | | | | | | | |
| | Proven & Probable Oxide | Proven & Probable Mixed | Total Proven & Probable | Waste
K Tonnes | Total
K Tonnes | Strip
Ratio |
| Bench | K Tonnes | g Au/t | K Ozs Au | g Ag/t | K Ozs Ag | K Tonnes | g Au/t | K Ozs Au | g Ag/t | K Ozs Ag | K Tonnes | g Au/t | K Ozs Au | g Ag/t | K Ozs Ag |
| 2984 | - | - | - | - | - | - | - | - | - | - | - | - | - | - | - | - | - | - |
| 2976 | - | - | - | - | - | - | - | - | - | - | - | - | - | - | - | 0 | 0 | NA |
| 2968 | - | - | - | - | - | - | - | - | - | - | - | - | - | - | - | 12 | 12 | NA |
| 2960 | - | - | - | - | - | - | - | - | - | - | - | - | - | - | - | 43 | 43 | NA |
| 2952 | 3 | 0.56 | 0 | 5.7 | 1 | - | - | - | - | - | 3 | 0.56 | 0 | 5.7 | 1 | 146 | 149 | 45.14 |
| 2944 | 13 | 0.48 | 0 | 5.7 | 2 | - | - | - | - | - | 13 | 0.48 | 0 | 5.7 | 2 | 224 | 238 | 16.68 |
| 2936 | 25 | 0.46 | 0 | 3.4 | 3 | - | - | - | - | - | 25 | 0.46 | 0 | 3.4 | 3 | 309 | 334 | 12.36 |
| 2928 | 20 | 0.40 | 0 | 6.4 | 4 | - | - | - | - | - | 20 | 0.40 | 0 | 6.4 | 4 | 396 | 416 | 20.11 |
| 2920 | 38 | 0.31 | 0 | 4.2 | 5 | - | - | - | - | - | 38 | 0.31 | 0 | 4.2 | 5 | 506 | 544 | 13.40 |
| 2912 | 88 | 0.44 | 1 | 3.0 | 9 | - | - | - | - | - | 88 | 0.44 | 1 | 3.0 | 9 | 533 | 622 | 6.05 |
| 2904 | 233 | 0.61 | 5 | 4.3 | 32 | - | - | - | - | - | 233 | 0.61 | 5 | 4.3 | 32 | 479 | 712 | 2.06 |
| 2896 | 341 | 0.58 | 6 | 3.9 | 43 | 0 | 0.31 | 0 | 42.7 | 0 | 341 | 0.58 | 6 | 3.9 | 43 | 457 | 798 | 1.34 |
| 2888 | 379 | 0.57 | 7 | 4.9 | 60 | 1 | 0.46 | 0 | 9.7 | 0 | 380 | 0.57 | 7 | 4.9 | 60 | 536 | 916 | 1.41 |
| 2880 | 539 | 0.57 | 10 | 6.2 | 107 | - | - | - | - | - | 539 | 0.57 | 10 | 6.2 | 107 | 566 | 1,105 | 1.05 |
| 2872 | 584 | 0.54 | 10 | 6.9 | 129 | - | - | - | - | - | 584 | 0.54 | 10 | 6.9 | 129 | 591 | 1,175 | 1.01 |
| 2864 | 676 | 0.59 | 13 | 10.2 | 221 | 10 | 0.62 | 0 | 6.0 | 2 | 686 | 0.59 | 13 | 10.1 | 223 | 529 | 1,215 | 0.77 |
| 2856 | 681 | 0.64 | 14 | 10.5 | 230 | 11 | 1.23 | 0 | 11.0 | 4 | 692 | 0.65 | 14 | 10.5 | 234 | 410 | 1,102 | 0.59 |
| 2848 | 538 | 0.67 | 12 | 12.1 | 210 | 18 | 0.96 | 1 | 13.9 | 8 | 557 | 0.68 | 12 | 12.2 | 218 | 297 | 853 | 0.53 |
| 2840 | 447 | 0.72 | 10 | 16.0 | 230 | 15 | 0.64 | 0 | 61.0 | 30 | 462 | 0.72 | 11 | 17.5 | 260 | 205 | 667 | 0.44 |
| 2832 | 316 | 0.85 | 9 | 16.4 | 167 | 4 | 1.02 | 0 | 62.2 | 9 | 320 | 0.85 | 9 | 17.0 | 175 | 114 | 434 | 0.36 |
| 2824 | 121 | 0.67 | 3 | 11.0 | 43 | - | - | - | - | - | 121 | 0.67 | 3 | 11.0 | 43 | 37 | 159 | 0.31 |
| 2816 | 42 | 0.82 | 1 | 16.4 | 22 | - | - | - | - | - | 42 | 0.82 | 1 | 16.4 | 22 | 2 | 44 | 0.05 |
| 2808 | - | - | - | - | - | - | - | - | - | - | - | - | - | - | - | - | - | - |
| Total | 5,084 | 0.62 | 102 | 9.3 | 1,518 | 60 | 0.87 | 2 | 27.5 | 53 | 5,144 | 0.62 | 103 | 9.5 | 1,571 | 6,394 | 11,537 | 1.24 |
Note:ProvenandProbable Reservesfor Phase 5 are stated using cutoffgradesof 0.35 g Au/t and 0.30 g Au/t for Oxide and Mixedmaterial respectively.
| | |
| November 2012 | Shahuindo Project | 233 |
| |
|
MINE DEVELOPMENT ASSOCIATES |
| |
| Table 15-15 | Total Proven and Probable Bench Reserves |
| | | | | | | | | | | | | | | | | | |
| | Proven & Probable Oxide | Proven & Probable Mixed | Total Proven & Probable | Waste
K Tonnes | Total
K Tonnes | Strip
Ratio |
| Bench | K Tonnes | g Au/t | K Ozs Au | g Ag/t | K Ozs Ag | K Tonnes | g Au/t | K Ozs Au | g Ag/t | K Ozs Ag | K Tonnes | g Au/t | K Ozs Au | g Ag/t | K Ozs Ag |
| 3144 | - | - | - | - | - | - | - | - | - | - | - | - | - | - | - | - | - | - |
| 3136 | - | - | - | - | - | - | - | - | - | - | - | - | - | - | - | 10 | 10 | NA |
| 3128 | 22 | 0.60 | 0 | 6.1 | 4 | - | - | - | - | - | 22 | 0.60 | 0 | 6.1 | 4 | 38 | 60 | 1.76 |
| 3120 | 38 | 0.58 | 1 | 5.1 | 6 | - | - | - | - | - | 38 | 0.58 | 1 | 5.1 | 6 | 87 | 125 | 2.27 |
| 3112 | 63 | 0.65 | 1 | 4.3 | 9 | - | - | - | - | - | 63 | 0.65 | 1 | 4.3 | 9 | 254 | 317 | 4.03 |
| 3104 | 109 | 0.83 | 3 | 4.9 | 17 | - | - | - | - | - | 109 | 0.83 | 3 | 4.9 | 17 | 556 | 665 | 5.12 |
| 3096 | 140 | 0.84 | 4 | 5.2 | 24 | 8 | 0.49 | 0 | 9.0 | 2 | 147 | 0.82 | 4 | 5.4 | 26 | 755 | 902 | 5.12 |
| 3088 | 161 | 0.95 | 5 | 5.4 | 28 | 7 | 0.71 | 0 | 9.0 | 2 | 168 | 0.94 | 5 | 5.5 | 30 | 1,056 | 1,224 | 6.28 |
| 3080 | 305 | 0.99 | 10 | 5.5 | 54 | 5 | 0.72 | 0 | 7.5 | 1 | 310 | 0.98 | 10 | 5.6 | 55 | 1,335 | 1,645 | 4.31 |
| 3072 | 375 | 1.02 | 12 | 5.4 | 65 | 3 | 0.40 | 0 | 9.1 | 1 | 378 | 1.02 | 12 | 5.4 | 66 | 1,462 | 1,840 | 3.87 |
| 3064 | 445 | 0.94 | 13 | 6.2 | 88 | 1 | 0.34 | 0 | 15.9 | 0 | 446 | 0.94 | 13 | 6.2 | 89 | 1,632 | 2,077 | 3.66 |
| 3056 | 527 | 1.00 | 17 | 7.4 | 125 | - | - | - | - | - | 527 | 1.00 | 17 | 7.4 | 125 | 1,643 | 2,170 | 3.12 |
| 3048 | 599 | 1.16 | 22 | 10.1 | 195 | - | - | - | - | - | 599 | 1.16 | 22 | 10.1 | 195 | 1,370 | 1,968 | 2.29 |
| 3040 | 540 | 1.24 | 21 | 13.4 | 233 | 20 | 1.20 | 1 | 11.6 | 7 | 560 | 1.23 | 22 | 13.4 | 241 | 1,117 | 1,678 | 1.99 |
| 3032 | 488 | 1.28 | 20 | 16.3 | 256 | 33 | 0.75 | 1 | 9.8 | 10 | 520 | 1.24 | 21 | 15.9 | 266 | 938 | 1,458 | 1.80 |
| 3024 | 496 | 1.12 | 18 | 17.4 | 278 | 33 | 0.59 | 1 | 19.2 | 20 | 529 | 1.09 | 19 | 17.5 | 298 | 755 | 1,285 | 1.43 |
| 3016 | 542 | 1.10 | 19 | 19.3 | 337 | 44 | 0.49 | 1 | 17.2 | 25 | 586 | 1.05 | 20 | 19.2 | 361 | 680 | 1,266 | 1.16 |
| 3008 | 493 | 0.90 | 14 | 17.3 | 275 | 14 | 0.48 | 0 | 10.2 | 5 | 507 | 0.89 | 15 | 17.1 | 279 | 584 | 1,091 | 1.15 |
| 3000 | 504 | 0.87 | 14 | 14.6 | 237 | 8 | 0.67 | 0 | 11.8 | 3 | 512 | 0.87 | 14 | 14.5 | 240 | 666 | 1,179 | 1.30 |
| 2992 | 403 | 0.95 | 12 | 19.1 | 247 | 2 | 0.62 | 0 | 12.8 | 1 | 404 | 0.95 | 12 | 19.1 | 248 | 595 | 1,000 | 1.47 |
| 2984 | 306 | 0.91 | 9 | 16.4 | 162 | - | - | - | - | - | 306 | 0.91 | 9 | 16.4 | 162 | 644 | 950 | 2.10 |
| 2976 | 243 | 0.89 | 7 | 15.1 | 118 | - | - | - | - | - | 243 | 0.89 | 7 | 15.1 | 118 | 604 | 847 | 2.49 |
| 2968 | 331 | 0.89 | 9 | 12.0 | 127 | - | - | - | - | - | 331 | 0.89 | 9 | 12.0 | 127 | 610 | 940 | 1.84 |
| 2960 | 457 | 1.14 | 17 | 11.8 | 173 | - | - | - | - | - | 457 | 1.14 | 17 | 11.8 | 173 | 844 | 1,301 | 1.84 |
| 2952 | 775 | 1.06 | 27 | 12.6 | 315 | - | - | - | - | - | 775 | 1.06 | 27 | 12.6 | 315 | 948 | 1,723 | 1.22 |
| 2944 | 827 | 0.87 | 23 | 9.0 | 240 | - | - | - | - | - | 827 | 0.87 | 23 | 9.0 | 240 | 1,410 | 2,237 | 1.70 |
| 2936 | 882 | 0.82 | 23 | 10.1 | 287 | - | - | - | - | - | 882 | 0.82 | 23 | 10.1 | 287 | 2,109 | 2,991 | 2.39 |
| 2928 | 1,058 | 0.71 | 24 | 9.7 | 331 | - | - | - | - | - | 1,058 | 0.71 | 24 | 9.7 | 331 | 2,597 | 3,655 | 2.45 |
| 2920 | 1,147 | 0.70 | 26 | 9.5 | 350 | 4 | 1.05 | 0 | 13.8 | 2 | 1,151 | 0.70 | 26 | 9.5 | 352 | 3,084 | 4,235 | 2.68 |
| 2912 | 1,200 | 0.76 | 29 | 9.7 | 372 | 2 | 0.59 | 0 | 21.7 | 1 | 1,201 | 0.76 | 29 | 9.7 | 373 | 3,321 | 4,522 | 2.76 |
| 2904 | 1,292 | 0.79 | 33 | 8.8 | 367 | 1 | 0.83 | 0 | 27.5 | 1 | 1,293 | 0.79 | 33 | 8.9 | 368 | 3,580 | 4,874 | 2.77 |
| 2896 | 1,282 | 0.74 | 30 | 7.7 | 317 | 5 | 0.42 | 0 | 15.8 | 2 | 1,287 | 0.74 | 31 | 7.7 | 319 | 3,645 | 4,931 | 2.83 |
| 2888 | 1,477 | 0.68 | 32 | 7.4 | 354 | 2 | 0.55 | 0 | 6.2 | 0 | 1,479 | 0.68 | 32 | 7.4 | 354 | 3,755 | 5,234 | 2.54 |
| 2880 | 1,660 | 0.68 | 36 | 7.5 | 401 | - | - | - | - | - | 1,660 | 0.68 | 36 | 7.5 | 401 | 3,617 | 5,277 | 2.18 |
| 2872 | 1,686 | 0.69 | 37 | 8.4 | 458 | 2 | 0.48 | 0 | 4.6 | 0 | 1,687 | 0.69 | 37 | 8.4 | 458 | 3,738 | 5,425 | 2.22 |
| 2864 | 1,704 | 0.70 | 38 | 7.9 | 434 | 10 | 0.62 | 0 | 6.0 | 2 | 1,714 | 0.70 | 38 | 7.9 | 435 | 3,492 | 5,206 | 2.04 |
| 2856 | 1,810 | 0.74 | 43 | 7.6 | 444 | 11 | 1.23 | 0 | 11.0 | 4 | 1,821 | 0.74 | 43 | 7.7 | 448 | 3,376 | 5,197 | 1.85 |
| 2848 | 1,835 | 0.74 | 44 | 7.5 | 441 | 18 | 0.96 | 1 | 13.9 | 8 | 1,854 | 0.74 | 44 | 7.5 | 449 | 2,889 | 4,743 | 1.56 |
| 2840 | 1,858 | 0.75 | 45 | 8.5 | 508 | 15 | 0.64 | 0 | 61.0 | 30 | 1,873 | 0.75 | 45 | 8.9 | 537 | 2,650 | 4,524 | 1.41 |
| 2832 | 1,650 | 0.74 | 39 | 7.8 | 412 | 4 | 1.02 | 0 | 62.2 | 9 | 1,654 | 0.74 | 39 | 7.9 | 421 | 2,099 | 3,753 | 1.27 |
| 2824 | 1,313 | 0.71 | 30 | 6.4 | 269 | - | - | - | - | - | 1,313 | 0.71 | 30 | 6.4 | 269 | 1,992 | 3,305 | 1.52 |
| 2816 | 1,171 | 0.78 | 29 | 7.5 | 281 | - | - | - | - | - | 1,171 | 0.78 | 29 | 7.5 | 281 | 1,524 | 2,695 | 1.30 |
| 2808 | 1,172 | 0.85 | 32 | 8.3 | 311 | 1 | 0.40 | 0 | 4.2 | 0 | 1,172 | 0.85 | 32 | 8.3 | 311 | 1,274 | 2,446 | 1.09 |
| 2800 | 994 | 0.98 | 31 | 8.5 | 272 | - | - | - | - | - | 994 | 0.98 | 31 | 8.5 | 272 | 883 | 1,877 | 0.89 |
| 2792 | 891 | 1.05 | 30 | 8.9 | 254 | - | - | - | - | - | 891 | 1.05 | 30 | 8.9 | 254 | 747 | 1,639 | 0.84 |
| 2784 | 700 | 1.24 | 28 | 10.6 | 239 | 1 | 0.38 | 0 | 2.5 | 0 | 701 | 1.24 | 28 | 10.6 | 239 | 449 | 1,150 | 0.64 |
| 2776 | 557 | 1.11 | 20 | 10.4 | 186 | 1 | 0.80 | 0 | 6.8 | 0 | 558 | 1.11 | 20 | 10.4 | 186 | 411 | 970 | 0.74 |
| 2768 | 377 | 1.02 | 12 | 12.9 | 156 | 1 | 1.67 | 0 | 11.0 | 0 | 378 | 1.02 | 12 | 12.9 | 157 | 237 | 615 | 0.63 |
| 2760 | 296 | 0.98 | 9 | 15.7 | 149 | 2 | 3.38 | 0 | 104.2 | 8 | 299 | 1.00 | 10 | 16.3 | 157 | 134 | 433 | 0.45 |
| 2752 | 161 | 1.13 | 6 | 16.8 | 87 | 1 | 4.77 | 0 | 144.7 | 7 | 162 | 1.17 | 6 | 18.0 | 94 | 49 | 211 | 0.30 |
| 2744 | 136 | 0.98 | 4 | 15.3 | 67 | 0 | 4.65 | 0 | 411.5 | 5 | 136 | 0.99 | 4 | 16.3 | 71 | 19 | 155 | 0.14 |
| 2736 | 91 | 0.96 | 3 | 15.8 | 46 | - | - | - | - | - | 91 | 0.96 | 3 | 15.8 | 46 | 3 | 94 | 0.04 |
| 2728 | - | - | - | - | - | - | - | - | - | - | - | - | - | - | - | - | - | - |
| Total | 37,589 | 0.84 | 1,015 | 9.4 | 11,404 | 258 | 0.76 | 6 | 18.9 | 157 | 37,847 | 0.84 | 1,022 | 9.5 | 11,561 | 72,268 | 110,114 | 1.91 |
Note: Proven and Probable Reserves are stated based on variable cutoff grades in g Au/t where:
Oxide: 0.35, 0.35, 0.30, 0.35, 0.30, 0.30 for Phases 1, 1B, 2, 3, 4, and 5 respectively; and
Mixed: 0.35, 0.35, 0.33, 0.35, 0.33, 0.33 for Phases 1, 1B, 2, 3, 4, and 5 respectively.
| |
| 15.5.2 | In-pit Inferred Resources |
Inferred resources were considered as waste and not used in the economic analysis. Note that CIM standards define inferred resources as:
An ‘Inferred Mineral Resource’ is that part of a Mineral Resource for which quantity and grade or quality can be estimated on the basis of geological evidence and limited sampling and reasonably assumed, but
| | |
| November 2012 | Shahuindo Project | 234 |
| |
|
MINE DEVELOPMENT ASSOCIATES |
not verified, geological and grade continuity. The estimate is based on limited information and sampling gathered through appropriate techniques for locations such as outcrops, trenches, pits, workings and drill holes.
Due to the uncertainty that may be attached to Inferred Mineral Resources, it cannot be assumed that all or any part of an Inferred Mineral Resource will be upgraded to an Indicated or Measured Mineral Resource as a result of continued exploration.
Very little Inferred material is found within the pit designs and above cutoff grade. This is due to 1) extensive drilling that has been completed inside of the ultimate pit extents; and 2) the elevated cutoff grade tends to reduce the pit size around areas that are well drilled.
In-pit Inferred resources are shown in Table 15-16. Oxide in-pit resources are presented using a 0.20 g Au/t cutoff grade while Sulfide in-pit resources use a 0.50 g Au/t cutoff grade. The cutoff grades are reflective of the cutoffs used to report resources. Note that at the resource cutoff grade for mixed material (0.35 g Au/t), there are no Mixed Inferred resources.
| |
| Table 15-16 | In-Pit Inferred Resources |
| | | | | | | | |
| | Cutoff
g AuEq/t | In-Pit Inferred Resources |
| | K Tonnes | g Au/t | K ozs Au | g Ag/t | K ozs Ag | g AuEq/t | K ozs AuEq |
| Oxide | 0.20 | 1,756 | 0.38 | 22 | 3.4 | 194 | 0.40 | 22 |
| Sulfide | 0.50 | 253 | 1.12 | 9 | 34.5 | 280 | 1.12 | 9 |
| Total | | 2,009 | 0.48 | 31 | 7.3 | 475 | 0.49 | 31 |
| | |
| November 2012 | Shahuindo Project | 235 |
| |
|
MINE DEVELOPMENT ASSOCIATES |
The Shahuindo Project has been planned as an open pit truck and front end loader operation. The truck and loader method provides reasonable cost benefits and selectivity for this type of deposit. Only open pit mining methods are considered for mining at Shahuindo.
| |
| 16.2 | Mine Material Type Definition |
For production scheduling, material types were classified into either ore or waste categories. Ore consists of only Measured or Indicated material, which includes oxide or transition material. All Inferred material is considered waste. Note that there are no sulfide Measured or Indicated resources, thus all sulfide material is considered to be waste.
Waste material was defined as all material inside of the pit designs that did not meet Proven and Probable reserve classifications. This includes Inferred material. Among the waste material is approximately 21 million tonnes of mineralized material that is above the economic cutoff grade, however, since the material was below the operational cutoff grades, the material is considered waste and is not included in Proven and Probable reserves or in the production schedule. This material is reported as “Mineralized Waste” and is shown in Table 16-1.
| | |
| November 2012 | Shahuindo Project | 236 |
| |
|
MINE DEVELOPMENT ASSOCIATES |
| |
| Table 16-1 | In-Pit Mineralized Waste by Phase |
| | | | | | | |
| | Mineralized Waste |
| Phase | K Tonnes | g Au/t | K Ozs Au | g Ag/t | K Ozs Ag | g AuEq/t | K Ozs AuEq |
| Ph_1 | 842 | 0.25 | 7 | 4.5 | 123 | 0.27 | 7 |
| Ph_1b | 1,328 | 0.26 | 11 | 3.6 | 155 | 0.27 | 12 |
| Ph_2 | 2,273 | 0.23 | 17 | 3.4 | 245 | 0.25 | 18 |
| Ph_3 | 3,761 | 0.26 | 32 | 2.1 | 251 | 0.27 | 32 |
| Ph_4 | 10,966 | 0.24 | 84 | 3.4 | 1,190 | 0.25 | 88 |
| Ph_5 | 1,859 | 0.24 | 14 | 4.1 | 247 | 0.25 | 15 |
| Total | 21,030 | 0.24 | 164 | 3.3 | 2,211 | 0.25 | 172 |
Note: Mineralized material reported in Table 16-1 is Measured and Indicated oxide material inside of pit designs that is below operational cutoff grades but above a 0.20 g AuEq/t cutoff grade.
| |
| Table 16-2 | Waste by Material Type and Phase |
| | | | | |
| | In-Pit Waste Material by Type |
| | Mineralized | Oxide | Mixed | Sulfide | Total |
| Phase | K Tonnes | K Tonnes | K Tonnes | K Tonnes | K Tonnes |
| Ph_1 | 842 | 3,604 | 12 | 4 | 4,462 |
| Ph_1b | 1,328 | 1,096 | - | - | 2,424 |
| Ph_2 | 2,273 | 11,529 | 51 | 592 | 14,445 |
| Ph_3 | 3,761 | 6,961 | - | 18 | 10,741 |
| Ph_4 | 10,966 | 22,362 | 34 | 441 | 33,802 |
| Ph_5 | 1,859 | 4,395 | 10 | 130 | 6,393 |
| Total | 21,030 | 49,947 | 107 | 1,184 | 72,267 |
In addition, both waste and ore were broken down into silicate and non-silicate material.This was done to allow different mining and processing costs to be applied accordingly.
| |
| 16.3 | Mine-Waste Facilities |
Mine waste storage has been designed as a single facility, which incorporates a haul road leading from the open pits to the crusher / processing facilities. The waste dump has been designed as a valley fill and an under drainage system for the waste dump has been designed by KCA. The overall slope of the waste dump has been designed at a slope of 2.5:1 (horizontal to vertical).
| | |
| November 2012 | Shahuindo Project | 237 |
| |
|
MINE DEVELOPMENT ASSOCIATES |
The waste dump is to be constructed in five phases. The first phase is to construct the haulage roadway to the crusher which will reduce the cycle times required for ore haulage from the pits to the process facilities.
The second phase is to build a stockpiling area that is located near the switchback along the ore haul road. This will require stacking of approximately 10 million tonnes of waste material before the stockpile area is fully operational in approximately year 2.
Phase 3 and 4 will fill the lower portions of the waste dump at a 2.5:1 (horizontal to vertical) slope up to the 2800m elevation. This fill is split longitudinally through the valley fill to: 1) facilitate access for construction of under drains; and 2) help to even out haulage cycle times and truck requirements. Phase 3 would fill along the north side of the valley, and Phase 4 would fill along the south side.
The final phase of dump construction is to complete the waste dump above the 2800m elevation. Table 16-3 shows the waste capacities as planned. The waste is assumed to have an average SG value of 1.60, which includes a swell and compaction factor of waste to be approximately 1.3 or an increase of 30% of the original volume.
| | | | | |
| | Designed | Utilized | |
| | K Cu Meters | K Tonnes | K Cu Meters | K Tonnes | Utilization |
| Haulage Road | 1,041 | 1,666 | 1,041 | 1,666 | 100.0% |
| Stockpile Construction | 10,784 | 17,254 | 10,784 | 17,254 | 100.0% |
| Lower Dump - North | 11,272 | 18,035 | 11,272 | 18,035 | 100.0% |
| Lower Dump - South | 6,186 | 9,897 | 6,186 | 9,897 | 100.0% |
| Upper Dump | 15,903 | 25,445 | 15,884 | 25,414 | 98.9% |
| Total | 45,186 | 72,298 | 45,018 | 72,029 | 99.6% |
Three primary stockpiles have been designed:
| 1. | A live stockpile is located near the crusher and will be fed through the crusher by a single front end loader on a daily basis. This stockpile has approximately 300,000 tonnes of capacity, though it may be enlarged slightly. |
| | | |
| 2. | A long-term stockpile has been designed in the barrow pit area. Initial material is placed in this stockpile area during pre-production, and it is removed in year two. After year two the stockpile grows, reaching its total capacity of about 2 million |
| | | |
| | |
| November 2012 | Shahuindo Project | 238 |
| |
|
MINE DEVELOPMENT ASSOCIATES |
tonnes in year four. The remainder of material is removed from the stockpile at the end of the mine life.
| | 3. | A second long-term stockpile is built just off the switchback along the crusher haul road. This stockpile is built on top of waste material that is placed as part of the Phase 2 waste dump. The stockpile is designed for long-term storage of lower grade ore and has a maximum capacity of approximately 6 million tonnes of ore. |
Note that at this time, no stockpiling of mineralized waste has been contemplated.
| |
| 16.4 | Mine-Production Schedule |
Proven and Probable reserves were used to schedule mine production, and Inferred resources inside of the pit were considered as waste. The final production schedule has been constrained by required loaders and trucks while striving to maintain 10,000 tonnes per day of available ore to the crusher. All scheduling was done using Gemcom MineSched™ software.
Note that mining of the barrow pit is not included in the production schedule, as that activity takes place during construction and is part of the KCA schedule of activities. Mining equipment will be used for earthworks activities approximately 3 months prior to mining in the open pits. The earthworks will include mining the barrow pit and other cut-and-fill operations in preparations for the leach pad and leaching facilities. Mining equipment will return to open pit mining during the last 4 months of the pre-production period.
Waste material will be hauled to the waste dump as previously described. Ore is hauled to either a long-term stockpile or the live stockpile near the crushing facilities. The crusher is a portable crusher without a truck hopper, and is to be fed by loader. Thus, all material is handled from the live stockpile to the crusher by means of a front end loader. Material from the long-term stockpiles is loaded into trucks at the stockpile, and then re-handled to the live stockpile as needed.
Table 16-4 shows the mine production schedule. Table 16-5 shows the handling of long-term stockpiles.
| | |
| November 2012 | Shahuindo Project | 239 |
| |
|
MINE DEVELOPMENT ASSOCIATES |
| |
| Table 16-4 | Annual Mine Production Schedule |
| | | | | | | | | | | | | | |
| | | Pre-
Prod | Yr 1 | Yr 2 | Yr 3 | Yr 4 | Yr 5 | Yr 6 | Yr 7 | Yr 8 | Yr 9 | Yr 10 | Yr 11 | Total |
Mine to
Stockpile | K Tonnes | 792 | 911 | 1,137 | 1,783 | 2,417 | 2,456 | 3,220 | 2,002 | 834 | 0 | - | - | 15,552 |
| g Au/t | 0.82 | 0.39 | 0.37 | 0.37 | 0.37 | 0.35 | 0.35 | 0.35 | 0.35 | 0.55 | - | - | 0.39 |
| K Ozs Au | 21 | 11 | 13 | 21 | 29 | 28 | 37 | 23 | 9 | 0 | - | - | 193 |
| g Ag/t | 15.29 | 5.38 | 5.13 | 6.18 | 5.06 | 5.11 | 5.09 | 4.92 | 6.52 | 16.80 | - | - | 5.81 |
| K Ozs Ag | 390 | 158 | 188 | 354 | 393 | 403 | 528 | 316 | 175 | 0 | - | - | 2,904 |
Mine to
Crusher | K Tonnes | - | 2,395 | 2,116 | 2,653 | 3,084 | 1,987 | 2,008 | 1,658 | 2,392 | 3,650 | 352 | - | 22,295 |
| g Au/t | - | 1.20 | 1.47 | 1.33 | 1.30 | 1.11 | 1.17 | 1.59 | 1.04 | 0.63 | 0.82 | - | 1.16 |
| K Ozs Au | - | 93 | 100 | 114 | 129 | 71 | 76 | 85 | 80 | 73 | 9 | - | 829 |
| g Ag/t | - | 13.76 | 14.21 | 17.61 | 9.23 | 10.51 | 9.44 | 13.55 | 10.38 | 10.67 | 14.12 | - | 12.08 |
| K Ozs Ag | - | 1,060 | 967 | 1,502 | 915 | 671 | 610 | 723 | 798 | 1,252 | 160 | - | 8,657 |
Total Ore
Mined | K Tonnes | 792 | 3,305 | 3,253 | 4,435 | 5,500 | 4,443 | 5,228 | 3,660 | 3,226 | 3,650 | 352 | - | 37,847 |
| g Au/t | 0.82 | 0.98 | 1.08 | 0.94 | 0.89 | 0.69 | 0.67 | 0.91 | 0.86 | 0.63 | 0.82 | - | 0.84 |
| K Ozs Au | 21 | 104 | 113 | 135 | 158 | 99 | 112 | 107 | 89 | 73 | 9 | - | 1,022 |
| g Ag/t | 15.3 | 11.5 | 11.0 | 13.0 | 7.4 | 7.5 | 6.8 | 8.8 | 9.4 | 10.7 | 14.1 | - | 9.5 |
| K Ozs Ag | 390 | 1,217 | 1,154 | 1,856 | 1,308 | 1,075 | 1,137 | 1,039 | 973 | 1,252 | 160 | - | 11,561 |
| Total Waste | K Tonnes | 2,517 | 8,587 | 9,682 | 8,193 | 9,170 | 11,474 | 10,828 | 4,277 | 4,788 | 2,641 | 111 | - | 72,267 |
| Total Mined | K Tonnes | 3,309 | 11,892 | 12,935 | 12,629 | 14,670 | 15,917 | 16,056 | 7,937 | 8,015 | 6,291 | 463 | - | 110,114 |
| Strip Ratio | W:O | 3.18 | 2.60 | 2.98 | 1.85 | 1.67 | 2.58 | 2.07 | 1.17 | 1.48 | 0.72 | 0.31 | | 1.91 |
Re-handle
(Stockpile to
Crusher) | K Tonnes | - | 1,255 | 1,493 | 1,007 | 566 | 1,663 | 1,642 | 2,002 | 1,258 | - | 3,298 | 1,367 | 15,552 |
| g Au/t | - | 0.67 | 0.37 | 0.37 | 0.37 | 0.36 | 0.36 | 0.36 | 0.36 | - | 0.36 | 0.36 | 0.39 |
| K Ozs Au | - | 27 | 18 | 12 | 7 | 19 | 19 | 23 | 14 | - | 38 | 16 | 193 |
| g Ag/t | - | 11.64 | 5.14 | 6.64 | 5.27 | 5.16 | 5.13 | 5.07 | 5.27 | - | 5.27 | 5.27 | 5.81 |
| K Ozs Ag | - | 470 | 247 | 215 | 96 | 276 | 271 | 326 | 213 | - | 559 | 232 | 2,904 |
| | |
| November 2012 | Shahuindo Project | 240 |
| |
|
MINE DEVELOPMENT ASSOCIATES |
| |
| Table 16-5 | Annual Long Term Stockpile Balance |
| | | | | | | | | | | | | | | |
| | | | Pre-Prod | Yr 1 | Yr 2 | Yr 3 | Yr 4 | Yr 5 | Yr 6 | Yr 7 | Yr 8 | Yr 9 | Yr 10 | Yr 11 | Yr 12 |
Total
Stockpile
Balance | Added | K Tonnes | 792 | 911 | 1,137 | 1,783 | 2,417 | 2,456 | 3,220 | 2,002 | 834 | 0 | - | - | - |
| | g Au/t | 0.83 | 0.39 | 0.37 | 0.37 | 0.38 | 0.35 | 0.36 | 0.36 | 0.36 | 0.55 | - | - | - |
| | K Ozs Au | 21 | 11 | 13 | 21 | 29 | 28 | 37 | 23 | 9 | 0 | - | - | - |
| | g Ag/t | 15.4 | 5.4 | 5.2 | 6.2 | 5.1 | 5.1 | 5.1 | 4.9 | 6.6 | 16.9 | - | - | - |
| | K Ozs Ag | 390 | 158 | 188 | 354 | 393 | 403 | 528 | 316 | 175 | 0 | - | - | - |
| Removed | K Tonnes | - | 1,255 | 1,493 | 1,007 | 566 | 1,663 | 1,642 | 2,002 | 1,258 | - | 3,298 | 1,367 | - |
| | g Au/t | - | 0.67 | 0.37 | 0.37 | 0.38 | 0.37 | 0.36 | 0.36 | 0.36 | - | 0.36 | 0.36 | - |
| | K Ozs Au | - | 27 | 18 | 12 | 7 | 19 | 19 | 23 | 14 | - | 38 | 16 | - |
| | g Ag/t | - | 11.7 | 5.2 | 6.7 | 5.3 | 5.2 | 5.2 | 5.1 | 5.3 | - | 5.3 | 5.3 | - |
| | K Ozs Ag | - | 470 | 247 | 215 | 96 | 276 | 271 | 326 | 213 | - | 559 | 232 | - |
| Balance | K Tonnes | 792 | 448 | 92 | 867 | 2,718 | 3,511 | 5,089 | 5,089 | 4,665 | 4,665 | 1,367 | - | - |
| | g Au/t | 0.83 | 0.38 | 0.38 | 0.37 | 0.38 | 0.37 | 0.36 | 0.36 | 0.36 | 0.36 | 0.36 | - | - |
| | K Ozs Au | 21 | 5 | 1 | 10 | 33 | 41 | 59 | 58 | 54 | 54 | 16 | - | - |
| | g Ag/t | 15.4 | 5.4 | 6.1 | 5.7 | 5.2 | 5.2 | 5.2 | 5.1 | 5.3 | 5.3 | 5.3 | - | - |
| | K Ozs Ag | 390 | 77 | 18 | 157 | 454 | 582 | 839 | 829 | 791 | 791 | 232 | - | - |
| | |
| November 2012 | Shahuindo Project | 241 |
|
| MINE DEVELOPMENT ASSOCIATES |
| |
| 16.5 | Equipment Selection and Productivities |
Shahuindo has been planned as an open pit mine using small haul trucks and front-end loading equipment. Mine production is achieved using up to four front end loaders with 6.9 cubic-meter buckets. The proposed truck fleet will consist of conventional trucks with a 22 cubic-meter bed.
Table 16-6 shows the maximum loader productivity estimate based on scheduled time, availability, and truck and material parameters. This maximum productivity would require that trucks are always present, which is not always the case.
| |
| Table 16-6 | Maximum Loader Productivity Estimate |
| | | | | | |
| | | | | | | Cat 988F |
| Material Properties | | All Rock | | Loading Parameters | | Scania Trucks |
| Material SG (BCM) | t/cm (Wet) | 2.70 | | Shovel Mech. Avail. | % | 90% |
| Material SG (Loose) | t/cm (Wet) | 1.62 | | Operating Efficiency | % | 83% |
| Material SG (BCM Dry) | t/cm (Dry) | 2.20 | | Bucket Capacity | cym | 6.9 |
| Material SG (LCM Dry) | t/cm (Dry) | 1.50 | | Bucket Fill Factor | % | 95% |
| Swell Factor | | 1.4 | | Avg. Cycle Time | sec | 40 |
| | | | | Truck Parameters | | |
| Daily Schedule | | | | Truck Mech. Avail. | % | 85% |
| Shifts per Day | shift/day | 2 | | Operating Efficiency | % | 83% |
| Hours per Shift | hr/shift | 12 | | Volume Capacity | cym | 22 |
| Theoretical Hours per Day | hrs/day | 24 | | Tonnage Capacity | lt (Wet) | 35 |
| Shift Startup / Shutdown | hrs/shift | 0.5 | | Truck Spot Time | sec | 24 |
| Lunch | hrs/shift | 0.5 | | | | |
| Breaks | hrs/shift | 0.25 | | | | Cat 988F
Scania Trucks |
| Operational Standby | hrs/shift | 0.25 | | Shovel Productivity | |
| Total Standby / shift | hrs/shift | 1.50 | | Effective Bucket Capacity | cyd | 6.56 |
| Total Standby / day | hrs/day | 3.00 | | Tonnes per Pass - Wet | lst (Wet) | 10.6 |
| Available Work Hours | hrs/day | 21.00 | | Tonnes per Pass - Dry | lst (Dry) | 9.8 |
| Schedule Efficiency | % | 87.5% | | Theoretical Passes - Vol | passes | 3.36 |
| | | | | Theoretical Passes - Wt | passes | 3.30 |
| | | | | Actual Passes Used | passes | 4.0 |
| | | | | Truck Tonnage - Wet | wmt/load | 35 |
| | | | | Truck Tonnage - Dry | dmt/load | 32 |
| | | | | Truck Capacity Utilized -Vol | % | 98% |
| | | | | Truck Capacity Utilized - Wt | % | 100% |
| | | | | Load Time | min | 3.07 |
| | | | | Theoretical Productivity | dst/hr | 634 |
| | | | | Tonnes per Operating Hour | dst/hr | 530 |
| | | | | Tonnes per Day | dst/day | 10,000 |
| | | | | Potential 355 day year | t/year | 3,550,000 |
| | |
| November 2012 | Shahuindo Project | 242 |
| |
|
MINE DEVELOPMENT ASSOCIATES |
Truck productivity is based on haulage routes and travel speeds. The haulage routes were drawn from the pit designs to each of the potential destinations. Additional haulage lines were drawn for each bench within the pit designs. The speeds were flagged into the haulage string description fields based on location and haul gradient. A maximum speed limit of 35 kilometers per hour was adhered to. Bench travel was allowed at a maximum of 20 kilometers per hour.
MineSched™ software was used to calculate the truck hours based on assigned speeds for loaded and empty trucks along each of the haul routes. Resulting haulage strings were drawn by MineSched™ and verified to ensure proper routing of haulage was followed.
The calculated truck hours were considered theoretical productive truck hours. This does not account for interferences on ramps, slow down due to additional equipment interference, or operator inefficiencies. Thus, an efficiency factor of 83% was used to adjust equipment hours, both truck and loaders, to operating hours for use in cost estimation.
The available hours per day were adjusted by mechanical availability and operator efficiency. The mechanical availabilities start at 90% and are degraded by 1% per year for loading equipment and 2% per year for haulage equipment until the availability is at a minimum of 85%. The availability was weighted based on the age of the equipment being used. The operator efficiency factor used is 87.5%, which accounts for break times, lunches, and shift startups and shutdowns.
Table 16-7 shows the truck and loader equipment usage and calculated operating hours.
Drill productivity was assumed based on drilling of silicate or non-silicate materials. A 20.95 m/hour drill rate was applied to silicate material, and 22.86 m/hour was used for non-silicate material with all holes using 150mm holes. In addition, blast hole drilling was based on whether material was anticipated to be waste or ore. Based on Geotechnical reports, much of the material is “soil” like. This tends to relate to the silicate content of the material. Thus, in known waste material that was to be non-silicate, it was assumed that 75% of the material would not require drilling and loading of the material could be done without blasting. All anticipated ore zones and any of the margins between ore and waste are assumed to require drilling for assay values used in ore control.
Track mounted drills were selected for blast hole and assay drilling.
| | |
| November 2012 | Shahuindo Project | 243 |
| |
|
MINE DEVELOPMENT ASSOCIATES |
Other equipment was selected for support functions including dozers, graders, water trucks and other miscellaneous equipment. The mine equipment requirements are shown in Table 16-8.
| | |
| November 2012 | Shahuindo Project | 244 |
| |
|
MINE DEVELOPMENT ASSOCIATES |
| |
| Table 16-7 | Annual Load and Haul Equipment Requirements |
| | | | | | | | | | | | | | | |
| | | Pre-Prod | Yr 1 | Yr 2 | Yr 3 | Yr 4 | Yr 5 | Yr 6 | Yr 7 | Yr 8 | Yr 9 | Yr 10 | Yr 11 | Yr 12 | Total |
| Tonnes Ore to Crusher | K Tonnes | - | 3,650 | 3,609 | 3,660 | 3,650 | 3,650 | 3,650 | 3,660 | 3,650 | 3,650 | 3,650 | 1,367 | - | 37,847 |
| Tonnes Mined | K Tonnes | 3,309 | 11,892 | 12,935 | 12,629 | 14,670 | 15,917 | 16,056 | 7,937 | 8,015 | 6,291 | 463 | - | - | 110,114 |
| Haulage Requirements |
| Productive Hours | Hrs | 30,408 | 148,272 | 158,908 | 126,988 | 140,641 | 126,022 | 145,503 | 71,196 | 79,283 | 56,603 | 18,695 | 4,515 | - | 1,107,033 |
| Operating Efficiency | % | 83% | 83% | 83% | 83% | 83% | 83% | 83% | 83% | 83% | 83% | 83% | 0% | 0% | |
| Operating Hours | Hrs | 36,636 | 178,641 | 191,455 | 152,998 | 169,447 | 151,833 | 175,304 | 85,778 | 95,522 | 68,196 | 22,524 | 5,440 | - | 1,333,775 |
| Number of Trucks | # | 19 | 27 | 30 | 26 | 26 | 26 | 26 | 12 | 12 | 10 | 10 | 8 | - | |
| Truck Availability | % | 90% | 90% | 88% | 86% | 87% | 87% | 87% | 90% | 90% | 90% | 90% | 90% | 0% | |
| Available Operating Hours | Hrs | 37,573 | 185,039 | 201,556 | 172,320 | 172,471 | 174,149 | 174,149 | 83,009 | 82,782 | 68,985 | 68,985 | 55,339 | - | 1,476,357 |
| Use of Available Hours | % | 98% | 97% | 95% | 89% | 98% | 87% | 101% | 103% | 115% | 99% | 33% | 10% | 0% | 90% |
| Tonnes per Operating Hour | t/Hr | 90 | 67 | 68 | 83 | 87 | 105 | 92 | 93 | 84 | 92 | 21 | - | - | 83 |
| 988 Front End Loader Usage |
| Number of Loaders | # | 2 | 3 | 4 | 4 | 4 | 5 | 5 | 4 | 3 | 3 | 2 | 2 | - | |
| Availability | % | 90% | 90% | 89% | 87% | 87% | 86% | 86% | 89% | 88% | 87% | 86% | 85% | 0% | |
| Operating Efficeincy | % | 83% | 83% | 83% | 83% | 83% | 83% | 83% | 83% | 83% | 83% | 83% | 0% | 0% | |
| Available Operating Hrs | Op Hrs | 5,783 | 20,696 | 26,185 | 26,747 | 26,674 | 32,960 | 32,960 | 27,362 | 20,236 | 20,006 | 13,184 | 13,066 | - | 265,857 |
| Operating Hours | Op Hrs | 5,499 | 19,763 | 21,496 | 20,987 | 24,379 | 26,451 | 26,682 | 13,190 | 13,319 | 10,454 | 770 | - | - | 182,990 |
| Use of Available Operating Hours | % | 95% | 95% | 82% | 78% | 91% | 80% | 81% | 48% | 66% | 52% | 6% | 0% | 0% | 69% |
| 988 Front End Loader Fedding Crusher |
| Number of Loaders | # | - | 1 | 1 | 1 | 1 | 1 | 1 | 1 | 1 | 1 | 1 | 1 | - | |
| Availability | % | 0% | 90% | 90% | 90% | 90% | 90% | 90% | 90% | 90% | 90% | 90% | 90% | 0% | |
| Operating Efficeincy | % | 0% | 83% | 83% | 83% | 83% | 83% | 83% | 83% | 83% | 83% | 83% | 83% | 0% | |
| Available Operating Hrs | Op Hrs | - | 6,899 | 6,899 | 6,917 | 6,899 | 6,899 | 6,899 | 6,917 | 6,899 | 6,899 | 6,899 | 6,917 | - | 75,940 |
| Operating Hours | Op Hrs | - | 6,766 | 6,690 | 6,784 | 6,766 | 6,766 | 6,766 | 6,784 | 6,766 | 6,766 | 6,766 | 2,535 | - | 70,151 |
| Use of Available Operating Hours | % | 0% | 98% | 97% | 98% | 98% | 98% | 98% | 98% | 98% | 98% | 98% | 37% | 0% | 92% |
| | |
| November 2012 | Shahuindo Project | 245 |
| |
|
MINE DEVELOPMENT ASSOCIATES |
| |
| Table 16-8 | Annual Mine Equipment Requirements (Number of Units) |
| | | | | | | | | | | | | |
| PrimaryMiningEquipment | Pre-Prod | Yr1 | Yr2 | Yr3 | Yr4 | Yr5 | Yr6 | Yr7 | Yr8 | Yr9 | Yr10 | Yr11 | Yr12 |
| Surface Top Hammer Drill | 2 | 2 | 2 | 2 | 2 | 2 | 2 | 1 | 1 | 1 | 1 | 1 | - |
| 6.9m3 Front End Loader - Stockpiles | 1 | 1 | 1 | 1 | 1 | 1 | 1 | 1 | 1 | 1 | 1 | 1 | - |
| 6.9m3 Front End Loader - Production | 2 | 3 | 4 | 4 | 4 | 5 | 5 | 4 | 3 | 3 | 2 | 2 | - |
| 35t Haul Truck | 19 | 27 | 30 | 26 | 26 | 26 | 26 | 12 | 12 | 10 | 10 | 8 | - |
| SupportEquipment |
| 230 Kw Dozer | 3 | 3 | 3 | 3 | 3 | 3 | 3 | 3 | 3 | 3 | 3 | 3 | - |
| 4.9m Motor Grader | 2 | 2 | 2 | 2 | 2 | 2 | 2 | 2 | 2 | 2 | 2 | 2 | - |
| Water Truck - 5000 Gallon | 2 | 2 | 2 | 2 | 2 | 2 | 2 | 2 | 2 | 2 | 2 | 2 | - |
| Rock Breaker - Impact Hammer (691 Kg m) | 1 | 1 | 1 | 1 | 1 | 1 | 1 | 1 | 1 | 1 | 1 | 1 | - |
| Backhoe/Loader (1.5 cu m) | 1 | 1 | 1 | 1 | 1 | 1 | 1 | 1 | 1 | 1 | 1 | 1 | - |
| Horizontal Drill Rig | 1 | 1 | 1 | 1 | 1 | 1 | 1 | 1 | 1 | - | - | - | - |
| Pit Pumps (5299 lpm) | 3 | 3 | 3 | 3 | 3 | 3 | 3 | 3 | 3 | 3 | 3 | 3 | - |
| 2 cm excavator | 1 | 1 | 1 | 1 | 1 | 1 | 1 | 1 | 1 | 1 | 1 | 1 | - |
| Flatbed | 1 | 1 | 1 | 1 | 1 | 1 | 1 | 1 | 1 | 1 | 1 | 1 | - |
| Blasting | | | | | | | | | | | | | |
| Explosives Truck | 1 | 1 | 1 | 1 | 1 | 1 | 1 | 1 | 1 | 1 | 1 | 1 | - |
| Skid Loader | 1 | 1 | 1 | 1 | 1 | 1 | 1 | 1 | 1 | 1 | 1 | 1 | - |
| MineMaintenance | | | | | | | | | | | | | |
| Lube/Fuel Truck | 2 | 2 | 2 | 2 | 2 | 2 | 2 | 1 | 1 | 1 | 1 | 1 | - |
| Mechanics Truck | 3 | 4 | 4 | 4 | 4 | 4 | 4 | 2 | 2 | 1 | 1 | 1 | - |
| Tire Truck | 1 | 1 | 1 | 1 | 1 | 1 | 1 | 1 | 1 | 1 | 1 | 1 | - |
| OtherMineEquipment | | | | | | | | | | | | | |
| Light Plant | 6 | 6 | 6 | 6 | 6 | 6 | 6 | 4 | 4 | 3 | 3 | 3 | - |
| Light Vehicles | 20 | 20 | 20 | 20 | 20 | 20 | 20 | 20 | 20 | 20 | 20 | 20 | - |
| | |
| November 2012 | Shahuindo Project | 246 |
| |
|
MINE DEVELOPMENT ASSOCIATES |
| |
| 16.6 | Mine Pit Dewatering Plan |
Recommendations for pit dewatering were provided by Ausenco. MDA has relied on the following information for pit dewatering (Ausenco, 21 September 2012):
Horizontal Drain Installation Plan
Based on the slope stability analysis performed by Golder, Ausenco has designed a mine pit dewatering plan by the installation of 5 VWPs, 41 vertical interceptor wells, 24 vertical dewatering wells and 462 horizontal drains over a period of nine (9) years of mine pre-operation and operation. This dewatering plan is based on computer, analytical solutions and proposed optimization.
Based on the mining schedule provided by MDA, the wells and drains would be installed as follows;
Year 0 (Pre-Production):Five (5) VWPs in the locations and to the depths indicated inTable 6-1.
Thirteen (13) 100 m deep interceptor wells around the proposed mine pit perimeter of the upper part of Golder cross-section D.
Twenty-five (25) 200 m deep interceptor wells installed along the western mine pit perimeter where Golder indicates that there are slope stability issues in their cross-sections D, E and F.
Twenty-two (22) 200-300 m deep dewatering wells installed at the proposed toe of the slopes C, D, E and F.
Table 6-2andTable 6-3summarize the coordinates and well completion depths of the proposed wells.
Eighty-two (82) 300 m deep horizontal drains installed in the upper part of cross-section D as follows;
Fifteen (15) drains installed at the 16 m bench;
Seventeen (17) drains installed at the 48 m bench;
Twenty (20) drains at the 56 m bench; and
Thirty (30) drains at the 72 m bench.
| | |
| November 2012 | Shahuindo Project | 247 |
| |
|
MINE DEVELOPMENT ASSOCIATES |
Forty-one (41) 300 m horizontal drains installed in the mine pit area which is part of Golder’s cross-section C as follows;
Nine (9) drains at 40 m bench;
Eighteen (18) drains at 72 m bench; and
Fourteen (14) drains at 80 m bench.
Year 1:Eight (8) 200 m deep horizontal drains installed in Golder’s cross-section B as follows;
Two (2) drains at 24 m bench;
One (1) drain at 40 m bench;
Three (3) drains at 72 m bench; and
Two (2) drains at 104 m bench.
Forty-Eight (48) 300 m deep horizontal drains installed in the lower part of Golder’s cross-section D area as follows;
Three (3) drains at 24 m bench;
Seven (7) drains at 48 m bench;
Nine (9) drains at 88 m bench;
Ten (10) drains at 128 m bench (this bench corresponds to the 80 mbench in cross-section C); and
Nineteen (19) drains at 144 m bench.
Year 2:Seven (7) 200 m deep horizontal drains installed in Golder’s cross-section B as follows;
Twenty-two (22) 300 m deep horizontal drains installed in the lower portion of Golder’s cross-section D as follows;
Year 3:One (1) 200 m horizontal drain installed in Golder’s cross-section B at 40 m bench.
Forty-eight (48) 300 m horizontal drains installed in the lower part of cross-section D as follows;
| | |
| November 2012 | Shahuindo Project | 248 |
| |
|
MINE DEVELOPMENT ASSOCIATES |
Year 4:Thirty-four (34) 300 m deep horizontal drains installed in the bottom of cross-section D as follows;
Thirteen (13) drains at 104 m bench;
Ten (10) drains at 128 m bench; and
Eleven (11) drains at 152 m bench.
Twelve (12) 300 m deep horizontal drains installed at the 48 m bench inGolder’s cross-section F area of the mine pit.
Year 5:Thirty-four (34) 300 m deep horizontal drains installed in the cross-section D area as follows;
Eleven (11) drains at 24 m bench;
Twelve (12) drains at 48 m bench; and
Seventeen (17) drains at the 72 m bench.
Eleven (11) 300 m drains installed at the 72 m bench in cross-section F.
Year 6:Twelve (12) 300 m horizontal drains installed at the 96 m bench in the cross-section D area of the western pit wall.
Thirteen (13) 300 m horizontal drains installed at the 96 m bench in cross-section F area of the mine pit wall.
Two (2) 200 m deep horizontal drains installed at the 112 m bench in cross-section G area of the pit wall.
Year 7:Four (4) 200 m horizontal drains installed in cross-section G area as follows;
Eighteen (18) 300 m horizontal drains installed in the cross-section E area as follows;
Twenty (20) 300 m horizontal drains installed in the cross-section F area as follows;
Year 8:Thirty-three (33) 300 m deep horizontal drains will be installed in the cross-sectional area D as follows;
| | |
| November 2012 | Shahuindo Project | 249 |
| |
|
MINE DEVELOPMENT ASSOCIATES |
Eleven (11) drains at 120 m bench;
Eleven (11) drains at 144 m bench; and
Eleven (11) drains at 168 m bench.
Horizontal Drain Piping
The horizontal drains will discharge to 2-inch diameter poly or vinyl piping. The piping will be routed along the benches and down vertically to the nearest sump where the discharge water will be collected and pumped. Water will be pumped to the Treatment Plant or, if the quality meets Peruvian Water Quality criteria, to the quebrada Choloque.
| | |
| November 2012 | Shahuindo Project | 250 |
| |
|
MINE DEVELOPMENT ASSOCIATES |
Test work developed by KCA has indicated that the Shahuindo ores are amenable to heap leaching. Based on a modeled reserve of approximately 37.8 million tonnes and an established processing rate of 10,000 tonnes/day ore, the project has an estimated 10.4-year mine life.
Engineering and design of a 3,650,000 tonne/year processing plant was undertaken for complete crushing, leaching and recovery systems. The criteria used for the design of the processing circuit are summarized in Table 17-1.
| |
| Table 17-1 | Processing Design Criteria Summary |
| |
| ITEM | DESIGN CRITERIA |
| Annual Tonnage Processed | 3,650,000 tonnes |
| Crushing Production Rate | 10,000 tonnes/day normal |
| Crushing Operation | 12 hours/shift, 2 shifts/day, 7 days/week |
| Crusher Availability | 70% |
| Crushing Product Size | 100% -32 mm |
| Leaching Cycle, days (Total) | 75 |
| Average Gold Recovery (oxide) | 86% |
| Average Gold Recovery (mixed) | 50% |
| Average Silver Recovery | 15.0% |
Test work shows field gold recovery of 86% for oxide and 50% for transition ore, and silver recovery of 15% for oxide and 15% for transition ore at a crush size of P100= 32 mm. A two-stage plant has been selected that will nominally produce this product at the desired throughput.
Results from compacted permeability tests and column leach tests on core samples show the need for cement agglomeration at a 6 kg/t cement addition rate.
Tests work thus far has shown only small amounts of soluble copper in the ore, and it is not expected to be a problem with extraction.
| | |
| November 2012 | Shahuindo Project | 251 |
| |
|
MINE DEVELOPMENT ASSOCIATES |
| |
| 17.1 | Process Description Summary |
Crushing is accomplished by a two-stage, open-circuit crushing system operating 7 days/week, 24 hours/day, at a rate of 10,000 tonnes/day. Feed to the main crushing circuit is by front-end loader from a ROM stockpile. The crushing circuit will be located between the open pits and the heap leach pad. The plant also has a small gravel circuit to produce and stockpile sized product for use as leach pad drainage material.
The final product from the crusher circuit discharges to a kidney-shaped stockpile. The crushed ore is conveyed from the stockpile by a reclaim conveyor belt located in a tunnel fitted with dual pan feeders buried below the stockpile. Cement is added to the crushed ore on the reclaim conveyor and is then transported to the leach pad using two fixed overland conveyors and a variable number of portable conveyors. Once over the lined leach pad, dilute cyanide solution is added to the ore on the conveyor as it is transferred to portable field conveyors and ultimately to a portable radial stacker where it discharges onto the heap at the active stacking area.
The stacked ore is leached using a drip and/or sprinkler irrigation system for solution application depending on water balance requirements. After percolating through the ore, the gold and silver-bearing solution drains to a pregnant (PLS) pond where it is collected and pumped to an activated carbon adsorption-desorption-recovery (ADR) plant.
Pregnant solution is pumped to the plant where adsorption will take place in one train of five cascade columns. Barren discharge from the final columns flows by gravity to a barren tank and is then pumped to the heap for further leaching. High strength cyanide solution is injected into the barren solution to maintain the cyanide concentration in the leach solutions at the desired level.
Desorption of gold and silver from loaded carbon utilizes a pressurized elution column followed by recovery of gold and silver from pregnant eluant solutions in electrolytic cells containing stainless steel cathodes. Loaded cathodes are washed and the resulting precious metal sludge is retorted to remove and recover mercury followed by smelting in a diesel-fired crucible furnace to produce a doré final product.
Acid washing of carbon is done in a fiber-reinforced plastic vessel. Thermal regeneration of the carbon is by a rotary carbon kiln.
An excess solution (storm water) pond is included to contain any leach solutions and/or precipitation events that cannot be managed during normal operations. Excess solution
| | |
| November 2012 | Shahuindo Project | 252 |
| |
|
MINE DEVELOPMENT ASSOCIATES |
will return to the barren tank as makeup solution during average precipitation years, or be sent to gold scavenging and treatment before discharge during wet years. Make-up water will be from a combination of excess solution and impounded surface water.
The general arrangement and simplified flow sheet are shown in Figures 17-1 and 17-2.
| | |
| November 2012 | Shahuindo Project | 253 |
| |
|
MINE DEVELOPMENT ASSOCIATES |
| |
| Figure 17-1 | Shahuindo Project General Arrangement |

| | |
| November 2012 | Shahuindo Project | 254 |
| |
|
MINE DEVELOPMENT ASSOCIATES |
| |
| Figure 17-2 | Heap Leaching Flow Sheet |
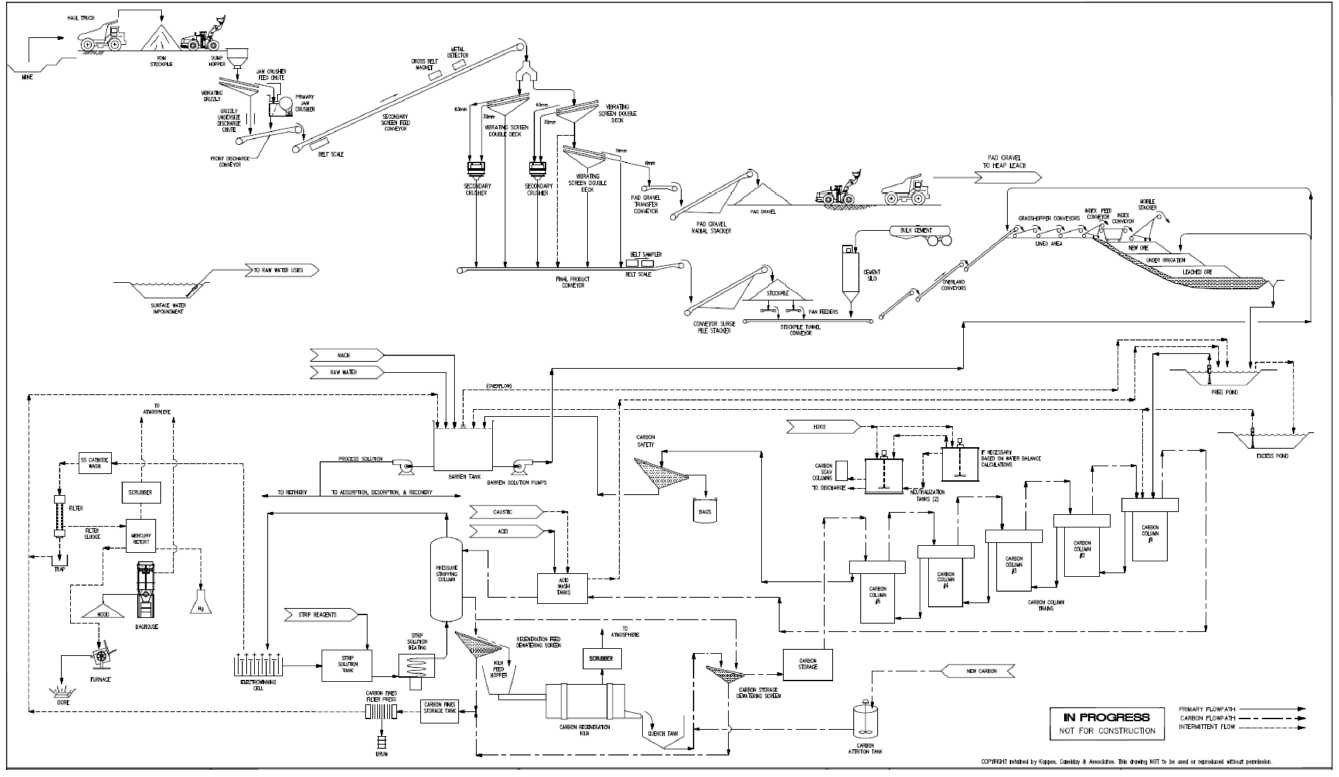
| | |
| November 2012 | Shahuindo Project | 255 |
| |
|
MINE DEVELOPMENT ASSOCIATES |
The following modular components are included in the crushing facility:
ROM hopper bin;
A primary crushing plant with a vibrating grizzly, primary jaw crusher, and acrusher product conveyor;
Two parallel secondary crushing units with double-deck screens operating inopen-circuit;
A pad-cover gravel screening circuit which scalps the oversize from the bottomdeck of a gravel scalping screen and conveys it to a small radial stacker andgravel stockpile;
A crushed ore stockpile with a fixed stacker;
A belt weightometer, magnet, and metal detector; and,
Associated transfer conveyors.
ROM ore is transported from the mine in surface haul trucks and dumped in a ROM ore stockpile. Ore is reclaimed from the stockpile by a front-end loader and fed into the ROM hopper bin. Any oversize rocks or large lumps are separated at the ROM stockpile for later breakage using mine equipment. The plant crushing / processing rate is 10,000 tonnes/day.
Material is fed from the hopper bin by a vibrating grizzly feeder. The grizzly oversize is feed to the jaw crusher. The jaw crusher product and vibrating grizzly undersize are recombined on the primary crusher discharge conveyor and transferred to the secondary splitter feed conveyor that feeds a splitter bin. A tramp metal electromagnet and metal detector are installed on this conveyor to protect the secondary crushers.
Ore leaving the splitter bin is fed equally to two secondary screen feed conveyors by vibrating pan feeders. The secondary screen feed conveyors discharge to two parallel secondary crushing modules complete with double-deck screens and secondary cone crushers.
Screened oversize from the two decks is fed to the secondary cone crusher in open-circuit. Secondary screen undersize is final product and falls directly onto the final product conveyor. Secondary crusher discharge and screen undersize product are combined as final product and conveyed to the crushed ore stockpile.
| | |
| November 2012 | Shahuindo Project | 256 |
| |
|
MINE DEVELOPMENT ASSOCIATES |
One of the secondary crushing modules is designed to allow for diversion of the secondary screen undersize to a separate double-deck screening module to produce pad gravel (as needed) for pad construction. Oversize crushed ore (+19 mm) discharging from the top screen deck is diverted to the crushed ore final product conveyor. Oversize from the second deck (-19 mm and +6 mm) is pad gravel product and conveyed to a radial stacker and pad gravel stockpile. Undersize from the second screen deck (-6 mm) is conveyed to the crushed ore final product conveyor.
The final plant product is 100% passing 32 mm (approximately 80% passing 22 mm) and is conveyed to a fixed stacker, which discharges to a 5,750 tonne kidney-shaped stockpile (total capacity at 70º arc). The sized pad cover gravel product is stockpiled with a radial stacker adjacent to the crushing plant. The pad gravel stockpile has a total capacity of approximately 2,500 tonnes.
A modular motor control center is housed in a separate room or container and is located proximal to the crushing area. A crusher operator control cabin is mounted above the motor control center.
All of the conveyors are interlocked so that if one conveyor trips out, all upstream conveyors and the vibrating grizzly feeder will also trip. This interlocking will prevent large spills and equipment damage. Both of these features are considered necessary to meet the design utilization for the system.
Table 17-2 outlines the crusher and feeder settings included in the crushing circuit design.
| |
| Table 17-2 | Crushing Circuit Set Points |
| |
| Description | Design Settings |
| Vibrating Grizzly | 225 mm openings |
| Jaw Crusher | CSS 125 mm |
| Secondary Screen | |
Top Deck | 63 mm openings |
Bottom Deck | 32 mm openings |
| Secondary Cone Crusher | CSS 25 mm |
| Pad Gravel Screen | |
Top Deck | 19 mm openings |
Bottom Deck | 6 mm openings |
| | |
| November 2012 | Shahuindo Project | 257 |
| |
|
MINE DEVELOPMENT ASSOCIATES |
The crushed ore stockpile is sized to accommodate a total capacity of approximately 5,750 tonnes. The stockpile is kidney-shaped and is 22.5 m diameter at the base and 8.5 m high at the peak. Dozer-push is used as required to maintain feed to the conveyor system.
The crushed ore is reclaimed from the stockpile by two vibrating pan feeders to a conveyor in a tunnel below the stockpile. Cement for agglomeration is added onto the reclaim conveyor. The reclaim conveyor discharges to an overland conveyor system.
Pad gravel is reclaimed from the gravel stockpile by a front-end loader and loaded into dump haul trucks for transport to the leach pad.
Cement is added onto the tunnel reclaim conveyor a rate of 6 kg/tonne from one 120-tonne silo equipped with bin activator, variable speed screw-feeder, and dust collector. The cement addition rate is controlled by the output of a weightometer mounted on the conveyor belt. The ore with cement is discharged onto the heap stacking line after transport on the overland conveyor system. Once on the lined leach pad area, a small stream of barren solution is added to the crushed ore stream to assist in agglomeration and mixing of the ore and cement through the downstream transfer points along the stacking line (belt agglomeration -- no agglomeration drum is utilized).
The following components are included in the stacking system:
Overland conveyors (2)
Jump conveyors (9 initial + 3 future = 12 total), 35 m long
Ramp conveyors (10 initial + 5 future), 35 m long
An index feed conveyor, 21.3 m long
A horizontal index conveyor, 33.5 m long
A mobile radial telestacker conveyor, 41.5 m long
The overland conveyor system is composed of two fixed conveyors that transport the reclaimed ore and cement to the heap stacking line. As stacking and heap construction progresses, overland conveyor sections will be retired from service.
| | |
| November 2012 | Shahuindo Project | 258 |
| |
|
MINE DEVELOPMENT ASSOCIATES |
The heap stacking line consists of mobile field conveyors (grasshoppers) that transfer the ore to a horizontal index conveyor and mobile stacker conveyor. The number of grasshopper conveyors required varies depending upon the area of the pad being stacked. The maximum number of jump conveyors required will be 12 units to reach the south-central portion of the leach pad from the transfer point at the end of the first overland conveyor segment in Year 5.
The ore is stacked in 8 meter lifts, in cells 80 meters wide (at the toe), and is stacked to a maximum total ore heap height (depth of ore over liner) of 116 meters. The agglomerated ore is left to cure for 48 hours prior to irrigation / leaching.
Once a lift of cells has finished leaching and is sufficiently drained and dry, a new lift can be stacked over the top of the old lift. The old lift is cross-ripped with a dozer prior to stacking the new ore to break up any cemented sections and to redistribute any fines that may have been winnowed by the irrigation solution or rainfall.
During operations, ore is conveyed and stacked onto the pad creating flat layers, or platforms, termed “lifts”, so that the stacking equipment can be moved onto the previous lift for continued stacking. The whole stack advances up the gradient in a stair-step manner, allowing stacking against relatively steep sidewalls of lined area at the sides and back of the heap. The final pad height is 31 lifts.
| |
| 17.6 | Solution Application and Leaching |
Following stacking and a nominal 48 hour cure time, the crushed and agglomerated ore is irrigated with leach solution and the resulting gold-bearing solutions are collected into the pregnant pond.
The Shahuindo Gold project is designed as a single pass system with no recycle of intermediate solutions to the heap leach. The ore is leached with drip tubes spaced 1m apart during the dry season. Sprinklers spaced 6m apart, and dripper tubes are used on side-slopes during the wet season. Reusable PVC pipes are used to distribute the solutions to the sprinklers and dripper tubes on top of the heap. The primary reason to use the sprinklers is to increase evaporation.
To reduce the potential for scaling problems within the irrigation system, it is necessary to continuously add an antiscalant polymer to the leach solutions.
| | |
| November 2012 | Shahuindo Project | 259 |
| |
|
MINE DEVELOPMENT ASSOCIATES |
The total leach time of 75 days has been designed into the crushed ore leach system. The leach time is based upon metallurgical test work. Leach solutions are applied to the ore at a nominal application rate of 6-7 L/hr/m2with a cyanide concentration of 250 ppm to the crushed ore heap.
To reduce cyanide consumption, high concentration cyanide solution is injected directly into the suction side of the barren pumps using metering pumps. This allows for accurate control of cyanide concentration and greatly reduces loss due to natural degradation in the circuit.
Crushed ore is leached at a rate of 3.65 million tonnes/year.
| |
| 17.6.2 | Leach System Description |
Double suction pumps (1 operating, 1 standby) at the barren tank are used for barren solution application to the heap leach. These pumps are mounted beside the barren tank and are high-volume, high-head to pump to the heap leach pad. High-strength cyanide and an antiscalant agent are added to the suction side of the barren leach solution pumps by metering pumps. The nominal flow rate of barren solution is 433 m3/hr with a concentration of 250 ppm cyanide.
A steel and HDPE header-pipe from the barren tank pumps supplies the solution to the active irrigation areas on the leach pad. A totalizing magnetic flow meter and continuous drip solution sampler are installed on the leach solution header for metallurgical balance calculations.
The leach solution header is installed along the north side of the leach pad area. Valved tees at the header supply leach solution to risers that distribute solution to the top of the stacked ore at the active leach-cells.
Reusable Yelomine risers tee off the main header every 60 meters. The sprinkler lines connect directly to the risers at 6 meter spacing. Pressure gauges are included on each riser. Extra risers provide solution to the side slopes.
Gold and silver bearing solutions draining from the leach pad are collected at the bottom of the ore stack by a network of perforated drainage pipes within a gravel layer and are directed to the pregnant pond.
| | |
| November 2012 | Shahuindo Project | 260 |
| |
|
MINE DEVELOPMENT ASSOCIATES |
Installed submersible pumps in the ponds are used for solution transfer. The pumps are mounted on slides on the pond sidewalls to facilitate placement and extraction of the pumps in the ponds. Additional rough-textured protective liner panels and conveyor belting are installed on the pond sidewalls in the area where the pumps are located to protect the pond liner.
A barren solution booster pump station is included with installation of the Phase 2 leach pad extension.
Several leach pad sites were considered, and results of geotechnical drilling revealed that the sites were unsuitable for pad construction. The site ultimately selected for the study is adequate based on results from geotechnical analysis. The Phase 1 heap leach pad capacity is approximately 13.5 million cubic meters (17.6 million tonnes). The final Phase 2 pad capacity is approximately 29.0 million cubic meters (37.8 million tonnes).
An under-drain system consisting of perforated pipes is installed below the low permeability soil (clay) liner to collect and convey any near surface underground water below the pad. In addition, the under-drains act as an early leak detection system that collects any solution that may leak through the composite liner system and allow it to be captured and pumped back to the circuit.
The leach pad consists of a composite liner system utilizing 300 mm of compacted clay underlying a 1.5 mm Low Density Polyethylene (LLDPE) welded liner (geomembrane). On steeper areas, geosynthetic clay liner (GCL) could replace the compacted clay underliner and textured liner is used as required to increase slope stability properties as determined in detailed design.
A 600 mm layer of sized gravel over-liner is placed on the top of the geomembrane to protect the liner and act as a basal drainage layer. Perforated collection pipes are embedded in the gravel layer to enhance solution drainage and provide a rapid return of pregnant solution after it has passed through the ore. The piping and collection layer also minimizes the depth of solution (head) over the liner system.
The collected solution is directed to the pregnant pond and then pumped to the carbon ADR (adsorption-desorption-recovery) process plant for metal extraction.
| | |
| November 2012 | Shahuindo Project | 261 |
| |
|
MINE DEVELOPMENT ASSOCIATES |
The solution containment and storage system includes the following facilities:
Barren Solution Tank
Pregnant Solution Pond
Excess Solution Pond
Waste Dump Seepage Pond
The barren solution tank is an 8 m diameter by 8 m high carbon steel tank and has been sized to provide 45 minutes of storage capacity at the design flow rate of 520 m3/h.
The pregnant and excess solution ponds have been sized to insure that all the leach solutions can be managed in a controlled manner to prevent any unplanned discharges of solution. The pregnant pond is sized to hold a 24-hr working volume of solution plus 24 hours of heap drain-down in the event of an electrical power loss (a total of ~30,500 m3minimum). The excess solution pond is sized to hold the average year wet season accumulations (as calculated from the annual average water balance) plus 24 hours of heap drain-down and the 24-hour/100-year storm event over the entire lined area (a total of ~546,000 m3minimum).
Both the pregnant and excess pond liners utilize a double 1.5 mm high density polyethylene (HDPE) liner system on top of 300 mm of compacted clay soil. Leak detection is provided by geonet sandwiched between the two HDPE liners on top of a low permeability soil liner and a collection system to detect any solution between the liners in the event there is leakage through the primary liner. There is a second similar leak detection and collection system installed between the bottom HDPE liner and the compacted clay liner. This type of double-redundancy liner and leak detection system significantly reduces the possibility of solution entering the environment below the pond. The leak detection systems are checked and logged for solution each shift during operations.
Heavy rain events will result in solution being diverted to the excess solution pond. Storm water solution in the excess pond is returned to the barren tank as make-up solution as soon as practical.
There is also a waste dump seepage pond that captures and stores seepage water from precipitation events that occur over the waste dump. The pond utilizes a single liner
| | |
| November 2012 | Shahuindo Project | 262 |
| |
|
MINE DEVELOPMENT ASSOCIATES |
system of 300 mm layer of compacted clay soil. Any water accumulating in the pond is periodically pumped out to the excess pond.
All ponds have a freeboard of 1 meter (including a safety berm of 500 mm) around the perimeter of the ponds.
There are two separate components within the water and solution management system at Shahuindo:
| 1. | A rainfall collection and storage system is used to supply make-up water and water for all other uses at the mine site (dust control, sanitary, and miscellaneous). This system of two reservoirs catches and stores rainfall in single-lined ponds for later use. |
| | |
| 2. | An excess and pregnant solution collection and storage system to accommodate and manage seasonal variations of solution from the process, as well as storm water surges from the leach pad and waste dump areas. This pond system (HDPE double-lined) provides the necessary capacity to store the process solutions during normal years and very wet years. |
Both systems are equipped with interconnecting pumping and piping/canal systems to allow for orderly transfers of water or solution to and from the reservoirs and to the points of use in the heap leach facilities.
Solution management for the system is generally simple. The pregnant pond should be maintained in the mid-to-lower range of its working capacity. The excess solution pond should normally be maintained at empty or low levels whenever possible. When solution is diverted to the excess solution pond, it should be pumped back to the leach system as soon as practical. Every effort should be made to avoid storing excess solution over a long period of time.
The leach pad will be constructed in two phases, and the excess pond impoundment construction is correspondingly phased. A summary of the various impoundments is shown below.
| | |
| November 2012 | Shahuindo Project | 263 |
| |
|
MINE DEVELOPMENT ASSOCIATES |
| |
| Table 17-3 | Water Impoundment and Solution Storage Capacities |
| | | |
| Designation | Construction
Phase* | Purpose | Storage Capacity (m3) |
| Excess Pond | 1& 2 | Excess Solution Storage | 546,000
(total Phase 1 + Phase 2) |
| Pregnant Solution Pond | 1 | Pregnant Solution Storage | 30,500 |
Waste Dump Seepage
Pond | 1 | Waste Dump Seepage
Capture | 9,650 |
| Water Storage Ponds | 1 | Water storage | 350,000
(total of ponds 1 and 2) |
| * | Phase 1 is prior to start-up; Phase 2 is ready by the end of year 3 |
A 500 m3/hr cyanide neutralization circuit (peroxide/copper sulfate) with a carbon adsorption scavenger system is included for emergency neutralization and discharge. The equipment is sized for 500 m3/hr to allow 100% of the excess solution accumulation and/or the excess pond to be drained in approximately 1.5 month’s time to accomodate emergencies or an unforseen period of consecutive, exceptionally wet years. A first-fill inventory of 30 days of neutralization chemicals is also included in the capital cost estimate.
| 17.9.1 | Excess Solution Impoundment |
Excess solution consists of a mixture of process solutions and storm water collected by the leach pad and generally represents seasonal accumulations. Because it can be characterized as dilute process solutions, chemical concentrations in the excess solutions are usually considerably less than those found in the process solutions. The excess solution usually will contain 5-40 ppm total cyanide (CN) and have a pH of 7-10. It is common for seasonal accumulations of excess solution to be stored for months at a time and over time the cyanide is degraded by ultraviolet light, and further diluted by subsequent storm waters.
The excess solution impoundment includes a compacted dam. The dam and impoundment are lined with clay and two, 1.5 mm HDPE liners.
The impoundment has an under-drain system to allow springs and seepages to freely drain through a network of perforated pipes. This system also acts as an additional leak detection system beneath both the HDPE liners and the compacted clay layer. The under-drain system is equipped with a pump-back sump so that if a leak is detected in the impoundment, all leaking solution can be returned to the impoundment.
| | |
| November 2012 | Shahuindo Project | 264 |
| |
|
MINE DEVELOPMENT ASSOCIATES |
Further, incorporating additional conservatism, the excess solution pond is tentatively sized at 546,000 m3. The maximum daily rainfall event is estimated to be 80 mm, as noted above and the pond is sized to accommodate this amount over the active leach area plus a 24-hour heap draindown in the event of no power/pumps.
| 17.9.2 | Pregnant Solution Pond |
Following stacking, the crushed ore is irrigated with leach solution and the resulting gold-bearing solutions are collected and sent to the pregnant solution pond. The pond is lined with 300 mm of clay and two 1.5 mm HDPE liners, and includes a leak detection system.
The pregnant pond is sized at 30,500 m3. The maximum daily rainfall event is estimated to be 80 mm, as noted previously. The pregnant pond is sized to accommodate this amount over the active leach area plus a 24-hour heap draindown in the event of no power/pumps, including the normal working volume of 12,500 m3. The pond is designed to overflow to the excess pond if the storage capacity is exceeded.
| 17.9.3 | Waste Dump Seepage Pond |
The waste dump seepage pond is located at the base of the waste dump to collect and isolate any water seeping from the dump due to water infiltration from rainfall events.
The pond has a design capacity of 9,650 m3and is single-lined with 300 mm of clay. Any seepage accumulating in the pond will be periodically pumped out to the excess pond.
| 17.9.4 | Water Storage Impoundments |
The water storage impoundments are located to the south of leach pad. There are two impoundment facilities (east and west) that have a total storage capacity of approximately 350,000 m3. The impoundments include compacted dams and the dams and impoundments are single-lined with 1.5mm HDPE.
Water pumped from mine pit interceptor wells, surface diversion ditches, and rainfall runoff is captured and stored in the impoundments for process water needs and downstream user requirements. Open pit dewatering water from in-pit wells, horizontal drains and precipitation may also be sent directly to the storage facilities provided that they meet water quality standards. In the event that pit water does not meet the
| | |
| November 2012 | Shahuindo Project | 265 |
| |
|
MINE DEVELOPMENT ASSOCIATES |
standards, the open pit dewatering water will be sent to a water treatment plant before entering the water impoundments.
| 17.9.5 | Pit Dewatering Water Treatment |
For the purposes of the feasibility study, a chemical coagulation/filtration process is to be used as the water treatment method for any mine pit dewatering water that fails to meet water quality standards for discharge into the water storage impoundments. This method includes pH adjustment, if required, then utilizes hypochlorite (or Cl2) and ferric chloride to oxidize and remove arsenic, iron and other metals from solution, followed by coagulation and filtration.
The treatment plant processing rate is estimated at a maximum of approximately 120 m3/h based on pit dewatering flow estimates from Ausenco. No samples of pit dewatering water are presently available; therefore, a very conservative water treatment design has been used.
Based on the operating performance at a similar mining operation, arsenic, iron, zinc and aluminum are effectively removed to below discharge standards. Antimony (if present) could be reduced by approximately 50%. According to available literature, mercury and/or cadmium (if present) should be susceptible to the chemical coagulation/filtration process using ferric chloride. A packed-bed highly-activated carbon column is included as these other metals in solution may require additional treatment to reach final discharge standards.
Based on a groundwater sample from a piezometer hole P-6, only arsenic and sulfate exceed their respective Peruvian water standards. However, additional water sample analysis should be undertaken to identify any changes in water chemistry and/or treatment requirements as interceptor and in-pit dewatering wells are drilled and well monitoring programs are established. Peru water quality discharge specifications are shown below:
| | |
| November 2012 | Shahuindo Project | 266 |
| |
|
MINE DEVELOPMENT ASSOCIATES |
| |
| Table 17-4 | Peru Discharge Standards Liquid Effluents from Mining Activities* |
| | | |
| Parameter | Unit | Maximum
Concentration
(Instantaneous) | Maximum
Concentration
(Annual Average) |
| pH | | 6-9 | 6-9 |
| TSS | mg/l | 50 | 25 |
| CNtotal | mg/l | 1.0 | 0.8 |
| Cu | mg/l | 0.5 | 0.4 |
| Cd | mg/l | 0.05 | 0.04 |
| Zn | mg/l | 1.5 | 1.2 |
| Pb | mg/l | 0.20 | 0.16 |
| As | mg/l | 0.1 | 0.08 |
| Fe | mg/l | 2.0 | 1.6 |
| Crhexav | mg/l | 0.10 | 0.08 |
| Hg | mg/l | 0.0020 | 0.0016 |
| * | Decreto Supremo No 010-2010-MINAM, Peru Ministry of Energy and Mines |
| 17.10 | Process Water Balance |
| |
| 17.10.1 | Precipitation Data |
Based upon rainfall data provided by Ausenco, the solution management system for the Shahuindo heap leach is designed as a zero discharge facility during average rainfall years. This is achieved by using excess solution accumulated during the wet season for make-up requirements during the dry season and by enhanced evaporation of excess solutions. During extremely wet years, planned discharge of neutralized solutions will likely occur in order to have the excess solution pond empty by the end of the dry season in preparation for the next rainy season.
Active water balances have been calculated after Phase 2 construction is completed for an average year, a 100-year wet year and a 100-year dry year. A schematic overall water balance considering daily averages for the average rain year, an extreme wet year and an extreme dry year are shown in Figures 17-3, 17-4, and 17-5.
Any runoff from the waste dump is sent to the excess pond and is included within the process water balance. The waste dump seepage pond evaporation and pond rainfall collection area are also included in the calculations.
| | |
| November 2012 | Shahuindo Project | 267 |
| |
|
MINE DEVELOPMENT ASSOCIATES |
The excess solution pond volume used for water balance solution storage calculations has been designed to allow for emergency situations. The storage volume of the pond takes into account the volume that must be reserved to contain a 100-year, 24-hour storm event over the entire lined collection area and the 24-hour drain-down volume from the heap leach in the event of power or pump/pipeline failure. In the event of a major rainfall event, or a disruption of the leach system due to a major power outage or pump/pipeline failure, overflow from the pregnant pond is allowed to enter the excess solution pond. The solution captured in the excess solution pond under these conditions is returned to the barren tank or to the pregnant pond after the upset conditions are under control.
The Phase 2 balances indicate that additional evaporation will be required to reduce excess solution volumes in both the average and 100 year wet year balance. For the average year, sprinklers irrigation of the leach pads will be used (in conjunction with drip emitters) on the heap during the wet season to increase evaporation. During a 100 year wet year, sprinklers are used year-round, as necessary.
Since the excess solution pond should be essentially empty at the end of the dry season, an additional enhanced evaporation system is required. A total of fourteen, 25 m3/hr capacity land-mounted evaporation units operating at 35% evaporation efficiency are included. This is the estimated maximum number of evaporation units that can be effectively deployed in the heap and process area without encountering overspray problems. An additional 4 units have been included for use in the open pit area, but those have no effect on the process water balance.
During an average year wet season, contaminated storm waters can be diverted to the excess solution pond. The excess solution pond does not reach its maximum capacity during an average year. During the average year dry season, solution collected in the excess solution pond is returned to the barren as make-up solution for adsorption and evaporation losses. Only a limited number of enhanced evaporation units will need to be operated during the dry season to “empty” the excess solution pond.
During a 100-year wet year, active water balance calculations (shown in Table 17-7 and Figure 17-3) show that detoxification and discharge activities will be required since enhanced evaporation will not be sufficient to avoid reaching maximum carrying capacity in the excess solution pond during the wet season. Careful monitoring of the excess solution pond should be followed to initiate detoxification and discharge activities as required and, as the year progresses, to empty the excess pond before the onset of the next rainy season.
| | |
| November 2012 | Shahuindo Project | 268 |
| |
|
MINE DEVELOPMENT ASSOCIATES |
During an extreme dry year, no sprinklers or enhanced evaporation are required and makeup water from pit dewatering and/or the raw water impoundments will be used to maintain the system in-balance.
Following these simple rules will allow safe management of the system with adequate surge capacity and reaction time to maintain control of the system without constant emergencies during rain events.
| | |
| November 2012 | Shahuindo Project | 269 |
| |
|
MINE DEVELOPMENT ASSOCIATES |
| |
| Figure 17-3 | Average Year Daily Water Balance Schematic |
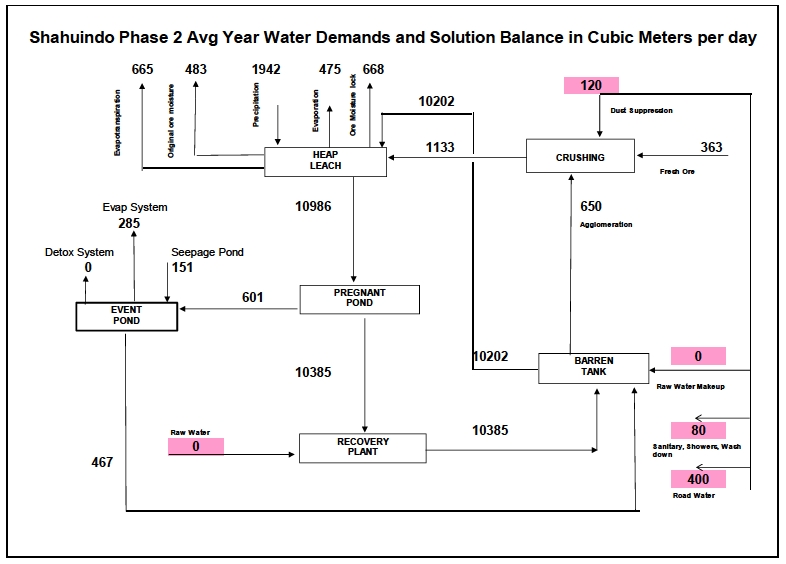
| | |
| November 2012 | Shahuindo Project | 270 |
| |
|
MINE DEVELOPMENT ASSOCIATES |
| |
| Figure 17-4 | 100 Year Wet Year Daily Water Balance Schematic |
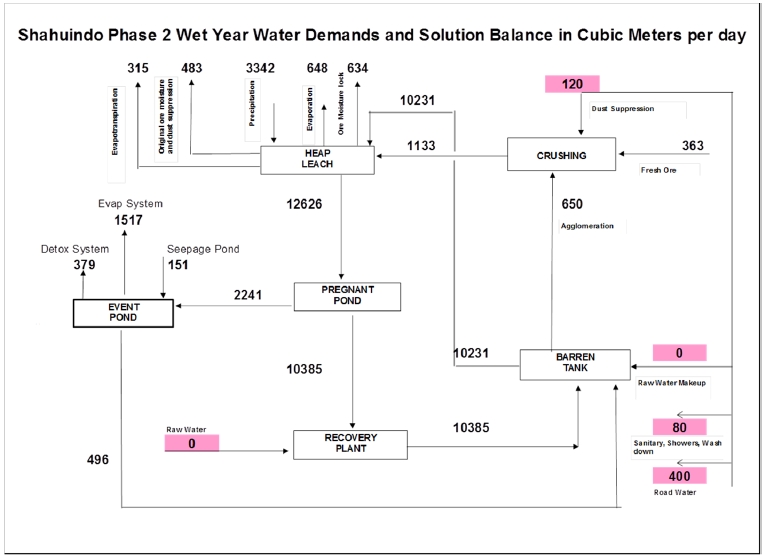
| | |
| November 2012 | Shahuindo Project | 271 |
| |
|
MINE DEVELOPMENT ASSOCIATES |
| |
| Figure 17-5 | Dry Year Daily Water Balance Schematic |
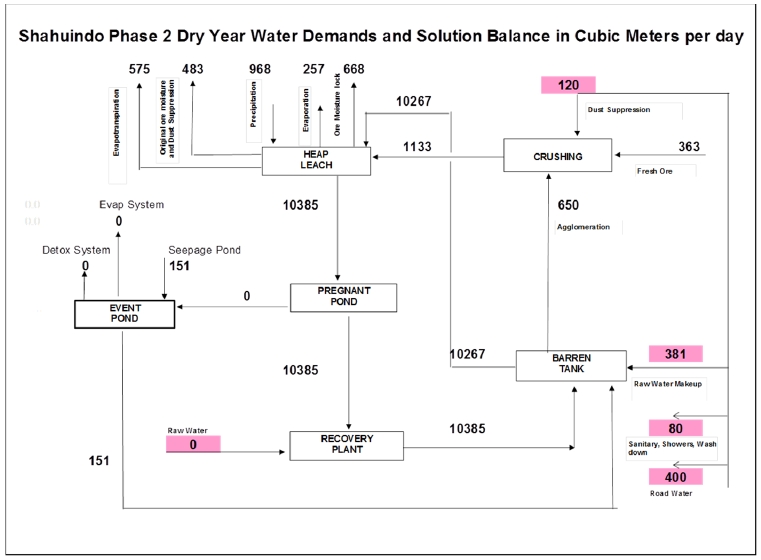
| | |
| November 2012 | Shahuindo Project | 272 |
| |
|
MINE DEVELOPMENT ASSOCIATES |
The adsorption section of the ADR facility consists of one column train of five, cascade type open-top up-flow mild-steel carbon adsorption columns. Each of the carbon columns are nominally 3.16 meters in diameter by 3.16 meters high, with a capacity of 6 tonnes of activated carbon, designed for a solution flow of 520 m3/hr.
Pregnant solution is pumped directly to the adsorption circuit using a submersible pump on a pump slide in the pregnant pond. Antiscalant is added to the pump suctions to prevent scaling of the carbon that can affect carbon loading. Barren solution exiting the last carbon adsorption column flows through a screen to separate and capture any floating carbon from the solution.
A magnetic flow meter equipped with a totalizer measures solution flow to the carbon columns. Pregnant and barren solution continuous samplers are installed at the feed and discharge end of the carbon column train. These are used to measure feed and barren solution gold and silver concentrations. Additional sample points for solution and carbon samples are provided on each column to monitor adsorption efficiency and gold/silver loading profiles.
Adsorption of gold and silver from pregnant leach solution is a continuous process. Periodically, the carbon contained in the lead column in the series becomes loaded with gold and silver, and must be advanced to the acid wash and desorption circuit. Loaded carbon is transferred as a batch from the lead column to the acid wash column using pumps.
Carbon in the remaining columns is then advanced, one at a time, and a batch of new (or stripped/regenerated) carbon is transferred into the final empty column using pumps. Drive solution for the carbon transfer pumps comes from the barren tank process solution pump. Loaded carbon transfers approximately every 24 hours and desorption occurs approximately four to seven times per week during normal operation.
Acid washing consists of circulating a dilute acid solution through the bed of carbon to dissolve and remove scale from the carbon. Acid washing the carbon may be done either before or after each desorption cycle. The process is performed on a batch basis.
| | |
| November 2012 | Shahuindo Project | 273 |
| |
|
MINE DEVELOPMENT ASSOCIATES |
The acid wash circuit includes the following major components:
A fiberglass, or FRP-lined, acid wash column, 6 tonne carbon capacity, with a 5:1aspect ratio (height to diameter) to reduce short-circuiting of solution
An acid mix tank, 12 m3capacity, of polypropylene or fiberglass
An acid wash solution circulation pump with a 24 m3/hr capacity each
A concentrated acid transfer pump
An acid wash carbon transfer pump
An acid wash area sump pump
After carbon is transferred into the acid wash column, but before any acid is introduced, fresh water is circulated through the bed of carbon to remove any entrained caustic cyanide solution. This rinse solution is pumped to the pregnant solution pond with the acid wash circulation pump. A dilute acid solution is then prepared in the mix tank, and circulation is established between the acid wash vessel and the acid mix tank. Concentrated acid is injected into the recycle stream to achieve and maintain a pH ranging from 1.0 to 2.0. Completion of the cycle is indicated when the pH stabilizes between 1.0 and 2.0 without acid addition for a minimum of one full hour of circulation.
After acid washing has been completed, the acid wash pump will pump spent acid solution from the acid mix tank and wash vessel directly to the pregnant pond. The carbon is then rinsed with raw water followed by rinsing with dilute caustic solution to remove any residual acid. Total time required for acid washing a 6 tonne batch of carbon is 4 to 6 hours. After acid washing is complete, a carbon transfer pump will transfer the carbon to the desorption section.
A Zadra pressure elution, hot caustic desorption circuit has been selected for the Shahuindo Project. This type of circuit requires 24 hours or less to complete a cycle and for this reason each strip batch is sized for 6 tonnes of carbon. Each desorption cycle requires the transfer of a 6 tonne batch from the adsorption circuit to the strip vessel.
The desorption circuit is sized to elute, or “strip,” the gold from a 6-tonne batch of carbon into pregnant eluate solution. During the elution cycle, gold and silver are continuously extracted by electrowinning from the pregnant eluate concurrently with desorption. A complete desorption cycle will require approximately 18 hours. The desorption section of the plant contains the following major components:
| | |
| November 2012 | Shahuindo Project | 274 |
| |
|
MINE DEVELOPMENT ASSOCIATES |
One stainless steel, insulated pressure vessel with 6-tonne carbon capacity
One 3.4 million BTU/hr output, diesel-fired hot water heater with hot water recirculation pumps
Four, plate heat exchangers: primary, heat recovery (2 each) and cooling
One insulated eluant storage tank sufficient to hold 48 m3
One eluant solution pump, sized for 24 m3/hr and
One elution carbon transfer pump
After a batch of carbon has been transferred to the elution vessel, barren strip solution (eluant) containing sodium hydroxide and sodium cyanide is pumped through the heat recovery and primary heat exchangers, and introduced to the elution vessel at a temperature of 135°C and a nominal operating pressure of approximately 340 kPa (50 psig). Final stripped-carbon gold and silver content is typically less than 160 grams per tonne of carbon.
Under normal operating conditions, barren eluant solution from the solution storage tank will pass through the heat recovery exchanger to be preheated by hot pregnant eluant leaving the elution column. The barren eluant solution then passes through the primary heat exchanger to raise the temperature up to 135°C using pressurized hot water (~180°C) from the boiler system.
The elution column contains three, internal stainless steel inlet screens to hold carbon in the column and to distribute incoming stripping solution evenly in the column. Pregnant eluant solution leaving the elution column passes through two external stainless steel screens before passing the cooling heat exchanger to reduce the eluate temperature to about 75°C (to prevent boiling at 3,000 meters above sea level). The cooled pregnant eluate solution is sent to the electrowinning cells.
After desorption is complete, the stripped carbon is pumped to dewatering screens to remove water and carbon fines, and transferred to carbon regeneration or to the carbon storage tank.
The electrowinning circuit is operated in series with the elution circuit. Solution is pumped continuously from the barren eluant tank through the elution vessel, then
| | |
| November 2012 | Shahuindo Project | 275 |
| |
|
MINE DEVELOPMENT ASSOCIATES |
through the electrowinning cells, and back to the barren eluant tank in a continuous closed loop process.
The precious metals recovery (electrowinning) system includes the following components:
Two 3.5 m3electrolytic sludging cells containing stainless steel cathodes andanodes
Two DC power supply, 0 to 9 volt, 0 to 2,000 amperes
A hood with exhaust fan for electrolytic cell off-gas venting
Two electrolytic cell discharge pumps
A cathode wash box and pressure washer
A plate-and-frame cathode sludge filter press (0.43 m3) and filter feed pump
The gold and silver-laden solution exiting the elution column is filtered to trap any carbon escaping from the column; passes through the heat recovery exchanger and the cooling exchanger to reduce the solution temperature to 75ºC and flows to the electrowinning circuit.
Gold and silver are won from the eluant in the electrowinning cells using stainless steel cathodes and a current density of approximately 50 amperes per square meter of anode surface. Caustic soda (sodium hydroxide) in the eluate solution acts as an electrolyte to encourage free flow of electrons and promote the precious metal winning from solution. To keep the electrical resistance of the solution low during desorption and the electrowinning cycle, make-up caustic soda must sometimes be added to the barren eluant tank. Barren eluate solution leaving the electrolytic cells is pumped back to the eluate storage tank for recycle through the elution column.
Periodically, all or part of the barren eluant is dumped to the pregnant pond and new solution is added to the tank. Typically, about one-third of the barren eluant is discarded after each elution or strip cycle. Sodium hydroxide and sodium cyanide are added as required from the reagent handling systems to the barren eluant tank during fresh solution make-up.
The precious metal-laden cathodes in the electrolytic cells are removed about once per week and processed to produce the final doré product. Loaded cathodes are transferred to a cathode wash box where precipitated precious metals are removed from the
| | |
| November 2012 | Shahuindo Project | 276 |
| |
|
MINE DEVELOPMENT ASSOCIATES |
cathodes with a pressure washer. The resulting sludge is pumped to a plate-and-frame filter press to remove water and the filter cake is loaded into pans for mercury retorting.
| 17.11.5 | Carbon Thermal Regeneration |
Thermal regeneration consists of drying the carbon thoroughly and heating it to approximately 750º C for ten minutes. It is expected that thermal reactivation every third adsorption cycle will maintain suitable carbon activity. The thermal regeneration circuit will include the following major components:
A regeneration feed dewatering screen
A carbon kiln feed hopper, 6 tonne capacity complete with variable speed screwfeeder
A horizontal, diesel-fired carbon regeneration kiln, 250 kilogram per hour capacitywith an off-gas mercury scrubber system
A carbon quench tank, 6 tonne capacity, and
A regenerated carbon transfer pump
A carbon storage dewatering screen
A carbon fines storage tank, and
A carbon fines plate-and-frame filter press with filter feed pump
The 6 tonne carbon batch to be thermally reactivated is dewatered on a vibrating screen, transferred to the regeneration kiln feed hopper and fed to the regeneration kiln by a screw feeder. Hot, regenerated carbon leaving the kiln falls into a water-filled quench tank for cooling and storage. Ultimately, quenched regenerated carbon is pumped to the carbon storage dewatering screen to remove any fines and the coarse carbon will be returned to the adsorption circuit.
Carbon fines passing the regeneration feed dewatering screen and/or the carbon storage dewatering screen are stored in the carbon fines tank and are periodically filtered in a carbon fines filter press. The carbon fines recovered in the filter are stored in drums and the filtrate solution is sent to the barren tank.
| 17.11.6 | Refining and Smelting |
The smelting portion of the circuit includes the following major components:
| | |
| November 2012 | Shahuindo Project | 277 |
| |
|
MINE DEVELOPMENT ASSOCIATES |
A 0.43 m3(15 ft3), electric mercury retort (Dee type) with condenser, scrubbersystem (sulfur-impregnated carbon) and vacuum pump
A diesel-fired, tilting crucible furnace, 600 kilograms red brass capacity
A smelting furnace hood and off-gas extraction blower
A smelting furnace off-gas scrubber system
A flux mixer (cement mixer)
A slag jaw crusher, 127 mm x 178 mm (5” x 7”)
Cathode sludge from the filter press is dried and treated in a mercury retort to remove and recover any mercury that might be present. Sludge is placed into pans and heated in the retort for approximately 6 hours at about 480°C to volatilize the mercury.
A vacuum pump system removes mercury vapor from the retort oven and passes the vapor through a water-cooled mercury condenser. Condensed mercury is collected in a trap, and then transferred and stored in flasks for later sale. Cooled mercury-depleted vapor leaving the trap is passed through a sulfur-impregnated carbon scrubber to remove any residual mercury and maintain final emissions below 0.15 milligrams mercury per cubic meter of air.
Estimated average annual mercury recovered is approximately 450 kg or about thirteen, 76-pound flasks per year.
After mercury removal, cathode sludge is mixed with fluxes and is then fed to a tilting diesel fired furnace. After melting, slag is poured off into 100 kg capacity cast iron molds until the remaining molten furnace charge is mostly molten metal (doré). Doré is poured off into 40 kg bar molds, cooled, cleaned, and stored in a vault pending shipment to a third party refiner. The Doré poured from the furnace will represent the final product of the processing circuit.
Periodically, slag produced from the smelting operation is re-smelted on a batch basis to recover residual metal values. Reprocessed slag will be placed on the heap leach pad.
A hood collects the furnace fumes which will pass through a bag house to remove particulates, then through an induced draft fan. The system will be designed to remove over 99.5% of the particulates present in the exhaust fumes.
| | |
| November 2012 | Shahuindo Project | 278 |
| |
|
MINE DEVELOPMENT ASSOCIATES |
| 17.12 | ADR Reagent Mixing and Handling Systems |
The reagent handling system includes equipment used to mix and store sodium cyanide and sodium hydroxide batches, to add both of these reagents to the barren eluant solution tank, caustic to the acid wash circuit, and to add cyanide to the barren leach solution system. Reagent mixing and storage are at ambient temperature and pressure. The major equipment required to perform these tasks includes:
A sodium cyanide mix tank with agitator and bag breaker system
A sodium cyanide transfer pump
A sodium cyanide storage tank
Sodium cyanide dosing pumps (4)
A sodium hydroxide mix/storage tank with agitator
Sodium hydroxide transfer pump
Sodium hydroxide metering pump (for acid wash circuit)
Antiscalant dosing pump
Solid, sodium cyanide briquettes are delivered to the site in 1-tonne sacks. Raw water or barren solution is used to partially fill the cyanide mix tank and a small amount of sodium hydroxide (pumped from the caustic storage tank) is added to the tank to make a 0.5% NaOH solution prior to the addition of sodium cyanide briquettes. The caustic addition will insure that proper alkaline pH is maintained, thereby minimizing waste of cyanide by dissociation and possible generation of toxic HCN gas.
An electric hoist is used to lift the sacks to the top of the cyanide mix tank. A bag breaker system is mounted above the mix tank to discharge cyanide briquettes into the mix tank. The tank is designed to contain and dissolve solid sodium cyanide briquettes and yield a solution containing 25% (by weight) sodium cyanide.
Distribution of the high-strength cyanide solution is by metering pumps to points of use at the barren solution pump suctions. If needed in the elution cycle, cyanide solution for the barren eluant tank is pumped from the cyanide storage tank using a separate metering pump.
| | |
| November 2012 | Shahuindo Project | 279 |
| |
|
MINE DEVELOPMENT ASSOCIATES |
All cyanide distribution lines will be double-containment, either by “pipe-within-pipe” or “pipe-over-liner” containment systems.
Sodium hydroxide (caustic) solution is prepared in an agitated caustic mix tank. Sodium hydroxide is delivered to the site in small sacks (25 to 50 kg). Raw water or barren solution will be used to fill the mix tank and solid sodium hydroxide will be manually added to the tank for dissolution. The tank is designed to contain and dissolve solid NaOH flakes, or pearls, and to yield a solution containing 20% (by weight) sodium hydroxide.
For elution, concentrated caustic solution is pumped from the mix tank to the eluant storage tank where it is mixed with raw water to produce a 1% (by weight) sodium hydroxide eluant solution. The estimated consumption of sodium hydroxide is about 160 kilograms per elution cycle assuming replacing one-third of the eluate solution batch each cycle. Fresh sodium hydroxide solution for barren eluant make-up is pumped from the caustic mix tank directly into the eluant storage tank.
For cyanide mixing, concentrated caustic solution is pumped to the cyanide mix tank where it is mixed with barren solution (or raw water) to produce a 0.5% (by weight) solution. The estimated consumption of sodium hydroxide is about 140 kilograms per cyanide mix batch.
For carbon acid wash neutralization, concentrated caustic solution is pumped to the acid wash tank where it is mixed with raw water and circulated through the acid wash column. The estimated consumption of sodium hydroxide is about 8 kilograms per 6-tonne carbon acid was batch.
The carbon handling system will include equipment used to transfer, store and to add/handle carbon. The major equipment required to perform these tasks includes:
Carbon transfer pumps for carbon transfer (5);
Carbon dewatering screens (2);
Carbon fines filter press;
Electric hoist for carbon bulk bag handling (1).
| | |
| November 2012 | Shahuindo Project | 280 |
| |
|
MINE DEVELOPMENT ASSOCIATES |
Carbon transfer pumps transfer carbon between the various unit operations in the recovery plant. Loss of carbon in the processing circuit is expected to average approximately 5 tonnes/month.
The carbon column train has one carbon transfer pump to transfer carbon between columns and to transport carbon to the elution column. Each carbon column will be valved for to a suction and discharge manifold on the pump. “Push” water for carbon transfer will be barren solution pumped from the barren solution pump to the recovery plant manifold.
New carbon is added to the circuit after pre-soaking in water. A carbon bulk bag, which contains about 0.5 tonnes of virgin carbon, will be loaded into a soaking vessel by an electric hoist. Fresh water is added to the vessel, and the carbon will be soaked for 24 hours.
Once the soaking process is complete, the carbon slurry is pumped to a vibrating dewatering screen for removal of fines. The oversize carbon from this screen drops directly into the carbon quench tank and the carbon is ready for transfer to the adsorption columns. The undersize from the screen drains to the carbon fines tank and is filtered into dry cakes in a filter press and stored in drums or supersacks.
Carbon leaving the acid wash circuit passes over a carbon dewatering screen or the regeneration feed dewatering screen. Water and fine carbon passing either screen is sent to the carbon fines filter to recover the fine carbon. Clear solution leaving the filter will be discharged to the excess solution pond or to the barren solution tank.
New/washed/regenerated carbon stored in the carbon quench tank is pumped to the carbon trains to replace carbon removed for elution or to replace carbon losses.
| 17.14 | Process Solution and Makeup Water |
Process solution is required in the heap leach recovery plant for reagent make-up, wash down, filter cleaning, and other uses. The process solution requirements are met by a separate pipeline from the barren tank. With the exception of extremely dry years, only minor amounts of fresh raw water will be required in the recovery plant.
| | |
| November 2012 | Shahuindo Project | 281 |
| |
|
MINE DEVELOPMENT ASSOCIATES |
| 17.15 | Process Reagents and Consumables |
| |
| 17.15.1 | Usage and Storage Requirements |
A reagent contained and roofed reagent storage area is included in the process area. Average estimated annual reagent and consumable consumption quantities for the Process Area are shown in Table 17-5.
| |
| Table 17-5 | Projected Annual Reagents and Consumables |
| | | |
| Reagent | Form | Storage Capacity | Annual Consumption |
| Cement - Portland Type II | Bulk | 120 t | 21,900t |
| Sodium Cyanide (98%) | Briquettes 1000 kg
Supersacks | 60 t | 987 t |
| Activated Carbon | 500 kg Supersacks | 12 t | 48 t avg (62 t to 40 t)* |
| Diesel | Liquid Bulk Delivery Truck | 300 m3Mine, 20 m3
Process | 7,000 m3 avg Mine, **
1,150 m3 avg Process* |
| Antiscalant | Liquid Tote 1 m3Bins | 7 m3 | 47 m3 |
| Hydrochloric Acid (32%) | Liquid Tote Bins | 20 m3 | 256 m3 avg
(311 m3 to 201 m3)* |
| Sodium Hydroxide | Dry Solid Sacks | 3 t | 23 t avg (28 t to 18 t)* |
| Silica | Dry Solid Sacks | 1 t | 5 t avg (7 t to 3 t)* |
| Borax | Dry Solid Sacks | 1 t | 8 t avg (11 t to 5 t)* |
| Soda Ash | Dry Solid Sacks | 1 t | 4 t avg (5 t to 3 t)* |
| Niter | Dry Solid Sacks | 1 t | 3 t avg (4 t to 2 t)* |
| Hydrogen Peroxide (50%) | Liquid Tote 1 m3Bins | 20 t | N/A |
| Copper Sulfate | 1000 kg Supersacks | 1 t | N/A |
| Sulfuric Acid (94%) | Liquid Tote 1 m3Bins | 20 t | N/A |
| Crusher Liners | Mn Steel | 1 set/crusher | 6 sets/crusher |
| * | Varies with gold/silver head grade and elution cycles required |
| ** | Average mining fuel consumption years 1 thru 5, declines thereafter |
| |
Cement is assumed to be delivered in 20-tonne bulk truckloads. Storage is in one, 120-tonne silo and the estimated consumption is 60 tonnes/day when cement addition is required. Generally this will require 3 to 4 truck deliveries per day with a 2-day supply stored onsite.
The cement from the silos is metered directly onto the conveyor through screw feeders. A bin activator and dust collector is included with each silo.
| | |
| November 2012 | Shahuindo Project | 282 |
| |
|
MINE DEVELOPMENT ASSOCIATES |
The cyanide system includes equipment used to mix, store and distribute sodium cyanide solutions to the agglomeration, heap leach, and elution systems. Reagent mixing and storage is at ambient temperature and pressure. The major equipment required to perform these tasks includes:
Sodium cyanide is delivered as briquettes in 1,000 kg bulk bags inside plywood crates. The sodium cyanide briquettes are dissolved using barren solution in a carbon steel tank equipped with an agitator. A 25% sodium cyanide solution concentration (maximum) is prepared in this manner. After dissolution, the cyanide solution is transferred to a storage tank with a 1.5-batch storage capacity. Usage requirements indicate that one 2-tonne batch should be mixed every shift.
Distribution of the high-strength cyanide solution is by individual metering pumps to points of use at the barren solution pumps, elution circuit, and agglomeration solution pump.
All cyanide distribution lines will be double-containment: either “pipe-within-pipe” or “pipe-over-liner” systems. A one-month reserve supply of dry cyanide inventory should be kept on-site, in case of supply interruptions, and is to be stored in a secure fenced and roofed area.
Activated carbon is used to adsorb the precious metal values from the leach solution in the adsorption columns. Make-up carbon is 6 x 12 mesh. Carbon is delivered in 500-kg supersacks. Carbon transfer pumps transfer carbon between the various unit operations in the recovery plant. New carbon is added to the circuit after pre-soaking. The new carbon requirement to replace fine carbon losses is projected to be 3% of the weight of carbon stripped in the elution section.
| | |
| November 2012 | Shahuindo Project | 283 |
| |
|
MINE DEVELOPMENT ASSOCIATES |
| 17.15.5 | Hydrochloric Acid |
Hydrochloric acid (HCl) is used in the acid wash section of the elution circuit prior to return to the adsorption columns, or transfer to the carbon regeneration kiln. Hydrochloric acid (approximately 32% by weight in water) is delivered in 200 liter drums or 1,000 liter tote bins. Acid washing consists of circulating a dilute acid solution through the bed of carbon to dissolve and remove scale from the carbon. Acid washing the carbon is usually done after each desorption cycle.
Diesel fuel is required for the elution boiler, carbon regeneration kiln, and the smelting furnace. Approximately 96,000 liters (96 m3) of diesel fuel will be consumed in the process area each month.
Antiscalant agents are used to prevent the build-up of scale in the process solution and heap irrigation lines. Antiscalant agent is normally added to the process pump intakes, or directly into pipelines, and consumption varies depending on the concentration of scale-forming species in the process stream. Delivery is in liquid form in 1 m3(1-tonne) bulk containers.
Antiscalant is added directly from the supplier bulk containers into the pregnant and barren pumping systems using variable speed, chemical-metering pumps. On average, antiscalant consumption is expected to be about 6 kilograms per 1,000 m3(6 ppm) of process solution to be treated (pregnant and barren) which equates to 120 kilograms per day. The recommended minimum inventory should be 7 tote bins.
Various fluxes are used in the smelting process to remove impurities from the bullion in the form of a glass slag. The normal flux components are a mix of silica sand, borax, and sodium carbonate (soda ash). The flux mix composition is variable and is adjusted to meet individual project smelting needs: fluorspar and/or potassium nitrate (niter) are sometimes added to the mix. Dry fluxes will be delivered in 25-kg or 50-kg bags. Average consumption of fluxes is estimated to be 0.075 kilograms per troy ounce of gold and silver produced.
| | |
| November 2012 | Shahuindo Project | 284 |
| |
|
MINE DEVELOPMENT ASSOCIATES |
| 17.15.9 | Hydrogen Peroxide |
The amount of hydrogen peroxide required is strongly dependent on the cyanide concentration of the solution to be treated and discharged (5.6 g H2O2/ 1 ppm CN). Typically the solution to be discharged is contaminated storm-water that has been exposed to sunlight while stored in the excess solution pond for some time. Ultraviolet radiation significantly decomposes cyanide fairly rapidly. Under these conditions the cyanide levels in the excess solution are normally only a few ppm, and dosage rates are typically in the range of 0.25 kg hydrogen peroxide per cubic meter of solution treated. At this addition rate, 288,000 m3could be treated with the recommended inventory of 20 tote bins.
Copper sulfate is used as a catalyst with the hydrogen peroxide to speed the cyanide destruction process. Only a very small addition is required, and some solutions contain enough copper naturally to eliminate the need for adding the copper sulfate. Provisionally, this small system and reagent inventory is included although it may not be necessary.
Sulfuric acid may be needed during detoxification and discharge to lower pH sufficiently to meet discharge standards. The amount to be added can vary significantly depending on the pH of the solution to be treated. As the overall solution system pH is largely dictated by the amount of cement added for agglomeration as well as the natural acidity of the ore, it is not uncommon to have relatively high pH solutions in operations using cement for agglomeration. Even though the solutions treated are largely storm-water and dilute, unlike cyanide, pH is not reduced by ultraviolet radiation. The pH is mostly dictated by how diluted, or how “contaminated”, the storm water actually is. Strict solution management procedures can greatly influence the level of contamination of storm waters stored in the excess solution pond.
Typical dosage rates at similar operations are in the range of 0.65 kg sulfuric acid per cubic meter of solution treated. At this assumed dosage rate, the recommended inventory of 20 tote bins will treat 56,000 m3of solution.
| | |
| November 2012 | Shahuindo Project | 285 |
| |
|
MINE DEVELOPMENT ASSOCIATES |
Crusher liners require replacement periodically due to abrasive wear. Replacements of liners are expected approximately every two months and a spare set for all crushers should be kept in inventory onsite.
| | |
| November 2012 | Shahuindo Project | 286 |
| |
|
MINE DEVELOPMENT ASSOCIATES |
| 18.0 | PROJECT INFRASTRUCTURE |
| |
The infrastructure and services were developed to support the Shahuindo Project operations. These include the following major areas:
Access roads, including upgrades to existing roads and construction of newroads.
Power connection and supply from an existing cross-country power line to thesite main substation and from the main substation to site facilities.
Diesel-fired generators for back-up power supply to critical areas.
Process water supply and distribution, including a fire water system.
Potable water supply.
Sewage system.
Project buildings, including:
| o | Offices |
| | |
| o | Mine shop |
| | |
| o | Warehouse |
| | |
| o | Guard house |
| | |
| o | Process Warehouse / Maintenance Area |
| | |
| o | Reagent storage |
Diesel fuel storage and delivery systems
Explosives storage
Man camps for construction and operations
Miscellaneous site services such as
| o | Security |
| | |
| o | First Aid |
| | |
| o | Communications |
| | |
| o | Employee transport |
| | |
| o | Solid waste disposal |
| | |
| | |
| November 2012 | Shahuindo Project | 287 |
| |
|
MINE DEVELOPMENT ASSOCIATES |
| 18.2 | Access Roads and Port Access |
As described in Section 5.1, the principal access to the Shahuindo property is by a paved road from the city of Cajamarca. The site is approximately 115 km from Cajamarca, primarily on an asphalt-paved highway (100 km on Highway 3N) as well as gravel and dirt roads. The Shahuindo Project site is approximately 970 km by road north-north west of Lima. The port sites for project development support are the Port of Callao (Lima) and the Port of Paita in the north.
Approximately 15 km of dirt and gravel roads on the route from Cruce Pomabomba (between Cajamarca and Project site) require upgrades for access to the Shahuindo. These upgrades are necessary to accommodate construction and mine activities. Alternative routes have been explored and evaluated for the study.
The general location of the Shahuindo site is shown in Figures 18-1.
The site access road from Cajamarca and the Shahuindo access road upgrade from Cruce Pomabomba to the Shahuindo site are shown in Figures 5-1 and 5-2, respectively, in Section 5 of this report.
| | |
| November 2012 | Shahuindo Project | 288 |
| |
|
MINE DEVELOPMENT ASSOCIATES |
| |
| Figure 18-1 | Project Location and Access – Surrounding Region |
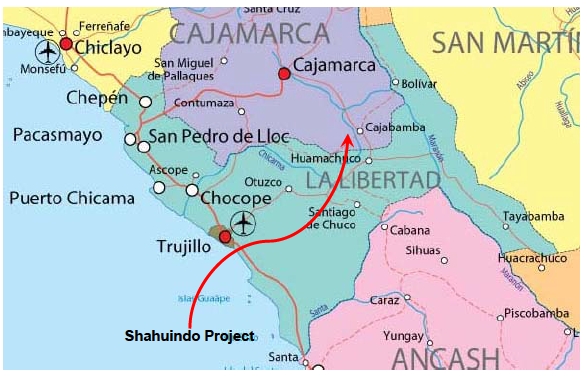
The Shahuindo Project will be supplied with power by connecting to the national commercial grid. Overhead power lines will connect 220 kV, three phase and 60 Hz power system, to a metering and switching substation. This main substation will be located at approximately 9152654N 806437E (about 4.9 km to the south southwest of the mine). Power from the main substation will be distributed on-site at 23 kV and further stepped down to 4,160 V, 460V, 220 V and 110 V accordingly. Large operating motors will use 4,160 V and smaller operating motors will use 460 V, electrical outlets will be 220 V and control systems have the option of using either 220 V or 120 V.
| 18.3.1 | Estimated Electric Power Consumption |
The estimated project electrical power consumption is presented in Table 18-1.
| | |
| November 2012 | Shahuindo Project | 289 |
| |
|
MINE DEVELOPMENT ASSOCIATES |
| |
| Table 18-1 | Shahuindo Heap Leach Power Demand |
| | | | | |
| Year 1 | Year 2 & 3 | Year 4 & On |
| Attached | Average | Attached | Average | Attached | Average |
| Power | Demand | Power | Demand | Power | Demand |
| (kW) | (kW) | (kW) | (kW) | (kW) | (kW) |
| 5,303 | 2924 | 5,681 | 3095 | 6,949 | 3641 |
In the event of a power failure or power interruption, diesel-fired backup generators will be used to supply emergency power for project safety and security. Backup electric power will be supplied to the following facilities:
Administrative offices and La Tauna Camp
First aid station
Communications facilities
Critical process equipment
An existing generator currently supplying power for the La Tauna Camp will be used to supply back-up emergency power for the office/camp facilities, the first aid station and communications equipment.
In order to maintain critical solution balances in the solution handling systems during power outages, a 1,056 kW generator is required for the Pond/ADR area for the critical pumps. This emergency generator will be located in the ADR area and is sized to run the critical process pumps for both Phase 1 and Phase 2. A fuel tank will be provided for the generator to maintain a 4 day fuel supply. The fuel storage system will also include a concrete containment area sized for 10% over the capacity of the tank(s).
The Shahuindo heap leach project will require a water supply for the following uses:
Mining operations for dust control, drilling, etc.
Crushing for dust control
Makeup water for the heap leach pad
Process plant and laboratory
Man camp and administration
| | |
| November 2012 | Shahuindo Project | 290 |
| |
|
MINE DEVELOPMENT ASSOCIATES |
Water demand will be highest during the dry season in the driest years: the peak is estimated to be 61 m3/h. The make-up water required by the heap leach system during the dry season, particularly during abnormally dry years, will be met from several potential sources:
Solution previously stored in the storm water excess solution pond
Well water and/or water from pit dewatering
Water from the water catchment ponds
As designed, the project will not require additional water from outside sources for operation of the heap leach and processing plant. To avoid continuing solution accumulation in the excess solution pond, enhanced evaporation systems are required for average and wet years. In the event of a 100-year wet precipitation year, the treatment and discharge of some of the solution will be required.
| 18.4.1 | Operations and Construction Water Balance |
A process water balance was prepared in consideration of varying operational and climatic conditions during the projected life of the project and is discussed in greater detail in Section 17 of this report. The process water balance considers the water consumed by the project and the water collected from precipitation events on the project components in addition to seasonal evaporation.
Solution from the heap leach pad will drain to the pregnant solution pond, where it will be pumped through the processing facility to recover precious metals and is then pumped back to the leach pad in a continuous cycle. The excess pond is located adjacent to the pregnant solution pond to allow containment of excess process solution during precipitation events which add additional water to the contained system.
In addition to the excess and pregnant solution ponds there are two water catchment ponds to collect water from precipitation. Process water requirements are first met by pumping collected waters from the excess pond; after that resource is exhausted, make-up requirements will be met by water either pumped from pit and dewatering wells, or from the raw water catchment collection system.
| | |
| November 2012 | Shahuindo Project | 291 |
| |
|
MINE DEVELOPMENT ASSOCIATES |
Construction of the raw water catchment ponds and mine will have some impact on surface flows and groundwater to the surrounding areas and small communities. Shahuindo is required to provide compensation flows from the water catchment system for domestic, irrigation and environmental uses. The affected communities are San Jose, Shahuindo, Chorobamba and Liclipampa.
Raw water for the Shahuindo Project will be collected and stored in the water catchment ponds. The project will need no off-site water for support of operations. The water that is collected and stored by the excess and water ponds will be sufficient for all operations that will take place. Table 18-2 presents a detailed breakdown of the solution and water reservoirs and their impoundment capacities.
| | |
| November 2012 | Shahuindo Project | 292 |
| |
|
MINE DEVELOPMENT ASSOCIATES |
| |
| Table 18-2 | Reservoirs and Impoundment Capacities |
| | | | |
| Designation | Construction
Phase | Purpose | Max. Storage
Capacity (m3) | Footprint
Area (m2) |
| Pregnant Pond | 1 | Pregnant Solution Storage | 31,875 | 6,690 |
Excess Pond
(Phase 1 Total) | 1 | Overflow Solution From
Pregnant Solution Pond | 356,500 | 41,040 |
Excess Pond
(Phase 2 Total) | 2 | Overflow Solution From
Pregnant Solution Pond | 546,100 | 58,150 |
Water Storage
Pond 1 | 1 | Water Collection And
Storage | 249,500 | 38,370 |
Water Storage
Pond 2 | 1 | Water Collection and
Storage | 111,800 | 25,418 |
Raw water for plant distribution and office use will be provided by a combination of well water and collected rain water. This water will be pumped to water tanks for raw water distribution, crushing dust suppression, building facilities (non-potable), and fire water.
The water storage ponds have been sized to insure that sufficient compensation water is available to provide outside downstream user domestic, irrigation and environmental flows needs. Table 18-3 presents the downstream user total compensation flows required by month.
| |
| Table 18-3 | Downstream User Compensation Flow Required by Stream (L/s) |
| | | | | | | | | | | | | | |
| Stream | Compensation
Point | Jan | Feb | Mar | Apr | May | Jun | Jul | Aug | Sep | Oct | Nov | Dec | Note |
Quebrada
Shahuindo | SHAP-06 | 0.5 | 0.5 | 0.5 | 0.5 | 0.5 | 14.7 | 23.1 | 22.6 | 2.0 | 1.2 | 2.0 | 0.5 | Domestic + Irrigation
+ Environmental |
Quebrada
Higueron | SHAP-04 | 0.3 | 0.3 | 0.3 | 0.3 | 0.3 | 1.5 | 1.9 | 1.6 | 0.5 | 0.3 | 0.3 | 0.3 | Domestic +
Environmental |
Quebrada
El Pacae | SHAP-03 | 0.7 | 0.7 | 0.7 | 0.7 | 0.7 | 0.7 | 2.5 | 3.1 | 0.7 | 0.7 | 0.7 | 0.7 | Domestic + Irrigation
+ Environmental |
| San Jose | SHAP-02 - NEW | 1.0 | 1.0 | 1.0 | 1.0 | 1.0 | 1.0 | 1.0 | 1.0 | 1.0 | 1.0 | 1.0 | 1.0 | Only Domestic |
| Total | | 2.6 | 2.6 | 2.6 | 2.6 | 2.6 | 17.9 | 28.5 | 28.3 | 4.2 | 3.3 | 4.1 | 2.6 | |
Depending on water quality analyses, pit dewatering water may be sent: 1) directly to the water storage ponds; or 2), through a water treatment plant before being sent to the water storage ponds; or 3) to the excess pond as makeup water. If treatment is necessary, a chemical coagulation/filtration process is to be used as the water treatment method for any mine pit dewatering water that fails to meet water quality standards for discharge into the water storage impoundments. The treatment plant processing rate is estimated at a maximum of approximately 120 m3/h based on pit dewatering flow
| | |
| November 2012 | Shahuindo Project | 293 |
| |
|
MINE DEVELOPMENT ASSOCIATES |
estimates from Ausenco. Additional details on the water treatment process can be found in Section 17.9.
There are currently no plans to have a potable water treatment system for the Shahuindo Project. Potable water for drinking and cooking will be provided in bottles.
Two separate fire water pumping systems will be installed to deliver water to 1) the mine shop/crushing/main warehouse area, and 2) to the process area. The main water storage tank near the main warehouse will include an exclusive fire water reserve of 400 m3(one half of the tank volume). The process area water storage tank will include an exclusive fire water reserve of 200 m3(one half of the tank volume). Each system will have two fire water pumps, one electric and one diesel, to assure operation in the event of an electrical outage, and a small electric booster pump to maintain a constant water pressure on the system.
The Shahuindo Project buildings include administration, laboratory, process, mine shop, mine warehouse and workshop, powder magazine, construction and permanent camp, dining facilities, fuel storage, security, and first aid. Process buildings consist of maintenance shop and warehouse (mill shop), office, locker rooms, ADR facility, refinery and reagent storage.
| 18.5.1 | Administration Building |
An administration building/office is already inplace at the La Tauna camp that includes water and power supply along with sewage facilities. The cost for the administration facility is not included in this report.
A full-service assay and metallurgical laboratory will be installed on site to run all sample analyses required for mining and process operations. The laboratory will include sample preparation, fire assay, bullion analyses, AA spectroscopy, particle size distribution analyses, metallurgical testing (bottle roll and column leach testing), and personnel offices. The single-level laboratory building has a foot print of 448 m2. The building is
| | |
| November 2012 | Shahuindo Project | 294 |
| |
|
MINE DEVELOPMENT ASSOCIATES |
also equipped with a dust collection system (baghouse) for the sample preparation area and a ventilation system with a wet scrubber for the wet lab area. Laboratory metallurgical chemical wastes will be stored temporarily on site and transported to the heap leach for disposal in the process systems.
Process buildings are expected to be a combination of prefabricated modular buildings and local concrete masonry unit construction. There are a number of small buildings located near and within the process areas:
| o | The process maintenance and warehouse area includes a fenced warehouse storage area, a covered maintenance work shop area, and two offices and toilet facilities. The offices are located along the side of the maintenance and warehouse area. Overall area of the office portion of the building is 46 m2. |
| o | Includes offices, conference room, waiting room, and men/women’s toilet facilities. Two individual offices are located within the building, and one additional large office with space for five separate desks. The overall area of the building is 129 m2and is about 4.5 m in height with a gable style roof. |
| o | Includes men’s and women’s lockers and toilet facilities. The men’s lockers can accommodate 70 full-height lockers or 140 half-height lockers, while the women’s side can accommodate 28 full-height or 56 half-height lockers. Overall area of the building is 118 m2with 4.5 m of height and a gable style roof. |
| o | Incorporates the adsorption, thermal reactivation, elution, pregnant eluate solution, and acid washing circuits in a total area of 1243 m2. About 100 m2are covered with a roof to protect specialty equipment (carbon regeneration kiln and solution boiler); the remaining ADR area is uncovered without a roof. |
| | |
| o | Includes the electrowinning and smelting equipment. For security reasons, this building includes brick walls and a chain-link fenced area on |
| | |
| | |
| November 2012 | Shahuindo Project | 295 |
| |
|
MINE DEVELOPMENT ASSOCIATES |
the exterior. Located within the refinery are a security office, break room, and a shower/changing room. A 3 m roll up door is also included between the refinery building and fenced area. The overall area of the refinery is 339 m2and the fenced area is about 86 m2, the total height is about 7.5 m with a shed style roof.
| o | Includes storage for cyanide, carbon, antiscalant, caustic soda, and acid. The facility is about 301 m2and covered with a shed-style roof. |
Most of the process operations will be outdoors and a boom truck and 40 ton crane are to be used for maintenance activities; no overhead cranes are planned. Operator work stations will be positioned to allow unobstructed views of key operating equipment and ore feed positions.
The mine shop is designed with a semi-open arrangement to include repair bays for heavy and light trucks, wash and welding areas. This building has five primary work bays and an additional covered welding bay on one side and a wash bay on the other side. The overall footprint area of the mine shop is 1,353 m2and the overall height is about 15 m with a curved truss roof. Each covered end bay is about 228 m2with a usable height of 6.68 m. The shop will have concrete floors and metal siding on the back-side. Mobile cranes will be used as required for maintenance lifting, no overhead crane is included.
| 18.5.5 | Mine Warehouse and Workshop |
The mine warehouse and workshop building is a completely enclosed steel building with a workshop area (240 m2), a warehouse area (248 m2), four offices, a meeting room, a bathroom facility, and a tool room. The total area of the warehouse is 698 m2plus a small fenced storage area (48 m2). The workshop and warehouse areas each have a roll-up door and concrete ramp for forklift or other equipment access.
The powder magazine includes 1-ANFO and 1-Emulsion storage bins/silos. Each has a 40 to 45 tonne capacity and is equipped with a pneumatic storage handling to off load delivery trucks to the site. The silos are configured to have drive-through loading for on-site ANFO trucks that will be used to deliver the product to the hole when loading patterns. Blending and mixing are accomplished inside of the delivery truck prior to
| | |
| November 2012 | Shahuindo Project | 296 |
| |
|
MINE DEVELOPMENT ASSOCIATES |
loading the holes. ANFO and Emulsion are considered to be blasting agents as opposed to high explosives and, as such, minimal protection for storage is required. However, the silos will be kept in the explosives storage facilities away from active mining and processing areas.
Two additional storage magazines are included: One powder magazine for storage of boosters, detonation-cord, and accessories used to initiate the blasting; and one cap magazine to be used to store blasting caps. Each of these magazines will be located in the explosives storage area near the ANFO/Emulsion silos west of the open pit and northwest of the Tauna camp.
Site work at the explosives storage area will include foundation work for the silos, development of access roads to the facilities, berms around the powder and cap magazines, and fencing around the entire facility. The berms will be partially built by digging into the back behind the magazine, and then by building up earthen material around the sides and front. The berms will be at least the height of the magazines and the height of any trucks delivering or retrieving explosives for use in the mine.
| 18.5.7 | Construction / Permanent Operations Camp |
The Shahuindo Project currently has a camp on site with units ranging from single room to multi-room layouts. The existing camp can currently house 106 persons. The existing camp is to be expanded for use as both the construction and permanent camp for the Project. The camp expansion includes 10 modular tent-style housing units each able to accommodate 32 workers, as well as one module with 64 beds each for staff workers. The total camp capacity is expected to be about 490 persons. Modular bathroom/shower units equipped with toilets, urinals, showers are planned for each tent, and bathrooms and showers are present in the staff modules and existing camp units. A sewage treatment system will be present for the area for waste generated.
The majority of the local work force will be bussed from Cajabamba, and surrounding villages and usage of the existing facilities will be adequate.
Dining facilities are currently present on-site. During construction, additional capacity can be obtained by using a tent-style kitchen/cafeteria module. Following the main construction period, a portion of the dining area can be converted to training and meeting rooms and a recreation area.
| | |
| November 2012 | Shahuindo Project | 297 |
| |
|
MINE DEVELOPMENT ASSOCIATES |
| 18.6 | Diesel Fuel Delivery and Storage |
Diesel fuel will be delivered to the mine site via vendor tanker trucks. The main diesel storage facility for heavy equipment and light vehicle fueling will be a vendor supplied storage tank (approximately 300,000 liters of total capacity) complete with fuel dispensing systems. The total area of the main fuel storage facility is about 106 m2.
Two additional 20,000 liter diesel storage tanks are located in the process plant area: one to supply diesel fuel for the elution boiler, carbon regeneration kiln and the refining furnace; and the second tank dedicated to the emergency generator set.
All storage tanks will be placed in a 110% concrete containment to assure no fuel is leaked to the environment.
Access to the facility will be limited by fences in the process and camp areas. The fencing is already in place and includes security check points at the entry; a guardhouse is also in place and will need to be manned 24 hours per day.
A first aid office and ambulance are already present on-site, but will be relocated to the existing administrative office complex at the Tauna camp site. Emergency medical staff will be available on site and the ambulance will be available for emergency transport of workers to the nearby town of Cajabamba.
The infrastructure for radios and telephone communications as well as satellite-internet systems are already in place and active to provide on-site and off-site communications. A recent upgrade was made to the system so no additional capital costs will be included in the feasibility study.
Transportation will be provided for the workers from to the mine via local contractor bus service as required on scheduled shift changes.
| | |
| November 2012 | Shahuindo Project | 298 |
| |
|
MINE DEVELOPMENT ASSOCIATES |
A sewage treatment system will be installed to treat black and gray water waste generated at the Tauna camp area. The system will be a compact domestic treatment plant capable of treating 60 m3/day of waste.
Sewage generated in the mine and process areas will be collected and directed to septic tanks with a biological filter to process both black and grey water. The septic units will be located down slope from the affected area and designed so as not to contaminate groundwater, springs, or existing water courses.
Solid wastes will be disposed of in a manner complying with local regulations. Waste classified as residential or commercial waste products will be disposed of in a solid waste landfill off-site. Products not allowed to be disposed of in the landfill will be transported to the appropriate facilities.
Sulliden is planning to manage other waste management facilities at the Shahuindo Project. The facilities will include: one waste transfer facility (WTS); and one hazardous material storage-hazardous waste transfer station (HMS-HWTS).
A waste transfer storage facility (WTS) will only be used for temporary storage of wastes prior to transport offsite for final disposal by a certified EPS-RS transport and disposal company. A hazardous material storage-hazardous waste transfer station (HMS-HWTS) facility will perform two functions: 1) temporary storage of hazardous waste and 2) storage of hazardous materials (i.e., materials to be used, reused or recycled but not for disposal).
| | |
| November 2012 | Shahuindo Project | 299 |
| |
|
MINE DEVELOPMENT ASSOCIATES |
| 18.11.2.1 | Solid Waste to Off-Site Landfill |
The estimated generation rates for the mine site are based on typical rates for residential and commercial activities. A typical person generates approximately 0.85 kilograms per day of residential waste and 0.45 kilograms per day of commercial waste. During construction and operation, a maximum of approximately 132 tonnes of waste per year will be deposited into the landfill.
| 18.11.2.2 | Hazardous Waste |
Hazardous wastes will be stored temporarily on-site in two location; a waste transfer facility (WTS) and a hazardous material storage-hazardous waste transfer station (HMS-HWTS).
All hazardous wastes will be transported offsite by a certified EPS-RS company for final disposal according to Peruvian regulations.
A waste transfer stations (WTS) will be constructed at the mine site at a location to be determined but within otherwise developed areas.
The types of waste stored at the transfer stations will be primarily hydrocarbon derivatives (used lubricants, contaminated soils, etc.).
The project will include one hazardous waste storage (HWS) and hazardous material storage (HMS) area. The facility will perform two functions: temporary storage of hazardous waste and temporary storage of hazardous material. Waste and hazardous materials will be stored in drums or similar sealed containers and all containers (waste or materials) will be properly marked as such along with the material type contained in the drum and its destination.
Hazardous wastes will be stored at the facility until they are transported to an approved off-site hazardous waste landfill, incinerator, recycling, reuse or treatment center. This facility will be located near the ADR.
| | |
| November 2012 | Shahuindo Project | 300 |
| |
|
MINE DEVELOPMENT ASSOCIATES |
Hazardous materials (i.e., not wastes, but products to be used or recycled on-site) will also be stored at these facilities. The HMS provides an area to store oils, solvents, cleaning fluids, and so forth.
Spills of such hazardous materials on site will be given the highest operating priority and will generally involve the excavation of contaminated soils, neutralization of the affected site, and disposal and/or neutralization of the affected soils on site. The mining equipment on site will be immediately available for use in such circumstances.
| | |
| November 2012 | Shahuindo Project | 301 |
| |
|
MINE DEVELOPMENT ASSOCIATES |
| 19.0 | MARKET STUDIES AND CONTRACTS |
Gold and silver production can be competitively sold to numerous reputable smelters and refiners throughout the world on a regular and predictable basis. Demand for gold and silver is presently high, with September 2012 gold and silver spot prices ranging from approximately $1,686 to $1,785 per ounce and $31.70 to 34.70 per ounce, respectively. The large number of available markets for doré allows gold and silver to be readily sold on the spot market. Sulliden expects that any sales contract would be consistent with standard industry practices. There are currently no contracts in place for metal sales.
The gold and silver prices used in the economic analyses are $1,415 and $27, respectively. These are the approximate three-year trailing averages as of the end of August 2012.
| | |
| November 2012 | Shahuindo Project | 302 |
| |
|
MINE DEVELOPMENT ASSOCIATES |
| |
20.0 | ENVIRONMENTAL STUDIES, PERMITTING AND SOCIAL OR COMMUNITY IMPACT |
The environmental and social portions of the Shahuindo Project are summarized in this chapter. Environmental studies, laws and regulations, permitting, preliminary closure plan, and social impacts are discussed.
| |
| 20.1 | Environmental Studies and Regulations |
The General Mining Law of Peru is the primary body of law with regard to environmental regulation of exploration and mining activities. The General Mining Law is administered by the Ministry of Energy and Mines. A detailed description of Peru’s environmental regulations is found on the Ministry of Energy and Mines website.
Generally, the Ministry of Energy and Mines requires exploration and mining companies to prepare an Environmental Impact Statement (DIA) – Category I, Environmental Impact Study Semi Detailed (EIAsd) – Category II, an Environmental Impact Assessment, a Program for Environmental Management and Adjustment, and a mine closure plan. The category II EIAsd has been completed while the other documents are currently in progress. Mining companies are also subject to annual environmental audits of operations by the Organismo de Evaluación y Fiscalización Ambiental (OEFA).
According to Peruvian regulations (D.S. 020-2008-EM y la R.M. 167-2008-MEM-DM) a DIA–Category I cover drilling of less than 20 drill platforms within a 10 hectare area. An EIAsd–Category II is applicable to mining and exploration programs with either more than 20 drill platforms, exploration areas greater than 10 hectares, or construction of more than 50 meters of tunnels. Both classifications require development of public community involvement processes, which are administered under regulations D.S. 028-2008-EM and R.M. 304-2008-MEM-DM. Sulliden has applied for and received the proper permits for all exploration activities.
A mining company that has completed its exploration stage work program must submit an Environmental Impact Assessment (EIA) or a modified Environmental Impact Assessment either when applying for a new mining or processing concession, increasing the size of existing processing operations by more than 50 percent; or executing any other changes to an existing mining project that results in a greater than 50 percent change in the mining rate or expected profit (DS 016-93-EM. Cap III, Art 20).
| | |
| November 2012 | Shahuindo Project | 303 |
| |
|
MINE DEVELOPMENT ASSOCIATES |
A new Environmental Impact Assessment must be developed when additional, previously un-mined areas are proposed to be added to an operation (DS 016-93-EM, D.S. 028-2008-EM and R.M. 304-2008-MEM-DM, review articles 15 and 16), and must include preparation of an executive summary and scheduling of workshops and public community participation.
The Environmental Impact Assessment must incorporate planned expenditure on environmental programs at a rate that is no less than one percent of the value of annual production of the planned operation. The Ministry of Energy and Mines must review and make a decision on the project within 120 days, including initial notification, and the initial stage of the public consultation process. The process of actual project approval may take 8–12 months. Within this period the applicant company must organize hearings and workshops to present project data and coordinate the dates and locations of such hearings with the Ministry of Energy and Mines.
In the proposed project, if there is less than a 50 percent change in the mining rate or expected profit, the changes to the existing Environmental Impact Assessment may be accepted, subject to informational workshops and public hearings being held. The Ministry of Energy and Mines must review and make a decision on the existing project’s Environmental Impact Assessment within 30 days, including initial notification, and the initial stage of the public consultation process. The approvals process may take 6–8 months.
A mining company must also prepare and submit a closure plan (Plan de Cierre de Minas) for each component of its operation. The closure plan must outline what measures will be taken to protect the environment over the short-, medium- and long-term from solids, liquids and gases generated by the mining operation.
The General Mining Law of Peru has in place a system of sanctions or financial penalties that can be levied against a mining company which is not in compliance with the environmental regulations.
| | |
| November 2012 | Shahuindo Project | 304 |
| |
|
MINE DEVELOPMENT ASSOCIATES |
Besides the relevant local and national exploration permits, additional permits will be required for Project development. Key permits identified that could impact either development or construction timetables include:
Certificate for the Inexistence of Archaeological Remains (CIRA)
During 2003 and 2007, archaeological surveys were conducted in the Project area to support granting of the appropriate environmental permits for exploration programs. The surveys indicated the presence of sites of potential archaeological significance. As part of Project development, Sulliden is undertaking an Archaeological Evaluation (PEA in the Spanish acronym). The Archaeological Evaluation results would determine whether a “Certificate for the Inexistence of Archaeological Remains” can be granted. Having “Certificate for the Inexistence of Archaeological Remains” clearance is currently an informal pre-requisite for Ministry of Energy and Mining to evaluate environmental assessment studies.
Environmental Impact Assessment (EIA)
The EIA is discussed in Section 20.1.
Mine Closure Plan
The mine closure plan must be presented before the General Directorate of Mining Environmental Affairs (DGAAM) within the year following the approval of the Environmental Impact Assessment, and, as stated above, it must be approved before starting operations for the project.
Establishment of a financial guarantee for closure
A company is required to pay the first annual installment of the execution guarantee of the Mining Closure Plan, which will be defined with the approval of the Environmental Impact Assessment, in the period after Environmental Impact Assessment approval and up to the first twelve working days of the year following approval.
_______________________
| | |
| November 2012 | Shahuindo Project | 305 |
| |
|
MINE DEVELOPMENT ASSOCIATES |
Beneficiation Concession
Such a permit is required prior to commencement of extraction, metallurgical processing or refining activities, and is dependent on an approved Environmental Impact Assessment.
Mining Transportation Concession
This permit is required for construction of items such as overland conveyors or pipelines. It is also dependent on the applicant having an approved Environmental Impact Assessment.
Permanent Power Concession
Following the approval from COES (Comité de Operación Económica del Sistema Interconectado Nacional), the completion of the required environmental and social studies and construction approval, the power concession will be granted to operate the line and substation.
Water Usage Permits
These will be required, principally for potable water consumption.
Easements and Rights-of-way
Easements to accommodate subsidiary power lines to the Project will be required. Sulliden may also have to apply for approval to have Project roads cross local, regional or national roads; the final location of many of the internal Project roads has yet to be determined.
District and Provincial Municipality Licenses
The number and type of provincial and municipality permits to support Project development and construction would be identified and reviewed during any feasibility-level studies conducted on the Project.
_______________________
| | |
| November 2012 | Shahuindo Project | 306 |
| |
|
MINE DEVELOPMENT ASSOCIATES |
Construction and Operation Permits
These include required permits for mine operations, civil defense, fuel storage, reagent storage and use, powder magazines, explosives handling and use, and waste disposal.
| |
| 20.1.2 | Existing Environmental Conditions |
There are surface disturbances associated with informal mining activity within the project area, primarily in the Algamarca anticline and La Chilca hill areas. The majority of the informal miners come from Huamachuco, Trujillo, and Cajamarca. They live in shanty-style accommodation on the workings. There is an expectation that environmental contamination will be associated with these sites.
The presence of informal miners in some numbers may also create a safety issue for both the miners and Shahuindo personnel.
With a perceived exhaustion of easily-mineable mineralization in the Algamarca anticline area, there may be a risk of the informal miners moving to exploit other areas of Sulliden’s concessions. An inventory of the existing environmental conditions was submitted as part of the EIAsd for the Category II exploration permit.
| |
| 20.2.1 | Location of the Study Area |
The Shahuindo Project is characterized by varied topography with several areas being heavily dissected by rivers and streams. Altitudes range from 2,500 m to 3,350 m above sea level. The Shahuindo Project is located in the department of Cajamarca, in the province of Cajabamba and the district of Cachachi, (Figure 20-1.).
| |
| 20.2.2 | Social Baseline Study |
A critical component of the Sulliden Gold Corporations’ Environmental Social Impact Assessment (ESIA) is the completion of the Social Baseline Study, which describes the people and locations within the area of influence of the Project, which may experience either positive and or negative effects from the future development of the mine. The Area of Influence has been further divided into the Direct and Indirect Areas of Influence. The Direct Area of Influence is defined as those people and or places, which may directly experience either positive or negative social effects from the project in varying degrees.
| | |
| November 2012 | Shahuindo Project | 307 |
| |
|
MINE DEVELOPMENT ASSOCIATES |
Fourteen villages have been identified within the Direct Area of Influence and include: Algamarca, La Fila, Liclipampa Alto, Pauquilla, Rosahuayta, San Jose, Araqueda, Quillishpampa, Moyan Alto, Moyan Bajo, Pampachancas, Shahuindo, Liclipampa Bajo and Siguis. Within the direct area of influence the four communities of San Jose, Shahuindo, Moyan Alto and Moyan Bajo will experience some levels of resettlement. A detailed Resettlement Action Plan, structured in accordance with the IFC Performance Standard 5 for Land Acquisition and Involuntary Resettlement has been prepared to mitigate the effects from resettlement and land acquisition.
The Indirect Area of Influence is composed of people and or places that may experience positive social impacts and reduced negative social impacts than those located in the direct area of influence. Communities within the indirect area of influence include those living in the Districts of Cachachi and Condebamba.
| | |
| November 2012 | Shahuindo Project | 308 |
| |
|
MINE DEVELOPMENT ASSOCIATES |
| |
| Figure 20-1 | Location of Direct Influence Area |
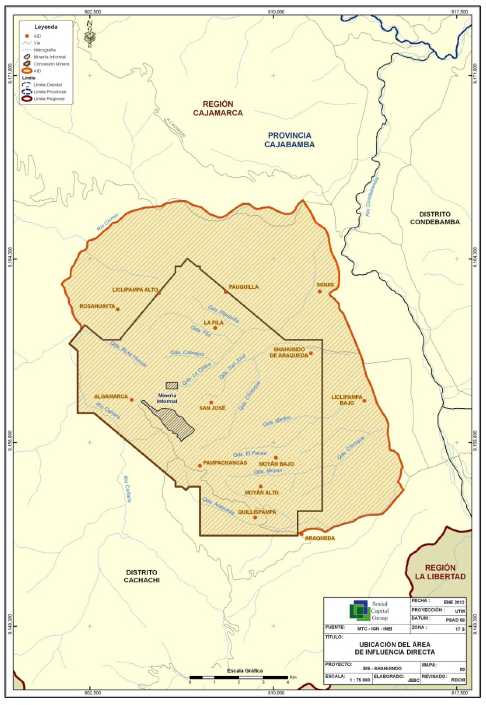
| | |
| November 2012 | Shahuindo Project | 309 |
| |
|
MINE DEVELOPMENT ASSOCIATES |
| |
| 20.2.3 | Public Consultation and Engagement Plan |
Sulliden is committed to proactive and transparent engagement with the communities, public institutions and government agencies located within the project’s area of influence. The company’s public consultation and engagement plan is built around the following commitments:
To comply with Peruvian legislation regarding consultation and engagement
To implement a consultation and communication plan in an open, honest andtransparent manner with neighboring populations and interest groups, and createan atmosphere of mutual trust.
Guide our actions based on comprehensive understanding of the social,economic and cultural context in which the project is developed.
Contribute to strengthening local social organizations through participation in thedevelopment of the project and in the activities that may affect them
Engage the local communities throughout the baseline study stage of the ESIAthrough a participatory monitoring program and the extension of this programthroughout the construction, operation and closure stages.
To ensure that the company communicates effectively Sulliden has established the following methods of communication and access to information:
Two public information offices, one at the project site and one in the town ofCajabamba
The development of project information booklets and fact sheets
Use of the local radio to provide information about progress of the project
Guided visits to the project site and
Information workshops
Throughout the development of the ESIA, Sulliden has held unofficial and official community workshops. Once the ESIA is delivered to the authorities, the company will hold its public audience and throughout the review stage, information workshops and meetings with the communities and interest groups will be held to respond to their questions and observations.
| |
| 20.2.4 | Community Development Program |
The company recognizes its role to contribute to local sustainable development by utilizing its ability to mobilize technical and financial resources, to support the
| | |
| November 2012 | Shahuindo Project | 310 |
| |
|
MINE DEVELOPMENT ASSOCIATES |
implementation of local initiatives for local development during the construction and operational stages.
The objectives of the community development program are the following:
Strengthen local productive capacities to generate opportunities for alternativeemployment for the population in the direct area of influence
Strengthen technical capacities of the stakeholders in the area of influence
Provide capacity building initiatives to local organizations and leaders to bettermanage local development initiatives in a transparent and participatory manner.
Create and consolidate channels of coordination and dialogue between the localarea communities and the project.
The company will focus its sustainable development initiatives in the following areas:
Local Employment and Purchase of Local Goods and Services.Training for local people within the direct area of influence in multifaceted disciplines and the purchase of goods and services from local providers.
Economic Production. Improvement to local productive capacities and infrastructure (agriculture, livestock and fish farming) and the sustainable management of forest resources.
Small Business Development and Entrepreneurship. Promotion of entrepreneurship and small business programs.
Local Social Development. Working with national, regional and local levels of government to implement projects aimed at improving the education and health.
Strengthening Local Institutions. Strengthening the capacity of local stakeholders, such as local governments, grassroots organizations, among others.
| |
| 20.3 | Reclamation and Closure |
The Shahuindo Project has been designed to meet and comply with the environmental standards and legislated closure requirements of Peru.
| | |
| November 2012 | Shahuindo Project | 311 |
| |
|
MINE DEVELOPMENT ASSOCIATES |
In accordance with Peruvian requirements, company standards, and accepted industry practices, the development, operation, and conceptual reclamation plans have been proposed to accomplish:
Protection of public health and safety.
Minimization or elimination of environmental damage.
Return of the land to a state fit for its original use or an acceptable alternativeuse.
The conceptual closure and reclamation plan proposes that the following actions be taken:
The open pits will remain as permanent features, berms will be installed and roads closed to prevent public access. Any potential acid generating materials on the pit floor will be covered with non-acid generating waste. It is expected that the pit will eventually fill with water and form a pit lake.
The heap leach will be rinsed to remove trace cyanide to adequate discharge levels. The heap will undergo minor re-contouring, a low-permeability soil capping will be placed over the facility and it will be re-vegetated.
The solution ponds will be closed with the procedures established in the approved closure plan. These procedures will include conversion of the ponds into wet lands, then covering with a low-permeability soil capping, and re-vegetating.
The water storage ponds can be left intact for future use by locals or reclaimed depending on community requirements. Side slopes and other affected areas will be re-vegetated according to the approved closure plan.
Exposed leach pad berms will be re-graded and exposed liner will be either removed or buried.
The processing plant and support facilities will be removed and the land re-vegetated.
| | |
| November 2012 | Shahuindo Project | 312 |
| |
|
MINE DEVELOPMENT ASSOCIATES |
Concrete pads and foundations will be chemically neutralized where necessary, then broken up and buried in place or removed and buried in the waste or heap leach facility.
Operating surfaces will be reclaimed and re-vegetated.
The waste rock facility will be constructed in lifts at a natural angle of repose. With setbacks between lifts, the overall waste dump slopes will be approximately 2.5(H):1.0(V) and will remain at this gradient at closure. A capping consisting of low-permeability soil will placed over the facility and then re-vegetated.
Road accesses to hazardous areas (open pits, waste dump and leach pad) will be closed, or restricted to allow essential monitoring and maintenance work to be carried out. Where practical, roads will be turned over to local communities for future use.
Programmed physical and geochemical monitoring will take place during the active closure and post-closure periods.
Maintenance of the installations will be carried out as necessary, based on the results of the monitoring programs.
| |
| 20.3.1 | Reclamation of Open Pits |
At the end of the operation, the slopes and benches will undergo minor re-contouring. The approved closure plan will determine the required measures to control the pit lake water quality. Acid-generating material on the pit floor will be covered with non-acid generating waste. Rain water runoff will be controlled so as to reduce erosion, sediment transport and limit contact with acid-generating lithologies. Re-vegetation of the pits is not considered necessary. Roads into the pits will be closed after active closure activities within them have been completed. Other access points to the facilities will be closed off and warning signs will be placed at appropriate sites around the facilities.
| |
| 20.3.2 | Reclamation of Waste Rock Facility |
At closure, the following reclamation activities will take place to ensure physical stability of the waste rock facility:
Minor re-grading of the slopes will be undertaken to obtain an overall grade of2.5(H):1(V) and to make the contours more natural in nature thereby making thefacility more compatible with its future terrain use.
A cap, consisting of low-permeability soil to a total thickness of approximately 30cm, will be placed over the facility. This will serve to reduce infiltration ofrainwater into the underlying waste rock.
| | |
| November 2012 | Shahuindo Project | 313 |
| |
|
MINE DEVELOPMENT ASSOCIATES |
A cap of organic soil, with a thickness of 10 to 30 cm, will be placed over thefacility and re-vegetated with a mixture of locally-occurring seeds, grasses andplants. This will serve to bind the soils and reduce the erosive effect of anyrunoff waters.
The diversion berm and surface runoff system will be upgraded at closure tominimize post-closure maintenance requirements.
Drainage and surface runoff infrastructure will be installed in order to control theerosion and physical integrity of the cover and the underlying waste material.
Where erosion problems have manifested themselves during operations,additional armouring will be provided. Where sedimentation and other blockageissues have occurred, the sections will be steepened or otherwise modified.These measures will serve to improve performance in the post-closure passivemaintenance environment.
A monitoring and maintenance program will be implemented that takes accountof erosion, blockages and degradation of the physical integrity of the facility.
At closure, the following reclamation activities will take place to ensure geochemical stability of the waste rock facility:
The effluent collection system at the base of the waste dump will be maintainedin closure for sediment control and to provide a place to periodically sampleeffluent. Flows will continue to be directed to the collection pond located at thetoe of the waste rock dump.
If needed, this pond can be converted to a buffering pond and/or a wetlandssystem if water quality of the effluent will not be compatible with the receivingwaters. Post-closure monitoring will be required to determine this.
Acid generation will be minimized by reducing the amount of water in contact withthe waste rock material. Potential acid generating waste will be covered withnon-acid generating material during operations. Concurrent reclamation of thewaste dump will be conducted during operations by re-contouring and cappingwith a low-permeability soil cap of approximately 30 cm. The facility will then bere-vegetated on an on-going basis. The combination will reduce rainfallinfiltration by limiting the amount of water entering the facility and by increasingthe evapotranspiration of the vegetation.
The quality and quantity of runoff from (and infiltration through) the wastedisposal facility will be monitored throughout the life of the project and for several
| | |
| November 2012 | Shahuindo Project | 314 |
| |
|
MINE DEVELOPMENT ASSOCIATES |
years post-closure to ensure that any discharge meets water quality standards according to the project requirements.
| |
| 20.3.3 | Reclamation of Water Storage Ponds |
The water storage ponds can remain for future use by surrounding communities or can be reclaimed. If the reclamation of the water storage ponds is the required option, then the following activities would be performed:
The dams will be breached and re-graded to re-establish flow of surface watersto downstream areas.
A cap of organic soil, with a thickness of 10 to 30 cm, will be placed over thefacility and re-vegetated with a mixture of locally-occurring seeds, grasses andplants.
The diversion and surface runoff systems will be upgraded at closure to minimizepost-closure maintenance requirements.
A monitoring and maintenance program will be implemented that takes intoaccount erosion, blockages and degradation of the physical integrity of the area.
| |
| 20.3.4 | Reclamation of Heap Leach Facility |
Once the economic recovery of gold from the heap leach is complete, the facility will enter closure. The first activity involves rinsing the heap in sections to remove and neutralize any remaining cyanide. As the rinsing of sections is completed, the other closure activities begin to take place.
The following reclamation activities will take place at closure to ensure physical stability of the heap:
Minor re-contouring to ensure overall slope gradients of 2.5(H):1(V) which willminimize any slope failure concerns.
A cap consisting of low-permeability soil to a total thickness of approximately 30cm will be placed over the facility. This will serve to reduce infiltration ofrainwater into the underlying heap material and improve control over the flow ofwater.
A cap of organic soil, with a thickness of 10 to 30 cm, will be placed over thefacility and re-vegetated with a mixture of locally-occurring seeds, grasses andplants.
| | |
| November 2012 | Shahuindo Project | 315 |
| |
|
MINE DEVELOPMENT ASSOCIATES |
Drainage and surface runoff infrastructure will be installed in order to control theerosion and physical integrity of the cover and the underlying heap material.
Where erosion problems have manifested themselves during operations,additional armouring will be provided. Where sedimentation and other blockageissues have occurred, the sections will be steepened or otherwise modified.These measures will serve to improve performance in the post-closure passivemaintenance environment.
A monitoring and maintenance program will be implemented that takes accountof erosion, blockages and degradation of the physical integrity of the facility.
The following reclamation activities will take place at closure to ensure geochemical stability of the heap:
The diversion berm and surface runoff system will be upgraded at closure tominimize post-closure maintenance requirements and limit the unnecessarytreatment of good-quality water in the wetlands or buffering system.
A low-permeability soil cap of approximately 30 cm will be placed over the facility.This will help to limit the infiltration of rainwater and air into the underlying heapmaterial.
A cap of organic soil, with a thickness of 10 to 30 cm, will be placed over thefacility and re-vegetated with a mixture of locally-occurring seeds, grasses andplants. This will serve to bind the soils, reduce the erosive effect of any runoffwaters and reduce rainfall infiltration into the heap by increasing the effect ofevapotranspiration.
The quality and quantity of runoff from and infiltration through the heap will bemonitored during active closure and for a number of years post-closure to ensurethat any discharge meets water quality discharge requirements.
Following completion of the gold recovery, a rinse solution will be circulated through the ore until the residual cyanide is reduced to levels that comply with Peruvian regulations and established in the approved closure plan. The rinse will include a combination of neutralized solution and fresh water. The lined solution ponds will be used during the process for circulating the rinse solution.
Once rinse is complete the heap pad and solution ponds will be modified to mimic natural drainage terrain and established into a wetland. All discharge will be directed
| | |
| November 2012 | Shahuindo Project | 316 |
| |
|
MINE DEVELOPMENT ASSOCIATES |
through the wetlands prior to release to the environment. The wetlands constitute a passive system to treat effluents and eliminate trace metals generated over time from the heap material. Water quality monitoring will be performed at the discharge point on a periodic basis to ensure that the discharge meets Peruvian standards.
| |
| 20.3.6 | Passive Treatment of Heap Leach Effluent |
Once the initial rinse has been completed, the process solution ponds will be converted to wetlands, then covered with a low permeability soil cap, and re-vegetated or closed with the procedures established in the approved closure plan. The ponds will be covered by organic soils, creating a natural wetland. The system will be capped with a geomembrane to control infiltration and reduce evaporation during dry years. The detailed design of this system will be developed during the preparation of the final closure document.
All effluent from the pads will be directed through the wetlands prior to discharge to the environment. The discharge from this passive system will be monitored through closure and post-closure and receive active treatment if the water quality does not meet regulatory discharge water quality standards. The efficiency of the passive wetland system will be improved during the first seasons of operation as real data becomes available.
| |
| 20.3.7 | Reclamation of Ancillary Facilities |
All project operating and maintenance facilities will be dismantled and removed from the property. All foundations will be chemically neutralized as needed, then broken up and buried in place or removed and buried in the waste rock or heap leach facilities. The building sites will then be graded, scarified, and re-vegetated with grass and other indigenous species. Topsoil will be applied in areas where it is necessary to ensure successful re-vegetation. Surface runoff will be appropriately controlled and redirected where necessary, in order to minimize erosion and sediment transport, especially during the early period before the vegetation has had a chance to bind the soils.
Much of the process equipment will retain a value as used equipment and will be sold for use at other operations or projects. Any remaining equipment and materials will be given to recyclers in exchange for removing it from the site.
Industrial waste items that cannot be disposed of by recyclers will be buried in the waste dump or in the pad. Any hazardous waste will be removed from site by approved contractors to an approved waste facility.
| | |
| November 2012 | Shahuindo Project | 317 |
| |
|
MINE DEVELOPMENT ASSOCIATES |
| |
| 20.3.8 | Reclamation of Roads |
The road network will continue to be used through the mine closure and post-mine closure programs. Access to potentially hazardous areas, such as the open pits, waste dump and heap leach facilities will be restricted to authorized personnel during closure while earthmoving activities are taking place and will be permanently closed thereafter. Most roads will be handed over to local authorities or communities after a final one-off maintenance and repair program that will include items such as road cutting stability and final water control structures. Any reclamation of project roads, such as might occur with the haul roads, will be by grading to improve site drainage, scarifying and re-vegetation.
| | |
| November 2012 | Shahuindo Project | 318 |
| |
|
MINE DEVELOPMENT ASSOCIATES |
| |
| 21.0 | CAPITAL AND OPERATING COSTS |
Capital and operating costs for the Shahuindo Project were estimated by MDA and KCA with input from Sulliden on pre-production owner’s costs and general and administrative operating costs. The estimated capital and operating costs are considered to have an accuracy of +/-15%, and are discussed in greater detail in sections 21.1 and 21.2.
The total capital cost for the Shahuindo Project is US$ 188.2 million. Table 21-1 presents the capital requirements for the Shahuindo Project.
| |
| Table 21-1 | Shahuindo Project Capital Cost Summary |
| |
| Description | Cost (USD) |
| Pre-Production Capital | $132,746,000 |
| Working Capital (60 days) | $7,637,000 |
| Sustaining (Future) Capital | $47,789,000 |
| Total | $188,172,000 |
The total life of mine operating cost for the Shahuindo Project is US$ 11.94 per tonne of ore. Table 21-2 presents the operating cost requirements for the Shahuindo Project.
| |
| Table 21-2 | Shahuindo Project Operating Cost Summary |
| |
| Description | LOM Cost
(USD / t ore) |
| Mine | $5.66 |
| Process | $4.00 |
| Service & Support | $0.51 |
| Site G & A | $1.76 |
| Total | $11.94 |
* Note – differences in totals due to rounding.
IGV is not included in the capital and operating costs.
| | |
| November 2012 | Shahuindo Project | 319 |
| |
|
MINE DEVELOPMENT ASSOCIATES |
| |
| 21.1 | Capital Costs Summary |
The required capital expenditures for the Shahuindo Project are summarized in Table 21-1. The costs have been based on the design outlined in this report and are considered to have an accuracy of +/-15%. The scope of these costs includes the preparation of costs for all mining equipment, process facilities, and infrastructure for the project.
The costs presented have been estimated primarily by KCA with input from MDA on mine pre-production and equipment costs. All equipment and material requirements are based on the design information described in previous sections of this report. Capital cost estimates have been made primarily using budgetary supplier quotes for all major and most minor equipment items. Where supplier quotes were not available, a reasonable cost estimate was made based on supplier quotes in KCA’s/MDA’s files.
All capital cost estimates are based on the purchase of equipment quoted new from the manufacturer, or estimated to be fabricated new.
Table 21-3 presents the capital cost summary by area for the pre-production capital requirements, including the pre-production mining fleet. All costs are in second quarter 2012 US dollars (US$). Where prices were supplied in Peruvian Nuevo Soles, an average conversion rate of 2.65 Soles per US dollar was used.
| | |
| November 2012 | Shahuindo Project | 320 |
| |
|
MINE DEVELOPMENT ASSOCIATES |
| |
| Table 21-3 | Summary of Pre-Production Capital Costs |
| | | |
| Plant Totals Direct Costs | Total Supply
Cost (US$) | Install
(US$) | Grand Total
(US$) * |
| Area 00 - Site & Utilities General | $203,000 | $4,144,000 | $4,347,000 |
| Area 03 – Camp | $1,125,000 | $37,000 | $1,162,000 |
| Area 05 - Water Supply & Distribution | $2,470,000 | $6,718,000 | $9,188,000 |
| Area 06 - Process Area General | $300,000 | $0 | $300,000 |
| Area 08 - Mobile Equipment | $28,761,000 | $0 | $28,761,000 |
| Area 10 – Crushing | $6,935,000 | $1,115,000 | $8,050,000 |
| Area 15 - Ore Reclaim & Stacking | $8,517,000 | $777,000 | $9,294,000 |
| Area 20 - Heap Leach & Solution Handling | $5,326,000 | $7,354,000 | $12,680,000 |
| Area 25 – Adsorption | $3,490,000 | $279,000 | $3,768,000 |
| Area 30 - Acid Wash & Elution | $1,514,000 | $128,000 | $1,642,000 |
| Area 35 - Electrowinning & Refining | $1,532,000 | $108,000 | $1,640,000 |
| Area 40 - Carbon Handling & Regeneration | $1,564,000 | $135,000 | $1,699,000 |
| Area 45 – Detoxification | $593,000 | $78,000 | $672,000 |
| Area 50 – Electrical | $1,170,000 | $44,000 | $1,214,000 |
| Area 70 – Reagents | $367,000 | $74,000 | $441,000 |
| Area 75 – Laboratory | $1,270,000 | $87,000 | $1,357,000 |
| Area 80 – Ancillaries | $5,837,000 | $1,143,000 | $6,979,000 |
| | | | |
| Plant Total Direct Costs | $70,974,946 | $22,221,340 | $93,196,000 |
| Spare Parts | $1,943,000 |
| Contingency | $11,431,000 |
| Indirect Field Costs | $3,388,000 |
| Initial Fills | $903,000 |
| EPCM | $8,388,000 |
| Owner's Costs | $7,330,000 |
| Pre-Production Mining Provision | $6,167,000 |
| TOTAL Pre-Production Capital Cost (IGV Not Included) | $132,746,000 |
| Working Capital (60 days) | $7,637,000 |
* Note – differences in totals due to rounding.
| | |
| November 2012 | Shahuindo Project | 321 |
| |
|
MINE DEVELOPMENT ASSOCIATES |
Mining cost estimates are based on work by MDA, who prepared the mine plan, haul distances, and profiles. Based on this work MDA obtained budgetary quotations for the major mining equipment. The total pre-production mining equipment costs for pre-stripping are US$ 26.2 million. Pre-production mining costs are estimated to be US$ 6.2 million.
The pre-production mine fleet costs are presented in Table 21-4.
| | |
| November 2012 | Shahuindo Project | 322 |
| |
|
MINE DEVELOPMENT ASSOCIATES |
| |
| Table 21-4 | Pre-Production Mining Fleet & Costs |
| |
| Equipment | Qty |
| Primary Mining Equipment | |
| Track mounted Blast Hole Drill Rig | 2 |
| 6.9m3Front End Loader - Stockpiles | 1 |
| 6.9m3Front End Loader - Production | 2 |
| 35t Haul Truck | 19 |
| Support Equipment | |
| 230 Kw Dozer | 3 |
| 4.9 m Motor Grader | 2 |
| Water Truck - 5000 gal | 2 |
| Rock Breaker - Impact Hammer (691 Kg m) | 1 |
| Backhoe/Loader (1.5 cu m) | 1 |
| Horizontal Drill Rig | 1 |
| Pit Pumps (5299 lpm) | 3 |
| 2 cm excavator | 1 |
| Flatbed | 1 |
| Blasting | |
| Explosives Truck | 1 |
| Skid Loader | 1 |
| Mine Maintenance | |
| Lube/Fuel Truck | 2 |
| Mechanics Truck | 3 |
| Tire Truck | 1 |
| Other Mine Capital | |
| Mine Dewatering | 1 |
| Light Plant | 6 |
| Lowboy Tractor & Trailer | 1 |
| Explosives Storage Site Prep | 1 |
| ANFO Storage Bins | 2 |
| Powder Magazines | 1 |
| Cap Magazine | 1 |
| Mobile Radios | 52 |
| Shop Equipment | 1 |
| Engineering & Office Equipment | 1 |
| Water Storage (Dust Suppression) | 1 |
| Base Radio & GPS Stations | 1 |
| Unspecified Miscellaneous Equipment | 1 |
| Access Roads - Haul Roads - Site Prep | 1 |
| Light Vehicles | |
| 3/4 ton pickup | 1 |
| 4wd pickup | 9 |
| 4wd pickup | 6 |
| 4wd pickup | 1 |
| 1 t 4wd pickup | 1 |
| 3/4 ton passenger van | 2 |
| Area Total | $26,169,131 |
The mine capital cost is estimated based on the quantity of equipment required to achieve the mine production and on the costs for equipment from equipment procurement firms, estimation guides, and recent project data with which MDA has been involved. Table 21-5 shows the estimated mine capital requirements by year in 000’s
| | |
| November 2012 | Shahuindo Project | 323 |
| |
|
MINE DEVELOPMENT ASSOCIATES |
USD. The initial mine capital is estimated to be $32.3 million US. This includes $26.2 million for initial mining equipment and infrastructure (Table 21-4) and an additional $6.2 million for pre-stripping. The pre-stripping cost is not shown in Table 21-5, but is included in the mine operating costs shown in Table 21-10. The pre-stripping operating cost of $6.2 million has been capitalized by KCA in the financial analysis.
Sustaining mining capital is estimated to be $27.5 million US which includes additional haul trucks when required, plus replacement equipment through the life of mine. Mine capital expenditure details are given in the following sections.
| | |
| November 2012 | Shahuindo Project | 324 |
| |
|
MINE DEVELOPMENT ASSOCIATES |
| |
| Table 21-5 | Estimated Mine Capital by Year |
| | | | | | | | | | | | | | | | |
| | Pre-Prod | Yr 1 | Yr 2 | Yr 3 | Yr 4 | Yr 5 | Yr 6 | Yr 7 | Yr 8 | Yr 9 | Yr 10 | Yr 11 | Yr 12 | Yr 13 | Yr 14 | Total |
| Primary Mining Equipment | $15,081 | $2,070 | $869 | $0 | $5,103 | $3,385 | $368 | $368 | $613 | $613 | $0 | $0 | $0 | $0 | $0 | $28,472 |
| Support Equipment | $5,968 | $0 | $0 | $0 | $2,355 | $2,355 | $0 | $0 | $0 | $0 | $0 | $0 | $0 | $0 | $0 | $10,680 |
| Blasting | $244 | $0 | $27 | $27 | $0 | $27 | $27 | $0 | $27 | $27 | $0 | $0 | $0 | $0 | $0 | $408 |
| Mine Maintenance | $1,223 | $47 | $0 | $0 | $636 | $636 | $0 | $0 | $0 | $0 | $0 | $0 | $0 | $0 | $0 | $2,540 |
| Other Mine Capital | $3,653 | $845 | $497 | $1,185 | $592 | $804 | $908 | $508 | $572 | $5 | $0 | $0 | $0 | $0 | $0 | $9,568 |
| Total Capital | $26,169 | $2,961 | $1,393 | $1,212 | $8,686 | $7,207 | $1,303 | $876 | $1,213 | $646 | $0 | $0 | $0 | $0 | $0 | $51,666 |
| | |
| November 2012 | Shahuindo Project | 325 |
| |
|
MINE DEVELOPMENT ASSOCIATES |
| |
| 21.2.1 | Major Mining Equipment |
Capital for major mining equipment is discussed in the following subsections.
Drilling and Blasting.Drilling and Blasting capital includes:
A total of $2.4 million will be spent for track mounted blast hole drills through thelife of mine;
$190,000 for an explosives truck to deliver explosives to blast holes;
$218,000 is spent to purchase a total of four skid loaders (one initial skid loaderand then three replacements through the life of mine);
$50,000 for site preparation for the ANFO mixing and magazine areas;
$96,000 for ANFO storage bins and mixing facilities; and
$11,000 for portable powder and cap magazines.
Loading.Loading is assumed to be completed using front end loaders, which have been estimated to cost $1,369,390 per unit including freight and assembly. Up to a total of 4 loaders would be used for production and an additional loader would be used to move ore from the live stockpile to the crusher. Including replacement units, a total of 9 loaders will be purchased through the life of mine. Initial capital expenditure for loaders is $5.1 million and $7.2 million will be required for loaders in sustaining capital.
Haulage.The haulage equipment capital estimate assumes the use of 35-tonne haul trucks. These trucks will be purchased in Lima, Peru at a cost of $245,334 each, which includes dump boxes and 15% for freight and commissioning. An initial 34 trucks would be purchased during pre-production, of which some would be used for construction of the leach pad. Initial capital for trucks is $8.3 million with an additional $5.4 million being spent for expansion of the fleet and replacement trucks. A total of 56 trucks are purchased through the life of mine.
| | |
| November 2012 | Shahuindo Project | 326 |
| |
|
MINE DEVELOPMENT ASSOCIATES |
Capital estimates for mine support equipment include freight and erection. The life of mine support capital is estimated as follows:
$5,382,000 for track dozers ($897,000 US each);
$3,388,000 for motor graders ($847,000 US each);
$652,932 for 4 5,000 gal water tanks ($163,233 US each quoted by United Truck& Equipment);
$375,771 for a excavator ($375,771 US);
$120,000 for a low-boy trailer complete with a used over the road tractor to tow it;
$93,000 for in-pit pumps ($31,000 US each);
$22,000 for one rock breaker to be attached to the excavator as needed; and
$92,000 for light plants.
Maintenance capital estimate includes:
$770,000 for lube and service trucks;
$1,496,000 for mechanics trucks;
$274,000 for tire trucks; and
$200,000 for miscellaneous shop equipment.
Mine facilities such as construction of the truck shop and warehouse, mine operations buildings, and administration offices have been estimated by KCA.
| | |
| November 2012 | Shahuindo Project | 327 |
| |
|
MINE DEVELOPMENT ASSOCIATES |
A total life of mine cost of $2.3 million has been estimated for light vehicles.
Other capital that is included with the mining capital estimate includes:
$5,554,046 for mine dewatering including the cost of installation of horizontaldrains;
$200,000 for miscellaneous Engineering and Geology related software andsupplies;
$50,000 for water storage (water suppression);
$150,000 for base radio and surveying equipment;
$419,000 for haul roads and site preparations around open pits; and
$200,000 for unspecified miscellaneous equipment.
| | |
| November 2012 | Shahuindo Project | 328 |
| |
|
MINE DEVELOPMENT ASSOCIATES |
| |
| 21.3 | Process Capital Costs |
Process costs have been estimated by KCA. Capital cost estimates have been made primarily using budgetary supplier quotes for all major and most minor equipment items. Where supplier quotes were not available a reasonable cost estimate was made based on supplier quotes in KCA’s files.
Each area in the process cost estimate, including crushing, stacking, heap leach solution handling, recovery plant, etc. in the capital cost table is separated into the following disciplines, where applicable:
Freight, customs fees and duties, and installation costs are also considered and included in the capital cost estimate for each discipline, and are discussed in the following sections.
Engineering, procurement, and construction management (EPCM), contractor indirect costs, and initial inventory are added to the total direct costs.
Estimates for equipment freight costs are based on loads as bulk freight at an average percentage of equipment cost. The cost for transport for equipment items to the jobsite in Peru near Cajamarca is estimated to average 8% of the equipment cost.
| | |
| November 2012 | Shahuindo Project | 329 |
| |
|
MINE DEVELOPMENT ASSOCIATES |
Where applicable, supplier quoted freight cost estimates for equipment packages are used in place of the freight estimate.
Several equipment items are expected to be purchased or manufactured in Peru. An estimated freight cost of 2% of the mechanical equipment cost is used these items.
| |
| 21.3.3 | Duties and Customs Fees |
Ernst & Young’sPeru Business & Investment Guide 2010/2011has published customs rates of 0%, 9%, and 17%, depending on the imported good, for Peru. Customs fees for items imported to Peru are taken at 17% of equipment costs for the study. No customs fees or duties are applied to equipment or materials that are expected to be manufactured or purchased in Peru. Equipment and materials expected to be manufactured or purchased in Peru include most major plate work, electrical equipment, and other miscellaneous equipment items.
Equipment will be manufactured or purchased in Peru where possible to reduce the customs fees and import duties costs for the project.
Installation estimates for the equipment are based on the equipment type and include all installation labor and equipment usage. The hourly installation labor rates are estimated to be US$ 25/hr. Quoted supplier equipment installation costs are used where provided.
Major earthworks volumes were estimated by KCA with input from MDA. These estimates include major earthworks for various building platforms, site roads, the heap leach pad and solution ponds, water dams, waste dumps, canals, water diversions, and seepage ponds. The major earthworks also contain the costs associated with the supply and installation of ADS pipe for the heap leach pad and waste dump underdrains.
Earthworks for the Shahuindo Project are planned to be performed by the owner using equipment from the mining fleet, along with additional scrapers, compactors, and water trucks. Five water trucks are to be rented for the construction of the water ponds and an additional water truck will be rented for the leach pad construction. Unit rates for the major earthworks for the project are based on a contractor quote as well as estimates made by KCA and MDA. Because Sulliden plans to perform their own construction earthworks, it is assumed that all mobilization, demobilization, direct costs, and indirect costs are included in the supply costs for
| | |
| November 2012 | Shahuindo Project | 330 |
| |
|
MINE DEVELOPMENT ASSOCIATES |
the mining and earthworks fleets and the Project’s operating costs. The unit rates for the major earthworks items for the Shahuindo Project are shown in Table 21-6.
| |
| Table 21-6 | Major Earthworks Unit Rates |
| | |
| Description | Unit | Unit Cost |
| Tree Cutting | Hectares | $3,700.00 |
| Site Preparation, Clearing | m3 | $4.16 |
| Excavation - Type B | m3 | $3.46 |
| Excavation - Type C | m3 | $10.69 |
| Mined Fill | m3 | $0.95 |
| Structural Fill 30 cm lifts 90-92% spread and comp. | m3 | $2.89 |
Liner for the Shahuindo Project is required for the heap leach pad, the pregnant solution pond, the water ponds, and the seepage pond. Liner quantities are based on the layouts of the various facilities and include an additional 10% for wrinkles and wastage. Liner includes the supply and installation of the LLDPE, HDPE, and the associated materials for the Project. Liner pricing is based on quotes.
Civils include detailed earthworks and concrete. Concrete quantities have been estimated from takeoffs based on quantities from previous similar equipment installations, on major equipment weights, and on slab areas. Concrete costs have been estimated at US$ 510 and 580 per m3for FC175 and FC280 concrete, respectively. These costs include all form work, footing excavation, concrete supply, rebar, and curing costs. Concrete prices are provided by Sulliden based on recent installed costs in the area.
Structural steel costs have mostly been incorporated into the mechanical equipment costs for this Project as much of the major equipment is either “turnkey or “modular” and includes the structure needed for the equipment as part of the purchasing package. An allowance of US$ 300,000 is included for structural steel for small tank access, small platforms, hand rails, and other miscellaneous uses in this cost estimate.
| | |
| November 2012 | Shahuindo Project | 331 |
| |
|
MINE DEVELOPMENT ASSOCIATES |
Platework includes costs for tankage, bins, and chutes. The majority of the platework has been included in the vendor packages for all major equipment. Platework not included in vendor packages include tanks for the site water system, the barren solution tank, neutralization tanks, and the cyanide mix and storage tanks. Costs for these items are based on quotes supplied by a large Peruvian engineering and manufacturing firm.
| |
| 21.3.10 | Mechanical Equipment |
Costs for all major items of new equipment are based on budgetary quotes from vendors. Costs for minor equipment items are based on supplier quotes or from KCA/MDA’s in-house database. Installation estimates are based on equipment type and cost and include all installation labor and equipment usage. Where available, vendor estimated installation costs are used.
| |
| 21.3.11 | Piping, Electrical and Instrumentation |
Major piping, including process solution piping, major water and fire water lines, and heap irrigation are costed based on estimated material takeoffs and supplier quotes. Additional ancillary piping, fittings, and valve costs have been estimated on a percentage basis of the mechanical equipment costs. A factor ranging from 0% to 20% was used to estimate the ancillary piping purchase costs for each area.
Major electrical items such as transformers, substations, generator sets, power lines and VFDs have been included in the electrical costs section. Miscellaneous electrical costs have been estimated on a percentage of the mechanical equipment basis. A rate ranging from 3% to 15% of the mechanical equipment cost is used for each area. Costs for these items are based on quotes received from suppliers or estimated based on KCA’s in-house database.
Instrumentation costs are minimal with a percentage range of 0% to 5% of the mechanical equipment cost being used.
| |
| 21.4 | Infrastructure Capital Costs |
Costs for the site infrastructure for the Shahuindo Project have been estimated using information provided by Sulliden as well as supplier quotes and quotes from past KCA projects.
Buildings.A list of the buildings is provided in Table 21-7 below. Building costs have been based on a combination of steel building costs and site-constructed buildings as supplied by
| | |
| November 2012 | Shahuindo Project | 332 |
| |
|
MINE DEVELOPMENT ASSOCIATES |
vendors. An allowance of $35,000 for office furnishings, which includes desks, chairs, etc., is included.
|
| Buildings |
| Powder Magazine Building |
| Crusher Workshop |
| ADR Plant Warehouse and |
| Maintenance Area |
| Refinery Building |
| Lab Building |
| Warehouse |
| Process Office Building |
| Locker Room Building |
| Mine Shop |
| Guard Shack |
| MCC Buildings |
Access & Haul Roads. A cost of US$ 2,998,000 was determined by the Sulliden Technical Service Group for the main access road to the Shahuindo Project site. Internal site access roads and haul roads are estimated based on earthworks quantities and are included in the major earthworks costs.
Power Supply. The Carhuamayo-Paragsha-Conococha Kiman Ayllu-Cajamarca Norte-Cerro Corona-Carhuaquero trans-national 220 kV power line has been recently constructed and passes within three kilometers of the Shahuindo Project site. PEPSA Tecsult supplied an estimate for the installation of the power supply infrastructure. This includes the main Shahuindo substation, a camp substation, crushing/mine shop area substation, heap leach/solution handling substation and the mine substation. One additional transformer station was added by KCA for the dewatering wells substation. The Shahuindo main substation is used for interconnections and contains extra space for growth, as required by Abengoa; the others are internal substations for Shahuindo. The site distribution will use independent transformers at each operating area.
Raw Water Supply. Raw water for the Shahuindo Project is supplied primarily by rain water catchments and pit dewatering. Capital costs for the raw water supply includes the main water storage tank, process raw water storage tank, water dam earthworks and liner costs for rain water catchment, pumps for the water dams, water dam booster tanks, booster pumps, gravity
| | |
| November 2012 | Shahuindo Project | 333 |
| |
|
MINE DEVELOPMENT ASSOCIATES |
tanks, and pipelines. Costs for the dewatering wells have been included in the infrastructure; costs for the dewatering well pumps are included in the mechanical equipment for both pre-production and sustaining capital.
Site Fencing. A US$ 150,000 allowance has been allotted for all site fencing and an additional US$ 88,000 for livestock fencing. Fencing allowances exclude fenced yards for construction.
Indirect costs include contractor’s costs for items such as temporary construction facilities, quality control, survey support, warehouse and fenced yards, support equipment, security, etc. These costs have been estimated and are included in the capital costs estimate. Table 21-8 summarizes the field indirect costs.
| | |
| November 2012 | Shahuindo Project | 334 |
| |
|
MINE DEVELOPMENT ASSOCIATES |
| |
| Table 21-8 | Field Indirect Costs |
| |
| Description | Cost, US$ |
| Construction Equipment Rentals | $1,588,056 |
| QA/QC | $250,000 |
| Surveying Support | $100,000 |
| Construction Warehouse & Fenced Yard | $210,000 |
| Miscellaneous Construction Facilities | $100,000 |
| General Support Equipment | $100,000 |
| Vehicles - 9 pickups + 1 Flatbed | $370,000 |
| Construction Power and Communications | $350,000 |
| Security | $120,000 |
| Outside Consultants | $200,000 |
| |
| 21.4.2 | Vendor Representatives |
Costs for vendor representatives for the engineering and installation supervision have been included in several vendor quotes on major equipment items and are included in this cost estimate.
Spare parts costs not directly provided by the suppliers were estimated as a percentage of the mechanical equipment costs. For the study a percentage of 6% was used.
| |
| 21.4.4 | Initial Fills Inventory |
The initial fills consists of consumable items stored on site at the outset of operations, which includes sodium cyanide (NaCN), cement, carbon, antiscalant, caustic soda, hydrochloric acid, copper sulfate, hydrogen peroxide, sulfuric acid, diesel fuel, and fluxes (SiO2, borax, niter, and soda ash). This inventory of initial fills is in place to insure that adequate consumables are available for the first stage of operation. The initial fills estimate is based primarily on a one month supply of operating requirements and/or rounded to the nearest full truckload delivery. Details of the initial fills are presented in Table 21-9.
| | |
| November 2012 | Shahuindo Project | 335 |
| |
|
MINE DEVELOPMENT ASSOCIATES |
| | | | | | | |
| Item | Basis | Needed
Weight
(kg or L) | Truckloads | Quantity to
Order (kg or
L) | Unit
Price
(US$) | Shipping
(US$) | Total Cost
(Excl. IGV)
(US$) |
| | | | | | | | |
| NaCN | 3 weeks | 60,000 | 3.0 | 60,000 | 4.10 | dlvd. | $246,000 |
| Cement | Full Silo | 120,000 | 6.0 | 120,000 | 0.15 | dlvd. | $18,000 |
| Carbon | Full Circuit | 30,000 | 1.5 | 30,000 | 2.70 | 0.41 | $93,300 |
| Antiscalant | 5 weeks | 9,000 | 0.5 | 9,000 | 2.00 | 0.41 | $21,690 |
| Caustic Soda | 3 weeks | 3,000 | 0.2 | 10,000 | 0.77 | 0.41 | $11,800 |
| Hydrochloric Acid | 3 weeks | 20,000 | 1.0 | 20,000 | 0.75 | 0.41 | $23,280 |
| Copper Sulfate | 1 Super Sack | 1,000 | 1.0 | 20,000 | 2.82 | 0.41 | $64,560 |
| Hydrogen Peroxide | 1 truckload | 20,000 | 1.0 | 20,000 | 0.90 | 0.41 | $26,200 |
| Sulfuric Acid | 1 truckload | 20,000 | 1.0 | 20,000 | 0.75 | 0.41 | $23,200 |
| Diesel (L) | Partial fill of the diesel storage tank (300 m3) & process tanks | 186,500 | 8.0 | 186,500 | 1.10 | dlvd. | $205,920 |
| Flux | 4 weeks | | | | | | |
| SiO2 | | 560 | 0.0 | 1,000 | 0.50 | dlvd. | $500 |
| Borax | | 896 | 0.0 | 1,000 | 0.98 | dlvd. | $980 |
| Niter | | 448 | 0.0 | 1,000 | 1.75 | dlvd. | $1,750 |
| Soda Ash | | 336 | 0.0 | 1,000 | 1.70 | dlvd. | $1,700 |
| Lab Consumables, Reagents, and Small Items | | | | | | | $163,939 |
| TOTAL | | $902,819 |
| |
| 21.4.5 | Engineering, Procurement and Construction Management |
The estimated cost for engineering, procurement and construction management (EPCM) for the development, construction, and commissioning are based on a percentage of the direct capital cost. The total EPCM cost of US$ 8,387,666, or 9% of the total project direct costs, is based on the assumption that a Peruvian company will perform the EPCM. The percentage base for the EPCM is based on discussions with a local Peruvian engineering and construction firm.
The EPCM costs cover services and expenses for the following areas:
Project Management
Detailed Engineering
Engineering Support
Procurement
| | |
| November 2012 | Shahuindo Project | 336 |
| |
|
MINE DEVELOPMENT ASSOCIATES |
Construction Management
Commissioning
Preliminary project development is discussed in Section 24.
For some major pieces of equipment, costs associated with detailed engineering, commissioning, and installation supervision have been included in the vendor’s quotes; these costs are reflected in this discipline of the capital cost estimate.
Contingency is applied ranging from 10% to 20% of the direct costs. Contingency for pre-production totals 12.3% of the direct costs, and contingency for the sustaining capital is 11.2% of the direct costs.
| |
| 21.5 | Sustaining Capital Costs |
Future capital expenditures will include additional costs for the second phase of construction of the pad site and excess solution ponds in the third year of production, as well as evaporators and a water treatment plant that are added in year 2. The future capital also includes additional mining equipment and mining fleet, as well as the replacement of the light vehicles throughout the operation. The future capital cost accounts for a total of US$ 47,788,545, including contingency.
Reclamation and Closure.Reclamation and Closure is considered as a future cost in the financial analysis in Section 22 of this report and is discussed in detail in Section 20.3 of the environmental section. Costs for reclamation and closure are estimated to be US$ 17.8 million for the entire project (US$ 0.471 per tonne ore) plus an additional operating cost for G & A of US$ 2.6 million for a total closure cost of US$ 20.4 million.
Owner’s costs are intended to cover the following items:
Owner’s costs for labor, offices, home office support, vehicles, travel and consultantsduring construction.
Royalties, license fees etc.
Owner’s start-up and commissioning crew.
Taxes and permits.
| | |
| November 2012 | Shahuindo Project | 337 |
| |
|
MINE DEVELOPMENT ASSOCIATES |
Owner’s costs were developed by Sulliden and reviewed by KCA for reasonableness. The total cost is approximately US$7.3 million.
The working capital for the Shahuindo Project is estimated to be US$ 7,637,000. The working capital is the capital required for operations before any revenue is produced by the mine and is based on the operating costs for the mine, process, and the general administrative costs for the Project. The working capital is based on 60 days of operation.
The following capitals costs have been excluded from KCA’s scope of supply and estimate:
| | |
| November 2012 | Shahuindo Project | 338 |
| |
|
MINE DEVELOPMENT ASSOCIATES |
| |
| 21.9 | Operating Costs Summary |
Operating costs for the Shahuindo Project have been estimated based upon the information presented in earlier sections of this report. Mine operating costs were determined by MDA and are estimated to be US$ 5.66/t ore for the life of mine, not including pre-production. These results are presented in more detail in Section 21.2.1. The estimated life of mine annual operating cost for the process, lab, and support services is estimated to be US$ 4.51, and the G&A for the Shahuindo Project is estimated to be US$ 1.76 per tonne of ore. These results are presented in more detail in Sections 21.2.2 and 21.2.3, respectively. A summary of projected operating costs is presented in Table 21-10.
| |
| Table 21-10 | Shahuindo Project Operating Cost Summary |
| |
| Description | LOM Cost
(USD / t ore) * |
| Mine | $5.66 |
| Process | $4.00 |
| Service & Support | $0.51 |
| Site G & A | $1.76 |
| Total | $11.94 |
* Note – Differences due to rounding
Operating costs for the project have been estimated from first principals. Labor costs are estimated using project specific staffing, salary, wage, and benefit requirements. Unit consumption of materials, supplies, power, water, and delivered supply costs are also estimated.
The operating costs were determined by year, with power consumption increasing in Years 2 and 4 for the process area. Increased power consumption is a result of the addition of a water treatment plant and evaporators in year 2, and the addition of standard and portable grasshopper conveyors and booster pumps for the barren solution for the Phase 2 leach pad expansion in year 4. Reagent consumptions for the heap leach recovery plant decrease throughout the Project life resulting from lower average metal production and lower utilization of the recovery plant in each subsequent year.
The operating costs presented are based upon ownership of all project production equipment and site facilities, as well as the Owner employing and directing all operating, maintenance, and support personnel.
| | |
| November 2012 | Shahuindo Project | 339 |
| |
|
MINE DEVELOPMENT ASSOCIATES |
The operating costs have been estimated and are presented without any added contingency allowances. The mine, processing, support and general and administrative operating costs are considered to have an accuracy range of +/- 15%.
Operating costs estimates have been based upon information obtained from the following sources:
MDA Mining costs
Project metallurgical test work and process engineering
Budgetary quotations from potential suppliers of project operating andmaintenance supplies and materials
Recent KCA project file data
Experience of KCA staff with other similar operations
Sulliden G&A operation costs
Where specific data does not exist, cost allowances have been based upon consumption and operating requirements from other similar properties for which reliable data exists. Freight costs have been estimated where delivered prices were not available.
All costs are presented in 2ndquarter 2012 US dollars (US$). Where prices were supplied in Peruvian Nuevo Soles, an average conversion rate of 2.65 per US dollar was used. These costs do not include IGV (Value Added Tax).
| | |
| November 2012 | Shahuindo Project | 340 |
| |
|
MINE DEVELOPMENT ASSOCIATES |
| |
| 21.10 | Mining Operating Costs |
Mining operating costs were determined by MDA. It is expected that the bulk of the deposit will be able to be mined using standard drill, blast, load, and haul open pit mining methods.
Annual mine operating costs have been estimated based on personnel requirements and equipment hourly costs. Table 21-11 summarizes the annual mine operating costs for each operating year in US$/tonne mined. The costs are provided based on functionality (drilling, blasting, loading, hauling, support, mine general services, mine maintenance, engineering, and geology). The total average mining cost is estimated to be $2.00/t mined ($ 5.83/t ore) including pre-production.
The following subsections describe the operating cost estimate by functionality.
| | |
| November 2012 | Shahuindo Project | 341 |
| |
|
MINE DEVELOPMENT ASSOCIATES |
| |
| Table 21-11 | Annual Mine Operating Costs |
| | | | | | | | | | | | | | |
| Mining Costs | Units | PreProd | Yr1 | Yr2 | Yr3 | Yr4 | Yr5 | Yr6 | Yr7 | Yr8 | Yr9 | Yr10 | Yr11 | Total |
| Mine General Service | K USD | $337 | $790 | $875 | $861 | $922 | 861 | 861 | 861 | 861 | 639 | 639 | 126 | $8,635 |
| Mine Maintenance | KUSD | $327 | $1,275 | $1,281 | $1,276 | $1,304 | 1,275 | 1,275 | 1,276 | 1,275 | 1,275 | 725 | 496 | $13,059 |
| Engineering | KUSD | $195 | $392 | $395 | $392 | $407 | 392 | 392 | 392 | 392 | 392 | 392 | 153 | $4,287 |
| Geology | KUSD | $147 | $253 | $257 | $253 | $270 | 253 | 253 | 253 | 253 | 253 | 253 | 102 | $2,797 |
| Mine Dewatering | KUSD | $126 | $320 | $336 | $361 | $390 | 384 | 399 | 400 | 396 | 290 | 290 | 117 | $3,807 |
| Drilling | KUSD | $294 | $1,119 | $1,455 | $1,730 | $1,906 | 2,221 | 2,169 | 945 | 1,400 | 805 | 92 | - | $14,134 |
| Blasting | KUSD | $1,169 | $3,431 | $3,654 | $3,734 | $4,235 | 4,670 | 4,637 | 3,172 | 2,977 | 2,773 | 241 | - | $34,694 |
| Loading | KUSD | $666 | $3,190 | $3,442 | $3,417 | $3,755 | 4,118 | 4,141 | 2,636 | 2,545 | 2,258 | 1,169 | 409 | $31,748 |
| Hauling | KUSD | $1,893 | $9,273 | $10,037 | $8,283 | $8,849 | 8,243 | 9,050 | 4,353 | 4,687 | 3,496 | 1,926 | 544 | $70,634 |
| Mine Support | KUSD | $1,014 | $3,500 | $3,500 | $3,508 | $3,500 | 3,500 | 3,500 | 3,508 | 3,500 | 3,500 | 2,256 | 1,947 | $36,732 |
| Total Mine Cost | KUSD | $6,167 | $23,543 | $25,232 | $23,816 | $25,538 | $25,917 | $26,678 | $17,795 | $18,285 | $15,681 | $7,983 | $3,894 | $220,529 |
| Mine Cost per Tonne Mined |
| Mine General Service | $/t | $0.10 | $0.07 | $0.07 | $0.07 | $0.06 | $0.05 | $0.05 | $0.11 | $0.11 | $0.10 | $1.38 | $- | $0.08 |
| Mine Maintenance | $/t | $0.10 | $0.11 | $0.10 | $0.10 | $0.09 | $0.08 | $0.08 | $0.16 | $0.16 | $0.20 | $1.57 | $- | $0.12 |
| Engineering | $/t | $0.06 | $0.03 | $0.03 | $0.03 | $0.03 | $0.02 | $0.02 | $0.05 | $0.05 | $0.06 | $0.85 | $- | $0.04 |
| Geology | $/t | $0.04 | $0.02 | $0.02 | $0.02 | $0.02 | $0.02 | $0.02 | $0.03 | $0.03 | $0.04 | $0.55 | $- | $0.03 |
| Mine Dewatering | $/t | $0.04 | $0.03 | $0.03 | $0.03 | $0.03 | $0.02 | $0.02 | $0.05 | $0.05 | $0.05 | $0.63 | $- | $0.03 |
| Drilling | $/t | $0.09 | $0.09 | $0.11 | $0.14 | $0.13 | $0.14 | $0.14 | $0.12 | $0.17 | $0.13 | $0.20 | $- | $0.13 |
| Blasting | $/t | $0.35 | $0.29 | $0.28 | $0.30 | $0.29 | $0.29 | $0.29 | $0.40 | $0.37 | $0.44 | $0.52 | $- | $0.32 |
| Loading | $/t | $0.20 | $0.27 | $0.27 | $0.27 | $0.26 | $0.26 | $0.26 | $0.33 | $0.32 | $0.36 | $2.52 | $- | $0.29 |
| Hauling | $/t | $0.57 | $0.78 | $0.78 | $0.66 | $0.60 | $0.52 | $0.56 | $0.55 | $0.58 | $0.56 | $4.16 | $- | $0.64 |
| Mine Support | $/t | $0.31 | $0.29 | $0.27 | $0.28 | $0.24 | $0.22 | $0.22 | $0.44 | $0.44 | $0.56 | $4.87 | $- | $0.33 |
| Total Mine Cost | $/t | $1.86 | $1.98 | $1.95 | $1.89 | $1.74 | $1.63 | $1.66 | $2.24 | $2.28 | $2.49 | $17.23 | $- | $2.00 |
| | |
| November 2012 | Shahuindo Project | 342 |
| |
|
MINE DEVELOPMENT ASSOCIATES
|
The average life-of-mine drilling cost is estimated to be $0.13/t mined. This includes maintenance labor allocated to drill maintenance.
The average life-of-mine blasting cost is estimated to be $0.32/t mined.
The average life-of-mine loading cost is estimated to be $0.29/t mined or $0.25/t moved. The cost per tonne moved includes the re-handle of ore and includes maintenance labor allocated.
The average life-of-mine haulage cost is estimated to be $0.63/t mined or $0.56/t moved. The cost per tonne moved includes re-handle of stockpiled ore at the end of the mine life and maintenance labor allocated to truck maintenance.
| |
| 21.10.5 | Mine-Support Costs |
Mine-support costs include the operation of all of the mine-support equipment. The average life-of-mine support cost is estimated to be $0.34/t mined or $0.29/t moved. The cost per tonne moved includes support during re-handling of stockpiled ore at the end of the mine life and maintenance labor allocated to drill maintenance.
| |
| 21.10.6 | Mine-Maintenance Costs |
The average life-of-mine mine-maintenance cost is estimated to be $0.12/t mined or $0.10/t moved. Note that the maintenance wages for mechanics has been included in the operating cost for equipment. Thus, the maintenance costs do not include the labor directly attributed to equipment maintenance.
| |
| 21.10.7 | Mine General Services, Engineering, and Geology Costs |
The average life-of-mine general services, Engineering, and Geology costs are estimated to be $0.14/t mined or $0.13/t moved. Mine general services costs include costs for mine supervision, engineering, geology, light vehicles, and supplies.
| | |
| November 2012 | Shahuindo Project | 343 |
| |
|
MINE DEVELOPMENT ASSOCIATES
|
| |
| 21.10.8 | Mine Dewatering Costs |
The mine dewatering costs were estimated to be $0.03/t or $3,807,000 for the life of the mine based on operating horizontal drains. The cost estimate includes personnel to operate and maintain the horizontal drains and the pumping of water to a tank outside of the pit. KCA has included the cost of moving the water from the ex-pit tanks location to the leach pad where it will be used as makeup water for process operations.
The cost for the installation of horizontal drains is calculated based on owner owned and operated equipment and is included as a pre-production and sustaining capital cost.
| |
| 21.10.9 | Mine Personnel and Staffing |
Mine personnel estimates include both operating and mine-staff personnel. Operating personnel are estimated as the number of people required to operate drills, trucks, loading, and support equipment to achieve the production schedule as well as those persons required for blasting. Mine staff is based on the people required for supervision and support of mine production. The estimated number of mine personnel required to execute the mine plan is shown in Table 21-12.
Salaries for each position were estimated based on information received from Sulliden. Salaries include an allowance for benefits for each position. The extended cost for labor by year is shown in thousands of US dollars in Table 21-13.
| | |
| November 2012 | Shahuindo Project | 344 |
| |
|
MINE DEVELOPMENT ASSOCIATES
|
| |
| Table 21-12 | Mine Personnel Requirements |
| | | | | | | | | | | | | |
| Mine Overhead | Pre-
Prod | Yr 1 | Yr 2 | Yr 3 | Yr 4 | Yr 5 | Yr 6 | Yr 7 | Yr 8 | Yr 9 | Yr
10 | Yr
11 | Yr
12 |
| Mine Manager | 1 | 1 | 1 | 1 | 1 | 1 | 1 | 1 | 1 | 1 | 1 | 1 | - |
| Mine Clerk | 1 | 1 | 1 | 1 | 1 | 1 | 1 | 1 | 1 | 1 | 1 | 1 | - |
| Mine General Foreman | 1 | 1 | 1 | 1 | 1 | 1 | 1 | 1 | 1 | 1 | 1 | 1 | - |
| Mine Shift Foremen | 4 | 12 | 12 | 12 | 12 | 12 | 12 | 12 | 12 | 8 | 8 | - | - |
| Mine Trainer | 2 | 4 | 4 | 4 | 4 | 4 | 4 | 4 | 4 | 4 | 4 | - | - |
| Mine Dewatering | 6 | 6 | 6 | 6 | 6 | 6 | 6 | 6 | 6 | 2 | 2 | - | - |
| Blaster | 3 | 4 | 4 | 4 | 4 | 4 | 4 | 4 | 4 | 4 | 4 | - | - |
| Blaster's Helper | 3 | 4 | 4 | 4 | 4 | 4 | 4 | 4 | 4 | 4 | 4 | - | - |
| Mine Production | | | | | | | | | | | | | |
| Loading Operators | 8 | 16 | 20 | 20 | 20 | 24 | 24 | 20 | 16 | 16 | 12 | 12 | - |
| Mechanics | 4 | 7 | 8 | 8 | 8 | 10 | 10 | 8 | 7 | 7 | 5 | 5 | - |
| Welders | 1 | 2 | 2 | 2 | 2 | 3 | 3 | 2 | 2 | 2 | 2 | 2 | - |
| Servicemen | 1 | 2 | 2 | 2 | 2 | 3 | 3 | 2 | 2 | 2 | 2 | 2 | - |
| Haul Truck Operators | 76 | 108 | 120 | 104 | 104 | 104 | 104 | 48 | 48 | 40 | 40 | 32 | - |
| Mechanics | 31 | 44 | 48 | 42 | 42 | 42 | 42 | 20 | 20 | 16 | 16 | 13 | - |
| Welders | 8 | 11 | 12 | 11 | 11 | 11 | 11 | 5 | 5 | 4 | 4 | 4 | - |
| Servicemen | 8 | 11 | 12 | 11 | 11 | 11 | 11 | 5 | 5 | 4 | 4 | 4 | - |
| Drill Operators | 4 | 8 | 8 | 8 | 8 | 8 | 8 | 8 | 8 | 4 | 4 | - | - |
| Mechanics | 2 | 4 | 4 | 4 | 4 | 4 | 4 | 4 | 4 | 2 | 2 | - | - |
| Welders | 1 | 1 | 1 | 1 | 1 | 1 | 1 | 1 | 1 | 1 | 1 | - | - |
| Servicemen | 1 | 1 | 1 | 1 | 1 | 1 | 1 | 1 | 1 | 1 | 1 | - | - |
| Support Equipment Operators | 21 | 25 | 25 | 25 | 25 | 25 | 25 | 25 | 25 | 25 | 17 | 17 | - |
| Mechanics | 9 | 10 | 10 | 10 | 10 | 10 | 10 | 10 | 10 | 10 | 7 | 7 | - |
| Welders | 1 | 1 | 1 | 1 | 1 | 1 | 1 | 1 | 1 | 1 | 1 | 1 | - |
| Servicemen | 1 | 1 | 1 | 1 | 1 | 1 | 1 | 1 | 1 | 1 | 1 | 1 | - |
| Total Mine Operating | 198 | 285 | 308 | 284 | 284 | 292 | 292 | 194 | 189 | 161 | 144 | 103 | - |
| | |
| November 2012 | Shahuindo Project | 345 |
| |
|
MINE DEVELOPMENT ASSOCIATES
|
| |
| Table 21-12 | Mine Personnel Requirements (cont.) |
| | | | | | | | | | | | | |
| Mine Maintenance | Pre-
Prod | Yr 1 | Yr 2 | Yr 3 | Yr 4 | Yr 5 | Yr 6 | Yr 7 | Yr 8 | Yr 9 | Yr
10 | Yr
11 | Yr
12 |
| Maintenance Superintendent | 1 | 1 | 1 | 1 | 1 | 1 | 1 | 1 | 1 | 1 | 1 | 1 | - |
| Maintenance Foremen | 2 | 4 | 4 | 4 | 4 | 4 | 4 | 4 | 4 | 4 | 2 | 2 | - |
| Light Vehicle Mechanics | 2 | 4 | 4 | 4 | 4 | 4 | 4 | 4 | 4 | 4 | 2 | 2 | - |
| Tiremen | 2 | 6 | 6 | 6 | 6 | 6 | 6 | 6 | 6 | 6 | 2 | 2 | - |
| Shop Laborers | 2 | 4 | 4 | 4 | 4 | 4 | 4 | 4 | 4 | 4 | 2 | 2 | - |
| Maintenance Planner | 4 | 4 | 4 | 4 | 4 | 4 | 4 | 4 | 4 | 4 | 2 | 2 | - |
| Service, Fuel, & Lube | 2 | 4 | 4 | 4 | 4 | 4 | 4 | 4 | 4 | 4 | 4 | 4 | - |
| Total Mine Maintenance | 15 | 27 | 27 | 27 | 27 | 27 | 27 | 27 | 27 | 27 | 15 | 15 | - |
| Engineering | | | | | | | | | | | | | |
| Chief Engineer | 1 | 1 | 1 | 1 | 1 | 1 | 1 | 1 | 1 | 1 | 1 | 1 | - |
| Mine Surveyors | 3 | 3 | 3 | 3 | 3 | 3 | 3 | 3 | 3 | 3 | 3 | 3 | - |
| Surveyor Helper | 2 | 2 | 2 | 2 | 2 | 2 | 2 | 2 | 2 | 2 | 2 | 2 | - |
| Mine Engineer | 3 | 3 | 3 | 3 | 3 | 3 | 3 | 3 | 3 | 3 | 3 | 3 | - |
| Total Engineering | 9 | 9 | 9 | 9 | 9 | 9 | 9 | 9 | 9 | 9 | 9 | 9 | - |
| Mine Geology | | | | | | | | | | | | | |
| Chief Geologist | 1 | 1 | 1 | 1 | 1 | 1 | 1 | 1 | 1 | 1 | 1 | 1 | - |
| Ore Control Geologist | 4 | 4 | 4 | 4 | 4 | 4 | 4 | 4 | 4 | 4 | 4 | 4 | - |
| Sampler | 2 | 2 | 2 | 2 | 2 | 2 | 2 | 2 | 2 | 2 | 2 | 2 | - |
| Total Geology | 7 | 7 | 7 | 7 | 7 | 7 | 7 | 7 | 7 | 7 | 7 | 7 | - |
| Total Mine Operations Workforce | | | | | | | | | | | | | |
| Mine Operations | 198 | 285 | 308 | 284 | 284 | 292 | 292 | 194 | 189 | 161 | 144 | 103 | - |
| Mine Maintenance | 15 | 27 | 27 | 27 | 27 | 27 | 27 | 27 | 27 | 27 | 15 | 15 | - |
| Engineering | 9 | 9 | 9 | 9 | 9 | 9 | 9 | 9 | 9 | 9 | 9 | 9 | - |
| Geology | 7 | 7 | 7 | 7 | 7 | 7 | 7 | 7 | 7 | 7 | 7 | 7 | - |
| Total Mine Operations | 229 | 328 | 351 | 327 | 327 | 335 | 335 | 237 | 232 | 204 | 175 | 134 | - |
| | |
| November 2012 | Shahuindo Project | 346 |
| |
|
MINE DEVELOPMENT ASSOCIATES
|
| |
| Table 21-13 | Mine Annual Personnel Costs ($000’s USD) |
| | | | | | | | | | | | | | |
| | Pre-Prod | Yr 1 | Yr 2 | Yr 3 | Yr 4 | Yr 5 | Yr 6 | Yr 7 | Yr 8 | Yr 9 | Yr 10 | Yr 11 | Yr 12 | Total |
| Mine Overhead | $373 | $897 | $967 | $967 | $967 | $967 | $967 | $967 | $967 | $745 | $582 | $74 | $0 | $9,440 |
| Mine Production | $1,389 | $5,546 | $6,027 | $5,611 | $5,611 | $5,767 | $5,767 | $3,991 | $3,889 | $3,299 | $2,661 | $775 | $0 | $50,334 |
| Mine Maintenance | $150 | $567 | $567 | $567 | $567 | $567 | $567 | $567 | $567 | $567 | $318 | $119 | $0 | $5,689 |
| Engineering | $180 | $357 | $357 | $357 | $357 | $357 | $357 | $357 | $357 | $357 | $357 | $134 | $0 | $3,884 |
| Mine Geology | $131 | $216 | $216 | $216 | $216 | $216 | $216 | $216 | $216 | $216 | $216 | $81 | $0 | $2,372 |
| Mine Operations Workforce | $1,851 | $6,686 | $7,166 | $6,751 | $6,751 | $6,907 | $6,907 | $5,131 | $5,029 | $4,439 | $3,553 | $1,109 | $0 | $62,279 |
| | |
| November 2012 | Shahuindo Project | 347 |
| |
|
MINE DEVELOPMENT ASSOCIATES
|
| |
| 21.11 | Process and Support Services Operating Cost |
Operating requirements have been estimated based upon unit costs and consumption, and, where possible, have been broken down by area. The average life of mine operating cost for the process, lab, and service and support is US$ 4.51 per tonne of ore.
Table 21-14 shows the process and support services operating costs by area by year.
| | |
| November 2012 | Shahuindo Project | 348 |
| |
|
MINE DEVELOPMENT ASSOCIATES
|
| |
| Table 21-14 | Shahuindo Operating Cost Summary (US$/t) – By Year |
| | | | | |
| | Yr 1 | Yr 2 & 3 | Yr 4 | Yr 5 | Yr 6 on |
| | US$ per | US$ per | US$ per | US$ per | US$ per |
| | Tonne Ore | Tonne Ore | Tonne Ore | Tonne Ore | Tonne Ore |
| | | | | | |
| PROCESS | | | | | |
| Process Labor | $0.579 | $0.579 | $0.579 | $0.579 | $0.579 |
| Primary Crushing | $0.101 | $0.101 | $0.101 | $0.101 | $0.101 |
| Secondary Crushing | $0.252 | $0.252 | $0.252 | $0.252 | $0.252 |
| Reclaim /Convey/Stacking | $0.298 | $0.298 | $0.321 | $0.321 | $0.321 |
| Heap Leach Systems | $0.121 | $0.128 | $0.165 | $0.165 | $0.165 |
| Carbon ADR Plant | $0.527 | $0.523 | $0.451 | $0.385 | $0.359 |
| Refinery | $0.054 | $0.054 | $0.052 | $0.050 | $0.050 |
| Reagents | $2.161 | $2.161 | $2.138 | $2.118 | $2.118 |
| PROCESS TOTAL (IGV not incld) | $4.092 | $4.095 | $4.058 | $3.971 | $3.945 |
| | | | | | |
| SUPPORT SERVICES | | | | | |
| Water Distribution | $0.096 | $0.146 | $0.166 | $0.180 | $0.200 |
| Laboratory | $0.224 | $0.224 | $0.224 | $0.224 | $0.224 |
| Support | $0.114 | $0.114 | $0.114 | $0.114 | $0.114 |
| TOTAL SERVICE & SUPPORT | $0.434 | $0.485 | $0.504 | $0.518 | $0.538 |
| | | | | | |
| TOTAL COST | $4.526 | $4.580 | $4.562 | $4.489 | $4.483 |
| | |
| November 2012 | Shahuindo Project | 349 |
| |
|
MINE DEVELOPMENT ASSOCIATES
|
| |
| 21.11.1 | Process Personnel and Staffing |
Staffing requirements for process and administration personnel as well as wages, salaries, and burdens are estimated by KCA. Staffing requirements for mining and mine administration personnel are estimated by MDA (see Section 21.2).
Provisions for overtime, benefits, and taxes for the process personnel are included in the wage and salary data. The benefits and burdens for personnel are based on 53% of the base annual salary for salaried employees and 52% for hourly employees. These burdens include the following:
A gratuity of two monthly salaries per employee per year
30 days paid vacation per employee
An employer-paid severance payment of 8.5% which is applied against wageearnings
An employer-paid social security tax of 9% and a hazardous occupation tax of1.5% are applied against wage earnings.
Table 21-15 presents the staffing levels for the processing and administrative portions of the project. Total yearly staffing costs for process is estimated at US$2.1 million and laboratory at US$269 thousand.
| | |
| November 2012 | Shahuindo Project | 350 |
| |
|
MINE DEVELOPMENT ASSOCIATES
|
| |
| Table 21-15 | Shahuindo Project Staffing Levels |
| | | |
| | Job Title | Qty | |
| | | |
| PROCESS | | |
| Supervision | | |
| Process Manager | 1 | |
| Metallurgist | 1 | |
| Metallurgical Technician | 2 | |
| Administrative Technician | 2 | |
| Process General Foreman | 1 | |
| Shift Foreman | 4 | |
| Maint General Foreman | 1 | |
| Crushing | | |
| Primary Crusher Operator | 4 | |
| Secondary Crusher Operator | 4 | |
| Crusher Feed Loader Operator | 0 | |
| Crusher Helper | 4 | |
| Heap Leach | | |
| Heap Leach Operator | 4 | |
| Stacking Operator | 4 | |
| Heap Dozer Operator (& relief loader) | 4 | |
| Utility Operator | 12 | |
| Piping Crew - Heap Leach | 16 | |
| Day Laborer | 6 | |
| Shift Laborer (reliever) | 8 | |
| Recovery Plant | | |
| Recovery Plant Operator | 4 | |
| Reagent Operator | 4 | |
| Refiner | 2 | |
| Refining Helper | 2 | |
| Process Maintenance | | |
| Mechanic I | 12 | |
| Planner | 1 | |
| Mechanic II | 10 | |
| Electrician | 5 | |
| Instrumentation Technician | 2 | |
| Subtotal Process | 120 | |
| | | |
| LABORATORY | | |
| Chief Assayer | 1 | |
| Assayers | 4 | |
| Lab Technician | 4 | |
| Sample Preparation Labor | 8 | |
| Subtotal Laboratory | 17 | |
| TOTALPROCESS & LABORATORY | 137 | |
| | |
| November 2012 | Shahuindo Project | 351 |
| |
|
MINE DEVELOPMENT ASSOCIATES
|
Salaried Employees. All salaried employees are expected to be Peruvian nationals, most of which will be recruited from the nation at large. It is not expected that many local personnel will have the initial experience to fill the salaried and supervisory positions.
Hourly Employees. The hourly employees are budgeted to come from the local towns and villages. Estimates of wages are based on standard work weeks and include overtime provisions.
For the purposes of operating cost estimation by area, the power consumption used in a given section has been estimated based on installed power that has been factored for the operating schedule, availability, operating utilization, and load factor.
The unit cost of power has been estimated to be US$ 0.07/kWh for the Shahuindo Project based on Sulliden’s opportunity to buy energy in blocks and form a long term contract.
Total kilowatt-hours of electricity consumed each year will vary depending on the type of ore processed. An average annual electrical consumption based on the life of mine is estimated to be approximately 27.0 million kilowatt-hours per year.
The total average power consumption is estimated to be approximately 6.53 kWh/tonne of ore for Year 1, 6.89 kWh/tonne of ore for Years 2 and 3, and 7.84 kWh/tonne ore for Years 4 through the life of the project. Increases in the average power consumption per tonne of ore in Years 2 and 4 are a result of the addition of evaporators, a water treatment system, grasshopper conveyors, and the addition of barren solution booster pumps. The average life of mine power consumption is estimated to be 7.39 kWh/tonne ore. The average power cost is estimated to be US$ 0.517 per tonne ore for the life of the project. The maximum attached power is estimated to be about 6.53 MW for the project. Power requirements are presented in Table 21-16.
| | |
| November 2012 | Shahuindo Project | 352 |
| |
|
MINE DEVELOPMENT ASSOCIATES
|
| |
| Table 21-16 | Process Power and Consumption – By Year |
| | | | | | | | |
| Year 1 | Year 2 & 3 | Year 4 & On |
| Attached | Average | | Attached | Average | | Attached | Average | |
| Power | Demand | kWh/t Ore | Power | Demand | kWh/t Ore | Power | Demand | kWh/t Ore |
| (kW) | (kW) | | (kW) | (kW) | | (kW) | (kW) | |
| 5,260 | 2744 | 6.53 | 5,638 | 2915 | 6.89 | 6,534 | 3461 | 7.84 |
Operating supply requirements have been estimated based upon unit costs and consumption, where possible, and have been broken down by area. In the sections below the assumptions and unit costs associated with the development of the operating costs are presented. All freight costs have been included. Reagent consumptions are derived from test work performed by KCA and from the Design Criteria. Other costs were estimated from past KCA experience with similar operations. Table 21-17 shows the consumption of major consumables.
| | |
| November 2012 | Shahuindo Project | 353 |
| |
|
MINE DEVELOPMENT ASSOCIATES
|
| |
| Table 21-17 | Process Consumable Items |
| | | |
| Item | Form | Storage Capacity | Annual Consumption |
Cement - Portland Type
II | Bulk | 120 t | 21,900 t |
| Sodium Cyanide (98%) | Briquettes - 1000 kg
Supersacks | 60 t | 987 t |
| Activated Carbon | 500 kg Supersacks | 12 t | 48 t avg (62 t to 40 t)* |
| Diesel | Bulk Delivery Truck | 20 m3Process | 1,150 m3avg Process* |
| Antiscalant | Liquid Tote 1 m3Bins | 7 m3 | 47 m3 |
| Hydrochloric Acid (32%) | Liquid Tote Bins | 20 m3 | 256 m3avg (311 m3to 201 m3)* |
| Sodium Hydroxide | Dry Solid Sacks | 3 t | 23 t avg (28 t to 18 t)* |
| Silica | Dry Solid Sacks | 1 t | 5 t avg (7 t to 3 t)* |
| Borax | Dry Solid Sacks | 1 t | 8 t avg (11 t to 5 t)* |
| Soda Ash | Dry Solid Sacks | 1 t | 4 t avg (5 t to 3 t)* |
| Niter | Dry Solid Sacks | 1 t | 3 t avg (4 t to 2 t)* |
Hydrogen Peroxide
(50%) | Liquid Tote 1 m3Bins | 20 t | N/A |
| Copper Sulfate | 1000 kg Supersacks | 1 t | N/A |
| Sulfuric Acid (94%) | Liquid Tote 1 m3Bins | 20 t | N/A |
| Crusher Liners | Mn Steel | 1 set/crusher | 6 sets/crusher |
| * Varies with gold/silver head grade and elution cycles required | |
Operating costs for these items have been distributed based on tonnage and gold production, or smelting batches, as appropriate.
Crusher Liners. In general, there is a high variability among the ore with respect to abrasion. Overall the ore abrasion is average to lower than average with an expected wear rate of 0.17 kg/t. Based on this the liner wear projection is as follows:
Heap Leach Consumables.
Pipes, Fittings, and Emitters- The heap pipe costs include expenses for broken pipe, fittings and valves and abandoned tubing. The heap pipe cost was estimated to be US$ 0.03/t ore, and was based on previous detailed studies conducted by KCA on similar projects.
| | |
| November 2012 | Shahuindo Project | 354 |
| |
|
MINE DEVELOPMENT ASSOCIATES
|
Cement- The unit consumption of cement is expected to be 6 kg/t (average) for the Shahuindo ores.
Cyanide- Sodium cyanide consumption was estimated to average 0.27 kg/t based on metallurgical test work evaluations. A delivered price of US$ 4.10/kg was used based on suppliers’ quote.
Antiscale Agent (Scale Inhibitor)- Antiscale consumption was based on a dosage range of 0 to 20 ppm to the suctions of the barren pumps returning solution back to the heap. A delivered price of US$ 2.41/kg was used based on a supplier’s quote.
Process Consumables.
Carbon- Carbon used for adsorption of gold from the pregnant solution is estimated to average 50,800 kg/a, at a cost of US$ 3.11/kg. Carbon consumption is assumed to be 3% of the carbon stripped per year and varies based on metal production.
Caustic Soda (NaOH)- Caustic NaOH consumption for the ADR circuit is estimated to be 22,800 kg/a. The supply cost of caustic is US$ 1.18/kg. Caustic consumption is calculated based on the number of strips per year and varies based on metal production. The calculation assumes a 1% caustic strip solution and that one third of the solution is discarded each strip.
Hydrochloric Acid- Hydrochloric acid consumption for the ADR circuit is estimated to be 255,400 L/a. Hydrochloric acid for the carbon acid wash circuit is supplied at a cost of US$ 1.16/L. Hydrochloric acid consumption is based on 150 liters of acid per strip and varies based on metal production.
Smelting Fluxes- It has been estimated that 0.075 kg of mixed fluxes per troy ounce of precious metal produced will be required. The estimated delivered cost of these fluxes, which includes borax, silica, niter, and soda ash, is US$ 1.5/kg, which is based on data from similar previous KCA projects.
Laboratory. Fire assaying and solution assaying of samples will be conducted in the on-site laboratory. It is estimated that approximately 175 solids assays at US$ 5/assay and 250 solutions assays at US$ 1.50/assay will need to be performed each day.
Fuel. Diesel fuel will be required for heavy equipment operation, vehicles, stripping and for smelting operations, and has been quoted at US$ 1.104/L.
| | |
| November 2012 | Shahuindo Project | 355 |
|
| MINE DEVELOPMENT ASSOCIATES |
Mobile Equipment includes the cost for diesel fuel in the hourly operating cost for these units.
Average annual diesel consumption is estimated to be 1,150 m3for the process and 7,000 m3for the mine.
Numerous pieces of support equipment are required for the processing area of the project. These include light vehicles, maintenance trucks, a flatbed truck, Bobcat Loader, forklifts, a 75 ton crane, a boom truck, a dozer, and a front loader (included in the mine operating costs). The costs to operate and maintain each of these pieces of equipment has been estimated using, where possible, data sheet information. Otherwise, allowances have been made based upon experience in similar operations.
Support equipment annual operating costs have been estimated to average $417,000 per year, or $0.11 per tonne of ore.
| | |
| November 2012 | Shahuindo Project | 356 |
| |
|
MINE DEVELOPMENT ASSOCIATES
|
The maintenance and supply costs used in the study are factored from data obtained from other operations, as applicable. Operating costs for these items have been distributed based on ore type, tonnage, gold production from ore types, or smelting batches as appropriate. It is likely that the potential for inaccuracy within the overall operating cost estimate is highest in the maintenance supply area.
Maintenance and repair supply costs is estimated to average $0.25 per tonne of ore.
| |
| 21.12 | General Administrative |
General and Administrative labor costs are expected to average about US$ 1.76 per tonne ore. These costs include insurance, office supplies, utilities, legal and accounting services, travel expenses, security, health and safety personnel and supplies, camp operations, bus transportation, community relations, software licenses, network maintenance, etc. The G & A costs were provided by Sulliden and reviewed by KCA. The G & A costs presented in this report are believed to be reasonable for this type of operation.
| | |
| November 2012 | Shahuindo Project | 357 |
| |
|
MINE DEVELOPMENT ASSOCIATES
|
Based on the estimated production parameters, capital costs, and operating costs, a cash flow model was prepared by KCA for the economic analysis of the Shahuindo Project. All of the information used in this economic evaluation has been taken from work completed by KCA and other consultants working on this project as described in previous sections of this report.
The Shahuindo Project economics were evaluated using a discounted cash flow (DCF) method, which measures the Net Present Value (NPV) of future cash flow streams. The final economic model was developed by KCA, with input from Sulliden, using the following assumptions:
Period of Analysis of 16 years (includes two years of pre-production andinvestment), 10.4 years of production, and 3.6 years for closure and reclamation
Three year trailing average (as at August 31, 2012) gold price of US$ 1,415/ozand silver price of US$ 27.00/oz
Processing rate of 10,000 tpd ore
Heap leach recoveries of 86% and 15% for gold and silver, respectively, for oxideore and recoveries of 50% and 15% for gold and silver for the transition ore.
Capital and operating costs used for this model as developed in Section 21 ofthis report.
The project economics based on these criteria from the cash flow model are summarized in Table 22-1.
| | |
| November 2012 | Shahuindo Project | 358 |
| |
|
MINE DEVELOPMENT ASSOCIATES
|
Table 22-1 Life-of-Mine Summary
| |
| Financial Analysis | |
| Internal Rate of Return (IRR), Pre-Tax | 52.2% |
| Internal Rate of Return (IRR), After-Tax | 37.8% |
| Average Annual Cash Flow (Pre-Tax)1 | $ 70.1 M |
| NPV @ 5% (Pre-Tax) | $ 382.9 M |
| Average Annual Cash Flow (After-tax)1,2 | $ 52.1 M |
| NPV @ 5% (After-Tax) | $ 248.6 M |
| Gold Price Assumption (US$/Ounce) | $1,415 |
| Silver Price Assumption (US$/Ounce) | $27 |
| Pay Back Period (Years based on After-tax) | 2.2 Years |
| | |
| Capital Costs (Excluding IGV Tax) | |
| Initial Capital | $ 131.8 M |
| Working Capital and Initial Fills | $ 8.5 M |
| Sustaining Capital (life of mine)3 | $ 47.8 M |
| | |
| Operating Costs (Average Life of Mine) | |
| Mining | $ 5.66/Tonne |
| Processing & Support | $ 4.51/Tonne |
| G&A | $ 1.77/Tonne |
| Total Operating Cost/Tonne Ore4 | $ 11.94/Tonne |
| Cash Operating Costs (per ounce of gold)5 | $ 552/Ounce |
| | |
| Production Data | |
| Life of Mine | 10.4 Years |
| Mine Throughput (Ore) | 3.65 M TPY / 10,000 TPD |
| Metallurgical Recovery Au (Avg) | 85.8% |
| Average Annual Gold Production | 84,500 Ounces |
| Metallurgical Recovery Ag (Avg) | 15% |
| Average Annual Silver Production | 167,200 Ounces |
| Total Gold Produced (AuEq) | 909,500 Ounces |
| Average LOM Strip Ratio (waste:ore) | 1.91:1 |
| Notes: | 1) | Average annual cash flow is defined as the total cash flow generated over the 10.4 years of production divided by 10.4 |
| | 2) | After-tax values calculated using the new royalty and tax regime implemented by the Peruvian Government in October 2011 |
| | 3) | Reclamation, closure, and salvage value are not included in sustaining capital. |
| | 4) | Does not include Au/Ag refining charges or Peruvian government royalty and 8% workers profit sharing |
| | 5) | Silver sales have been treated as an operating cost byproduct credit for the Cash Operating Costs per ounce gold calculation |
| | | |
| | |
| November 2012 | Shahuindo Project | 359 |
| |
|
MINE DEVELOPMENT ASSOCIATES
|
The Shahuindo Project economics are evaluated using a discounted cash flow method. The DCF method requires that annual cash inflows and outflows are projected, from which the resulting net annual cash flows are discounted back to the project evaluation date. Considerations for this analysis include the following:
The cash flow model was prepared by KCA with input from Sulliden Gold Corp.
The cash flow model is based on the MDA mine production schedule which onlyincludes proven and probable reserves.
The period of analysis is 16 years (including 2 years of pre-production andinvestment), 10.4 years of production, and 3.6 years for closure and reclamation.
All cash flow amounts are in US dollars (US$). All costs are considered to be2nd quarter 2012 costs. Inflation is not included in this model.
The Internal Rate of Return (IRR) is calculated as the discount rate that yields azero Net Present Value (NPV).
The NPV is calculated by discounting the annual cash back to Year -2 at differentdiscount rates. All annual cash flows are assumed to occur at the end of eachrespective year.
The Payback Period is the amount of time, in years, required to recover the InitialConstruction Capital cost.
Working Capital and IGV of 18% are considered in this model.
Government royalties and taxes are included in the model.
100% equity financing is assumed.
Reclamation and Closure costs are included.
A summary of the general assumptions for cost inputs, parameters, royalties, and taxes used in the economic analysis are as follows:
| | |
| November 2012 | Shahuindo Project | 360 |
| |
|
MINE DEVELOPMENT ASSOCIATES
|
The gold price of US$ 1,415/oz and silver price of US$ 27/oz are used as thebase case commodity prices. These are the three year trailing average prices asof the end of August 2012, rounded to the nearest dollar.
Silver sales values are treated as a by-product credit for the calculation ofaverage operating cash cost per ounce of gold
Gold/silver production and revenue in the model are delayed 1.5 months from thetime ore is stacked. This delay reflects the time required to recover gold from theheap.
The Capital Cost for the project construction is mostly spent in the first two yearsof development (Years -2 and -1) with all of the initial capital being spent in theseyears. Sustaining capital for replacement of mining/surface vehicles andequipment is included annually. In Year 3 of production, sustaining capital isspent for expansion of the heap leach pad and associated facilities.
Depreciation allowance is applied to the economic model.
The Peruvian value added tax of 18% (IGV) is included in this cash flow analysisduring pre-production and Year 1. IGV reimbursements are delayed by 90 days(3 months) and this delay is reflected in the cash flow during the pre-productionperiod. IGV will be owed on the import of goods, construction contracts, andpurchase of any goods or services in Peru during both construction andoperation of the project. The IGV taxes paid during the exploration phase (preyear -2), construction phase and over the life of the mine are recoverable.
Beginning in Year 1, IGV to be paid during production operations is assumed tobe equal to IGV refunded, so the net effect is zero.
There is a sliding scale for government royalties of gold and silver in Peru. Thereis also a sliding scale Special Mining Tax (SMT) tax that applies to gold andsilver. Both sliding scales are calculated based on production and operatingprofits. For the base case, the government royalty and SMT are 1.92% and1.76% as a percent of sales, respectively.
The Peruvian income tax rate of 30% is included in the model.
Cash operating costs per ounce represent the mine site operating costs such asmining, processing, metal transport, refining, administration, governmentimposed royalties and government imposed 8% worker’s profit sharing, net ofsilver by-product sales revenue and are exclusive of amortization, reclamation,capital, and exploration and development costs. Due to the inclusion of royaltiesand the 8% workers profit sharing in cash costs per ounce, cash costs increase
| | |
| November 2012 | Shahuindo Project | 361 |
| |
|
MINE DEVELOPMENT ASSOCIATES
|
or decrease as the price of gold fluctuates up or down regardless of whether allother costs remained fixed.
Other taxes may be payable by the project which include property tax, municipaltaxes, stamp tax, mining license fees, etc. These taxes are considered to berelatively minor and are included in the project G&A operating costs.
The cash flow analysis evaluated the project on a stand-alone basis as aPeruvian project. Only Peruvian royalty and tax liabilities have been considered.
No withholding taxes (stamp tax) for payment of dividends are included. Nocorporate costs are included for head office overheads of the parent company inCanada.
| |
| 22.4 | Capital Cost Estimates |
The capital costs are outlined in Section 21 of this report. The mining costs were estimated by MDA. All process and infrastructure costs were estimated by KCA.
The initial project capital cost and sustaining capital requirements are summarized in Table 22-3.
| | |
| November 2012 | Shahuindo Project | 362 |
| |
|
MINE DEVELOPMENT ASSOCIATES
|
| |
| Table 22-2 | Capital Cost to Completion |
| | |
| Capital Area | Capital Cost * |
| Mine Development | $6,167,000 | |
| Mine Equipment | $26,169,000 | |
| | | |
| Major Earthworks | $19,070,000 | |
| Liner, GCL & Miscellaneous | $3,552,000 | |
| Civils (Supply & Install) | $1,269,000 | |
| Structural Steelwork (Supply & Install) | $300,000 | |
| Platework (Supply & Install) | $990,000 | |
| Mechanical Equipment | $26,631,000 | |
| Piping | $2,491,000 | |
| Electrical | $6,364,000 | |
| Instrumentation | $450,000 | |
| Commissioning and Supervision | $949,000 | |
| Infrastructure | $4,961,000 | |
| Spare Parts | $1,943,000 | |
| Contingency | $11,431,000 | |
| Subtotal | $112,737,000 | |
| EPCM | $8,388,000 | |
| Indirect & Owners Costs | $10,718,000 | |
| Initial Fills | $903,000 | |
| Subtotal | $20,009,000 | |
| Pre-production Total | $132,746,000 | |
| Working Capital (60 days) | $7,637,000 | |
| Total Sustaining Capital | $47,789,000 | |
| LOM Total Capital Cost (excluding IGV) | $188,172,000 | |
| | | |
| IGV (recovered during Yrs -2, -1 and Yr 1) | $25,269,000 | |
* Note: Costs rounded to nearest US$ 1,000. | | |
The recoveries of working capital and salvage value are included in the cash flow model, but have not been included with the capital costs shown above.
| |
| 22.5 | Operating Cost Estimates |
Operating costs were estimated by KCA for all process and support areas. G&A costs were provided by Sulliden with input from KCA. Mining costs were estimated by MDA. Table 22-3 below provides a summary of the project costs. Table 22-1 presented earlier shows the operating cost per ounce of gold.
| | |
| November 2012 | Shahuindo Project | 363 |
| |
|
MINE DEVELOPMENT ASSOCIATES
|
| |
| Table 22-3 | LOM Operating and G&A Costs |
| | | |
| | Description | LOM Cost (USD / t ore) | |
| | Mine * | $5.66 | |
| | Process | $4.08 | |
| | Support Services | $0.44 | |
| | Site G & A | $1.76 | |
| | Total | $11.94 | |
| | * Note: | Mine operating cost does not include pre-production mining costs | |
| |
| 22.6 | Financial Model and Cash Flow |
A discounted cash flow (DCF) method was used to evaluate the economics of the Shahuindo Project. The DCF method measures the Net Present Value (NPV) of future cash flow streams. This financial model has been developed by KCA with input from Sulliden. Table 22-4 shows the key financial parameters derived from the cash flow analysis. Table 22-5 presents the cash flows.
| | |
| November 2012 | Shahuindo Project | 364 |
| |
|
MINE DEVELOPMENT ASSOCIATES
|
| |
| Table 22-4 | Key Financial Parameters |
| | |
| Au price | 1415 | $/oz |
| Ag price | 27 | $/oz |
| Au RecoveryOXIDE | 86 | % |
| Au RecoveryMIXED | 50 | % |
| Ag RecoveryOXIDE | 15 | % |
| Ag RecoveryMIXED | 15 | % |
| Ag to Au Ratio | 52.4 | oz Ag/Oz Au |
| Treatment rate | 10,000 | t/d |
| | | |
| Refining cost Au | 5.5 | $/oz |
| Refining cost Ag | 0.57 | $/oz |
| Payable factor (Au and Ag) | 99.5 | % |
| | | |
| Peruvian tax rate | 30 | % |
| IGV Rebate (from prior G&A and Exploration) | 12,000,000 | $ |
| | | |
| Pre-Tax NPV | i, % | Post-Tax NPV |
| $572,250,770 | 0 | $385,512,669 |
| $382,916,181 | 5 | $248,612,213 |
| $303,435,901 | 8 | $191,591,519 |
| $260,529,220 | 10 | $363,751,273 |
| $179,046,363 | 15 | $158,580,779 |
| 52.2% | IRR | 37.8% |
| | | |
| Annual Au oz (avg) | 84,476 | |
| Total Au oz payable | 872,000 | (Rounded to nearest 100 oz) |
| Annual Ag oz (avg) | 167,150 | |
| Total Ag oz payable | 1,725,000 | (Rounded to nearest 1,000 oz) |
| | | |
| Cost/oz Au, $ before royalties | 523.48 | (with Ag sales as Op cost byproduct credit) |
| Cost/oz Au, $ after royalties | 551.52 | (with Ag sales as Op cost byproduct credit) |
| | | |
| Annual eAu oz (avg) | 87,665 | |
| Total eAu oz produced/payable | 909,500 | (Rounded to nearest 100 oz) |
| | | |
| Mine life | 10.4 | years |
| Payback | 2.2 | years |
| Total government royalty paid | $24,572,000 | (Rounded to nearest US$ 1,000) |
| Total SMT tax paid | $22,522,000 | (Rounded to nearest US$ 1,000) |
| | |
| November 2012 | Shahuindo Project | 365 |
| |
|
MINE DEVELOPMENT ASSOCIATES
|
| |
| Table 22-5 | Cash Flow Analysis |
| | | | | | | | | | | | | | | | | | |
| ITEM | | Year -2 | Year -1 | Year 1 | Year 2 | Year 3 | Year 4 | Year 5 | Year 6 | Year 7 | Year 8 | Year 9 | Year 10 | Year 11 | Year 12 | Year 13 | Year 14 | TOTAL |
| TOTAL MINED | | | | | | | | | | | | | | | | | | |
| Pit to Stockpile, MT | | | 792.24 | 910.82 | 1137.25 | 1782.83 | 2416.87 | 2455.76 | 3220.40 | 2001.76 | 833.78 | 0.00 | 0.00 | 0.00 | | | | 15551.71 |
| | Au, g/t | | 0.82 | 0.39 | 0.37 | 0.37 | 0.37 | 0.35 | 0.35 | 0.35 | 0.35 | 0.55 | 0.00 | 0.00 | | | | 0.39 |
| | Ag, g/t | | 15.29 | 5.38 | 5.13 | 6.18 | 5.06 | 5.11 | 5.09 | 4.92 | 6.52 | 16.80 | 0.00 | 0.00 | | | | 5.81 |
| contained Au, koz | | 20.90 | 11.43 | 13.44 | 21.15 | 29.10 | 27.77 | 36.58 | 22.83 | 9.47 | 0.00 | 0.00 | 0.00 | | | | 192.66 |
| contained Ag, koz | | 389.60 | 157.55 | 187.56 | 354.05 | 393.27 | 403.39 | 527.58 | 316.50 | 174.86 | 0.00 | 0.00 | 0.00 | | | | 2904.37 |
| Pit to Crusher, Mt | | | | 2394.64 | 2116.17 | 2652.52 | 3083.58 | 1987.28 | 2007.65 | 1658.24 | 2392.44 | 3650.00 | 352.45 | 0.00 | | | | 22294.97 |
| | | | | | | | | | | | | | | | | | | |
| | Au, g/t | | | 1.20 | 1.47 | 1.33 | 1.30 | 1.11 | 1.17 | 1.59 | 1.04 | 0.63 | 0.82 | 0.00 | | | | 1.16 |
| | Ag, g/t | | | 13.76 | 14.21 | 17.61 | 9.23 | 10.51 | 9.44 | 13.55 | 10.38 | 10.67 | 14.12 | 0.00 | | | | 12.08 |
| contained Au, koz | | | 92.57 | 99.88 | 113.55 | 129.14 | 70.83 | 75.83 | 84.64 | 79.99 | 73.48 | 9.27 | | | | | 829.18 |
| contained Ag, koz | | | 1059.71 | 966.96 | 1502.13 | 914.69 | 671.47 | 609.61 | 722.69 | 798.32 | 1252.20 | 159.96 | | | | | 8657.73 |
| | | | | | | | | | | | | | | | | | |
| Pit to Dumps | | | 2516.99 | 8586.71 | 9681.98 | 8193.47 | 9169.62 | 11473.77 | 10827.60 | 4277.25 | 4788.30 | 2640.83 | 110.74 | 0.00 | | | | 72267.27 |
| Total Mined | | | 3309.23 | 11892.17 | 12935.40 | 12628.81 | 14670.08 | 15916.81 | 16055.65 | 7937.25 | 8014.52 | 6290.83 | 463.19 | 0.00 | | | | 110113.94 |
| Strip Ratio | | | 3.18 | 2.60 | 2.98 | 1.85 | 1.67 | 2.58 | 2.07 | 1.17 | 1.48 | 0.72 | 0.31 | | | | | 1.91 |
| | | | | | | | | | | | | | | | | | |
| Stockpile to Crusher, Mt | | | | 1255.36 | 1493.02 | 1007.48 | 566.42 | 1662.72 | 1642.35 | 2001.76 | 1257.56 | 0.00 | 3297.56 | 1367.49 | | | | 15551.71 |
| | Au, g/t | | | 0.67 | 0.37 | 0.37 | 0.38 | 0.37 | 0.36 | 0.36 | 0.36 | 0.00 | 0.36 | 0.36 | | | | 0.35 |
| | Ag, g/t | | | 11.72 | 5.18 | 6.68 | 5.30 | 5.19 | 5.16 | 5.10 | 5.31 | 0.00 | 5.31 | 5.31 | | | | 5.30 |
| contained Au, koz | | | 27.03 | 17.92 | 12.03 | 6.85 | 19.53 | | 23.15 | 14.52 | | 38.07 | 15.79 | | | | 174.90 |
| contained Ag, koz | | | 473.18 | 248.49 | 216.44 | 96.53 | 277.47 | | 328.34 | 214.61 | | 562.74 | 233.37 | | | | 2651.16 |
| | | | | | | | | | | | | | | | | | |
| CRUSHER FEED | | | | | | | | | | | | | | | | | | |
| Ore Processed to Heap Leach OXIDE | | | | 3,621.53 | 3,543.35 | 3,569.65 | 3,648.81 | 3,648.63 | 3,649.29 | 3,658.88 | 3,642.80 | 3,593.33 | 3,645.68 | 1,366.57 | | | | |
| Ore Processed to Heap Leach MIXED | | | | 28.47 | 65.83 | 90.35 | 1.19 | 1.37 | 0.71 | 1.12 | 7.20 | 56.67 | 4.32 | 0.92 | | | | |
| Au grade to Heap Leach | OXIDE | | | 1.02 | 1.02 | 1.08 | 1.16 | 0.77 | 0.81 | 0.91 | 0.80 | 0.62 | 0.40 | 0.36 | | | | |
| Ag grade to Heap Leach | OXIDE | | | 13.05 | 10.46 | 14.53 | 8.61 | 8.07 | 7.50 | 8.91 | 8.46 | 10.41 | 6.10 | 5.27 | | | | |
| Au grade to Heap Leach | MIXED | | | 0.71 | 0.82 | 0.55 | 0.34 | 0.34 | 0.34 | 0.36 | 2.71 | 0.89 | 0.39 | 0.37 | | | | |
| Ag grade to Heap Leach | MIXED | | | 11.60 | 10.26 | 17.10 | 10.00 | 10.00 | 10.00 | 6.90 | 88.36 | 26.90 | 28.55 | 5.81 | | | | |
| | | | | | | | | | | | | | | | | | |
| Total Ore Processed, kt | | | | 3,650.00 | 3,609.18 | 3,660.00 | 3,650.00 | 3,650.00 | 3,650.00 | 3,660.00 | 3,650.00 | 3,650.00 | 3,650.00 | 1,367.49 | | | | 37,846.67 |
| | Au, g/t | | | 1.02 | 1.01 | 1.07 | 1.16 | 0.77 | 0.81 | 0.91 | 0.80 | 0.63 | 0.40 | 0.36 | | | | 0.84 |
| | Ag, g/t | | | 13.03 | 10.46 | 14.59 | 8.61 | 8.07 | 7.50 | 8.91 | 8.62 | 10.67 | 6.13 | 5.27 | | | �� | 9.50 |
| contained Au, kg | | | 3,714.04 | 3,660.04 | 3,903.30 | 4,227.67 | 2,806.43 | 2,946.85 | 3,347.46 | 2,936.17 | 2,285.12 | 1,464.50 | 487.81 | | | | 31,779.38 |
| contained Ag, kg | | | 47,575.49 | 37,749.46 | 53,403.31 | 31,429.18 | 29,454.84 | 27,378.41 | 32,619.52 | 31,457.82 | 38,943.27 | 22,360.39 | 7,209.76 | | | | 359,581.45 |
| | | | | | | | | | | | | | | | | | |
| Recoverable Gold Stacked OXIDE, kg | | | 3,176.69 | 3,101.33 | 3,314.24 | 3,635.44 | 2,413.12 | 2,534.08 | 2,878.46 | 2,508.32 | 1,921.71 | 1,258.01 | 419.22 | | | | 27,160.63 |
| Recoverable Gold Stacked MIXED, kg | | | 10.11 | 26.92 | 24.77 | 0.20 | 0.24 | 0.12 | 0.20 | 9.76 | 25.29 | 0.85 | 0.17 | | | | 98.62 |
| Total Recoverable Gold Stacked, kg | | | 3,186.80 | 3,128.25 | 3,339.01 | 3,635.65 | 2,413.36 | 2,534.21 | 2,878.66 | 2,518.08 | 1,947.00 | 1,258.86 | 419.39 | | | | 27,259.26 |
| Total Recoverable Gold Stacked, koz | | | | 102.46 | 100.58 | 107.35 | 116.89 | 77.59 | 81.48 | 92.55 | 80.96 | 62.60 | 40.47 | 13.48 | | | | 876.41 |
| | | | | | | | | | | | | | | | | | |
| Recoverable Silver Stacked OXIDE, kg | | | 7,086.77 | 5,561.14 | 7,778.70 | 4,712.60 | 4,416.17 | 4,105.70 | 4,891.77 | 4,623.25 | 5,612.83 | 3,335.56 | 1,080.66 | | | | 53,205.15 |
| Recoverable Silver Stacked MIXED, kg | | | 49.55 | 101.28 | 231.79 | 1.78 | 2.06 | 1.06 | 1.16 | 95.42 | 228.66 | 18.50 | 0.80 | | | | 732.07 |
| Total Recoverable Silver Stacked, kg | | | 7,136.32 | 5,662.42 | 8,010.50 | 4,714.38 | 4,418.23 | 4,106.76 | 4,892.93 | 4,718.67 | 5,841.49 | 3,354.06 | 1,081.46 | | | | 53,937.22 |
| Total Recoverable Silver Stacked, koz | | | | 229.44 | 182.05 | 257.54 | 151.57 | 142.05 | 132.04 | 157.31 | 151.71 | 187.81 | 107.84 | 34.77 | | | | 1,734.12 |
| | | | | | | | | | | | | | | | | | |
| Months recovery delay lag time | | | | 1.50 | 1.50 | 1.50 | 1.50 | 1.50 | 1.50 | 1.50 | 1.50 | 1.50 | 1.50 | 1.50 | | | | |
| Total Gold Produced Profile, oz | | | 89,651 | 100,811 | 106,505 | 115,697 | 82,503 | 80,991 | 91,167 | 82,407 | 64,892 | 43,239 | 18,543 | | | | 876,405 |
| Total Silver Produced Profile, oz | | | 200,758 | 187,974 | 248,107 | 164,817 | 143,239 | 133,287 | 154,152 | 152,409 | 183,296 | 117,832 | 48,249 | | | | 1,734,122 |
| | | | | | | | | | | | | | | | | | |
| TOTAL EQUIVALENT Au oz PRODUCED | | | 93,481 | 104,398 | 111,239 | 118,842 | 85,237 | 83,534 | 94,108 | 85,315 | 68,390 | 45,487 | 19,464 | | | | 909,495 |
| | | | | | | | | | | | | | | | | | |
| gold payable, oz | | | 89,202 | 100,307 | 105,972 | 115,118 | 82,091 | 80,586 | 90,711 | 81,995 | 64,568 | 43,023 | 18,450 | | | | 872,023 |
| silver payable, oz | | | 199,755 | 187,034 | 246,866 | 163,993 | 142,523 | 132,621 | 153,381 | 151,647 | 182,379 | 117,243 | 48,008 | | | | 1,725,451 |
| equivalent Au payable oz | | | 93,014 | 103,876 | 110,683 | 118,247 | 84,810 | 83,117 | 93,638 | 84,889 | 68,048 | 45,260 | 19,366 | | | | 904,947 |
| GROSS REVENUE, $ | | | | $131,614,829 | $146,984,121 | $156,615,862 | $167,320,002 | $120,006,750 | $117,609,946 | $132,497,425 | $120,117,596 | $96,287,980 | $64,042,476 | $27,403,262 | | | | $1,280,500,249 |
| | |
| November 2012 | Shahuindo Project | 366 |
| |
|
MINE DEVELOPMENT ASSOCIATES
|
|
| Cash Flow Analysis (continued) |
| | | | | | | | | | | | | | | | | |
| ITEM | Year -2 | Year -1 | Year 1 | Year 2 | Year 3 | Year 4 | Year 5 | Year 6 | Year 7 | Year 8 | Year 9 | Year 10 | Year 11 | Year 12 | Year 13 | Year 14 | TOTAL |
| OPERATING COSTS | | | | | | | | | | | | | | | | | |
| Mining cost,$ | | | $23,542,847 | $25,232,310 | $23,815,517 | $25,537,507 | $25,917,223 | $26,677,998 | $17,795,161 | $18,285,230 | $15,681,264 | $7,982,802 | $3,893,698 | $0 | $0 | $0 | $214,361,557 |
| Processing cost,$ | | | $16,519,864 | $16,530,483 | $16,763,223 | $16,652,798 | $16,384,445 | $16,363,489 | $16,408,321 | $16,363,493 | $16,363,484 | $16,363,491 | $6,130,653 | $0 | $0 | $0 | $170,843,744 |
| G&A,$ | | | $6,397,710 | $6,452,278 | $6,395,338 | $6,395,338 | $6,414,318 | $6,414,318 | $6,181,813 | $6,169,950 | $6,103,520 | $6,034,718 | $1,585,190 | $747,255 | $747,255 | $747,255 | $66,786,253 |
| Refining costs, Au | | | $490,613 | $551,688 | $582,846 | $633,150 | $451,500 | $443,223 | $498,911 | $450,973 | $355,124 | $236,624 | $101,476 | $0 | $0 | $0 | $4,796,129 |
| Refining costs, Ag | | | $113,860 | $106,610 | $140,714 | $93,476 | $81,238 | $75,594 | $87,427 | $86,439 | $103,956 | $66,828 | $27,365 | $0 | $0 | $0 | $983,507 |
| Government Royalty, $ | | | $2,171,961 | $3,022,487 | $3,748,958 | $4,378,886 | $1,669,764 | $1,632,601 | $3,245,185 | $2,571,274 | $1,531,916 | $532,659 | $66,756 | $0 | $0 | $0 | $24,572,447 |
| TOTAL OPERATING COST, $ | | | $49,236,855 | $51,895,856 | $51,446,595 | $53,691,155 | $50,918,487 | $51,607,223 | $44,216,817 | $43,927,359 | $40,139,265 | $31,217,122 | $11,805,138 | $747,255 | $747,255 | $747,255 | $482,343,636 |
| |
| CAPITAL COSTS | | | | | | | | | | | | | | | | | |
| Mine Development | | $6,167,118 | | | | | | | | | | | | | | | $6,167,118 |
| Mine Equipment | $7,761,172 | $18,407,959 | | | | | | | | | | | | | | | $26,169,131 |
| | | | | | | | | | | | | | | | | | |
| Major Earthworks | $5,005,630 | $14,063,993 | | | | | | | | | | | | | | | $19,069,623 |
| Liner, GCL & Miscellaneous | $177,616 | $3,374,701 | | | | | | | | | | | | | | | $3,552,317 |
| Civils (Supply & Install) | $351,040 | $917,744 | | | | | | | | | | | | | | | $1,268,784 |
| Structural Steelwork (Supply & Install) | | $300,000 | | | | | | | | | | | | | | | $300,000 |
| Platework (Supply & Install) | | $990,073 | | | | | | | | | | | | | | | $990,073 |
| Mechanical Equipment | $1,795,310 | $24,835,913 | | | | | | | | | | | | | | | $26,631,223 |
| Piping | | $2,491,288 | | | | | | | | | | | | | | | $2,491,288 |
| Electrical | $2,014,100 | $4,350,058 | | | | | | | | | | | | | | | $6,364,158 |
| Instrumentation | | $450,225 | | | | | | | | | | | | | | | $450,225 |
| Commissioning and Supervision | | $948,918 | | | | | | | | | | | | | | | $948,918 |
| Infrastructure | $1,106,731 | $3,853,815 | | | | | | | | | | | | | | | $4,960,546 |
| Spare Parts | | $1,942,962 | | | | | | | | | | | | | | | $1,942,962 |
| Contingency | | $11,430,599 | | | | | | | | | | | | | | | $11,430,599 |
| | | | | | | | | | | | | | | | | | |
| EPCM | $1,258,150 | $7,129,516 | | | | | | | | | | | | | | | $8,387,666 |
| Indirects & Owners Costs | $1,607,708 | $9,110,348 | | | | | | | | | | | | | | | $10,718,056 |
| Initial Fills | | $902,819 | | | | | | | | | | | | | | | $902,819 |
| Working Capital (60 days) | | $7,637,272 | | | | | | | | | | | | | | | $7,637,272 |
| | | | | | | | | | | | | | | | | | |
| IGV (total to be Paid) | $3,793,942 | $21,474,958 | | | | | | | | | | | | | | | $25,268,900 |
| IGV Rebate during period (90 day delay) | ($2,845,457) | ($17,054,704) | | | | | | | | | | | | | | | ($19,900,161) |
| | | | | | | | | | | | | | | | | | |
| TOTAL PRE_PRODUCTION CAPITAL | $22,025,943 | $123,725,574 | | | | | | | | | | | | | | | $145,751,517 |
| | | | | | | | | | | | | | | | | | |
| SUSTAINING CAPITAL,$ | | | $8,600,352 | $2,161,302 | $13,254,992 | $10,555,644 | $8,774,845 | $1,433,386 | $964,032 | $1,333,906 | $710,086 | | | | | | $47,788,545 |
| | | | | | | | | | | | | | | | | | |
| IVG Rebate (includes Exploration pre Yr-2) | | | $17,368,739 | | | | | | | | | | | | | | $17,368,739 |
| Reclamation & Closure (On-going & Final) | | | | | | | $455,436 | $66,514 | $66,514 | $66,514 | $66,514 | $66,514 | $4,870,326 | $4,870,326 | $4,870,326 | $2,435,163 | $17,834,150 |
| Working Capital Recovery | | | | | | | | | | | | $4,899,000 | $2,738,272 | | | | $7,637,272 |
| Salvage Value | | | | $4,000 | $135,000 | $228,000 | $1,030,000 | $116,000 | $731,000 | $190,000 | $336,000 | $291,000 | | | $2,097,546 | $2,902,546 | $8,061,093 |
| | | | | | | | | | | | | | | | | | |
| PRE-TAX NET CASH FLOW | | | | | | | | | | | | | | | | | |
| Net cash flow pre-tax, pre employee royalty $ | ($22,025,943) | ($123,725,574) | $91,146,360 | $92,930,963 | $92,049,275 | $103,301,203 | $60,887,981 | $64,618,823 | $87,981,061 | $74,979,817 | $55,708,116 | $37,948,840 | $13,466,070 | ($5,617,581) | ($3,520,035) | ($279,872) | $619,849,505 |
| Royalty to workers at 8% | | | $4,624,887 | $5,730,848 | $6,557,064 | $7,305,935 | $3,887,670 | $3,805,682 | $5,606,485 | $4,773,899 | $3,326,254 | $1,615,706 | $364,304 | $0 | $0 | $0 | $47,598,735 |
| Net cash flow pre-tax less worker royalty, $ | ($22,025,943) | ($123,725,574) | $86,521,473 | $87,200,115 | $85,492,211 | $95,995,268 | $57,000,311 | $60,813,141 | $82,374,577 | $70,205,918 | $52,381,862 | $36,333,134 | $13,101,765 | ($5,617,581) | ($3,520,035) | ($279,872) | $572,250,770 |
| Pre-Tax Cumulative Net Cash Flow,$ | ($22,025,943) | ($145,751,517) | ($59,230,043) | $27,970,072 | $113,462,282 | $209,457,550 | $266,457,861 | $327,271,002 | $409,645,579 | $479,851,497 | $532,233,358 | $568,566,492 | $581,668,258 | $576,050,677 | $572,530,642 | $572,250,770 | |
| |
| AFTER-TAX NET CASH FLOW | | | | | | | | | | | | | | | | | |
| Income and special mining taxes, $ | | | $18,024,328 | $22,518,698 | $25,926,902 | $29,000,183 | $15,064,463 | $14,745,679 | $22,190,360 | $18,788,227 | $12,946,452 | $6,171,049 | $1,361,760 | $0 | $0 | $0 | $186,738,101 |
| After-Tax Net Annual Cash Flow, $ | ($22,025,943) | ($123,725,574) | $68,497,146 | $64,681,417 | $59,565,308 | $66,995,085 | $41,935,848 | $46,067,462 | $60,184,217 | $51,417,691 | $39,435,409 | $30,162,085 | $11,740,006 | ($5,617,581) | ($3,520,035) | ($279,872) | $385,512,669 |
| After-Tax Cumulative Net Cash Flow,$ | ($22,025,943) | ($145,751,517) | ($77,254,371) | ($12,572,954) | $46,992,354 | $113,987,439 | $155,923,287 | $201,990,749 | $262,174,966 | $313,592,657 | $353,028,066 | $383,190,151 | $394,930,156 | $389,312,575 | $385,792,541 | $385,512,669 | |
| |
Avg Operating Cash Cost/oz Au
(Ag sales as OpEx byproduct credit) | | | $540.64 | $521.54 | $482.03 | $488.94 | $617.65 | $639.97 | $501.08 | $541.30 | $593.93 | $686.13 | $586.38 | $0.00 | $0.00 | $0.00 | $551.52 |
| | |
| November 2012 | Shahuindo Project | 367 |
| |
|
MINE DEVELOPMENT ASSOCIATES
|
To estimate the relative strength of the project, base case sensitivity analyses have been completed analyzing the economic sensitivity to several parameters including changes in gold/silver price, capital cost and average operating cash cost per ounce gold. For the purposes of this report, silver sales have been treated as a byproduct operating cost credit in the calculation of the average operating cash cost per ounce gold. The after-tax analysis is presented in Table 22-6. Figures 22-1, 22-2, and 22-3 present graphical representations of the after-tax sensitivities. From these sensitivities it can be seen that the project is robust. The project is most sensitive to gold price, followed by capital cost and operating costs (as expressed by average operating cash cost per ounce gold).
The economic indicators chosen for sensitivity evaluation are the internal rate of return (IRR) and NPV at 0% and 5% discount rates. The results of the sensitivity analysis are presented in tabular and graphical form on the next few pages. This analysis indicates the project is, as most projects are, most sensitive to revenue, that being gold and silver price, ore grade, and/or recoveries.
| |
| Table 22-6 | Sensitivity Analysis |
| | | | | |
| | | | | NPV (in USD 1,000's) |
| | | Variation | IRR (After-Tax) | 0% | 5% |
| Gold/Silver Price (% of Base Case) |
| 85% | | 1202.75 | 28.7% | 273,427 | 168,783 |
| 90% | | 1273.50 | 31.8% | 310,946 | 195,502 |
| 100% | | 1415.00 | 37.8% | 385,513 | 248,612 |
| 110% | | 1556.50 | 43.5% | 459,598 | 301,386 |
| 115% | | 1627.25 | 46.2% | 496,508 | 327,681 |
| | | | | | |
| Cap Cost (% of Base Case) |
| 85% | $ | 123,765,861 | 44.9% | 405,745 | 267,538 |
| 90% | $ | 131,094,413 | 42.3% | 399,004 | 261,231 |
| 100% | $ | 145,751,517 | 37.8% | 385,513 | 248,612 |
| 110% | $ | 160,408,621 | 33.9% | 372,018 | 235,991 |
| 115% | $ | 167,737,173 | 32.2% | 365,269 | 229,679 |
| | | | | | |
| Average Operating Cash Cost/Oz (% of Base Case) | | |
| 85% | $ | 484.53 | 40.6% | 424,064 | 275,712 |
| 90% | $ | 506.79 | 39.7% | 411,281 | 266,727 |
| 100% | $ | 551.52 | 37.8% | 385,513 | 248,612 |
| 110% | $ | 596.47 | 35.8% | 359,521 | 230,343 |
| 115% | $ | 619.06 | 34.8% | 346,421 | 221,135 |
| | |
| November 2012 | Shahuindo Project | 368 |
| |
|
MINE DEVELOPMENT ASSOCIATES
|
| |
| Figure 22-1 | After-Tax IRR vs. Gold Price, Capital Cost, and Operating Cash Cost |
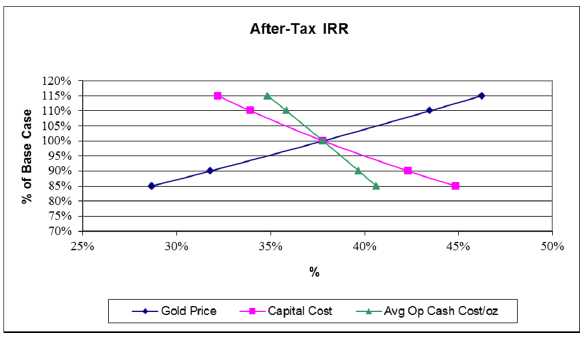
| |
| Figure 22-2 | NPV @ 0% vs. Gold Price, Capital Cost, and Operating Cash Cost |

| | |
| November 2012 | Shahuindo Project | 369 |
| |
|
MINE DEVELOPMENT ASSOCIATES
|
| |
| Figure 22-3 | NPV @ 5% vs. Gold Price, Capital Cost, and Operating Cash Cost |
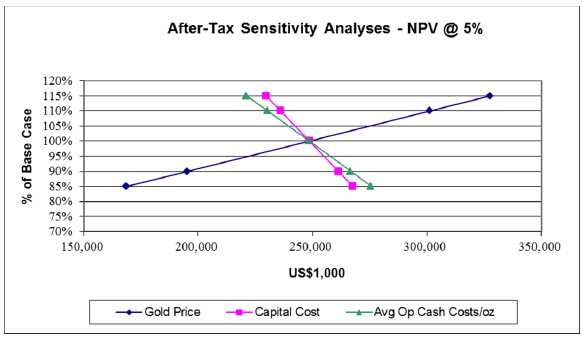
| | |
| November 2012 | Shahuindo Project | 370 |
| |
|
MINE DEVELOPMENT ASSOCIATES
|
KCA and MDA are not aware of any adjacent properties to the Shahuindo Project that would affect the mineral Resources or Reserves.
| | |
| November 2012 | Shahuindo Project | 371 |
| |
|
MINE DEVELOPMENT ASSOCIATES
|
| |
| 24.0 | OTHER RELEVANT DATA AND INFORMATION |
| |
| 24.1.1 | Pit Slope Stability Analysis |
The scope of work for Golder Associates for the pit slope stability analyses was to provide feasibility-Ievel pit slope design recommendations. The work included the following:
Drilling, geotechnical logging, sampling, and laboratory testing of six geotechnicalcore holes
Televiewer surveys of suitable core holes for collection of structural data
Surface geotechnical mapping of sedimentary rocks and porphyry to documentrock characteristics and structural conditions
Point load testing and laboratory index and strength testing on representativesamples of the porphyry and sedimentary rocks
Update the geotechnical model based on the updated geological model,geotechnical investigation, and laboratory testing
Use the updated geotechnical and hydrogeological models as a basis for:
Structural stability analyses of slopes in the porphyry and sedimentary rocks
Rock mass stability analysis of slopes in the porphyry, sedimentary rocks, and debris flow unit
Golder Associates’ personnel from their Reno office visited the site from 15 February to 23 March 2011 to review the latest geological models and conditions with Shahuindo site personnel; evaluate and monitor core drilling procedures; implement and monitor geotechnical core logging, orientation, and sampling procedures; and complete the surface geotechnical mapping. Golder personnel logged the drill core from the geotechnical drilling program and performed the point load testing and collected representative samples for laboratory strength testing.
The information gathered during the field investigation and the proposed pit designs provided by MDA provide the basis for the recommendations by Golder Associates. Details of their investigation are provided in their report (Golder, November 2012).
| | |
| November 2012 | Shahuindo Project | 372 |
| |
|
MINE DEVELOPMENT ASSOCIATES
|
The data from the field and laboratory studies were used to develop an engineering geologic characterization of the deposit that consists of the following main components:
The purpose of this characterization is to define the information required to support the stability analyses. For material and rock mass properties, the characterization is developed in terms of discrete "design" values for these properties. For geological structure, the characterization includes the orientations of major structures; and "design" orientations for discontinuity sets that are considered to occur systematically in a rock mass.
The pit was separated into sectors for stability evaluation purposes as shown in Figure 24-1. Pit slope stability at Shahuindo is expected to be controlled by a combination of low rock mass strength and structural control. Slopes in Sectors A, B, D, and E will be developed in weak rock or soil, and will be limited by the low shear strength of the Soil Units. Slopes in Sectors E and F will be comprised of a larger proportion of competent rock than slopes in the other sectors, and will be subject to structural control, and also possibly to limitations by low rock mass strength depending on the distribution of the Soil Units in the slopes.
The weight of soil and rock creates shear stresses within pit slopes. Pore pressure in the slopes reduces the available effective shear strength of the rock and soil mass. If the shear stresses are greater than the available effective shear strength along potential failure surfaces, the pit slope will become unstable. The likelihood for pit slope instability due to shear through the soil and rock mass was evaluated. Recommended minimum Factors of Safety (FOS) for design of non-critical slopes are on the order of 1.2, and up to 1.5 for slopes containing critical facilities and access ramps.
Because Ausenco's hydrogeology investigation was in progress during this investigation and groundwater conditions had not yet been well-characterized, initial rock mass stability analyses consisted of constructing slope height vs. slope angle charts that used Ru factors to represent various groundwater conditions. MDA designed the final pit using Golder Associates’ slope design recommendations, which are based on these
| | |
| November 2012 | Shahuindo Project | 373 |
| |
|
MINE DEVELOPMENT ASSOCIATES
|
"generic" analyses. Upon completion of the hydrogeology investigation, which included a dewatering plan, additional rock mass stability analyses were run on stability sections drawn through the final pit slopes to verify adequate FOS. The stability sections included phreatic surfaces produced by Ausenco using their groundwater modeling program.
Based on the initial Golder Associates slope design recommendations, the pit slopes and ramps utilized in the mine design by MDA are summarized below.
| | | | | | | | | | |
| | Sector | |
| | A | B | C | D-South | D-North | E | F-South | F-North | G | |
| Height Between Catch Benches | 8.0 | 8.0 | 16.0 | 8.0 | 8.0 | 8.0 | 16.0 | 16.0 | 8.0 | meters |
| Bench Face Angle | 63.0 | 63.0 | 63.0 | 63.0 | 63.0 | 63.0 | 63.0 | 63.0 | 63.0 | degrees |
| Catch Bench Width | 10.3 | 8.3 | 10.3 | 10.3 | 10.3 | 8.3 | 13.9 | 10.3 | 8.3 | meters |
| Inner-Ramp Angle | 29.0 | 33.0 | 41.0 | 29.0 | 29.0 | 33.0 | 36.0 | 41.0 | 33.0 | degrees |
| |
| Figure 24-1 | Pit Slope Stability Sectors and Section Locations |
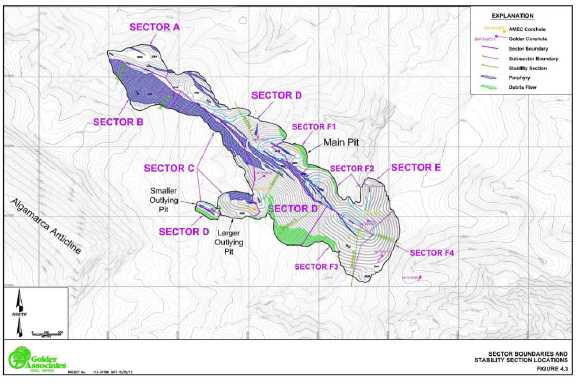
| | |
| November 2012 | Shahuindo Project | 374 |
| |
|
MINE DEVELOPMENT ASSOCIATES
|
| |
| 24.1.2 | Heap Leach Facilities Geotechnical |
The heap leach facilities incorporate the Crushing Area, Water Pond, Process Plant, Leach Pad and Excess Solution Pond. Ausenco conducted various calculations, along with laboratory test work, on carrying capacities and ground settling for these facilities based on the general location arrangements provided by KCA.
The results provided by Ausenco are as follows:
Crushing Area
Field of research has determined that the area has a floor covering up to 0.50 m thick, consisting of soft organic silt with gravel. The residual soil consists of clay with sand and /or sandy clay, rigid to hard consistency, damp, brown colored, homogeneous structure and variable thickness up to 12 m.
Given the good capacity of residual soil, the foundation of structures in this area requires a replacement of 3 m (minimum) below the foundation level. The filler material should be structural fill compacted in layers up to 0.30 m. Table 24-1 presents the carrying capacities and ground settling results.
| |
| Table 24-1 | Crushing Area Carrying Capacities and Ground Settling Results |
| | | | | | | |
| Structure | Type of | L | B | Df | q1 | q2 | q3 |
| Foundation | (m) | (m) | (m) | (kPa) | (kPa) | (kPa) |
| Primary Crushing Area | | | | | | | |
| Vibrating Grizzly | Slab | 9.0 | 4.5 | 1.0 | 826.8 | 367.0 | 735.0 |
| Primary Crusher | Slab | 7.0 | 4.2 | 1.0 | 826.7 | 420.0 | 827.0 |
| Transporting chute | Footer | 4.3 | 4.3 | 1.0 | 894.0 | 550.0 | 894.0 |
| Control house & tower | Footer | 4.3 | 4.3 | 1.0 | 894.0 | 550.0 | 894.0 |
| Tower control rock breaker | Footer | 4.5 | 4.5 | 1.0 | 901.9 | 526.0 | 902.0 |
| Secondary Crushing Area | | | | | | | |
| Secondary crushing structure | Slab | 18.5 | 8.0 | 1.0 | 1009.9 | 255.0 | 505.0 |
| Tower control | Slab | 8.0 | 6.0 | 1.0 | 934.0 | 349.0 | 695.0 |
| Stockpile | | | | | | | |
| Reclaim Tunnel | Slab | 43.0 | 6.5 | 1.0 | 899.9 | 271.0 | 540.0 |
| MCP culvert | Slab | 13.5 | 6.5 | 1.0 | 931.6 | 284.0 | 565.0 |
| Take-Up tower | Slab | 8.5 | 7.5 | 1.0 | 1013.1 | 324.0 | 645.0 |
| Consistent parameters for all:Φ(º) = 38; Υ(MN/m3) = 0.024. |
Where:
L (m) = Length of foundation
B (m) = Width of foundation
Df(m) = Depth of foundation
q1(kPa) = Allowable capacity determined by resistance | q2(kPa) = Allowable capacity limited according to 1 " of
settlement
q>3(kPa) = Allowable capacity limited according to 2 " of
settlement
Φ (º) = Friction angle
Υ (MN/m3) = Specific gravity of ground |
|
|
|
|
| | |
| November 2012 | Shahuindo Project | 375 |
| |
|
MINE DEVELOPMENT ASSOCIATES
|
Processing Plant
Field of research has determined that the area has a floor covering up to 0.60 m in thickness, consisting of soft organic silt. The underlying residual soil layer consists of clay with sand and clay with gravel, incorporates a consistency of rigid to hard and of dense compaction, damp, brown colored, homogeneous structure and variable thickness.
It is recommended to place the structural foundations in rock bed, so the soil covering and residual soil must be removed in their entirety. Table 24-2 presents the carrying capacities and ground settling results.
| |
| Table 24-2 | Processing Area Carrying Capacities and Ground Settling Results |
| | | | | | | | |
| Structure | Type of | L | B | Df | q1 | q2 | q3 |
| Foundation | (m) | (m) | (m) | (kPa) | (kPa) | (kPa) |
| ADR Pond Area |
| Carbon Columns | Slab | 10.0 | 0.8 | 1.0 | 428.2 | 428.2 | 428.2 |
| Slab | 10.0 | 2.0 | 1.0 | 421.2 | 421.2 | 421.2 |
| Carbon Fines Storage Tank | Slab | 2.0 | 2.0 | 1.0 | 526.9 | 526.9 | 526.9 |
| Slab | 4.0 | 2.0 | 1.0 | 460.9 | 460.9 | 460.9 |
Consistent parameters for all:
Φ (º) = 38; Υ (MN/m3) = 0.024. |
|
Where:
L (m) = Length of foundation
B (m) = Width of foundation
Df (m) = Depth of foundation
q1 (kPa) = Allowable capacity determined by
resistance | q2 (kPa) = Allowable capacity limited according to 1 "
of settlement
q3 (kPa) = Allowable capacity limited according to 2 "
of settlement
Φ (º) = Friction angle
Υ (MN/m3) = Specific gravity of ground |
|
|
|
|
|
Water Pond
Field of research has determined that the area has a floor covering up to 0.50 m thick, consisting of soft organic silt. The underlying residual soil layer consists of clay with sand, clay with gravel, sand with clays, and gravel with clays, stiff to hard consistency and dense compaction, damp, brown in color, homogeneous structure and variable thickness not exceeding 2.50 m. The underlying layer consists of quartzite-sandstone rock shale inter-bedded with siltstone.
Placing the structural foundations in rock bed is recommended, so all material and residual soil cover must be removed. Stability analysis is presented in Table
| | |
| November 2012 | Shahuindo Project | 376 |
| |
|
MINE DEVELOPMENT ASSOCIATES
|
24-3. Ausenco has concluded that from the results in Table 24-3 that the proposed slope configuration for the Water Pond is stable.
Heap Leach Pad
Ausenco performed stability analyses of the leach pad configuration proposed by KCA. Slope stability analyses were conducted in 2 sections. Such analyses covered short and long-term stability in both static and pseudo-static conditions, evaluating adequate shear strength parameters for each geotechnical model. Shear strength parameters were obtained through triaxial compression tests conducted in “CU” consolidated un-drained conditions, obtained through the “Geotechnical Engineering and Hydrological Services Feasibility Study, November, 2011”. As part of the design of the geotechnical model, the water table was conservatively assumed to be located 1.0 m below the natural terrain surface. The results of this testing indicate adequate conditions of stability.
The results of these stability analyses indicate factors of safety higher than the minimum value prosed in the design criteria. The minimum factors of safety were established as being 1.5 in static conditions and 1.0 in pseudo-static conditions.
Excess Solution Pond
Field of research has determined that the area is a floor covering up to 0.90 m thick, consisting of soft organic silt. The underlying residual soil layer consists of clay with sand, clay with gravel, sand with clays, and gravel with clays, harsh and rigid consistency with dense compaction, damp, brown in color, homogeneous structure and variable thickness not exceeding 3 m. The underlying layer consists of quartzite-sandstone rock shale inter-bedded with siltstone.
Placing the structural foundations in rock bed is recommended, so all material and residual soil cover must be removed. The stability analysis is presented in Table 24-3. Ausenco has concluded that from the results in Table 24-3 that the proposed slope configuration for the Excess Solution Pond is stable.
| | |
| November 2012 | Shahuindo Project | 377 |
| |
|
MINE DEVELOPMENT ASSOCIATES
|
| |
| Table 24-3 | Water and Excess Solution Ponds Analysis of Stability Results |
| | | | | |
| | | | | Safety Factor |
| Area | Section | Case | Condition | Static | Pseudo- |
| | | | | Static K=0.16 |
| Water Pond | 1-1’ | Circular | Upstream Slope | 1.96 | 1.30 |
| Failure | Downstream Slope | 1.69 | 1.17 |
Excess
Solution Pond | 2-2’
Phase 1 | Circular | Upstream Slope | 1.71 | 1.30 |
| Failure | Downstream Slope | 1.71 | 1.19 |
2-2’
Phase 2 | Circular | Upstream Slope | 2.12 | 1.38 |
| Failure | Downstream Slope | 1.85 | 1.27 |
Ausenco has concluded that from the results in Table 24-3 that the proposed slope configuration for the Water Pond and the Excess Solution Pond is stable.
Ausenco was contracted by Sulliden to conduct the Hydrology Feasibility Study on the Shahuindo Project area. The Shahuindo Project is located, in the district of Cachachi, province of Cajabamba in the north of Perú, approximately 80 Km south of Cajamarca city and 15 Km west of Cajabamba city. The Project area’s topography varies between 2,900 and 3,300 masl.
The Shahuindo Project is an open pit oxide mine, with the main activities oriented towards gold and silver recovery. An approximate service life of 10.4 years for mine operational activities has been estimated based on an approximate resource quantity of 100 mt and a production rate of 10,000 t/day.
This report consolidates the hydrological information necessary for the final conceptualization of the mining operations, developing the analysis of hydrological variables which underpin the results from the water balance and the estimation of the Project’s flows compensation.
The information includes field investigations conducted during different monitoring rounds in 2009, 2010, 2011 and 2012, with an emphasis on the water quantity and quality monitoring of surface and underground water bodies, an inventory of users in the Project area and the identification of the main water uses. It also includes the climatic and meteorological analyses which describe the weather characteristics in the project area, focusing on the precipitation and evaporation patterns for average and extreme
| | |
| November 2012 | Shahuindo Project | 378 |
| |
|
MINE DEVELOPMENT ASSOCIATES
|
conditions with different return periods. The development of the rainfall-runoff model, “abcd” model, which was adjusted to the data available from the surrounded Project area, allows for estimating discharges in the main quebradas that will be altered by the Project facilities.
| |
| 24.2.1 | Field Investigations |
Flow quantity monitoring was conducted on the rivers and quebradas around the Project area in 24 flow monitoring points. The measurements were conducted by Ausenco during monitoring rounds in August 2009, February 2010, November 2010 and March 2011 and by Sulliden in November 2011. The estimated yields from the August 2009 flow monitoring (dry season), were used in the calculation of the base flow of the basins in the Project area. The estimated yield for August 2009 varies between 0.54 and 4.81 L/s/km2, with an average of 1.91 L/s/km2. The estimated yield for the rainy season, (February 2010 and March 2011) varies between 0.60 and 9.17 L/s/km2, with an average of 3.98 L/s/km2.
A total of 24 surface water points, 26 points corresponding to the spring water designated for domestic use (except point SHAP-01 which comes from quebrada), 7 environmental passive points with effluents and 15 underground water points were sampled for water quality monitoring purposes. Additionally, an inventory was taken of 120 springs from which only the field parameters were collected.
The water user inventory received support from local water users. However, despite management activities executed by Sulliden’s social and environmental areas, it was impossible to take into account 100% of the existing surface water samples in the project’s surrounding areas, due to both restricted access in some zones as well as limited coordination with the formal and informal water users associations in the basin. It must be noted that an “in situ” workshop was conducted in every accessible area. The workshop provided information on hydric resources, purpose of the inventory and the monitoring process.
An inventory of springs was conducted in addition to the users’ inventory and water quality monitoring. During the field visit to evaluate water quality, Ausenco identified 31 springs designated for domestic use with intake structures. The field inventory work on water uses conducted in September 2011, resulted in the identification of 105 springs for multi-use without intake structures and 10 springs used for watering agricultural areas, totaling 146 springs distributed in different communities surrounding the Shahuindo Project.
| | |
| November 2012 | Shahuindo Project | 379 |
| |
|
MINE DEVELOPMENT ASSOCIATES
|
| 24.2.2 | Climate and Meteorology |
The climate identified in the Project area varies between dry-temperate to subhumid-cool in accordance with the Thornthwaite classification. The average annual precipitation rate is 900 mm with the highest values recorded between October and April (88% of the annual precipitation) during the rainy season, and the lowest values recorded during the dry season, between May and September (12% of the annual precipitation). The average annual evaporation rate is 1,250 mm. The average annual temperature is estimated at 13.7ºC, a maximum average temperature of 19.9°C and a minimum average temperature of 7.3°C. The relative humidity in the area of study varies between 70% and 84%, while an average relative humidity has been estimated at 78% for the Project’s average altitude (2,900 masl), with the maximum and minimum relative humidity values estimated at 89% and 60%, respectively. The wind speed and direction are obtained from the Cajabamba station, with a result of an annual average speed of 2 m/s. The wind type of greatest frequency in the area is light wind (ventolina) (between 0.6 and 1.8 m/s). Annual records from the Cajabamba station indicate wind flows primarily from the NW. The maximum precipitation in 24 hours is 80 mm, and 93 mm for return periods of 100 and 500 years, respectively.
Hydrographically, the Project area is located in the Condebamba River basin, a tributary on the right bank of the Crisnejas River. The Crisnejas River basin covers an approximate area of 4,909 km2and is a tributary on the left bank of the Marañón River, which, in turn, is located in the hydrographic region of the Amazons on Atlantic. The Condebamba River basin covers an approximate area of 1,936 km2, a main canal length of 90.4 km and flows southeast to north with an average slope of 2.9%. The altitudes of the basin range between 4,600 masl to 2,000 masl at the intersection with the Cajamarca River.
Locally, the area of study is located over micro-basins in the Shingomate, Shahuindo and Higueron quebradas, all tributaries on the left bank of the Condebamba River. The leach pad is located in the Sauce and El Higuerón quebradas (which drain towards the El Pacae quebrada); the waste rock storage facility is located in the Choloque quebrada (which drains towards the Shahuindo quebrada) and the pit is located between the Shahuindo and Higuerón quebradas.
| | |
| November 2012 | Shahuindo Project | 380 |
| |
|
MINE DEVELOPMENT ASSOCIATES
|
The Shahuindo quebrada is formed by the confluence of the San Jose (also called the Chirimayo quebrada) and Choloque quebradas. The basin covers an approximate area of 22.2 km2, with altitudes ranging between 3,650 masl and 2,100 masl at the lowest point. The main axis moves in an eastward direction with an approximate length of 12.2 km and an average slope of 10%
The El Pacae quebrada is formed by the confluence of the El Sauce and Los Merinos quebradas, and subsequently receives contribution from the El Higueron quebrada on the left bank. This basin covers an area of 18 km2, with altitudes that vary from 3,150 masl and 2,100 masl at the lowest point. The main axis moves in a northeast-northwest direction with an approximate length of 9 km and an average slope of 12%.
The El Higuerón quebrada basin covers an area of 4.0 km2, with altitudes that vary from 2,200 masl and 2,900 masl at the highest point. The main axis moves in a northwest-southeast direction with an approximate length of 4.4 km and an average slope of 16%.
Surface flows were indirectly calculated by applying the “abcd” rainfall-runoff model, as there are no hydrometric stations near the Project area. The model parameters were identified based on monthly flow data recorded in the Puente Crisnejas station on the Crisnejas River from 1969 through 1976. The parameters for each stream of interest, the Shahuindo, Higuerón and El Pacae quebradas, were finally adjusted using the flows monitored during the dry season in 2009 and the estimated recharge from the Hydrogeology Feasibility Study (Ausenco, 2012). The flows produced by the model are compatible with the irregular flow regime throughout the year, which strongly depends on seasonal precipitation. Results from the analysis indicate the following:
The average annual runoff coefficients for current conditions are estimated at35%, 27% and 34% for the Shahuindo, Higuerón and El Pacae sub-basins,respectively;
The average annual estimated flow in the Shahuindo quebrada (9.93 km2) forcurrent conditions is 99.2 L/s, and towards the end of the project (4.07 km2),without accounting for replacement flows, is 32.4 L/s. These results indicate anestimated variation in the average annual flow of 67%;
The average annual estimated flow in the Higuerón quebrada (2.02 km2) for thecurrent conditions is 13.8 L/s and towards the end of the project (0.86 km2),without accounting for replacement flows, is 5.1 L/s. These results indicate anestimated variation in the average annual flow of 63%;
| | |
| November 2012 | Shahuindo Project | 381 |
| |
|
MINE DEVELOPMENT ASSOCIATES
|
- The average annual estimated flow in the El Pacae quebrada (7.12 km2) forcurrent conditions is 62.8 L/s and towards the end of the project (5.80 km2),without accounting for replacement flows, is 46.9 L/s. These results indicate anestimated variation in the average annual flow estimated of 25%.
The arrangement of the Project facilities will consequently restrict the availability of the hydric resources designated for different uses by the local populations (for livestock or population), given the decrease in the average flows availability. The Project facilities are primarily located in the Shahuindo, Higuerón and El Pacae sub-basins, in which agricultural and domestic purposes are the main uses of water.
In the above mentioned sub-basins, population water supply sources have been identified for the San Jose, Shahuindo de Araqueda, Chorobamba and Liclipampa Bajo communities. The water supply for agricultural use is supplied from the Shahuindo and El Pacae quebradas,whose flows are diverted to the Shahuindo de Araqueda and Aurelio Garcia/Jesus Rodriguez canals. The replacement flows are estimated for domestic and agricultural supply in order to preserve the current evaluated conditions. Additionally, replacement flow estimates account for the environmental flows in each sub-basin, estimated as a percentage of the average annual flow.
The preliminary evaluation of the total annual replacement flows indicated that 42,416 m3is required for domestic supply; 101,216 m3for agricultural supply and 86,674 m3for environmental flows. The total annual replacement volume is preliminary estimated at 230,306 m3annually.
The inventory of water uses and users has identified the main uses of water from the sources in the Project area as: domestic, agricultural and livestock.
The organizational structure of the agricultural users is determined by the valid regulation maintained by the Crisnejas Local Water Administration (ALA-Crisnejas, as per the Spanish acronym) as the entity responsible for the administration and management of water use in the basins located in the Project area.
The ALA-Crisnejas operates under the Marañón Water Administrative Authority (AAA as per the Spanish acronym) regulations. The agrarian water users within the area of study are represented by the Cajabamba Water Users Board. This board is comprised by 4
| | |
| November 2012 | Shahuindo Project | 382 |
| |
|
MINE DEVELOPMENT ASSOCIATES
|
irrigation committees: Cajabamba, Condebamba, Cachachi and Sitacocha. The Cachachi Irrigation Commission is formed by 54 irrigation committees. In a majority of the cases, there is an irrigation committee for every main canal originating from a surface or underground water source.
Of the 54 irrigation committees, 44 use surface water while the other 10 committees use spring water. There are 30 irrigation committees present in the area of study; the 30 committees form part of the 44 committees using surface water.
The water users for domestic and energy purposes are grouped, depending on the type of water source, in the Water and Sanitation Administration Boards (JAAS as per the Spanish acronym). In accordance with the information provided by ALA-Crisnejas, the Cachachi district had 26 JAAS registered until the year 2009. Only one of these was registered by the local water authority for electrical generation, in the area of study during the same period. Twelve JAAS were for domestic water supply. Only the San Jose Minas Azules JAAS is supplied from a surface water source, while the rest of the JAAS are supplied from springs.
The inventory of surface water use was developed by grouping the hydraulic structures identified based on the water source (river or quebrada). Water is primarily used for irrigation and livestock, except for only one source that is exclusively used for domestic consumption. An inventory was taken of uptakes and canals identified in the water sources, geo-referencing their position, characterizing the hydraulic structure and identifying the state of conservation. For those canals with no flows, the more frequent water level print in the canal was noted.
The inventory of spring use identified 31 springs for population use with catchment structures. Subsequently, 105 multi-use springs without catchment structures and 10 springs for irrigation purposes were identified during the inventory work conducted in September 2011.
Ausenco has conducted water quality monitoring on the water sources in the Shahuindo Project area during 2009, 2010, 2011 and 2012. The presence of informal mining has been identified in the area of study, localized around the mineralized area, in addition to the environmental liabilities corresponding to previous mining activities carried out by Compañía Minera Algamarca. The latter is located mainly along the Cañaris River to the west of the Project.
| | |
| November 2012 | Shahuindo Project | 383 |
| |
|
MINE DEVELOPMENT ASSOCIATES
|
The water quality monitoring points were selected to represent water sources which could be impacted by future mine operations, as well as the local water sources which allow for characterization of the current water quality in the Project area. A total of 24 surface water points, 26 points corresponding to water for domestic use, whose water source is a spring (with the exception of point SHAP-01), 7 environmental liabilities with effluents and 15 underground water points were sampled.
Given the lack of classification of the surface water bodies in the Project area (according to Resolución Jefatural No. 202-2010-ANA), results from the quality monitoring were analyzed and compared to all of the categories included within the Environmental Quality National Standards for Water (ECA as per the Spanish acronym) approved by the Ministry of Environment in July 2008.
The surface waters are characterized by high turbidity levels and pH levels which vary between circumneutral to alkaline, and an electrical conductivity proportional to the quantity of dissolved solids, with an approximate ratio of 0.7 (TDS/Cond).
Likewise, in the case of water designated for domestic use, these are characterized by low to null total suspended solids (TSS) values and pH levels that vary between circumneutral to alkaline, and an electrical conductivity proportional to the quantity of dissolved solids, with an approximate ration of 0.63 (TDS/Cond).
Also, the underground water presents with pH levels that vary from acidic to alkaline, and an electrical conductivity proportional to the quantity of dissolved solids, with an approximate ratio of 0.6 (TDS/Cond).
The conductivity and hardness, increases as the TDS increases, for surface water and water designated for human consumption.
Elevated concentrations of total and dissolved metals were found in the sampled water. Some of these waters currently do not comply with the water quality standards corresponding to the ECA categories: 1-A1 (domestic use), 3 (irrigation and drinking water for animals), and 4 (preservation of aquatic life in lagoons and rivers). These cases include:
| | |
| November 2012 | Shahuindo Project | 384 |
| |
|
MINE DEVELOPMENT ASSOCIATES
|
The high presence of metals in some surface water monitoring points and in riverbed sediments, can be explained by the presence: of tailings, waste, and the pithead upstream of point SH-01, from tailings upstream of point SH-02, from pitheads upstream of points SH-04, SH-06A, SH-12, SH-14, SH-26; from informal mining upstream of points SH-07, SH-08, SH-24; from informal mining and pitheads upstream of points SH-24A, SH-25, from pitheads and effluents from environmental liabilities upstream of points SH-05; and from informal mining, pitheads tailings and waste upstream of points SH-15, SH-16, SH-17.
| |
| 24.3.7 | Water designated for Human Consumption |
Generally, some of the monitoring points of water designated for domestic consumption exceed the ECA’s in aluminum, iron, manganese, phosphorous, copper and zinc, which could be due to the mineralization of the soil.
However, in point SHAP-01, the monitoring point located in a quebrada (surface water), also exceeds the ECA’s in arsenic and lead, which could be due to the presence of intakes and informal mining near this monitoring point.
In general, underground water in some points, exceed the ECAs only in aluminum, iron, manganese, cobalt, nickel, which could be due to mineralization of the soil.
However, points P4 and P-6 exceed ECA category 1-A1 and point P-1A exceeds the ECAs categories 1-A1 and 3 in arsenic.
Ausenco was retained by Sulliden to complete a Hydrogeological Study of Shahuindo.
The Hydrogeology Study was completed in support of a Feasibility Study completed by KCA and an Environmental Study and Impact Assessment (ESIA) completed by Ausenco. The objectives of the Hydrogeology Study consisted of the following:
| | |
| November 2012 | Shahuindo Project | 385 |
| |
|
MINE DEVELOPMENT ASSOCIATES
|
The Shahuindo Project is located within a regional fold and thrust belt of predominantly Mesozoic sedimentary rocks. These sedimentary rocks comprise terrestrial and marine formations of the Lower Cretaceous Goyllarisquiza Group (Reyes Rivera, 1980). Regional stratigraphy is dominated by clastic sediments deposited during the Lower Cretaceous which have been subsequently structurally altered by at least three orogenic episodes (AMEC, 2010). At the project site, the sedimentary rocks have been intruded by intermediate to felsic intrusive rocks at various locations which are generally along the axis of the anticline.
| |
| 24.4.2 | Field Investigation |
A total of nineteen (19) PVC standpipe piezometers were installed for water level monitoring, hydraulic pressure monitoring and water quality sampling (see Figure 24-2). The depth of the piezometers ranged from 41.3 to 248.5 meters below ground level (m bgl). Twelve (12) of the piezometers were designed to monitor true water table elevation and serve as water quality sampling locations across the project area. Eight (8) additional piezometers were designed to monitor deep hydraulic pressure gradients to be used in the groundwater model and for water quality sampling.
Hydraulic permeability tests were conducted in open boreholes before the installation of standpipe piezometers. These tests consisted of Lugeon and Lefranc-type tests during the advancement of HQ diameter DDH boreholes. The calculated geometric mean hydraulic conductivity from the packer tests ranged from 2.56 x 10-03 (Inca Formation) to 4.70 x 10-05 cm/sec (Santa Formation).
As of May 2012, piezometers P-1A, P-1C, P-5, P-13 and P-14 were obstructed. Piezometers P-3A and P-12 were dry (May 2012 groundwater sampling event).
Stand-pipe piezometer P-10 was not installed due to lack of access. This piezometer was to be located downgradient from the heap leach pad.
Ausenco supervised the drilling, installation, development and testing of test well TW-1 in the mine pit area. The test well was installed for the following objectives;
- Determination of aquifer characteristics via conductance of test well pumpingtests;
| | |
| November 2012 | Shahuindo Project | 386 |
| |
|
MINE DEVELOPMENT ASSOCIATES
|
Analysis of the pumping test data for TW-1 indicated a Transmissivity (T) of 3.2 m2/day (K of 5.9 E-5 cm/sec or 0.05 m/d) and Storativity (S) value of 0.0009.
| | |
| November 2012 | Shahuindo Project | 387 |
| |
|
MINE DEVELOPMENT ASSOCIATES
|
| |
| Figure 24-2 | Installed Piezometer Locations |
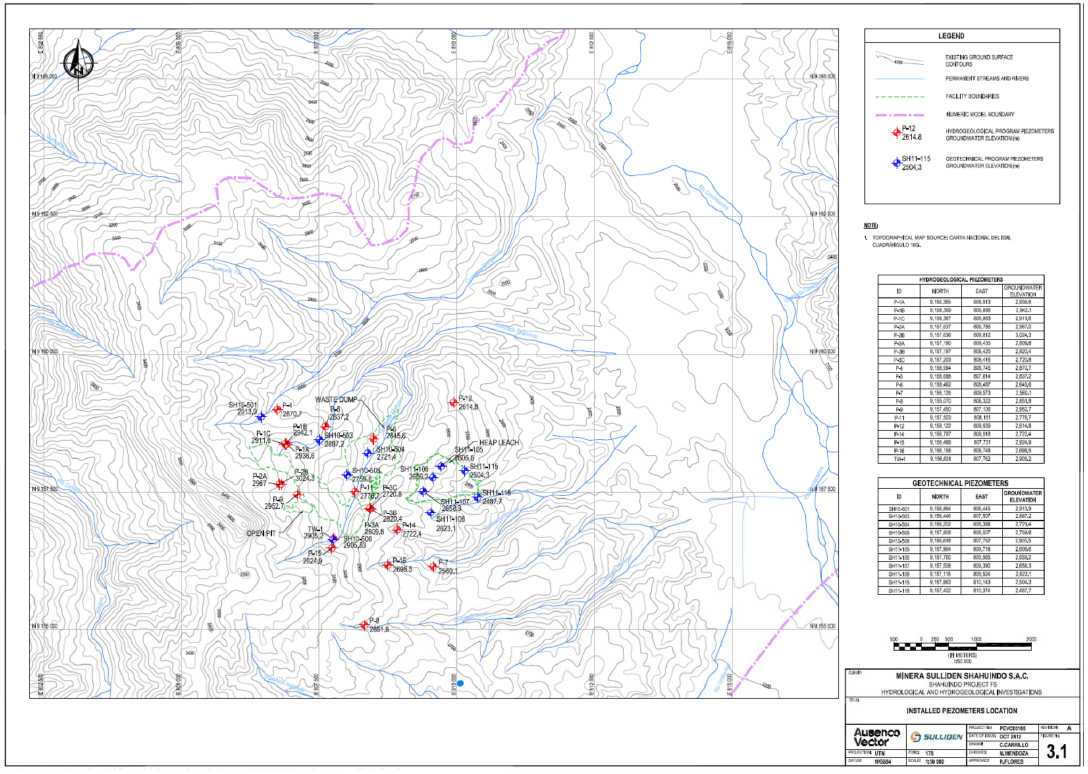
| | |
| November 2012 | Shahuindo Project | 388 |
| |
|
MINE DEVELOPMENT ASSOCIATES
|
| |
| 24.4.3 | Groundwater Modeling |
After completion of the field investigation program, a finite-difference groundwater model was created of the Shahuindo Project study area. The primary objectives of the groundwater flow model were as follows:
Confirm the conceptual hydrogeological model for the study area and to improvethe understanding of the groundwater flow system;
Provide estimates of groundwater inflow during mine operations to facilitate thedevelopment of a preliminary dewatering plan;
Provide estimates of groundwater drawdown around the proposed mine pit andchanges in surface water flows; and
Simulation of potential lake formation in the mine pit after closure.
The Shahuindo groundwater model was formulated and simulated using MODFLOW-SURFACT (HydroGeoLogic, Inc., 2011) and Groundwater Vistas (Rumbaugh & Rumbaugh, 2011), a graphical user interface. Ausenco created a geologic framework model by generalizing existing geologic mapping from the site and from the regional geologic map. Hydrogeologic Units (HGUs) were then grouped together from the regionally mapped formations based on the age, material properties of similar rock types and the distance from the project site. The active model domain encompasses an area of 354 km2 with 178 rows and 196 columns. The model was created with 14 layers, for a total of 488,432 cells.
The steady-state groundwater model was calibrated to represent base-line or pre-mining conditions at the site. Measured groundwater levels from stand-pipe piezometers, groundwater spring elevations and surface water flows were used as targets in the steady-state calibration. Based on review comments provided by Itasca, an independent 3rd party reviewer retained by Sulliden, an alternative steady-state model case was performed to examine the potential changes in model results which would be obtained using the geometric mean hydraulic conductivity value from packer testing conducted in the Santa Formation for hydraulic conductivity Zone 2 in the groundwater model. The alternative steady-state model had worse calibration statistics with a Normalized Residual Mean Square (NRMS) of 7.03% vs. 4.78% for the original steady-state model.
Two (2) transient groundwater flow models were then developed to examine changes to the groundwater flow system that may occur as a result of mine pit excavation and concurrent dewatering and as a result of mine abandonment upon cessation of mining. The transient groundwater model simulates the groundwater system response to pit
| | |
| November 2012 | Shahuindo Project | 389 |
| |
|
MINE DEVELOPMENT ASSOCIATES
|
excavation, provides estimates of mine pit dewatering rates and of potential impacts to base-flow while mining is ongoing. The active mining model employs transient boundary forcing which represents the change in mine pit depth and areal extent over time as the development of the mine progresses. Pit dewatering rates are estimated to range from 1 to 18 L/s on an annual average basis.
Groundwater flux to base-flow or spring-flow is expected to be reduced slightly (1 – 2.2 L/s) during active mining for the quebrada Shahuindo whose upper reaches traverse the proposed mine pit and site location.
Particle pathlines were also calculated for particles originating beneath the proposed waste rock dump and the proposed heap leap pad for use in geochemical modeling. The proposed waste rock dump and heap leach pad locations are situated over quebradas. As a result, the calculated pathlines are relatively short as the toe of each structure (downstream point on steeply-dipping, in-filled quebrada) is generally lower in elevation than the main portion of each structure which lies further uphill along the quebrada centerline. Due to the low calibrated permeabilities, groundwater velocities were low. An average travel time of 80 years was calculated for groundwater to discharge to the quebrada Choloque after traveling from underneath the waste rock dump. An average travel time 30 years was calculated for groundwater to discharge to the quebradas El Higueron or El Sauce after traveling from underneath the heap leach pad.
The second transient groundwater model simulates groundwater system response to mine abandonment, the formation of a pit lake, examines the rate of pit lake formation and provides an estimate of the time period for the recovery of baseflow to approximately pre-mining conditions. A pit lake is expected to form and completely fill within three (3) to twelve (12) years. The primary inflow to the pit lake is expected to be surface water runoff from within the pit footprint and from the larger pit watershed.
To more accurately simulate the seasonal variability of precipitation, evaporation and run-off, and to simulate pit lake geochemistry, additional pit lake modeling was performed in GoldSIM. The results of the pit lake modeling are included in a separate technical memorandum.
Particle pathlines from the pit lake initially travel downwards to layers 10 and 11 and then travel through Zone 3 towards the east-northeast and the Rio Condebamba before moving up to discharge to drain boundaries near the river location. If the average velocity for the steady-state particle from piezometer P-9 (0.085 m/d) is used to calculate
| | |
| November 2012 | Shahuindo Project | 390 |
| |
|
MINE DEVELOPMENT ASSOCIATES
|
a representative travel time from the pit area assuming an 8 km travel distance, the representative travel time would be about 250 years.
| |
| 24.4.4 | Mine Pit Dewatering |
Due to the limitations of available data, Ausenco cautions that the actual amount of interceptor wells, dewatering wells and horizontal drains will most likely deviate from the plan based on field conditions. Monitoring of the hydraulic heads in the pit area, both from VWPs and existing stand-pipe piezometers, plus recorded flow rates from horizontal drains will be key parameters that will actually determine successive well and drain locations during the course of mining. Based on these issues, Ausenco suggests the dewatering plan can initially be optimized as follows:
13 interceptor wells (100 m depth) in the upper section of D;
25 interceptor wells (200 m depth) along the top of the proposed pit wall forGolder Associates’ cross-sections D, E and F;
4 mid-wall dewatering wells (200 m depth) in the pit walls of cross-sections D, Eand F;
22 dewatering wells (200-300 m depth) along the proposed toe of the pit wall forcross-sections C, D, E and F;
21 horizontal drains (200 m depth) in the proposed pit walls of cross-sections Band G; and
504 horizontal drains (300 m depth) in the proposed pit walls of cross-sections C,D, E and G.
Due to the low permeability of the aquifer formation, the interceptor wells and dewatering wells will need to be installed first, before mining operations commence, in order to effectively dewater the proposed pit walls.
| |
| 24.5 | Project Implementation |
The design phase is currently scheduled to start early in January 2013. A majority of the construction is scheduled to start after approval of the EIA and permit approvals, which is currently estimated to happen at the beginning of September 2013. The target date for completion of construction and first gold pour is December 2014.
To meet the schedule, major earthworks must begin in September and construction equipment and crews must be onsite and support tasks such as internal site roads must
| | |
| November 2012 | Shahuindo Project | 391 |
| |
|
MINE DEVELOPMENT ASSOCIATES
|
be started in late August. The EIA documents and other long term permit applications must be submitted in the fourth quarter of 2012 to meet the September issuance of permits. Final design of long lead time items must be completed early on in the design phase.
The project will be developed in a manner similar to most other heap leach projects. Initial design including basic design and long lead time items procurement will be done during the early stages. Detailed engineering and procurement will follow and finally the construction phase will be completed. Details of these activities are discussed in the sections that follow. General comments and critical path items are also presented.
The schedule is based on similar projects that KCA has been involved in and reflects work productivity in similar climate conditions. Optimization, resource sharing, and critical path tasks have not been incorporated into the schedule. In general, the schedule can be described as “somewhat aggressive,” and typically has some slack time built in. The schedule has been developed based on the assumption that all permits have been issued or will be issued and that no delays will occur due to local permitting or social issues.
An important aspect of the project schedule is ordering the major equipment items with long lead times during February to April 2013 and initiating field construction work by late August 2013. The present schedule would have mobilization on-site completed by mid-August with start of crushing by late September 2014. The completion of the upper fresh water storage pond prior to the start of the wet season of 2013 / 2014 is critical to the schedule as this pond will provide water for construction activities and operations.
The detailed design phase of the project is separated into two parts: an initial basic and detailed engineering phase followed by final detailed engineering. The initial design phase of the project will include finalization of:
| | |
| November 2012 | Shahuindo Project | 392 |
| |
|
MINE DEVELOPMENT ASSOCIATES
|
Specifications for long lead time equipment, a logistic study, finalization of site geotechnical work, detailed engineering for the leach pad and ponds, and detailed engineering for common infrastructure items will be completed early in this period. The heap leach facility and fresh water storage system earthworks will be designed to a level with sufficient detail to allow the work to finalize construction equipment requirements. Additionally, design of the power line will be completed in this period.
Final detailed engineering work will progress in areas and disciplines in a similar sequence to the initial design phase. Typically this will include: earthworks, plate work, structural, civil, mechanical, piping, electrical, and instrumentation. Earthworks represent a large portion of the work both during initial construction and during future construction. As such an emphasis will be placed on completion of the earthwork design to facilitate start of the earthworks.
Final drawings for the various disciplines will be required. Some areas such as the crusher, ADR plant, the emergency generator package, and the stacking gear, will be packaged type of contracts. In these types of contracts the vendor will supply detailed design and also will be responsible for a majority of the site work.
Equipment procurement will be a high priority during detailed design as this phase is dependent on equipment selection. This factor is most prevalent in areas where there are multiple disciplines, such as the crushing and ADR circuits. As such, these equipment or equipment packages will be prioritized.
To the greatest extent possible, the required equipment for the project will be sourced within Peru. Shipping times for most of the locally supplied equipment are expected to be less than one week. Imported equipment shipping is expected to vary between 30 to 60 days. A summary of estimated shipping times for major components are presented in Table 24-4.
| | |
| November 2012 | Shahuindo Project | 393 |
| |
|
MINE DEVELOPMENT ASSOCIATES
|
| |
| Table 24-4 | Procurement Lead Times |
| |
| Facility/Equipment | Procurement Lead Time |
| Mine Loaders/Dozers | Six to seven months |
| Mine Haul Trucks | Two to three months |
| Miscellaneous Construction Equipment | Three to four months |
| Substations/Transformers/Power Lines | Eight to ten months |
| Crushing System | Five to six months |
| Conveying/Stacking Equipment | Seven to eight months |
| Process Plant, Process Pumps, Water Pumps | Three to nine months |
| Shop/Warehouse/Miscellaneous Buildings | One to three months |
| Man Camp | One to two months |
| Pad/Pond Liners | Two to three months |
| Laboratory Equipment | Five to six months |
| |
| 24.5.3 | Construction Period |
Construction activities are expected to start in August 2013. It is anticipated that all construction and erection will be done using local or regional Peruvian contractors, and that concrete, aggregate, steel, tankage, building materials and supplies, and pipe can be acquired through local sources. Lining installation will be done by the liner supplier, using his own personnel for installation supervision. A separate quality assurance/quality control (QA/QC) group will provide quality control oversight.
Required construction equipment will be determined and equipment bids will be solicited upon completion of preliminary heap leach, earthwork drainage, roads, and earthwork construction grade drawings. Sulliden will be doing a majority of the earthworks with Owner owned equipment, much of which will be from the planned mining fleet. Sulliden will utilize trained local or regional Peruvian workers for the earthworks. An experienced earthworks construction supervisor will be hired to oversee the earthworks.
The warehouse and fuel facilities will be constructed during the early phases of the construction period to allow for use during construction. The existing man camp will be used for housing of the initial earthworks personnel. The expansion to this man camp will also occur early in the construction phase. If needed, the relatively close proximity of the project to Cajabamba will allow for the construction crews and operational staff to be housed in the towns until the expanded man camp is available.
| | |
| November 2012 | Shahuindo Project | 394 |
| |
|
MINE DEVELOPMENT ASSOCIATES
|
An administrative complex exists that will be made available for use as a construction office and first aid area. The existing kitchen facilities will be used to provide meals. A laboratory is also planned for construction and will be available prior to the start of mining activities.
It is expected that the Owner will provide most of the construction management services utilizing their own personnel. Design will be accomplished largely using local engineering firms. Procurement will be handled by the Owner, with support from the engineering firm(s). A third party group will be contracted to provide quality control services for the earthworks, concrete and installation of the pad and pond liners.
The owner will assign a project manager who will lead the engineering, procurement and construction management for the project. This person will provide management continuity for the project from the beginning of engineering through commissioning and first gold production. Project engineering and design staff, construction supervisors, an electrical supervisor, a geotechnical engineer, safety and environmental supervisors and a liner QA/QC technician will support the project manager.
During construction, the Owner will have individuals on the Construction Management team to monitor environmental and safety issues. This will insure that the contractors and all other site personnel adhere to the project environmental and safety standards.
Specialist contractors or suppliers representatives will be contracted as appropriate to assist with installation and commissioning of major or specialized equipment. In addition, outside specialist consultants may be utilized during commissioning and the early operating period to fine tune operations and recoveries.
As the project progresses, staff personnel will be hired. It is expected that by September 2014, virtually all of the project staff will have been hired and mobilized to the site. At this point the project will depend upon project personnel for all accounting, security, and purchasing and warehousing support.
The project development schedule is based on the following parameters:
- Several tasks will have to be completed prior to final approval of the EIA andpermits. They include the following:
| | |
| November 2012 | Shahuindo Project | 395 |
| |
|
MINE DEVELOPMENT ASSOCIATES
|
- purchasing of mine equipment required for construction activities
- purchasing of materials for the warehouse and truck shop
- purchasing of the main substation and associated facilities
- construction equipment and crew mobilization to site
- start construction of site roads
Earthworks for the initial construction will be a major factor. The heap leachfacilities and ponds will require extensive fill which will be sourced from localareas and from mine waste. Time estimates for earthwork activities were basedon placing and compacting 6,500 m3/day on average.
Water for construction will also be a major factor. The upper water pond needsto be completed prior to the start of the wet season. Initial construction activitieswill include hauling water up from the river until the upper fresh water pond isconstructed and allowed to fill with water during the wet season.
Time requirements for clay placement, moistening and compaction wereestimated based on an average of 3,500 m3/day rate.
Geomembrane liner installation was estimated at an average of 5,000 m2/day.
Large tanks and building components will be field fabricated on site.
Where ever possible, components will be semi-modular to reduce siteconstruction time.
The work is done on a typical 6-day per week construction schedule, withnominal two 10-hour shifts.
The heap pad liners will be constructed in phase development. This will allowover liner material and ore to be placed as soon as possible on the pad.
The schedule includes the following opportunities and risks:
Opportunities
The schedule has a minor amount of slack time built into it.
The schedule was developed on two 10-hour shifts, six days per week. Theschedule could incorporate three 8-hour shifts, working seven days a week tocondense the schedule or recover time.
Risks
| | |
| November 2012 | Shahuindo Project | 396 |
| |
|
MINE DEVELOPMENT ASSOCIATES
|
Schedule for construction disciplines is somewhat restrictive. Multiple vendorsmay be required for certain disciplines to meet schedule.
Some of the earthworks and liner installation activities have to occur over therainy season. Even though scheduling of construction activities were sloweddown somewhat during the wet season to partially account for wetter conditions,an abnormally wet, rainy season could severely curtail construction activities,delay start-up and increase costs.
| |
| 24.6 | Opportunities and Risks |
There are opportunities and risks that have been identified in various areas of the project. These opportunities and risks pertain to production and resource expansion, access to power, mine operations, processing, water management, closure, social and political issues and land acquisition.
| |
| 24.6.1 | Production Expansion |
Potential Opportunity.The mining scenario and production profile presented in the Feasibility Study reflects the Company’s preference to present a financially disciplined capital cost project with a small infrastructure footprint that allows for expeditious permitting and a shorter construction schedule. During the course of the Feasibility Study, a significant amount of engineering was completed for a higher production rate scenario. This higher production rate scenario would utilize the majority of the currently identified mineral resource.
Although the current Mineral Resource estimate has the ability to support a significantly higher mining rate and gold production profile (the Feasibility Study only considers 40% of the gold ounces from the total oxide Mineral Resource) management believes that given the current financial market conditions it is best to commence its operation as quickly as possible with a lower capital cost project that will act as a foundation for future stages of expansion. Moreover, it is anticipated that production growth could be funded from internal cash flows.
Potential Risk.The funding of the expanded mining scenario by internally generated cash flow assumes a gold commodity price $1,415 per ounce. Mineral prices fluctuate and if they significantly declined it could negatively impact the internal cash flow generated by the Project and the Company’s ability to self-fund a future expansion.
| | |
| November 2012 | Shahuindo Project | 397 |
| |
|
MINE DEVELOPMENT ASSOCIATES
|
| |
| 24.6.2 | Mineral Resource Growth and Mineral Resource Conversion |
Potential Opportunity.Three main exploration targets have currently been identified on the Shahuindo concession, which together present opportunities for short and medium term mineral resource growth. Potential short term Mineral Resource growth can be attained from parallel mineralized corridors located in proximity to the current mineral body have been defined with initial drilling and remain open along strike, at depth or at width. Potential medium term growth can be attained from the North Corridor, located approximately two kilometres from the defined mineral zone. The Company began drilling this area in 2011, and to date it has yielded positive mineral intersections that warrant continued geological attention. Other medium and longer term Mineral Resource growth potential could come from defined exploration targets to the north-east and south-west of the 4 kilometer long mineral resource, which have strong geochemical and geophysical surface anomalies that are indicative of additional mineralization for 2.5 kilometres along the general strike of the Central Corridor.
The Shahuindo deposit is a comparatively homogenous gold ore body as currently defined in the mineral resource. Furthermore, there is an opportunity to address insufficiently drilled Inferred mineral resources on the property and convert them to Measured or Indicated categories.
Potential Risk.The mineral targets listed above require additional drilling and the Company’s expectations may not coincide with actual results. An area to the northeast of the main mineralized corridor containing Inferred material would require the withdrawal of a small number of informal miners in order for the Company to drill and upgrade the mineral resource category. Although the Company believes it can accomplish this, there is no guarantee it will be successful in doing so. Additionally, the purchase of surface rights on some of the exploration targets is ongoing yet incomplete.
Condemnation drilling is not complete on areas beyond the proposed mine infrastructure. Should the mineral resource increase significantly, an expanded mining scenario would require further condemnation drilling to identify areas for additional infrastructure.
| |
| 24.6.3 | Access to Electrical Power |
Potential Opportunity. In 2011, a main North-South running national high-tension electric transmission line was installed within the east side of the Shahuindo property. The Company is planning to construct a multi-bay electrical switchyard located three kilometres from the mine site that will have the capacity of providing additional power for
| | |
| November 2012 | Shahuindo Project | 398 |
| |
|
MINE DEVELOPMENT ASSOCIATES
|
expanded oxide mining scenarios as well as the potential future exploitation of sulphide mineralization.
The switchyard and electrical infrastructure for the Shahuindo Project will also benefit the local people and the state. The new multi-bay switchyard will provide local power company, Hidrandina, the possibility of a new connection point to improve the quality of power to the towns of Cajabamba and Huamachuco among others, as well as other operating mines and future mining operations.
Should other users require access to electrical power, the Company will be reimbursed on a proportional basis for its capital cost investment.
Potential Risk. The main power line has been built to strict electrical transmission standards however interruptions of power, while not anticipated, are possible and would require the use of diesel backup generators which would increase operational costs. Power generated from downhill conveyors could mitigate this risk.
| |
| 24.6.4 | Pit Geotechnical and Mine Planning |
Potential Opportunities. Pit slope angles have been estimated based on relatively high fragmented ore material. During detailed design and actual mining, these slopes design parameters may be steepened; thus reducing the strip ratio and waste material generation.
Mine cost estimates assume reduced blasting requirements in some of the softer more fragmented soil like material. This may be further reduced based on operational experience during mining.
Potential Risks. The geotechnical slope parameters assume that pit walls can be effectively depressurized. Depressurization is assumed to be accomplished using vertical dewatering wells and horizontal drains. Should the depressurization efforts not be successful, then it would require either additional depressurization efforts or further flattening of pit slopes. The additional depressurization would require additional operational and capital costs. Further flattening of slopes could increase the strip ratio and or reduce the available reserves for mining.
| |
| 24.6.5 | Metallurgy and Processing |
Potential Opportunities. A conservative estimation of the ore’s particle size delivered from the mine was used in the Feasibility Study to size the crushing circuit. If finer run of
| | |
| November 2012 | Shahuindo Project | 399 |
| |
|
MINE DEVELOPMENT ASSOCIATES
|
mine material (ROM) is received at the crusher then crushing costs may be lower than projected.
The metallurgical performance, i.e. gold recovery, of the fragmented ore may be higher than expected if the particle size distribution is very fine.
Finer ROM ore may provide faster leach rates and higher gold recovery.
Potential Risks. The presence of excessive amounts of low permeability material in the ore can increase processing costs by requiring higher additions of cement in agglomeration.
Potential Opportunities. Optimizing leach pad management, including staged reclamation, may eliminate or minimize the need for late project phase water evaporation thereby reducing capital and operating costs.
Potential Risks. Excess water in the project’s later years of operation, may exceed the capacity of the evaporation system requiring additional expense for more evaporators or additional diversion structures. The formation of a pit lake after cessation of operations could increase closure costs significantly, depending on timing and pit water quality.
The formation of a pit lake after cessation of operations could increase closure costs significantly, depending on timing and pit water quality.
| |
| 24.6.7 | Heap Leach Design and Operation |
Potential Opportunities. Conservative heap leach cycles were used in the feasibility study. The operation may show faster recovery and better recovery which would allow for higher heap lift heights and higher leach solution application rates. This would result in faster recovery of gold and would increase the capacity of the existing leach pad and lower capital and operating costs.
The leach pad location could be expanded to accommodate a larger amount of ore lowering capital and operating costs should an expansion of the project occur.
Potential Risks. The leach pad design consists of 8m lift height and a 75 day treatment cycle. Should actual operational data indicate that these conditions are sub-optimal,
| | |
| November 2012 | Shahuindo Project | 400 |
| |
|
MINE DEVELOPMENT ASSOCIATES
|
changes may be needed to optimize performance that could impact operating and sustaining capital costs.
The Shahuindo Project is located in the department of Cajamarca in northern Peru which boasts a very high concentration of mining projects. Some mines in the area have been and continue to be subject to adverse social-political situations. Resistance towards mining activities by the local population could delay or impede the development and operation of the Shahuindo Project.
The Company employs a dedicated Community Relations Team to mitigate social opposition. The Team has implemented a strategy that promotes transparent stakeholder engagement and active community participation and consultation at its Shahuindo property. This includes a training program designed and implemented by Social Capital Group for new job and business opportunities. The Company has maintained a strong focus on social relations since 2002, and in July 2005 it received a Social Responsibility Award for its ongoing efforts.
Peru continues to have issues with informal miners working outside the law on surface and underground excavation within mineral concessions that are owned by mining companies. There are currently two small groups of informal miners operating on the Shahuindo concessions. The first group is mining high-grade veins on the prominent landmark on the property, the Algamarca Anticline, and are located approximately one kilometer away from the planned infrastructure and pit area. The second, smaller group’s mining activities are focused near surface on high grade veins outside of the current mining plan but along strike and within the potential future expansion area to the northwest of the mineral deposit.
The Company has successfully been following a strategy of non-confrontational containment that prevent them from encroaching on new areas of the property; however there is always a risk that issues and difficulties could arise from informal miners that could delay or impede the development of the Shahuindo Project.
In addition, in early 2012 the Peruvian government approved five legislative decrees that oppose illegal mining activities and implement steps to formalize them. The Regional government of Cajamarca and the office of the director of energy and mines (DREM) in
| | |
| November 2012 | Shahuindo Project | 401 |
| |
|
MINE DEVELOPMENT ASSOCIATES
|
Cajamarca are working on a social initiative for the informal miners to convert their illegal mining activities into other forms of legal work.
| |
| 24.6.10 | Land Acquisition & Resettlement |
Additional purchase of land surface rights will be required for the proposed mine infrastructure and in order for the Company to obtain its construction permit. Although land purchase and relocation strategies are in place, a delay or failure in obtaining all surface rights could impede or prevent the development of the project.
The Company currently has a dedicated land purchase and resettlement team with proven experience and success in Peru. To date, land acquisition on the Shahuindo site has been successful and high quality resettlement land has been purchased near the city of Cajabamba for the relocation program.
| |
| 24.6.11 | Political Situation |
Peru is one of the largest mining countries in South America and these activities have been intrinsically linked to the Country’s positive development. In the past 20 years Peru’s mining GDP has risen almost 260% and today it has a mining project portfolio of approximately $41 billion (Peruvian Ministry of Energy & Mines), including over 400 mining operations (Celfin). In July 2011, Ollanta Humala was elected as Peru’s new President for a five-year term. In his first year, in successful consultation with the mining sector, he revised the mining sector’s tax structure. In large part due to mining opposition, Humala has also made changes to his cabinet three times. Although he openly supports the development of mining projects and foreign investment, these have also created heated social conflicts and this political climate has potential to affect both the project delivery and the outcome.
Humala is a supporter of continued growth in the mining sector and has recently established a new office called The Office for Dialogue and Sustainability. This office is led by Vladimiro Huaroc, the former Regional President of Junin, who has been charged to create regional offices for the prevention and management of social conflicts through dialogue and other conflict resolution mechanisms.
According to the President of the Central Bank, private investment in Peru during the first quarter of 2012 increased 13.6%, mostly in the mining and energy sectors. In the same period, direct private foreign investments increased 60%.
| | |
| November 2012 | Shahuindo Project | 402 |
| |
|
MINE DEVELOPMENT ASSOCIATES
|
| |
| 25.0 | INTERPRETATIONS AND CONCLUSIONS |
This report provides a summary of the feasibility study conducted on the Shahuindo Project. KCA and MDA have reviewed the project data and have visited the project site. KCA and MDA believe that the data provided by Sulliden are generally an accurate and reasonable representation of the Shahuindo deposit.
The Shahuindo Project demonstrates technical and financial viability based on the evaluations, studies, and analyses conducted to-date. A significant Measured, Indicated and Inferred gold-silver resource and Proven and Probable reserve have been outlined on the Shahuindo property.
The Shahuindo Project assay database contains 827 drill holes and a total of 94,441 gold assays, 93,073 silver assays, and 69,103 total-sulfur analyses. Approximately 90 percent of the drill data is within or directly adjacent to the current resource boundary and was used in the creation of the geologic models and subsequent resource estimation. The Measured and Indicated resources were then used as a basis for the reserves.
For the Shahuindo deposit, the most important characteristic is the relatively continuous, near-surface mineralization extending over a strike length of more than 4,000 m. Within the large, continuous lower-grade mineralized shell, higher-grade gold and silver mineralization is related to generally near-vertical to southwest-dipping structures hosted within variably silicified sedimentary rocks, primarily the Carhuaz Formation, or along sedimentary rock/porphyry intrusive contacts. The mineralized structures occur as zones of strong fracturing and brecciation, which can be up to 25 m wide though widths of 5 m to 10 m are more common. The structures can intersect and sub-divide, with significant mineral grades (>2 g Au/t) forming at the structural intersections and within the more prominent structures. Gold and silver mineralization at Shahuindo is considered to be of the intermediate sulfidation epithermal type.
The Shahuindo deposit contains both shallow oxidized and underlying sulfidic mineralization, with the latter unoxidized material containing up to 10 to 15 percent pyrite. The base of oxidation is variable throughout the deposit occurring at depths as shallow as 15 m below the topographic surface and as deep as 200 m below the surface. The redox boundary can be fairly sharp with the transition to sulfide-dominant material occurring over just a few meters, although in many parts of the deposit the transition zone can be over 50 m thick.
| | |
| November 2012 | Shahuindo Project | 403 |
| |
|
MINE DEVELOPMENT ASSOCIATES
|
Gold mineralization is of similar tenor throughout the vertical extent of the deposit, but silver mineralization is strongly leached within the oxide zone, with a resulting decrease in metal grade. Related enrichment of silver within the transition zone and the top of the sulfide zone results in silver values that are on average about five times greater in the enriched horizon than in the overlying oxide zone.
The Shahuindo gold and silver resource is based on drill-sample analyses, density measurements, logged oxide/sulfide content, and lithologic and structural geologic contacts. The stated resource is fully diluted to 8 m by 8 m by 4 m blocks and tabulated on gold-equivalent (AuEq) grade cutoffs of 0.2 g AuEq/t for oxide material, 0.35 g Au/t for mixed oxide and sulfide material, and 0.5 g Au/t for sulfide material. At the reportable cut-offs, the Shahuindo Indicated Resource totals 147,310,000 tonnes averaging 0.515 g Au/t (2,438,000 ounces gold) and 7.1 g Ag/t (33,370,000 ounces silver). The Inferred Resource totals 71,000,000 tonnes averaging 0.713 g Au/t (1,628,000 ounces gold) and 20.4 g Ag/t (46,560,000 ounces silver). Due to metallurgical and grade uncertainties, all sulfide and overburden material is restricted to the Inferred classification.
The extent of the gold and silver resource to be included in any potential open-pit, heap-leach mining/milling scenario is controlled by the oxidation boundary. Approximately 95 percent of the current potential open-pit resource is classified as Indicated. A small portion of the Indicated resource (<50,000 ounces gold) occurs within the overburden directly over the Measured and Indicated-classified bedrock resource. Any potential open-pit scenario would include removing the mineralized overburden, so it is likely that some economic benefit could be attained by processing this material.
Additional drilling to expand the resource along strike and potentially discover new mineralized zones along sub-parallel structural corridors is warranted. Further infill drilling within the current resource boundary is not expected to substantially change the current open-pit oxide and mixed resources, although there is the potential to discover isolated zones of higher-grade mineralization along cross-structures and at structural intersections. Expanding the sulfide resource would be expected with further deep drilling beneath the oxide resource, while upgrading the sulfide resources to Indicated requires additional metallurgical study.
The metallurgical testing results indicate that Shahuindo material is amenable to processing by heap leaching methods. Gold recoveries are high, and the rates of recoveries are fairly rapid for oxide material. Reagent requirements are low to moderate. Based on the available leach test results and applying appropriate deductions to estimate field recoveries from laboratory data, gold recovery is estimated
| | |
| November 2012 | Shahuindo Project | 404 |
| |
|
MINE DEVELOPMENT ASSOCIATES
|
to average 86% on oxides and a conservative 50% on transition material. Silver recoveries are low, and the rate of silver recovery is also generally slow. Silver recoveries are estimated to average 15%.
The pit slope stability analysis conducted by Golder Associates indicates that there is a higher than usual uncertainty associated with the slope design recommendations because of the complex geotechnical conditions in the pit slopes. The slope stability will be controlled by a combination of structural control and low rock mass strength. Limit equilibrium stability analyses were formed on six stability sections drawn through critical slopes of the proposed pit. Two dewatering scenarios were supplied by Ausenco for years 9 and 11 of the mine plan. The analyses resulted in factors of safety of 1.2 or greater for each section for both years. Slope stability will be sensitive to the presence of groundwater pressures and effective depressurizing of slopes will be required throughout the project life.
Pit slope design parameters used in the mine design are discussed in Section 15.
Pit optimization was done using Gemcom’s Whittle software to define pit limits with input for economic and slope parameters. The optimization used economic parameters for various mining and processing scenarios to define the best operating scenario for the project. Pit optimization used only Measured and Indicated resources for processing. All Inferred material was considered to be waste. Note that no sulfide material was included in Measured or Indicated resources; thus, all sulfide material is considered waste.
The proven and probable reserves based on project economics and metal recoveries were estimated to be 37.85 million tonnes of ore at gold and silver grades of 0.84 g/t and 9.5 g/t, respectively. The reserve reflects Sulliden’s preference to present a financially disciplined capital cost project as the mineral resource has the ability to support a much larger operation.
Water management includes compensation for downstream users whose current water source will be impacted by project activities. The preliminary determined annual volumes are 86,674 m3for environmental flows, 42,416 m3for community supply and 101,216 m3for irrigation supply. The total annual replacement volume is preliminary estimated at 230,306 m3annually. Surface water is primarily used for irrigation with the exception of a single area which is exclusively for domestic use. The use of spring water for domestic-livestock and livestock purposes are the most important within the Project area given the number of sources accessed, representing 25% and 23%, respectively of
| | |
| November 2012 | Shahuindo Project | 405 |
| |
|
MINE DEVELOPMENT ASSOCIATES
|
the entire registry. In general, the high presence of metals in some of the surface water monitoring points and in the riverbed sediments could be due to the presence of tailings, waste, pithead, environmental liabilities effluents and informal mining upstream from the monitoring points.
The conclusions of the predictive geochemical modeling effort performed by Ausenco can be summarized as follows:
The majority of the inflow water entering the Open Pit will be from surface waterinflow as Catchment Runoff. About 62 percent of the contribution to the pit lakewill be from runoff. Direct precipitation, and groundwater inflow, will contribute tothe pit lake water balance as well. Over time, the contribution from directprecipitation will increase as a percentage of annual inflow as the pit lake surfacearea increases;
The pit lake is anticipated to fill to a maximum elevation of 2,800 masl inapproximately 7 years and overflow;
The pit lake is anticipated to be of poorer water quality than surroundinggroundwater and pH is anticipated to be of concern; and
Because the geochemical sources to the pit lake are continuous and removal ofwater due to evaporation, dissolved chemical constituents are expected toconcentrate over time.
It should be noted that the Ausenco model includes some 62% of the water contribution to the pit lake coming from catchment runoff. Additional diversion structures will be able to significantly minimize contribution to the pit lake from external surface runoff, which will significantly increase the time required to fill the pit lake. This additional design will be conducted in detailed engineering.
As indicated above, the quality of the pit lake water was significantly changed from local groundwater after 100 years of model simulation. At that time, the pH of the pit lake water is anticipated to be 4.2, which is also lower than local groundwater.
The capital expenditures required include $131.8 million for pre-preproduction, $8.5 million for working capital and initial fills and $47.8 million for sustaining capital. The operating cost is $11.94/t ore. The costs are in second quarter 2012 US dollars. The project produces 872,000 ounces of gold and 1,725,000 ounces of silver at a cash operating cost of $552 per gold ounce. The project has an after tax NPV @ 5% of $248.6 million. The after tax Internal Rate of Return is 37.8%. The project is more
| | |
| November 2012 | Shahuindo Project | 406 |
| |
|
MINE DEVELOPMENT ASSOCIATES
|
sensitive to gold prices/gold recovery variations than to changes in capital and operating costs.
Other primary conclusions and interpretation of the NI 43-101 are:
Prior to initiation of procurement and construction activities, detailed engineeringis required.
No allowance is included for inflation or escalation or other changes as a result ofchanging economic conditions in Peru.
The project has opportunities to extend mine life and improve operating costs.
The project has potential risks including social issues, water management, pitdewatering, pit lake formation after cessation of operations with associated costsand political uncertainty.
| | |
| November 2012 | Shahuindo Project | 407 |
| |
|
MINE DEVELOPMENT ASSOCIATES
|
The work that has been completed to date has demonstrated that Shahuindo is a technically and economically viable project and justifies additional work as described in this Section.
A significant Measured, Indicated and Inferred epithermal gold-silver resource has been outlined on the Shahuindo property. The potential open-pit, heap-leach oxide resource can be expanded along both width and strike, while the current Inferred-only sulfide resource is open at depth and along strike. Both targets warrant additional drilling. Sulliden has also identified highly prospective exploration targets on the Shahuindo property that need to be drill tested. On the North Corridor target, follow-up drilling on various mineralized drilled intercepts needs to be conducted. Additional expenditures are clearly warranted to further explore the potential associated with the Shahuindo deposit.
The feasibility study presents a robust project. Detailed engineering should be started and design and costing of long lead time items finalized to meet the project development schedule. Engineering to better estimate timing of pit lake formation and to treat pit lake water should also be conducted early on in the detailed engineering phase. The cost of this detailed engineering is included in the project economics.
| |
| 26.1 | Deposit Expansion and Exploration Activities |
The recommended drill program to be completed in 2013 is an additional 35,000 meters of drilling that should focus on the following objectives:
the expansion of existing oxide resources by drilling both width and strikeextensions and sub-parallel corridors immediately to the north and south of theCentral Corridor hosting the resource in Shahuindo;
deep drilling to expand the sulfide resource;
grade-assessment drilling (twin program); and
exploration drilling of the North Corridor and other additional targets elsewhereon the property.
Additional geophysics, primarily IP, and surface geochemical sampling are recommended to assist in the delineation of drill targets within the North Corridor and also along the northwest extension of the resource within the Central Corridor.
| | |
| November 2012 | Shahuindo Project | 408 |
| |
|
MINE DEVELOPMENT ASSOCIATES
|
A recommended budget for the above program is included in Table 26-1.
| |
| Table 26-1 | Exploration Recommendations and Associated Costs |
| | | |
| Task | Estimated Cost |
| Exploration drilling: 35,000 m ($200/m) | $ | 7,000,000 | |
| Geophysical surveys | $ | 75,000 | |
| Other Exploration Activities | $ | 550,000 | |
| Condemnation (including drilling) | $ | 300,000 | |
| Miscellaneous project work | $ | 75,000 | |
| Phase One Budget | $ | 8,000,000 | |
Golder Associates listed several recommendations to maintain pit slope stability. They are presented in their pit slope stability report (Golder, November, 2012).
Slope stability at Shahuindo will be sensitive to the presence of groundwater pressures. Groundwater pressures within the slopes must be managed by adequate investigation, monitoring and drainage as required. Groundwater levels must be maintained at or below the levels indicated in the Ausenco modeling, with corresponding depressurization during prior stages of pit slope development. Surface flows on soil units should be controlled to limit erosion and infiltration that could result in stability issues.
The uncertainties in the geotechnical model should be managed by a program of ongoing geotechnical documentation, monitoring and engineering evaluations where appropriate. Phase and final pit walls should be mapped after they are mined, but before access is affected by subsequent mining. A comprehensive slope monitoring program should be implemented that includes surface displacement monitoring, subsurface displacement monitoring and visual inspections.
The costs to implement these recommendations are included as part of the mine operating costs.
| | |
| November 2012 | Shahuindo Project | 409 |
| |
|
MINE DEVELOPMENT ASSOCIATES
|
| |
| 26.3 | Geotechnical Recommendations |
As a result of geological and geotechnical investigation conducted, the analysis of the information obtained and the revision of existing data, Ausenco has established the proper design criteria for the project and confirmed stability of the ground loadings. During this process Ausenco has identified the following recommendations:
Even though robust seismic design parameters were established, Ausencorecommends performing a site-specific seismic hazard study for the ShahuindoProject area. From this study a more precise maximum acceleration expected inthe area using deterministic and probabilistic methods can be determined.
A study of the surrounding material deposits has been performed within theShahuindo property, with a goal of finding materials for structural fill, lowpermeability soil and riprap. Ausenco recommends an additional study to identifyborrow areas adjacent to the project area. Many areas were not investigated dueto the lack of community permissions.
For cuts that will take place over natural terrain, Ausenco recommends they beperformed with a 1H:1V angle and benches with widths of 2.5 m for every 5 m ofheight.
In the Crushing Area, Ausenco recommends upgrading the bearing capacitycalculations according to the final arrangements of the foundations of thedifferent structures, and comparing actual loads transmitted to the ground.
The cost associated with these recommendations is approximately $100,000.
It is recommended to install a meteorological and hydrological monitoring network in the Project area during the operational period, with a core group equipped with permanent recording equipment. Consequently, it is recommended that:
The meteorological network has at least two permanent recording stationslocated at approximately the lowest and highest points of the Project area. Theequipment must provide direct precipitation and evaporation measurements;
The permanent hydrometric record stations be installed in each of the quebradaslocated in the Project area. Another station must be installed in an adjacentquebrada, not affected by the project, for the purpose of collecting data toestablish comparative scenarios of conditions with and without the project.
| | |
| November 2012 | Shahuindo Project | 410 |
| |
|
MINE DEVELOPMENT ASSOCIATES
|
This network will allow for controlling assumptions made in the study, and shall provide a solid basis for future hydrological reevaluations (with emphasis on water balance predictions for operation and closure, the commitments to flow replacement and other aspects that must be established in the closure plan).
Request information on water rights in the basins located in the Project area from the Crisnejas Local Water Administration. This information will validate the water demand assessments for irrigation purposes, necessary for optimizing the replacement flows.
Request from the National Water Authority (ANA as per the Spanish acronym) the classification of surface water bodies present in the Project area. This will permit identification of the Environmental Quality Standard for the water that Sulliden must conserve.
The estimated cost for the above recommendations is approximately $100,000.
Monitoring
Due to vandalism, each of the stand-pipe piezometers should be enclosed with a gated enclosure that restricts access to the piezometers and hopefully, reduces future vandalism.
Four (4) of the five (5) piezometers that were vandalized should be replaced. These piezometers are as follows: P-1A, P-5, P-13 and P-14. In addition, P-10, which was never installed, should be installed as this will act as a monitoring point down-gradient from the heap leach pad.
Based on the groundwater model MODPATH results, two (2) additional shallow stand-pipe piezometers should be installed down-gradient from the waste rock dump and excess solution pond. These piezometers will act as monitoring points to detect leakage from these facilities.
Surface water sampling should be performed in the quebradas Choloque, El Higueron and El Sauce once the waste rock and heap leach pad facilities are built to also act as monitoring points for surface water quality.
Quarterly groundwater monitoring should be performed on the stand-pipe piezometers installed in the mine project area. The monitoring should consist of static water level
| | |
| November 2012 | Shahuindo Project | 411 |
| |
|
MINE DEVELOPMENT ASSOCIATES
|
measurements and groundwater quality sampling. The cost for these piezometers and monitoring is approximately $50,000 to $100,000.
Pit Lake Mitigation Measures
Since, pit lake modeling indicates that a pit lake will form and overflow after the mine has closed, Ausenco recommends that mitigation methods be employed to limit the amount of overflow and remediate the pit lake water quality. Such mitigation methods could be as follows;
Terraces in final pit to create more lake surface area for more evaporation fromfree water surfaces;
Engineered spillway to pass peak flows from pit lake; and
Engineered wetland in the quebrada Choloque to remediate pit lake overflows.
Review engineering solutions to prevent surface water from entering the pit. Theanalysis presented by Ausenco assumes 62% of the inflow to the pit will besurface wate. If this surface water can be prevented from entering the pit the timeto fill the pit will be significantly increased (estimated at 200 years).
Depending on the outcome of additional pit lake evaluations, the cost for the above hydrogeology recommendations is estimated to vary from $2 million to $8 million.
| | |
| November 2012 | Shahuindo Project | 412 |
| |
|
MINE DEVELOPMENT ASSOCIATES
|
Amireault, S., 2009 (November),Shahuindo Project Geology Presentation: Internal Sulliden Gold Corp. PowerPoint Presentation.
Ashley, R. P., 1982,Occurrence Model for Enargite-gold Deposits,inErickson, R. L., ed.,Characteristics of Mineral Deposit Occurrences: U. S. Geological Survey Open File Report 82-795, p. 144-147.
Ausenco,Mine Pit Dewatering Plan,Memorandum, 21 September 2012 Email
Ausenco, (October 2012),Proyecto Shahuindo, Estudio de Factibilidad, Hidrología,
Prepared for Sulliden Shahuindo S.A.C.
Ausenco, (October 2012),Feasibility Study, Hydrogeology Report, Report prepared for Sulliden Gold Corporation
Ausenco, (October 2012),Shahuindo Geochemical Pit Lake Model Report,Report prepared for Sulliden Gold Corporation
Ausenco, (October 2012), Proyecto Shahuindo,Estudio Geotécnico de la Planta de Procesos, Área de Chancado, Presa de Agua y Poza de Excesos de Solución, Report Prepared for Sulliden Gold Corporation
Ausenco, (November 2012), Proyecto Shahuindo, Memorándum Técnico 14 - Análisis de Estabilidad de Taludes del Pad de Lixiviación, Prepared for Sulliden Gold Corporation
Bonham, H. F., Jr., 1988,Models for Volcanic-hosted Precious Metal Deposits; A Review,inSchafer, R. W., et al., eds.,Bulk Mineable Precious Metal Deposits of the Western United States: Geological Society of Nevada, p. 259-271.
Bussey, S., and Nelson, E., 2011,Geological Analysis of the Shahuindo district, Cajabamba Province, Peru:Report prepared by Western Mining Services LLC for Sulliden Gold Corporation, 69 p.
Davies, R. C. I., 2002,Tectonic, Magmatic and Metallogenic Evolution of the Cajamarca Mining District, Northern Peru: Ph. D. thesis, James Cook University, Australia, 323 p.
| | |
| November 2012 | Shahuindo Project | 413 |
| |
|
MINE DEVELOPMENT ASSOCIATES
|
Dawson Metallurgical Laboratories Inc, (October 15, 1996),Results of Laboratory Test Work Performed n 20 Composites Samples from the Boti Project to Determine Gold and Silver Extraction,Report prepared for Asarco Inc., Latin American Exploration Division.
Fletcher, D. I., 1997,Boti Gold-silver Project, Department of Cajamarca, Peru: Internal Asarco Inc. report, 13 p. plus appendices.
Gilbert, J. M., and Park, C. F., 1986,The Geology of Ore Deposits: Freeman and Company, New York, 985 p.
Golder Associates (November 2012),Draft Feasibility-Level Pit Slope Investigation,
Prepared for Sulliden Gold Corporation
Grigorita, A., In prep,U-Pb radiometric dating for 3 samples of Shahuindo Project: Internal Memorandum prepared for Sulliden Gold Corporation.
Heap Leach Consultants (February 2005), Proyecto “San José de Algarmaca”, Informe de Pruebas de Cianuracion en Botellas y Columnas a Escala Piloto, Report prepared for Cía. Minera Algamarca S.A.
Hedenquist, J. W., 1987,Mineralization Associated with Volcanic-related Hydrothermal Systems in the Circum-Pacific Basin,inHorn, M. K., ed.,Transactions of the Fourth Circum-Pacific Energy and Mineral Resources Conference, Singapore: American Association of Petroleum Geologists, p. 513-524.
Hedenquist, J. W., and Arribas, A. R., Jr., 1999,I. Hydrothermal Processes in Intrusion-related Systems; II. Characteristics, Examples and Origin of Epithermal Gold Deposits,inMolnar, F., Lexa, J., and Hedenquist, J. W., eds.,Epithermal Mineralization of the Western Carpathians: Society of Economic Geologists, Guidebook Series, no. 31, p. 13-61.
Hedenquist, J. W., Arribas, A. R., and Urien-Gonzales, E., 2000,Exploration for Epithermal Gold Deposits: SEG Reviews, v. 13, p. 245-277.
Hodder, R. W., 2010a (June),The Shahuindo Epithermal Gold Occurrence, Cajabamba Province, Peru; Petrographic Reconnaissance & Interpretation of Shape and Size: Report prepared for Sulliden Gold Corporation Ltd., 112 p.
| | |
| November 2012 | Shahuindo Project | 414 |
| |
|
MINE DEVELOPMENT ASSOCIATES
|
Hodder, R. W., 2010b (December 15),The Shahuindo Epithermal Gold Occurrence; an Addendum to the June 30, 2010 report by Hodder et al.: Report prepared for Sulliden Gold Corporation Ltd., 27 p.
Kappes, Cassiday & Associates (January 2011),Drill Core Composites, Column Leach Test Program, Report of Metallurgical Test Work,Report prepared for Sulliden Gold Corporation
Kappes, Cassiday & Associates (March 2011),Report of Metallurgical Test Work, Bottle Roll Tests – 2010, SHM-10-116 – SHM-10-118,Report prepared for Sulliden Gold Corporation
Kappes, Cassiday & Associates (May 2011),116 & 118 Column Tests, Report of Metallurgical Test Work,Report prepared for Sulliden Gold Corporation
Kappes, Cassiday & Associates (June 2011),Polymer Testing, Report of Metallurgical Test Work,Report prepared for Sulliden Gold Corporation
Kappes, Cassiday & Associates (June 2011),Report of Metallurgical Test Work, Bottle Roll Tests – 2011,Report prepared for Sulliden Gold Corporation
Kappes, Cassiday & Associates (June 2011),Report of Metallurgical Test Work, Bottle Roll Tests – 2009 Core,Report prepared for Sulliden Gold Corporation
Kappes, Cassiday & Associates (June 2011),All Rock Code Composites, Report of Metallurgical Test Work,Report prepared for Sulliden Gold Corporation
Kappes, Cassiday & Associates (October 2011),Bottle Roll Leach Test Comparisons, Report of Metallurgical Test Work,Report prepared for Sulliden Gold Corporation
Kappes, Cassiday & Associates (December 2011),HLC 6, 7, 8, 9 Composites, Report of Metallurgical Test Work,Report prepared for Sulliden Gold Corporation
Kappes, Cassiday & Associates (January 2012),P1 and P2 Zones, Report of Metallurgical Test Work,Report prepared for Sulliden Gold Corporation
Kappes, Cassiday & Associates (May 2012),Bulk ROM Material, Report of Metallurgical Test Work,Report prepared for Sulliden Gold Corporation
| | |
| November 2012 | Shahuindo Project | 415 |
| |
|
MINE DEVELOPMENT ASSOCIATES
|
Longo, A. et.al, 2012,Evolution of Calc-Alkaline Volcanism and Associated Hydrothermal Gold Deposit at Yanacocha, Peru:Econ. Geol., Vol. 105, pp 1191-1241.
Mégard, F., 1984,The Andean orogenic period and its major structures in central and northern Peru:J. geo. Soc. London, Vol. 141, pp 893-900, 5 figs.
Minera Sulliden Shahuindo SAC, (22 August 2012),Via de Acceso Principal al Proyecto Shahuindo,Internal Memorandum
Montoya, D. E., Noble, D. C., Eyzaguirre, V. R., and Desrosiers, D. F., 1995,Sandstone-hosted Gold Deposits; A New Exploration Target is Recognized in Peru: Engineering and Mining Journal, June 1, 1995.
Moscoso, O. D., et al, 2011 (April),Estudio de Impacto Ambiental Semidetallado Categoria II: Viceversa Consulting, 481p. plus appendices.
Reyes Rivera, L., 1980,Geologia de Los Cuadrangulos de Cajamarca, San Marcos y Cajabamba: Instituto Geologico Minero y Metalurgico (NGEMMET) Boletin no. 31, sheets 15-f, 15-g, and 16-g at 1:50,000 scale, 67 p.
Sanchez Rojas, Ramon, In prep,Determinación de los vectores de mineralización y zonamiento de alteraciones hidrotermales del proyecto Shahuindo-Perú: Thesis to be submitted to the Universidad Nacional de Cajamarca.
Saucier, G., and Buchanan, M. J., 2005 (April),Resources Estimation, Shahuindo Project, Peru: Report prepared for Sulliden Exploration Inc. by Met-Chem Canada Inc., 71 p.
Saucier, G., and Poulin, L., 2004 (March),Resources Estimation, Shahuindo Project, Peru: Report prepared for Sulliden Exploration by Met-Chem Canada Inc., 69 p.
Scherrenberg, A. et.al., 2012,Stratigraphic variations across the Maranon Fold-Thrust Belt, Per: Implications for the basin architecture of the West Peruvian Trough:J. South. Amer. Earth Sc. Vol. 38, pp 147-158.
Sulliden Exploration Inc., 2009a (April 30): Annual Information Form: unpublished internal report to Toronto Stock Exchange.
| | |
| November 2012 | Shahuindo Project | 416 |
| |
|
MINE DEVELOPMENT ASSOCIATES
|
Sulliden Exploration Inc., 2009b (October 31): Management Discussion and Analysis: unpublished internal report to Toronto Stock Exchange.
Taylor, B., 2007,Epithermal Gold Deposits,inGoodfellow, W. D., ed.,Mineral Deposits of Canada: A Synthesis of Major Deposit Types, District Metallogeny, the Evolution of Geological Provinces, and Exploration Methods: Geological Association of Canada, Mineral Deposits Division, Special Publication no. 5, p. 113-139.
Tietz, P., and Kappes, D., 2011 (July 26),Technical Report on the Shahuindo Project, Cajabamba, Peru: Report prepared for Sulliden Gold Corporation, Ltd by Mine Development Associates and Kappes, Cassiday & Associates, 144 p.
Tietz, P., and Defilippi, C., 2012 (October 15), UpdatedTechnical Report on the Shahuindo Project, Cajabamba, Peru: Report prepared for Sulliden Gold Corporation, Ltd by Mine Development Associates and Kappes, Cassiday & Associates, 149 p.
VDG del Peru S.A.C., 2002 (December),Geophysical Report on Induced Polarization, DGPS and Magnetic Surveys, Shahuindo Project: Report prepared for Exploration Sulliden Inc., 42 p.
VDG del Peru S.A.C., 2003 (February),Geophysical Report on Induced Polarization and Magnetic Surveys, Shahuindo Project: Report prepared for Minera Sulliden Shahuindo S.A.C., 44 p.
White, N. C., and Hedenquist, J. W., 1995,Epithermal Gold Deposits; Styles, Characteristics and Exploration: SEG Newsletter, no. 23, p. 1, 9-13.
Wright, C., Melnyk, J., Gormely, L., Simpson, G., and Lupo, J., 2010a (Effective date December 8, 2009; revised date February 16, 2010),Shahuindo Gold Project, Cajabamba Province, Peru, NI 43-101 Technical Report on Preliminary Assessment: Report prepared by AMEC Americas Inc. for Sulliden Gold Corporation, 181 p.
Wright, C., Melnyk, J., Gormely, L., Simpson, G., and Lupo, J., 2010b (February 19),Shahuindo Gold Project, Cajabamba Province, Peru, Preliminary Assessment: Report prepared by AMEC Americas Inc. for Sulliden Gold Corporation, 485 p.
| | |
| November 2012 | Shahuindo Project | 417 |
| |
|
MINE DEVELOPMENT ASSOCIATES
|
| |
| 28.0 | AUTHORS’ CERTIFICATES |
| | |
| November 2012 | Shahuindo Project | 418 |
| |
|
MINE DEVELOPMENT ASSOCIATES
|
Carl E Defilippi
I, Carl E. Defilippi, M.Sc., C.E.M., do hereby certify that I am currently employed as Senior Engineer for Kappes, Cassiday & Associates located at 7950 Security Circle, Reno, Nevada 89506 and:
1. I graduated with a Bachelor of Science degree in Chemical Engineering from the University of Nevada in 1978 and a Master of Science degree in Metallurgical Engineering from the University of Nevada in 1981.
2. I am a Registered Member of the Society for Mining, Metallurgy and Exploration (775870RM).
3. I have read the definition of “qualified person” set out in National Instrument 43-101 (NI 43-101) and certify that by reason of my education, affiliation with a professional association (as defined in NI 43-101) and past relevant work experience, I fulfill the requirements to be a “qualified person” for the purposes of NI 43-101. I am independent of the Issuer and related companies applying all of the tests in section 1.5 of National Instrument 43-101.
4. I am one of the authors of this Technical Report titled Technical Report on the Shahuindo Heap Leach Project, Cajabamba, Peru prepared for Sulliden Gold Corporation Ltd., effective as of September 26, 2012, and dated November 9, 2012. I am responsible for Sections 2, 4, 5, 13, 17 through 20, 21 (except 21.2 and 21.10), 22, 23 and 27 and am co-responsible for Sections 1, 3, 6 and 24 through 26, except for those issues discussed in Section 3.0.
5. I visited the Shahuindo project site on April 6 through 8, 2010 and May 4 through 7, 2010.
6. As of the date of the certificate, to the best of my knowledge, information and belief, the Technical Report contains the necessary scientific and technical information to make the Technical Report not misleading.
7. I have read National Instrument 43-101 and Form 43-101F1, and the Technical Report has been prepared in compliance with that instrument and form.
8. I consent to the filing of the Technical Report with any stock exchange and other regulatory authority and any publication by them, including electronic publication in the public company files on their websites accessible by the public, of the Technical Report.
Dated November 9, 2012.
“Carl E. Defilippi"
Carl E. Defilippi
| | |
| November 2012 | Shahuindo Project | 419 |
| |
|
MINE DEVELOPMENT ASSOCIATES
|
Thomas L. Dyer, P.E.
I, Thomas L. Dyer, P.E., do hereby certify that I am currently employed as Senior Engineer for Mine Development Associates, Inc. located at 210 South Rock Blvd., Reno, Nevada 89502 and:
1. I graduated with a Bachelor of Science degree in Mining Engineering from the South Dakota School of Mines and Technology in 1996. I have worked as a mining engineer for a total of 16 years since my graduation.
2. I am a Registered Professional Engineer in the state of Nevada (#15729) and a SME
Registered Member in good standing (#4029995).
3. I have read the definition of “qualified person” set out in National Instrument 43-101 (NI 43-101) and certify that by reason of my education, affiliation with a professional association (as defined in NI 43-101) and past relevant work experience, I fulfill the requirements to be a “qualified person” for the purposes of NI 43-101. I am independent of the Issuer and related companies applying all of the tests in section 1.5 of National Instrument 43-101.
4. I am one of the authors of this Technical Report titled Technical Report on the Shahuindo Heap Leach Project, Cajabamba, Peru prepared for Sulliden Gold Corporation Ltd., effective as of September 26, 2012, and dated November 9, 2012. I am responsible for Sections 15, 16, 21.2, and 21.10 , and am co-responsible for Sections 1, 3, and 24 through 26, except for those issues discussed in Section 3.0.
5. I visited the Shahuindo project site on May 4 through 7, 2010.
6. As of the date of the certificate, to the best of my knowledge, information and belief, the Technical Report contains the necessary scientific and technical information to make the Technical Report not misleading.
7. I have read National Instrument 43-101 and Form 43-101F1, and the Technical Report has been prepared in compliance with that instrument and form.
8. I consent to the filing of the Technical Report with any stock exchange and other regulatory authority and any publication by them, including electronic publication in the public company files on their websites accessible by the public, of the Technical Report.
Dated November 9, 2012.
“Thomas L. Dyer"
Thomas L. Dyer
| | |
| November 2012 | Shahuindo Project | 420 |
| |
|
MINE DEVELOPMENT ASSOCIATES
|
Paul Tietz, CPG
I, Paul Tietz, CPG., do hereby certify that I am currently employed as Senior Geologist for Mine Development Associates, Inc. located at 210 South Rock Blvd., Reno, Nevada 89502 and:
1. I graduated with a Bachelor of Science degree in Biology/Geology from the University of Rochester in 1977, a Master of Science degree in Geology from the University of North Carolina, Chapel Hill in 1981, and a Master of Science degree in Geological Engineering from the University of Nevada, Reno in 2004.
2. I am a Certified Professional Geologist (#11004) with the American Institute of Professional Geologists.
3. I have read the definition of “qualified person” set out in National Instrument 43-101 (NI 43-101) and certify that by reason of my education, affiliation with a professional association (as defined in NI 43-101) and past relevant work experience, I fulfill the requirements to be a “qualified person” for the purposes of NI 43-101. I am independent of the Issuer and related companies applying all of the tests in section 1.5 of National Instrument 43-101.
4. I am one of the authors of this Technical Report titled Technical Report on the Shahuindo Heap Leach Project, Cajabamba, Peru prepared for Sulliden Gold Corporation Ltd., effective as of September 26, 2012, and dated November 9, 2012. I am responsible for Sections 7.0 through 12.0, and 14.0 of the Technical Report. I am co-responsible for Sections 1.0, 3.0, 6.0, 25.0, and 26.0 of the Technical Report except for those issues discussed in Section 3.0.
5. I am the co-author of two previous technical reports on the Shahuindo property completed for Sulliden Gold in 2011 and 2012. I visited the Shahuindo project site May 4 through 7, 2010, September 14 through 18, 2011, and March 8 through 11, 2012.
6. As of the date of the certificate, to the best of my knowledge, information and belief, the Technical Report contains the necessary scientific and technical information to make the Technical Report not misleading.
7. I have read National Instrument 43-101 and Form 43-101F1, and the Technical Report has been prepared in compliance with that instrument and form.
8. I consent to the filing of the Technical Report with any stock exchange and other regulatory authority and any publication by them, including electronic publication in the public company files on their websites accessible by the public, of the Technical Report.
Dated November 9, 2012.
Paul Tietz
Paul Tietz
| | |
| November 2012 | Shahuindo Project | 421 |