Exhibit 99.1

Franklin Financial Network, Inc. (NYSE:FSB) Second Quarter 2016 Investor Call July 27, 2016

2 Forward - Looking Statements Except for the historical information contained herein, this presentation contains forward - looking statements within the meaning of Section 27A of the Securities Act of 1933, as amended, and Section 21E of the Securities Exchange Act of 1934, as amended. The forward - looking statements include, among other things, statements regarding intent, belief or expectations of the Company and can be identified by the use of words such as "may," "will," "should," "would," "assume," "outlook," "seek," "plan," "believe," "expect," "anticipate," "intend," "estimate," "forecast," and other comparable terms. The Company intends that all such statements be subject to the “safe harbor” provisions of those Acts. Because forward - looking statements involve risks and uncertainties, actual results may differ materially from those expressed or implied. Investors are cautioned not to place undue reliance on these forward - looking statements and are advised to carefully review the discussion of forward - looking statements and risk factors in documents the Company files with the Securities and Exchange Commission. The Company undertakes no obligation to publicly update or revise any forward - looking statements, whether as a result of new information, future events or otherwise.
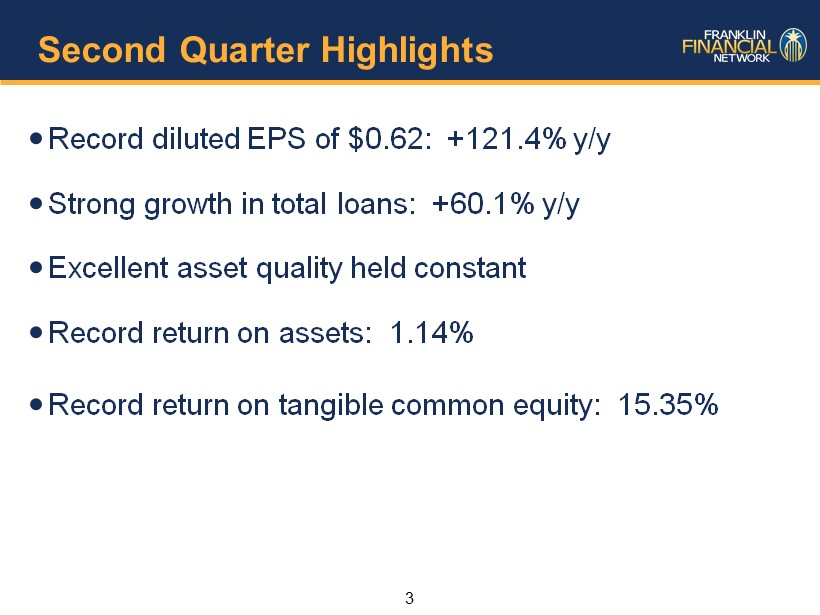
3 Second Quarter Highlights Record diluted EPS of $0.62: +121.4% y/y Strong growth in total loans: +60.1% y/y Excellent asset quality held constant Record return on assets: 1.14% Record return on tangible common equity: 15.35%
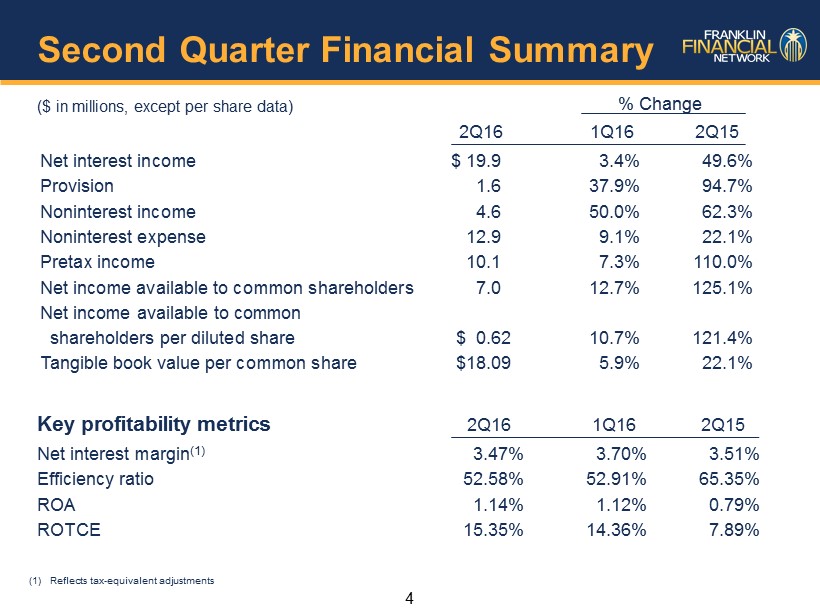
4 Second Quarter Financial Summary ($ in millions, except per share data) % Change 2Q16 1Q16 2Q15 Net interest income $ 19.9 3.4% 49.6% Provision 1.6 37.9% 94.7% Noninterest income 4.6 50.0% 62.3% Noninterest expense 12.9 9.1% 22.1% Pretax income 10.1 7.3% 110.0% Net income available to common shareholders 7.0 12.7% 125.1% Net income available to common shareholders per diluted share $ 0.62 10.7% 121.4% Tangible book value per common share $18.09 5.9% 22.1% Key profitability metrics 2Q16 1Q16 2Q15 Net interest margin (1) 3.47% 3.70% 3.51% Efficiency ratio 52.58% 52.91% 65.35% ROA 1.14% 1.12% 0.79% ROTCE 15.35% 14.36% 7.89% (1) Reflects tax - equivalent adjustments
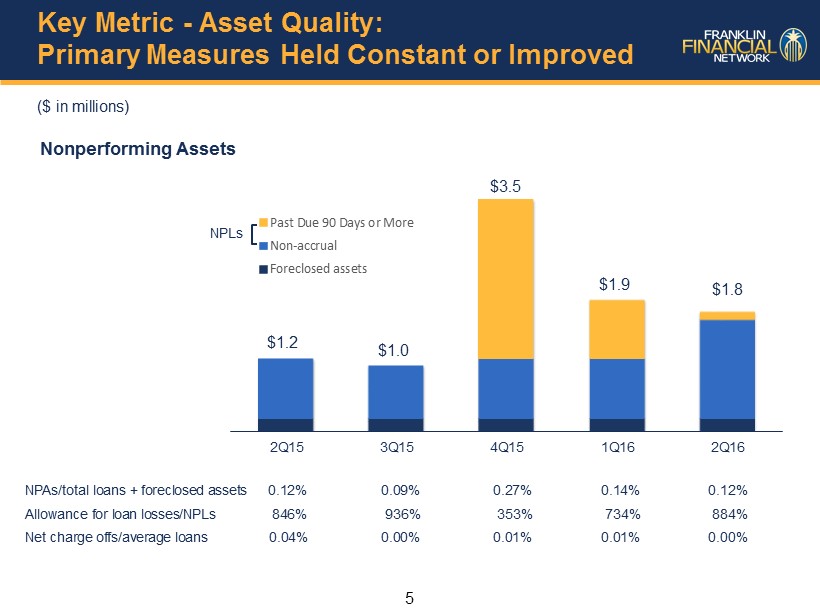
5 Key Metric - Asset Quality: Primary Measures Held Constant or Improved ($ in millions) Nonperforming Assets NPAs/total loans + foreclosed assets 0.12% 0.09% 0.27% 0.14% 0.12% Allowance for loan losses/NPLs 846% 936% 353% 734% 884% Net charge offs/average loans 0.04% 0.00% 0.01% 0.01% 0.00% 2Q15 3Q15 4Q15 1Q16 2Q16 Past Due 90 Days or More Non-accrual Foreclosed assets $1.2 $1.0 $3.5 $1.9 NPLs $1.8
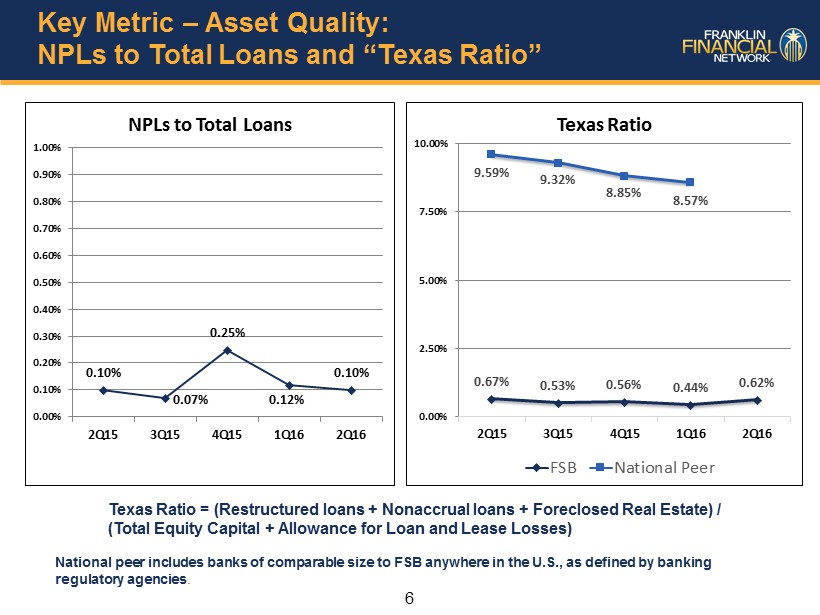
6 Key Metric – Asset Quality: NPLs to Total Loans and “Texas Ratio” 0.10% 0.07% 0.25% 0.12% 0.10% 0.00% 0.10% 0.20% 0.30% 0.40% 0.50% 0.60% 0.70% 0.80% 0.90% 1.00% 2Q15 3Q15 4Q15 1Q16 2Q16 NPLs to Total Loans Texas Ratio = (Restructured loans + Nonaccrual loans + Foreclosed Real Estate) / (Total Equity Capital + Allowance for Loan and Lease Losses) 0.67% 0.53% 0.56% 0.44% 0.62% 9.59% 9.32% 8.85% 8.57% 0.00% 2.50% 5.00% 7.50% 10.00% 2Q15 3Q15 4Q15 1Q16 2Q16 Texas Ratio FSB National Peer National peer includes banks of comparable size to FSB anywhere in the U.S., as defined by banking regulatory agencies .
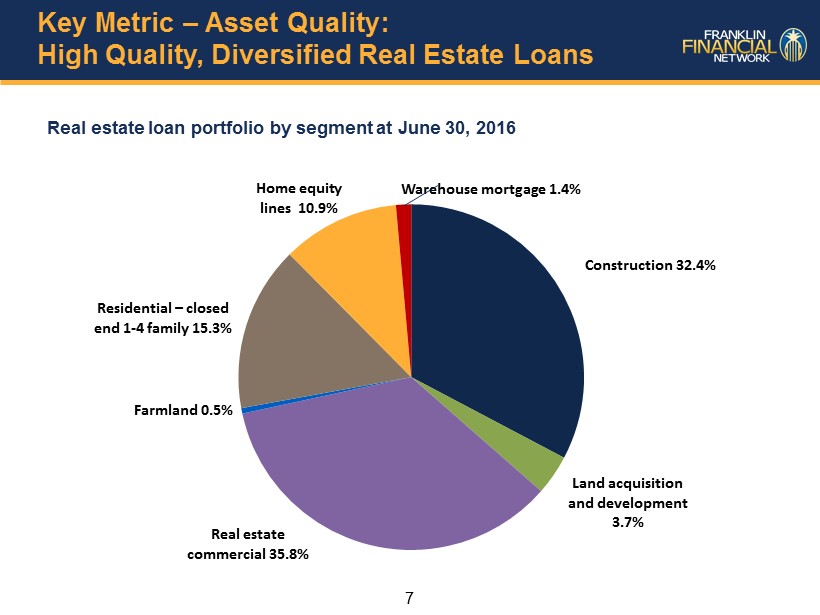
7 Key Metric – Asset Quality: High Quality, Diversified Real Estate Loans Real estate loan portfolio by segment at June 30, 2016 Construction 32.4% Land acquisition and development 3.7% Real estate commercial 35.8% Farmland 0.5% Residential – closed end 1 - 4 family 15.3% Home equity lines 10.9% Warehouse mortgage 1.4%
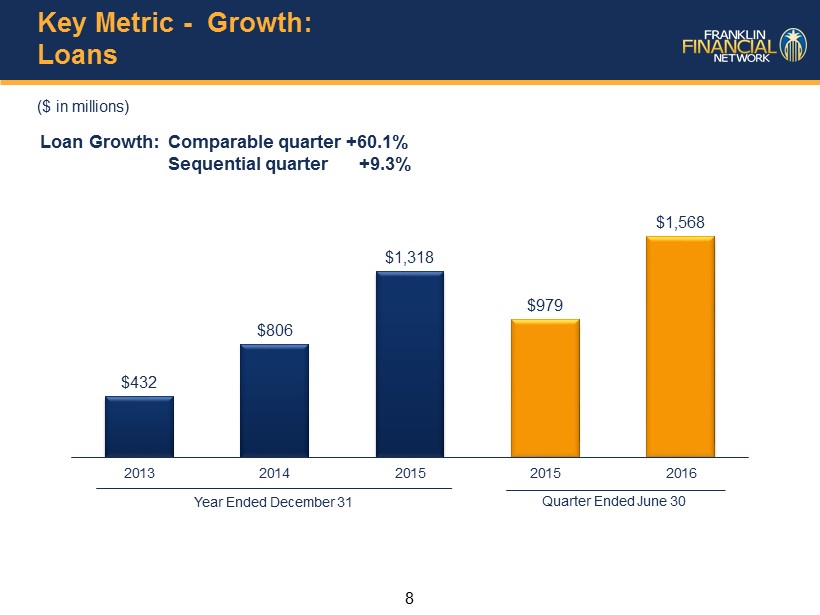
8 Key Metric - Growth: Loans ($ in millions) Loan Growth: Comparable quarter +60.1% Sequential quarter +9.3% $432 $806 $1,318 $979 $1,568 2013 2014 2015 2015 2016 Year Ended December 31 Quarter Ended June 30
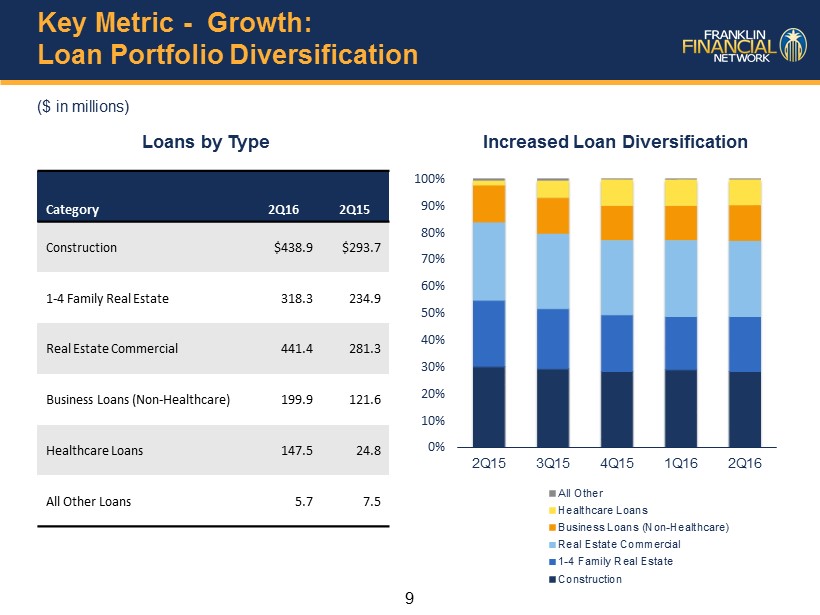
9 Key Metric - Growth: Loan Portfolio Diversification Category 2Q16 2Q15 Construction $438.9 $293.7 1 - 4 Family Real Estate 318.3 234.9 Real Estate Commercial 441.4 281.3 Business Loans (Non - Healthcare) 199.9 121.6 Healthcare Loans 147.5 24.8 All Other Loans 5.7 7.5 ($ in millions) Increased Loan Diversification 0% 10% 20% 30% 40% 50% 60% 70% 80% 90% 100% 2Q15 3Q15 4Q15 1Q16 2Q16 All Other Healthcare Loans Business Loans (Non-Healthcare) Real Estate Commercial 1-4 Family Real Estate Construction Loans by Type
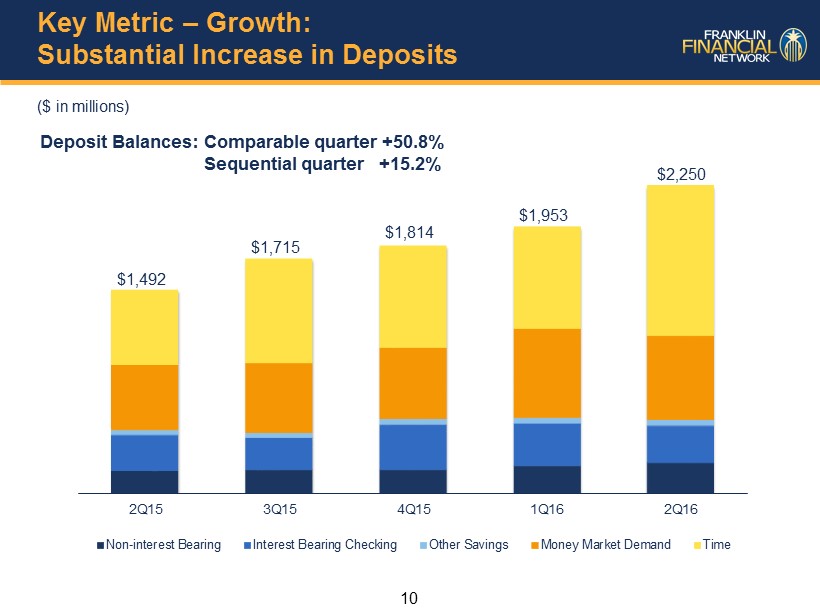
10 Key Metric – Growth: Substantial Increase in Deposits ($ in millions) Deposit Balances: Comparable quarter +50.8% Sequential quarter +15.2% 2Q15 3Q15 4Q15 1Q16 2Q16 Non-interest Bearing Interest Bearing Checking Other Savings Money Market Demand Time $1,492 $1,715 $1,814 $1,953 $2,250
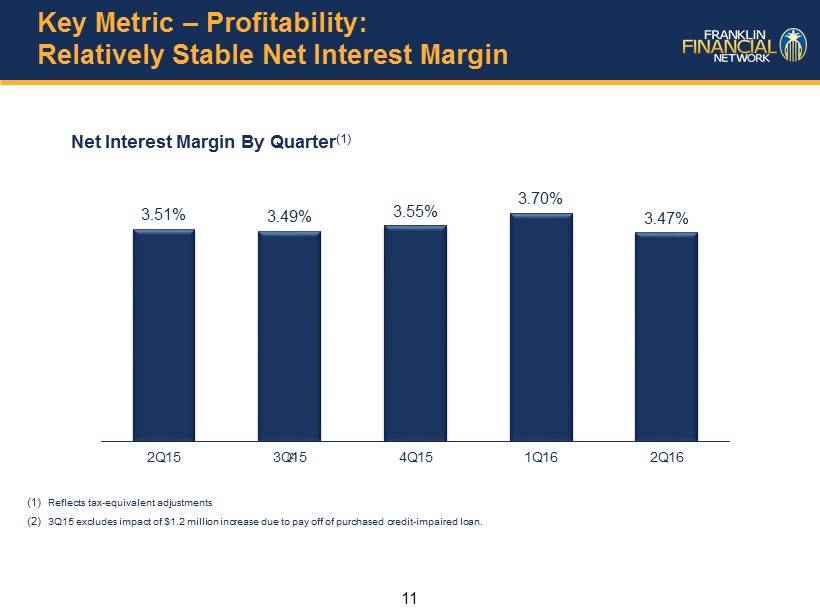
11 Key Metric – Profitability: Relatively Stable Net Interest Margin Net Interest Margin By Quarter (1) 3.51% 3.49% 3.55% 3.70% 3.47% 2Q15 3Q15 4Q15 1Q16 2Q16 (1) Reflects tax - equivalent adjustments (2) 3Q15 excludes impact of $1.2 million increase due to pay off of purchased credit - impaired loan. (2)
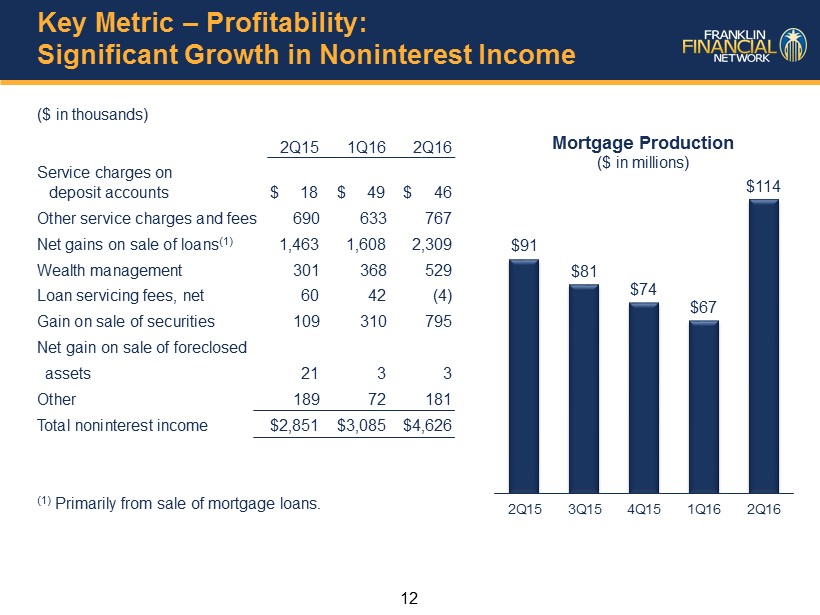
12 Key Metric – Profitability: Significant Growth in Noninterest Income ($ in thousands) 2Q15 1Q16 2Q16 Service charges on deposit accounts $ 18 $ 49 $ 46 Other service charges and fees 690 633 767 Net gains on sale of loans (1) 1,463 1,608 2,309 Wealth management 301 368 529 Loan servicing fees, net 60 42 (4) Gain on sale of securities 109 310 795 Net gain on sale of foreclosed assets 21 3 3 Other 189 72 181 Total noninterest income $2,851 $3,085 $4,626 (1) Primarily from sale of mortgage loans. $91 $81 $74 $67 $114 2Q15 3Q15 4Q15 1Q16 2Q16 Mortgage Production ($ in millions)
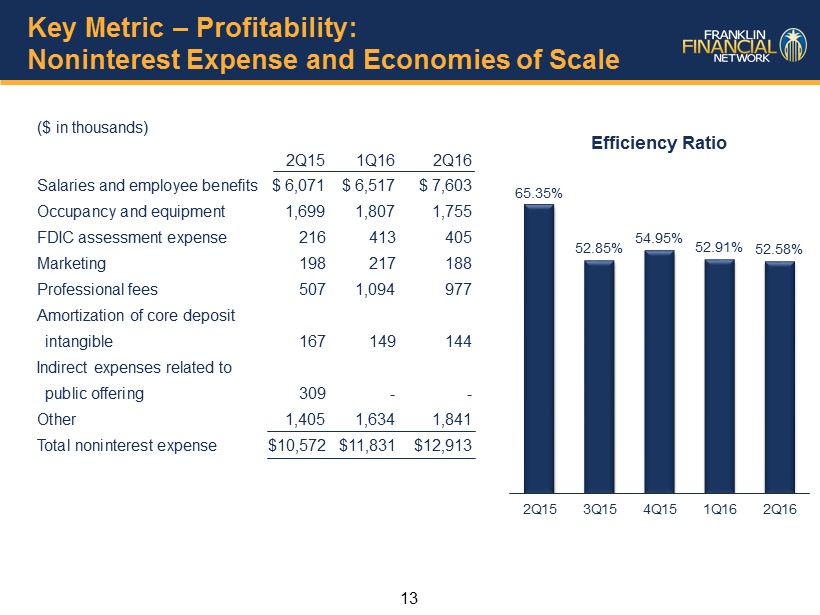
13 Key Metric – Profitability: Noninterest Expense and Economies of Scale ($ in thousands) 2Q15 1Q16 2Q16 Salaries and employee benefits $ 6,071 $ 6,517 $ 7,603 Occupancy and equipment 1,699 1,807 1,755 FDIC assessment expense 216 413 405 Marketing 198 217 188 Professional fees 507 1,094 977 Amortization of core deposit intangible 167 149 144 Indirect expenses related to public offering 309 - - Other 1,405 1,634 1,841 Total noninterest expense $10,572 $11,831 $12,913 65.35% 52.85% 54.95% 52.91% 52.58% 2Q15 3Q15 4Q15 1Q16 2Q16 Efficiency Ratio
14 Key Elements of FSB Performance Growth Real Estate Lending Asset Quality Proven, Successful Banking Model