Exhibit 99.2

Franklin Financial Network, Inc. (NYSE:FSB) Second Quarter 2017 Investor Call July 27, 2017
2 Forward - Looking Statements Except for the historical information contained herein, this presentation contains forward - looking statements within the meaning of Section 27A of the Securities Act of 1933, as amended, and Section 21E of the Securities Exchange Act of 1934, as amended. The forward - looking statements include, among other things, statements regarding intent, belief or expectations of the Company and can be identified by the use of words such as "may," "will," "should," "would," "assume," "outlook," "seek," "plan," "believe," "expect," "anticipate," "intend," "estimate," "forecast," and other comparable terms. The Company intends that all such statements be subject to the “safe harbor” provisions of those Acts. Because forward - looking statements involve risks and uncertainties, actual results may differ materially from those expressed or implied. Investors are cautioned not to place undue reliance on these forward - looking statements and are advised to carefully review the discussion of forward - looking statements and risk factors in documents the Company files with the Securities and Exchange Commission. The Company undertakes no obligation to publicly update or revise any forward - looking statements, whether as a result of new information, future events or otherwise.
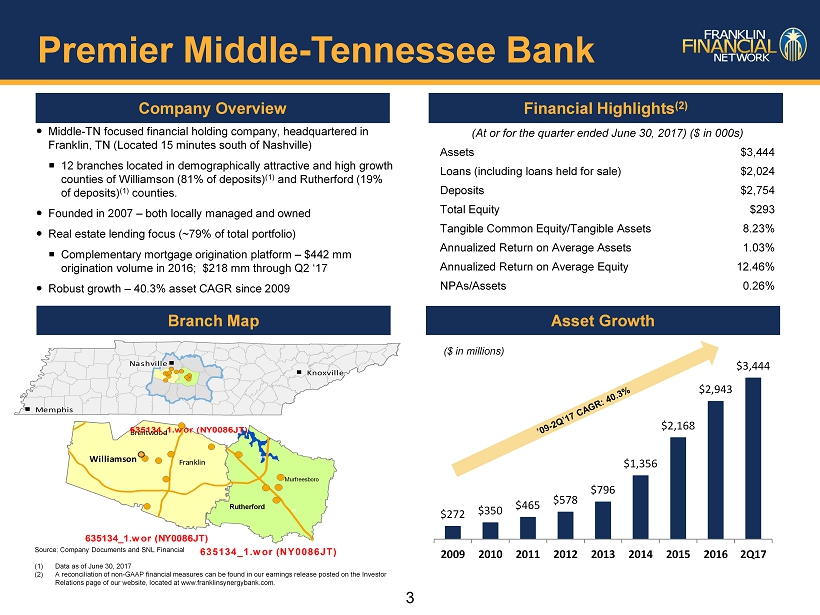
3 Company Overview Financial Highlights (2) Source: Company Documents and SNL Financial (1) Data as of June 30, 2017 (2) A reconciliation of non - GAAP financial measures can be found in our earnings release posted on the Investor Relations page of our website, located at www.franklinsynergybank.com. Asset Growth 635134_1.wor (NY0086JT) 24 840 Murfreesboro Rutherford 635134_1.wor (NY0086JT) Franklin Brentwood Williamson 840 65 40 635134_1.wor (NY0086JT) 635134_1.wor (NY0086JT) Nashville Nashville Nashville Nashville Nashville Nashville Nashville Nashville Nashville Nashville Nashville Nashville Nashville Nashville Nashville Nashville Nashville Nashville Nashville Nashville Nashville Nashville Nashville Nashville Nashville Nashville Nashville Nashville Nashville Nashville Nashville Nashville Nashville Nashville Nashville Nashville Nashville Nashville Nashville Nashville Nashville Nashville Nashville Nashville Nashville Nashville Nashville Nashville Nashville Knoxville Knoxville Knoxville Knoxville Knoxville Knoxville Knoxville Knoxville Knoxville Knoxville Knoxville Knoxville Knoxville Knoxville Knoxville Knoxville Knoxville Knoxville Knoxville Knoxville Knoxville Knoxville Knoxville Knoxville Knoxville Knoxville Knoxville Knoxville Knoxville Knoxville Knoxville Knoxville Knoxville Knoxville Knoxville Knoxville Knoxville Knoxville Knoxville Knoxville Knoxville Knoxville Knoxville Knoxville Knoxville Knoxville Knoxville Knoxville Knoxville Memphis Memphis Memphis Memphis Memphis Memphis Memphis Memphis Memphis Memphis Memphis Memphis Memphis Memphis Memphis Memphis Memphis Memphis Memphis Memphis Memphis Memphis Memphis Memphis Memphis Memphis Memphis Memphis Memphis Memphis Memphis Memphis Memphis Memphis Memphis Memphis Memphis Memphis Memphis Memphis Memphis Memphis Memphis Memphis Memphis Memphis Memphis Memphis Memphis (At or for the quarter ended June 30, 2017) ($ in 000s) Assets $3,444 Loans (including loans held for sale) $2,024 Deposits $2,754 Total Equity $293 Tangible Common Equity/Tangible Assets 8.23 % Annualized Return on Average Assets 1.03% Annualized Return on Average Equity 12.46% NPAs/Assets 0.26% Middle - TN focused financial holding company, headquartered in Franklin, TN (Located 15 minutes south of Nashville) 12 branches located in demographically attractive and high growth counties of Williamson ( 81% of deposits ) (1) and Rutherford (19% of deposits ) (1) counties. Founded in 2007 – both locally managed and owned Real estate lending focus (~ 79% of total portfolio) Complementary mortgage origination platform – $442 mm origination volume in 2016; $218 mm through Q2 ‘ 17 Robust growth – 40.3% asset CAGR since 2009 Branch Map ($ in millions) Premier Middle - Tennessee Bank $272 $350 $465 $578 $796 $1,356 $2,168 $2,943 $3,444 2009 2010 2011 2012 2013 2014 2015 2016 2Q17
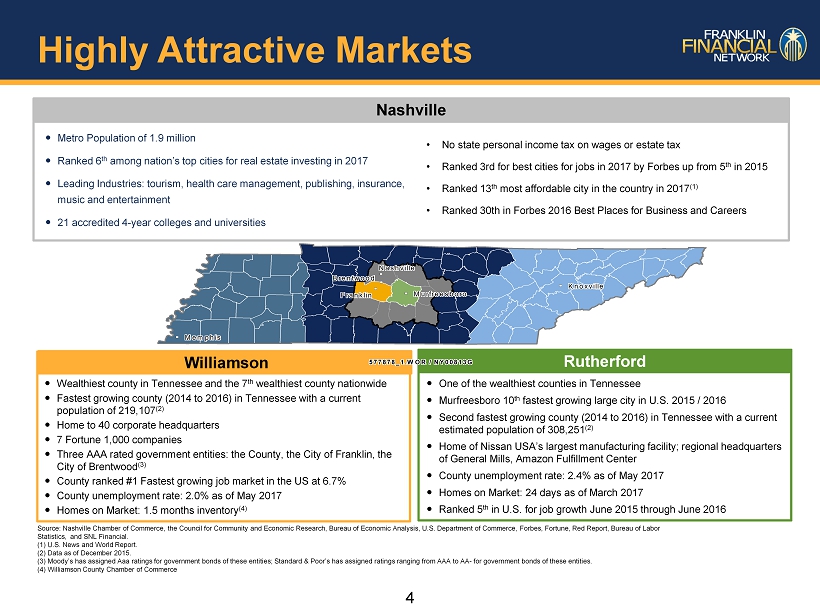
4 Ranked 30 th in Forbes 2016 Best Places for Business and Careers Metro Population of 1.9 million Ranked 6 th among nation’s top cities for real estate investing in 2017 Leading Industries: tourism, health care management, publishing, insurance, music and entertainment 21 accredited 4 - year colleges and universities Source: Nashville Chamber of Commerce, the Council for Community and Economic Research, Bureau of Economic Analysis, U.S. Dep art ment of Commerce, Forbes , Fortune, Red Report, Bureau of Labor Statistics, and SNL Financial. (1) U.S. News and World Report. (2) Data as of December 2015. (3) Moody’s has assigned Aaa ratings for government bonds of these entities; Standard & Poor’s has assigned ratings ranging from AAA to AA - for government b onds of these entities. (4) Williamson County Chamber of Commerce Nashville • No state personal income tax on wages or estate tax • Ranked 3rd for best cities for jobs in 2017 by Forbes up from 5 th in 2015 • Ranked 13 th most affordable city in the country in 2017 (1 ) • Ranked 30th in Forbes 2016 Best Places for Business and Careers Wealthiest county in Tennessee and the 7 th wealthiest county nationwide F astest growing county ( 2014 to 2016) in Tennessee with a current population of 219,107 (2 ) Home to 40 corporate headquarters 7 Fortune 1,000 companies Three AAA rated government entities: the County, the City of Franklin, the City of Brentwood (3) County ranked #1 Fastest growing job market in the US at 6.7% County unemployment rate: 2.0% as of May 2017 Homes on Market: 1.5 months inventory (4) Williamson Rutherford One of the wealthiest counties in Tennessee Murfreesboro 10 th fastest growing large city in U.S. 2015 / 2016 Second fastest growing county ( 2014 to 2016) in Tennessee with a current estimated population of 308,251 (2 ) Home of Nissan USA’s largest manufacturing facility; regional headquarters of General Mills, Amazon Fulfillment Center County unemployment rate: 2.4% as of May 2017 Homes on Market: 24 days as of March 2017 Ranked 5 th in U.S. for job growth June 2015 through June 2016 577878_1.WOR / NY00813G 577878_1.WOR / NY00813G 577878_1.WOR / NY00813G 577878_1.WOR / NY00813G 577878_1.WOR / NY00813G 577878_1.WOR / NY00813G 577878_1.WOR / NY00813G 577878_1.WOR / NY00813G 577878_1.WOR / NY00813G 577878_1.WOR / NY00813G 577878_1.WOR / NY00813G 577878_1.WOR / NY00813G 577878_1.WOR / NY00813G 577878_1.WOR / NY00813G 577878_1.WOR / NY00813G 577878_1.WOR / NY00813G 577878_1.WOR / NY00813G 577878_1.WOR / NY00813G 577878_1.WOR / NY00813G 577878_1.WOR / NY00813G 577878_1.WOR / NY00813G 577878_1.WOR / NY00813G 577878_1.WOR / NY00813G 577878_1.WOR / NY00813G 577878_1.WOR / NY00813G 577878_1.WOR / NY00813G 577878_1.WOR / NY00813G 577878_1.WOR / NY00813G 577878_1.WOR / NY00813G 577878_1.WOR / NY00813G 577878_1.WOR / NY00813G 577878_1.WOR / NY00813G 577878_1.WOR / NY00813G 577878_1.WOR / NY00813G 577878_1.WOR / NY00813G 577878_1.WOR / NY00813G 577878_1.WOR / NY00813G 577878_1.WOR / NY00813G 577878_1.WOR / NY00813G 577878_1.WOR / NY00813G 577878_1.WOR / NY00813G 577878_1.WOR / NY00813G 577878_1.WOR / NY00813G 577878_1.WOR / NY00813G 577878_1.WOR / NY00813G 577878_1.WOR / NY00813G 577878_1.WOR / NY00813G 577878_1.WOR / NY00813G 577878_1.WOR / NY00813G Nashville Nashville Nashville Nashville Nashville Nashville Nashville Nashville Nashville Nashville Nashville Nashville Nashville Nashville Nashville Nashville Nashville Nashville Nashville Nashville Nashville Nashville Nashville Nashville Nashville Nashville Nashville Nashville Nashville Nashville Nashville Nashville Nashville Nashville Nashville Nashville Nashville Nashville Nashville Nashville Nashville Nashville Nashville Nashville Nashville Nashville Nashville Nashville Nashville Brentwood Brentwood Brentwood Brentwood Brentwood Brentwood Brentwood Brentwood Brentwood Brentwood Brentwood Brentwood Brentwood Brentwood Brentwood Brentwood Brentwood Brentwood Brentwood Brentwood Brentwood Brentwood Brentwood Brentwood Brentwood Brentwood Brentwood Brentwood Brentwood Brentwood Brentwood Brentwood Brentwood Brentwood Brentwood Brentwood Brentwood Brentwood Brentwood Brentwood Brentwood Brentwood Brentwood Brentwood Brentwood Brentwood Brentwood Brentwood Brentwood Franklin Franklin Franklin Franklin Franklin Franklin Franklin Franklin Franklin Franklin Franklin Franklin Franklin Franklin Franklin Franklin Franklin Franklin Franklin Franklin Franklin Franklin Franklin Franklin Franklin Franklin Franklin Franklin Franklin Franklin Franklin Franklin Franklin Franklin Franklin Franklin Franklin Franklin Franklin Franklin Franklin Franklin Franklin Franklin Franklin Franklin Franklin Franklin Franklin Murfreesboro Murfreesboro Murfreesboro Murfreesboro Murfreesboro Murfreesboro Murfreesboro Murfreesboro Murfreesboro Murfreesboro Murfreesboro Murfreesboro Murfreesboro Murfreesboro Murfreesboro Murfreesboro Murfreesboro Murfreesboro Murfreesboro Murfreesboro Murfreesboro Murfreesboro Murfreesboro Murfreesboro Murfreesboro Murfreesboro Murfreesboro Murfreesboro Murfreesboro Murfreesboro Murfreesboro Murfreesboro Murfreesboro Murfreesboro Murfreesboro Murfreesboro Murfreesboro Murfreesboro Murfreesboro Murfreesboro Murfreesboro Murfreesboro Murfreesboro Murfreesboro Murfreesboro Murfreesboro Murfreesboro Murfreesboro Murfreesboro Knoxville Knoxville Knoxville Knoxville Knoxville Knoxville Knoxville Knoxville Knoxville Knoxville Knoxville Knoxville Knoxville Knoxville Knoxville Knoxville Knoxville Knoxville Knoxville Knoxville Knoxville Knoxville Knoxville Knoxville Knoxville Knoxville Knoxville Knoxville Knoxville Knoxville Knoxville Knoxville Knoxville Knoxville Knoxville Knoxville Knoxville Knoxville Knoxville Knoxville Knoxville Knoxville Knoxville Knoxville Knoxville Knoxville Knoxville Knoxville Knoxville Memphis Memphis Memphis Memphis Memphis Memphis Memphis Memphis Memphis Memphis Memphis Memphis Memphis Memphis Memphis Memphis Memphis Memphis Memphis Memphis Memphis Memphis Memphis Memphis Memphis Memphis Memphis Memphis Memphis Memphis Memphis Memphis Memphis Memphis Memphis Memphis Memphis Memphis Memphis Memphis Memphis Memphis Memphis Memphis Memphis Memphis Memphis Memphis Memphis Highly Attractive Markets
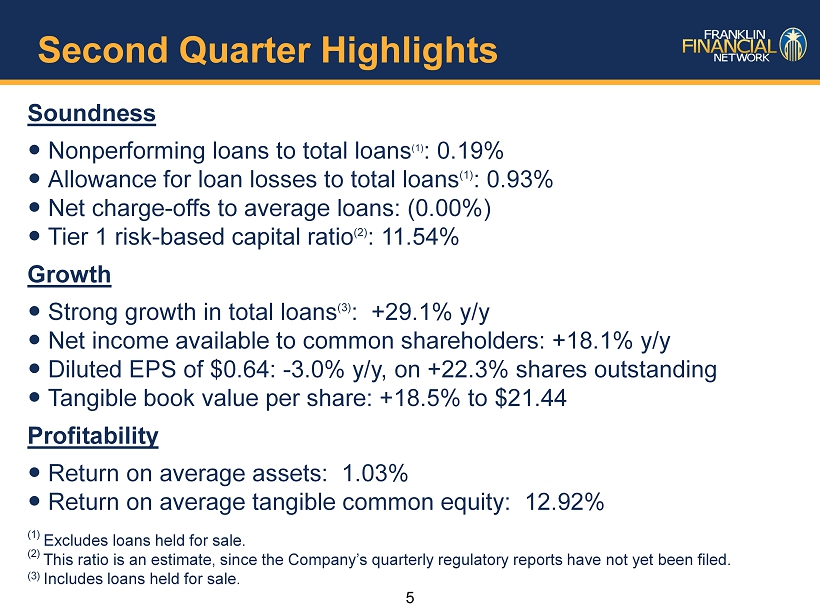
5 Second Quarter Highlights Soundness Nonperforming loans to total loans (1) : 0.19% Allowance for loan losses to total loans (1) : 0.93% Net charge - offs to average loans: (0.00%) Tier 1 risk - based capital ratio (2 ) : 11.54% Growth Strong growth in total loans (3) : +29.1% y/y Net income available to common shareholders: +18.1% y/y Diluted EPS of $ 0.64: - 3.0% y/y, on +22.3% shares outstanding Tangible book value per share: +18.5% to $21.44 Profitability Return on average assets : 1.03% Return on average tangible common equity: 12.92% (1) Excludes loans held for sale . (2) This ratio is an estimate, since the Company’s quarterly regulatory reports have not yet been filed. (3) Includes loans held for sale.

6 Second Quarter Financial Summary ($ in millions, except per share data) % Change 2Q17 1Q17 2Q16 Net interest income $ 24.5 3.5% 22.8% Provision 0.6 - 69.1% - 63.4% Noninterest income 3.9 - 3.2% - 16.1% Noninterest expense 15.3 7.1% 18.4% Pretax income 12.5 8.4% 23.9% Net income available to common shareholders 8.9 11.7% 18.1% Net income available to common shareholders per diluted share $ 0.64 10.3% - 3.0% Tangible book value per common share $21.44 5.3% 18.5% Key profitability metrics 2Q17 1Q17 2Q16 Net interest margin (1) 3.08 % 3.18% 3.47% Efficiency ratio 53.91% 51.63% 52.58% Return on average assets 1.03% 0.99% 1.22% Return on average tangible common equity 12.92% 12.28 % 16.47% (1) Reflects tax - equivalent adjustments
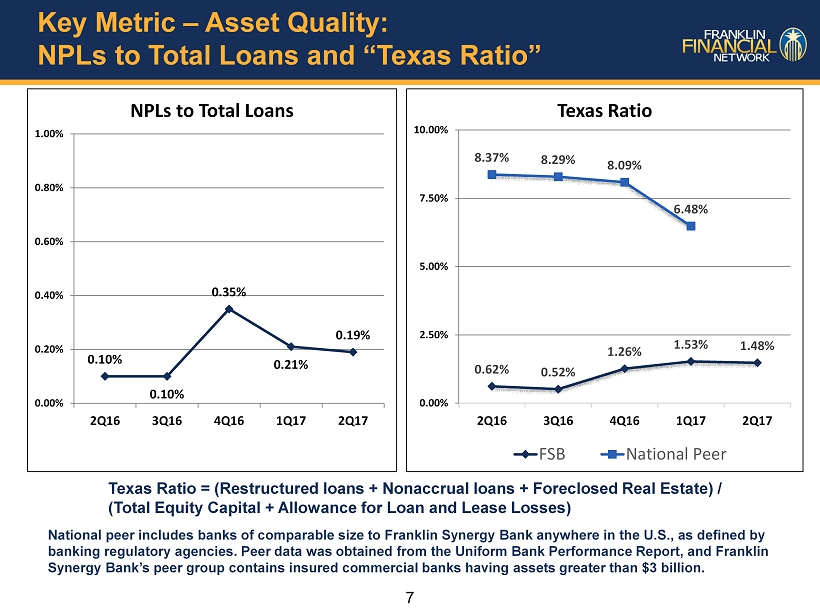
7 Key Metric – Asset Quality: NPLs to Total Loans and “Texas Ratio” 0.10% 0.10% 0.35% 0.21% 0.19% 0.00% 0.20% 0.40% 0.60% 0.80% 1.00% 2Q16 3Q16 4Q16 1Q17 2Q17 NPLs to Total Loans Texas Ratio = (Restructured loans + Nonaccrual loans + Foreclosed Real Estate) / (Total Equity Capital + Allowance for Loan and Lease Losses) 0.62% 0.52% 1.26% 1.53% 1.48% 8.37% 8.29% 8.09% 6.48% 0.00% 2.50% 5.00% 7.50% 10.00% 2Q16 3Q16 4Q16 1Q17 2Q17 Texas Ratio FSB National Peer National peer includes banks of comparable size to Franklin Synergy Bank anywhere in the U.S., as defined by banking regulatory agencies. Peer data was obtained from the Uniform Bank Performance Report, and Franklin Synergy Bank’s peer group contains insured commercial banks having assets greater than $ 3 billion .
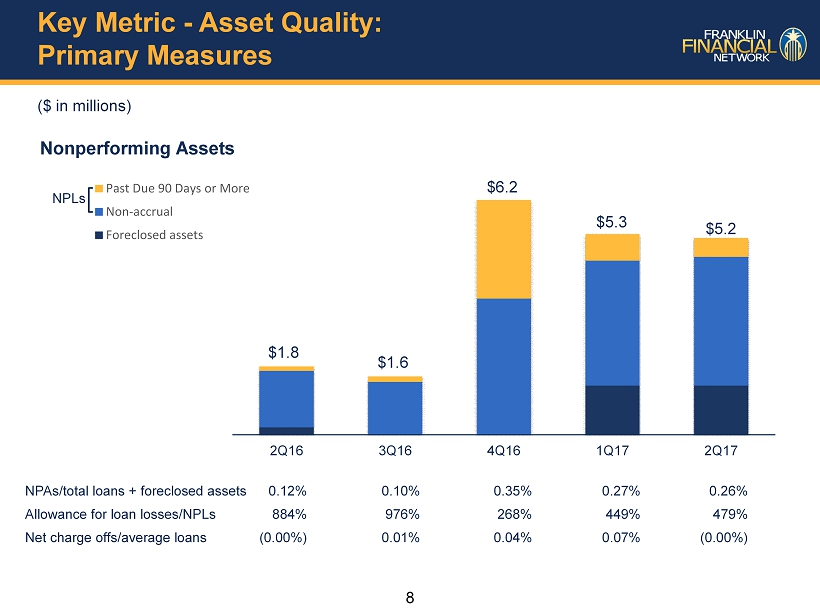
8 Key Metric - Asset Quality: Primary Measures ($ in millions) Nonperforming Assets NPAs/total loans + foreclosed assets 0.12% 0.10% 0.35% 0.27% 0.26% Allowance for loan losses/NPLs 884 % 976% 268% 449% 479 % Net charge offs/average loans (0.00%) 0.01% 0.04% 0.07% (0.00%) 2Q16 3Q16 4Q16 1Q17 2Q17 Past Due 90 Days or More Non-accrual Foreclosed assets $1.6 $6.2 NPLs $1.8 $5.3 $ 5.2

9 Key Metric - Asset Quality: High Quality, Diversified Real Estate Loans Real estate loan portfolio by segment at June 30, 2017 Construction 28.4% Warehouse mortgage 0.7% Acquisition and development 2.8% Commercial real estate 36.3% Farmland 0.3% Residential - closed end 1 - 4 family 21.7% Home equity lines 9.8%
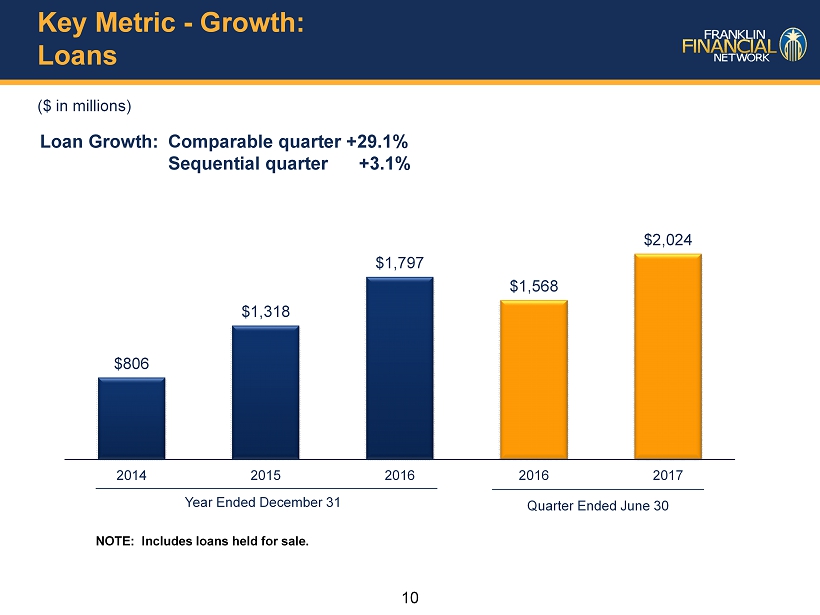
10 Key Metric - Growth: Loans ($ in millions) Loan Growth: Comparable quarter +29.1% Sequential quarter +3.1% $806 $1,318 $1,797 $1,568 $2,024 2014 2015 2016 2016 2017 Year Ended December 31 Quarter Ended June 30 NOTE: Includes loans held for sale.
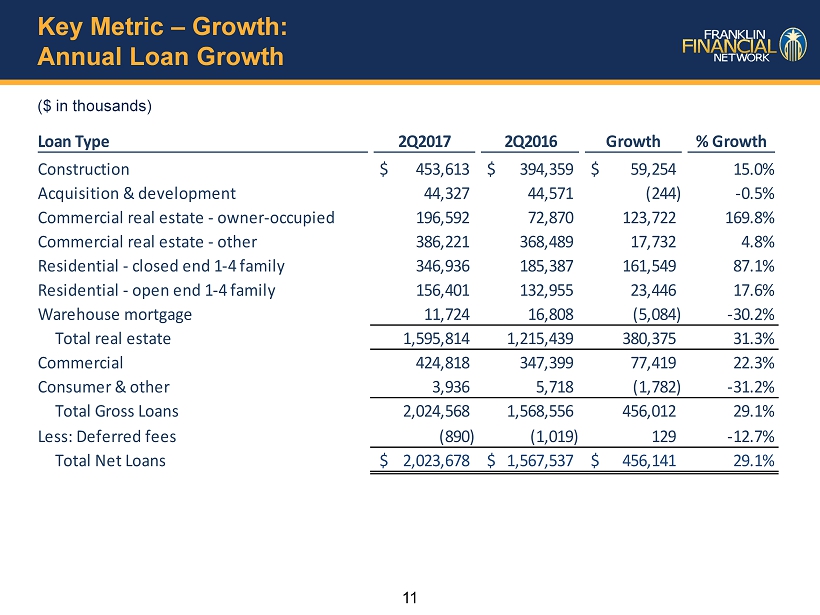
11 Key Metric – Growth: Annual Loan Growth Loan Type 2Q2017 2Q2016 Growth % Growth Construction 453,613$ 394,359$ 59,254$ 15.0% Acquisition & development 44,327 44,571 (244) -0.5% Commercial real estate - owner-occupied 196,592 72,870 123,722 169.8% Commercial real estate - other 386,221 368,489 17,732 4.8% Residential - closed end 1-4 family 346,936 185,387 161,549 87.1% Residential - open end 1-4 family 156,401 132,955 23,446 17.6% Warehouse mortgage 11,724 16,808 (5,084) -30.2% Total real estate 1,595,814 1,215,439 380,375 31.3% Commercial 424,818 347,399 77,419 22.3% Consumer & other 3,936 5,718 (1,782) -31.2% Total Gross Loans 2,024,568 1,568,556 456,012 29.1% Less: Deferred fees (890) (1,019) 129 -12.7% Total Net Loans 2,023,678$ 1,567,537$ 456,141$ 29.1% ($ in thousands)

12 Key Metric - Growth: Substantial Y/Y Increase in Deposits ($ in millions) Deposit Balances: Comparable quarter +22.4% Sequential quarter - 2.2 % 2Q16 3Q16 4Q16 1Q17 2Q17 Non-interest Bearing Interest Bearing Checking Other Savings Money Market Demand Time $2,392 $2,250 $2,218 $2,817 $ 2,754
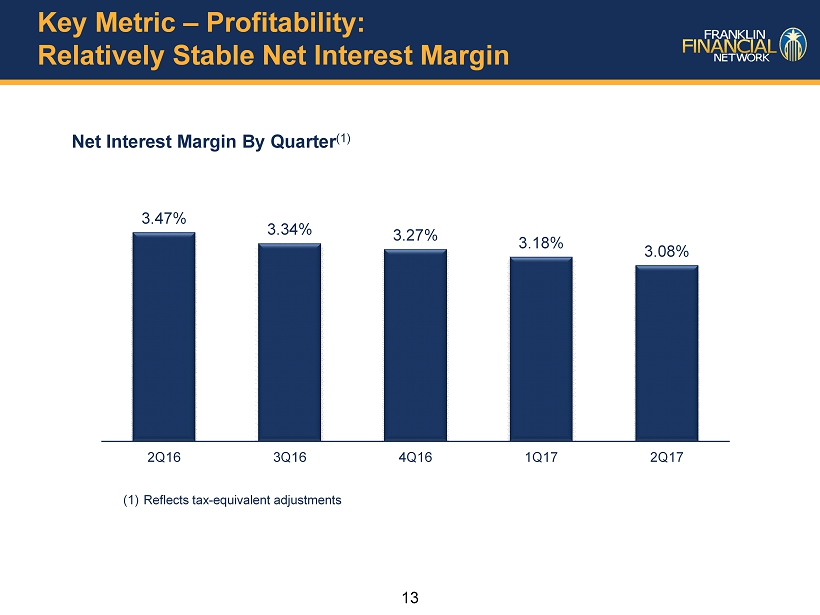
13 Key Metric – Profitability: Relatively Stable Net Interest Margin Net Interest Margin By Quarter (1) 3.47% 3.34% 3.27% 3.18% 3.08% 2Q16 3Q16 4Q16 1Q17 2Q17 (1) Reflects tax - equivalent adjustments
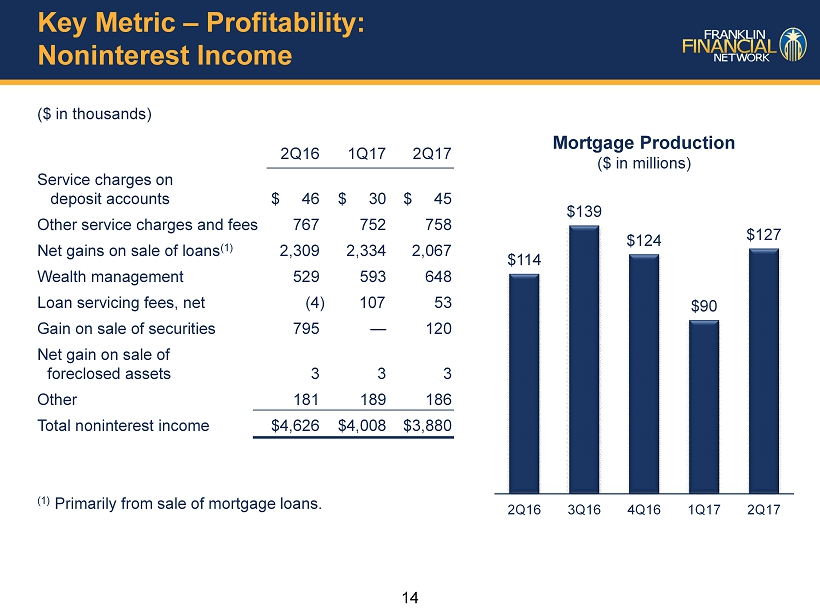
14 Key Metric – Profitability: Noninterest Income ($ in thousands) 2Q16 1Q17 2Q17 Service charges on deposit accounts $ 46 $ 30 $ 45 Other service charges and fees 767 752 758 Net gains on sale of loans (1) 2,309 2,334 2,067 Wealth management 529 593 648 Loan servicing fees, net (4 ) 107 53 Gain on sale of securities 795 — 120 Net gain on sale of foreclosed assets 3 3 3 Other 181 189 186 Total noninterest income $4,626 $4,008 $3,880 (1) Primarily from sale of mortgage loans. $114 $139 $124 $90 $127 2Q16 3Q16 4Q16 1Q17 2Q17 Mortgage Production ($ in millions)
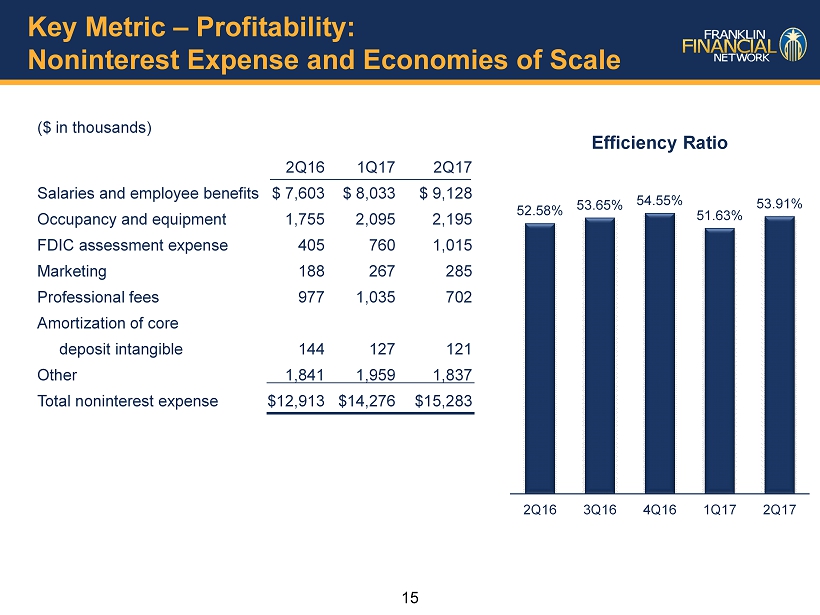
15 Key Metric – Profitability: Noninterest Expense and Economies of Scale ($ in thousands) 2Q16 1Q17 2Q17 Salaries and employee benefits $ 7,603 $ 8,033 $ 9,128 Occupancy and equipment 1,755 2,095 2,195 FDIC assessment expense 405 760 1,015 Marketing 188 267 285 Professional fees 977 1,035 702 Amortization of core deposit intangible 144 127 121 Other 1,841 1,959 1,837 Total noninterest expense $ 12,913 $ 14,276 $ 15,283 52.58% 53.65% 54.55% 51.63% 53.91% 2Q16 3Q16 4Q16 1Q17 2Q17 Efficiency Ratio

16 Key Elements of FSB Performance Growth Real Estate Lending Asset Quality Proven, Successful Banking Model