Exhibit 99.1
Franklin Financial Network, Inc.(NYSE:FSB)Quarterly Investor Presentation November 2019
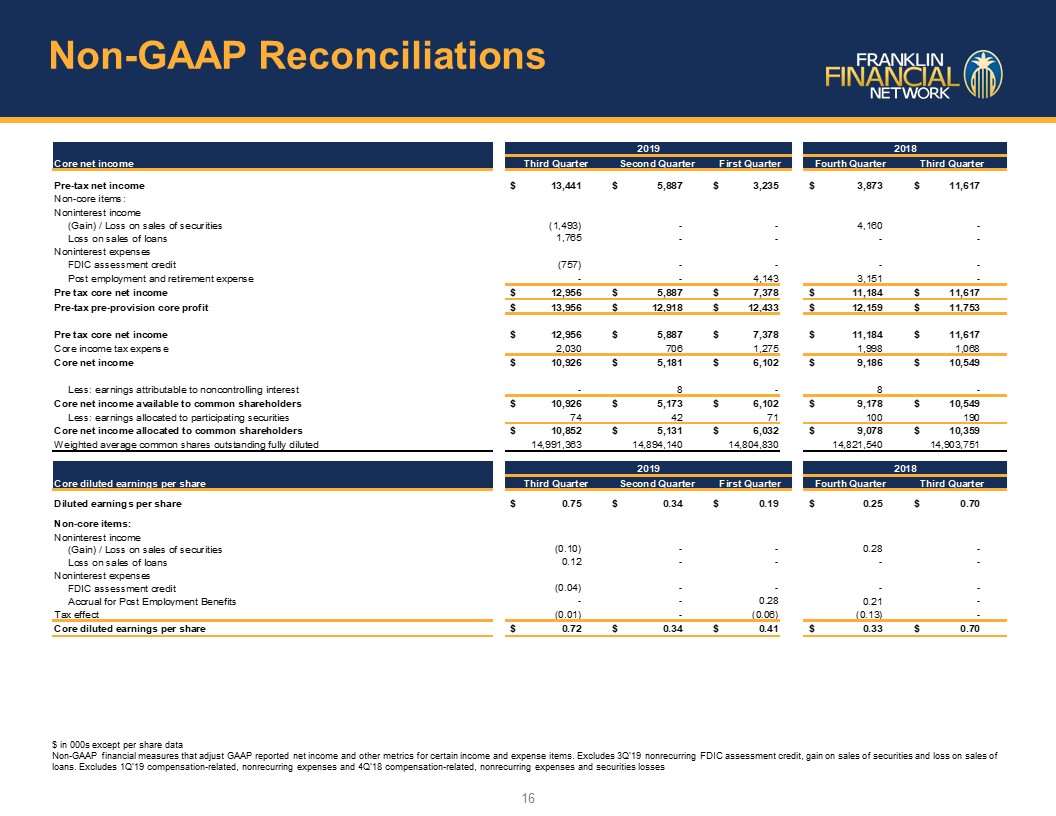
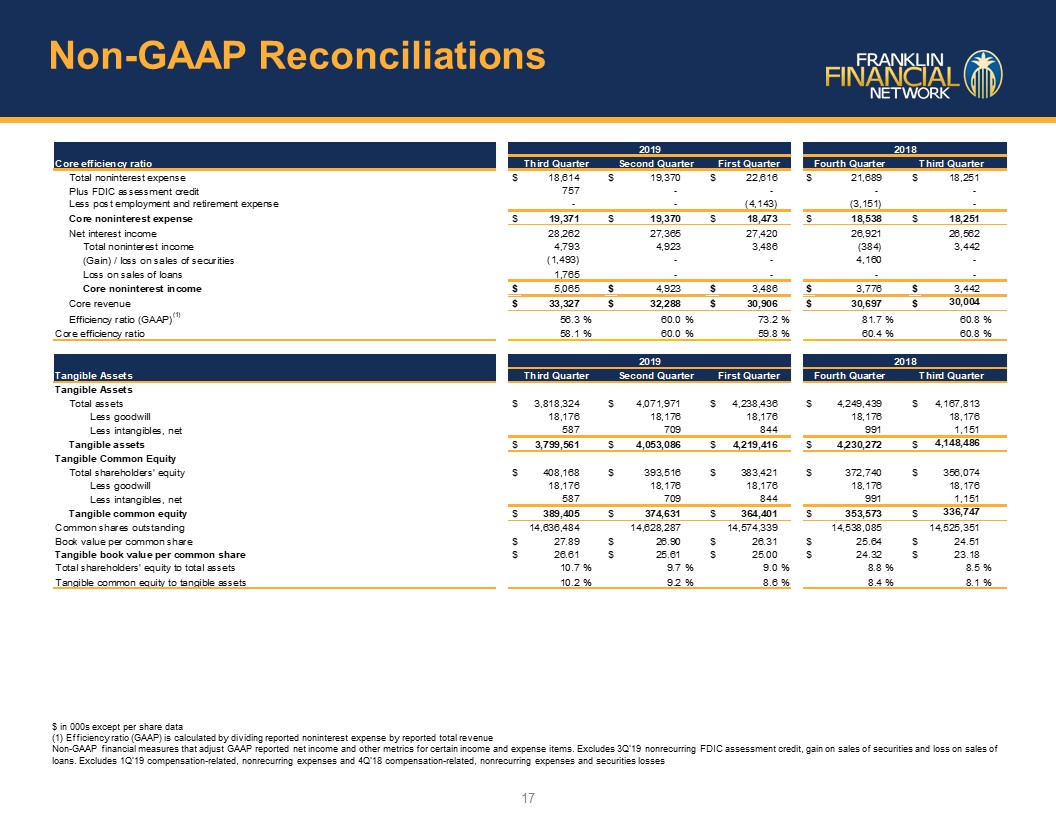
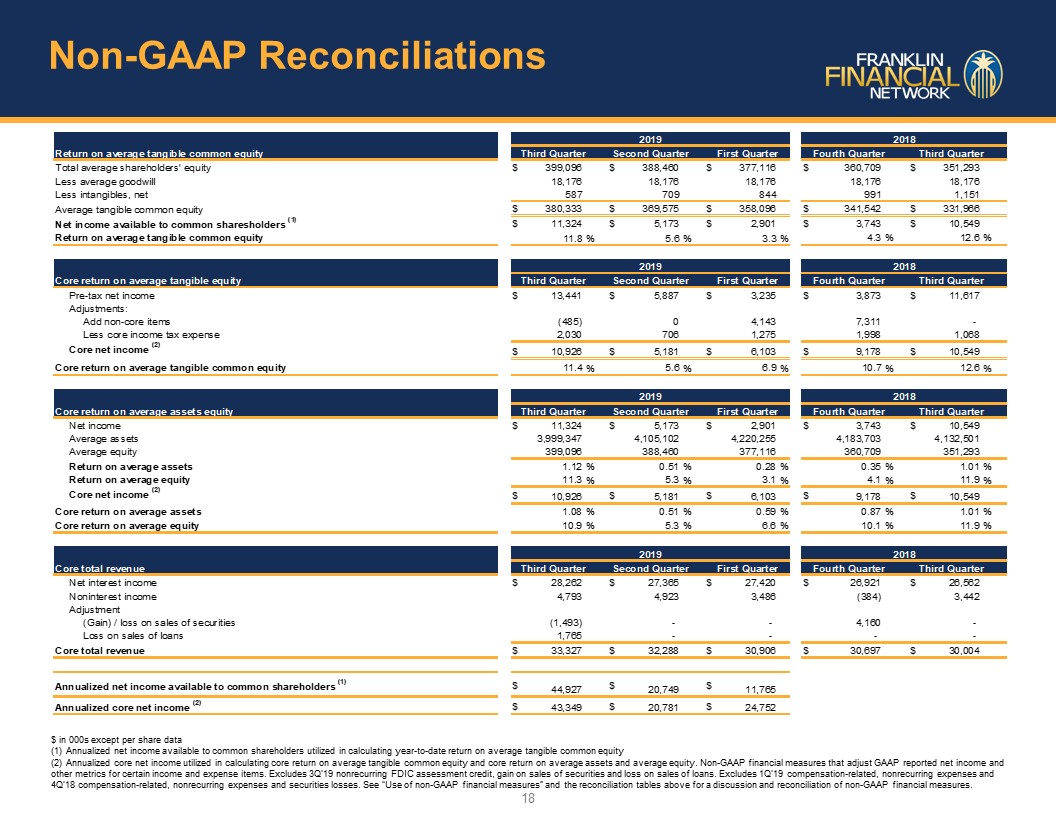
Forward-Looking Statements Except for the historical information contained herein, this presentation contains forward-looking statements within the meaning of Section 27A of the Securities Act of 1933, as amended, and Section 21E of the Securities Exchange Act of 1934, as amended. The forward-looking statements include, among other things, statements regarding intent, belief or expectations of the Company and can be identified by the use of words such as "may," "will," "should," "would," "assume," "outlook," "seek," "plan," "believe," "expect," "anticipate," "intend," "estimate," "forecast," and other comparable terms. The Company intends that all such statements be subject to the “safe harbor” provisions of those Acts. Because forward-looking statements involve risks and uncertainties, actual results may differ materially from those expressed or implied. Investors are cautioned not to place undue reliance on these forward-looking statements and are advised to carefully review the discussion of forward-looking statements and risk factors in documents the Company files with the Securities and Exchange Commission. The Company undertakes no obligation to publicly update or revise any forward-looking statements, whether as a result of new information, future events or otherwise, unless otherwise required by law.Use of non-GAAP Financial MeasuresSome of the financial data included in this presentation and our selected historical consolidated financial information are not measures of financial performance recognized by GAAP. Our management uses these non-GAAP financial measures in its analysis of our performance:"Common equity” is defined as total shareholders’ equity at end of period less the liquidation preference value of the preferred stock;“Tangible common equity” is common equity less goodwill and other intangible assets;“Total tangible assets” is defined as total assets less goodwill and other intangible assets;“Other intangible assets” is defined as the sum of core deposit intangible and SBA servicing rights;"Tangible book value per share" is defined as tangible common equity divided by total common shares outstanding. This measure is important to investors interested in changes from period-to-period in book value per share exclusive of changes in intangible assets;“Tangible common equity ratio” is defined as the ratio of tangible common equity divided by total tangible assets. We believe that this measure is important to many investors in the marketplace who are interested in relative changes from period-to period in common equity and total assets, each exclusive of changes in intangible assets;“Core Return on Average Tangible Common Equity” is defined as annualized core net income available to common shareholders divided by average tangible common equity;“Core Efficiency Ratio” is defined as noninterest expense divided by our operating revenue, which is equal to net interest income plus noninterest income with all adjusted to certain one-time expenses;“Core Diluted Earnings Per Share” is defined as reported earnings per share adjusted for certain one-time expenses;“Core Non-Interest Income” is defined as non-interest income adjusted for certain one-time items;“Core Non-Interest Expense” is defined as non-interest expense adjusted for certain one-time items;“Core Compensation Expense” is defined as compensation expense adjusted for certain one-time items;“Core Net Income” is defined as “Net Income Available to Common Shareholders” adjusted for certain one-time items;“Pre-tax core net income” is defined as pre-tax net income adjusted for certain one-time noninterest income and noninterest expense items; and“Pre-tax pre-provision core profit” is defined as pre-tax core net income and provision for loan losses. We believe these non-GAAP financial measures provide useful information to management and investors that is supplementary to our financial condition, results of operations and cash flows computed in accordance with GAAP; however, we acknowledge that our non-GAAP financial measures have a number of limitations. As such, you should not view these disclosures as a substitute for results determined in accordance with GAAP, and they are not necessarily comparable to non-GAAP financial measures that other companies use.
Strong Foundation & Momentum Soundness Growth Profitability 1 Driving long-term value creation Value-based client servicesStrong sense of communityRelationship-driven commercial and private banking businessLeadership and governanceLeading position in great marketsStrong capital and disciplined creditScalable, efficient technology and systems
Leading Nashville Bank 2 Nashville Brentwood Nolensville Smyrna Murfreesboro Thompson’s Station Franklin Nashville MSA Source: SNL FinancialNote: $ in billions. Branch information pro forma as of June 30, 2019 Footprint Market share by County Strong presence in Nashville MSA and industry lead in Williamson County Tennessee
Attractive Nashville Market Notable Companies Operating In and Around Nashville Population growth 2010 – 2020 (%) Projected population growth 2020 – 2025 (%) Projected HHI growth 2020 – 2025 (%) Nashville Market Highlights The Nashville MSA is the 8th largest Southeast metropolitan area with a population exceeding 1.9 million as of July 2018The Nashville MSA is expected to surpass the current size of Austin, Charlotte, Portland, and Denver regions by 2035, with a population of 2.6 millionThe Nashville region gained 94 net new people per day on average in 2017Unemployment rate of 2.1% is below the national average of 3.8% as of March 2019 Nashville Growth Source: S&P Market Intelligence, Nashville Area Chamber of Commerce, Bureau of Labor Statistics, U.S. Census Bureau 2018, Forbes, FREDAllianceBernstein LP to base 1,050 jobs in Davidson county Mitsubishi Motors’ relocation to Nashville will bring 200 jobs to Franklin Amazon operations hub will bring as many as 5,000 jobs 1 Forbes’ list for metro area job growth in professional and business services (2017) #1 in “The Best Big Cities for Jobs 2017” #3 healthiest economy in top 100 metro areas (2017) #4 on Forbes’ list of fastest growing cities of 2018 #7 3 2 3
Highly Experienced Management Team 4 Chris BlackChief Financial Officer Previously held senior roles at FB FinancialHeld positions at Merrill Lynch & Co. and ISI Group, specializing in the Banking SectorServed for over 9 years as officer and pilot in the U.S. Air ForceB.S. Engineering from Cornell University and M.B.A from Auburn University David McDanielChief Lending Officer Leads the Williamson County, Corporate / Healthcare and Leasing banking teams24 years of banking experience having previously held roles at Community First Bank, AmSouth Bank, First American Bank, Equitable Securities and Merrill LynchGraduate of University of Tennessee and graduate of ABA Private Client Wealth Management school at Emory Lee MossPresident Joined Franklin Synergy Bank in 2014 upon the sale of MidSouth Bank to Franklin SynergyServed as Chairman and CEO of MidSouth Bank and has held roles at Third National Bank and SunTrustGraduate of the University of Tennessee, majoring in Banking J. Myers Jones, IIIChief Executive Officer Previously served as President and CEO of Franklin National Bank for 13 years prior to its acquisition by Fifth Third BankHeld Executive Vice President of Commercial Lending role at Cadence bankGraduate of Austin Peay State University and Herbert V. Prochnow Graduate school of Banking at the University of Wisconsin Eddie MaynardChief Credit Officer Previously Vice President in Credit and Commercial areas at Franklin National Bank for 8 years prior to its acquisition by Fifth Third BankMost recently served as Assistant Chief Credit Officer at Franklin Synergy BankGraduate of West Virginia University and the Graduate School of Banking at Louisiana State University Terry HowellChief Operating Officer Previously served as Chief Operating Officer at Civic Bank & Trust and Chief Financial Officer at First Tennessee BankOver 30 years of financial services experienceGraduate of Executive Masters of Business Administration program at University of Memphis’ Fogelman College of Business and undergrad from University of Tennessee
Evolution of the Franchise 5 Total Assets ($mn) Phase I: De-novo on solid foundation Phase II: Growth & economies of scale Phase III: Balanced growth & profitability Formed as a Tennessee corporation in April 2007 and commenced banking operations in November 2007Raised $26 million in equity from institutional & local investors Completed the acquisition of MidSouth Bank in July 2014, increasing the Nashville footprintLaunched IPO in 2015Joins Russell 2000 index, S&P SmallCap 600 Index and NYSE Financial-100 Index3.9% annualized EPS and 16.0% annualized TBVPS growth since 2013Completed acquisition of Civic Bank and Trust in 2018 Accelerated balance sheet rotation and optimization starting in 2018Declared initial dividend in January 2019 and announced 50% dividend increase in October 2019Initiated common stock repurchase plan
Key Highlights Financial Results Non-GAAP financial measures that adjust GAAP reported net income and other metrics for certain income and expense items. See “Use of non-GAAP financial measures” and the Appendix hereto for a discussion and reconciliation of non-GAAP financial measures 6 Financial Highlights and Recent Developments Growth & Profitability Net interest margin (FTE) expansion of 14bps from 2Q’19 to 2.98%; contractual loan yields declined 4bps, total deposit costs declined 16bps$86.7 million SNC reduction to $144.5 million, or 5.2% of loans held for investmentBook value per share $27.89, 13.8% growth year-over-year; tangible book value per share $26.61, growth of 15.6% annualized and 14.8% growth year-over-year(1)Pre-tax pre-provision profit of $14.4 million, up 46.8% annualized quarter-over-quarter, and 22.9% year-over yearNet Income of $11.3 million in 3Q’19, core net income of $10.9 million, more than double that of 2Q’19 and up 3.6% from 3Q’18Continued optimization of balance sheet with $221.7 million securities reduction to 16.0% of total assets and overall deleveraging of non-core balance sheet Retail & other deposit increase of $225.8 million, or 58.5% annualized and 14.5% year-over-year; reduction of $109.7 million in brokered deposits in 3Q’19, or 62.3% annualized, and 33.6% year-over-year Announced dividend increase of 50% from $0.04 per share to $0.06 per share in subsequent quarter # in red, placeholders Show same number on both sides Net interest margin:TBVPS:Total assets ($mn):Total deposits ($mn):TCE / TA: 2.98%$26.61$3,818.3$3,062.010.2%
Non-GAAP financial measures that adjust GAAP reported net income and other metrics for certain income and expense items. Excludes 3Q’19 nonrecurring FDIC assessment credit, gain on sales of securities and loss on sales of loans. Excludes 1Q’19 compensation-related non-recurring expenses and securities losses. 2017 metrics adjusted for DTA write-down that was recorded in December 2017 related to the change in income tax regulations that resulted from the Tax Cuts and Jobs Act that was passed in late December 2017. See “Use of non-GAAP financial measures” and the Appendix hereto for a discussion and reconciliation of non-GAAP financial measures Balancing Profitability and Growth Net Income(1) ($mn) Net Interest Income ($mn) Return on Average Tangible Common Equity(1) Non-Interest Expenses ($mn) Strong, sustainable earnings and return metrics driven by loan growth and disciplined credit and expenses 7 (1) 0.89% 0.87% 0.92% 1.06% 0.97% 1.01% 0.51% 0.97% 1.12% (1) 3.41% Net Interest Margin-FTE 3.74% 3.62% 3.42% 3.06% 2.70% 2.84% 2.71% 2.98% Core ROAA(1) (1)
Earnings Per Share Tangible Book Value Per Share(1) Earnings continue to support the growth and future profitability of the franchise while building tangible book value per share(2) 8 Sustaining Earnings Momentum and Tangible Book Value Growth Non-GAAP financial measures that adjust GAAP reported net income and other metrics for certain income and expense items. Core EPS excludes 3Q’19 nonrecurring FDIC assessment credit, gain on sales of securities and loss on sales of loans, and compensation-related non-recurring expenses and securities losses from 1Q’19. 2017 metrics adjusted for DTA write-down that was recorded in December 2017 related to the change in income tax regulations that resulted from the Tax Cuts and Jobs Act that was passed in late December 2017. See “Use of non-GAAP financial measures” and the Appendix hereto for a discussion and reconciliation of non-GAAP financial measures See Forward-Looking Statements on page 1 (1)
Diversified and Disciplined Loan Portfolio Loan Portfolio(1,2) ($mn) CRE & CLD Concentration Franchise defined by strong loan growth while maintaining diversification and credit discipline Excluding Loans Held for Sale, commercial includes owner-occupied commercial real estate loans Totals may not sum due to rounding Risk-based capital at bank-level as defined in Call Report. 3Q’19 calculation is preliminary and subject to change 9 Positive trend in CRE and CLD concentration ratio due to continued shift in loan portfolio mix and strong increase in capitalNo OREO on Balance Sheet as of September 30, 2019CLD loan concentration is down from 211% at 4Q’14 to 127% as of 3Q’19 (which is under management guidance of 140%) and has been steady since 2017 Total CRE loan concentration is down from 352% at 4Q’14 to 274% as of 3Q’19, and has been steady since 2017
Continue to Unlock Value of Core Bank Step : Balance Sheet RotationYTD through Q3’19, reduced securities portfolio by more than $539.9mn or 62.6% through a blend of redeployment into higher-yielding assets and non-core balance sheet deleveragingNon-core balance sheet deleverage strategy executed in Q3’19 represents continued focus on core banking activities SNC Loans decreased by $86.7mn in Q3’19 to 5.2% of Loans HFI reporting the lowest percentage since Q2’18Step : Balance Sheet OptimizationBrokered deposits decreased $208.3mn from Q4’18, a decline of 34.9%, annualized, representing 19.3% of total deposits from 23.2% at Q4’18Reciprocal deposits increased $53.7mn from Q4’18, an increase of 23.0%, annualizedRetail deposits increased $218.1mn from Q4’18, or 19.0% annualizedNoninterest bearing deposits increased 25.7% annualized from Q4’18 and 7.9% year-over-year Accelerated Balance Sheet Actions Deposit Portfolio ($mn) Continued focus on retail deposits while leveraging public funds 10 Deposits Drive Strategic Repositioning 1 2
Excluding Loans Held for Sale 3Q’19 calculation is preliminary and subject to change with filing of quarterly regulatory reports Low risk, well-capitalized balance sheet 11 Solid Credit and Low Risk Balance Sheet
ALLL / NPAs ALLL / Gross Loans(1) Classified Assets / Loans HFI NPAs / Assets(2) 12 Excluding Loans Held for Sale Nonperforming assets are non-accruing loans, loans ninety days past due and still accruing interest, and foreclosed real estate Asset Quality
Medium-Term Performance Targets Achieving these objectives will result in considerable performance enhancements – and we have a roadmap(1) 13 ROATCE> 14.0% ROAA> 1.20% NIM> 3.00% See Forward-Looking Statements on page 1 Roadmap Drivers Balance sheet optimization Focus on deepening client relationships Maintain credit quality focus and discipline Exceed return hurdle rates Areas of Focus Attract best talent Deposit gathering Diversified, sound loan growth Re-deployment of capital Target Goals
Key Drivers of FSB Performance 14
Appendix
Shared National Credit (“SNC”) & Healthcare Portfolios Note: $ in 000s* Annualized 15
Non-GAAP Reconciliations 16 $ in 000s except per share dataNon-GAAP financial measures that adjust GAAP reported net income and other metrics for certain income and expense items. Excludes 3Q’19 nonrecurring FDIC assessment credit, gain on sales of securities and loss on sales of loans. Excludes 1Q’19 compensation-related, nonrecurring expenses and 4Q’18 compensation-related, nonrecurring expenses and securities losses
Non-GAAP Reconciliations 17 $ in 000s except per share data(1) Efficiency ratio (GAAP) is calculated by dividing reported noninterest expense by reported total revenue Non-GAAP financial measures that adjust GAAP reported net income and other metrics for certain income and expense items. Excludes 3Q’19 nonrecurring FDIC assessment credit, gain on sales of securities and loss on sales of loans. Excludes 1Q’19 compensation-related, nonrecurring expenses and 4Q’18 compensation-related, nonrecurring expenses and securities losses
Non-GAAP Reconciliations 18 $ in 000s except per share data Annualized net income available to common shareholders utilized in calculating year-to-date return on average tangible common equity Annualized core net income utilized in calculating core return on average tangible common equity and core return on average assets and average equity. Non-GAAP financial measures that adjust GAAP reported net income and other metrics for certain income and expense items. Excludes 3Q’19 nonrecurring FDIC assessment credit, gain on sales of securities and loss on sales of loans. Excludes 1Q’19 compensation-related, nonrecurring expenses and 4Q’18 compensation-related, nonrecurring expenses and securities losses. See “Use of non-GAAP financial measures” and the reconciliation tables above for a discussion and reconciliation of non-GAAP financial measures.