UNITED STATES
SECURITIES AND EXCHANGE COMMISSION
Washington, D.C. 20549
FORM 10-Q
| x | QUARTERLY REPORT PURSUANT TO SECTION 13 OR 15(d) OF THE SECURITIES EXCHANGE ACT OF 1934 |
For the quarterly period ended June 30, 2015
| ¨ | TRANSITION REPORT PURSUANT TO SECTION 13 OR 15(d) OF THE SECURITIES EXCHANGE ACT OF 1934 |
For the transition period from to
Commission file number 001-36895
FRANKLIN FINANCIAL NETWORK, INC.
(Exact name of registrant as specified in its charter)
| | |
| Tennessee | | 20-8839445 |
(State or other jurisdiction of incorporation or organization) | | (I.R.S. Employer Identification No.) |
| |
722 Columbia Avenue Franklin, Tennessee | | 37064 |
| (Address of principal executive offices) | | (Zip Code) |
615-236-2265
(Registrant’s telephone number, including area code)
N/A
(Former Name, Former Address and Former Fiscal Year, if Changed Since Last Report)
Indicate by check mark whether the registrant: (1) has filed all reports required to be filed by Section 13 or 15(d) of the Securities Exchange Act of 1934 during the preceding 12 months (or for such shorter period that the registrant was required to file such reports), and (2) has been subject to such filing requirements for the past 90 days. Yes x No ¨
Indicate by check mark whether the registrant has submitted electronically and posted on its corporate Web site, if any, every Interactive Data File required to be submitted and posted pursuant to Rule 405 of Regulation S-T (§ 232.405 of this chapter) during the preceding 12 months (or for such shorter period that the registrant was required to submit and post such files). Yes x No ¨
Indicate by check mark whether the registrant is a large accelerated filer, an accelerated filer, a non-accelerated filer, or a smaller reporting company. See the definitions of “large accelerated filer,” “accelerated filer” and “smaller reporting company” in Rule 12b-2 of the Exchange Act.
| | | | | | |
| Large accelerated filer | | ¨ | | Accelerated filer | | ¨ |
| | | |
| Non-accelerated filer | | ¨ (Do not check if a smaller reporting company) | | Smaller reporting company | | x |
Indicate by check mark whether the registrant is a shell company (as defined in Rule 12b-2 of the Act). Yes ¨ No x
The number of shares outstanding of the registrant’s common stock, no par value per share, as of August 7, 2015, was 10,518,706.
TABLE OF CONTENTS
CAUTIONARY NOTE REGARDING FORWARD-LOOKING STATEMENTS
This Quarterly Report on Form 10-Q contains “forward-looking statements” as defined under U.S. federal securities laws. These statements reflect management’s current knowledge, assumptions, beliefs, estimates, and expectations and express management’s current views of future performance, results, and trends and may be identified by their use of terms such as “may,” “would,” “could,” “should,” “will,” “expect,” “anticipate,” “predict,” “project,” “potential,” “continue,” “contemplate,” “seek,” “assume,” “believe,” “intend,” “plan,” “forecast,” “goal,” and “estimate,” and other similar terms. Forward-looking statements are subject to a number of risks and uncertainties that could cause our actual results to differ materially from those described in the forward-looking statements. Readers should not place undue reliance on forward-looking statements. Such statements are made as of the date of this Quarterly Report on Form 10-Q, and we undertake no obligation to update such statements after this date.
Risks and uncertainties that could cause our actual results to differ materially from those described in forward-looking statements include those discussed in our filings with the Securities and Exchange Commission (“SEC”), including those described in our prospectus filed with the SEC pursuant to Rule 424(b) under the Securities Act of 1933, as amended (the “Securities Act”), on March 27, 2015 (the “Prospectus”) and those described in Item 1A of Part II of this Quarterly Report on Form 10-Q.
1
PART I FINANCIAL INFORMATION
ITEM 1. CONDENSED CONSOLIDATED FINANCIAL STATEMENTS
FRANKLIN FINANCIAL NETWORK, INC.
CONDENSED CONSOLIDATED BALANCE SHEETS
June 30, 2015 and December 31, 2014
(Dollar amounts in thousands, except share and per share data)
| | | | | | | | |
| | | June 30,
2015 | | | December 31,
2014 | |
| | | (Unaudited) | | | | |
ASSETS | | | | | | | | |
Cash and due from financial institutions | | $ | 43,163 | | | $ | 49,347 | |
Certificates of deposit at other financial institutions | | | 250 | | | | 250 | |
Securities available for sale | | | 635,184 | | | | 395,705 | |
Securities held to maturity (fair value 2015—$46,885 and 2014—$53,741) | | | 46,815 | | | | 53,332 | |
Loans held for sale, at fair value | | | 16,842 | | | | 18,462 | |
Loans | | | 962,191 | | | | 787,188 | |
Allowance for loan losses | | | (8,016 | ) | | | (6,680 | ) |
| | | | | | | | |
Net loans | | | 954,175 | | | | 780,508 | |
| | | | | | | | |
Restricted equity securities, at cost | | | 7,685 | | | | 5,349 | |
Premises and equipment, net | | | 9,584 | | | | 9,664 | |
Accrued interest receivable | | | 4,886 | | | | 3,545 | |
Bank owned life insurance | | | 21,938 | | | | 11,664 | |
Deferred tax asset | | | 8,430 | | | | 6,780 | |
Buildings held for sale | | | — | | | | 4,080 | |
Foreclosed assets | | | 206 | | | | 715 | |
Servicing rights, net | | | 3,298 | | | | 3,053 | |
Goodwill | | | 9,124 | | | | 9,124 | |
Core deposit intangible, net | | | 2,359 | | | | 2,698 | |
Other assets | | | 2,813 | | | | 1,551 | |
| | | | | | | | |
Total assets | | $ | 1,766,752 | | | $ | 1,355,827 | |
| | | | | | | | |
LIABILITIES AND SHAREHOLDERS’ EQUITY | | | | | | | | |
Deposits | | | | | | | | |
Non-interest bearing | | $ | 167,749 | | | $ | 150,337 | |
Interest bearing | | | 1,324,237 | | | | 1,021,896 | |
| | | | | | | | |
Total deposits | | | 1,491,986 | | | | 1,172,233 | |
Federal funds purchased and repurchase agreements | | | 36,567 | | | | 39,078 | |
Federal Home Loan Bank advances | | | 57,000 | | | | 19,000 | |
Accrued interest payable | | | 578 | | | | 421 | |
Other liabilities | | | 3,540 | | | | 3,296 | |
| | | | | | | | |
Total liabilities | | | 1,589,671 | | | | 1,234,028 | |
Shareholders’ equity | | | | | | | | |
Senior non-cumulative preferred stock, no par value, $10,000 liquidation value: Series A, 1,000,000 shares authorized; 10,000 shares issued and outstanding at June 30, 2015 and December 31, 2014, respectively | | | 10,000 | | | | 10,000 | |
Common stock, no par value; 20,000,000 shares authorized; 10,502,671 and 7,756,411 shares issued and outstanding at June 30, 2015 and December 31 2014, respectively | | | 146,017 | | | | 94,251 | |
Retained earnings | | | 21,588 | | | | 15,372 | |
Accumulated other comprehensive income (loss) | | | (524 | ) | | | 2,176 | |
| | | | | | | | |
Total shareholders’ equity | | | 177,081 | | | | 121,799 | |
| | | | | | | | |
Total liabilities and shareholders’ equity | | $ | 1,766,752 | | | $ | 1,355,827 | |
| | | | | | | | |
See accompanying notes to condensed consolidated financial statements.
2
FRANKLIN FINANCIAL NETWORK, INC.
CONDENSED CONSOLIDATED STATEMENTS OF INCOME
Three and Six Months Ended June 30, 2015 and 2014
(Dollar amounts in thousands, except share and per share data)
(Unaudited)
| | | | | | | | | | | | | | | | |
| | | Three Months Ended
June 30, | | | Six Months Ended
June 30, | |
| | 2015 | | | 2014 | | | 2015 | | | 2014 | |
Interest income and dividends | | | | | | | | | | | | | | | | |
Loans, including fees | | $ | 12,173 | | | $ | 6,380 | | | $ | 23,327 | | | $ | 12,298 | |
Securities: | | | | | | | | | | | | | | | | |
Taxable | | | 2,957 | | | | 2,234 | | | | 5,622 | | | | 4,537 | |
Tax-exempt | | | 169 | | | | 20 | | | | 189 | | | | 40 | |
Dividends on restricted equity securities | | | 83 | | | | 51 | | | | 150 | | | | 91 | |
Federal funds sold and other | | | 31 | | | | 14 | | | | 51 | | | | 32 | |
| | | | | | | | | | | | | | | | |
Total interest income | | | 15,413 | | | | 8,699 | | | | 29,339 | | | | 16,998 | |
| | | | | | | | | | | | | | | | |
Interest expense | | | | | | | | | | | | | | | | |
Deposits | | | 1,913 | | | | 1,214 | | | | 3,546 | | | | 2,362 | |
Federal funds purchased and repurchase agreements | | | 92 | | | | 57 | | | | 163 | | | | 84 | |
Federal Home Loan Bank advances | | | 81 | | | | 80 | | | | 146 | | | | 109 | |
| | | | | | | | | | | | | | | | |
Total interest expense | | | 2,086 | | | | 1,351 | | | | 3,855 | | | | 2,555 | |
| | | | | | | | | | | | | | | | |
Net interest income | | | 13,327 | | | | 7,348 | | | | 25,484 | | | | 14,443 | |
Provision for loan losses | | | 805 | | | | 440 | | | | 1,430 | | | | 825 | |
| | | | | | | | | | | | | | | | |
Net interest income after provision for loan losses | | | 12,522 | | | | 6,908 | | | | 24,054 | | | | 13,618 | |
| | | | | | | | | | | | | | | | |
Noninterest income | | | | | | | | | | | | | | | | |
Service charges on deposit accounts | | | 18 | | | | 12 | | | | 34 | | | | 24 | |
Other service charges and fees | | | 690 | | | | 313 | | | | 1,308 | | | | 549 | |
Net gains on sale of loans | | | 1,463 | | | | 1,567 | | | | 3,110 | | | | 2,351 | |
Loan servicing fees, net of amortization of servicing assets | | | 60 | | | | 88 | | | | 103 | | | | 100 | |
Gain on sales and calls of securities | | | 109 | | | | 63 | | | | 524 | | | | 71 | |
Net gain (loss) on foreclosed assets | | | 21 | | | | (2 | ) | | | 27 | | | | 31 | |
Investment services | | | 301 | | | | 35 | | | | 587 | | | | 77 | |
Other | | | 189 | | | | 354 | | | | 373 | | | | 648 | |
| | | | | | | | | | | | | | | | |
Total noninterest income | | | 2,851 | | | | 2,430 | | | | 6,066 | | | | 3,851 | |
| | | | | | | | | | | | | | | | |
Noninterest expense | | | | | | | | | | | | | | | | |
Salaries and employee benefits | | | 6,071 | | | | 3,805 | | | | 11,752 | | | | 7,350 | |
Occupancy and equipment | | | 1,699 | | | | 1,009 | | | | 3,278 | | | | 1,795 | |
FDIC assessment expense | | | 216 | | | | 120 | | | | 430 | | | | 239 | |
Marketing | | | 198 | | | | 135 | | | | 418 | | | | 246 | |
Professional fees | | | 507 | | | | 279 | | | | 866 | | | | 633 | |
Amortization of core deposit intangible | | | 167 | | | | — | | | | 339 | | | | — | |
Indirect expenses related to public offering | | | 309 | | | | — | | | | 326 | | | | — | |
Other | | | 1,405 | | | | 730 | | | | 2,784 | | | | 1,307 | |
| | | | | | | | | | | | | | | | |
Total noninterest expense | | | 10,572 | | | | 6,078 | | | | 20,193 | | | | 11,570 | |
| | | | | | | | | | | | | | | | |
Income before income tax expense | | | 4,801 | | | | 3,260 | | | | 9,927 | | | | 5,899 | |
Income tax expense | | | 1,667 | | | | 1,225 | | | | 3,661 | | | | 2,335 | |
| | | | | | | | | | | | | | | | |
Net income | | | 3,134 | | | | 2,035 | | | | 6,266 | | | | 3,564 | |
Dividends paid on Series A preferred stock | | | (25 | ) | | | (25 | ) | | | (50 | ) | | | (50 | ) |
| | | | | | | | | | | | | | | | |
Net income available to common shareholders | | $ | 3,109 | | | $ | 2,010 | | | $ | 6,216 | | | $ | 3,514 | |
| | | | | | | | | | | | | | | | |
Earnings per share: | | | | | | | | | | | | | | | | |
Basic | | $ | 0.30 | | | $ | 0.41 | | | $ | 0.67 | | | $ | 0.72 | |
Diluted | | | 0.28 | | | | 0.40 | | | | 0.64 | | | | 0.70 | |
See accompanying notes to condensed consolidated financial statements.
3
FRANKLIN FINANCIAL NETWORK, INC.
CONDENSED CONSOLIDATED STATEMENTS OF COMPREHENSIVE INCOME (LOSS)
Three and Six Months Ended June 30, 2015 and 2014
(Dollar amounts in thousands, except share and per share data)
(Unaudited)
| | | | | | | | | | | | | | | | |
| | | Three Months Ended
June 30, | | | Six Months Ended
June 30, | |
| | | 2015 | | | 2014 | | | 2015 | | | 2014 | |
Net income | | $ | 3,134 | | | $ | 2,035 | | | $ | 6,266 | | | $ | 3,564 | |
Other comprehensive income (loss), net of tax: | | | | | | | | | | | | | | | | |
Unrealized gains/losses on securities: | | | | | | | | | | | | | | | | |
Unrealized holding gain (loss) arising during the period | | | (6,900 | ) | | | 4,892 | | | | (3,865 | ) | | | 8,068 | |
Reclassification adjustment for gains included in net income | | | (109 | ) | | | (63 | ) | | | (524 | ) | | | (71 | ) |
| | | | | | | | | | | | | | | | |
Net unrealized gains (losses) | | | (7,009 | ) | | | 4,829 | | | | (4,389 | ) | | | 7,997 | |
| | | | | | | | | | | | | | | | |
Tax effect | | | 2,754 | | | | (1,849 | ) | | | 1,689 | | | | (3,062 | ) |
| | | | | | | | | | | | | | | | |
Total other comprehensive income (loss) | | | (4,255 | ) | | | 2,980 | | | | (2,700 | ) | | | 4,935 | |
| | | | | | | | | | | | | | | | |
Comprehensive income (loss) | | $ | (1,121 | ) | | $ | 5,015 | | | $ | 3,566 | | | $ | 8,499 | |
| | | | | | | | | | | | | | | | |
See accompanying notes to condensed consolidated financial statements.
4
FRANKLIN FINANCIAL NETWORK, INC.
CONDENSED CONSOLIDATED STATEMENTS OF CHANGES IN SHAREHOLDERS’ EQUITY
Six Months Ended June 30, 2015 and 2014
(Dollar amounts in thousands, except share and per share data)
(Unaudited)
| | | | | | | | | | | | | | | | | | | | | | | | |
| | | Preferred
Stock | | | Common Stock | | | Retained
Earnings | | | Accumulated
Other
Comprehensive
Income (Loss) | | | Total
Shareholders’
Equity | |
| | | | Shares | | | Amount | | | | |
Balance at December 31, 2013 | | $ | 10,000 | | | | 4,862,875 | | | $ | 52,638 | | | $ | 7,058 | | | $ | (4,533 | ) | | $ | 65,163 | |
Exercise of common stock options | | | — | | | | 119 | | | | 1 | | | | — | | | | — | | | | 1 | |
Dividends paid on Series A preferred stock | | | — | | | | — | | | | — | | | | (50 | ) | | | — | | | | (50 | ) |
Issuance of restricted stock, net of forfeitures | | | | | | | 32,568 | | | | | | | | | | | | | | | | | |
Stock based compensation expense, net of forfeitures | | | — | | | | — | | | | 311 | | | | — | | | | — | | | | 311 | |
Stock issued in conjunction with 401(k) employer match | | | — | | | | 20,345 | | | | 275 | | | | — | | | | — | | | | 275 | |
Net income | | | — | | | | — | | | | — | | | | 3,564 | | | | — | | | | 3,564 | |
Other comprehensive income | | | — | | | | — | | | | — | | | | — | | | | 4,935 | | | | 4,935 | |
| | | | | | | | | | | | | | | | | | | | | | | | |
Balance at June 30, 2014 | | $ | 10,000 | | | | 4,915,907 | | | $ | 53,225 | | | $ | 10,572 | | | $ | 402 | | | $ | 74,199 | |
| | | | | | | | | | | | | | | | | | | | | | | | |
Balance at December 31, 2014 | | $ | 10,000 | | | | 7,756,411 | | | $ | 94,251 | | | $ | 15,372 | | | $ | 2,176 | | | $ | 121,799 | |
Exercise of common stock options | | | — | | | | 71,965 | | | | 780 | | | | — | | | | — | | | | 780 | |
Exercise of common stock warrants | | | — | | | | 3,600 | | | | 43 | | | | — | | | | — | | | | 43 | |
Dividends paid on Series A preferred stock | | | — | | | | — | | | | — | | | | (50 | ) | | | — | | | | (50 | ) |
Issuance of restricted stock, net of forfeitures | | | | | | | 30,695 | | | | — | | | | — | | | | — | | | | — | |
Stock based compensation expense, net of forfeitures | | | — | | | | — | | | | 371 | | | | — | | | | — | | | | 371 | |
Stock issued related to initial public offering, net of stock issuance costs of $5,015 | | | — | | | | 2,640,000 | | | | 50,425 | | | | — | | | | — | | | | 50,425 | |
Excess tax benefit from exercise of stock options | | | — | | | | — | | | | 147 | | | | — | | | | — | | | | 147 | |
Net income | | | — | | | | — | | | | — | | | | 6,266 | | | | — | | | | 6,266 | |
Other comprehensive income (loss) | | | — | | | | — | | | | — | | | | — | | | | (2,700 | ) | | | (2,700 | ) |
| | | | | | | | | | | | | | | | | | | | | | | | |
Balance at June 30, 2015 | | $ | 10,000 | | | | 10,502,671 | | | $ | 146,017 | | | $ | 21,588 | | | $ | (524 | ) | | $ | 177,081 | |
| | | | | | | | | | | | | | | | | | | | | | | | |
See accompanying notes to condensed consolidated financial statements.
5
FRANKLIN FINANCIAL NETWORK, INC.
CONDENSED CONSOLIDATED STATEMENTS OF CASH FLOWS
Six Months Ended June 30, 2015 and 2014
(Dollar amounts in thousands, except share and per share data)
(Unaudited)
| | | | | | | | |
| | | Six Months Ended
June 30, | |
| | | 2015 | | | 2014 | |
Cash flows from operating activities | | | | | | | | |
Net income | | $ | 6,266 | | | $ | 3,564 | |
Adjustments to reconcile net income to net cash from operating activities | | | | | | | | |
Depreciation and amortization on premises and equipment | | | 659 | | | | 335 | |
Accretion of purchase accounting adjustments | | | (1,245 | ) | | | — | |
Net amortization of securities | | | 1,837 | | | | 1,127 | |
Amortization of loan servicing right asset | | | 441 | | | | 363 | |
Amortization of core deposit intangible | | | 339 | | | | — | |
Provision for loan losses | | | 1,430 | | | | 825 | |
Excess tax benefit related to the exercise of stock options | | | (147 | ) | | | — | |
Origination of loans held for sale | | | (161,442 | ) | | | (109,942 | ) |
Proceeds from sale of loans held for sale | | | 165,486 | | | | 106,443 | |
Net gain on sale of loans | | | (3,110 | ) | | | (2,351 | ) |
Gain on sale of available for sale securities | | | (375 | ) | | | (71 | ) |
Gain on call of held to maturity securities | | | (149 | ) | | | — | |
Income from bank owned life insurance | | | (274 | ) | | | (120 | ) |
(Gain) loss on sale of foreclosed assets | | | (22 | ) | | | (31 | ) |
Stock-based compensation | | | 371 | | | | 311 | |
Compensation expense related to common stock issued to 401(k) plan | | | 240 | | | | 159 | |
Recognition of deferred gain on sale of loans | | | (18 | ) | | | (21 | ) |
Recognition of deferred gain on sale of foreclosed assets | | | (5 | ) | | | — | |
Net change in: | | | | | | | | |
Accrued interest receivable and other assets | | | (2,565 | ) | | | (1,061 | ) |
Accrued interest payable and other liabilities | | | 331 | | | | (716 | ) |
| | | | | | | | |
Net cash from operating activities | | | 8,048 | | | | (1,186 | ) |
Cash flows from investing activities | | | | | | | | |
Available for sale securities: | | | | | | | | |
Sales | | | 32,288 | | | | 24,373 | |
Purchases | | | (446,795 | ) | | | (69,210 | ) |
Maturities, prepayments and calls | | | 169,306 | | | | 56,491 | |
Held to maturity securities: | | | | | | | | |
Purchases | | | — | | | | (8,601 | ) |
Maturities, prepayments and calls | | | 6,538 | | | | 6,370 | |
Net change in loans | | | (173,912 | ) | | | (65,554 | ) |
Purchase of bank owned life insurance | | | (10,000 | ) | | | — | |
Proceeds from sale of buildings held for sale | | | 4,080 | | | | — | |
Purchase of restricted equity securities | | | (2,336 | ) | | | (745 | ) |
Proceeds from sale of foreclosed assets | | | 531 | | | | 377 | |
Purchases of premises and equipment, net | | | (579 | ) | | | (2,014 | ) |
| | | | | | | | |
Net cash from investing activities | | | (420,879 | ) | | | (58,513 | ) |
Cash flows from financing activities | | | | | | | | |
Increase in deposits | | | 319,813 | | | | 66,024 | |
Decrease in federal funds purchased and repurchase agreements | | | (2,511 | ) | | | (8,439 | ) |
Proceeds from Federal Home Loan Bank advances | | | 157,000 | | | | 10,000 | |
Repayment of Federal Home Loan Bank advances | | | (119,000 | ) | | | — | |
Proceeds from exercise of common stock warrants | | | 43 | | | | — | |
Proceeds from exercise of common stock options, including excess tax benefit | | | 927 | | | | 1 | |
Proceeds from issuance of common stock, net of offering costs | | | 50,425 | | | | — | |
Dividends paid on preferred stock | | | (50 | ) | | | (50 | ) |
| | | | | | | | |
Net cash from financing activities | | | 406,647 | | | | 67,536 | |
| | | | | | | | |
Net change in cash and cash equivalents | | | (6,184 | ) | | | 7,837 | |
Cash and cash equivalents at beginning of period | | | 49,347 | | | | 18,217 | |
| | | | | | | | |
Cash and cash equivalents at end of period | | $ | 43,163 | | | $ | 26,054 | |
| | | | | | | | |
Supplemental information: | | | | | | | | |
Interest paid | | $ | 3,698 | | | $ | 2,403 | |
Income taxes paid | | | 5,150 | | | | 3,470 | |
Non-cash supplemental information: | | | | | | | | |
Transfers from loans to foreclosed assets | | $ | — | | | $ | 1,315 | |
See accompanying notes to condensed consolidated financial statements.
6
FRANKLIN FINANCIAL NETWORK, INC.
NOTES TO CONDENSED CONSOLIDATED FINANCIAL STATEMENTS
(Dollar amounts in thousands, except share and per share data)
(Unaudited)
NOTE 1—BASIS OF PRESENTATION
The accompanying unaudited consolidated financial statements of Franklin Financial Network, Inc. (“FFN”), and its wholly owned subsidiaries, Franklin Synergy Bank and BCG Consulting Group, Inc. (collectively, the “Company”), have been prepared in accordance with instructions to Form 10-Q and therefore do not include all information and footnotes necessary for a fair presentation of financial position, results of operations, and cash flows in conformity with U.S. generally accepted accounting principles (U.S. GAAP). All adjustments which are, in the opinion of management, necessary for a fair presentation of the results for the periods reported have been included as required by Regulation S-X, Rule 10-01. All such adjustments are of a normal recurring nature. It is suggested that these interim consolidated financial statements and notes be read in conjunction with the financial statements and accompanying notes included in the Company’s Annual Report on Form 10-K filed with the SEC on March 11, 2015.
NOTE 2—ACQUISITIONS
Acquisition of MidSouth Bank
On July 1, 2014 the Company completed the acquisition of MidSouth Bank (“MidSouth”), pursuant to the terms of the Agreement and Plan of Reorganization and Bank Merger (the “merger agreement”) dated November 19, 2013.
The acquisition was accounted for under the acquisition method of accounting in accordance with ASC Topic 805,Business Combinations. The Company recognized goodwill on this acquisition of $9,124, after consideration of a measurement period adjustment discussed below, which is nondeductible for tax purposes as this acquisition was a nontaxable transaction. The goodwill is calculated based on the fair values of the assets acquired and liabilities assumed as of the acquisition date. Fair value estimates are based on the information available, and are subject to change for up to one year after the closing date of the acquisition as additional information relative to closing date fair values becomes available. Fair values are preliminary estimates due to pending appraisals on loans and other real estate owned.
The Company acquired 100% of the outstanding preferred and common stock of MidSouth. The purchase price consisted of both cash and shares of the Company’s common stock. MidSouth’s common shareholders received 0.425926 shares of FFN common stock for each share of MidSouth common stock. MidSouth’s preferred shareholders received 0.851852 shares of FFN common stock for each share of MidSouth preferred stock. Each MidSouth Series 2009A warrant holder received 0.18 shares of FFN common stock for each MidSouth Series 2009A warrant, and each Series 2011-A warrant holder received 0.146667 shares of FFN common stock for each MidSouth Series 2011-A warrant. In lieu of issuing fractional shares of FFN common stock, FFN paid former MidSouth shareholders an amount in cash determined by multiplying (i) $13.50 by (ii) the fraction of a share (rounded to the nearest ten thousandth when expressed in decimal form) of FFN common stock.
MidSouth common stock options were converted into options to purchase shares of FFN common stock based on the 0.425926 exchange ratio, with the new exercise price becoming the exercise price of the MidSouth options divided by the exchange ratio. On the date of the merger, 2,766,191 shares of FFN common stock were exchanged for the common and preferred stock, and common stock warrants of MidSouth in accordance with the proration and allocation procedures contained in the merger agreement and as noted above. Subsequently, cash totaling $100 was paid to dissenting MidSouth shareholders representing 7,427 shares of FFN common stock. In addition, $18 of cash was paid to MidSouth shareholders for fractional shares in accordance with the merger agreement.
7
Based on a valuation of the FFN’s common stock as of July 1, 2014, the resulting purchase price was $41,094. The following table summarizes the purchase price calculation:
| | | | | | | | | | | | |
| | | Number of
MidSouth shares
outstanding
(in thousands) | | | Per share
exchange
ratio | | | Number of FFN
shares—as
exchanged
(in thousands) | |
Common Shares | | | 3,873 | | | | 0.425926 | | | | 1,650 | |
Convertible Voting Preferred Stock, 2009-A | | | 1,018 | | | | 0.851852 | | | | 867 | |
Convertible Voting Preferred Stock, 2011-A | | | 242 | | | | 0.851852 | | | | 206 | |
Series 2009-A Stock Warrants (strike price $3.25) | | | 193 | | | | 0.185185 | | | | 36 | |
Series 2011-A Stock Warrants (strike price $3.68) | | | 44 | | | | 0.153333 | | | | 7 | |
| | | | | | | | | | | | |
| | | | | | | | | | | 2,766 | |
Multiplied by FFN common stock value at acquisition date | | | | | | | | | | $ | 14.50 | |
| | | | | | | | | | | | |
Fair value of FFN common stock issued (“Stock Consideration”) | | | | | | | | | | $ | 40,110 | |
Cash consideration paid for fractional shares | | | | | | | | | | | 18 | |
Cash consideration paid for dissenting shares | | | | | | | | | | | 100 | |
Fair value of MidSouth stock options converted to FFN stock options | | | | | | | | | | | 866 | |
| | | | | | | | | | | | |
Total acquisition consideration | | | | | | | | | | $ | 41,094 | |
| | | | | | | | | | | | |
On July 1, 2014 the Company acquired MidSouth. As previously disclosed, the fair values initially assigned to the assets acquired and liabilities assumed were preliminary and subject to refinement for up to one year after the closing date of the acquisition as new information relative to closing date fair values becomes available. Based on appraisals received subsequent to the acquisition date, the Company adjusted its initial fair value estimate of foreclosed assets that were acquired. The table below summarizes the fair value of the assets purchased, including goodwill, and liabilities assumed as of the July 1, 2014 purchase date.
| | | | | | | | | | | | |
In Thousands | | July 1, 2014
(as initially reported) | | | Measurement
Period
Adjustments | | | July 1, 2014
(as adjusted) | |
Assets: | | | | | | | | | | | | |
Cash and due from banks | | $ | 1,369 | | | $ | — | | | $ | 1,369 | |
Interest-bearing accounts at other financial institutions | | | 10,946 | | | | | | | | 10,946 | |
Securities, available-for-sale | | | 57,431 | | | | | | | | 57,431 | |
Loans held for sale | | | 7,071 | | | | | | | | 7,071 | |
Loans | | | 184,345 | | | | | | | | 184,345 | |
Certificates of deposit at other financial institutions | | | 250 | | | | | | | | 250 | |
Restricted equity securities | | | 1,572 | | | | | | | | 1,572 | |
Bank premises and equipment, net | | | 6,650 | | | | | | | | 6,650 | |
Bank-owned life insurance | | | 3,144 | | | | | | | | 3,144 | |
Accrued interest receivable | | | 728 | | | | | | | | 728 | |
Foreclosed assets | | | 800 | | | | (260 | ) | | | 540 | |
Core deposit intangible | | | 3,060 | | | | | | | | 3,060 | |
Deferred tax asset | | | 6,753 | | | | 100 | | | | 6,853 | |
Goodwill | | | 8,964 | | | | 160 | | | | 9,124 | |
Other assets | | | 747 | | | | | | | | 747 | |
| | | | | | | | | | | | |
Total assets acquired | | $ | 293,830 | | | $ | — | | | $ | 293,830 | |
| | | | | | | | | | | | |
Liabilities: | | | | | | | | | | | | |
Deposits | | $ | 244,415 | | | $ | — | | | $ | 244,415 | |
Short-term borrowings | | | 6,893 | | | | | | | | 6,893 | |
Other liabilities | | | 1,428 | | | | | | | | 1,428 | |
| | | | | | | | | | | | |
Total liabilities assumed | | $ | 252,736 | | | $ | — | | | $ | 252,736 | |
| | | | | | | | | | | | |
At June 30, 2015, there were no circumstances or significant changes that have occurred since July 1, 2014 related to the acquisition of MidSouth that, in management’s assessment, would necessitate recording impairment of goodwill.
8
In the acquisition, the Company purchased $184,345 of loans at fair value, net of $7,347, or 3.8%, estimated discount to the outstanding principal balance, representing 38.0% of the Company’s total loans at June 30, 2014. Of the total loans acquired, management identified loans totaling $5,527 as having credit deficiencies. All loans that were on non-accrual status and all loan relationships that were identified as substandard or impaired as of the acquisition date were considered by management to be credit-impaired and are accounted for pursuant to ASC Topic 310-30. The table below summarizes the total contractually required principal and interest cash payments, management’s estimate of expected total cash payments and fair value of the loans as of July 1, 2014 for purchased credit-impaired (“PCI”) loans. Contractually required principal and interest payments have been adjusted for estimated prepayments.
| | | | |
Contractually required principal and interest | | $ | 8,510 | |
Non-accretable difference | | | (1,745 | ) |
| | | | |
Cash flows expected to be collected | | | 6,765 | |
Accretable yield | | | (1,238 | ) |
| | | | |
Total purchased credit-impaired loans acquired | | $ | 5,527 | |
| | | | |
The table below presents information with respect to the fair value of acquired loans, as well as their unpaid principal balance at acquisition date.
| | | | | | | | |
| | | Unpaid
Principal
Balance | | | Fair
Value | |
Loans: | | | | | | | | |
Residential real estate | | $ | 39,425 | | | $ | 38,618 | |
Commercial real estate | | | 82,465 | | | | 80,566 | |
Construction and land development | | | 43,766 | | | | 42,454 | |
Commercial loans | | | 16,311 | | | | 15,352 | |
Consumer and other loans | | | 1,865 | | | | 1,828 | |
Purchased credit-impaired | | | 7,860 | | | | 5,527 | |
| | | | | | | | |
Total earning assets | | $ | 191,692 | | | $ | 184,345 | |
| | | | | | | | |
In its assumption of the deposit liabilities, the Company believed the deposits assumed from the acquisition have an intangible value. The Company applied ASC Topic 805, which prescribes the accounting for goodwill and other intangible assets such as core deposit intangibles, in a business combination. The Company determined the estimated fair value of the core deposit intangible asset totaled $3,060, which will be amortized utilizing an accelerated amortization method over an estimated economic life of 8.2 years. When determining the valuation amount, deposits were analyzed based on factors such as type of deposit, deposit retention, interest rates and age of deposit relationships.
Pro-forma information
Pro-forma data for the three- and six-month periods ending June 30, 2014 listed in the table below present pro-forma information as if the MidSouth acquisition occurred at the beginning of 2014. Because the MidSouth transaction closed on July 1, 2014, and its actual results are included in the Company’s actual operating results for the three- and six-month periods ending June 30, 2015, there is no pro-forma information for those periods.
| | | | | | | | |
| | | Three
months
ended
Jun 30, 2014 | | | Six
months
ended
Jun 30, 2014 | |
Net interest income | | $ | 10,645 | | | $ | 21,048 | |
Net income available to common shareholders | | | 2,217 | | | | 4,098 | |
Earnings per share—basic | | $ | 0.29 | | | $ | 0.53 | |
Earnings per share—diluted | | $ | 0.28 | | | $ | 0.52 | |
Supplemental pro forma earnings for the three and six months ended June 30, 2014 were adjusted to exclude acquisition-related costs that were incurred during the three and six months ended June 30, 2014 of $965 and $1,481, respectively. Supplemental pro forma earnings for the three and six months ended June 30, 2014 were adjusted to include discount accretion and premium amortization related to the fair value adjustments to acquisition date assets and liabilities, as appropriate.
9
During the three months ending June 30, 2014, the acquisition of MidSouth increased pro-forma net interest income by approximately $3,297 and net income available to common shareholders by approximately $207. During the six months ending June 30, 2014, the acquisition of MidSouth increased pro-forma net interest income by approximately $6,605 and net income available to common shareholders by approximately $584.
NOTE 3—SECURITIES
The following table summarizes the amortized cost and fair value of the available for sale securities portfolio at June 30, 2015 and December 31, 2014 and the corresponding amounts of gross unrealized gains and losses recognized in accumulated other comprehensive income.
| | | | | | | | | | | | | | | | |
| | | Amortized
Cost | | | Gross
Unrealized
Gains | | | Gross
Unrealized
Losses | | | Fair
Value | |
June 30, 2015 | | | | | | | | | | | | | | | | |
U.S. government sponsored entities and agencies | | $ | 14,236 | | | $ | 154 | | | $ | (192 | ) | | $ | 14,198 | |
Mortgage-backed securities: residential | | | 512,479 | | | | 3,617 | | | | (3,986 | ) | | | 512,110 | |
Mortgage-backed securities: commercial | | | 20,303 | | | | 35 | | | | (149 | ) | | | 20,189 | |
State and political subdivisions | | | 89,028 | | | | 90 | | | | (431 | ) | | | 88,687 | |
| | | | | | | | | | | | | | | | |
Total | | $ | 636,046 | | | $ | 3,896 | | | $ | (4,758 | ) | | $ | 635,184 | |
| | | | | | | | | | | | | | | | |
| | | | | | | | | | | | | | | | |
| | | Amortized
Cost | | | Gross
Unrealized
Gains | | | Gross
Unrealized
Losses | | | Fair
Value | |
December 31, 2014 | | | | | | | | | | | | | | | | |
U.S. government sponsored entities and agencies | | $ | 30,070 | | | $ | 417 | | | $ | (314 | ) | | $ | 30,173 | |
U.S. Treasury securities | | | 20,000 | | | | — | | | | — | | | | 20,000 | |
Mortgage-backed securities: residential | | | 335,677 | | | | 4,593 | | | | (1,203 | ) | | | 339,067 | |
Mortgage-backed securities: commercial | | | 6,432 | | | | 33 | | | | — | | | | 6,465 | |
| | | | | | | | | | | | | | | | |
Total | | $ | 392,179 | | | $ | 5,043 | | | $ | (1,517 | ) | | $ | 395,705 | |
| | | | | | | | | | | | | | | | |
The amortized cost and fair value of the held to maturity securities portfolio at June 30, 2015 and December 31, 2014 and the corresponding amounts of gross unrecognized gains and losses were as follows:
| | | | | | | | | | | | | | | | |
| | | Amortized
Cost | | | Gross
Unrecognized
Gains | | | Gross
Unrecognized
Losses | | | Fair
Value | |
June 30, 2015 | | | | | | | | | | | | | | | | |
U.S. government sponsored entities and agencies | | $ | 3,374 | | | $ | 15 | | | $ | (102 | ) | | $ | 3,287 | |
Mortgage backed securities: residential | | | 34,551 | | | | 486 | | | | (548 | ) | | | 34,489 | |
State and political subdivisions | | | 8,890 | | | | 248 | | | | (29 | ) | | | 9,109 | |
| | | | | | | | | | | | | | | | |
Total | | $ | 46,815 | | | $ | 749 | | | $ | (679 | ) | | $ | 46,885 | |
| | | | | | | | | | | | | | | | |
| | | | | | | | | | | | | | | | |
| | | Gross
Amortized
Cost | | | Gross
Unrecognized
Gains | | | Gross
Unrecognized
Losses | | | Fair
Value | |
December 31, 2014 | | | | | | | | | | | | | | | | |
U.S. government sponsored entities and agencies | | $ | 5,550 | | | $ | 162 | | | $ | (87 | ) | | $ | 5,625 | |
Mortgage backed securities: residential | | | 38,587 | | | | 555 | | | | (562 | ) | | | 38,580 | |
State and political subdivisions | | | 9,195 | | | | 351 | | | | (10 | ) | | | 9,536 | |
| | | | | | | | | | | | | | | | |
Total | | $ | 53,332 | | | $ | 1,068 | | | $ | (659 | ) | | $ | 53,741 | |
| | | | | | | | | | | | | | | | |
10
Sales and calls of available for sale securities were as follows:
| | | | | | | | | | | | | | | | |
| | | Three Months Ended
June 30, | | | Six Months Ended
June 30, | |
| | | 2015 | | | 2014 | | | 2015 | | | 2014 | |
Proceeds | | $ | 22,999 | | | $ | 18,922 | | | $ | 34,288 | | | $ | 24,373 | |
Gross gains | | | — | | | | 201 | | | | 390 | | | | 225 | |
Gross losses | | | (1 | ) | | | (138 | ) | | | (15 | ) | | | (154 | ) |
Calls of held to maturity securities were as follows:
| | | | | | | | | | | | | | | | |
| | | Three Months Ended
June 30, | | | Six Months Ended
June 30, | |
| | | 2015 | | | 2014 | | | 2015 | | | 2014 | |
Proceeds | | $ | 1,500 | | | $ | — | | | $ | 2,300 | | | $ | — | |
Gross gains | | | 110 | | | | — | | | | 149 | | | | — | |
Gross losses | | | — | | | | — | | | | — | | | | — | |
The amortized cost and fair value of the investment securities portfolio are shown by contractual maturity. Securities not due at a single maturity date, primarily mortgage-backed securities, are shown separately.
| | | | | | | | |
| | | June 30, 2015 | |
| | | Amortized
Cost | | | Fair
Value | |
Available for sale | | | | | | | | |
Three months or less | | $ | — | | | $ | — | |
Over three months through one year | | | — | | | | — | |
Over one year through five years | | | — | | | | — | |
Over five years through ten years | | | 9,711 | | | | 9,862 | |
Over ten years | | | 93,553 | | | | 93,023 | |
Mortgage-backed securities: residential | | | 512,479 | | | | 512,110 | |
Mortgage-backed securities: commercial | | | 20,303 | | | | 20,189 | |
| | | | | | | | |
Total | | $ | 636,046 | | | $ | 635,184 | |
| | | | | | | | |
Held to maturity | | | | | | | | |
Three months or less | | $ | — | | | $ | — | |
Over three months through one year | | | — | | | | — | |
Over one year through five years | | | 1,382 | | | | 1,439 | |
Over five years through ten years | | | 1,106 | | | | 1,122 | |
Over ten years | | | 9,776 | | | | 9,835 | |
Mortgage-backed securities: residential | | | 34,551 | | | | 34,489 | |
| | | | | | | | |
Total | | $ | 46,815 | | | $ | 46,885 | |
| | | | | | | | |
Securities pledged at June 30, 2015 and December 31, 2014 had a carrying amount of $479,240 and $366,764 and were pledged to secure public deposits and repurchase agreements.
At June 30, 2015 and December 31, 2014, there were no holdings of securities of any one issuer, other than the U.S. government-sponsored entities and agencies, in an amount greater than 10% of shareholders’ equity.
11
The following table summarizes the securities with unrealized and unrecognized losses at June 30, 2015 and December 31, 2014, aggregated by major security type and length of time in a continuous unrealized loss position:
| | | | | | | | | | | | | | | | | | | | | | | | |
| | | Less Than 12 Months | | | 12 Months or Longer | | | Total | |
| | | Fair
Value | | | Unrealized
Losses | | | Fair
Value | | | Unrealized
Losses | | | Fair
Value | | | Unrealized
Losses | |
June 30, 2015 | | | | | | | | | | | | | | | | | | | | | | | | |
Available for sale | | | | | | | | | | | | | | | | | | | | | | | | |
U.S. government sponsored entities and agencies | | $ | 1,933 | | | $ | (67 | ) | | $ | 4,325 | | | $ | (125 | ) | | $ | 6,258 | | | $ | (192 | ) |
Mortgage-backed securities: residential | | | 259,366 | | | | (2,976 | ) | | | 30,688 | | | | (1,010 | ) | | | 290,054 | | | | (3,986 | ) |
Mortgage-backed securities: commercial | | | 16,148 | | | | (149 | ) | | | — | | | | — | | | | 16,148 | | | | (149 | ) |
State and political subdivisions | | | 60,330 | | | | (431 | ) | | | — | | | | — | | | | 60,330 | | | | (431 | ) |
| | | | | | | | | | | | | | | | | | | | | | | | |
Total available for sale | | $ | 337,777 | | | $ | (3,623 | ) | | $ | 35,013 | | | $ | (1,135 | ) | | $ | 372,790 | | | $ | (4,758 | ) |
| | | | | | | | | | | | | | | | | | | | | | | | |
| | | |
| | | Less Than 12 Months | | | 12 Months or Longer | | | Total | |
| | | Fair
Value | | | Unrecognized
Losses | | | Fair
Value | | | Unrecognized
Losses | | | Fair
Value | | | Unrecognized
Losses | |
Held to maturity | | | | | | | | | | | | | | | | | | | | | | | | |
U.S. government sponsored entities and agencies | | $ | 1,942 | | | $ | (58 | ) | | $ | 956 | | | $ | (44 | ) | | $ | 2,898 | | | $ | (102 | ) |
Mortgage-backed securities: residential | | | 8,909 | | | | (102 | ) | | | 9,338 | | | | (446 | ) | | | 18,247 | | | | (548 | ) |
State and political subdivisions | | | 3,971 | | | | (29 | ) | | | — | | | | — | | | | 3,971 | | | | (29 | ) |
| | | | | | | | | | | | | | | | | | | | | | | | |
Total held to maturity | | $ | 14,822 | | | $ | (189 | ) | | $ | 10,294 | | | $ | (490 | ) | | $ | 25,116 | | | $ | (679 | ) |
| | | | | | | | | | | | | | | | | | | | | | | | |
| | | |
| | | Less Than 12 Months | | | 12 Months or Longer | | | Total | |
| | | Fair
Value | | | Unrealized
Losses | | | Fair
Value | | | Unrealized
Losses | | | Fair
Value | | | Unrealized
Losses | |
December 31, 2014 | | | | | | | | | | | | | | | | | | | | | | | | |
Available for sale | | | | | | | | | | | | | | | | | | | | | | | | |
U.S. government sponsored entities and agencies | | $ | 9,999 | | | $ | (1 | ) | | $ | 8,232 | | | $ | (313 | ) | | $ | 18,231 | | | $ | (314 | ) |
Mortgage-backed securities: residential | | | 59,078 | | | | (323 | ) | | | 41,939 | | | | (880 | ) | | | 101,017 | | | | (1,203 | ) |
| | | | | | | | | | | | | | | | | | | | | | | | |
Total available for sale | | $ | 69,077 | | | $ | (324 | ) | | $ | 50,171 | | | $ | (1,193 | ) | | $ | 119,248 | | | $ | (1,517 | ) |
| | | | | | | | | | | | | | | | | | | | | | | | |
| | | |
| | | Less Than 12 Months | | | 12 Months or Longer | | | Total | |
| | | Fair
Value | | | Unrecognized
Losses | | | Fair
Value | | | Unrecognized
Losses | | | Fair
Value | | | Unrecognized
Losses | |
Held to maturity | | | | | | | | | | | | | | | | | | | | | | | | |
U.S. government sponsored entities and agencies | | $ | — | | | $ | — | | | $ | 2,913 | | | $ | (87 | ) | | $ | 2,913 | | | $ | (87 | ) |
Mortgage-backed securities: residential | | | 5,246 | | | | (25 | ) | | | 13,001 | | | | (537 | ) | | | 18,247 | | | | (562 | ) |
State and political subdivisions | | | 507 | | | | (1 | ) | | | 592 | | | | (9 | ) | | | 1,099 | | | | (10 | ) |
| | | | | | | | | | | | | | | | | | | | | | | | |
Total held to maturity | | $ | 5,753 | | | $ | (26 | ) | | $ | 16,506 | | | $ | (633 | ) | | $ | 22,259 | | | $ | (659 | ) |
| | | | | | | | | | | | | | | | | | | | | | | | |
Unrealized losses on debt securities have not been recognized into income because the issuers bonds are of high credit quality (rated AA or higher), management does not intend to sell and it is likely that management will not be required to sell the securities prior to their anticipated recovery, and the decline in fair value is largely due to changes in interest rates and other market conditions. The fair value is expected to recover as the bonds approach maturity.
12
NOTE 4—LOANS
Loans at June 30, 2015 and December 31, 2014 were as follows:
| | | | | | | | |
| | | June 30,
2015 | | | December 31,
2014 | |
Loans that are not PCI loans | | | | | | | | |
Construction and land development | | $ | 293,629 | | | $ | 239,225 | |
Commercial real estate: | | | | | | | | |
Nonfarm, nonresidential | | | 273,221 | | | | 240,975 | |
Other | | | 6,370 | | | | 5,377 | |
Residential real estate: | | | | | | | | |
Closed-end 1-4 family | | | 137,815 | | | | 130,631 | |
Other | | | 96,292 | | | | 83,129 | |
Commercial and industrial | | | 144,735 | | | | 76,570 | |
Consumer and other | | | 7,527 | | | | 8,025 | |
| | | | | | | | |
Loans before net deferred loan fees | | | 959,589 | | | | 783,932 | |
Deferred loan fees, net | | | (1,676 | ) | | | (1,059 | ) |
| | | | | | | | |
Total loans that are not PCI loans | | | 957,913 | | | | 782,873 | |
| | | | | | | | |
PCI loans | | | | | | | | |
Construction and land development | | $ | 77 | | | $ | 77 | |
Commercial real estate: | | | | | | | | |
Nonfarm, nonresidential | | | 1,752 | | | | 1,798 | |
Other | | | — | | | | — | |
Residential real estate: | | | | | | | | |
Closed-end 1-4 family | | | 703 | | | | 706 | |
Other | | | 107 | | | | 108 | |
Commercial and industrial | | | 1,639 | | | | 1,624 | |
Consumer and other | | | — | | | | 2 | |
| | | | | | | | |
Total PCI loans | | | 4,278 | | | | 4,315 | |
| | | | | | | | |
Allowance for loan losses | | | (8,016 | ) | | | (6,680 | ) |
| | | | | | | | |
Total loans, net of allowance for loan losses | | $ | 954,175 | | | $ | 780,508 | |
| | | | | | | | |
The following table presents the activity in the allowance for loan losses by portfolio segment for the three month periods ending June 30, 2015 and 2014:
| | | | | | | | | | | | | | | | | | | | | | | | |
| | | Construction
and Land
Development | | | Commercial
Real
Estate | | | Residential
Real
Estate | | | Commercial
and
Industrial | | | Consumer
and
Other | | | Total | |
Three Months Ending June 30, 2015 | | | | | | | | | | | | | | | | | | | | | | | | |
Allowance for loan losses: | | | | | | | | | | | | | | | | | | | | | | | | |
Beginning balance | | $ | 2,549 | | | $ | 2,124 | | | $ | 1,727 | | | $ | 850 | | | $ | 58 | | | $ | 7,308 | |
Provision for loan losses | | | 18 | | | | 197 | | | | 24 | | | | 474 | | | | 92 | | | | 805 | |
Loans charged-off | | | — | | | | — | | | | (17 | ) | | | — | | | | (88 | ) | | | (105 | ) |
Recoveries | | | — | | | | — | | | | 5 | | | | — | | | | 3 | | | | 8 | |
| | | | | | | | | | | | | | | | | | | | | | | | |
Total ending allowance balance | | $ | 2,567 | | | $ | 2,321 | | | $ | 1,739 | | | $ | 1,324 | | | $ | 65 | | | $ | 8,016 | |
| | | | | | | | | | | | | | | | | | | | | | | | |
Three Months Ending June 30, 2014 | | | | | | | | | | | | | | | | | | | | | | | | |
Allowance for loan losses: | | | | | | | | | | | | | | | | | | | | | | | | |
Beginning balance | | $ | 1,546 | | | $ | 1,695 | | | $ | 1,536 | | | $ | 464 | | | $ | 63 | | | $ | 5,304 | |
Provision for loan losses | | | 250 | | | | 159 | | | | (3 | ) | | | 44 | | | | (10 | ) | | | 440 | |
Loans charged-off | | | — | | | | — | | | | — | | | | — | | | | — | | | | — | |
Recoveries | | | — | | | | — | | | | 27 | | | | — | | | | — | | | | 27 | |
| | | | | | | | | | | | | | | | | | | | | | | | |
Total ending allowance balance | | $ | 1,796 | | | $ | 1,854 | | | $ | 1,560 | | | $ | 508 | | | $ | 53 | | | $ | 5,771 | |
| | | | | | | | | | | | | | | | | | | | | | | | |
13
There was no allowance for loan losses for PCI loans for the three months ended June 30, 2015 or for the three months ended June 30, 2014.
The following table presents the activity in the allowance for loan losses by portfolio segment for the six-month periods ending June 30, 2015 and 2014:
| | | | | | | | | | | | | | | | | | | | | | | | |
| | | Construction
and Land
Development | | | Commercial
Real
Estate | | | Residential
Real
Estate | | | Commercial
and
Industrial | | | Consumer
and
Other | | | Total | |
Six Months Ending June 30, 2015 | | | | | | | | | | | | | | | | | | | | | | | | |
Allowance for loan losses: | | | | | | | | | | | | | | | | | | | | | | | | |
Beginning balance | | $ | 2,690 | | | $ | 1,494 | | | $ | 1,791 | | | $ | 650 | | | $ | 55 | | | $ | 6,680 | |
Provision for loan losses | | | (123 | ) | | | 827 | | | | (43 | ) | | | 674 | | | | 95 | | | | 1,430 | |
Loans charged-off | | | — | | | | — | | | | (17 | ) | | | — | | | | (88 | ) | | | (105 | ) |
Recoveries | | | — | | | | — | | | | 8 | | | | — | | | | 3 | | | | 11 | |
| | | | | | | | | | | | | | | | | | | | | | | | |
Total ending allowance balance | | $ | 2,567 | | | $ | 2,321 | | | $ | 1,739 | | | $ | 1,324 | | | $ | 65 | | | $ | 8,016 | |
| | | | | | | | | | | | | | | | | | | | | | | | |
Six Months Ending June 30, 2014 | | | | | | | | | | | | | | | | | | | | | | | | |
Allowance for loan losses: | | | | | | | | | | | | | | | | | | | | | | | | |
Beginning balance | | $ | 1,497 | | | $ | 1,566 | | | $ | 1,402 | | | $ | 337 | | | $ | 98 | | | $ | 4,900 | |
Provision for loan losses | | | 299 | | | | 288 | | | | 112 | | | | 171 | | | | (45 | ) | | | 825 | |
Loans charged-off | | | — | | | | — | | | | — | | | | — | | | | — | | | | — | |
Recoveries | | | — | | | | — | | | | 46 | | | | — | | | | — | | | | 46 | |
| | | | | | | | | | | | | | | | | | | | | | | | |
Total ending allowance balance | | $ | 1,796 | | | $ | 1,854 | | | $ | 1,560 | | | $ | 508 | | | $ | 53 | | | $ | 5,771 | |
| | | | | | | | | | | | | | | | | | | | | | | | |
There was no allowance for loan losses for PCI loans for the six months ended June 30, 2015 or for the six months ended June 30, 2014.
The following table presents the balance in the allowance for loan losses and the recorded investment in loans by portfolio segment and based on impairment method as of June 30, 2015 and December 31, 2014. For purposes of this disclosure, recorded investment in loans excludes accrued interest receivable and loan fees, net due to immateriality.
| | | | | | | | | | | | | | | | | | | | | | | | |
| | | Construction
and Land
Development | | | Commercial
Real
Estate | | | Residential
Real
Estate | | | Commercial
and
Industrial | | | Consumer
and
Other | | | Total | |
June 30, 2015 | | | | | | | | | | | | | | | | | | | | | | | | |
Allowance for loan losses: | | | | | | | | | | | | | | | | | | | | | | | | |
Ending allowance balance attributable to loans: | | | | | | | | | | | | | | | | | | | | | | | | |
Individually evaluated for impairment | | $ | — | | | $ | — | | | $ | — | | | $ | 96 | | | $ | 23 | | | $ | 119 | |
Collectively evaluated for impairment | | | 2,567 | | | | 2,321 | | | | 1,739 | | | | 1,228 | | | | 42 | | | | 7,897 | |
Purchased credit-impaired loans | | | — | | | | — | | | | — | | | | — | | | | — | | | | — | |
| | | | | | | | | | | | | | | | | | | | | | | | |
Total ending allowance balance | | $ | 2,567 | | | $ | 2,321 | | | $ | 1,739 | | | $ | 1,324 | | | $ | 65 | | | $ | 8,016 | |
| | | | | | | | | | | | | | | | | | | | | | | | |
Loans: | | | | | | | | | | | | | | | | | | | | | | | | |
Individually evaluated for impairment | | $ | — | | | $ | 927 | | | $ | 807 | | | $ | 275 | | | $ | 23 | | | $ | 2,032 | |
Collectively evaluated for impairment | | | 293,629 | | | | 278,664 | | | | 233,300 | | | | 144,460 | | | | 7,504 | | | | 957,557 | |
Purchased credit-impaired loans | | | 77 | | | | 1,752 | | | | 810 | | | | 1,639 | | | | — | | | | 4,278 | |
| | | | | | | | | | | | | | | | | | | | | | | | |
Total ending loans balance | | $ | 293,706 | | | $ | 281,343 | | | $ | 234,917 | | | $ | 146,374 | | | $ | 7,527 | | | $ | 963,867 | |
| | | | | | | | | | | | | | | | | | | | | | | | |
14
| | | | | | | | | | | | | | | | | | | | | | | | |
| | | Construction
and Land
Development | | | Commercial
Real
Estate | | | Residential
Real
Estate | | | Commercial
and
Industrial | | | Consumer
and
Other | | | Total | |
December 31, 2014 | | | | | | | | | | | | | | | | | | | | | | | | |
Allowance for loan losses: | | | | | | | | | | | | | | | | | | | | | | | | |
Ending allowance balance attributable to loans: | | | | | | | | | | | | | | | | | | | | | | | | |
Individually evaluated for impairment | | $ | — | | | $ | — | | | $ | — | | | $ | 18 | | | $ | — | | | $ | 18 | |
Collectively evaluated for impairment | | | 2,690 | | | | 1,494 | | | | 1,791 | | | | 632 | | | | 55 | | | | 6,662 | |
Purchased credit-impaired loans | | | — | | | | — | | | | — | | | | — | | | | — | | | | — | |
| | | | | | | | | | | | | | | | | | | | | | | | |
Total ending allowance balance | | $ | 2,690 | | | $ | 1,494 | | | $ | 1,791 | | | $ | 650 | | | $ | 55 | | | $ | 6,680 | |
| | | | | | | | | | | | | | | | | | | | | | | | |
Loans: | | | | | | | | | | | | | | | | | | | | | | | | |
Individually evaluated for impairment | | $ | — | | | $ | 835 | | | $ | 93 | | | $ | 18 | | | $ | — | | | $ | 946 | |
Collectively evaluated for impairment | | | 239,225 | | | | 245,517 | | | | 213,667 | | | | 76,552 | | | | 8,025 | | | | 782,986 | |
Purchased credit-impaired loans | | | 77 | | | | 1,798 | | | | 814 | | | | 1,624 | | | | 2 | | | | 4,315 | |
| | | | | | | | | | | | | | | | | | | | | | | | |
Total ending loans balance | | $ | 239,302 | | | $ | 248,150 | | | $ | 214,574 | | | $ | 78,194 | | | $ | 8,027 | | | $ | 788,247 | |
| | | | | | | | | | | | | | | | | | | | | | | | |
Loans collectively evaluated for impairment reported at June 30, 2015 include certain loans acquired from MidSouth on July 1, 2014. The acquired loans were recorded at estimated fair value at date of acquisition, which included an estimated credit discount. On July 1, 2014, acquired non-PCI loans were recorded at an estimated fair value of $178,818, comprised of contractually unpaid principal totaling $183,832 net of estimated discounts totaling $5,014 which included both credit and interest rate discount components. At June 30, 2015, acquired non-PCI loans were recorded at $111,284, comprised of contractually unpaid principal totaling $114,159 net of discounts totaling $2,875. Management evaluated these loans for credit deterioration since acquisition and determined that no allowance for loan losses was necessary at June 30, 2015.
The following table presents information related to impaired loans by class of loans as of June 30, 2015 and December 31, 2014:
| | | | | | | | | | | | |
| | | Unpaid
Principal
Balance | | | Recorded
Investment | | | Allowance for
Loan Losses
Allocated | |
June 30, 2015 | | | | | | | | | | | | |
With no allowance recorded: | | | | | | | | | | | | |
Commercial real estate: | | | | | | | | | | | | |
Nonfarm, nonresidential | | $ | 2,514 | | | $ | 927 | | | $ | — | |
Residential real estate: | | | | | | | | | | | | |
Closed-end 1-4 family | | | 97 | | | | 97 | | | | — | |
Other | | | 710 | | | | 710 | | | | — | |
Commercial and industrial | | | 179 | | | | 179 | | | | — | |
| | | | | | | | | | | | |
Subtotal | | | 3,500 | | | | 1,913 | | | | — | |
With an allowance recorded: | | | | | | | | | | | | |
Commercial and industrial | | | 96 | | | | 96 | | | | 96 | |
Consumer and other | | | 23 | | | | 23 | | | | 23 | |
| | | | | | | | | | | | |
Subtotal | | | 119 | | | | 119 | | | | 119 | |
| | | | | | | | | | | | |
Total | | $ | 3,619 | | | $ | 2,032 | | | $ | 119 | |
| | | | | | | | | | | | |
December 31, 2014 | | | | | | | | | | | | |
With no allowance recorded: | | | | | | | | | | | | |
Commercial real estate: | | | | | | | | | | | | |
Nonfarm, nonresidential | | $ | 2,422 | | | $ | 835 | | | $ | — | |
Residential real estate: | | | | | | | | | | | | |
Closed-end 1-4 family | | | 93 | | | | 93 | | | | — | |
| | | | | | | | | | | | |
Subtotal | | | 2,515 | | | | 928 | | | | — | |
| | | | | | | | | | | | |
With an allowance recorded: | | | | | | | | | | | | |
Commercial and industrial | | | 18 | | | | 18 | | | | 18 | |
| | | | | | | | | | | | |
Subtotal | | | 18 | | | | 18 | | | | 18 | |
| | | | | | | | | | | | |
Total | | $ | 2,533 | | | $ | 946 | | | $ | 18 | |
| | | | | | | | | | | | |
15
The following table presents the average recorded investment of impaired loans by class of loans for the three and six months ended June 30, 2015 and 2014:
| | | | | | | | | | | | | | | | |
| | | Three Months Ended
June 30, | | | Six Months Ended
June 30, | |
Average Recorded Investment | | 2015 | | | 2014 | | | 2015 | | | 2014 | |
With no allowance recorded: | | | | | | | | | | | | | | | | |
Construction and land development | | $ | — | | | $ | — | | | $ | — | | | $ | — | |
Commercial real estate: | | | | | | | | | | | | | | | | |
Nonfarm, nonresidential | | | 865 | | | | — | | | | 850 | | | | 603 | |
Residential real estate: | | | | | | | | | | | | | | | | |
Closed-end 1-4 family | | | 313 | | | | — | | | | 265 | | | | — | |
Other | | | 238 | | | | — | | | | 119 | | | | — | |
Commercial and industrial | | | 110 | | | | — | | | | 104 | | | | — | |
| | | | | | | | | | | | | | | | |
Subtotal | | | 1,526 | | | | — | | | | 1,338 | | | | 603 | |
| | | | | | | | | | | | | | | | |
With an allowance recorded: | | | | | | | | | | | | | | | | |
Construction and land development | | $ | — | | | $ | — | | | $ | — | | | $ | — | |
Commercial real estate: | | | | | | | | | | | | | | | | |
Nonfarm, nonresidential | | | — | | | | 1,375 | | | | — | | | | 1,375 | |
Residential real estate: | | | | | | | | | | | | | | | | |
1-4 family | | | — | | | | 229 | | | | — | | | | 725 | |
Commercial and industrial | | | 43 | | | | 66 | | | | 30 | | | | 66 | |
Consumer and other | | | 16 | | | | — | | | | 8 | | | | — | |
| | | | | | | | | | | | | | | | |
Subtotal | | | 59 | | | | 1,670 | | | | 38 | | | | 2,166 | |
| | | | | | | | | | | | | | | | |
Total | | $ | 1,585 | | | $ | 1,670 | | | $ | 1,376 | | | $ | 2,769 | |
| | | | | | | | | | | | | | | | |
The impact on net interest income for these loans was not material to the Company’s results of operations for the three and six months ended June 30, 2015 and 2014.
The following table presents the recorded investment in nonaccrual and loans past due over 90 days still on accrual by class of loans as of June 30, 2015 and December 31, 2014:
| | | | | | | | |
| | | Nonaccrual | | | Loans Past Due
Over 90 Days | |
June 30, 2015 | | | | | | | | |
Commercial real estate: | | | | | | | | |
Nonfarm, nonresidential | | $ | 835 | | | $ | — | |
Residential real estate: | | | | | | | | |
Closed-end1-4 family | | | 96 | | | | — | |
Commercial and industrial | | | 16 | | | | — | |
| | | | | | | | |
Total | | $ | 947 | | | $ | — | |
| | | | | | | | |
December 31, 2014 | | | | | | | | |
Commercial real estate: | | | | | | | | |
Nonfarm, nonresidential | | $ | 835 | | | $ | — | |
Residential real estate: | | | | | | | | |
Closed-end 1-4 family | | | — | | | | 316 | |
| | | | | | | | |
Total | | $ | 835 | | | $ | 316 | |
| | | | | | | | |
Nonaccrual loans and loans past due 90 days still on accrual include both smaller balance homogeneous loans that are collectively evaluated for impairment and individually classified impaired loans.
16
The following table presents the aging of the recorded investment in past due loans as of June 30, 2015 and December 31, 2014 by class of loans:
| | | | | | | | | | | | | | | | | | | | | | | | | | | | |
| | | 30-59
Days
Past Due | | | 60-89
Days
Past Due | | | Greater
Than 89
Days
Past Due | | | Total
Past Due | | | Loans
Not
Past Due | | | PCI
Loans | | | Total | |
June 30, 2015 | | | | | | | | | | | | | | | | | | | | | | | | | | | | |
Construction and land development | | $ | 1,328 | | | $ | 38 | | | $ | — | | | $ | 1,366 | | | $ | 292,263 | | | $ | 77 | | | $ | 293,706 | |
Commercial real estate: | | | | | | | | | | | | | | | | | | | | | | | | | | | | |
Nonfarm, nonresidential | | | — | | | | — | | | | 835 | | | | 835 | | | | 272,386 | | | | 1,752 | | | | 274,973 | |
Other | | | — | | | | — | | | | — | | | | — | | | | 6,370 | | | | — | | | | 6,370 | |
Residential real estate: | | | | | | | | | | | | | | | | | | | | | | | | | | | | |
Closed-end 1-4 family | | | 630 | | | | 35 | | | | — | | | | 665 | | | | 137,150 | | | | 703 | | | | 138,518 | |
Other | | | 710 | | | | 40 | | | | — | | | | 750 | | | | 95,542 | | | | 107 | | | | 96,399 | |
Commercial and industrial | | | 79 | | | | — | | | | — | | | | 79 | | | | 144,656 | | | | 1,639 | | | | 146,374 | |
Consumer and other | | | 23 | | | | — | | | | — | | | | 23 | | | | 7,504 | | | | — | | | | 7,527 | |
| | | | | | | | | | | | | | | | | | | | | | | | | | | | |
| | $ | 2,770 | | | $ | 113 | | | $ | 835 | | | $ | 3,718 | | | $ | 955,871 | | | $ | 4,278 | | | $ | 963,867 | |
| | | | | | | | | | | | | | | | | | | | | | | | | | | | |
| | | | | | | |
| | | 30-59
Days
Past Due | | | 60-89
Days
Past Due | | | Greater
Than 89
Days
Past Due | | | Total
Past Due | | | Loans
Not
Past Due | | | PCI
Loans | | | Total | |
December 31, 2014 | | | | | | | | | | | | | | | | | | | | | | | | | | | | |
Construction and land development | | $ | 354 | | | $ | — | | | $ | — | | | $ | 354 | | | $ | 238,871 | | | $ | 77 | | | $ | 239,302 | |
Commercial real estate: | | | | | | | | | | | | | | | | | | | | | | | | | | | | |
Nonfarm, nonresidential | | | — | | | | — | | | | 835 | | | | 835 | | | | 240,140 | | | | 1,798 | | | | 242,773 | |
Other | | | — | | | | — | | | | — | | | | — | | | | 5,377 | | | | — | | | | 5,377 | |
Residential real estate: | | | | | | | | | | | | | | | | | | | | | | | | | | | | |
Closed-end 1-4 family | | | 299 | | | | 165 | | | | 316 | | | | 780 | | | | 129,851 | | | | 706 | | | | 131,337 | |
Other | | | 52 | | | | — | | | | — | | | | 52 | | | | 83,077 | | | | 108 | | | | 83,237 | |
Commercial and industrial | | | — | | | | 212 | | | | — | | | | 212 | | | | 76,358 | | | | 1,624 | | | | 78,194 | |
Consumer and other | | | — | | | | — | | | | — | | | | — | | | | 8,025 | | | | 2 | | | | 8,027 | |
| | | | | | | | | | | | | | | | | | | | | | | | | | | | |
| | $ | 705 | | | $ | 377 | | | $ | 1,151 | | | $ | 2,233 | | | $ | 781,699 | | | $ | 4,315 | | | $ | 788,247 | |
| | | | | | | | | | | | | | | | | | | | | | | | | | | | |
Credit Quality Indicators:The Company categorizes loans into risk categories based on relevant information about the ability of borrowers to service their debt such as: current financial information, historical payment experience, credit documentation, public information, and current economic trends, among other factors. The Company analyzes loans individually by classifying the loans as to credit risk. This analysis includes non-homogeneous loans, such as commercial and commercial real estate loans as well as non-homogeneous residential real estate loans. This analysis is performed on a quarterly basis. The Company uses the following definitions for risk ratings:
Special Mention.Loans classified as special mention have a potential weakness that deserves management’s close attention. If left uncorrected, these potential weaknesses may result in deterioration of the repayment prospects for the loan or of the institution’s credit position at some future date.
Substandard.Loans classified as substandard are inadequately protected by the current net worth and paying capacity of the obligor or of the collateral pledged, if any. Loans so classified have a well-defined weakness or weaknesses that jeopardize the liquidation of the debt. They are characterized by the distinct possibility that the institution will sustain some loss if the deficiencies are not corrected.
17
Loans not meeting the criteria above that are analyzed individually as part of the above described process are considered to be pass-rated loans. The following table includes PCI loans, which are included in the “Substandard” column. Based on the most recent analysis performed, the risk category of loans by class of loans is as follows as of June 30, 2015 and December 31, 2014:
| | | | | | | | | | | | | | | | |
| | | Pass | | | Special
Mention | | | Substandard | | | Total | |
June 30, 2015 | | | | | | | | | | | | | | | | |
Construction and land development | | $ | 293,629 | | | $ | — | | | $ | 77 | | | $ | 293,706 | |
Commercial real estate: | | | | | | | | | | | | | | | | |
Nonfarm, nonresidential | | | 271,384 | | | | — | | | | 3,589 | | | | 274,973 | |
Other | | | 6,370 | | | | — | | | | — | | | | 6,370 | |
Residential real estate: | | | | | | | | | | | | | | | | |
Closed-end 1-4 family | | | 136,939 | | | | — | | | | 1,579 | | | | 138,518 | |
Other | | | 95,582 | | | | — | | | | 817 | | | | 96,399 | |
Commercial and industrial | | | 144,460 | | | | — | | | | 1,914 | | | | 146,374 | |
Consumer and other | | | 7,504 | | | | — | | | | 23 | | | | 7,527 | |
| | | | | | | | | | | | | | | | |
| | $ | 955,868 | | | $ | — | | | $ | 7,999 | | | $ | 963,867 | |
| | | | | | | | | | | | | | | | |
| | | | |
| | | Pass | | | Special
Mention | | | Substandard | | | Total | |
December 31, 2014 | | | | | | | | | | | | | | | | |
Construction and land development | | $ | 239,225 | | | $ | — | | | $ | 77 | | | $ | 239,302 | |
Commercial real estate: | | | | | | | | | | | | | | | | |
Nonfarm, nonresidential | | | 239,584 | | | | — | | | | 3,189 | | | | 242,773 | |
Other | | | 5,377 | | | | — | | | | — | | | | 5,377 | |
Residential real estate: | | | | | | | | | | | | | | | | |
1-4 family | | | 128,869 | | | | — | | | | 2,468 | | | | 131,337 | |
Other | | | 83,129 | | | | — | | | | 108 | | | | 83,237 | |
Commercial and industrial | | | 76,552 | | | | — | | | | 1,642 | | | | 78,194 | |
Consumer and other | | | 8,025 | | | | — | | | | 2 | | | | 8,027 | |
| | | | | | | | | | | | | | | | |
| | $ | 780,761 | | | $ | — | | | $ | 7,486 | | | $ | 788,247 | |
| | | | | | | | | | | | | | | | |
Purchased Credit-impaired (“PCI”) loans
Income is recognized on PCI loans pursuant to ASC Topic 310-30. A portion of the fair value discount has been recognized as an accretable yield that is accreted into interest income over the estimated remaining life of the loans. The remaining non-accretable difference represents cash flows not expected to be collected.
The table below summarizes the total contractually required principal and interest cash payments, management’s estimate of expected total cash payments and carrying value of the loans as of June 30, 2015 and December 31, 2014. Contractually required principal and interest payments have been adjusted for estimated prepayments.
| | | | | | | | |
| | | Jun 30, 2015 | | | Dec 31, 2014 | |
Contractually required principal and interest | | $ | 6,000 | | | $ | 6,532 | |
Non-accretable difference | | | (973 | ) | | | (1,270 | ) |
| | | | | | | | |
Cash flows expected to be collected | | | 5,027 | | | | 5,262 | |
Accretable yield | | | (749 | ) | | | (947 | ) |
| | | | | | | | |
Carrying value of acquired loans | | | 4,278 | | | | 4,315 | |
Allowance for loan losses | | | — | | | | — | |
| | | | | | | | |
Carrying value less allowance for loan losses | | $ | 4,278 | | | $ | 4,315 | |
| | | | | | | | |
18
Management adjusted estimates of future expected losses, cash flows and renewal assumptions during the six months ended June 30, 2015. These adjustments resulted in a decrease in expected cash flows and accretable yield, and a decrease in the non-accretable difference. The table below summarizes the changes in total contractually required principal and interest cash payments, management’s estimate of expected total cash payments and carrying value of the loans during the three- and six-month periods ending June 30, 2015.
| | | | | | | | | | | | | | | | | | | | |
Activity during the three-month period ending June 30, 2015 | | Mar 31, 2015 | | | Effect of
Acquisitions | | | Income
Accretion | | | All other
Adjustments | | | Jun 30, 2015 | |
Contractually required principal and interest | | $ | 6,135 | | | $ | — | | | $ | — | | | $ | (135 | ) | | $ | 6,000 | |
Non-accretable difference | | | (989 | ) | | | — | | | | — | | | | 16 | | | | (973 | ) |
| | | | | | | | | | | | | | | | | | | | |
Cash flows expected to be collected | | | 5,146 | | | | — | | | | — | | | | (119 | ) | | | 5,027 | |
Accretable yield | | | (840 | ) | | | — | | | | 133 | | | | (42 | ) | | | (749 | ) |
| | | | | | | | | | | | | | | | | | | | |
Carry value of acquired loans | | $ | 4,306 | | | $ | — | | | $ | 133 | | | $ | (161 | ) | | $ | 4,278 | |
| | | | | | | | | | | | | | | | | | | | |
| | | | | |
Activity during the six-month period ending June 30, 2015 | | Dec 31, 2014 | | | Effect of
Acquisitions | | | Income
Accretion | | | All other
Adjustments | | | Jun 30, 2015 | |
Contractually required principal and interest | | $ | 6,532 | | | $ | — | | | $ | — | | | $ | (532 | ) | | $ | 6,000 | |
Non-accretable difference | | | (1,270 | ) | | | — | | | | — | | | | 297 | | | | (973 | ) |
| | | | | | | | | | | | | | | | | | | | |
Cash flows expected to be collected | | | 5,262 | | | | — | | | | — | | | | (235 | ) | | | 5,027 | |
Accretable yield | | | (947 | ) | | | — | | | | 190 | | | | 8 | | | | (749 | ) |
| | | | | | | | | | | | | | | | | | | | |
Carry value of acquired loans | | $ | 4,315 | | | $ | — | | | $ | 190 | | | $ | (227 | ) | | $ | 4,278 | |
| | | | | | | | | | | | | | | | | | | | |
Troubled Debt Restructurings
The Company’s loan portfolio contains no loans that have been modified in a troubled debt restructuring.
NOTE 5—LOAN SERVICING
Loans serviced for others are not reported as assets. The principal balances of these loans at June 30, 2015 and December 31, 2014 are as follows:
| | | | | | | | |
| | | June 30,
2015 | | | December 31,
2014 | |
Loan portfolios serviced for: | | | | | | | | |
Federal Home Loan Mortgage Corporation | | $ | 445,816 | | | $ | 414,222 | |
Other | | | 3,683 | | | | 3,986 | |
The components of net loan servicing fees for the three and six months ended June 30, 2015 and 2014 were as follows:
| | | | | | | | | | | | | | | | |
| | | Three Months Ended
June 30, | | | Six Months Ended
June 30, | |
| | | 2015 | | | 2014 | | | 2015 | | | 2014 | |
Loan servicing fees, net: | | | | | | | | | | | | | | | | |
Loan servicing fees | | $ | 278 | | | $ | 236 | | | $ | 544 | | | $ | 463 | |
Amortization of loan servicing fees | | | (218 | ) | | | (148 | ) | | | (441 | ) | | | (363 | ) |
Change in impairment | | | — | | | | — | | | | — | | | | — | |
| | | | | | | | | | | | | | | | |
Total | | $ | 60 | | | $ | 88 | | | $ | 103 | | | $ | 100 | |
| | | | | | | | | | | | | | | | |
The fair value of servicing rights was estimated by management to be approximately $4,679 at June 30, 2015. Fair value for June 30, 2015 was determined using a weighted average discount rate of 10.5% and a weighted average prepayment speed of 9.2%. At December 31, 2014, the fair value of servicing rights was estimated by management to be approximately $4,180. Fair value for December 31, 2014 was determined using weighted average discount rate of 10.5% and a weighted average prepayment speed of 10.8%.
19
The weighted average amortization period is 6.77 years. Estimated amortization expense for each of the next three years is:
| | | | |
2015 | | $ | 668 | |
2016 | | | 456 | |
2017 | | | 456 | |
NOTE 6—SHARE-BASED PAYMENTS
In connection with the Company’s 2010 private offering, 32,425 warrants were issued to shareholders, one warrant for every twenty shares of common stock purchased. Each warrant allows the shareholders to purchase an additional share of common stock at $12.00 per share. The warrants were issued with an effective date of March 30, 2010 and will be exercisable in whole or in part up to seven years following the date of issuance. The warrants are detachable from the common stock. There were 3,600 warrants exercised during the six months ended June 30, 2015, for which the Company received cash proceeds of $43. The exercised warrants had an aggregate intrinsic value of $31 at the date of exercise. No warrants were exercised during the six months ended June 30, 2014. At June 30, 2015, there were 28,277 outstanding warrants associated with the 2010 offering.
Since the common stock of the Company has been registered under the Securities Act and has been traded on a national securities exchange at $15.00 or more for forty-five (45) consecutive days, the Company may redeem the 2010 warrants at any time with not less than thirty (30) days’ written notice to the holder of such 2010 warrant, in whole or in part, at a redemption price of $1.00 per warrant; provided, however, that the holder of the 2010 warrant may exercise the 2010 warrant, in whole or in part, during such thirty (30) day period.
Stock Option Plan: The Company’s 2007 Stock Option Plan (“stock option plan” or the “Plan”), which was shareholder-approved, permitted the grant of stock options to its employees, organizers and directors for up to 551,250 shares of common stock. The Plan was amended during April 2010 to increase the number of shares available for issuance to 1,000,000. In April 2013, the Plan was amended to offer additional forms of equity compensation, to change the Plan’s name to the Franklin Financial Network, Inc. 2007 Omnibus Equity Incentive Plan, and to increase the number of authorized shares to 1,500,000. Shareholders approved amendments to the Company’s 2007 Stock Option Plan (“stock option plan” or the “Plan”) to increase the number of authorized shares to 2,000,000 in June 2014 and to 4,000,000 in February 2015. At June 30, 2015, there were 2,375,717 authorized shares available for issuance.
Employee, organizer and director awards are granted with an exercise price equal to the market price of the Company’s common stock at the date of grant; those option awards have a vesting period of 3 to 5 years and have a 10-year contractual term. The Company assigns discretion to its Board of Directors to make grants either as qualified incentive stock options or as non-qualified stock options. All employee grants are intended to be treated as qualified incentive stock options, if allowable. All other grants are expected to be treated as non-qualified.
During 2014, the Company granted 181,680 options, had 23,809 options exercised, and had 31,135 options that were either forfeited, cancelled or expired. In addition, on July 1, 2014, 322,300 MidSouth common stock options were converted into 137,280 options to purchase shares of FFN common stock with an exercise price of $8.57 per option pursuant to the terms of the merger agreement (see Note 2). Using the Black-Scholes option valuation model, the grant date fair value was estimated to be $6.31 per converted option based on the $14.50 fair value per share of FFN common stock at July 1, 2014. No compensation expense was required related to the converted options.
The fair value of each option award is estimated on the date of grant using a closed form option valuation (Black-Scholes) model that uses the assumptions noted in the table below. Expected stock price volatility is based on historical volatilities of a peer group. The Company uses historical data to estimate option exercise and post-vesting termination behavior.
The expected term of options granted represents the period of time that options granted are expected to be outstanding, which takes into account that the options are not transferable. The risk-free interest rate for the expected term of the option is based on the U.S. Treasury yield curve in effect at the time of the grant.
The fair value of options granted was determined using the following weighted-average assumptions as of grant date.
| | | | | | | | |
| | | June 30,
2015 | | | June 30,
2014 | |
Risk-free interest rate | | | 1.81 | % | | | 2.24 | % |
Expected term | | | 7.5 years | | | | 7.5 years | |
Expected stock price volatility | | | 25.00 | % | | | 11.04 | % |
Dividend yield | | | 0.22 | % | | | 0.44 | % |
The weighted average fair value of options granted for the six months ended June 30, 2015 and 2014 were $6.35 and $2.44, respectively.
20
A summary of the activity in the stock option plans for the six months ended June 30, 2015 follows:
| | | | | | | | | | | | | | | | |
| | | Shares | | | Weighted
Average
Exercise
Price | | | Weighted
Average
Remaining
Contractual
Term | | | Aggregate
Intrinsic
Value | |
Outstanding at beginning of year | | | 1,210,660 | | | $ | 11.32 | | | | 6.53 | | | $ | 7,244 | |
Granted | | | 210,782 | | | | 20.62 | | | | | | | | | |
Exercised | | | (77,600 | ) | | | 11.52 | | | | | | | | | |
Forfeited, expired, or cancelled | | | (2,108 | ) | | | 18.56 | | | | | | | | | |
| | | | | | | | | | | | | | | | |
Outstanding at period end | | | 1,341,734 | | | $ | 12.75 | | | | 6.58 | | | $ | 13,077 | |
| | | | | | | | | | | | | | | | |
Vested or expected to vest | | | 1,274,647 | | | $ | 12.75 | | | | 6.58 | | | $ | 12,423 | |
Exercisable at period end | | | 811,299 | | | $ | 10.73 | | | | 5.23 | | | $ | 9,550 | |
| | | | | | | | | | | | | | | | |
The Company received cash proceeds of $780 for the options exercised during the six months ended June 30, 2015. The exercised options had an aggregate intrinsic value of $639 at the date of exercise.
As of June 30, 2015, there was $1,756 of total unrecognized compensation cost related to non-vested stock options granted under the Plan. The cost is expected to be recognized over a weighted-average period of 1.8 years.
Restricted Share Award Plan: Additionally, the Company’s 2007 Omnibus Equity Incentive Plan provides for the granting of restricted share awards and other performance related incentives. During 2014, the Company awarded 87,374 restricted common shares to employees of the Company. When the restricted shares are awarded, a participant receives voting and dividend rights with respect to the shares, but is not able to transfer the shares until the restrictions have lapsed. These awards have a vesting period of three to five years and vest in equal annual installments on the anniversary date of the grant.
A summary of activity for non-vested restricted share awards for the six months ended June 30, 2015 is as follows:
| | | | | | | | |
Non-vested Shares | | Shares | | | Weighted-Average
Grant-Date
Fair Value | |
Non-vested at beginning of year | | | 102,710 | | | $ | 13.93 | |
Granted | | | 31,938 | | | | 20.69 | |
Vested | | | (11,705 | ) | | | 13.61 | |
Forfeited | | | (1,243 | ) | | | 16.29 | |
| | | | | | | | |
Non-vested at period end | | | 121,700 | | | $ | 15.73 | |
| | | | | | | | |
Compensation expense associated with the restricted share awards is recognized on a straight-line basis over the time period that the restrictions associated with the awards lapse based on the total cost of the award at the grant date. As of June 30, 2015, there was $1,677 of total unrecognized compensation cost related to non-vested shares granted under the Plan. The cost is expected to be recognized over a weighted-average period of 3.7 years.
NOTE 7—REGULATORY CAPITAL MATTERS
In July 2013, the Federal Reserve Board and the FDIC approved final rules that substantially amend the regulatory risk-based capital rules applicable to the Company and Bank. The final rules implement the regulatory capital reforms of the Basel Committee on Banking Supervision reflected in “Basel III: A Global Framework for More Resilient Banks and Banking Systems” (“Basel III”) and changes required by the Dodd-Frank Act.
Under these rules, the leverage and risk-based capital ratios of bank holding companies may not be lower than the leverage and risk-based capital ratios for insured depository institutions. The final rules implementing the Basel III regulatory capital reforms became effective to the Company and Bank on January 1, 2015, and include new minimum risk-based capital and leverage ratios. Moreover, these rules refine the definition of what constitutes capital for purposes of calculating those ratios, including the definitions of Tier 1 capital and Tier 2 capital.
In addition to the new minimum capital level requirements, the rules also establish a “capital conservation buffer” of 2.5% (to be phased in over three years) above the new regulatory minimum risk-based capital ratios, and result in the following minimum ratios once the capital conservation buffer is fully phased in: (i) a common Tier 1 risk-based capital ratio of 7.0%, (ii) a Tier 1 risk-based capital ratio of 8.5%, and (iii) a total risk-based capital ratio of 10.5%. The capital conservation buffer is to be phased in beginning in
21
January 2016 at 0.625% of risk-weighted assets and will increase each year until fully implemented in January 2019. An institution will be subject to limitations on paying dividends, engaging in share repurchases, and paying discretionary bonuses if capital levels fall below minimum levels plus the buffer amounts. These limitations establish a maximum percentage of eligible retained income that could be utilized for such actions.
The final rules allow banks and their holding companies with less than $250 billion in assets a one-time opportunity to opt-out of a requirement to include unrealized gains and losses in accumulated other comprehensive income in their capital calculation. The Company has opted out of this requirement.
Management believes, as of June 30, 2015, that the Company and Bank met all capital adequacy requirements to which they are subject and met the requirements to be considered well-capitalized. The Company’s and Bank’s actual capital amounts and ratios are presented in the following table (in thousands):
| | | | | | | | | | | | | | | | | | | | |
| | | Actual | | | Minimum Capital
Requirement | | | Excess
Amount | |
| | | Amount | | | Ratio | | | Amount | | | Ratio | | |
June 30, 2015 | | | | | | | | | | | | | | | | | | | | |
Company common equity Tier 1 capital to risk-weighted assets | | $ | 152,941 | | | | 12.29 | % | | $ | 56,006 | | | | 4.50 | % | | $ | 96,935 | |
Company total capital to risk-weighted assets | | $ | 168,019 | | | | 13.50 | % | | $ | 99,566 | | | | 8.00 | % | | $ | 68,453 | |
Company Tier 1 capital to risk-weighted assets | | $ | 160,003 | | | | 12.86 | % | | $ | 74,674 | | | | 6.00 | % | | $ | 85,329 | |
Company Tier 1 capital to average assets | | $ | 160,003 | | | | 10.19 | % | | $ | 62,790 | | | | 4.00 | % | | $ | 97,213 | |
Bank common equity Tier 1 capital to risk-weighted assets | | $ | 150,511 | | | | 12.10 | % | | $ | 55,980 | | | | 4.50 | % | | $ | 94,531 | |
Bank total capital to risk-weighted assets | | $ | 158,527 | | | | 12.74 | % | | $ | 99,519 | | | | 8.00 | % | | $ | 59,008 | |
Bank Tier 1 capital to risk-weighted assets | | $ | 150,511 | | | | 12.10 | % | | $ | 74,639 | | | | 6.00 | % | | $ | 75,872 | |
Bank Tier 1 capital to average assets | | $ | 150,511 | | | | 9.59 | % | | $ | 62,785 | | | | 4.00 | % | | $ | 87,726 | |
December 31, 2014 | | | | | | | | | | | | | | | | | | | | |
Company total capital to risk-weighted assets | | $ | 114,475 | | | | 12.30 | % | | $ | 74,464 | | | | 8.00 | % | | $ | 40,011 | |
Company Tier 1 capital to risk-weighted assets | | $ | 107,795 | | | | 11.58 | % | | $ | 37,232 | | | | 4.00 | % | | $ | 70,563 | |
Company Tier 1 capital to average assets | | $ | 107,795 | | | | 8.57 | % | | $ | 50,291 | | | | 4.00 | % | | $ | 57,504 | |
Bank total capital to risk-weighted assets | | $ | 113,830 | | | | 12.23 | % | | $ | 74,447 | | | | 8.00 | % | | $ | 39,383 | |
Bank Tier 1 capital to risk-weighted assets | | $ | 107,150 | | | | 11.51 | % | | $ | 37,223 | | | | 4.00 | % | | $ | 69,927 | |
Tier 1 capital to average assets | | $ | 107,150 | | | | 8.52 | % | | $ | 50,279 | | | | 4.00 | % | | $ | 56,871 | |
Dividend Restrictions: The Company’s principal source of funds for dividend payments is dividends received from the Bank. Banking regulations limit the amount of dividends that may be paid without prior approval of regulatory agencies. Under these regulations, the amount of dividends that may be paid in any calendar year is limited to the current year’s net profits, combined with the retained net profits of the preceding two years, subject to the capital requirements described above. During 2015 the Bank could declare, without prior approval, dividends of approximately $13,836 plus any 2015 net profits retained to the date of declaration.
NOTE 8—FAIR VALUE
Fair value is the exchange price that would be received for an asset or paid to transfer a liability (exit price) in the principal or most advantageous market for the asset or liability in an orderly transaction between market participants on the measurement date. There are three levels of inputs that may be used to measure fair values:
Level 1: Quoted prices (unadjusted) for identical assets or liabilities in active markets that the entity has the ability to access as of the measurement date.
Level 2: Significant other observable inputs other than Level 1 prices such as quoted prices for similar assets or liabilities; quoted prices in markets that are not active; or other inputs that are observable or can be corroborated by observable market data.
Level 3: Significant unobservable inputs that reflect a reporting entity’s own assumptions about the assumptions that market participants would use in pricing an asset or liability.
The Company used the following methods and significant assumptions to estimate the fair value of each type of asset and liability:
Securities: The fair values for investment securities are determined by quoted market prices, if available (Level 1). For securities where quoted prices are not available, fair values are calculated based on market prices of similar securities (Level 2). For securities where quoted prices or market prices of similar securities are not available, fair values are calculated using discounted cash flows or other market indicators (Level 3).
22
Derivatives: The fair values of derivatives are based on valuation models using observable market data as of the measurement date (Level 2).
Impaired Loans: The fair value of impaired loans with specific allocations of the allowance for loan losses is generally based on recent real estate appraisals. These appraisals may utilize a single valuation approach or a combination of approaches including comparable sales and the income approach. Adjustments are routinely made in the appraisal process by the independent appraisers to adjust for differences between the comparable sales and income data available. Such adjustments are usually significant and typically result in a Level 3 classification of the inputs for determining fair value. Non-real estate collateral may be valued using an appraisal, net book value per the borrower’s financial statements, or aging reports, adjusted or discounted based on management’s historical knowledge, changes in market conditions from the time of the valuation, and management’s expertise and knowledge of the client and client’s business, resulting in a Level 3 fair value classification. Impaired loans are evaluated on a quarterly basis for additional impairment and adjusted accordingly. Appraisals for impaired loans are generally obtained annually but may be obtained more frequently based on changing circumstances as part of the aforementioned quarterly evaluation.
Foreclosed Assets: Assets acquired through or instead of loan foreclosure are initially recorded at fair value less costs to sell when acquired, establishing a new cost basis. These assets are subsequently accounted for at lower of cost or fair value less estimated costs to sell. Fair value is commonly based on recent real estate appraisals which are updated no less frequently than annually. These appraisals may utilize a single valuation approach or a combination of approaches including comparable sales and the income approach. Adjustments are routinely made in the appraisal process by the independent appraisers to adjust for differences between the comparable sales and income data available. Such adjustments are usually significant and typically result in a Level 3 classification of the inputs for determining fair value. Foreclosed assets are evaluated on a quarterly basis for additional impairment and adjusted accordingly.
Loans Held For Sale: During 2014 the Company elected the fair value option for loans held for sale to align with other accounting policies related to mortgage banking, such as mortgage banking derivatives. These loans are typically sold to an investor following loan origination and the fair value of such accounts are readily available based on direct quotes from investors or similar transactions experienced in the secondary loan market. Fair value adjustments, as well as realized gains and losses are recorded in current earnings. Fair value is determined by market prices for similar transactions adjusted for specific attributes of that loan.
Assets and liabilities measured at fair value on a recurring basis, including financial assets and liabilities for which the Company has elected the fair value option, are summarized below:
| | | | | | | | | | | | |
| | | Fair Value Measurements at
June 30, 2015 Using: | |
| | | Quoted Prices
in Active
Markets for
Identical Assets
(Level 1) | | | Significant
Other
Observable
Inputs
(Level 2) | | | Significant
Unobservable
Inputs
(Level 3) | |
Financial Assets | | | | | | | | | | | | |
Securities available for sale | | | | | | | | | | | | |
U.S. government sponsored entities and agencies | | $ | — | | | $ | 14,198 | | | $ | — | |
Mortgage-backed securities-residential | | | — | | | | 512,110 | | | | — | |
Mortgage-backed securities-commercial | | | — | | | | 20,189 | | | | — | |
State and political subdivisions | | | — | | | | 88,687 | | | | — | |
| | | | | | | | | | | | |
Total securities available for sale | | $ | — | | | $ | 635,184 | | | $ | — | |
| | | | | | | | | | | | |
Loans held for sale | | $ | — | | | $ | 16,842 | | | $ | — | |
| | | | | | | | | | | | |
Mortgage banking derivatives | | $ | — | | | $ | 242 | | | $ | — | |
| | | | | | | | | | | | |
Financial Liabilities | | | | | | | | | | | | |
Mortgage banking derivatives | | $ | — | | | $ | 16 | | | $ | — | |
| | | | | | | | | | | | |
23
| | | | | | | | | | | | |
| | | Fair Value Measurements at
December 31, 2014 Using: | |
| | | Quoted Prices
in Active
Markets for
Identical Assets
(Level 1) | | | Significant
Other
Observable
Inputs
(Level 2) | | | Significant
Unobservable
Inputs
(Level 3) | |
Financial Assets | | | | | | | | | | | | |
Securities available for sale | | | | | | | | | | | | |
U.S. government sponsored entities and agencies | | $ | — | | | $ | 30,173 | | | $ | — | |
U.S. Treasury Bills | | | 20,000 | | | | — | | | | — | |
Mortgage-backed securities-residential | | | — | | | | 339,067 | | | | — | |
Mortgage-backed securities-commercial | | | — | | | | 6,465 | | | | — | |
State and political subdivisions | | | — | | | | — | | | | — | |
| | | | | | | | | | | | |
Total securities available for sale | | $ | 20,000 | | | $ | 375,705 | | | $ | — | |
| | | | | | | | | | | | |
Loans held for sale | | $ | — | | | $ | 18,462 | | | $ | — | |
| | | | | | | | | | | | |
Mortgage banking derivatives | | $ | — | | | $ | 285 | | | $ | — | |
| | | | | | | | | | | | |
Financial Liabilities | | | | | | | | | | | | |
Mortgage banking derivatives | | $ | — | | | $ | 132 | | | $ | — | |
| | | | | | | | | | | | |
As of June 30, 2015, the unpaid principal balance of loans held for sale was $16,548 resulting in an unrealized gain of $294 included in gains on sale of loans. For the three months ended June 30, 2015 and 2014, the change in fair value related to loans held for sale, which is included in gain on sale of loans, was ($293) and $329, respectively. For the six months ended June 30, 2015 and 2014, the change in fair value related to loans held for sale, which is included in gain on sale of loans, was ($270) and $538, respectively. None of these loans are 90 days or more past due or on nonaccrual as of June 30, 2015.
There were no transfers between level 1 and 2 during 2015 and 2014.
Assets measured at fair value on a non-recurring basis are summarized below:
There were no collateral dependent impaired loans carried at fair value as of June 30, 2015 or December 31, 2014. For the three months ended June 30, 2015 and 2014, $0 and ($20) in additional provision for loan losses was recorded related to impaired loans recorded at fair value of collateral. For the six months ended June 30, 2015 and 2014, $0 and $46 in additional provision for loan losses was recorded related to impaired loans recorded at fair value of collateral.
Foreclosed assets measured at fair value less costs to sell, had a net carrying amount of $206 and $715 as of June 30, 2015 and December 31, 2014, respectively. There were no properties at June 30, 2015 or 2014 that had required write-downs to fair value resulting in no write downs for the three or six months ending June 30, 2015 and 2014, respectively.
24
The carrying amounts and estimated fair values of financial instruments, at June 30, 2015 and December 31, 2014 are as follows:
| | | | | | | | | | | | | | | | | | | | |
| | | Carrying
Amount | | | Fair Value Measurements at
June 30, 2015 Using: | |
| | | | Level 1 | | | Level 2 | | | Level 3 | | | Total | |
Financial assets | | | | | | | | | | | | | | | | | | | | |
Cash and cash equivalents | | $ | 43,163 | | | $ | 43,163 | | | $ | — | | | $ | — | | | $ | 43,163 | |
Securities available for sale | | | 635,184 | | | | — | | | | 635,184 | | | | — | | | | 635,184 | |
Certificates of deposit held at other financial institutions | | | 250 | | | | — | | | | 250 | | | | — | | | | 250 | |
Securities held to maturity | | | 46,815 | | | | — | | | | 46,885 | | | | — | | | | 46,885 | |
Loans held for sale | | | 16,842 | | | | — | | | | 16,842 | | | | — | | | | 16,842 | |
Net loans | | | 954,175 | | | | — | | | | — | | | | 953,829 | | | | 953,829 | |
Restricted equity securities | | | 7,685 | | | | n/a | | | | n/a | | | | n/a | | | | n/a | |
Servicing rights, net | | | 3,298 | | | | — | | | | 4,679 | | | | — | | | | 4,679 | |
Accrued interest receivable | | | 4,886 | | | | 6 | | | | 2,257 | | | | 2,623 | | | | 4,886 | |
Financial liabilities | | | | | | | | | | | | | | | | | | | | |
Deposits | | $ | 1,491,986 | | | $ | 940,917 | | | $ | 557,906 | | | $ | — | | | $ | 1,498,823 | |
Federal funds purchased and repurchase agreements | | | 36,567 | | | | — | | | | 36,567 | | | | — | | | | 36,567 | |
Federal Home Loan Bank advances | | | 57,000 | | | | — | | | | 57,152 | | | | — | | | | 57,152 | |
Accrued interest payable | | | 578 | | | | 47 | | | | 531 | | | | — | | | | 578 | |
| | |
| | | Carrying
Amount | | | Fair Value Measurements at
December 31, 2014 Using: | |
| | | | Level 1 | | | Level 2 | | | Level 3 | | | Total | |
Financial assets | | | | | | | | | | | | | | | | | | | | |
Cash and cash equivalents | | $ | 49,347 | | | $ | 49,347 | | | $ | — | | | $ | — | | | $ | 49,347 | |
Securities available for sale | | | 395,705 | | | | 20,000 | | | | 375,705 | | | | — | | | | 395,705 | |
Certificates of deposit held at other financial institutions | | | 250 | | | | — | | | | 250 | | | | — | | | | 250 | |
Securities held to maturity | | | 53,332 | | | | — | | | | 53,741 | | | | — | | | | 53,741 | |
Loans held for sale | | | 18,462 | | | | — | | | | 18,462 | | | | — | | | | 18,462 | |
Net loans | | | 780,508 | | | | — | | | | — | | | | 782,745 | | | | 782,745 | |
Restricted equity securities | | | 5,349 | | | | n/a | | | | n/a | | | | n/a | | | | n/a | |
Servicing rights, net | | | 3,053 | | | | — | | | | 4,180 | | | | — | | | | 4,180 | |
Accrued interest receivable | | | 3,545 | | | | — | | | | 1,368 | | | | 2,177 | | | | 3,545 | |
Financial liabilities | | | | | | | | | | | | | | | | | | | | |
Deposits | | $ | 1,172,233 | | | $ | 848,158 | | | $ | 326,644 | | | $ | — | | | $ | 1,174,802 | |
Federal funds purchased and repurchase agreements | | | 39,078 | | | | — | | | | 39,078 | | | | — | | | | 39,078 | |
Federal Home Loan Bank advances | | | 19,000 | | | | — | | | | 19,146 | | | | — | | | | 19,146 | |
Accrued interest payable | | | 421 | | | | 33 | | | | 388 | | | | — | | | | 421 | |
The methods and assumptions not previously described used to estimate fair value are described as follows:
(a) Cash and Cash Equivalents: The carrying amounts of cash and short-term instruments approximate fair values and are classified as Level 1.
(b) Loans: Fair values of loans, excluding loans held for sale, are estimated as follows: For variable rate loans that reprice frequently and with no significant change in credit risk, fair values are based on carrying values resulting in a Level 3 classification. Fair values for other loans are estimated using discounted cash flow analyses, using interest rates currently being offered for loans with similar terms to borrowers of similar credit quality resulting in a Level 3 classification. Impaired loans are valued at the lower of cost or fair value as described previously. The methods utilized to estimate the fair value of loans do not necessarily represent an exit price.
The fair value of loans held for sale is estimated based upon binding contracts and quotes from third party investors resulting in a Level 2 classification.
(c) Restricted Equity Securities: It is not practical to determine the fair value of Federal Home Loan Bank or Federal Reserve Bank stock due to restrictions placed on its transferability.
(d) Mortgage Servicing Rights: Fair value of mortgage servicing rights is based on valuation models that calculate the present value of estimated net cash flows based on industry market data. The valuation model incorporates assumptions that market participants would use in estimating future net cash flows resulting in a Level 2 classification.
25
(e) Deposits:The fair values disclosed for demand deposits (e.g., interest and non-interest checking, passbook savings, and certain types of money market accounts) are, by definition, equal to the amount payable on demand at the reporting date (i.e., their carrying amount) resulting in a Level 1 classification. The carrying amounts of fixed-term money market accounts approximate their fair values at the reporting date resulting in a Level 1 classification. Fair values for certificates of deposit are estimated using a discounted cash flows calculation that applies interest rates currently being offered on certificates to a schedule of aggregated expected monthly maturities on time deposits resulting in a Level 2 classification.
(f) Federal Funds Purchased and Repurchase Agreements: The carrying amounts of federal funds purchased, borrowings under repurchase agreements, and other short-term borrowings, generally maturing within ninety days, approximate their fair values resulting in a Level 2 classification.
(g) Federal Home Loan Bank Advances: The fair values of the Company’s long-term borrowings are estimated using discounted cash flow analyses based on the current borrowing rates for similar types of borrowing arrangements resulting in a Level 2 classification.
(h) Accrued Interest Receivable/Payable: The carrying amounts of accrued interest approximate fair value resulting in a Level 1 or Level 2 classification based on the asset/liability that they are associated with.
(i) Off-balance Sheet Instruments: Fair values for off-balance sheet, credit-related financial instruments are based on fees currently charged to enter into similar agreements, taking into account the remaining terms of the agreements and the counterparties’ credit standing. The fair value of commitments is not material.
26
NOTE 9—EARNINGS PER SHARE
The two-class method is used in the calculation of basic and diluted earnings per share. Under the two-class method, earnings available to common shareholders for the period are allocated between common shareholders and participating securities according to dividends declared (or accumulated) and participation rights in undistributed earnings. The factors used in the earnings per share computation follow:
| | | | | | | | |
| | | Three Months Ended
June 30, | |
| | | 2015 | | | 2014 | |
Basic | | | | | | | | |
Net income available to common shareholders | | $ | 3,109 | | | $ | 2,010 | |
Less: earnings allocated to participating securities | | | (34 | ) | | | (20 | ) |
| | | | | | | | |
Net income allocated to common shareholders | | $ | 3,075 | | | $ | 1,990 | |
| | | | | | | | |
Weighted average common shares outstanding including participating securities | | | 10,490,972 | | | | 4,889,873 | |
Less: Participating securities | | | (116,103 | ) | | | (49,356 | ) |
| | | | | | | | |
Average shares | | | 10,374,869 | | | | 4,840,517 | |
| | | | | | | | |
Basic earnings per common share | | $ | 0.30 | | | $ | 0.41 | |
| | | | | | | | |
Diluted | | | | | | | | |
Net income allocated to common shareholders | | $ | 3,075 | | | $ | 1,990 | |
Weighted average common shares outstanding for basic earnings per common share | | | 10,374,869 | | | | 4,840,517 | |
Add: Dilutive effects of assumed exercises of stock options | | | 457,613 | | | | 127,848 | |
Add: Dilutive effects of assumed exercises of stock warrants | | | 12,785 | | | | 3,542 | |
| | | | | | | | |
Average shares and dilutive potential common shares | | | 10,845,267 | | | | 4,971,907 | |
| | | | | | | | |
Dilutive earnings per common share | | $ | 0.28 | | | $ | 0.40 | |
| | | | | | | | |
| |
| | | Six Months Ended
June 30, | |
| | | 2015 | | | 2014 | |
Basic | | | | | | | | |
Net income available to common shareholders | | $ | 6,216 | | | $ | 3,514 | |
Less: earnings allocated to participating securities | | | (73 | ) | | | (28 | ) |
| | | | | | | | |
Net income allocated to common shareholders | | $ | 6,143 | | | $ | 3,486 | |
| | | | | | | | |
Weighted average common shares outstanding including participating securities | | | 9,237,574 | | | | 4,876,347 | |
Less: Participating securities | | | (109,183 | ) | | | (38,325 | ) |
| | | | | | | | |
Average shares | | | 9,128,391 | | | | 4,838,022 | |
| | | | | | | | |
Basic earnings per common share | | $ | 0.67 | | | $ | 0.72 | |
| | | | | | | | |
Diluted | | | | | | | | |
Net income allocated to common shareholders | | $ | 6,143 | | | $ | 3,486 | |
Weighted average common shares outstanding for basic earnings per common share | | | 9,128,391 | | | | 4,838,022 | |
Add: Dilutive effects of assumed exercises of stock options | | | 445,611 | | | | 124,728 | |
Add: Dilutive effects of assumed exercises of stock warrants | | | 12,882 | | | | 3,542 | |
| | | | | | | | |
Average shares and dilutive potential common shares | | | 9,586,884 | | | | 4,966,292 | |
| | | | | | | | |
Dilutive earnings per common share | | $ | 0.64 | | | $ | 0.70 | |
| | | | | | | | |
For the three months ended June 30, 2015 and 2014, stock options for 147,782 and 245,432 shares of common stock were not considered in computing diluted earnings per common share because they were antidilutive. Stock options for 210,782 and 249,968 shares of common stock were not considered in computing diluted earnings per common share for the six months ended June 30, 2015 and 2014 because they were antidilutive.
27
NOTE 10—CAPITAL OFFERING
The Company commenced its initial public stock offering on March 26, 2015. The Company issued 2,640,000 shares of common stock at a price of $21.00 per share and began trading on the New York Stock Exchange on March 26, 2015, under the ticker symbol “FSB”. Net proceeds were as follows:
| | | | |
Gross proceeds | | $ | 55,440 | |
Less: stock offering costs | | | (5,015 | ) |
| | | | |
Net proceeds from issuance of common stock | | $ | 50,425 | |
| | | | |
28
ITEM 2. MANAGEMENT’S DISCUSSION AND ANALYSIS OF FINANCIAL CONDITION AND RESULTS OF OPERATIONS
The following discussion is intended to assist in the understanding and assessment of significant changes and trends related to the Company’s results of operations and financial condition. This discussion and analysis should be read in conjunction with the accompanying unaudited financial statements, the financial statements and accompanying notes included in the Company’s Prospectus filed with the SEC on March 27, 2015, which includes additional information about critical accounting policies and practices and risk factors, and Item 1A of Part II of this report, which updates those risk factors. Historical results and trends that might appear in the condensed consolidated financial statements should not be interpreted as being indicative of future operations. All amounts are in thousands, except per share data or unless otherwise indicated.
Critical Accounting Policies
The accounting and reporting policies of the Company are in accordance with accounting principles generally accepted in the United States of America and conform to general practices within the banking industry. To prepare financial statements in conformity with accounting principles generally accepted in the United States of America, management makes estimates and assumptions based on available information. These estimates and assumptions affect the amounts reported in the financial statements and the disclosures provided, and actual results could differ.
The Company’s accounting policies are integral to understanding the results reported. Accounting policies are described in detail in Note 1 of the notes to the consolidated financial statements. The critical accounting policies require judgment to ascertain the valuation of assets, liabilities, commitments and contingencies. Management has established policies and control procedures that are intended to ensure valuation methods are well controlled and applied consistently from period to period. In addition, the policies and procedures are intended to ensure that the process for changing methodologies occurs in an appropriate manner. The following is a brief summary of the more significant policies.
Principles of Consolidation
The consolidated financial statements include Franklin Financial Network, Inc. and its wholly owned subsidiaries, Franklin Synergy Bank and BCG Consulting Group, Inc. (“BCG”), together referred to as “the Company.” The Company sold the assets of BCG in December 2014; therefore, only the consolidated statements of income for the three and six months ending June 30, 2014 contain income and expenses that include BCG. The consolidated financial statements have been prepared in conformity with accounting principles generally accepted in the United States of America and conform to general practices within the banking industry. All significant intercompany accounts and transactions have been eliminated in the consolidated financial statements.
Purchased Loans
The Company maintains an allowance for loan losses on purchased loans based on credit deterioration subsequent to the acquisition date. In accordance with the accounting guidance for business combinations, because we recorded all acquired loans at fair value as of the date of the MidSouth acquisition, we did not establish an allowance for loan losses on any of the loans we purchased as of the acquisition date as any credit deterioration evident in the loans was included in the determination of the acquisition date fair values. For purchased credit-impaired loans accounted for under ASC 310-30, management establishes an allowance for loan losses subsequent to the date of acquisition by re-estimating expected cash flows on these loans on a quarterly basis, with any decline in expected cash flows due to credit triggering impairment recorded as provision for loan losses. The allowance established is the excess of the loan’s carrying value over the present value of projected future cash flows, discounted at the current accounting yield of the loan. These cash flow evaluations are inherently subjective as they require material estimates, all of which may be susceptible to significant change. While the determination of specific cash flows involves estimates, each estimate is unique to the individual loan, and none is individually significant. For non-purchased credit-impaired loans acquired in the MidSouth transaction and that are accounted for under ASC 310-20, the historical loss estimates are based on the historical losses experienced by MidSouth for loans with similar characteristics as those acquired other than purchased credit-impaired loans.
Allowance for Loan Losses
The allowance for loan losses is a valuation allowance for probable incurred credit losses. Loan losses are charged against the allowance when management believes the uncollectibility of a loan balance is confirmed. Subsequent recoveries, if any, are credited to the allowance. Management estimates the allowance balance required using past loan loss experience, the nature and volume of the portfolio, information about specific borrower situations and estimated collateral values, economic conditions, and other factors.
29
Allocations of the allowance may be made for specific loans, but the entire allowance is available for any loan that, in management’s judgment, should be charged off.
The allowance consists of specific and general components. The specific component relates to loans that are individually classified as impaired. A loan is impaired when, based on current information and events, it is probable that the Company will be unable to collect all amounts due according to the contractual terms of the loan agreement. Loans for which the terms have been modified resulting in a concession, and for which the borrower is experiencing financial difficulties, are considered troubled debt restructurings and classified as impaired.
Factors considered by management in determining impairment include payment status, collateral value, and the probability of collecting scheduled principal and interest payments when due. Loans that experience insignificant payment delays and payment shortfalls generally are not classified as impaired. Management determines the significance of payment delays and payment shortfalls on a case-by-case basis, taking into consideration all of the circumstances surrounding the loan and the borrower, including the length of the delay, the reasons for the delay, the borrower’s prior payment record, and the amount of the shortfall in relation to the principal and interest owed.
All loans classified by management as substandard or worse are individually evaluated for impairment. If a loan is impaired, a portion of the allowance is allocated so that the loan is reported, net, at the present value of estimated future cash flows using the loan’s existing rate or at the fair value of collateral if repayment is expected solely from the collateral.
Troubled debt restructurings are separately identified for impairment disclosures and are measured at the present value of estimated future cash flows using the loan’s effective rate at inception. If a troubled debt restructuring is considered to be a collateral dependent loan, the loan is reported, net, at the fair value of the collateral. For troubled debt restructurings that subsequently default, the Company determines the amount of reserve in accordance with the accounting policy for the allowance for loan losses.
The general component covers non-impaired loans and is based on historical loss experience adjusted for current factors. The historical loss experience is determined by portfolio segment and is based on a combination of the Bank’s loss history and loss history from the Bank’s peer group over the past three years. This actual loss experience is supplemented with other economic factors based on the risks present for each portfolio segment. These economic factors include consideration of the following: levels of and trends in delinquencies and impaired loans; levels of and trends in charge-offs and recoveries; trends in volume and terms of loans; effects of any changes in risk selection and underwriting standards; other changes in lending policies, procedures, and practices; experience, ability, and depth of lending management and other relevant staff; national and local economic trends and conditions; industry conditions; and effects of changes in credit concentrations.
Mortgage Servicing Rights
When loans are sold with servicing retained, servicing rights are initially recorded at fair value with the income statement effect recorded in gain on sale of loans. Fair value is based on market prices for comparable servicing contracts. All classes of servicing assets are subsequently measured using the amortization method which requires servicing rights to be amortized into non-interest income in proportion to, and over the period of, the estimated future net servicing income of the underlying loans.
Servicing assets are evaluated for impairment based upon the fair value of the rights as compared to carrying amount. Impairment is determined by stratifying rights into groupings based on predominant risk characteristics, such as interest rate, loan type and investor type. Impairment is recognized through a valuation allowance for an individual grouping, to the extent that fair value is less than the carrying amount. If the Company later determines that all or a portion of the impairment no longer exists for a particular grouping, a reduction of the allowance may be recorded as an increase to income. Changes in valuation allowances are reported with loan servicing fees on the income statement. The fair values of servicing rights are subject to significant fluctuations as a result of changes in estimated and actual prepayment speeds and default rates and losses.
Servicing fee income, which is reported on the income statement as loan servicing fees, is recorded for fees earned for servicing loans. The fees are based on a contractual percentage of the outstanding principal or a fixed amount per loan and are recorded as income when earned. The amortization of mortgage servicing rights is netted against mortgage loan servicing fee income.
Recent Accounting Pronouncements
There are currently no new accounting standards that have been issued that will have a significant impact on the Company’s financial position, results of operations or cash flows upon adoption that were not disclosed in the Company’s most recent Annual Report on Form 10-K.
30
COMPARISON OF RESULTS OF OPERATIONS FOR THE THREE AND SIX MONTHS ENDED
JUNE 30, 2015 AND 2014
Overview
The Company reported net income of $3,134 and $6,266 for the three and six months ended June 30, 2015, respectively, compared to $2,035 and $3,564 for the three and six months ended June 30, 2014. After the payment of preferred dividends on the senior preferred stock issued to the Treasury pursuant to Small Business Lending Fund (“SBLF”), the Company’s net earnings available to common shareholders for the three and six months ended June 30, 2015 was $3,109 and $6,216, respectively, compared to $2,010 and $3,514 for the three and six months ended June 30, 2014. The primary reason for the increase in net earnings available to common shareholders for the three and six months ended June 30, 2015 was increased interest income on loans and investment securities compared with the same periods in 2014. The increase in loans was due to both significant organic growth and due to the acquisition of MidSouth which, after considering the effect of purchase accounting entries, added $191,416 in loans when the transaction was completed on July 1, 2014. The growth in the securities portfolio is primarily attributable to both organic growth and capital leverage programs implemented during the second quarter of 2015 to utilize proceeds received from the issuance of common stock in conjunction with the Company’s initial public stock offering on March 26, 2015. The acquisition of MidSouth also added $57,431 in securities available-for-sale, after the effect of purchase accounting entries, when the transaction was completed on July 1, 2014.
Net Interest Income/Margin
Net interest income consists of interest income generated by earning assets less interest expense paid on interest-bearing liabilities and is the most significant component of our revenues. Net interest income for the three and six months ended June 30, 2015, totaled $13,327 and $25,484, respectively, compared to $7,348 and $14,443 for the same periods in 2014, an increase of $5,979 and $11,041, or 81.4% and 76.4%, between the respective periods. For the three and six months ended June 30, 2015, interest income increased $6,714 and $12,341, or 77.2% and 72.6%, respectively, due to growth in both the loan and investment securities portfolios. For the three and six months ended June 30, 2015, interest expense increased $735 and $1,300, or 54.4% and 50.9%, respectively, as a result of increases in both interest-bearing deposits and borrowings.
The tables below summarize average balances, yields, cost of funds, and the analysis of changes in interest income and interest expense for the three and six months ended June 30, 2015 and 2014:
Average Balances (7)—Yields & Rates
(Dollars are in thousands)
| | | | | | | | | | | | | | | | | | | | | | | | |
| | | Three Months Ended June 30, | |
| | | 2015 | | | 2014 | |
| | | Average
Balance | | | Interest
Inc / Exp | | | Average
Yield / Rate | | | Average
Balance | | | Interest
Inc / Exp | | | Average
Yield / Rate | |
ASSETS: | | | | | | | | | | | | | | | | | | | | | | | | |
Loans (1)(6) | | $ | 909,705 | | | $ | 12,173 | | | | 5.37 | % | | $ | 478,133 | | | $ | 6,380 | | | | 5.35 | % |
Securities available for sale (6) | | | 512,152 | | | | 2,790 | | | | 2.19 | % | | | 285,086 | | | | 1,859 | | | | 2.62 | % |
Securities held to maturity (6) | | | 48,676 | | | | 336 | | | | 2.77 | % | | | 59,619 | | | | 395 | | | | 2.66 | % |
Certificates of deposit at other financial institutions | | | 250 | | | | 2 | | | | 3.21 | % | | | — | | | | — | | | | 0.00 | % |
Federal funds sold and other (2) | | | 53,299 | | | | 112 | | | | 0.84 | % | | | 23,898 | | | | 65 | | | | 1.09 | % |
| | | | | | | | | | | | | | | | | | | | | | | | |
TOTAL INTEREST EARNING ASSETS | | $ | 1,524,082 | | | $ | 15,413 | | | | 4.06 | % | | $ | 846,736 | | | $ | 8,699 | | | | 4.12 | % |
Allowance for loan losses | | | (7,483 | ) | | | | | | | | | | | (5,467 | ) | | | | | | | | |
All other assets | | | 73,183 | | | | | | | | | | | | 29,258 | | | | | | | | | |
| | | | | | | | | | | | | | | | | | | | | | | | |
TOTAL ASSETS | | $ | 1,589,782 | | | | | | | | | | | $ | 870,527 | | | | | | | | | |
LIABILITIES & SHAREHOLDERS’ EQUITY | | | | | | | | | | | | | | | | | | | | | | | | |
Deposits: | | | | | | | | | | | | | | | | | | | | | | | | |
Interest checking | | $ | 265,844 | | | $ | 261 | | | | 0.39 | % | | $ | 173,628 | | | $ | 131 | | | | 0.30 | % |
Money market | | | 443,085 | | | | 630 | | | | 0.57 | % | | | 247,893 | | | | 454 | | | | 0.73 | % |
Savings | | | 33,471 | | | | 38 | | | | 0.46 | % | | | 20,639 | | | | 26 | | | | 0.51 | % |
Time deposits | | | 402,335 | | | | 984 | | | | 0.98 | % | | | 232,024 | | | | 603 | | | | 1.04 | % |
Federal Home Loan Bank advances | | | 48,165 | | | | 81 | | | | 0.67 | % | | | 33,000 | | | | 80 | | | | 0.97 | % |
Federal funds purchased and other (3) | | | 53,832 | | | | 92 | | | | 0.69 | % | | | 25,149 | | | | 57 | | | | 0.91 | % |
| | | | | | | | | | | | | | | | | | | | | | | | |
TOTAL INTEREST BEARING LIABILITIES | | $ | 1,246,732 | | | $ | 2,086 | | | | 0.67 | % | | $ | 732,333 | | | $ | 1,351 | | | | 0.74 | % |
Demand deposits | | | 157,511 | | | | | | | | | | | | 64,923 | | | | | | | | | |
Other liabilities | | | 5,937 | | | | | | | | | | | | 2,113 | | | | | | | | | |
Total shareholders’ equity | | | 179,602 | | | | | | | | | | | | 71,158 | | | | | | | | | |
| | | | | | | | | | | | | | | | | | | | | | | | |
TOTAL LIABILITIES AND SHAREHOLDERS’ EQUITY | | $ | 1,589,782 | | | | | | | | | | | $ | 870,527 | | | | | | | | | |
NET INTEREST SPREAD (4) | | | | | | | | | | | 3.39 | % | | | | | | | | | | | 3.38 | % |
NET INTEREST INCOME | | | | | | $ | 13,327 | | | | | | | | | | | $ | 7,348 | | | | | |
NET INTEREST MARGIN (5) | | | | | | | | | | | 3.51 | % | | | | | | | | | | | 3.48 | % |
31
| | | | | | | | | | | | | | | | | | | | | | | | |
| | | Six Months Ended June 30, | |
| | | 2015 | | | 2014 | |
| | | Average
Balance | | | Interest
Inc / Exp | | | Average
Yield / Rate | | | Average
Balance | | | Interest
Inc / Exp | | | Average
Yield / Rate | |
ASSETS: | | | | | | | | | | | | | | | | | | | | | | | | |
Loans (1)(6) | | $ | 877,749 | | | $ | 23,327 | | | | 5.36 | % | | $ | 461,948 | | | $ | 12,298 | | | | 5.37 | % |
Securities available for sale (6) | | | 460,458 | | | | 5,111 | | | | 2.24 | % | | | 280,876 | | | | 3,787 | | | | 2.72 | % |
Securities held to maturity (6) | | | 50,584 | | | | 700 | | | | 2.79 | % | | | 58,985 | | | | 790 | | | | 2.70 | % |
Certificates of deposit at other financial institutions | | | 250 | | | | 3 | | | | 2.42 | % | | | — | | | | — | | | | 0.00 | % |
Federal funds sold and other (2) | | | 49,154 | | | | 198 | | | | 0.81 | % | | | 27,077 | | | | 123 | | | | 0.92 | % |
| | | | | | | | | | | | | | | | | | | | | | | | |
TOTAL INTEREST EARNING ASSETS | | $ | 1,438,195 | | | $ | 29,339 | | | | 4.11 | % | | $ | 828,886 | | | $ | 16,998 | | | | 4.14 | % |
Allowance for loan losses | | | (7,262 | ) | | | | | | | | | | | (5,265 | ) | | | | | | | | |
All other assets | | | 71,276 | | | | | | | | | | | | 29,337 | | | | | | | | | |
| | | | | | | | | | | | | | | | | | | | | | | | |
TOTAL ASSETS | | $ | 1,502,209 | | | | | | | | | | | $ | 852,958 | | | | | | | | | |
LIABILITIES & SHAREHOLDERS’ EQUITY | | | | | | | | | | | | | | | | | | | | | | | | |
Deposits: | | | | | | | | | | | | | | | | | | | | | | | | |
Interest checking | | $ | 283,398 | | | $ | 435 | | | | 0.31 | % | | $ | 191,733 | | | $ | 297 | | | | 0.31 | % |
Money market | | | 418,719 | | | | 1,215 | | | | 0.59 | % | | | 242,942 | | | | 896 | | | | 0.74 | % |
Savings | | | 32,051 | | | | 73 | | | | 0.46 | % | | | 20,193 | | | | 51 | | | | 0.51 | % |
Time deposits | | | 371,593 | | | | 1,823 | | | | 0.99 | % | | | 218,050 | | | | 1,118 | | | | 1.03 | % |
Federal Home Loan Bank advances | | | 35,718 | | | | 146 | | | | 0.82 | % | | | 26,619 | | | | 109 | | | | 0.83 | % |
Federal funds purchased and other (3) | | | 48,381 | | | | 163 | | | | 0.68 | % | | | 19,193 | | | | 84 | | | | 0.88 | % |
| | | | | | | | | | | | | | | | | | | | | | | | |
TOTAL INTEREST BEARING LIABILITIES | | $ | 1,189,860 | | | $ | 3,855 | | | | 0.65 | % | | $ | 718,730 | | | $ | 2,555 | | | | 0.72 | % |
Demand deposits | | | 153,827 | | | | | | | | | | | | 62,352 | | | | | | | | | |
Other liabilities | | | 5,919 | | | | | | | | | | | | 2,322 | | | | | | | | | |
Total shareholders’ equity | | | 152,603 | | | | | | | | | | | | 69,554 | | | | | | | | | |
| | | | | | | | | | | | | | | | | | | | | | | | |
TOTAL LIABILITIES AND SHAREHOLDERS’ EQUITY | | $ | 1,502,209 | | | | | | | | | | | $ | 852,958 | | | | | | | | | |
NET INTEREST SPREAD (4) | | | | | | | | | | | 3.46 | % | | | | | | | | | | | 3.42 | % |
NET INTEREST INCOME | | | | | | $ | 25,484 | | | | | | | | | | | $ | 14,443 | | | | | |
NET INTEREST MARGIN (5) | | | | | | | | | | | 3.57 | % | | | | | | | | | | | 3.51 | % |
| (1) | Loan balances include both loans held in the Bank’s portfolio and mortgage loans held for sale and are net of deferred origination fees and costs. Non-accrual loans are included in total loan balances. |
| (2) | Includes federal funds sold, capital stock in the Federal Reserve Bank and Federal Home Loan Bank, and interest-bearing deposits at the Federal Reserve Bank. |
| (3) | Includes repurchase agreements. |
| (4) | Represents the average rate earned on interest-earning assets minus the average rate paid on interest-bearing liabilities. |
| (5) | Represents net interest income (annualized) divided by total average earning assets. |
| (6) | Interest income and rates exclude the effects of a tax equivalent adjustment to adjust tax exempt investment income on tax exempt investment securities to a fully taxable basis due to immateriality. |
| (7) | Average balances are average daily balances. |
Interest-earning assets averaged $1,524,082 and $1,438,195 during the three and six months ended June 30, 2015 compared to $846,736 and $828,886 for the same periods in 2014, an increase of $677,346 and $609,309, or 80.0% and 73.5%, respectively. This increase was primarily due to organic growth in both the loan and securities portfolios over the past year, increases to the securities
32
portfolio as a result of a capital leverage program that was implemented during the second quarter of 2015, and due to the acquisition of MidSouth. Average loans increased 90.3% and 90.0% and average investment securities increased 62.7% and 50.4% when comparing the three and six months ended June 30, 2015 with the same periods in 2014. When comparing the three and six months ended June 30, 2015 and 2014, the yield on average interest earning assets decreased six and three basis points to 4.06% and 4.11%, compared to 4.12% and 4.14%, for the same periods during 2014. The yield on available-for-sale securities was 2.19% and 2.24% during the three and six months ended June 30, 2015 compared to 2.62% and 2.72% for the same periods in 2014. The primary driver for the decrease in yield was due to decreases in coupon rates on securities purchased during the past 12 months. For the three and six months ended June 30, 2015, the weighted average coupon rate for available-for-sale securities was 2.99% compared to 3.29% and 3.41% for the same periods in 2014, a decrease of 30 and 42 basis points, respectively. During the six months ending June 30, 2015, the Company purchased securities with total purchased par of $305,160, weighted average yield of 2.45% and weighted average life of 7.1 years.
Interest-bearing liabilities averaged $1,246,732 and $1,189,860 during the three- and six-month periods ending June 30, 2015 compared to $732,333 and $718,730 for the same periods in 2014, an increase of $514,399 and $471,130, or 70.2% and 65.6%, respectively. Total average interest-bearing deposits grew $470,551 and $432,843, including increases in average brokered CDs of $154,452 and $111,316 and average interest-bearing public funds deposits of $86,610 and 80,988 for the three- and six-month periods ending June 30, 2015 as compared to the same periods during 2014. Rapid growth in the loan and investment portfolios also resulted in an increase in average Federal Home Loan Bank advances of $15,165 and $9,099 and average federal funds purchased of $28,683 and $29,188 for the three- and six-month periods ending June 30, 2015 as compared to the same periods during 2014. The cost of interest-bearing liabilities for the three and six months ending June 30, 2015 decreased by seven basis points each when comparing the cost of interest-bearing liabilities with the same periods of 2014, with the largest declines in interest costs being reported in money market deposits and in Federal funds purchased and other.
The tables below detail the components of the changes in net interest income for the periods indicated. For each major category of interest-earning assets and interest-bearing liabilities, information is provided with respect to changes due to average volume and changes due to rates, with the changes in both volumes and rates allocated to these two categories based on the proportionate absolute changes in each category.
Analysis of Changes in Interest Income and Expenses
| | | | | | | | | | | | |
| | | Net change three months ended
June 30, 2015 versus June 30, 2014 | |
| | | Volume | | | Rate | | | Net Change | |
INTEREST INCOME | | | | | | | | | | | | |
Loans | | $ | 5,759 | | | $ | 34 | | | $ | 5,793 | |
Securities available for sale | | | 1,481 | | | | (550 | ) | | | 931 | |
Securities held to maturity | | | (73 | ) | | | 14 | | | | (59 | ) |
Certificates of deposit at other financial institutions | | | 2 | | | | — | | | | 2 | |
Federal funds sold and other | | | 79 | | | | (32 | ) | | | 47 | |
| | | | | | | | | | | | |
TOTAL INTEREST INCOME | | $ | 7,248 | | | $ | (534 | ) | | $ | 6,714 | |
| | | | | | | | | | | | |
INTEREST EXPENSE | | | | | | | | | | | | |
Deposits | | | | | | | | | | | | |
Interest checking | | $ | 70 | | | $ | 60 | | | $ | 130 | |
Money market accounts | | | 357 | | | | (181 | ) | | | 176 | |
Savings | | | 16 | | | | (4 | ) | | | 12 | |
Time deposits | | | 443 | | | | (62 | ) | | | 381 | |
Federal Home Loan Bank advances | | | 37 | | | | (36 | ) | | | 1 | |
Other borrowed funds | | | 65 | | | | (30 | ) | | | 35 | |
| | | | | | | | | | | | |
TOTAL INTEREST EXPENSE | | $ | 988 | | | $ | (253 | ) | | $ | 735 | |
| | | | | | | | | | | | |
NET INTEREST INCOME | | $ | 6,260 | | | $ | (281 | ) | | $ | 5,979 | |
| | | | | | | | | | | | |
33
| | | | | | | | | | | | |
| | | Net change six months ended
June 30, 2015 versus June 30, 2014 | |
| | | Volume | | | Rate | | | Net Change | |
INTEREST INCOME | | | | | | | | | | | | |
Loans | | $ | 11,071 | | | $ | (42 | ) | | $ | 11,029 | |
Securities available for sale | | | 2,421 | | | | (1,097 | ) | | | 1,324 | |
Securities held to maturity | | | (113 | ) | | | 23 | | | | (90 | ) |
Certificates of deposit at other financial institutions | | | 3 | | | | — | | | | 3 | |
Federal funds sold and other | | | 100 | | | | (25 | ) | | | 75 | |
| | | | | | | | | | | | |
TOTAL INTEREST INCOME | | $ | 13,482 | | | $ | (1,141 | ) | | $ | 12,341 | |
| | | | | | | | | | | | |
INTEREST EXPENSE | | | | | | | | | | | | |
Deposits | | | | | | | | | | | | |
Interest checking | | $ | 142 | | | $ | (4 | ) | | $ | 138 | |
Money market accounts | | | 648 | | | | (329 | ) | | | 319 | |
Savings | | | 30 | | | | (8 | ) | | | 22 | |
Time deposits | | | 787 | | | | (82 | ) | | | 705 | |
Federal Home Loan Bank advances | | | 37 | | | | — | | | | 37 | |
Other borrowed funds | | | 128 | | | | (49 | ) | | | 79 | |
| | | | | | | | | | | | |
TOTAL INTEREST EXPENSE | | $ | 1,772 | | | $ | (472 | ) | | $ | 1,300 | |
| | | | | | | | | | | | |
NET INTEREST INCOME | | $ | 11,710 | | | $ | (669 | ) | | $ | 11,041 | |
| | | | | | | | | | | | |
Provision for Loan Losses
The provision for loan losses represents a charge to earnings necessary to establish an allowance for loan losses that, in our management’s evaluation, should be adequate to provide coverage for probable losses incurred in the loan portfolio. The allowance is increased by the provision for loan losses and is decreased by charge-offs, net of recoveries on prior loan charge-offs.
The provision for loan losses was $805 and $440 for the three months ended June 30, 2015 and 2014, respectively, and $1,430 and $825 for the six months ended June 30, 2015 and 2014, respectively. The higher provision for the six months ended June 30, 2015 compared to the same period in 2014 is due primarily to the Company’s loan growth during the three and six months ended June 30, 2015, compared to the same periods in 2014. Nonperforming loans at June 30, 2015 totaled $947 compared to $1,151 at December 31, 2014, representing 0.1% of total loans at both dates.
Non-Interest Income
Non-interest income for the three and six months ended June 30, 2015 was $2,851 and $6,066 compared to $2,430 and $3,851 for the same periods in 2014. The following is a summary of the components of non-interest income (in thousands):
| | | | | | | | | | | | | | | | |
| | | Three Months Ended
June 30, | | | $
Increase
(Decrease) | | | %
Increase
(Decrease) | |
| | | 2015 | | | 2014 | | | |
Service charges on deposit accounts | | $ | 18 | | | $ | 12 | | | $ | 6 | | | | 50.0 | % |
Other service charges and fees | | | 690 | | | | 313 | | | | 377 | | | | 120.4 | % |
Net gains on sale of loans | | | 1,463 | | | | 1,567 | | | | (104 | ) | | | (6.6 | %) |
Investment services | | | 301 | | | | 35 | | | | 266 | | | | 760.0 | % |
Loan servicing fees, net | | | 60 | | | | 88 | | | | (28 | ) | | | (31.8 | %) |
Gain on sales and calls of investment securities, net | | | 109 | | | | 63 | | | | 46 | | | | 73.0 | % |
Net gain (loss) on foreclosed assets | | | 21 | | | | (2 | ) | | | 23 | | | | 1,150.0 | % |
Other | | | 189 | | | | 354 | | | | (165 | ) | | | (46.6 | %) |
| | | | | | | | | | | | | | | | |
Total non-interest income | | $ | 2,851 | | | $ | 2,430 | | | $ | 421 | | | | 17.3 | % |
| | | | | | | | | | | | | | | | |
34
| | | | | | | | | | | | | | | | |
| | | Six Months Ended
June 30, | | | $
Increase
(Decrease) | | | %
Increase
(Decrease) | |
| | | 2015 | | | 2014 | | | |
Service charges on deposit accounts | | $ | 34 | | | $ | 24 | | | $ | 10 | | | | 41.7 | % |
Other service charges and fees | | | 1,308 | | | | 549 | | | | 759 | | | | 138.3 | % |
Net gains on sale of loans | | | 3,110 | | | | 2,351 | | | | 759 | | | | 32.3 | % |
Investment services | | | 587 | | | | 77 | | | | 510 | | | | 662.3 | % |
Loan servicing fees, net | | | 103 | | | | 100 | | | | 3 | | | | 3.0 | % |
Gain on sales and calls of investment securities, net | | | 524 | | | | 71 | | | | 453 | | | | 638.0 | % |
Net gain (loss) on foreclosed assets | | | 27 | | | | 31 | | | | (4 | ) | | | (12.9 | %) |
Other | | | 373 | | | | 648 | | | | (275 | ) | | | (42.4 | %) |
| | | | | | | | | | | | | | | | |
Total non-interest income | | $ | 6,066 | | | $ | 3,851 | | | $ | 2,215 | | | | 57.5 | % |
| | | | | | | | | | | | | | | | |
Other service charges and fees for the three and six months ending June 30, 2015 increased $377 and $759, or 120.4% and 138.3%, respectively, from the same periods in 2014. The increases for both periods were due to: (1) the MidSouth acquisition, which contributed to an increase in electronic banking fee income; (2) mortgage origination fee income, which increased due to the volume of loans originated during the periods; and (3) nonsufficient funds and overdraft fees, which have increased due to the number of accounts that were added in the MidSouth acquisition.
Net gains on the sale of loans include net gains realized from the sales of mortgage loans and Small Business Administration (“SBA”) loans. Net gains on the sale of mortgage loans are based, in part, on differences between the carrying value of loans being sold to third-party investors and the selling price. Also included are changes in the fair value of mortgage banking derivatives entered into by the Company to hedge the change in interest rates on loan commitments prior to their sale in the secondary market. Fluctuations in mortgage interest rates, changes in the demand for certain loans by investors, and whether servicing rights associated with the loans being sold are retained or released all affect the net gains on mortgage loan sales. Net gains for the three months ending June 30, 2015 were $1,463, a decrease of $104, or 6.6%, from the same period during 2014. The decrease was primarily due to less favorable differences between the selling price and the carrying value of the sold loans and due to a decrease in the fair value of mortgage banking derivatives. Net gains for the six months ending June 30, 2015 were $3,110, an increase of $759, or 32.3%, from the same period in 2014. The increase was primarily due to more favorable differences between the selling price and the carrying value of the sold loans and due to an increase in the fair value of mortgage banking derivatives when comparing the six months ending June 30, 2015 with the same period in 2014.
Investment services income for the three and six months ending June 30, 2015 increased $266 and $510, or 760.0% and 662.3%, respectively, in comparison with the same periods in 2014. The increases in both comparative periods were primarily due to the acquisition of MidSouth, which brought an established wealth management division and its existing client base into the Company when the acquisition was completed on July 1, 2014.
Loan servicing fees are fees earned for servicing residential mortgages and SBA loans offset by the amortization of the respective servicing rights. These servicing rights are initially recorded at fair value and then amortized in proportion to, and over the period of, the estimated life of the underlying loans. In addition, impairment to the servicing rights may be recognized through a valuation allowance, and adjustments to the allowance can affect the net loan servicing fees. For the three and six months ending June 30, 2015, net loan servicing fees were $60 and $103 compared to $88 and $100 for the three and six months ending June 30, 2014. The decrease in loan servicing fees when comparing the three months ending June 30, 2015 with the same period in 2014 was primarily related to an increase in amortization of mortgage servicing rights.
Net gain on sale of investment securities increased during the three and six months ending June 30, 2015 increased 73.0% and 638.0%, respectively when compared with the same periods in 2014. The significant increase for the six months ending June 30, 2015 is attributable to the sales and calls of securities during 2015, $291 of which was related to securities called during the first quarter of 2015.
Other non-interest income decreased by $165, or 46.6%, when comparing second quarter 2015 with second quarter 2014; however, it decreased by $275, or 42.4%, when comparing the six months ended June 30, 2015 with the same period in 2014. The decrease is attributed to the compliance consulting fees that were recorded in 2014 by the Company’s subsidiary, BCG, the assets of which the Company sold at the end of 2014. The Company has had no compliance consulting fee income in 2015 due to the sale of BCG.
35
Non-interest Expense
Non-interest expense for the three and six months ended June 30, 2015 was $10,572 and $20,193, compared to $6,078 and $11,570 compared to the same periods in 2014. These increases were the result of the following components listed in the table below:
| | | | | | | | | | | | | | | | |
| | | Three Months Ended
June 30, | | | $
Increase
(Decrease) | | | %
Increase
(Decrease) | |
| | | 2015 | | | 2014 | | | |
Salaries and employee benefits | | $ | 6,071 | | | $ | 3,805 | | | $ | 2,266 | | | | 59.6 | % |
Occupancy and equipment | | | 1,699 | | | | 1,009 | | | | 690 | | | | 68.4 | % |
FDIC assessment expense | | | 216 | | | | 120 | | | | 96 | | | | 80.0 | % |
Marketing | | | 198 | | | | 135 | | | | 63 | | | | 46.7 | % |
Professional fees | | | 507 | | | | 279 | | | | 228 | | | | 81.7 | % |
Amortization of core deposit intangible | | | 167 | | | | — | | | | 167 | | | | NM | |
Indirect expenses related to public offering | | | 309 | | | | — | | | | 309 | | | | NM | |
Other | | | 1,405 | | | | 730 | | | | 675 | | | | 92.5 | % |
| | | | | | | | | | | | | | | | |
Total non-interest expense | | $ | 10,572 | | | $ | 6,078 | | | $ | 4,494 | | | | 73.9 | % |
| | | | | | | | | | | | | | | | |
| | | |
| | | Six Months Ended
June 30, | | | $
Increase
(Decrease) | | | %
Increase
(Decrease) | |
| | | 2015 | | | 2014 | | | |
Salaries and employee benefits | | $ | 11,752 | | | $ | 7,350 | | | $ | 4,402 | | | | 59.9 | % |
Occupancy and equipment | | | 3,278 | | | | 1,795 | | | | 1,483 | | | | 82.6 | % |
FDIC assessment expense | | | 430 | | | | 239 | | | | 191 | | | | 79.9 | % |
Marketing | | | 418 | | | | 246 | | | | 172 | | | | 69.9 | % |
Professional fees | | | 866 | | | | 633 | | | | 233 | | | | 36.8 | % |
Amortization of core deposit intangible | | | 339 | | | | — | | | | 339 | | | | NM | |
Indirect expenses related to public offering | | | 326 | | | | — | | | | 326 | | | | NM | |
Other | | | 2,784 | | | | 1,307 | | | | 1,477 | | | | 113.0 | % |
| | | | | | | | | | | | | | | | |
Total non-interest expense | | $ | 20,193 | | | $ | 11,570 | | | $ | 8,623 | | | | 74.5 | % |
| | | | | | | | | | | | | | | | |
The increase in non-interest expense noted in the table above is indicative of the Company’s overall growth over the past 12 months. Two primary increases for the three and six months ending June 30, 2015, were in salaries and occupancy expenses, which were primarily attributed to: 1) the acquisition of MidSouth, which added the MidSouth employee base and five branch locations to the Bank’s branch network; and 2) the expansion of the Company’s headquarters in downtown Franklin, Tennessee. Also, staffing increased from 136 full-time equivalent employees as of June 30, 2014, to 221 as of June 30, 2015. The increased staffing is due to the retention of the majority of the MidSouth employees to continue to support the branches as well as the addition of key lenders and operational staff needed to facilitate the Company’s growth.
The increase in amortization expense for the core deposit intangible for the three and six months ending June 30, 2015 is directly attributable to the acquisition of MidSouth, which brought a core deposit intangible asset that is being amortized over a period of eight years and two months.
The increase in indirect expenses related to public offering for the three and six months ending June 30, 2015 is attributable to expenses incurred from management’s nationwide “roadshow” marketing campaign related to the Company’s initial public offering (“IPO”).
For the three and six months ended June 30, 2015, other non-interest expenses increased $675 and $1,477, or 92.5% and 113.0%, respectively from the same periods in 2014. Of the increases for the three and six months ending June 30, 2015, $151 and $325 is attributed to the increase in electronic banking expenses associated with the Company’s customers’ increased usage of technology-based services, such as ATM/debit card transactions, internet banking transactions, and other types of automated transactions. Much of the electronic banking expense increase was attributable to the MidSouth acquisition, which added more consumers to the Company’s customer base. Expenses related to the Company’s lending activities, including mortgage lending, accounted for $194 and $273 of the increase for the three and six months ending June 30, 2015, when compared with the same periods in 2014. The remaining increases of $330 and $879 were due to a variety of expense items that include, but are not limited to, deposit account expense, insurance expense, postage and freight, franchise taxes, meals and entertainment, travel, communications expenses, etc.
36
Income Tax Expense
The Company recognized income tax expense for the three and six months ended June 30, 2015, of $1,667 and $3,661, respectively, compared to $1,225 and $2,335, respectively, for the three and six months ended June 30, 2014. The Company’s year-to-date income tax expense for the period ended June 30, 2015 reflects an effective income tax rate of 36.9% compared to 39.6% for the same period in 2014. The decrease in the effective tax rate resulted from unfavorable permanent differences incurred during the six months ended June 30, 2014, from expenses associated with the acquisition of MidSouth and from stock based compensation expense incurred from the vesting of incentive stock options as a result of employee retirement.
COMPARISON OF BALANCE SHEETS AT JUNE 30, 2015 AND DECEMBER 31, 2014
Overview
The Company’s total assets increased by $410,925, or 30.3%, from December 31, 2014 to June 30, 2015. The increase in total assets has primarily been the result of organic growth in the loan and investment securities portfolios.
Loans
Lending-related income is the most important component of the Company’s net interest income and is a major contributor to profitability. The loan portfolio is the largest component of earning assets, and therefore generates the largest portion of revenues. The absolute volume of loans and the volume of loans as a percentage of earning assets is an important determinant of net interest margin as loans are expected to produce higher yields than securities and other earning assets. Total loans, net of deferred fees, at June 30, 2015 and December 31, 2014 were $962,191 and $787,188, respectively, an increase of $175,003, or 22.2%. Growth in the loan portfolio is primarily due to increased market penetration and a healthy local economy. In addition, the Company added a new health care lending team in the second quarter of 2015 that will be focused on commercial and industrial lending, with emphasis on lending within the health care industry, thereby adding more diversification to the Company’s loans. During the second quarter, this team closed nearly $25 million in loans with a number of approved loans in their pipeline to be closed during the third quarter of 2015.
The table below provides a summary of the loan portfolio composition for the periods noted.
| | | | | | | | | | | | | | | | |
| Types of Loans | | June 30, 2015 | | | December 31, 2014 | |
| | | Amount | | | % of Total
Loans | | | Amount | | | % of Total
Loans | |
Total loans, excluding PCI loans | | | | | | | | | | | | | | | | |
Real estate: | | | | | | | | | | | | | | | | |
Residential | | $ | 234,107 | | | | 24.3 | % | | $ | 213,760 | | | | 27.1 | % |
Construction and land development | | | 293,629 | | | | 30.5 | % | | | 239,225 | | | | 30.4 | % |
Commercial | | | 279,591 | | | | 29.0 | % | | | 246,352 | | | | 31.3 | % |
Commercial and industrial | | | 144,735 | | | | 15.0 | % | | | 76,570 | | | | 9.7 | % |
Consumer and other | | | 7,527 | | | | 0.8 | % | | | 8,025 | | | | 1.0 | % |
| | | | | | | | | | | | | | | | |
Total loans—gross, excluding PCI loans | | | 959,589 | | | | 99.6 | % | | | 783,932 | | | | 99.5 | % |
| | | | | | | | | | | | | | | | |
| | | | |
Total PCI loans (note 1) | | | | | | | | | | | | | | | | |
Real estate: | | | | | | | | | | | | | | | | |
Residential | | $ | 810 | | | | NM | | | $ | 814 | | | | 0.1 | % |
Construction and land development | | | 77 | | | | NM | | | | 77 | | | | NM | |
Commercial | | | 1,752 | | | | 0.2 | % | | | 1,798 | | | | 0.2 | % |
Commercial and industrial | | | 1,639 | | | | 0.2 | % | | | 1,624 | | | | 0.2 | % |
Consumer and other | | | — | | | | — | % | | | 2 | | | | NM | |
| | | | | | | | | | | | | | | | |
Total loans—gross PCI loans | | | 4,278 | | | | 0.4 | % | | | 4,315 | | | | 0.5 | % |
| | | | | | | | | | | | | | | | |
Total gross loans | | | 963,867 | | | | 100.0 | % | | | 788,247 | | | | 100.0 | % |
| | | | | | | | | | | | | | | | |
Less: deferred loan fees, net | | | (1,676 | ) | | | | | | | (1,059 | ) | | | | |
Allowance for loan losses | | | (8,016 | ) | | | | | | | (6,680 | ) | | | | |
| | | | | | | | | | | | | | | | |
Total loans, net allowance for loan losses | | $ | 954,175 | | | | | | | | 780,508 | | | | | |
| | | | | | | | | | | | | | | | |
Note 1: PCI accounted for pursuant to ASC Topic 310-30.
37
As presented in the above table, gross loans increased 22.3% during the first six months of 2015, primarily due to organic growth as a result of continued market penetration and the strength of the local economies. During this period, the Company experienced growth in real estate loans of 15.4% with the majority of the growth occurring in the construction and land development (22.7%) segment. The Company also experienced strong growth of 87.2% in the commercial and industrial segment during the first six months of 2015 due to the second quarter addition of a group of lenders that is focused on commercial and health care lending.
Real estate loans comprised 84.0% of the loan portfolio at June 30, 2015. The following chart displays the Company’s real estate loan portfolio as of June 30, 2015, broken down into the various segments or types of real estate loans that the Company produces and stated as a percentage of total real estate loans:
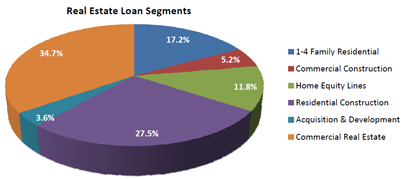
The largest portion of the real estate loan segments as of June 30, 2015, was construction and land development loans, which totaled 36.3% of real estate loans and was broken down into three sub-segments: residential construction (27.5% of real estate loans), commercial construction (5.2% of real estate loans), and acquisition and development (3.6% of real estate loans). Construction and land development loans totaled $293,706 and made up 30.5% of the total loan portfolio at June 30, 2015. Loans in this classification provide financing for the construction and development of residential properties and commercial income properties, multi-family residential development, and land designated for future development.
Commercial real estate loans totaled $281,343 at June 30, 2015, and comprised 34.7% of real estate loans and 29.2% of the total loan portfolio. The commercial real estate loan classification primarily includes commercial-based mortgage loans that are secured by nonfarm, nonresidential real estate properties and multi-family residential properties.
The residential real estate classification primarily includes 1-4 family residential loans which are typically conventional first-lien home mortgages, not including loans held-for-sale in the secondary market. Residential real estate loans totaled $234,917 and increased 9.5% during the first six months of 2015 and comprised 29.0% of real estate loans and 24.4% of total loans at June 30, 2015.
Commercial and industrial loans totaled $146,374 at June 30, 2015 and grew 87.2% during the first six months of 2015. Loans in this classification comprised 15.2% of total loans at June 30, 2015, as compared to 9.9% as of December 31, 2014. The commercial and industrial classification primarily consists of commercial loans to small-to-medium sized businesses, but with the addition of the health care lending team during the second quarter of 2015, the composition of that portfolio segment will likely change to reflect the addition of health care and other types of commercial loans.
38
The repayment of loans is a source of additional liquidity for the Company. The following table sets forth the loans maturing within specific intervals at June 30, 2015, excluding unearned net fees and costs.
Loan Maturity Schedule
| | | | | | | | | | | | | | | | |
| | | June 30, 2015 | |
| | | One year
or less | | | Over one
year to five
years | | | Over five
years | | | Total | |
Real estate: | | | | | | | | | | | | | | | | |
Residential | | $ | 21,336 | | | $ | 95,414 | | | $ | 118,167 | | | $ | 234,917 | |
Construction and land development | | | 154,346 | | | | 111,043 | | | | 28,317 | | | | 293,706 | |
Commercial | | | 19,506 | | | | 108,524 | | | | 153,313 | | | | 281,343 | |
Commercial and industrial | | | 40,820 | | | | 73,668 | | | | 31,886 | | | | 146,374 | |
Consumer and other | | | 2,496 | | | | 4,500 | | | | 531 | | | | 7,527 | |
| | | | | | | | | | | | | | | | |
Total | | $ | 238,504 | | | $ | 393,149 | | | $ | 332,214 | | | | 963,867 | |
| | | | | | | | | | | | | | | | |
Fixed interest rate | | $ | 134,612 | | | $ | 292,362 | | | $ | 152,833 | | | $ | 579,807 | |
Variable interest rate | | | 103,892 | | | | 100,787 | | | | 179,381 | | | | 384,060 | |
| | | | | | | | | | | | | | | | |
Total | | $ | 238,504 | | | $ | 393,149 | | | $ | 332,214 | | | | 963,867 | |
| | | | | | | | | | | | | | | | |
The information presented in the above table is based upon the contractual maturities of the individual loans, including loans which may be subject to renewal at their contractual maturity. Renewal of such loans is subject to review and credit approval, as well as modification of terms upon their maturity. Consequently, management believes this treatment presents fairly the maturity structure of the loan portfolio.
Allowance for Loan Losses
The Company maintains an allowance for loan losses that management believes is adequate to absorb the probable incurred losses inherent in the Company’s loan portfolio. The allowance is increased by provisions for loan losses charged to earnings and is decreased by loan charge-offs net of recoveries of prior period loan charge-offs. The level of the allowance is determined on a quarterly basis, although management is engaged in monitoring the adequacy of the allowance on a more frequent basis. In estimating the allowance balance, the following factors are considered:
| | • | | The nature and volume of the portfolio; |
| | • | | Risks known about specific borrowers; |
| | • | | Underlying estimated values of collateral securing loans; |
| | • | | Current and anticipated economic conditions; and |
| | • | | Other factors which may affect the allowance for probable incurred losses. |
The allowance for loan losses consists of two primary components: (1) a specific component which relates to loans that are individually classified as impaired and (2) a general component which covers non-impaired loans and is based on historical loss experience adjusted for current factors. The historical loss experience is determined by portfolio segment and is based on a combination of the Company’s loss history and loss history from peer group over the past three years. This actual loss experience is supplemented with other economic factors based on the risks present for each portfolio segment.
The following loan portfolio segments have been identified: (1) Construction and land development loans, (2) Commercial real estate loans, (3) Residential real estate, (4) Commercial and industrial loans, and (5) Consumer and other loans. Management evaluates the risks associated with these segments based upon specific characteristics associated with the loan segments. These risk characteristics include, but are not limited to, the value of the underlying collateral, adverse economic conditions, and the borrower’s cash flow. While the total allowance consists of a specific portion and a general portion, both portions of the allowance are available to provide for probable incurred loan losses in the entire portfolio.
39
In the table below, the components, as discussed above, of the allowance for loan losses are shown at June 30, 2015 and December 31, 2014.
| | | | | | | | | | | | | | | | | | | | | | | | | | | | | | | | | | | | |
| | | June 30, 2015 | | | December 31, 2014 | | | Increase (Decrease) | |
| | | Loan
Balance | | | ALLL
Balance | | | % | | | Loan
Balance | | | ALLL
Balance | | | % | | | Loan
Balance | | | ALLL
Balance | | | Change | |
Non impaired loans | | $ | 846,273 | | | $ | 7,897 | | | | 0.93 | % | | $ | 626,180 | | | $ | 6,662 | | | | 1.06 | % | | $ | 220,093 | | | $ | 1,235 | | | | -13 bps | |
MidSouth loans (Note 1) | | | 111,284 | | | | — | | | | — | % | | | 156,806 | | | | — | | | | — | % | | | (45,522 | ) | | | — | | | | — | |
Impaired loans | | | 2,032 | | | | 119 | | | | 5.86 | % | | | 946 | | | | 18 | | | | 1.90 | % | | | 1,086 | | | | 101 | | | | 396 bps | |
| | | | | | | | | | | | | | | | | | | | | | | | | | | | | | | | | | | | |
Non-PCI loans | | | 959,589 | | | | 8,016 | | | | 0.84 | % | | | 783,932 | | | | 6,680 | | | | 0.85 | % | | | 175,657 | | | | 1,336 | | | | -1 bps | |
PCI loans | | | 4,278 | | | | — | | | | — | % | | | 4,315 | | | | — | | | | — | % | | | (37 | ) | | | — | | | | — | |
| | | | | | | | | | | | | | | | | | | | | | | | | | | | | | | | | | | | |
Total loans | | $ | 963,867 | | | $ | 8,016 | | | | 0.83 | % | | $ | 788,247 | | | $ | 6,680 | | | | 0.85 | % | | $ | 175,620 | | | $ | 1,346 | | | | -2 bps | |
| | | | | | | | | | | | | | | | | | | | | | | | | | | | | | | | | | | | |
| | |
| Note 1: | | Loans acquired pursuant to the July 1, 2014 acquisition of MidSouth that are not PCI loans. These are performing loans recorded at estimated fair value at the acquisition date. The fair value adjustment at the acquisition date was approximately $5,014 of the outstanding non-PCI loan balances acquired, and the remaining fair value adjustment at June 30, 2015 was $2,875 of the outstanding non-PCI loan balances acquired. This amount is accreted into interest income over the remaining lives of the related loans on a level yield basis. Because these loans were recorded at estimated fair value on July 1, 2014, no allowance for loan loss was recorded at June 30, 2015 related to the acquired loans. |
At June 30, 2015, the allowance for loan losses was $8,016, compared to $6,680 at December 31, 2014. The allowance for loan losses as a percentage of total loans was 0.83% and 0.85% at June 30, 2015 and December 31, 2014, respectively. Loan growth during this period is the primary reason for the increase in the allowance amount.
The table below sets forth the activity in the allowance for loan losses for the periods presented.
| | | | | | | | |
| | | Six Months Ended
June 30, 2015 | | | Six Months Ended
June 30, 2014 | |
Beginning balance | | $ | 6,680 | | | $ | 4,900 | |
Loans charged-off: | | | | | | | | |
Residential real estate | | | 17 | | | | — | |
Construction & land development | | | — | | | | — | |
Commercial real estate | | | — | | | | — | |
Commercial & industrial | | | — | | | | — | |
Consumer and other | | | 88 | | | | — | |
| | | | | | | | |
Total loans charged-off | | | 105 | | | | — | |
Recoveries on loans previously charged-off: | | | | | | | | |
Residential real estate | | | 8 | | | | 46 | |
Construction & land development | | | — | | | | — | |
Commercial real estate | | | — | | | | — | |
Commercial & industrial | | | — | | | | — | |
Consumer and other | | | 3 | | | | — | |
| | | | | | | | |
Total loan recoveries | | | 11 | | | | 46 | |
Net (charge-offs) recoveries | | | (94 | ) | | | 46 | |
Provision for loan losses charged to expense | | | 1,430 | | | | 825 | |
| | | | | | | | |
Total allowance at end of period | | $ | 8,016 | | | $ | 5,771 | |
| | | | | | | | |
Total loans, gross, at end of period(1) | | $ | 963,867 | | | $ | 486,350 | |
| | | | | | | | |
Average gross loans(1) | | $ | 862,071 | | | $ | 453,699 | |
| | | | | | | | |
Allowance to total loans | | | 0.83 | % | | | 1.19 | % |
| | | | | | | | |
Net charge-offs (recoveries) to average loans, annualized | | | 0.02 | % | | | (0.02 | %) |
| | | | | | | | |
| (1) | Loan balances exclude loans held for sale |
40
While no portion of the allowance is in any way restricted to any individual loan or group of loans, and the entire allowance is available to absorb losses from any and all loans, the following table summarizes the allocation of allowance for loan losses by loan category and loans in each category as a percentage of total loans, for the periods presented.
| | | | | | | | | | | | | | | | | | | | | | | | |
| | | June 30, 2015 | | | December 31, 2014 | |
| | | Amount | | | % of
Allowance
to Total | | | % of Loan
Type to
Total
Loans | | | Amount | | | % of
Allowance
to Total | | | % of Loan
Type to
Total
Loans | |
Real estate loans: | | | | | | | | | | | | | | | | | | | | | | | | |
Residential | | $ | 1,739 | | | | 21.7 | % | | | 24.4 | % | | $ | 1,791 | | | | 26.8 | % | | | 27.2 | % |
Construction and land development | | | 2,567 | | | | 32.0 | % | | | 30.4 | % | | | 2,690 | | | | 40.3 | % | | | 30.4 | % |
Commercial | | | 2,321 | | | | 29.0 | % | | | 29.2 | % | | | 1,494 | | | | 22.4 | % | | | 31.5 | % |
Total real estate | | | 6,627 | | | | 82.7 | % | | | 84.0 | % | | | 5,975 | | | | 89.5 | % | | | 89.1 | % |
Commercial and industrial | | | 1,324 | | | | 16.5 | % | | | 15.2 | % | | | 650 | | | | 9.7 | % | | | 9.9 | % |
Consumer and other | | | 65 | | | | 0.8 | % | | | 0.8 | % | | | 55 | | | | 0.8 | % | | | 1.0 | % |
Nonperforming Assets
Non-performing loans consist of non-accrual loans and loans that are past due 90 days or more and still accruing interest. Non-performing assets consist of non-performing loans plus OREO (i.e., real estate acquired through foreclosure or deed in lieu of foreclosure). Loans are placed on non-accrual status when they are past due 90 days and management believes the borrower’s financial condition, after giving consideration to economic conditions and collection efforts, is such that collection of interest is doubtful. When a loan is placed on non-accrual status, interest accruals cease and uncollected interest is reversed and charged against current income. The interest on these loans is accounted for on the cash-basis, or cost-recovery method, until qualifying for return to accrual. Loans are returned to accrual status when all the principal and interest amounts contractually due are brought current and future payments are reasonably assured.
The primary component of non-performing loans is non-accrual loans, which as of June 30, 2015 totaled $947. The other component of non-performing loans are loans past due greater than 90 days and still accruing interest. Loans past due greater than 90 days are placed on non-accrual status, unless they are both well-secured and in the process of collection. There were outstanding no loans that were past due 90 days or more and still accruing interest at June 30, 2015.
The table below summarizes non-performing loans and assets for the periods presented.
| | | | | | | | |
| | | June 30,
2015 | | | December 31,
2014 | |
Non-accrual loans | | $ | 947 | | | $ | 835 | |
Past due loans 90 days or more and still accruing interest | | | — | | | | 316 | |
| | | | | | | | |
Total nonperforming loans | | | 947 | | | | 1,151 | |
Foreclosed real estate (“OREO”) | | | 206 | | | | 715 | |
| | | | | | | | |
Total nonperforming assets | | | 1,153 | | | | 1,866 | |
Total nonperforming loans as a percentage of total loans | | | 0.1 | % | | | 0.1 | % |
Total nonperforming assets as a percentage of total assets | | | 0.1 | % | | | 0.1 | % |
Allowance for loan losses as a percentage of non-performing loans | | | 846 | % | | | 580 | % |
As of June 30, 2015, there were three loans on non-accrual status. The amount and number are further delineated by collateral category and number of loans in the table below.
| | | | | | | | | | | | |
| | | Total Amount | | | Percentage of Total
Non-Accrual Loans | | | Number of
Non-Accrual
Loans | |
Residential real estate | | $ | 96 | | | | 10.1 | % | | | 1 | |
Construction & land development | | | — | | | | — | % | | | — | |
Commercial real estate | | | 835 | | | | 88.2 | % | | | 1 | |
Commercial & industrial | | | 16 | | | | 1.7 | % | | | 1 | |
Consumer | | | — | | | | — | % | | | — | |
| | | | | | | | | | | | |
Total non-accrual loans | | $ | 947 | | | | 100.0 | % | | | 3 | |
| | | | | | | | | | | | |
41
Investment Securities and Other Earning Assets
The investment securities portfolio is intended to provide the Company with adequate liquidity, flexible asset/liability management and a source of stable income. The portfolio is structured with minimal credit exposure to the Company and consists of both securities classified as available-for-sale and securities classified as held-to-maturity. All available-for sale securities are carried at fair value and may be used for liquidity purposes should management deem it to be in the Company’s best interest. Securities available-for-sale, consisting primarily of U.S. government sponsored enterprises and mortgage-backed securities, were $635,184 at June 30, 2015, compared to $395,705 at December 31, 2014, an increase of $239,479 or 60.5%. The increase in available-for-sale securities was primarily attributed to the securities purchased during the second quarter as part of the Company’s capital leverage program, which was designed to deploy the capital that was raised at the end of the first quarter of 2015.
The held-to-maturity securities are carried at amortized cost. This portfolio, consisting of U.S. government sponsored enterprises, mortgage-backed securities and municipal securities, totaled $46,815 at June 30, 2015, compared to $53,332 at December 31, 2014, a decrease of $6,517, or 12.2%. The decrease is attributable to securities that were called or matured during the first six months of 2015.
The combined portfolios represented 38.6% and 33.1% of total assets at June 30, 2015 and December 31, 2014, respectively. At June 30, 2015, the Company had no securities that were classified as having other than temporary impairment.
The Company also had other investments of $7,685 and $5,349 at June 30, 2015 and December 31, 2014, respectively, consisting of capital stock in the Federal Reserve and the Federal Home Loan Bank (required as members of the Federal Reserve Bank System and the Federal Home Loan Bank System). The Federal Home Loan Bank and Federal Reserve investments are “restricted” in that they can only be sold back to the respective institutions or another member institution at par, and are thus, not liquid, have no ready market or quoted market value, and are carried at cost. The increase from December 31, 2014 to June 30, 2015 was due to the Bank’s growth in capital at the end of the first quarter of 2015, which required the Bank to purchase additional Federal Reserve Bank stock based on the Federal Reserve Bank’s requirements for state member banks.
Bank Premises and Equipment
Bank premises and equipment totaled $9,584 at June 30, 2015 compared to $9,664 at December 31, 2014, a decrease of $80, or 0.8%.
Buildings Held for Sale
At June 30, 2015, the balance in buildings held for sale was zero, compared with the balance of $4,080 at December 31, 2014. Three of the former MidSouth branch properties were reclassified at December 31, 2014 as held for sale, since they had been identified to be sold, and the sale of the properties was probable at that time. These properties were sold to related parties of the Company and were subsequently leased by the Company upon completion of the sale. The sale of these properties settled during the first quarter of 2015, and a gain of $15 was realized as a result of the sale.
Deposits
Deposits represent the Company’s largest source of funds. The Company competes with other financial institutions for deposits, as well as with a growing number of non-deposit investment alternatives available to depositors, such as mutual funds, money market funds, annuities, and other brokerage investment products. Challenges to deposit growth include price changes on deposit products given movements in the rate environment and other competitive pricing pressures, and customer preferences regarding higher-costing deposit products or non-deposit investment alternatives.
At June 30, 2015, total deposits were $1,491,986, compared to $1,172,233 at December 31, 2014, an increase of $319,753, or 27.3%. The growth in deposits is primarily attributable to growth in brokered deposits, which is an integral part of the Company’s funding plan. The Company’s deposits are broken out in the table below:
| | | | | | | | | | | | | | | | |
| | | Jun 30, 2015 | | | Dec 31, 2014 | | | Change ($) | | | Change (%) | |
Deposits: | | | | | | | | | | | | | | | | |
Non-interest bearing deposits | | $ | 167,749 | | | $ | 150,337 | | | $ | 17,412 | | | | 11.6 | % |
Interest checking deposits: | | | | | | | | | | | | | | | | |
Public funds deposits | | | 168,532 | | | | 210,587 | | | | (42,055 | ) | | | (20.0 | ) |
Non-public funds deposits | | | 94,222 | | | | 87,930 | | | | 6,292 | | | | 7.2 | |
Brokered deposits | | | 992 | | | | 1,301 | | | | (309 | ) | | | (23.8 | ) |
| | | | | | | | | | | | | | | | |
Total interest checking | | | 263,746 | | | | 299,818 | | | | (36,072 | ) | | | (12.0 | ) |
| | | | | | | | | | | | | | | | |
Money market deposits: | | | | | | | | | | | | | | | | |
Public funds deposits | | | 163,762 | | | | 131,592 | | | | 32,170 | | | | 24.4 | |
Non-public funds deposits | | | 205,666 | | | | 207,600 | | | | (1,934 | ) | | | (0.9 | ) |
Brokered deposits | | | 106,031 | | | | 32,017 | | | | 74,014 | | | | 231.2 | |
| | | | | | | | | | | | | | | | |
Total money market checking | | | 475,459 | | | | 371,209 | | | | 104,250 | | | | 28.1 | |
| | | | | | | | | | | | | | | | |
Savings deposits | | | 33,963 | | | | 29,675 | | | | 4,288 | | | | 14.4 | |
Time deposits: | | | | | | | | | | | | | | | | |
Non-brokered time deposits | | | 274,274 | | | | 268,101 | | | | 6,173 | | | | 2.3 | |
Brokered time deposits† | | | 276,795 | | | | 53,093 | | | | 223,702 | | | | 421.3 | |
| | | | | | | | | | | | | | | | |
Total time deposits | | | 551,069 | | | | 321,194 | | | | 229,875 | | | | 71.6 | |
| | | | | | | | | | | | | | | | |
Total deposits | | $ | 1,491,986 | | | $ | 1,172,233 | | | $ | 319,753 | | | | 27.3 | % |
| | | | | | | | | | | | | | | | |
| † | Brokered time deposits included public funds time deposits of $33,133 and $8,133 at June 30, 2015 and December 31, 2014, respectively, which were part of the Company’s participation in the Certificate of Deposit Account Registry Service (CDARS) program. |
42
Total brokered deposits increased from $86,411 at December 31, 2014 to $383,818 at June 30, 2015, primarily due to brokered deposits that were added as part of the Company’s capital leverage program that was initiated during the second quarter of 2015, the funding from which was used to purchase investment securities to earn an interest rate spread over the brokered deposits, thereby increasing the Company’s net interest income.
Public funds deposits in the form of county deposits are also a part of the Company’s funding strategy and are cyclical in nature, with the highest period of growth being during the first quarter of each calendar year. At June 30, 2015, public funds totaled $365,427, compared with $350,312 at December 31, 2014, an increase of $15,115, or 4.3%.
Time deposits excluding brokered deposits as of June 30, 2015, amounted to $274,274, compared to $268,101 as of December 31, 2014, an increase of $6,173, or 2.3%. Noninterest-bearing checking deposits grew $17,412, or 11.6%, and non-public funds interest checking accounts grew $6,292, or 7.2%, respectively when comparing deposit balances from June 30, 2015 with balances at December 31, 2014.
The following table shows time deposits in denominations of $100 or more by category based on time remaining until maturity.
Maturity of non-brokered time deposits of $100 or more
| | | | |
| | | June 30, 2015 | |
Three months or less | | $ | 40,272 | |
Three through six months | | | 28,869 | |
Six through twelve months | | | 21,267 | |
Over twelve months | | | 85,633 | |
| | | | |
Total | | $ | 176,041 | |
| | | | |
Federal Funds Purchased and Repurchase Agreements
As of June 30, 2015, the Company had no federal funds purchased from correspondent banks compared to $16,825 outstanding as of December 31, 2014. Securities sold under agreements to repurchase had an outstanding balance of $36,567 as of June 30, 2015, compared to $22,253 as of December 31, 2014. Securities sold under agreements to repurchase are financing arrangements that mature daily. At maturity, the securities underlying the agreements are returned to the Company.
Federal Home Loan Bank Advances
The Company has established a line of credit with the Federal Home Bank of Cincinnati (“FHLB”) which is secured by a blanket pledge of 1-4 family residential mortgages. At June 30, 2015 these advances totaled $57,000, compared with advances of $19,000 at December 31, 2014. The growth in the FHLB advances is attributable to the capital leverage program that management initiated in the second quarter of 2015, the funding for which was initially used to purchase investment securities to earn a spread over the borrowing costs.
43
At June 30, 2015, the scheduled maturities of these and advances and interest rates were as follows:
| | | | | | | | |
Scheduled Maturities | | Amount | | | Weighted
Average
Rates | |
2015 | | $ | 40,000 | | | | 0.16 | % |
2016 | | | — | | | | — | % |
2017 | | | 10,000 | | | | 1.27 | % |
2018 | | | 7,000 | | | | 1.61 | % |
| | | | | | | | |
Total | | $ | 57,000 | | | | 0.53 | % |
| | | | | | | | |
Liquidity
Liquidity is defined as the ability to meet anticipated customer demands for funds under credit commitments and deposit withdrawals at a reasonable cost and on a timely basis.
Liquidity risk involves the risk of being unable to fund assets with the appropriate duration and rate-based liabilities, as well as the risk of not being able to meet unexpected cash needs. Liquidity planning and management are necessary to ensure the ability to fund operations cost-effectively and to meet current and future potential obligations such as loan commitments, lease obligations, and unexpected deposit outflows. In this process, management focuses on both assets and liabilities and on the manner in which they combine to provide adequate liquidity to meet the Company’s needs.
Funds are available from a number of basic banking activity sources including the core deposit base, the repayment and maturity of loans, payments of principal and interest as well as sales of investments classified as available-for-sale, and sales of brokered deposits. As of June 30, 2015, $635,184 of the investment securities portfolio was classified as available-for-sale and is reported at fair value on the consolidated balance sheet. Another $46,815 of the portfolio was classified as held-to-maturity and is reported at amortized cost. Approximately $479,240 of the total $681,999 investment securities portfolio on hand at June 30, 2015, was pledged to secure public deposits and repurchase agreements. Other funding sources available include repurchase agreements, federal funds purchased, and borrowings from the Federal Home Loan Bank.
Shareholders’ Equity
On March 26, 2015, The Company launched an initial public stock offering and began trading on the New York Stock Exchange under the ticker symbol “FSB.” In the offering, the Company issued 2,640,000 shares of its common stock at a price of $21.00 per share. The IPO was completed during March 2015. Net proceeds were as follows:
| | | | |
Gross proceeds | | $ | 55,440 | |
Less: stock offering costs | | | (4,436 | ) |
| | | | |
Net proceeds from issuance of common stock | | $ | 51,004 | |
| | | | |
The details of the offering are available in the Prospectus that the Company filed with the SEC on March 27, 2015.
Effects of Inflation and Changing Prices
The accompanying consolidated financial statements have been prepared in accordance with generally accepted accounting principles, which require the measurement of financial position and operating results in terms of historical dollars without considering the change in the relative purchasing power of money over time due to inflation. Unlike most industrial companies, virtually all of the assets and liabilities of a financial institution are monetary in nature. As a result, interest rates generally have a more significant impact on the performance of a financial institution than the effects of general levels of inflation. Although interest rates do not necessarily move in the same direction or to the same extent as the prices of goods and services, increases in inflation generally have resulted in increased interest rates. In addition, inflation affects financial institutions’ increased cost of goods and services purchased, the cost of salaries and benefits, occupancy expense, and similar items. Inflation and related increases in interest rates generally decrease the market value of investments and loans held and may adversely affect liquidity, earnings, and shareholders’ equity. Commercial and other loan originations and refinancings tend to slow as interest rates increase, and can reduce the Company’s earnings from such activities.
Off Balance Sheet Arrangements
The Company generally does not have any off-balance sheet arrangements other than approved and unfunded loans and lines and letters of credit to customers in the ordinary course of business. At June 30, 2015, the Company had unfunded loan commitments outstanding of $56,734, unused lines of credit of $272,704, and outstanding standby letters of credit of $10,504.
44
GAAP Reconciliation and Management Explanation of Non-GAAP Financial Measures
Some of the financial data included in our selected historical consolidated financial information are not measures of financial performance recognized by GAAP. Our management uses these non-GAAP financial measures in its analysis of our performance:
| | • | | “Common shareholders’ equity” is defined as total shareholders’ equity at end of period less the liquidation preference value of the preferred stock; |
| | • | | “Tangible common shareholders’ equity” is common shareholders’ equity less goodwill and other intangible assets; |
| | • | | “Total tangible assets” is defined as total assets less goodwill and other intangible assets; |
| | • | | “Other intangible assets” is defined as the sum of core deposit intangible and SBA servicing rights; |
| | • | | “Tangible book value per share” is defined as tangible common shareholders’ equity divided by total common shares outstanding. This measure is important to investors interested in changes from period-to-period in book value per share exclusive of changes in intangible assets; |
| | • | | “Tangible common shareholders’ equity ratio” is defined as the ratio of tangible common shareholders’ equity divided by total tangible assets. We believe that this measure is important to many investors in the marketplace who are interested in relative changes from period-to period in common equity and total assets, each exclusive of changes in intangible assets; |
| | • | | “Return on Average Tangible Common Equity” is defined as net income available to common shareholders divided by average tangible common shareholders’ equity; |
| | • | | “Efficiency ratio” is defined as noninterest expenses divided by our operating revenue, which is equal to net interest income plus noninterest income; |
| | • | | “Adjusted yield on loans” is our yield on loans after excluding loan accretion from our acquired loan portfolio. Our management uses this metric to better assess the impact of purchase accounting on our yield on loans, as the effect of loan discount accretion is expected to decrease as the acquired loans mature or roll off of our balance sheet; |
| | • | | “Net interest margin” is defined as annualized net interest income divided by average interest-earning assets for the period; |
| | • | | “Adjusted net interest margin” is net interest margin after excluding loan accretion from the acquired loan portfolio and premiums for acquired time deposits. Our management uses this metric to better assess the impact of purchase accounting on net interest margin, as the effect of loan discount accretion and accretion of net discounts and premiums related to deposits is expected to decrease as the acquired loans and deposits mature or roll off of our balance sheet. |
We believe these non-GAAP financial measures provide useful information to management and investors that is supplementary to our financial condition, results of operations and cash flows computed in accordance with GAAP; however, we acknowledge that our non-GAAP financial measures have a number of limitations. As such, you should not view these disclosures as a substitute for results determined in accordance with GAAP, and they are not necessarily comparable to non-GAAP financial measures that other companies use.
45
The following reconciliation table provides a more detailed analysis of these non-GAAP financial measures:
| | | | | | | | | | | | | | | | | | | | |
| | | As of or for the Three Months Ended | |
(Amounts in thousands, except share/
per share data and percentages) | | Jun 30,
2015 | | | Mar 31,
2015 | | | Dec 31,
2014 | | | Sept 30,
2014 | | | Jun 30,
2014 | |
Total shareholders’ equity | | $ | 177,081 | | | $ | 178,541 | | | $ | 121,799 | | | $ | 116,454 | | | $ | 74,199 | |
Less: Preferred stock | | | 10,000 | | | | 10,000 | | | | 10,000 | | | | 10,000 | | | | 10,000 | |
| | | | | | | | | | | | | | | | | | | | |
Total common shareholders’ equity | | | 167,081 | | | | 168,541 | | | | 111,799 | | | | 106,454 | | | | 64,199 | |
Less: Goodwill and other intangibles | | | 11,538 | | | | 11,709 | | | | 11,886 | | | | 12,074 | | | | 240 | |
| | | | | | | | | | | | | | | | | | | | |
Tangible common shareholders’ equity | | $ | 155,543 | | | $ | 156,832 | | | $ | 99,913 | | | $ | 94,380 | | | $ | 63,959 | |
Common shares outstanding | | | 10,502,671 | | | | 10,465,930 | | | | 7,756,411 | | | | 7,739,644 | | | | 4,915,907 | |
| | | | | | | | | | | | | | | | | | | | |
Tangible book value per share | | $ | 14.81 | | | $ | 14.99 | | | $ | 12.88 | | | $ | 12.19 | | | $ | 13.01 | |
| | | | | | | | | | | | | | | | | | | | |
Net income available to common shareholders | | $ | 3,109 | | | $ | 3,107 | | | $ | 2,810 | | | $ | 1,990 | | | $ | 2,010 | |
Average tangible common equity | | | 157,959 | | | | 103,475 | | | | 97,630 | | | | 96,310 | | | | 60,915 | |
| | | | | | | | | | | | | | | | | | | | |
Return on average tangible common equity | | | 7.89 | % | | | 12.18 | % | | | 11.42 | % | | | 8.20 | % | | | 13.23 | % |
| | | | | | | | | | | | | | | | | | | | |
Efficiency Ratio: | | | | | | | | | | | | | | | | | | | | |
Net interest income | | $ | 13,327 | | | $ | 12,157 | | | $ | 12,123 | | | $ | 11,127 | | | $ | 7,348 | |
Noninterest income | | | 2,851 | | | | 3,215 | | | | 2,926 | | | | 3,274 | | | | 2,430 | |
| | | | | | | | | | | | | | | | | | | | |
Operating revenue | | | 16,178 | | | | 15,372 | | | | 15,049 | | | | 14,401 | | | | 9,778 | |
Expense | | | | | | | | | | | | | | | | | | | | |
Total noninterest expense | | | 10,572 | | | | 9,621 | | | | 9,863 | | | | 10,389 | | | | 6,078 | |
| | | | | | | | | | | | | | | | | | | | |
Efficiency ratio | | | 65.35 | % | | | 62.59 | % | | | 65.54 | % | | | 72.14 | % | | | 62.16 | % |
| | | | | | | | | | | | | | | | | | | | |
Reported yield on loans | | | 5.37 | % | | | 5.35 | % | | | 5.67 | % | | | 5.92 | % | | | 5.77 | % |
Effect of accretion income on acquired loans | | | (0.32 | %) | | | (0.28 | %) | | | (0.36 | %) | | | (0.43 | %) | | | 0.00 | % |
| | | | | | | | | | | | | | | | | | | | |
Adjusted yield on loans | | | 5.05 | % | | | 5.07 | % | | | 5.31 | % | | | 5.49 | % | | | 5.77 | % |
| | | | | | | | | | | | | | | | | | | | |
Reported net interest margin | | | 3.51 | % | | | 3.65 | % | | | 3.97 | % | | | 3.86 | % | | | 3.48 | % |
Effect of accretion income on acquired loans | | | (0.19 | %) | | | (0.18 | %) | | | (0.23 | %) | | | (0.27 | %) | | | 0.00 | % |
Effect of premium amortization of acquired deposits | | | (0.01 | %) | | | (0.01 | %) | | | (0.02 | %) | | | (0.02 | %) | | | 0.00 | % |
| | | | | | | | | | | | | | | | | | | | |
Adjusted net interest margin | | | 3.31 | % | | | 3.46 | % | | | 3.72 | % | | | 3.57 | % | | | 3.48 | % |
| | | | | | | | | | | | | | | | | | | | |
46
FRANKLIN FINANCIAL NETWORK, INC.
SUMMARY QUARTERLY CONSOLIDATED FINANCIAL DATA (UNAUDITED)
(Amounts in thousands, except per share data and percentages)
| | | | | | | | | | | | | | | | | | | | |
| | | As of and for the three months ended | |
| | | Jun 30,
2015 | | | Mar 31,
2015 | | | Dec 31,
2014 | | | Sept 30,
2014 | | | Jun 30,
2014 | |
Income Statement Data ($): | | | | | | | | | | | | | | | | | | | | |
Interest income | | | 15,413 | | | | 13,926 | | | | 13,742 | | | | 12,692 | | | | 8,699 | |
Interest expense | | | 2,086 | | | | 1,769 | | | | 1,619 | | | | 1,565 | | | | 1,351 | |
Net interest income | | | 13,327 | | | | 12,157 | | | | 12,123 | | | | 11,127 | | | | 7,348 | |
Provision for loan losses | | | 805 | | | | 625 | | | | 885 | | | | 664 | | | | 440 | |
Noninterest income | | | 2,851 | | | | 3,215 | | | | 2,926 | | | | 3,274 | | | | 2,430 | |
Noninterest expense | | | 10,572 | | | | 9,621 | | | | 9,863 | | | | 10,389 | | | | 6,078 | |
Net income before taxes | | | 4,801 | | | | 5,126 | | | | 4,301 | | | | 3,348 | | | | 3,260 | |
Income tax expense | | | 1,667 | | | | 1,994 | | | | 1,466 | | | | 1,333 | | | | 1,225 | |
Net income | | | 3,134 | | | | 3,132 | | | | 2,835 | | | | 2,015 | | | | 2,035 | |
Net income available to common shareholders | | | 3,109 | | | | 3,107 | | | | 2,810 | | | | 1,990 | | | | 2,010 | |
Earnings per share, basic | | | 0.30 | | | | 0.39 | | | | 0.36 | | | | 0.26 | | | | 0.41 | |
Earnings per share, diluted | | | 0.28 | | | | 0.37 | | | | 0.34 | | | | 0.25 | | | | 0.40 | |
Profitability (%) | | | | | | | | | | | | | | | | | | | | |
Return on average assets | | | 0.79 | | | | 0.90 | | | | 0.88 | | | | 0.67 | | | | 0.94 | |
Return on average equity | | | 7.00 | | | | 10.14 | | | | 9.40 | | | | 7.02 | | | | 11.47 | |
Return on average tangible common equity | | | 7.89 | | | | 12.18 | | | | 11.42 | | | | 8.20 | | | | 13.23 | |
Efficiency ratio | | | 65.35 | | | | 62.59 | | | | 65.54 | | | | 72.14 | | | | 62.16 | |
Net interest margin | | | 3.51 | | | | 3.65 | | | | 3.97 | | | | 3.86 | | | | 3.48 | |
Balance Sheet Data ($): | | | | | | | | | | | | | | | | | | | | |
Loans (including HFS) | | | 979,033 | | | | 897,001 | | | | 805,650 | | | | 744,927 | | | | 501,664 | |
Allowance for loan losses | | | 8,016 | | | | 7,308 | | | | 6,680 | | | | 5,883 | | | | 5,771 | |
Cash | | | 43,413 | | | | 48,580 | | | | 49,347 | | | | 36,657 | | | | 26,054 | |
Securities | | | 681,999 | | | | 507,170 | | | | 449,037 | | | | 403,043 | | | | 322,607 | |
Goodwill | | | 9,124 | | | | 9,124 | | | | 9,124 | | | | 9,121 | | | | 157 | |
Intangible assets | | | 2,414 | | | | 2,585 | | | | 2,762 | | | | 2,953 | | | | 83 | |
Assets | | | 1,766,752 | | | | 1,509,430 | | | | 1,355,827 | | | | 1,238,579 | | | | 872,142 | |
Deposits | | | 1,491,986 | | | | 1,271,602 | | | | 1,172,233 | | | | 1,051,558 | | | | 747,324 | |
Liabilities | | | 1,589,671 | | | | 1,330,889 | | | | 1,234,028 | | | | 1,122,125 | | | | 797,943 | |
Total equity | | | 177,081 | | | | 178,541 | | | | 121,799 | | | | 116,454 | | | | 74,199 | |
Common equity | | | 167,081 | | | | 168,541 | | | | 111,799 | | | | 106,454 | | | | 64,199 | |
Tangible common equity | | | 155,543 | | | | 156,832 | | | | 99,913 | | | | 94,380 | | | | 63,959 | |
Asset Quality (%) | | | | | | | | | | | | | | | | | | | | |
Nonperforming loans / total loans | | | 0.10 | | | | 0.14 | | | | 0.15 | | | | 0.47 | | | | 0.34 | |
Nonperforming assets / total loans + OREO | | | 0.12 | | | | 0.19 | | | | 0.24 | | | | 0.70 | | | | 0.58 | |
Loan loss reserve / loans (excluding HFS) | | | 0.83 | | | | 0.84 | | | | 0.85 | | | | 0.82 | | | | 1.19 | |
Net charge-offs / average loans | | | 0.04 | | | | 0.00 | | | | 0.04 | | | | 0.30 | | | | (0.02 | ) |
Capital (%) | | | | | | | | | | | | | | | | | | | | |
Tangible common equity to tangible assets | | | 8.86 | | | | 10.47 | | | | 7.43 | | | | 7.70 | | | | 7.34 | |
Leverage ratio | | | 10.19 | | | | 11.41 | | | | 8.57 | | | | 8.83 | | | | 8.39 | |
Tier 1 common ratio | | | 12.29 | | | | 14.01 | | | | 10.51 | | | | 11.17 | | | | 11.10 | |
Tier 1 risk-based capital ratio | | | 12.86 | | | | 14.95 | | | | 11.58 | | | | 12.35 | | | | 12.86 | |
Total risk-based capital ratio | | | 13.50 | | | | 15.64 | | | | 12.30 | | | | 13.05 | | | | 13.88 | |
47
Emerging Growth Company Status
The Company is an “emerging growth company,” as defined in the Jumpstart Our Business Startups Act of 2012 (the “JOBS Act”), and may take advantage of certain exemptions from various reporting requirements that are applicable to public companies that are not emerging growth companies, including, but not limited to, not being required to comply with the auditor attestation requirements of Section 404 of the Sarbanes-Oxley Act, reduced disclosure obligations regarding executive compensation in periodic reports and proxy statements, and exemptions from the requirements of holding a nonbinding advisory vote on executive compensation and shareholder approval of any golden parachute payments not previously approved. In addition, even if the Company complies with the greater obligations of public companies that are not emerging growth companies, the Company may avail itself of the reduced requirements applicable to emerging growth companies from time to time in the future, so long as the Company is an emerging growth company. The Company will continue to be an emerging growth company until the earliest to occur of: (1) the end of the fiscal year following the fifth anniversary of the effectiveness of the Company’s Form S-4 filed with the SEC on May 14, 2014 in connection with the Company’s acquisition of MidSouth, which registered the Company’s common stock issued in the acquisition of MidSouth under the Securities Act, and resulted in the Company becoming an SEC reporting company under Section 15(d) of the Securities Exchange Act of 1934, as amended (the “Exchange Act”); (2) the last day of the fiscal year in which we have more than $1.0 billion in annual revenues; (3) the date on which we are deemed to be a “large accelerated filer” under the Exchange Act; or (4) the date on which we have, during the previous three-year period, issued publicly or privately, more than $1.0 billion in non-convertible debt securities. Management cannot predict if investors will find the Company’s common stock less attractive because it will rely on these exemptions. If some investors find the Company’s common stock less attractive as a result, there may be a less active trading market for its common stock and the Company’s stock price may be more volatile.
Further, the JOBS Act exempts emerging growth companies from being required to comply with new or revised financial accounting standards until private companies (that is, those that have not had a Securities Act registration statement declared effective or do not have a class of securities registered under the Exchange Act) are required to comply with the new or revised financial accounting standards. The JOBS Act provides that a company can elect to opt out of the extended transition period and comply with the requirements that apply to non-emerging growth companies but any such an election to opt out is irrevocable. The Company has elected to opt out of such extended transition period, which means that when a standard is issued or revised and it has different application dates for public or private companies, it adopts the new or revised standard at the time public companies adopt the new or revised standard. This election is irrevocable.
ITEM 3. QUANTITATIVE AND QUALITATIVE DISCLOSURES ABOUT MARKET RISK.
The Company’s primary component of market risk is interest rate volatility. Fluctuations in interest rates will ultimately impact both the level of income and expense recorded on a large portion of the Company’s assets and liabilities, and the market value of all interest-earning assets and interest-bearing liabilities, other than those which possess a short term to maturity. Based upon the nature of the Company’s operations, the Company is not subject to foreign currency exchange or commodity price risk.
Management seeks to maintain profitability in both immediate and long-term earnings through funds management/interest rate risk management. Interest rate risk (sensitivity) management deals with the potential impact on earnings associated with changing interest rates using various rate change (shock) scenarios. The Company’s rate sensitivity position has an important impact on earnings. Senior management monitors the Company’s rate sensitivity position throughout each month, and then the Asset Liability Committee (“ALCO”) of the Bank meets on a quarterly basis to analyze the rate sensitivity position and other aspects of asset/liability management. These meetings cover the spread between the cost of funds (primarily time deposits) and interest yields generated primarily through loans and investments, rate shock analyses, liquidity and dependency positions, and other areas necessary for proper balance sheet management.
Management believes interest rate risk is best measured by earnings simulation modeling. The simulation is run using the prime rate as the base with the assumption of rates increasing 100, 200, 300 and 400 basis points or decreasing 100 and 200 basis points. All rates are increased or decreased parallel to the change in prime rate. As a result of the simulation, over a 12-month time period ending June 30, 2015, net interest income was estimated to increase 0.96% and 0.91% if rates were to increase 100 basis points and 200 basis points, respectively, and was estimated to decrease 4.58% and 17.69% in a 100 basis points and 200 basis points declining rate assumption, respectively. These results are in line with the Company’s guidelines for rate sensitivity.
48
The following chart reflects the Company’s sensitivity to changes in interest rates as indicated as of June 30, 2015.
| | | | | | | | | | | | |
Projected Interest Rate
Change | | Net Interest
Income | | | Net Interest Income $
Change from Base | | | % Change from Base | |
| -200 | | | 44,611 | | | | -9,588 | | | | -17.69 | % |
| -100 | | | 51,718 | | | | -2,481 | | | | -4.58 | % |
| Base | | | 54,199 | | | | — | | | | 0.00 | % |
| +100 | | | 54,721 | | | | 522 | | | | 0.96 | % |
| +200 | | | 54,693 | | | | 494 | | | | 0.91 | % |
| +300 | | | 55,093 | | | | 894 | | | | 1.65 | % |
| +400 | | | 54,877 | | | | 678 | | | | 1.25 | % |
The preceding sensitivity analysis is a modeling analysis, which changes periodically and consists of hypothetical estimates based upon numerous assumptions including interest rate levels, changes in the shape of the yield curve, prepayments on loans and securities, rates on loans and deposits, reinvestments of pay downs and maturities of loans, investments and deposits, changes in spreads between key market rates, and other assumptions. In addition, there is no input for growth or a change in asset mix. While assumptions are developed based on the current economic and market conditions, the Company cannot make any assurances as to the predictive nature of these assumptions, including how customer preferences or competitor influences might change. As market conditions vary from those assumed in the sensitivity analysis, actual results will differ. Also, these results do not include any management action that might be taken in responding to or anticipating changes in interest rates. The simulation results are one indicator of interest rate risk, and actual net interest income is largely impacted by the allocation of assets, liabilities, and product mix.
ITEM 4. CONTROLS AND PROCEDURES.
(a) Evaluation of Disclosure Controls and Procedures. The Company’s chief executive officer and chief financial officer have evaluated the effectiveness of the design and operation of the Company’s “disclosure controls and procedures” (as that term is defined in Rule 13a-15(e) under the Exchange Act) as of June 30, 2015, the end of the fiscal quarter covered by this Quarterly Report on Form 10-Q. Based on that evaluation, the chief executive officer and chief financial officer have concluded that the Company’s disclosure controls and procedures are effective.
(b) Changes in Internal Controls. There has been no change in our internal control over financial reporting that occurred during the fiscal quarter covered by this Quarterly Report on Form 10-Q that has materially affected, or is reasonably likely to materially affect, our internal control over financial reporting.
PART II OTHER INFORMATION
ITEM 1. LEGAL PROCEEDINGS.
Management is not aware of any material pending legal proceedings against the Company which, if determined adversely, the Company believes would have a material adverse impact on the Company’s financial position, results of operations or cash flows.
ITEM 1A. RISK FACTORS
There have been no material changes to the risk factors disclosed in our Annual Report on Form 10-K filed with the SEC on March 11, 2015 other than the additional disclosure of the risk factors listed below.
An active, liquid market for our common stock may not develop or be sustained, which may impair the ability of our shareholders to sell their shares.
Before the listing of our common stock on the New York Stock Exchange (the “NYSE”) on March 26, 2015, our common stock had very little liquidity, with only limited trading of our common stock on the OTCQB of the OTC Markets Group. Even though our common stock is now listed on the NYSE under the symbol “FSB”, there is limited trading volume and an active, liquid trading market for our common stock may not develop or be sustained. A public trading market having the desired characteristics of depth, liquidity and orderliness depends upon the presence in the marketplace and independent decisions of willing buyers and sellers of our common stock, over which we have no control. If an active, liquid trading market for our common stock does not develop, shareholders may not be able to sell their shares at the volume, prices and times desired. Moreover, the lack of an established market could materially and adversely affect the value of our common stock. The market price of our common stock could decline significantly due to actual or anticipated issuances or sales of our common stock in the future.
49
Shares of our common stock are subject to dilution and the market price of our common stock could decline due to the number of outstanding shares of our common stock eligible for future sale, including shares that will be available for sale following the expiration of lock-up periods.
Actual or anticipated issuances or sales of additional amounts of our common stock in the future could cause the market price of our common stock to decline significantly and make it more difficult for us to sell equity securities in the future at a time and on terms that we deem appropriate. The issuance of any shares of our common stock in the future also would dilute the percentage ownership interest held by shareholders prior to such issuance. As of May 10, 2015, we had 10,501,462 shares of common stock issued and outstanding. Of the outstanding shares of common stock, all of the 2,640,000 shares that were sold in our initial public offering are freely tradable, except that any shares purchased by “affiliates” (as that term is defined in Rule 144 under the Securities Act), may be sold publicly only in compliance with certain limitations. In addition, 2,766,191 shares of our outstanding common stock were issued pursuant to a registration statement on Form S-4 in connection with the acquisition of MidSouth and are freely tradable. Other than certain of the restricted shares we previously issued under our 2007 Omnibus Equity Incentive Plan (the “2007 Plan”), and subject in certain cases to lock-up restrictions with respect to our directors and executive officers that restrict their ability, with certain exceptions, to transfer shares of our common stock held by them for a period of 180 days following the IPO, the remaining 4,084,234 outstanding shares of our common stock may be sold in the market over time in accordance with Rule 144 under the Securities Act or otherwise in future public offerings. We plan to file a registration statement on Form S-8 under the Securities Act to register an aggregate of 4,000,000 shares of our common stock for issuance under our 2007 Plan. Subject to certain exceptions, approximately 1,224,003 shares of our common stock will become eligible for sale upon expiration of the 180-day lock-up period. Accordingly, the market price of our common stock could be adversely affected by actual of anticipated sales of a significant number of shares of our common stock in the future.
ITEM 2. UNREGISTERED SALES OF EQUITY SECURITIES AND USE OF PROCEEDS.
Shares of the Company’s common stock were issued during the second quarter of 2015 pursuant to the exercise of warrants and options issued by the Company, as follows:
| | | | | | | | | | | | | | |
Date of Sale | | Number of Shares of
Common Stock Sold | | | Type of Issuance | | Price Per Share | | | Aggregate Price | |
| 04/02/2015 | | | 314 | | | Options Exercised | | $ | 11.75 | | | $ | (1)0.00 | |
| | | 649 | | | Options Exercised | | $ | 10.00 | | | $ | (1)0.00 | |
| | | 208 | | | Options Exercised | | $ | 10.50 | | | $ | (1)0.00 | |
| | | 239 | | | Options Exercised | | $ | 12.00 | | | $ | (1)0.00 | |
| | | 34 | | | Options Exercised | | $ | 13.00 | | | $ | (1)0.00 | |
| 04/26/2015 | | | 250 | | | Warrants Exercised | | $ | 12.00 | | | $ | 3,000.00 | |
| 05/05/2015 | | | 1,250 | | | Options Exercised | | $ | 12.00 | | | $ | 15,000.00 | |
| | | 125 | | | Options Exercised | | $ | 12.00 | | | $ | 1,500.00 | |
| | | 25 | | | Options Exercised | | $ | 12.00 | | | $ | 300.00 | |
| 05/06/2015 | | | 500 | | | Options Exercised | | $ | 12.00 | | | $ | 6,000.00 | |
| 05/15/2015 | | | 125 | | | Options Exercised | | $ | 12.00 | | | $ | 1,500.00 | |
| | | 125 | | | Options Exercised | | $ | 12.00 | | | $ | 1,500.00 | |
| | | 150 | | | Options Exercised | | $ | 12.00 | | | $ | 1,800.00 | |
| 05/21/2015 | | | 125 | | | Options Exercised | | $ | 12.00 | | | $ | 1,500.00 | |
| | | 425 | | | Options Exercised | | $ | 12.00 | | | $ | 5,100.00 | |
| 06/18/2015 | | | 175 | | | Options Exercised | | $ | 12.00 | | | $ | 2,100.00 | |
| | | 125 | | | Options Exercised | | $ | 12.00 | | | $ | 1,500.00 | |
| (1) | These option exercises were cashless exercises. |
Neither the exercises of the warrants and options nor their original issuances involved any underwriters, underwriting discounts or commissions, or any public offering, and the Company believes that such transactions were exempt from the registration requirements of the Securities Act in reliance on Section 4(a)(2) of the Securities Act (or Rule 506 of Regulation D promulgated thereunder) as transactions by an issuer not involving a public offering.
ITEM 3. DEFAULTS UPON SENIOR SECURITIES.
None.
ITEM 4. MINE SAFETY DISCLOSURES.
Not applicable.
50
ITEM 5. OTHER INFORMATION.
None.
ITEM 6. EXHIBITS
| | |
Exhibit No. | | Description |
| |
| 10.1 | | Triple Net Office Lease Agreement, by and between Columbia Avenue Partners, LLC and Franklin Synergy Bank (incorporated herein by reference to Exhibit 10.1 to the Company’s Current Report on Form 8-K filed with the Commission on June 12, 2015). |
| |
| 31.1 | | Certification of Chief Executive Officer Pursuant to Rule 13a-14(a) (Section 302 Certification). |
| |
| 31.2 | | Certification of Chief Financial Officer Pursuant to Rule 13a-14(a) (Section 302 Certification). |
| |
| 32 | | Certification of Chief Executive Officer and Chief Financial Officer Pursuant to 18 U.S.C. Section 1350 (Section 906 Certification). |
| |
| 101 | | Interactive Data Files. |
51
SIGNATURES
Pursuant to the requirements of the Exchange Act, the registrant has duly caused this report to be signed on its behalf by the undersigned, thereunto duly authorized.
| | | | |
| | FRANKLIN FINANCIAL NETWORK, INC. |
| | |
| August 13, 2015 | | By: | | /s/ Sally P. Kimble |
| | | | Sally P. Kimble |
| | | | On behalf of the registrant and as Chief Financial Officer (Principal Financial Officer) |
EXHIBIT INDEX
| | |
Exhibit No. | | Description |
| |
| 10.1 | | Triple Net Office Lease Agreement, by and between Columbia Avenue Partners, LLC and Franklin Synergy Bank (incorporated herein by reference to Exhibit 10.1 to the Company’s Current Report on Form 8-K filed with the Commission on June 12, 2015). |
| |
| 31.1 | | Certification of Chief Executive Officer Pursuant to Rule 13a-14(a) (Section 302 Certification). |
| |
| 31.2 | | Certification of Chief Financial Officer Pursuant to Rule 13a-14(a) (Section 302 Certification). |
| |
| 32 | | Certification of Chief Executive Officer and Chief Financial Officer Pursuant to 18 U.S.C. Section 1350 (Section 906 Certification). |
| |
| 101 | | Interactive Data Files. |