Exhibit 99.1
| | |
 | | Fourth Quarter/Year 2008
Earnings Release and Supplemental Information |
| | | | | | | | | | | | | | | | | | | | | | |
DuPont Fabros Technology, Inc. 1212 New York Avenue, NW Suite 900 Washington, D.C. 20005 | | (202) 728-0044 www.dft.com | | | | | | | | | | | | | | | | | | | | |
Fourth Quarter/Year 2008 Results
Table of Contents
| | |
Earnings Release | | 1-4 |
| |
Consolidated Statements of Operations | | 5 |
| |
Reconciliations of Net Income to Funds From Operations and Adjusted Funds From Operations | | 6 |
| |
Consolidated Balance Sheets | | 7 |
| |
Consolidated Statement of Cash Flows | | 8 |
| |
Stabilized Operating Properties | | 9 |
| |
Lease Expirations | | 10 |
| |
Development Projects | | 11 |
| |
Debt Summary | | 12 |
| |
Capital Structure | | 13 |
| |
Common Share and Operating Partnership Unit Weighted Average Amounts Outstanding | | 13 |
| |
2009 Guidance | | 14 |
| | | | |
| | Du Pont Fabros Technology, Inc.
1212 New York Avenue, NW Suite 900 Washington, D.C. 20005 (202) 728-0044 | | |
Note: This press release supplement contains certain non-GAAP financial measures that management believes are helpful in understanding its business, as further discussed within this press release supplement. These financial measures, which include Funds From Operations, Adjusted Funds From Operations, Funds From Operations per share and Adjusted Funds From Operations per share, should not be considered as an alternative to net earnings or any other GAAP measurement of performance or as an alternative to cash flows from operating, investing or financing activities. Furthermore, these non-GAAP financial measures are not intended to be a measure of cash flow or liquidity. Information included in this supplemental package is unaudited.
| | | | |
 | | Du Pont Fabros Technology, Inc. 1212 New York Avenue, NW Suite 900 Washington, D.C. 20005 | | |
| | |
| | | | NEWS |
| | |
| | | | AT FINANCIAL RELATIONS BOARD: |
| | | | Victoria Baker |
| | | | Investor/Media Inquiries |
| | | | 703-796-1798 |
| | | | vbaker@frbir.com |
DUPONT FABROS TECHNOLOGY, INC. REPORTS
FOURTH QUARTER AND YEAR 2008 RESULTS
Provides Financing, Leasing and Dividend Updates
WASHINGTON, D.C., February 11, 2009 - DuPont Fabros Technology, Inc. (NYSE: DFT) today reported results for the fourth quarter and year ended December 31, 2008. The results for 2007 are not provided in this earnings release as they are not comparable due to the Company’s IPO on October 24, 2007. All per share results are reported on a fully diluted basis.
Hossein Fateh, President and Chief Executive Officer of the Company, said, “We delivered solid results for the year with revenues of $173.7 million, net income of $19.1 million and Funds from operations (“FFO”) of $1.30 per share. Additionally, we have started strong in 2009 with the successful completion of several financing and leasing transactions.”
Highlights
| | • | | Obtained $150.0 million of new debt via the ACC4 loan accordion feature on February 10, 2009. |
| | • | | Paid off entire $135.1 million CH1 construction loan on February 10, 2009 eliminating debt maturities until August 2011 assuming extensions are exercised. |
| | • | | Obtained $30.0 million of new debt on February 6, 2009 to complete ACC5. |
| | • | | Restarted development of ACC5 in Ashburn, Virginia with expected completion in third quarter of 2009. |
| | • | | Executed six new leases and pre-leases totaling 14.4 megawatts at facilities in Ashburn, Virginia and Elk Grove Village, Illinois in the fourth quarter 2008 and to date in the first quarter 2009, which represents approximately $340 million of contract value over the respective lease terms. ACC4 is now 94% leased and ACC5 is now 57% pre-leased. |
Fourth Quarter 2008
For the quarter ended December 31, 2008, the Company reported net income of $3.5 million, or $0.10 per share compared to $4.1 million or $0.12 per share for the third quarter of 2008. FFO for the quarter ended December 31, 2008 was $20.1 million, or $0.30 per share, while Adjusted FFO (“AFFO”) was $14.1 million, or $0.21 per share. Both FFO and AFFO were in line with the high end of the Company’s expectations. FFO for the fourth quarter of 2008 decreased $0.8 million, or $0.01 per share, as compared to the third quarter of 2008 as a result of increased interest expense due to the temporary suspension of the Company’s development projects and the placement of CH1 into service on August 1, 2008. Revenues increased 10.7%, or $4.6 million, to $47.5 million for the fourth quarter of 2008 over the third quarter of 2008 primarily due to one-time completed ancillary projects included in other revenue.
-1-
Year Ended December 31, 2008
For the year ended December 31, 2008, the Company reported net income of $19.1 million, or $0.54 per share. FFO for the year ended December 31, 2008 was $86.6 million, or $1.30 per share, while AFFO was $54.1 million, or $0.81 per share.
Portfolio Update/Status
In the fourth quarter of 2008, the Company executed three new leases at its data center facilities:
| | • | | Two leases were signed at the Company’s CH1 facility in Elk Grove Village, Illinois, comprising 1.7 megawatts of critical load, 12,556 raised square feet and lease terms of five and ten years comprising 9.5% of critical load at Phase I of CH1; |
| | • | | The first pre-lease in Phase I of ACC5 in Ashburn, Virginia was executed, comprising 1.3 megawatts of critical load, 6,318 raised square feet and a lease term of ten years comprising 7.3% of the critical load. |
Subsequent to the fourth quarter of 2008, the Company executed three additional leases at its facilities:
| | • | | One lease was signed at ACC4 in Ashburn, Virginia, representing 2.275 megawatts of critical load and 11,000 raised square feet with a lease term of 10 years; |
| | • | | Two pre-leases were signed at ACC5 comprising 9.1 megawatts of critical load and 44,000 raised square feet with lease terms exceeding 12 years. The two pre-leases represent 50% of the facility’s critical load. |
In total, the fourth quarter 2008 and first quarter 2009 leases signed to date comprise 14.4 megawatts of critical load, 73,874 raised square feet and represent approximately $340 million of contract value to the Company.
As of the date of this press release, the Company’s stabilized operating portfolio’s critical load is 97.3% leased, CH1 is 9.5% leased and ACC5 is 57.3% pre-leased.
Liquidity
On February 6, 2009, the Company closed on two loans totaling $30.0 million. Each loan has a one-year maturity date with options to extend the term up to four additional years, subject to customary conditions. Each loan is secured by development properties, ACC5 and SC1, and bears interest at a fixed rate of 12%.
The Company raised $150 million via the ACC4 accordion feature and paid off in entirety its CH1 construction loan on February 10, 2009, receiving proceeds net of the CH1 loan payoff of approximately $12 million.
With these transactions, the Company has no debt maturities until the third quarter of 2011 assuming the election of the extension options on the company’s line of credit and new loans on ACC5 and SC1. As of the date of this press release, the Company has approximately $40 million of unrestricted cash and $10 million available on its revolving credit facility.
Development Update
In the first quarter of 2009, the Company resumed development of ACC5 and estimates a completion date during the third quarter of 2009. The Company will spend approximately $30 to $40 million to complete this project. The Company’s developments in New Jersey and Santa Clara remain temporarily suspended as it continues to work to obtain pre-leasing and financing in order to restart both developments. As of the date of this press release, total committed costs of approximately $37 million on NJ1 and SC1 remain accrued as construction costs payable, which will be paid over the next three quarters.
-2-
Dividends
The following table summarizes the characterization of the 2008 dividends paid on a per share basis.
| | | | | | | | |
Record Date | | Payment Date | | Cash Dividend | | Ordinary Taxable Dividend | | Nontaxable Return of Capital Distributions |
03/28/2008 | | 04/11/2008 | | $0.18750 | | $0.15005 | | $0.03745 |
06/27/2008 | | 07/11/2008 | | 0.18750 | | 0.15005 | | 0.03745 |
09/26/2008 | | 10/10/2008 | | 0.18750 | | 0.15005 | | 0.03745 |
| | | | | | | | |
2008 Totals | | | | $0.56250 | | $0.45015 | | $0.11235 |
| | | | | | | | |
The Company did not have capital gains for the 2008 taxable year. The Company currently does not plan to declare a dividend for either the first or second quarter of 2009 in order to preserve liquidity. The Company estimates 2009 dividends of approximately $0.17 to $0.23 per share to meet its 2009 REIT distribution requirement.
2009 Guidance
The Company has established an FFO guidance range of $0.21 to $0.25 per share for the first quarter of 2009.
The primary differences between the company’s fourth quarter 2008 FFO of $0.30 per share and the midpoint of the first quarter 2009 FFO guidance are:
| | • | | Higher operating costs of $0.01 per share in the first quarter of 2009 for the temporarily suspended developments. |
| | • | | Higher interest expense of $0.04 per share due to higher overall debt balances and a greater amount of interest expensed vs. capitalized. |
| | • | | Higher interest expense of $0.02 per share due to a one-time write-off of deferred loan costs on the CH1 loan. |
The Company has established an FFO guidance range of $0.96 to $1.12 per share for the full year 2009. The assumptions underlying this guidance can be found on page 14 of this release.
The primary differences between the company’s full year 2008 FFO of $1.30 per share and the midpoint of the full year 2009 FFO guidance are:
| | • | | Operating income increase of $0.16 per share. |
| | • | | Higher operating costs of $0.03 per share for the temporarily suspended developments. |
| | • | | Higher interest expense of $0.37 per share due to higher overall debt balances and a greater amount of interest expensed vs. capitalized. |
| | • | | Higher interest expense of $0.02 per share due to a one-time write-off of deferred loan costs on the CH1 loan. |
First Quarter 2009 Conference Call
DuPont Fabros Technology, Inc. expects to announce first quarter 2009 results on Monday, May 4th, 2009 and host a conference call to discuss those results at 10:00 a.m. ET on Tuesday, May 5th, 2009.
-3-
About DuPont Fabros Technology, Inc.
DuPont Fabros Technology, Inc. (NYSE: DFT) is a real estate investment trust (REIT) and leading owner, developer, operator and manager of wholesale data centers. The Company’s data centers are highly specialized, secure facilities used primarily by national and international technology companies to house, power and cool the computer servers that support many of their most critical business processes. DuPont Fabros Technology, Inc. is headquartered in Washington, DC. For more information please visit www.dft.com.
Conference Call and Web Cast Information
The Company will host a conference call to discuss these results tomorrow, Thursday, February 12, 2009 at 10:00 a.m. ET. To access the live call, please visit the Investor Relations section of the Company’s website at www.dft.com or dial 1-888-778-8895 (Domestic) or 1-913-312-0416 (International). A replay will be available for seven days by dialing 1-888-203-1112 (Domestic) or 1-719-457-0820 (International) using conference ID 5522403. The webcast will be archived on the Company’s website for one year atwww.dft.com on the Presentations & Webcasts page.
Forward-Looking Statements
Certain statements contained in this press release may be deemed to be forward-looking statements within the meaning of the Private Securities Litigation Reform Act of 1995. The matters described in these forward-looking statements describe expectations regarding future events, results and trends and are subject to known and unknown risks, uncertainties and other unpredictable factors, many of which are beyond the Company’s control. The Company faces many risks that could cause its actual performance to differ materially from the results predicted by its forward-looking statements, including, without limitation, the risk that the Company may be unable to obtain financing on favorable terms or pre-leasing on its development properties sufficient to enable it to resume construction, the risks commonly associated with construction and development of new facilities, including the timing to complete development of ACC5, risks relating to compliance with permitting, zoning, land-use and environmental requirements, the risks related to the leasing of space to third-party tenants, the risk that the Company may be unable to acquire additional properties on favorable terms or at all, and the risk that the Company may not be able to maintain its qualification as a REIT for federal tax purposes. The periodic reports that the Company files with the Securities and Exchange Commission, as well as the annual report on Form 10-K, contain detailed descriptions of these and many other risks to which the Company is subject. These reports are available on our website atwww.dft.com. Because of those risks, the Company’s actual results, performance or achievements may differ materially from the results, performance or achievements contemplated by its forward-looking statements. The information set forth in this news release represents management’s current expectations and intentions. The Company assumes no responsibility to issue updates to the forward-looking matters discussed in this press release.
-4-
DUPONT FABROS TECHNOLOGY, INC.
CONSOLIDATED STATEMENTS OF OPERATIONS
(in thousands except share and per share data)
| | | | | | | | |
| | | Quarter ended
December 31, 2008 | | | Year ended
December 31, 2008 | |
Revenues: | | | | | | | | |
Base rent | | $ | 26,211 | | | $ | 104,032 | |
Recoveries from tenants | | | 16,959 | | | | 58,802 | |
Other revenue | | | 4,360 | | | | 10,830 | |
| | | | | | | | |
Total revenues | | | 47,530 | | | | 173,664 | |
Expenses: | | | | | | | | |
Property operating costs | | | 15,020 | | | | 50,918 | |
Real estate taxes and insurance | | | 1,091 | | | | 3,986 | |
Depreciation and amortization | | | 13,587 | | | | 50,703 | |
General and administrative | | | 2,675 | | | | 10,568 | |
Other expenses | | | 3,669 | | | | 9,003 | |
| | | | | | | | |
Total expenses | | | 36,042 | | | | 125,178 | |
| | | | | | | | |
Operating income | | | 11,488 | | | | 48,486 | |
Interest income | | | 161 | | | | 308 | |
Interest: | | | | | | | | |
Expense incurred | | | (4,327 | ) | | | (10,852 | ) |
Amortization of deferred financing costs | | | (726 | ) | | | (1,782 | ) |
| | | | | | | | |
Income before minority interests – operating partnership | | | 6,596 | | | | 36,160 | |
Minority interests – operating partnership | | | (3,143 | ) | | | (17,078 | ) |
| | | | | | | | |
Net income available for common shares | | $ | 3,453 | | | $ | 19,082 | |
| | | | | | | | |
Earnings per share – basic: | | | | | | | | |
Net income per common share | | $ | 0.10 | | | $ | 0.54 | |
| | | | | | | | |
Weighted average common shares outstanding | | | 35,441,987 | | | | 35,428,521 | |
| | | | | | | | |
Earnings per share – diluted: | | | | | | | | |
Net income per common share | | $ | 0.10 | | | $ | 0.54 | |
| | | | | | | | |
Weighted average common shares outstanding | | | 35,441,987 | | | | 35,428,521 | |
| | | | | | | | |
Dividends declared per common share | | $ | — | | | $ | 0.5625 | |
| | | | | | | | |
-5-
DUPONT FABROS TECHNOLOGY, INC.
RECONCILIATIONS OF NET INCOME TO FFO AND AFFO(1)
(in thousands except per share data)
| | | | | | | | |
| | | Quarter ended
December 31, 2008 | | | Year ended
December 31, 2008 | |
Net income | | $ | 3,453 | | | $ | 19,082 | |
Minority interests - operating partnership | | | 3,143 | | | | 17,078 | |
Depreciation and amortization | | | 13,587 | | | | 50,703 | |
Less: Non real estate depreciation and amortization | | | (93 | ) | | | (267 | ) |
| | | | | | | | |
FFO | | $ | 20,090 | | | $ | 86,596 | |
Straight-line revenue | | | (4,323 | ) | | | (26,441 | ) |
Below market lease amortization, net of above market lease amortization | | | (1,744 | ) | | | (6,978 | ) |
Compensation paid with Company common shares | | | 89 | | | | 963 | |
| | | | | | | | |
AFFO | | $ | 14,112 | | | $ | 54,140 | |
| | | | | | | | |
FFO per share - diluted | | $ | 0.30 | | | $ | 1.30 | |
| | | | | | | | |
AFFO per share - diluted | | $ | 0.21 | | | $ | 0.81 | |
| | | | | | | | |
Weighted average common shares and OP units outstanding - diluted | | | 66,604 | | | | 66,591 | |
| | | | | | | | |
| (1) | Funds from operations, or FFO, is used by industry analysts and investors as a supplemental operating performance measure for REITs. We calculate FFO in accordance with the definition that was adopted by the Board of Governors of the National Association of Real Estate Investment Trusts, or NAREIT. FFO, as defined by NAREIT, represents net income determined in accordance with GAAP, excluding extraordinary items as defined under GAAP and gains or losses from sales of previously depreciated operating real estate assets, plus specified non-cash items, such as real estate asset depreciation and amortization, and after adjustments for unconsolidated partnerships and joint ventures. |
We use FFO as a supplemental performance measure because, in excluding real estate related depreciation and amortization and gains and losses from property dispositions, it provides a performance measure that, when compared year over year, captures trends in occupancy rates, rental rates and operating expenses. We also believe that, as a widely recognized measure of the performance of equity REITs, FFO will be used by investors as a basis to compare our operating performance with that of other REITs. However, because FFO excludes real estate related depreciation and amortization and captures neither the changes in the value of our properties that result from use or market conditions nor the level of capital expenditures and leasing commissions necessary to maintain the operating performance of our properties, all of which have real economic effects and could materially impact our results from operations, the utility of FFO as a measure of our performance is limited.
While FFO is a relevant and widely used measure of operating performance of equity REITs, other equity REITs may use different methodologies for calculating FFO and, accordingly, FFO as disclosed by such other REITs may not be comparable to our FFO. Therefore, we believe that in order to facilitate a clear understanding of our historical operating results, FFO should be examined in conjunction with net income as presented in the consolidated statements of operations. FFO should not be considered as an alternative to net income or to cash flow from operating activities (each as computed in accordance with GAAP) or as an indicator of our liquidity, nor is it indicative of funds available to fund our cash needs, including our ability to pay dividends or make distributions.
We also present FFO with a supplemental adjustment which we call Adjusted FFO (“AFFO”). AFFO is FFO excluding straight-line revenue, non-cash stock based compensation, unrealized gain or loss on derivative instruments, acquisition of service agreements, below market lease amortization net of above market lease amortization and early extinguishment of debt costs. AFFO does not represent cash generated from operating activities in accordance with GAAP and therefore should not be considered an alternative to net income as an indicator of our operating performance or as an alternative to cash flow provided by operations as a measure of liquidity and is not necessarily indicative of funds available to fund our cash needs including our ability to pay dividends. In addition, AFFO may not be comparable to similarly titled measurements employed by other companies. Our management uses AFFO in management reports to provide a measure of REIT operating performance that can be compared to other companies using AFFO.
-6-
DUPONT FABROS TECHNOLOGY, INC.
CONSOLIDATED BALANCE SHEETS
(in thousands except share data)
| | | | | | | | |
| | | December 31,
2008 | | | December 31,
2007 | |
| ASSETS | | | | | | | | |
Income producing property: | | | | | | | | |
Land | | $ | 39,617 | | | $ | 26,971 | |
Buildings and improvements | | | 1,277,230 | | | | 1,102,756 | |
| | | | | | | | |
| | | 1,316,847 | | | | 1,129,727 | |
Less: accumulated depreciation | | | (63,669 | ) | | | (17,672 | ) |
| | | | | | | | |
Net income producing property | | | 1,253,178 | | | | 1,112,055 | |
Construction in progress and land held for development | | | 447,881 | | | | 244,390 | |
| | | | | | | | |
Net real estate | | | 1,701,059 | | | | 1,356,445 | |
Cash and cash equivalents | | | 53,512 | | | | 11,510 | |
Restricted cash | | | 134 | | | | 119 | |
Rents and other receivables | | | 1,078 | | | | 1,304 | |
Deferred rent | | | 39,052 | | | | 12,611 | |
Lease contracts above market value, net | | | 19,213 | | | | 22,078 | |
Deferred costs, net | | | 42,917 | | | | 45,863 | |
Prepaid expenses and other assets | | | 7,798 | | | | 4,225 | |
| | | | | | | | |
Total assets | | $ | 1,864,763 | | | $ | 1,454,155 | |
| | | | | | | | |
| LIABILITIES AND STOCKHOLDERS’ EQUITY | | | | | | | | |
Liabilities: | | | | | | | | |
Line of credit | | $ | 233,424 | | | $ | — | |
Mortgage notes payable | | | 433,395 | | | | 296,719 | |
Accounts payable and accrued liabilities | | | 13,257 | | | | 11,011 | |
Construction costs payable | | | 82,241 | | | | 28,070 | |
Dividend and distribution payable | | | — | | | | 10,044 | |
Lease contracts below market value, net | | | 38,434 | | | | 48,277 | |
Prepaid rents and other liabilities | | | 27,075 | | | | 12,359 | |
| | | | | | | | |
Total liabilities | | | 827,826 | | | | 406,480 | |
Minority interests - operating partnership | | | 484,768 | | | | 490,102 | |
Commitments and contingencies | | | — | | | | — | |
| | |
Stockholders’ equity: | | | | | | | | |
Preferred stock, par value $.001, 50,000,000 shares authorized, no shares issued or outstanding at December 31, 2008 and 2007 | | | — | | | | — | |
Common stock, par value $.001, 250,000,000 shares authorized, 35,495,257 shares issued and outstanding at December 31, 2008, and 35,453,833 shares issued and outstanding at December 31, 2007 | | | 35 | | | | 35 | |
Additional paid in capital | | | 650,125 | | | | 664,714 | |
Accumulated deficit | | | (80,224 | ) | | | (99,306 | ) |
Accumulated other comprehensive loss | | | (17,767 | ) | | | (7,870 | ) |
| | | | | | | | |
Total stockholders’ equity | | | 552,169 | | | | 557,573 | |
| | | | | | | | |
Total liabilities and stockholders’ equity | | $ | 1,864,763 | | | $ | 1,454,155 | |
| | | | | | | | |
-7-
DUPONT FABROS TECHNOLOGY, INC.
CONSOLIDATED STATEMENT OF CASH FLOWS
(in thousands)
| | | | |
| | | Year ended
December 31,
2008 | |
Cash flow from operating activities | | | | |
Net income | | $ | 19,082 | |
Adjustments to reconcile net income to net cash provided by operating activities | | | | |
Minority interests - operating partnership | | | 17,078 | |
Depreciation and amortization | | | 50,703 | |
Straight line rent | | | (26,441 | ) |
Amortization of loan costs | | | 1,782 | |
Amortization of lease contracts above and below market value | | | (6,978 | ) |
Compensation paid with Company common shares | | | 963 | |
Changes in operating assets and liabilities | | | | |
Restricted cash | | | (15 | ) |
Rents and other receivables | | | 226 | |
Deferred costs | | | (790 | ) |
Prepaid expenses and other assets | | | (2,809 | ) |
Accounts payable and accrued liabilities | | | 1,864 | |
Prepaid rents and other liabilities | | | 4,611 | |
| | | | |
Net cash provided by operating activities | | | 59,276 | |
| | | | |
Cash flow from investing activities | | | | |
Investments in real estate - development | | | (317,299 | ) |
Interest capitalized for real estate under development | | | (13,150 | ) |
Improvements to real estate | | | (3,701 | ) |
Additions to non-real estate property | | | (642 | ) |
| | | | |
Net cash used in investing activities | | | (334,792 | ) |
| | | | |
Cash flow from financing activities | | | | |
Line of credit: | | | | |
Proceeds | | | 233,700 | |
Repayments | | | (276 | ) |
Mortgage notes payable: | | | | |
Proceeds | | | 136,676 | |
IPO transaction costs | | | (87 | ) |
Payments of financing costs | | | (4,776 | ) |
Dividends and distributions: | | | | |
Common shares | | | (25,273 | ) |
Minority interests - operating partnership | | | (22,446 | ) |
| | | | |
Net cash provided by financing activities | | | 317,518 | |
| | | | |
Net increase in cash and cash equivalents | | | 42,002 | |
Cash and cash equivalents, beginning | | | 11,510 | |
| | | | |
Cash and cash equivalents, ending | | $ | 53,512 | |
| | | | |
Supplemental information: | | | | |
Cash paid for interest, net of amounts capitalized | | $ | 10,195 | |
| | | | |
Loan costs capitalized for real estate under development | | $ | 2,298 | |
| | | | |
Construction costs payable capitalized to real estate | | $ | 54,171 | |
| | | | |
-8-
DUPONT FABROS TECHNOLOGY, INC.
Stabilized Operating Properties
As of December 31, 2008
| | | | | | | | | | | | | | | | |
Property (1) | | Property Location | | Year Built/ Renovated | | Gross
Building
Area
(2) | | Raised
Square
Feet
(3) | | Critical
Load
MW
(4) | | %
Leased
(5) | | | Annualized
Base Rent
(in thousands)
(6) |
VA3 | | Reston, VA | | 2003 | | 256,000 | | 144,901 | | 13.0 | | 100 | % | | $ | 8,333 |
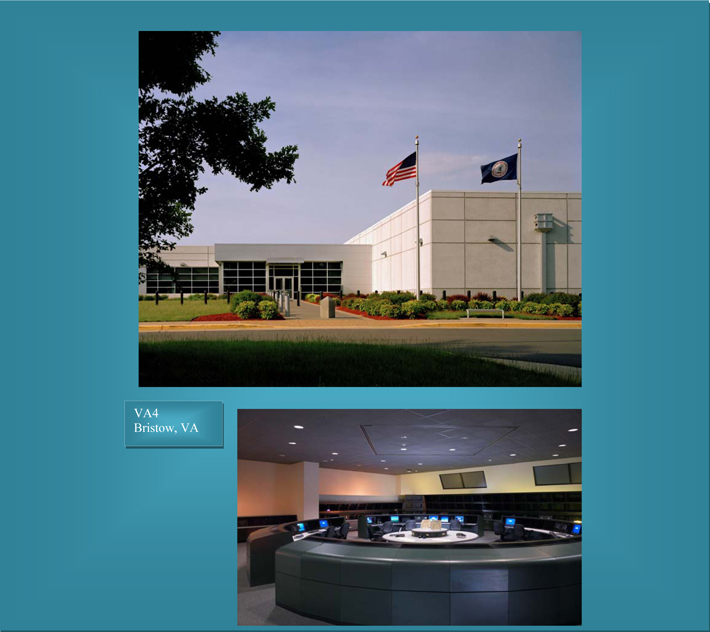
VA4 | | Bristow, VA | | 2005 | | 230,000 | | 90,000 | | 9.6 | | 100 | % | | $ | 16,095 |
ACC2 | | Ashburn, VA | | 2001/2005 | | 87,000 | | 53,397 | | 10.4 | | 100 | % | | $ | 11,154 |
ACC3 | | Ashburn, VA | | 2001/2006 | | 147,000 | | 79,600 | | 13.0 | | 100 | % | | $ | 18,076 |
ACC4 | | Ashburn, VA | | 2007 | | 307,000 | | 171,300 | | 36.4 | | 87.5 | % | | $ | 45,514 |
| | | | | | | | | | | | | | | | |
Totals | | | | | | 1,027,000 | | 539,198 | | 82.4 | | 94.5 | % | | $ | 99,172 |
| | | | | | | | | | | | | | | | |
| (1) | Stabilized operating properties are either 85% or more leased or are in service for 24 months or greater. |
| (2) | Gross building area is the entire building area, including raised square footage (the portion of gross building area where our tenants’ computer servers are located), tenant common areas, areas controlled by us (such as the mechanical, telecommunications and utility rooms) and, in some facilities, individual office and storage space leased on an as available basis to our tenants. |
| (3) | Raised square footage is that portion of gross building area where our tenants locate their computer servers. We consider raised square footage to be the net rentable square footage in each of our facilities. |
| (4) | Critical load (also referred to as IT load or load used by tenants’ servers or related equipment) is the power available for exclusive use by our tenants expressed in terms of megawatt, or MW, or kilowatt, or kW (1 MW is equal to 1,000 kW). |
| (5) | Percentage leased is expressed as a percentage of critical load that is subject to an executed lease. As of the date of this press release, we have executed one additional lease at ACC4, increasing the percentage leased for ACC4 to 93.8% and percentage leased for the stabilized operating properties to 97.3%. |
| (6) | Annualized base rent on a straight-lined basis for leases executed and/or amended as of January 1, 2009 over the non-cancellable terms of the respective leases and excludes approximately $7.0 million net amortization increase in revenue of above and below market leases. Annualized base rent on a cash basis for the 2009 calendar year is $89.5 million assuming no additional leasing or changes to existing leases. |
-9-
DUPONT FABROS TECHNOLOGY, INC.
Lease Expirations
As of December 31, 2008
The following table sets forth a summary schedule of lease expirations of our stabilized operating properties for each of the ten full calendar years beginning January 1, 2009. The information set forth in the table assumes that tenants exercise no renewal options.
| | | | | | | | | | | | | | | | | |
Year of
Lease Expiration | | Property | | Number
of
Leases
Expiring
(1) | | Raised
Square
Feet
Expiring
(2) | | % of
Net
Raised
Square
Feet | | | Total
kW
of
Expiring
Leases
(3) | | % of
Leased
kW | | | % of
Annualized
Rent | |
2009 | | VA3 | | 1 | | 27,268 | | 5.2 | % | | 2,600 | | 3.3 | % | | 1.2 | % |
2010 | | VA3 | | 1 | | 66,661 | | 12.9 | % | | 5,688 | | 7.3 | % | | 4.1 | % |
2011 | | VA3 | | 1 | | 14,320 | | 2.7 | % | | 1,300 | | 1.7 | % | | 1.0 | % |
2012 | | VA4 | | 1 | | 15,000 | | 2.9 | % | | 1,600 | | 2.1 | % | | 2.6 | % |
2013 | | VA3 | | 1 | | 26,943 | | 5.2 | % | | 2,600 | | 3.3 | % | | 1.3 | % |
| | VA4 | | 1 | | 15,000 | | 2.9 | % | | 1,600 | | 2.1 | % | | 2.6 | % |
2014 | | VA3 | | 1 | | 9,709 | | 1.9 | % | | 813 | | 1.0 | % | | 0.8 | % |
| | VA4 | | 1 | | 15,000 | | 2.9 | % | | 1,600 | | 2.1 | % | | 2.7 | % |
| | ACC4 | | 1 | | 2,700 | | 0.5 | % | | 569 | | 0.7 | % | | 0.8 | % |
2015 | | ACC2 | | 1 | | 53,397 | | 10.3 | % | | 10,400 | | 13.4 | % | | 11.3 | % |
| | VA4 | | 1 | | 15,000 | | 2.9 | % | | 1,600 | | 2.1 | % | | 2.7 | % |
2016 | | ACC3 | | 1 | | 39,800 | | 7.7 | % | | 6,500 | | 8.3 | % | | 9.5 | % |
| | VA4 | | 1 | | 15,000 | | 2.9 | % | | 1,600 | | 2.1 | % | | 2.8 | % |
2017 | | ACC3 | | 1 | | 23,600 | | 4.6 | % | | 3,900 | | 5.0 | % | | 5.3 | % |
| | VA4 | | 1 | | 15,000 | | 2.9 | % | | 1,600 | | 2.1 | % | | 2.8 | % |
| | ACC4 | | 3 | | 32,200 | | 6.2 | % | | 6,824 | | 8.7 | % | | 9.7 | % |
2018 | | ACC3 | | 1 | | 16,200 | | 3.1 | % | | 2,600 | | 3.3 | % | | 3.5 | % |
| | ACC4 | | 3 | | 59,100 | | 11.4 | % | | 12,513 | | 16.1 | % | | 18.0 | % |
After 2018 | | ACC3/ACC4 | | 4 | | 56,325 | | 10.9 | % | | 11,941 | | 15.3 | % | | 17.3 | % |
| | | | | | | | | | | | | | | | | |
Total | | | | 26 | | 518,223 | | 100 | % | | 77,848 | | 100 | % | | 100 | % |
| | | | | | | | | | | | | | | | | |
| (1) | The stabilized operating properties have 13 tenants with 16 separate leases and 26 different lease expiration dates. |
| (2) | Raised square footage is that portion of gross building area where our tenants locate their computer servers. We consider raised square footage to be the net rentable square footage in each of our facilities. |
| (3) | One megawatt is equal to 1,000 kW. |
-10-
DUPONT FABROS TECHNOLOGY, INC.
Development Projects
As of December 31, 2008
($ in thousands)
| | | | | | | | | | | | | | |
Property | | Property Location | | Gross
Building
Area(1) | | Raised
Square
Feet(2) | | Critical
Load
MW(3) | | Estimated
Total Cost (4) | | Construction
in Progress &
Land Held for
Development
(5) |
Projects Temporarily Suspended (6) | | | | | | | | | | | | |
| | | | | | |
ACC5 Phase I (7) | | Ashburn, VA | | 150,000 | | 85,600 | | 18.2 | | $ | 155,000 -$165,000 | | $ | 126,099 |
NJ1 Phase I | | Piscataway, NJ | | 150,000 | | 85,600 | | 18.2 | | $ | 200,000 -$215,000 | | | 126,966 |
SC1 Phase I | | Santa Clara, CA | | 150,000 | | 85,600 | | 18.2 | | $ | 240,000 -$280,000 | | | 86,653 |
| | | | | | | | | | | | | | |
| | | | 450,000 | | 256,800 | | 54.6 | | $ | 595,000 -$660,000 | | | 339,718 |
| | | | | |
Future Development Projects | | | | | | | | | | | | |
| | | | | | |
CH1 Phase II | | Elk Grove Village, IL | | 200,000 | | 89,917 | | 18.2 | | | * | | | |
ACC5 Phase II | | Ashburn, VA | | 150,000 | | 85,600 | | 18.2 | | | * | | | |
NJ1 Phase II | | Piscataway, NJ | | 150,000 | | 85,600 | | 18.2 | | | * | | | |
SC1 Phase II | | Santa Clara, CA | | 150,000 | | 85,600 | | 18.2 | | | * | | | |
SC2 Phase I/II | | Santa Clara, CA | | 300,000 | | 171,200 | | 36.4 | | | * | | | |
ACC6 Phase I/II | | Ashburn, VA | | 240,000 | | 155,000 | | 31.2 | | | * | | | |
ACC7 | | Ashburn, VA | | 100,000 | | 50,000 | | 10.4 | | | * | | | |
| | | | | | | | | | | | | | |
| | | | 1,290,000 | | 722,917 | | 150.8 | | | | | | 108,163 |
| | | | | | | | | | | | | | |
Subtotal | | | | 1,740,000 | | 979,717 | | 205.4 | | | | | | 447,881 |
| | | | | |
Completed not Stabilized | | | | | | | | | | | | |
| | | | | | |
CH1 Phase I (8) | | Elk Grove Village, IL | | 285,000 | | 121,223 | | 18.2 | | | | | | 189,783 |
| | | | | | | | | | | | | | |
Total | | | | 2,025,000 | | 1,100,940 | | 223.6 | | | | | $ | 637,664 |
| | | | | | | | | | | | | | |
| * | Development costs have not yet been estimated. |
| (1) | Gross building area is the entire building area, including raised square footage (the portion of gross building area where our tenants’ computer servers are located), tenant common areas, areas controlled by us (such as the mechanical, telecommunications and utility rooms) and, in some facilities, individual office and storage space leased on an as available basis to our tenants. |
| (2) | Raised square footage is that portion of gross building area where our tenants locate their computer servers. We consider raised square footage to be the net rentable square footage in each of our facilities. |
| (3) | Critical load (also referred to as IT load or load used by tenants’ servers or related equipment) is the power available for exclusive use by our tenants expressed in terms of MW or kW (1 MW is equal to 1,000 kW). |
| (4) | Includes estimated capitalization for construction and development, including closing costs, capitalized interest and capitalized operating carrying costs, as applicable, upon completion. |
| (5) | Amount capitalized as of December 31, 2008. |
| (6) | Construction temporarily suspended in Q4 2008. All estimated commitments were accrued and included in Construction costs payable on the Consolidated Balance Sheets as of December 31, 2008. |
| (7) | ACC5 Phase I is 57.3% pre-leased as of the date of this press release, and the Company resumed development. |
| (8) | CH1 Phase I is 9.5% leased as of the date of this press release. |
-11-
DUPONT FABROS TECHNOLOGY, INC.
Debt Summary as of December 31, 2008
($ in thousands)
| | | | | | | | | | | | |
| | | Amounts | | | % of Total | | | Rates (1) | | | Maturities
(years) |
Safari Term Loan | | $ | 200,000 | | | 30.0 | % | | 6.5 | % (2) | | 2.6 |
CH1 Construction Loan | | | 133,395 | (3) | | 20.0 | % | | 3.2 | % | | 1.0 |
ACC4 Term Loan | | | 100,000 | (3) | | 15.0 | % | | 4.8 | % | | 2.8 |
Line of Credit | | | 233,424 | | | 35.0 | % | | 1.8 | % | | 1.6 |
| | | | | | | | | | | | |
Total | | $ | 666,819 | | | 100.0 | % | | 3.9 | % | | 2.0 |
| | | | | | | | | | | | |
| Note: | The Company capitalized interest of $3.8 million and $15.4 million during the quarter and year ended December 31, 2008, respectively. |
| (1) | Rate as of December 31, 2008. |
| (2) | Rate is fixed by an interest rate swap. |
| (3) | On February 10, 2009, the CH1 construction loan was paid off and the ACC4 term loan increased to $250 million. |
Debt Maturity Schedule as of December 31, 2008
($ in thousands)
| | | | | | | | | |
Year | | Amounts | | % of Total | | | Rates (4) | |
2009(1) | | $ | 133,395 | | 20.0 | % | | 3.2 | % |
2010(2) | | | 233,424 | | 35.0 | % | | 1.8 | % |
2011(3) | | | 300,000 | | 45.0 | % | | 5.9 | %(5) |
| | | | | | | | | |
Total | | $ | 666,819 | | 100.0 | % | | 3.9 | % |
| | | | | | | | | |
| (1) | This loan matures on December 20, 2009 subject to a one-year extension option exercisable by the Company upon satisfaction of certain customary covenants. The loan was paid off on February 10, 2009. |
| (2) | Amount outstanding on the Company’s $275 million floating rate revolving facility which matures on August 7, 2010, subject to a one-year extension option exercisable by the Company upon satisfaction of certain customary conditions. A borrowing base covenant based on the initial appraised values of our Safari properties limits the amount available to $244 million. |
| (3) | $200 million Safari term loan matures on August 7, 2011 with no extension option. $100 million ACC4 term loan matures on October 24, 2011 and includes a one-year extension option exercisable by the Company upon satisfaction of certain customary conditions. ACC4 term loan increased to $250 million on February 10, 2009. |
| (4) | Rate as of December 31, 2008. |
| (5) | Rate on $200 million Safari term loan is fixed at 6.5% by an interest rate swap. |
Selected Financial Covenants
| | | | | | |
| | | 12/31/08 | | | 9/30/08 | |
Total Debt to Gross Asset Value (not to exceed 65%) | | 32 | % | | 28 | % |
Fixed Charge Coverage ratio (not less than 1.45) | | 4.08 | | | 5.36 | |
Borrowing Base Debt Service Coverage Ratio (not less than 1.35) | | 1.92 | | | 2.03 | |
Secured Recourse Debt to Gross Asset Value (not to exceed 15%) | | 10 | % | | 5 | % |
These selected covenants relate to DuPont Fabros Technology, LP and/or its related subsidiaries. DuPont Fabros Technology, Inc. is the general partner of DuPont Fabros Technology, LP.
-12-
DUPONT FABROS TECHNOLOGY, INC.
Capital Structure as of December 31, 2008
(in thousands except per share data)
| | | | | | | | | | | | |
Mortgage notes payable | | | | | | | | $ | 433,395 | | | |
Line of Credit | | | | | | | | | 233,424 | | | |
| | | | | | | | | | | | |
Total Debt | | | | | | | | | 666,819 | | 82.9 | % |
Common Shares | | 53 | % | | | 35,495 | | | | | | |
Operating Partnership (“OP”) Units | | 47 | % | | | 31,162 | | | | | | |
| | | | | | | | | | | | |
Total Shares and OP Units | | 100 | % | | | 66,657 | | | | | | |
Common Share Price at December 31, 2008 | | | | | $ | 2.07 | | | | | | |
| | | | | | | | | | | | |
Total Equity | | | | | | | | | 137,981 | | 17.1 | % |
| | | | | | | | | | | | |
Total Market Capitalization | | | | | | | | $ | 804,800 | | 100.0 | % |
| | | | | | | | | | | | |
Common Share and OP Unit
Weighted Average Amounts Outstanding
(in thousands)
| | | | |
| | | Q4 2008 | | YTD 2008 |
Weighted Average Amounts Outstanding for EPS Purposes: | | | | |
Common Shares – basic | | 35,442 | | 35,429 |
Shares issued from assumed conversion of | | | | |
- Restricted Shares | | — | | — |
| | | | |
Total Common Shares and OP Units - diluted | | 35,442 | | 35,429 |
| | | | |
Weighted Average Amounts Outstanding for FFO and AFFO Purposes: | | | | |
Common Shares – basic | | 35,442 | | 35,429 |
OP Units – basic | | 31,162 | | 31,162 |
| | | | |
Total Common Shares and OP Units | | 66,604 | | 66,591 |
Share issued from assumed conversion of | | | | |
- Restricted Shares | | — | | — |
| | | | |
Total Common Shares and OP Units - diluted | | 66,604 | | 66,591 |
| | | | |
Period Ending Amounts Outstanding: | | | | |
Common Shares | | 35,495 | | |
OP Units | | 31,162 | | |
| | | | |
Total Common Shares and OP Units | | 66,657 | | |
| | | | |
-13-
DUPONT FABROS TECHNOLOGY, INC.
2009 Guidance
The earnings guidance/projections provided below are based on current expectations and are forward-looking.
| | | | | | |
| | | Expected Q1 2009
per share | | Expected 2009
per share |
| | |
Earnings per share and unit – diluted | | $ | 0.01 to $0.05 | | $ | 0.13 to $0.27 |
| | |
Depreciation and amortization, net | | | 0.20 | | | 0.83 to 0.85 |
| | |
FFO per share and unit – diluted (1) | | $ | 0.21 to $0.25 | | $ | 0.96 to $1.12 |
2009 Debt Assumptions
| | | | |
| |
Weighted average debt outstanding | | $ | 700 to $725 million | |
| |
Weighted average interest rate | | | 5.0% to 5.4 | % |
| |
Total interest costs | | $ | 35.0 to $39.0 million | |
| |
Total amortization of deferred financing costs | | $ | 7.0 to $7.5 million | |
Interest expense capitalized | | $ | (4.0) to $(4.5) million | |
Deferred financing costs amortization capitalized | | $ | (0.8) to $(1.0) million | |
| | | | |
| |
Total interest expense after capitalization | | $ | 37.2 to $41.0 million | |
| | | | |
Note: Debt guidance assumes no new debt issued from the date of this release.
2009 Other Guidance Assumptions
| | | |
ACC5 placed in service date | | | Q3 2009 |
| |
Other revenues | | $ | 6 to $8 million |
| |
Straight-line revenue | | $ | 20 to $25 million |
| |
Below market lease amortization, net of above market lease amortization | | $ | 7 million |
| |
General and administrative expense | | $ | 11 to $14 million |
| |
Estimated required REIT dividend distribution payout | | $ | 0.17 to $0.23 per share |
| |
Weighted average common shares and OP units - diluted | | | 67.6 million |
(1) | Funds from operations, or FFO, is used by industry analysts and investors as a supplemental operating performance measure for REITs. We calculate FFO in accordance with the definition that was adopted by the Board of Governors of the National Association of Real Estate Investment Trusts, or NAREIT. FFO, as defined by NAREIT, represents net income determined in accordance with GAAP, excluding extraordinary items as defined under GAAP and gains or losses from sales of previously depreciated operating real estate assets, plus specified non-cash items, such as real estate asset depreciation and amortization, and after adjustments for unconsolidated partnerships and joint ventures. |
We use FFO as a supplemental performance measure because, in excluding real estate related depreciation and amortization and gains and losses from property dispositions, it provides a performance measure that, when compared year over year, captures trends in occupancy rates, rental rates and operating expenses. We also believe that, as a widely recognized measure of the performance of equity REITs, FFO will be used by investors as a basis to compare our operating performance with that of other REITs. However, because FFO excludes real estate related depreciation and amortization and captures neither the changes in the value of our properties that result from use or market conditions nor the level of capital expenditures and leasing commissions necessary to maintain the operating performance of our properties, all of which have real economic effects and could materially impact our results from operations, the utility of FFO as a measure of our performance is limited.
While FFO is a relevant and widely used measure of operating performance of equity REITs, other equity REITs may use different methodologies for calculating FFO and, accordingly, FFO as disclosed by such other REITs may not be comparable to our FFO. Therefore, we believe that in order to facilitate a clear understanding of our historical operating results, FFO should be examined in conjunction with net income as presented in the consolidated statements of operations. FFO should not be considered as an alternative to net income or to cash flow from operating activities (each as computed in accordance with GAAP) or as an indicator of our liquidity, nor is it indicative of funds available to fund our cash needs, including our ability to pay dividends or make distributions.
-14-