Year-end results For the year ended 31 December 2015 26 February 2016 Exhibit 99.2 |
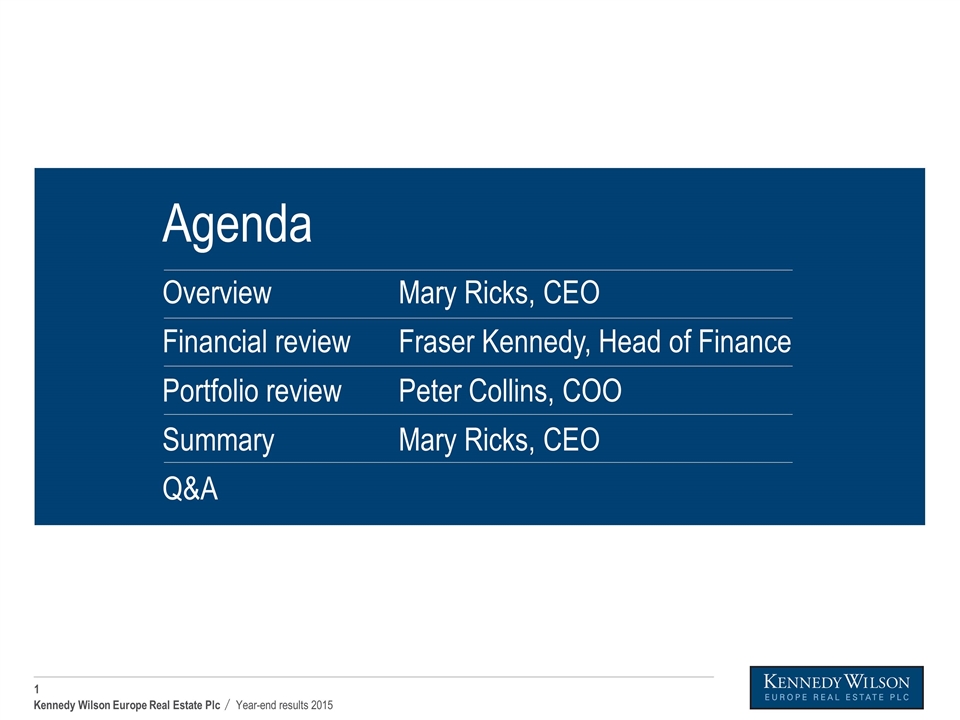
Overview Financial review Portfolio review Summary Q&A Mary Ricks, CEO Fraser Kennedy, Head of Finance Peter Collins, COO Mary Ricks, CEO Agenda

Overview Mary Ricks
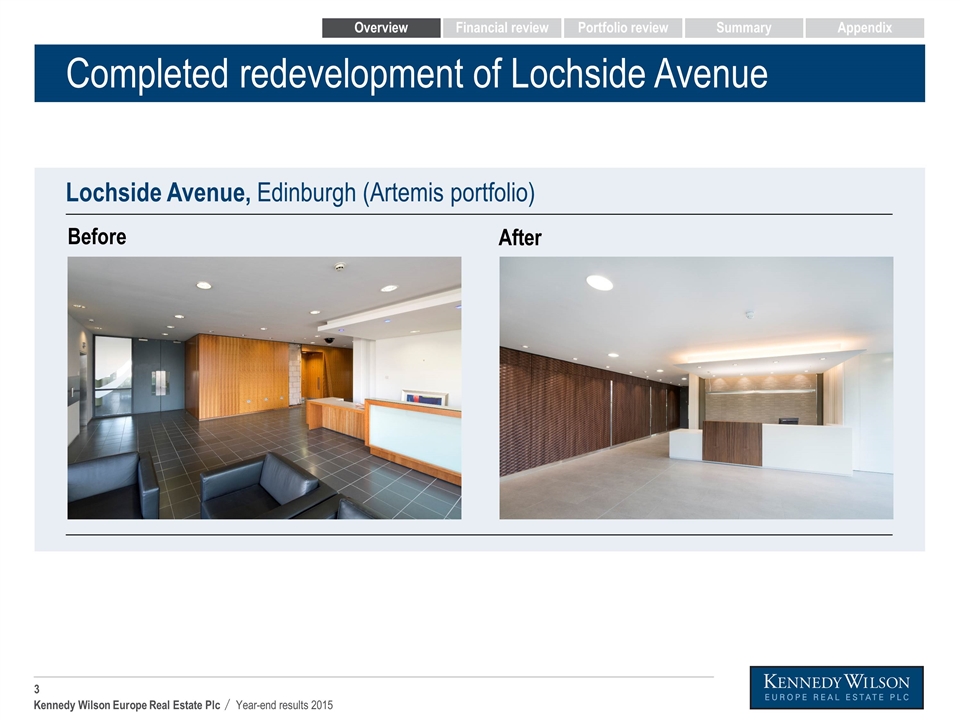
Completed redevelopment of Lochside Avenue Lochside Avenue, Edinburgh (Artemis portfolio) Before After Overview Financial review Portfolio review Summary Appendix
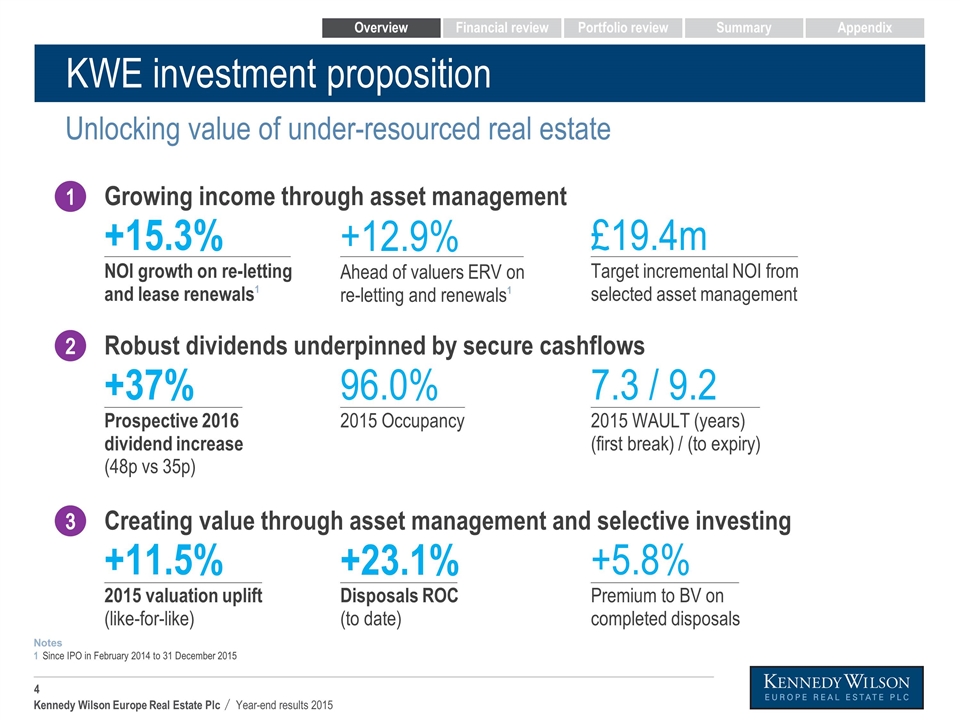
KWE investment proposition Unlocking value of under-resourced real estate Growing income through asset management +15.3% NOI growth on re-letting and lease renewals1 Creating value through asset management and selective investing +11.5% 2015 valuation uplift (like-for-like) 7.3 / 9.2 2015 WAULT (years) (first break) / (to expiry) +37% Prospective 2016 dividend increase (48p vs 35p) +23.1% Disposals ROC (to date) +12.9% Ahead of valuers ERV on re-letting and renewals1 £19.4m Target incremental NOI from selected asset management 96.0% 2015 Occupancy +5.8% Premium to BV on completed disposals Robust dividends underpinned by secure cashflows 1 2 3 Overview Financial review Portfolio review Summary Appendix Since IPO in February 2014 to 31 December 2015 Notes 1
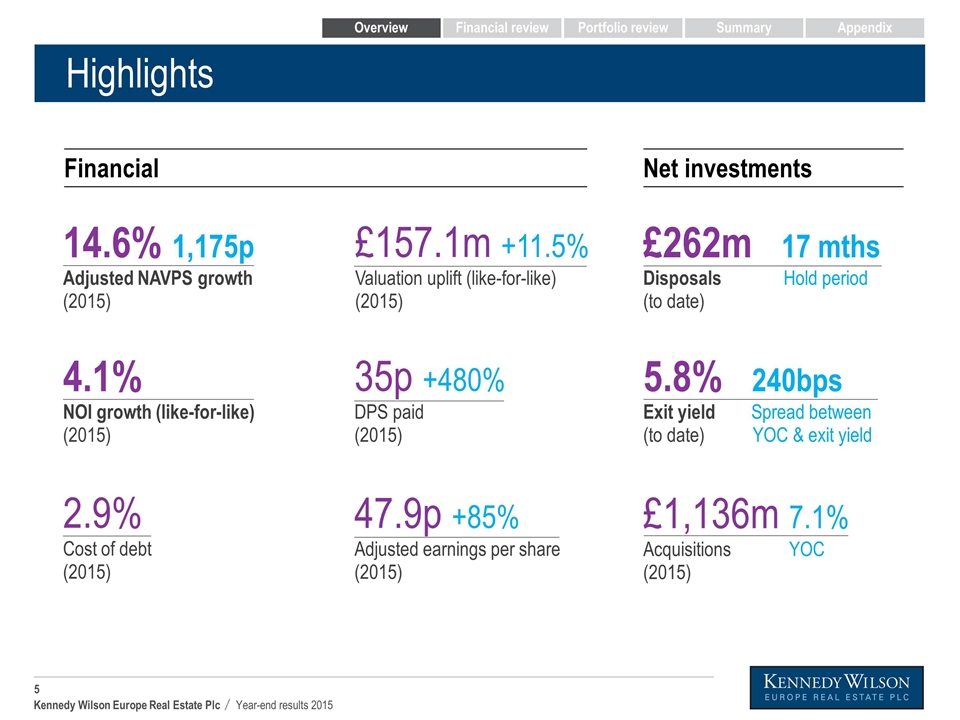
Highlights Financial Net investments £1,136m 7.1% Acquisitions YOC (2015) 35p +480% DPS paid (2015) 2.9% Cost of debt (2015) 47.9p +85% Adjusted earnings per share (2015) 14.6% 1,175p Adjusted NAVPS growth (2015) 4.1% NOI growth (like-for-like) (2015) £157.1m +11.5% Valuation uplift (like-for-like) (2015) £262m 17 mths Disposals Hold period (to date) 5.8% 240bps Exit yield Spread between (to date) YOC & exit yield Overview Financial review Portfolio review Summary Appendix
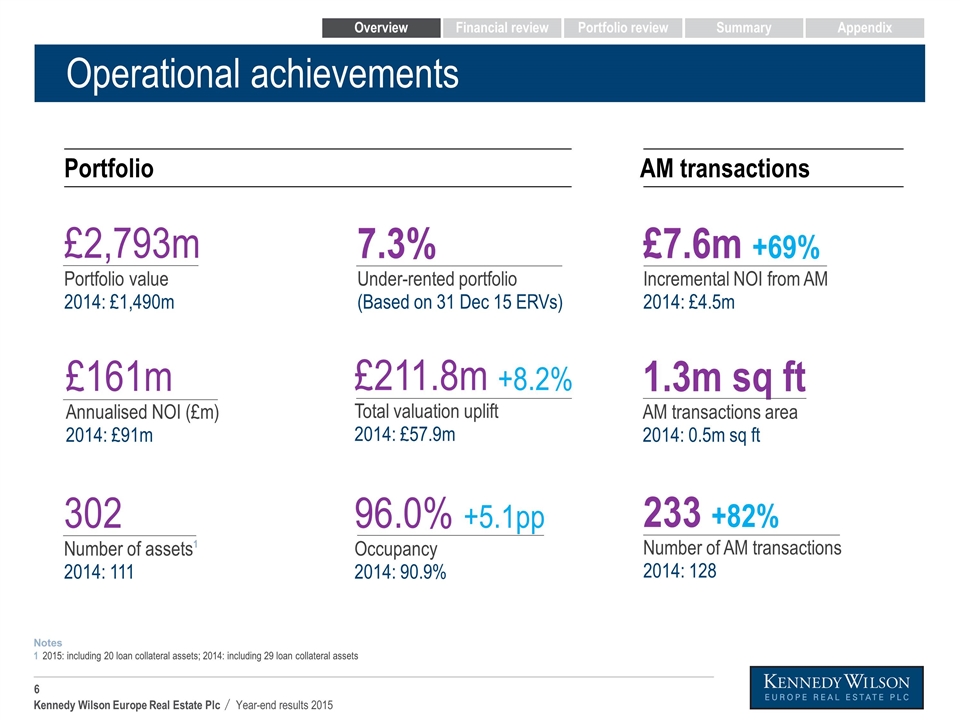
Operational achievements 2015: including 20 loan collateral assets; 2014: including 29 loan collateral assets Notes 1 Portfolio AM transactions £7.6m +69% Incremental NOI from AM 2014: £4.5m 96.0% +5.1pp Occupancy 2014: 90.9% 1.3m sq ft AM transactions area 2014: 0.5m sq ft 233 +82% Number of AM transactions 2014: 128 £2,793m Portfolio value 2014: £1,490m £161m Annualised NOI (£m) 2014: £91m 302 Number of assets1 2014: 111 £211.8m +8.2% Total valuation uplift 2014: £57.9m Overview Financial review Portfolio review Summary Appendix 7.3% Under-rented portfolio (Based on 31 Dec 15 ERVs)
Finance review Fraser Kennedy
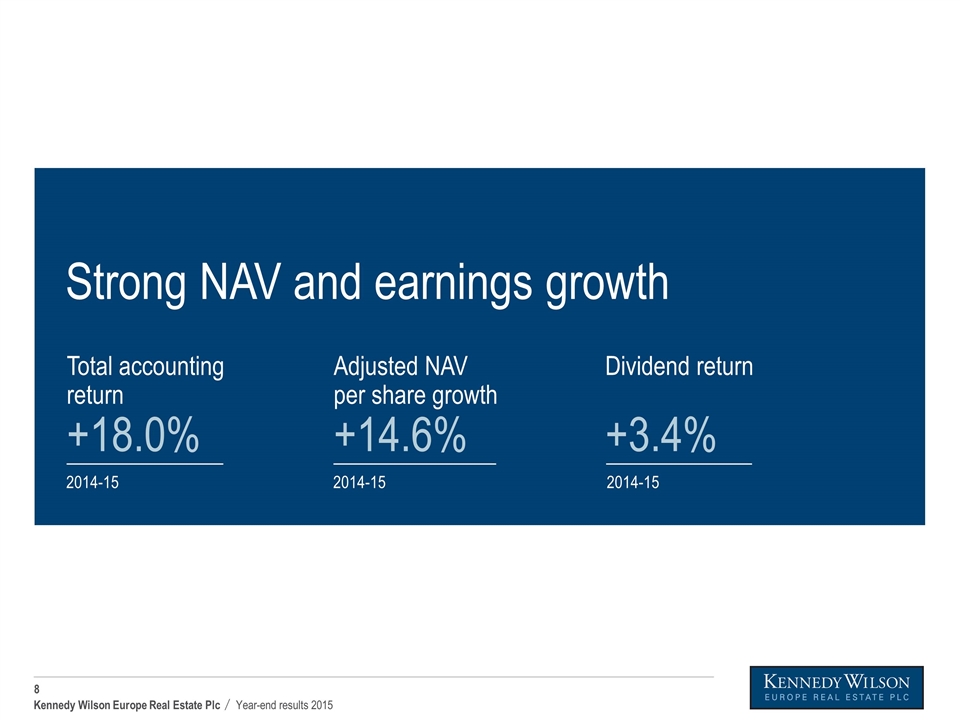
Strong NAV and earnings growth Adjusted NAV per share growth +14.6% 2014-15 Total accounting return +18.0% 2014-15 Dividend return +3.4% 2014-15
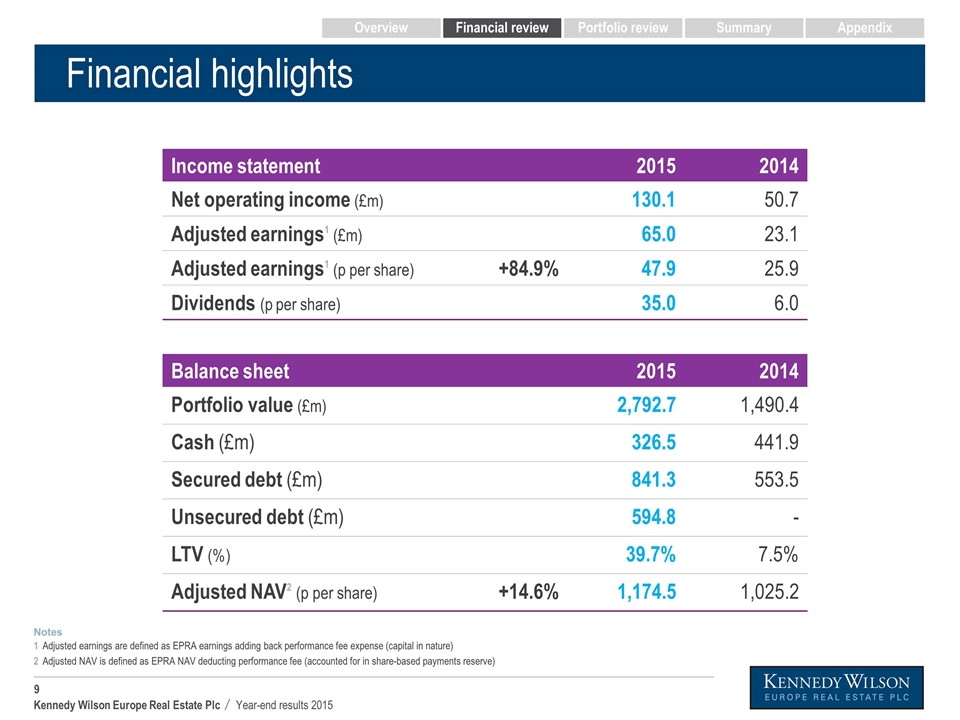
Financial highlights Overview Financial review Portfolio review Summary Appendix Adjusted earnings are defined as EPRA earnings adding back performance fee expense (capital in nature) Adjusted NAV is defined as EPRA NAV deducting performance fee (accounted for in share-based payments reserve) 1 2 Notes Income statement 2015 2014 Net operating income (£m) 130.1 50.7 Adjusted earnings1 (£m) 65.0 23.1 Adjusted earnings1 (p per share) +84.9% 47.9 25.9 Dividends (p per share) 35.0 6.0 Balance sheet 2015 2014 Portfolio value (£m) 2,792.7 1,490.4 Cash (£m) 326.5 441.9 Secured debt (£m) 841.3 553.5 Unsecured debt (£m) 594.8 - LTV (%) 39.7% 7.5% Adjusted NAV2 (p per share) +14.6% 1,174.5 1,025.2
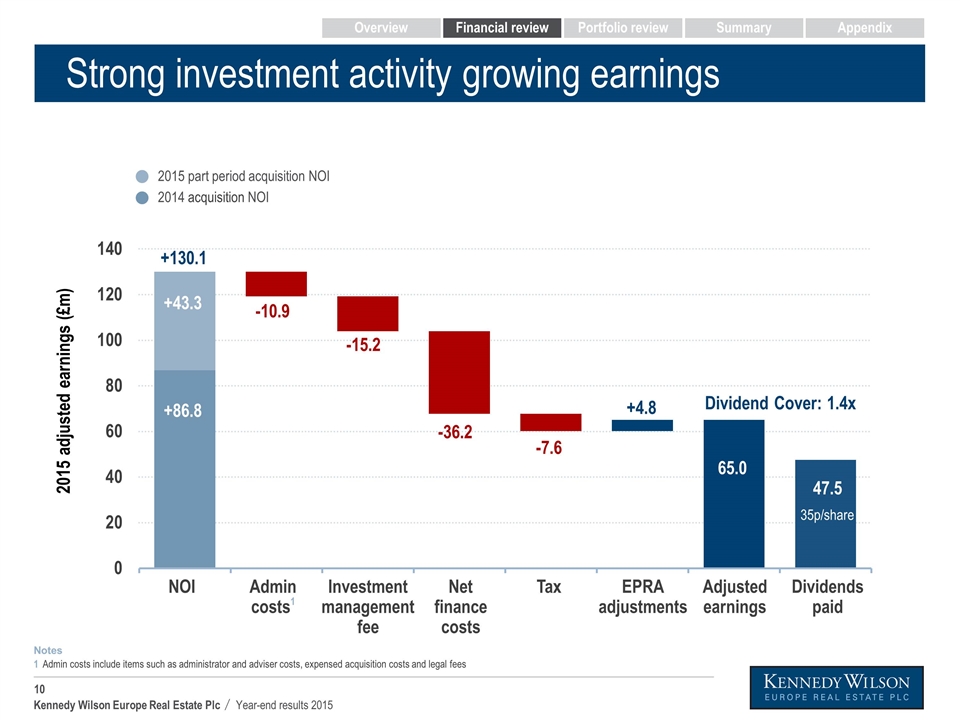
Strong investment activity growing earnings 65.0 +130.1 -10.9 -15.2 -36.2 -7.6 47.5 NOI Admin costs1 Investment management fee Dividends paid Adjusted earnings Net finance costs Tax Dividend Cover: 1.4x 2015 adjusted earnings (£m) 35p/share +43.3 +86.8 2015 part period acquisition NOI 2014 acquisition NOI +4.8 EPRA adjustments Admin costs include items such as administrator and adviser costs, expensed acquisition costs and legal fees 1 Notes Overview Financial review Portfolio review Summary Appendix
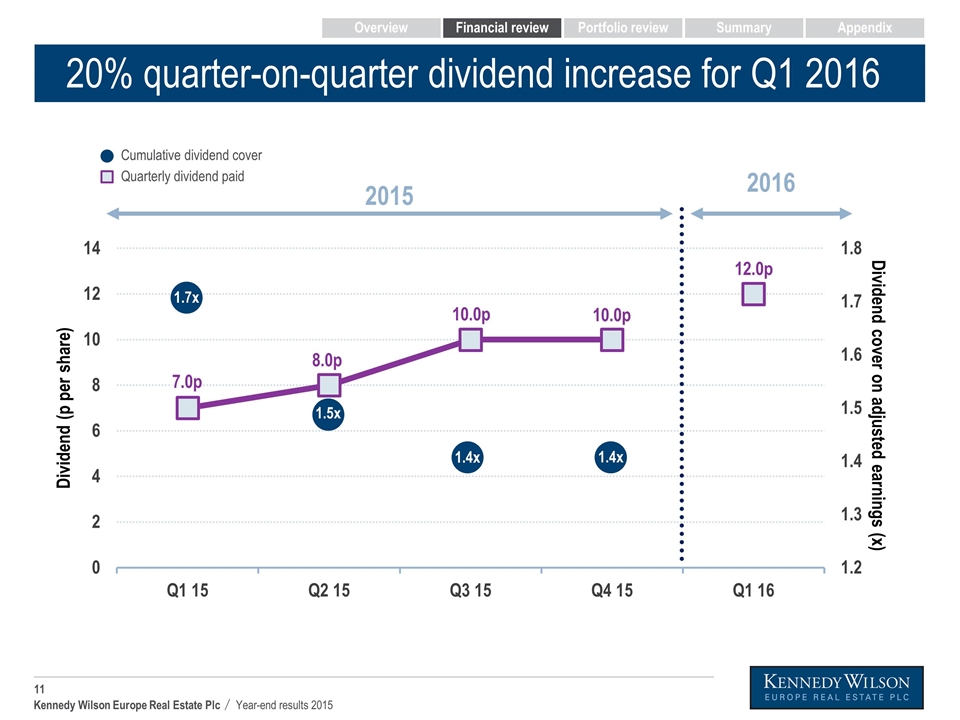
20% quarter-on-quarter dividend increase for Q1 2016 Cumulative dividend cover Quarterly dividend paid 12.0p 10.0p 8.0p 7.0p 10.0p Dividend (p per share) 1.5x 1.4x 1.4x 1.7x 2016 2015 Dividend cover on adjusted earnings (x) Overview Financial review Portfolio review Summary Appendix
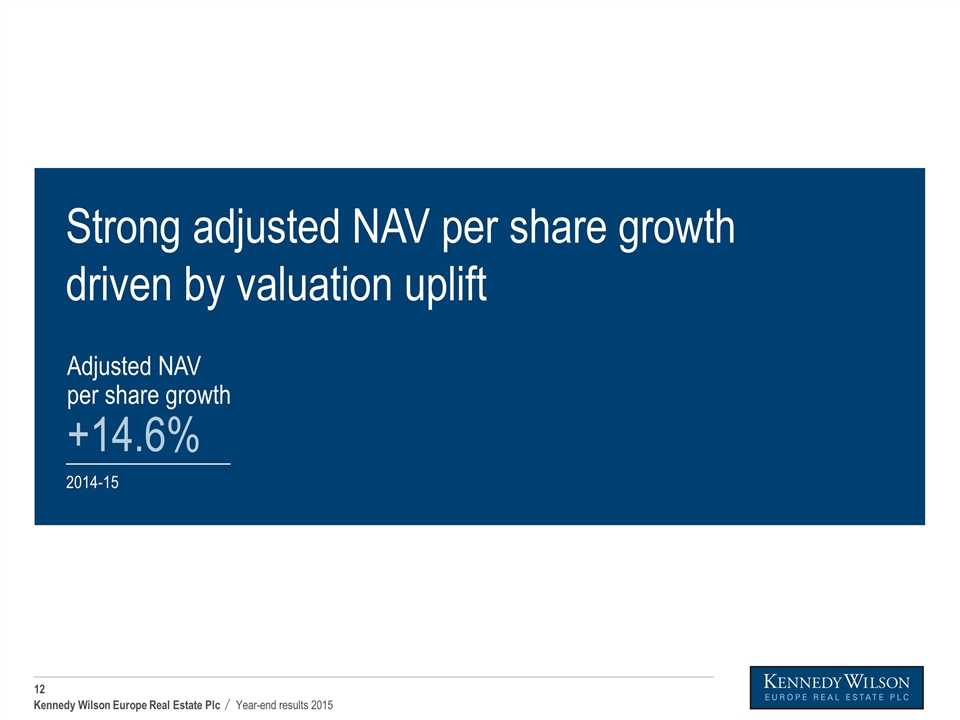
Strong adjusted NAV per share growth driven by valuation uplift Adjusted NAV per share growth +14.6% 2014-15
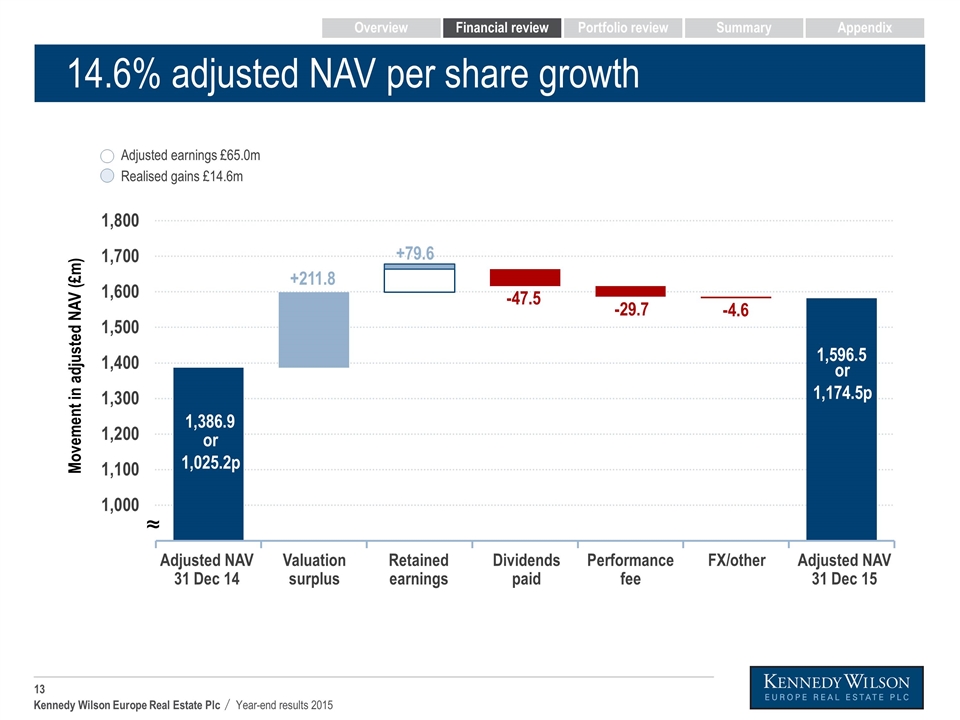
14.6% adjusted NAV per share growth Valuation surplus Retained earnings Dividends paid FX/other Adjusted NAV 31 Dec 15 ≈ Adjusted NAV 31 Dec 14 Performance fee Movement in adjusted NAV (£m) or 1,025.2p Adjusted earnings £65.0m Realised gains £14.6m Overview Financial review Portfolio review Summary Appendix
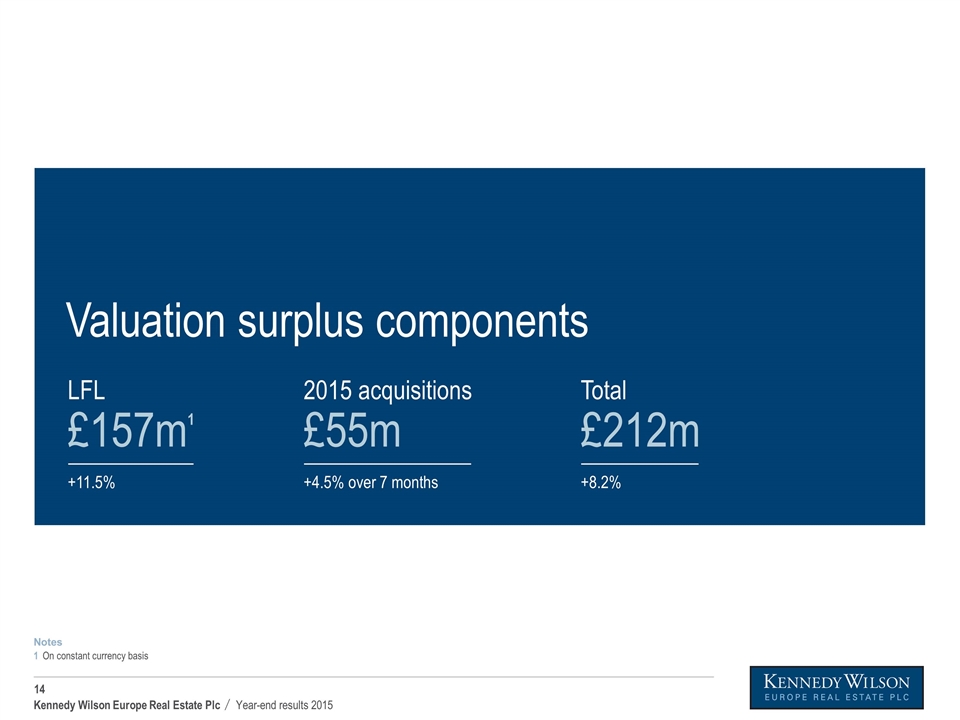
Valuation surplus components LFL £157m1 +11.5% 2015 acquisitions £55m +4.5% over 7 months Total £212m +8.2% On constant currency basis 1 Notes
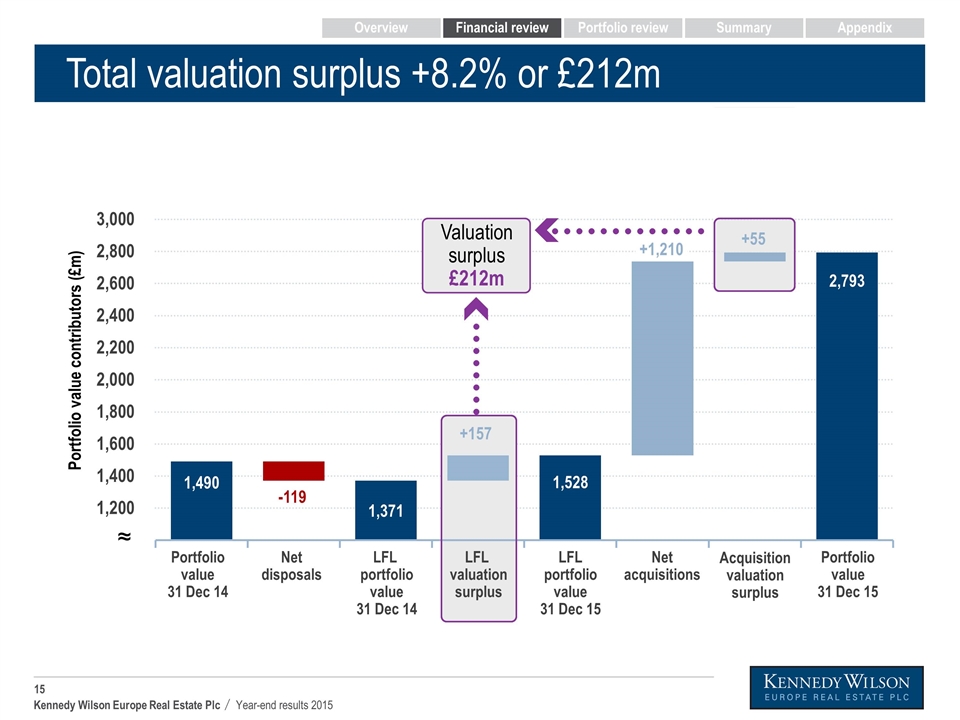
LFL valuation surplus Total valuation surplus +8.2% or £212m Portfolio value 31 Dec 14 Net disposals LFL portfolio value 31 Dec 14 LFL portfolio value 31 Dec 15 Net acquisitions Portfolio value 31 Dec 15 Acquisition valuation surplus Portfolio value contributors (£m) Overview Financial review Portfolio review Summary Appendix ≈ Valuation surplus £212m
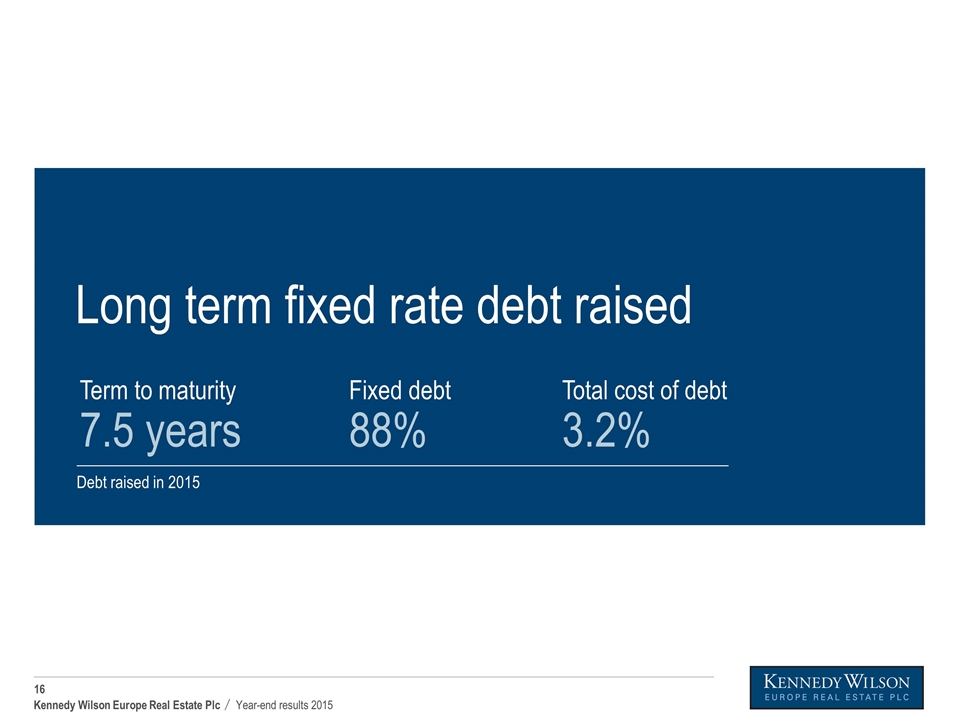
Long term fixed rate debt raised Total cost of debt 3.2% Term to maturity 7.5 years Debt raised in 2015 Fixed debt 88%
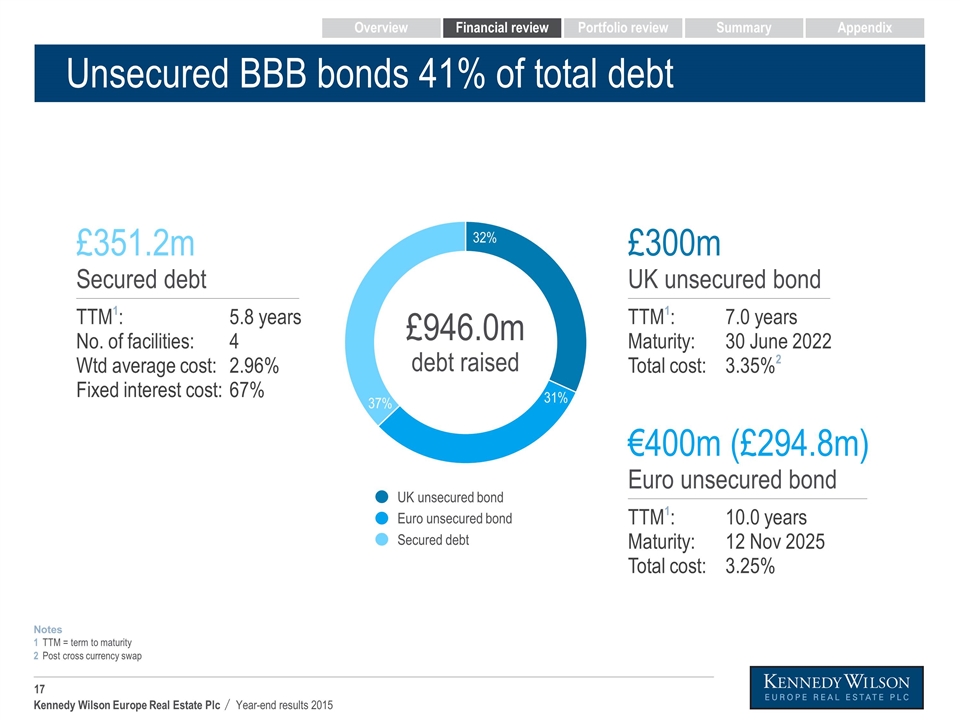
Unsecured BBB bonds 41% of total debt 32% 31% 37% £946.0m debt raised UK unsecured bond Euro unsecured bond Secured debt Post cross currency swap 2 TTM = term to maturity Notes 1 £351.2m Secured debt TTM1: No. of facilities: Wtd average cost: Fixed interest cost: 5.8 years 4 2.96% 67% €400m (£294.8m) Euro unsecured bond TTM1: Maturity: Total cost: 10.0 years 12 Nov 2025 3.25% £300m UK unsecured bond TTM1: Maturity: Total cost: 7.0 years 30 June 2022 3.35%2 Overview Financial review Portfolio review Summary Appendix
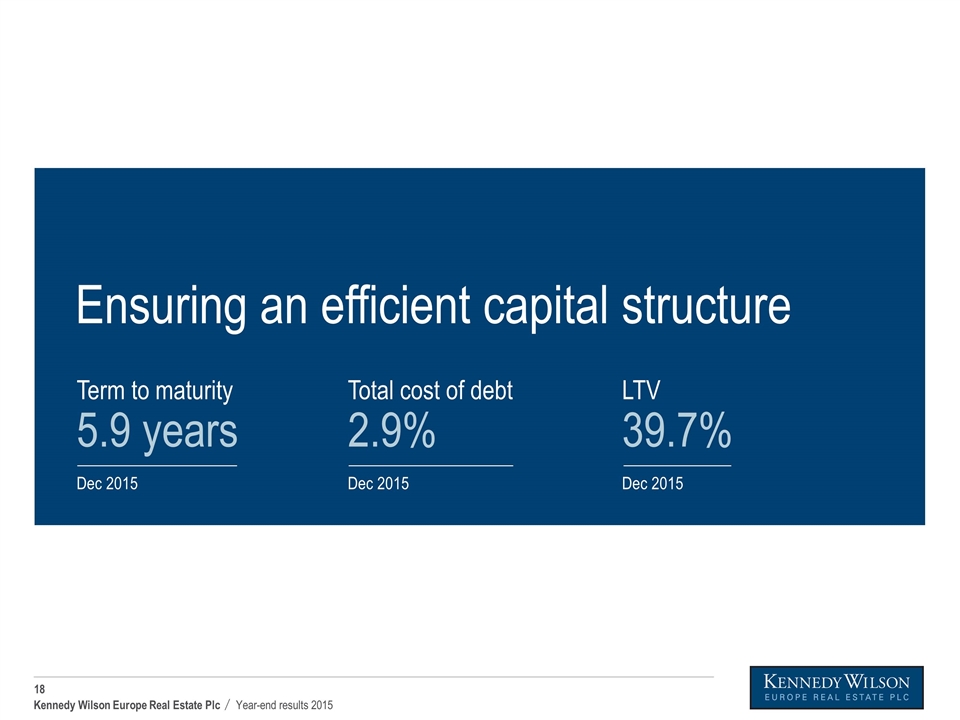
Dec 2015 Term to maturity 5.9 years Dec 2015 Total cost of debt 2.9% Dec 2015 LTV 39.7% Ensuring an efficient capital structure
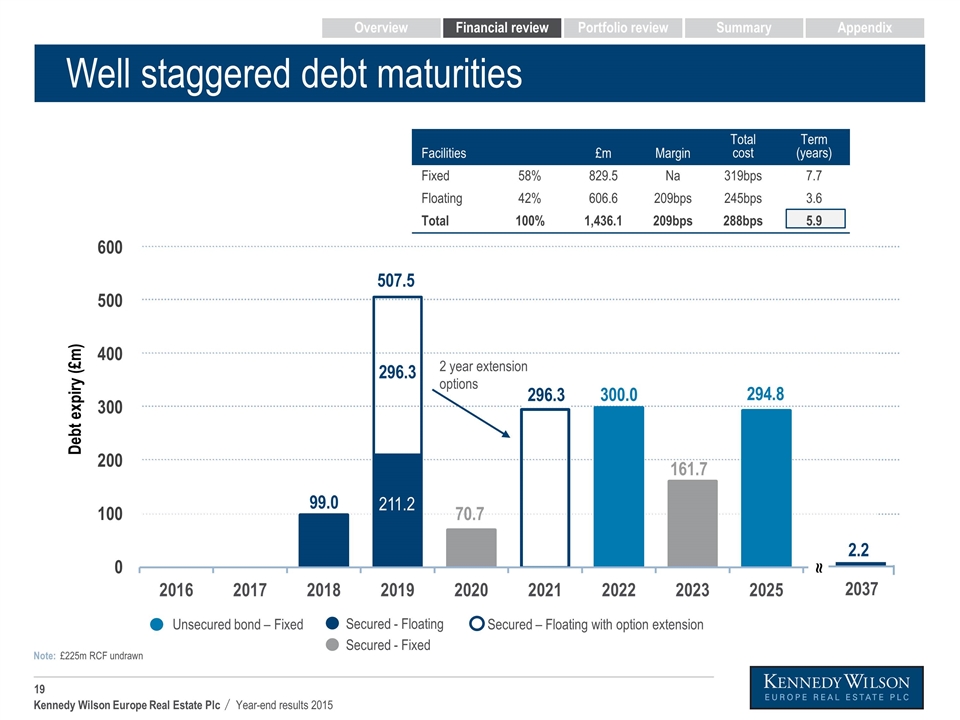
Well staggered debt maturities Unsecured bond – Fixed Secured - Floating Secured - Fixed Debt expiry (£m) 161.7 Secured – Floating with option extension 2 year extension options 211.2 ≈ 2.2 2037 Facilities £m Margin Total cost Term (years) Fixed 58% 829.5 Na 319bps 7.7 Floating 42% 606.6 209bps 245bps 3.6 Total 100% 1,436.1 209bps 288bps 5.9 296.3 £225m RCF undrawn Note: Overview Financial review Portfolio review Summary Appendix
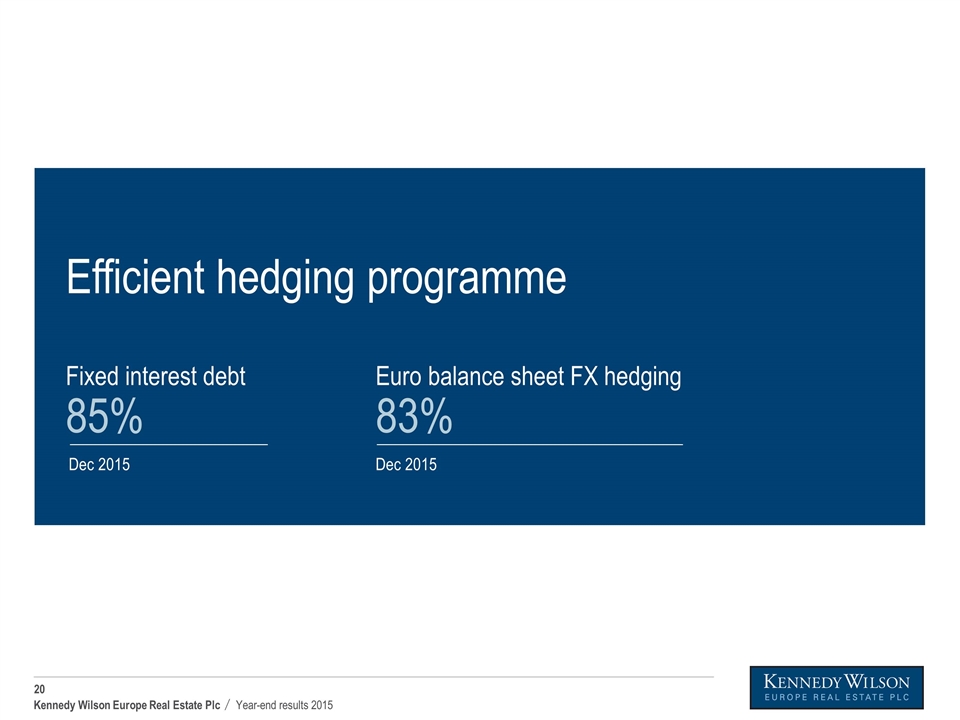
Dec 2015 Efficient hedging programme Dec 2015 Fixed interest debt 85% Euro balance sheet FX hedging 83%
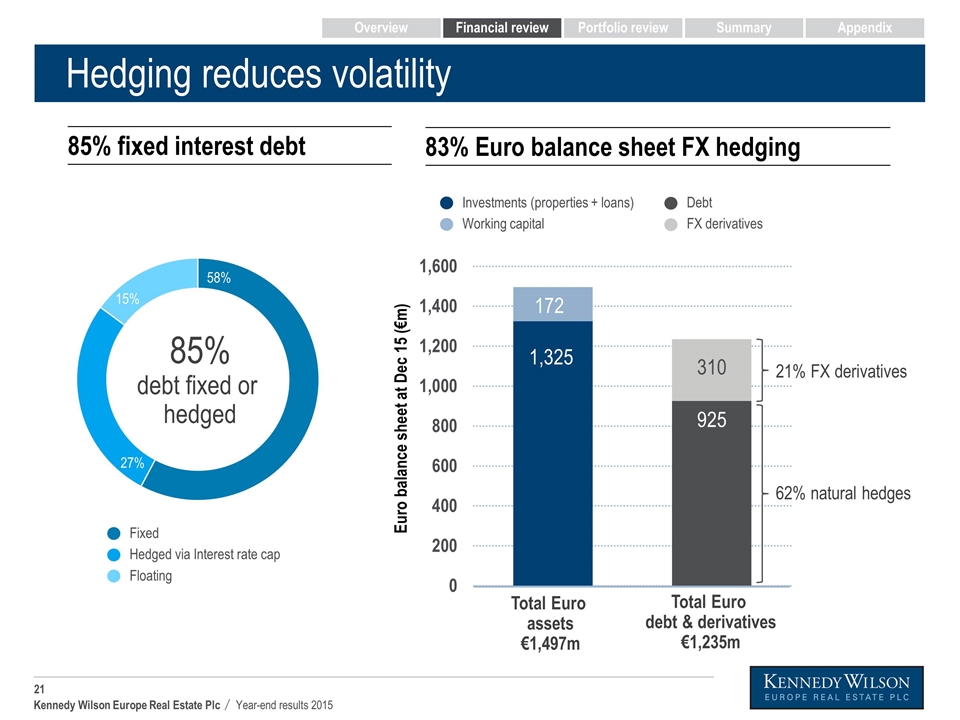
Hedging reduces volatility Total Euro assets €1,497m Total Euro debt & derivatives €1,235m Investments (properties + loans) Working capital 62% natural hedges 21% FX derivatives Euro balance sheet at Dec 15 (€m) 58% 27% 15% 85% debt fixed or hedged Fixed Hedged via Interest rate cap Floating 85% fixed interest debt 83% Euro balance sheet FX hedging Debt FX derivatives Overview Financial review Portfolio review Summary Appendix
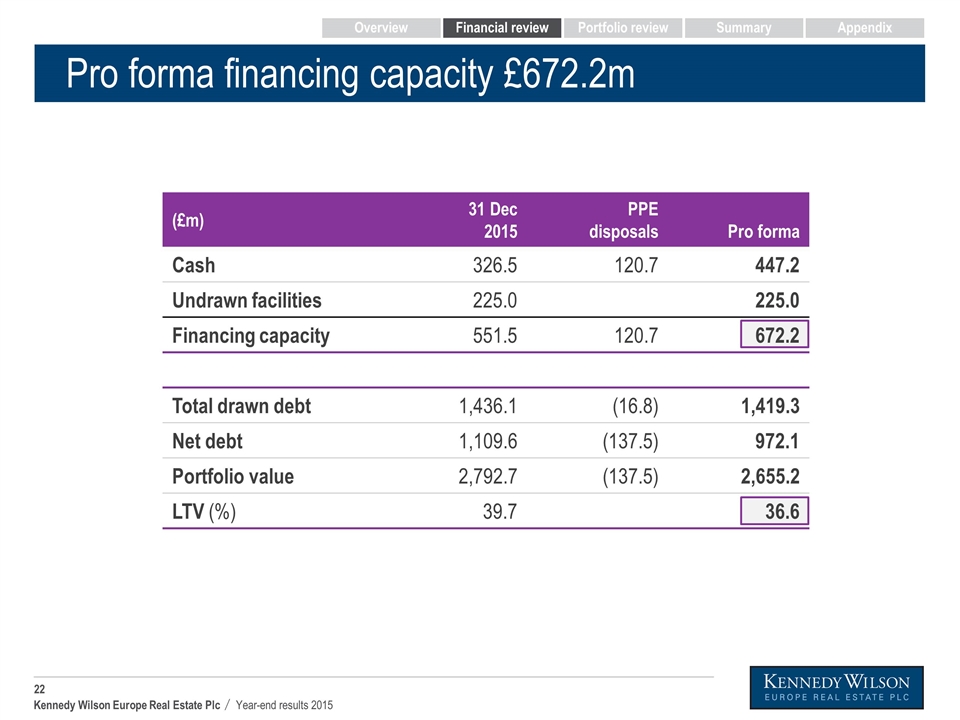
Pro forma financing capacity £672.2m (£m) 31 Dec 2015 PPE disposals Pro forma Cash 326.5 120.7 447.2 Undrawn facilities 225.0 225.0 Financing capacity 551.5 120.7 672.2 Total drawn debt 1,436.1 (16.8) 1,419.3 Net debt 1,109.6 (137.5) 972.1 Portfolio value 2,792.7 (137.5) 2,655.2 LTV (%) 39.7 36.6 Overview Financial review Portfolio review Summary Appendix
Portfolio review Peter Collins
Four target markets Four target sectors
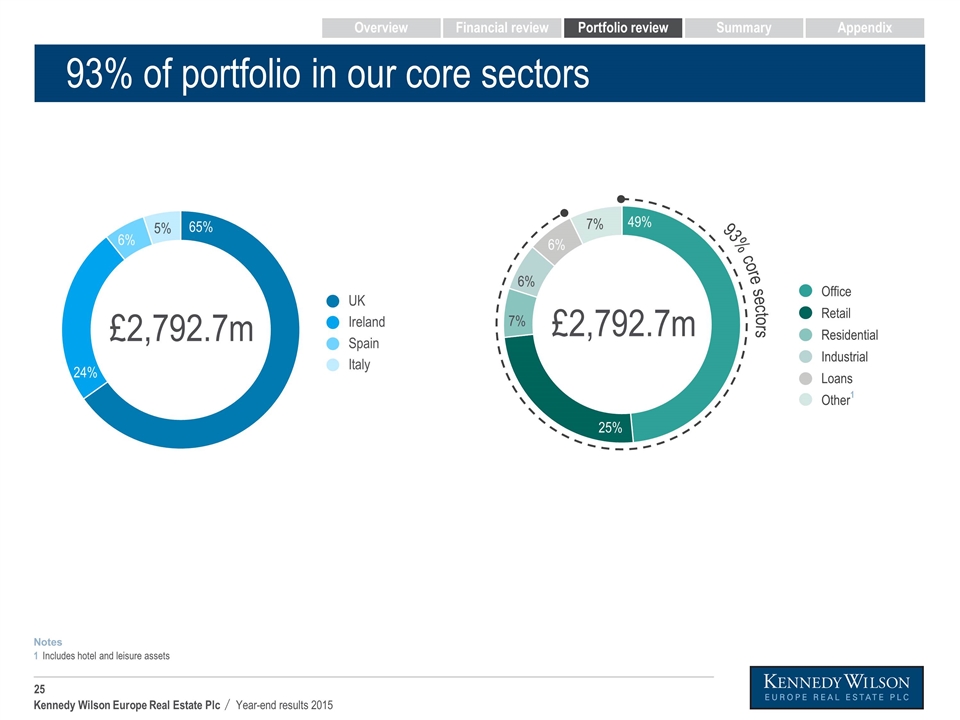
93% of portfolio in our core sectors 65% 24% 5% 6% £2,792.7m 49% 7% 25% 6% 7% 6% 93% core sectors £2,792.7m Overview Financial review Portfolio review Summary Appendix Office Retail Residential Industrial UK Ireland Spain Italy Other1 Loans Includes hotel and leisure assets 1 Notes
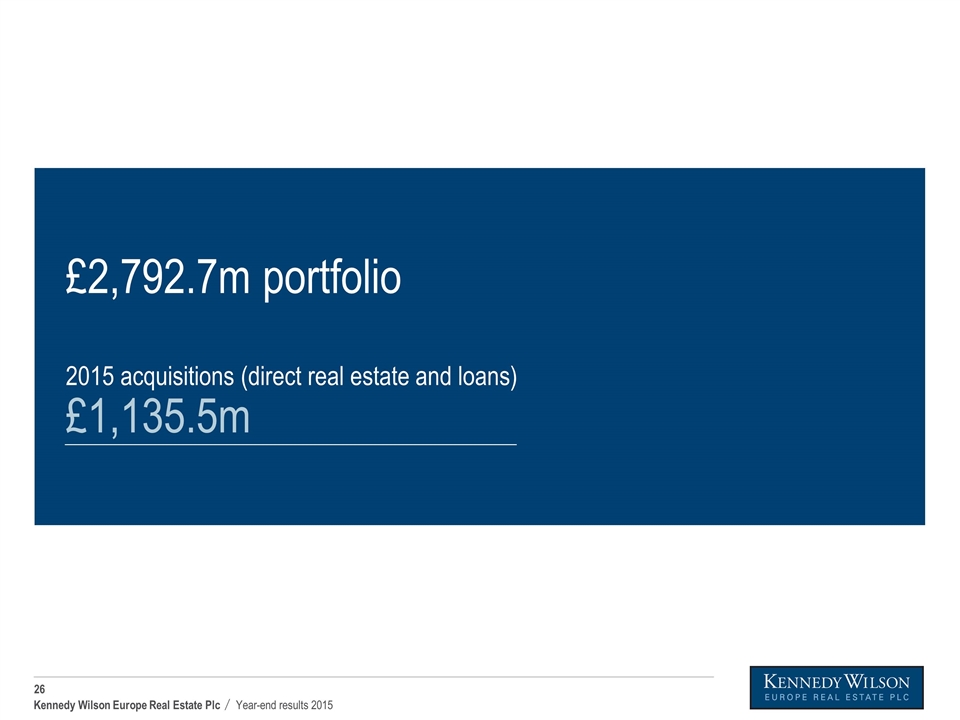
£2,792.7m portfolio 2015 acquisitions (direct real estate and loans) £1,135.5m
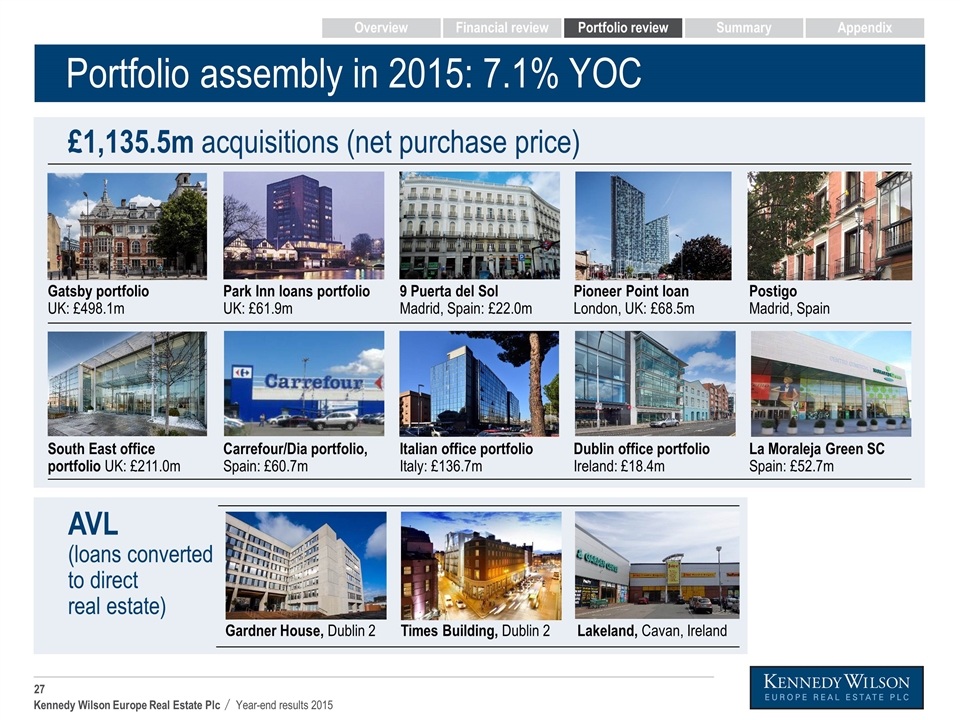
Portfolio assembly in 2015: 7.1% YOC Gatsby portfolio UK: £498.1m Park Inn loans portfolio UK: £61.9m 9 Puerta del Sol Madrid, Spain: £22.0m Pioneer Point loan London, UK: £68.5m Postigo Madrid, Spain South East office portfolio UK: £211.0m Carrefour/Dia portfolio, Spain: £60.7m Italian office portfolio Italy: £136.7m Dublin office portfolio Ireland: £18.4m La Moraleja Green SC Spain: £52.7m £1,135.5m acquisitions (net purchase price) Gardner House, Dublin 2 Times Building, Dublin 2 Lakeland, Cavan, Ireland AVL (loans converted to direct real estate) Overview Financial review Portfolio review Summary Appendix
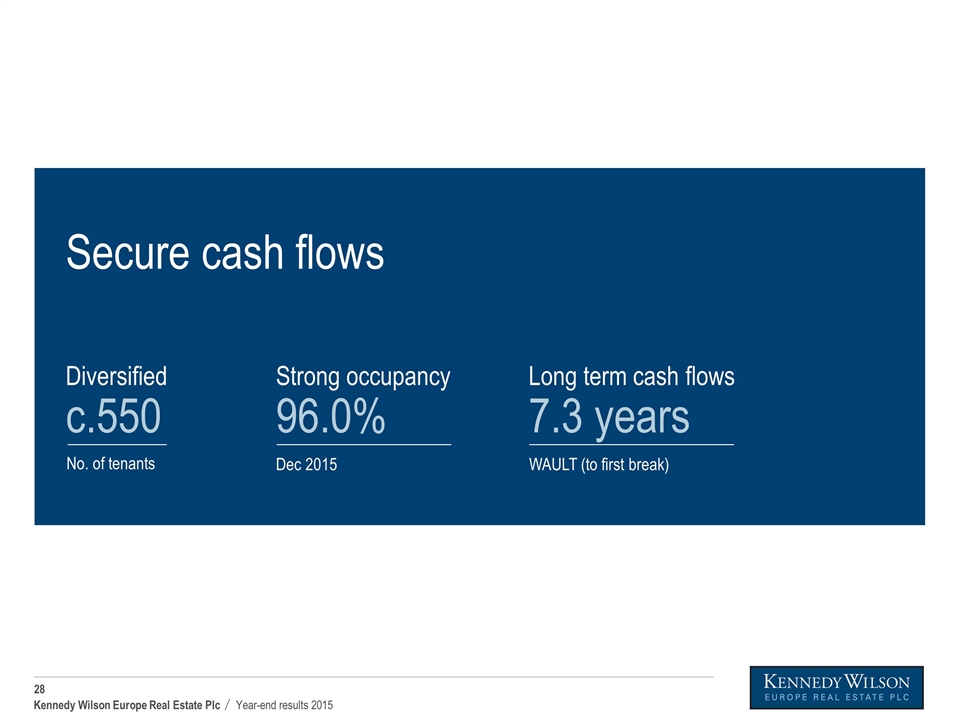
Secure cash flows Diversified c.550 Long term cash flows 7.3 years Strong occupancy 96.0% Dec 2015 WAULT (to first break) No. of tenants
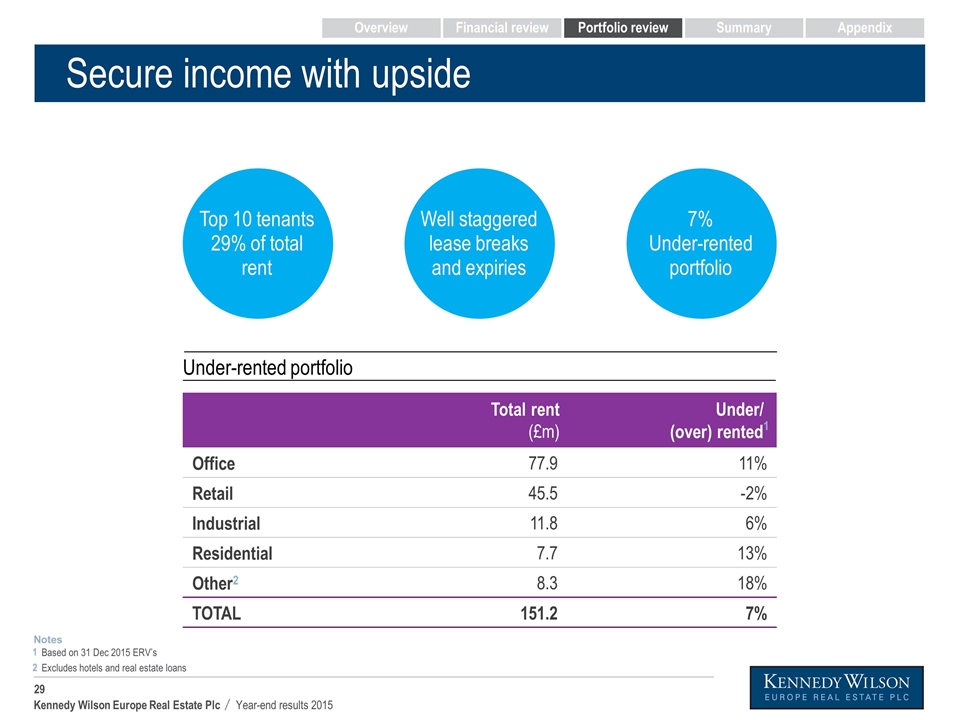
Secure income with upside Under-rented portfolio Top 10 tenants 29% of total rent Well staggered lease breaks and expiries 7% Under-rented portfolio Total rent (£m) Under/ (over) rented1 Office 77.9 11% Retail 45.5 -2% Industrial 11.8 6% Residential 7.7 13% Other2 8.3 18% TOTAL 151.2 7% Based on 31 Dec 2015 ERV’s Excludes hotels and real estate loans Notes 2 1 Overview Financial review Portfolio review Summary Appendix
Over next 2 years NOI progression from asset management Target incremental NOI £19.4m
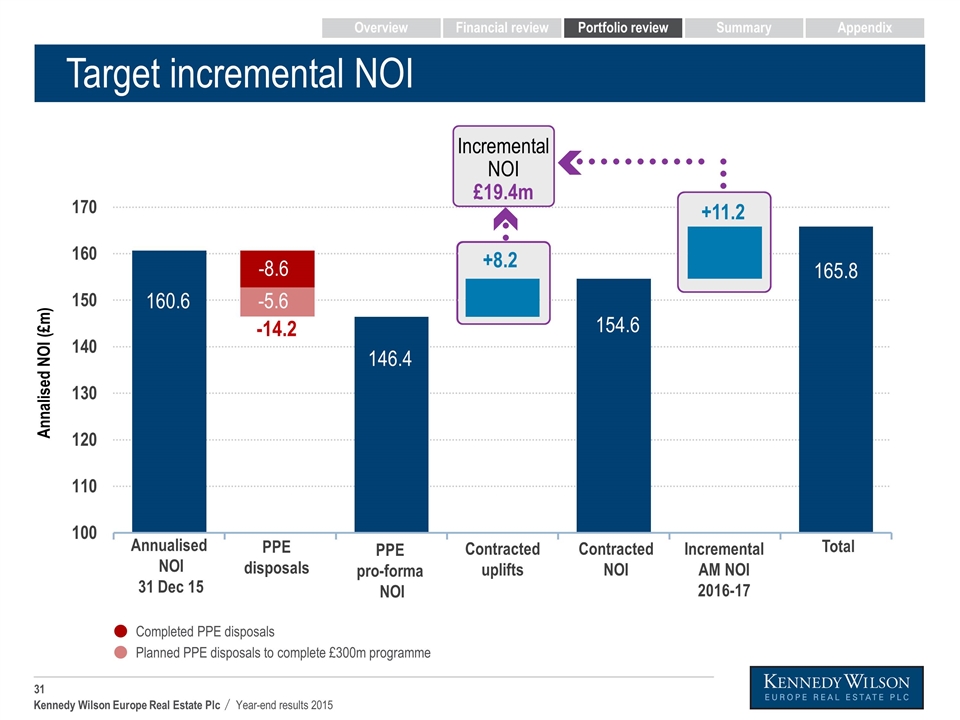
Target incremental NOI Overview Contracted NOI Contracted uplifts Incremental AM NOI 2016-17 Annualised NOI 31 Dec 15 PPE disposals Total PPE pro-forma NOI Completed PPE disposals Planned PPE disposals to complete £300m programme Annalised NOI (£m) -5.6 Overview Financial review Portfolio review Summary Appendix +11.2 +8.2 Incremental NOI £19.4m
Over next 2 years Selected asset management NOI drivers Target incremental NOI £11.2m
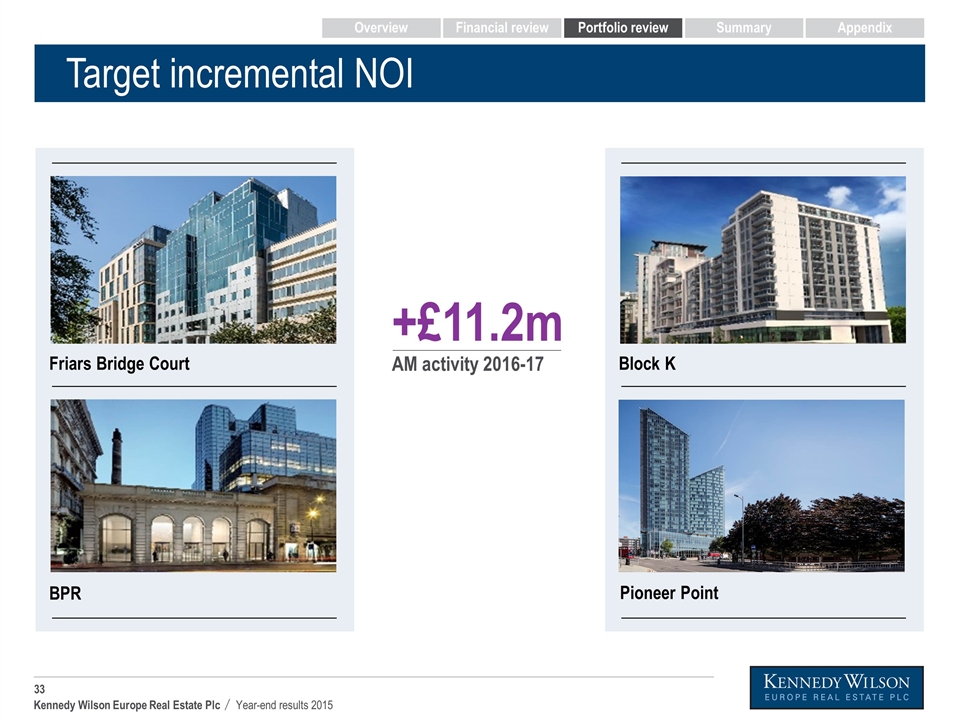
Target incremental NOI Overview Pioneer Point Friars Bridge Court BPR Block K +£11.2m AM activity 2016-17 Overview Financial review Portfolio review Summary Appendix
90% of LFL uplift Dublin, Central London & South East delivered
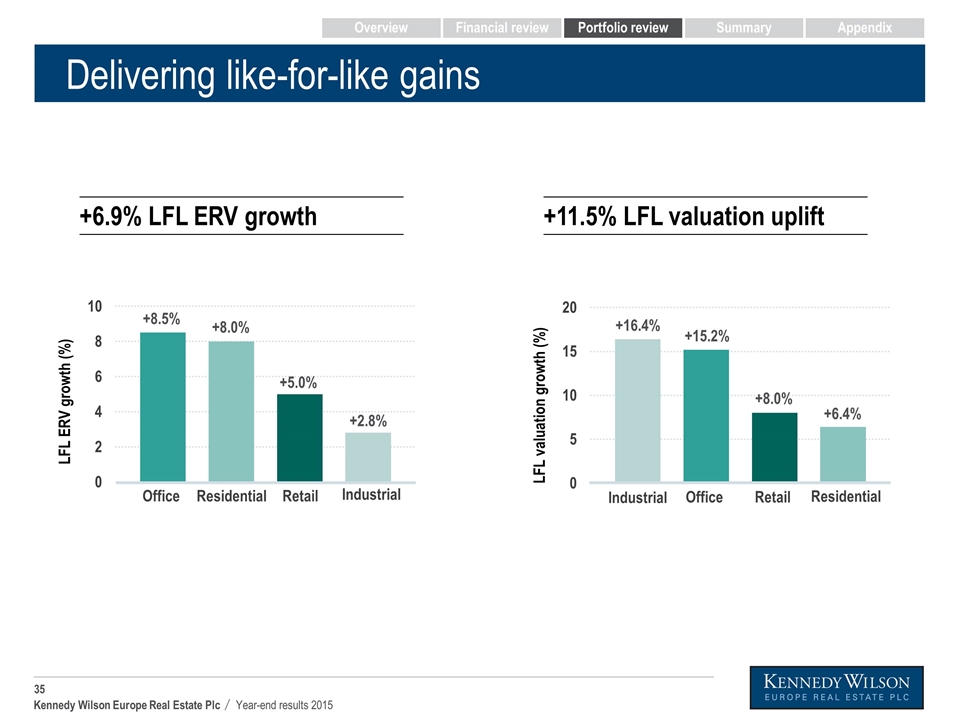
Delivering like-for-like gains LFL valuation growth (%) Office Retail Industrial Residential +8.0% +16.4% +15.2% +6.4% LFL ERV growth (%) Residential Retail Office Industrial +5.0% +8.5% +8.0% +2.8% +11.5% LFL valuation uplift +6.9% LFL ERV growth Office Retail Residential Industrial Other1 Loans Overview Financial review Portfolio review Summary Appendix
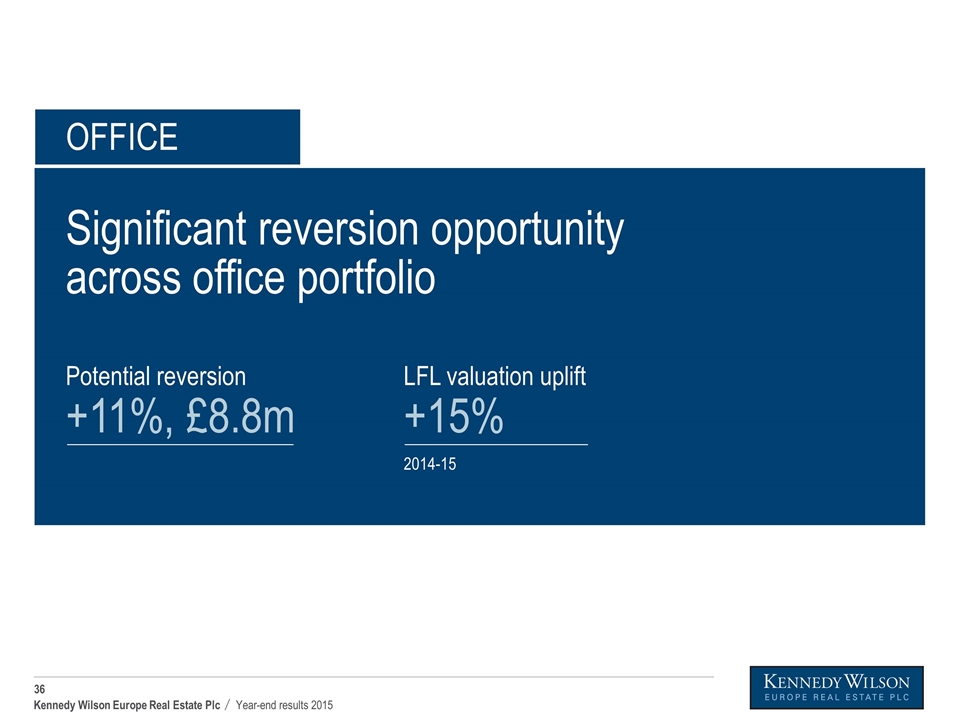
OFFICE Significant reversion opportunity across office portfolio Potential reversion +11%, £8.8m LFL valuation uplift +15% 2014-15
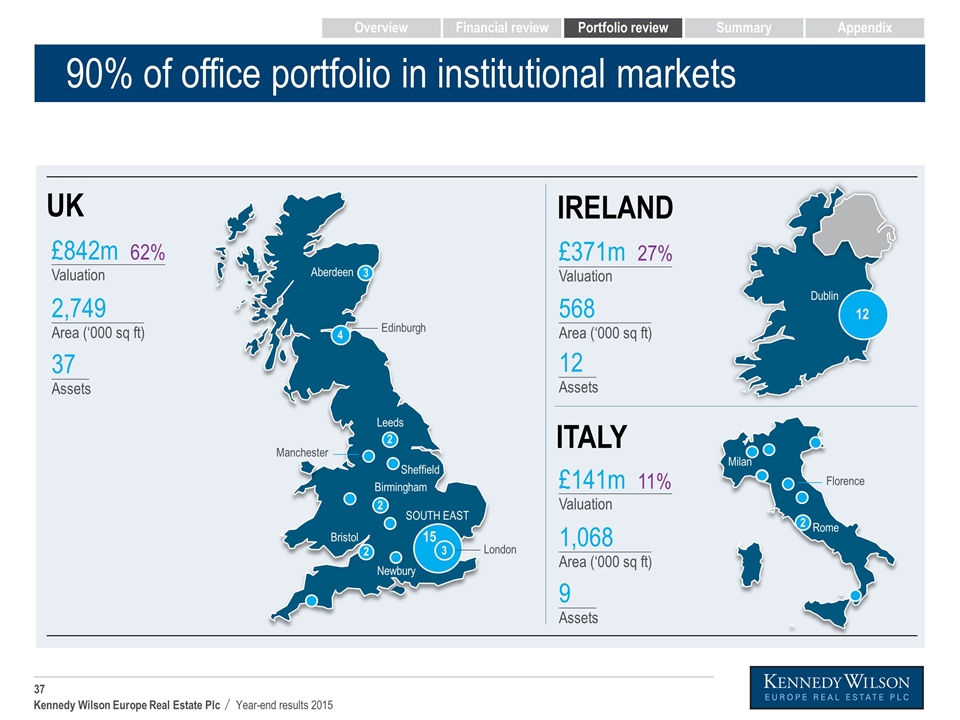
90% of office portfolio in institutional markets ITALY IRELAND UK 12 Dublin Rome Milan Florence 3 Aberdeen Edinburgh 4 Manchester Leeds 2 Sheffield Birmingham 2 2 Bristol Newbury London 15 3 SOUTH EAST £141m 11% Valuation 1,068 Area (‘000 sq ft) 9 Assets £371m 27% Valuation 568 Area (‘000 sq ft) 12 Assets £842m 62% Valuation 2,749 Area (‘000 sq ft) 37 Assets 2 Overview Financial review Portfolio review Summary Appendix
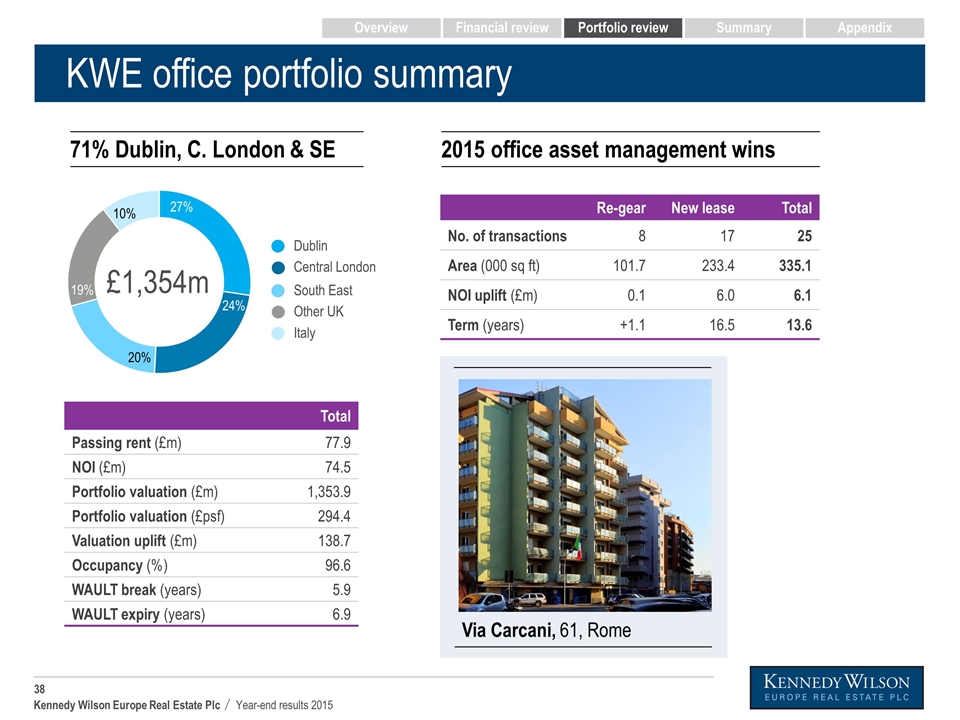
KWE office portfolio summary 71% Dublin, C. London & SE 10% 24% Dublin Central London 27% 20% £1,354m 19% South East Other UK Italy 2015 office asset management wins Via Carcani, 61, Rome Re-gear New lease Total No. of transactions 8 17 25 Area (000 sq ft) 101.7 233.4 335.1 NOI uplift (£m) 0.1 6.0 6.1 Term (years) +1.1 16.5 13.6 Total Passing rent (£m) 77.9 NOI (£m) 74.5 Portfolio valuation (£m) 1,353.9 Portfolio valuation (£psf) 294.4 Valuation uplift (£m) 138.7 Occupancy (%) 96.6 WAULT break (years) 5.9 WAULT expiry (years) 6.9 Overview Financial review Portfolio review Summary Appendix
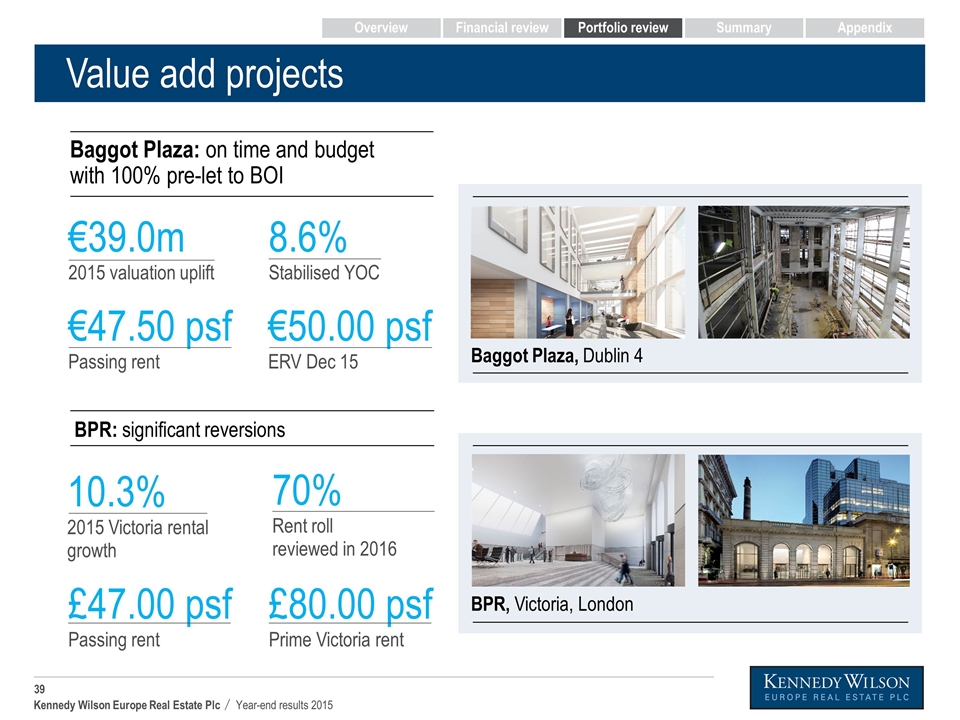
£80.00 psf Prime Victoria rent £47.00 psf Passing rent €50.00 psf ERV Dec 15 €47.50 psf Passing rent Value add projects BPR: significant reversions €39.0m 2015 valuation uplift 70% Rent roll reviewed in 2016 10.3% 2015 Victoria rental growth Baggot Plaza: on time and budget with 100% pre-let to BOI 8.6% Stabilised YOC Baggot Plaza, Dublin 4 BPR, Victoria, London Overview Financial review Portfolio review Summary Appendix
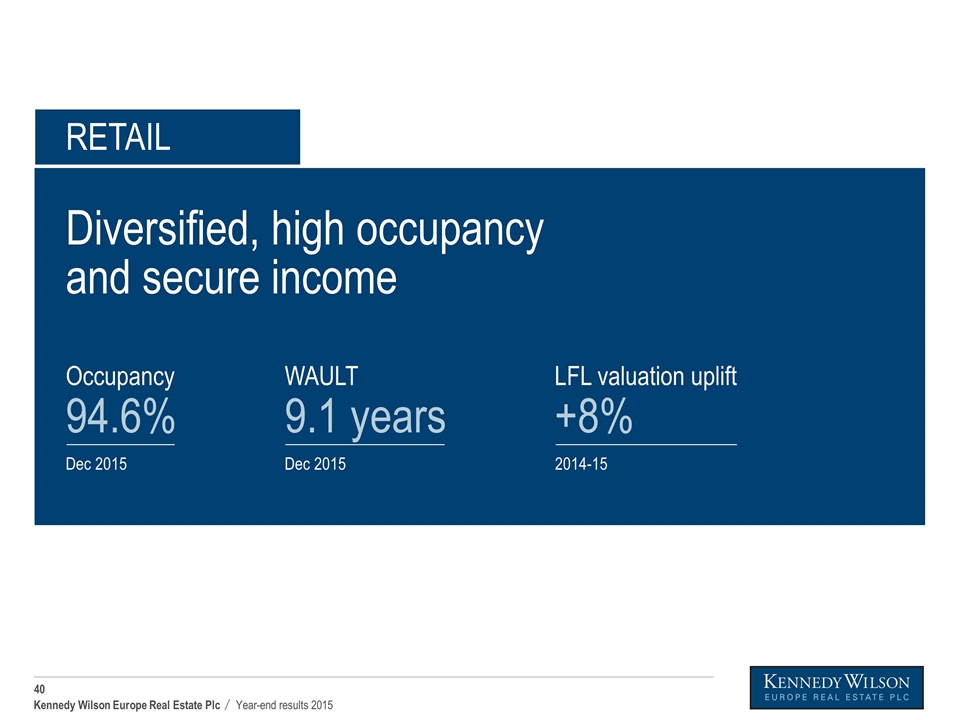
RETAIL Dec 2015 Occupancy 94.6% Dec 2015 WAULT 9.1 years 2014-15 LFL valuation uplift +8% Diversified, high occupancy and secure income
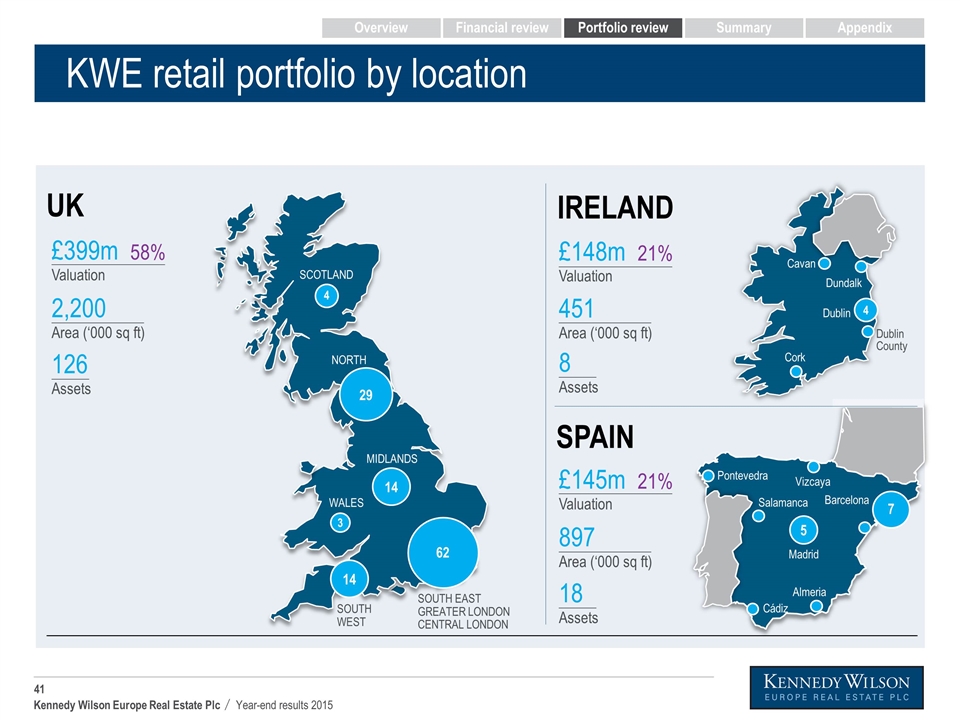
KWE retail portfolio by location x% SPAIN IRELAND UK £145m 21% Valuation 897 Area (‘000 sq ft) 18 Assets £148m 21% Valuation 451 Area (‘000 sq ft) 8 Assets £399m 58% Valuation 2,200 Area (‘000 sq ft) 126 Assets 4 SCOTLAND 3 WALES 14 SOUTH WEST 14 MIDLANDS 62 29 NORTH SOUTH EAST GREATER LONDON CENTRAL LONDON Almeria Cádiz Salamanca Pontevedra Madrid 5 Vizcaya 7 Barcelona Cork Cavan Dundalk 4 Dublin Dublin County Overview Financial review Portfolio review Summary Appendix
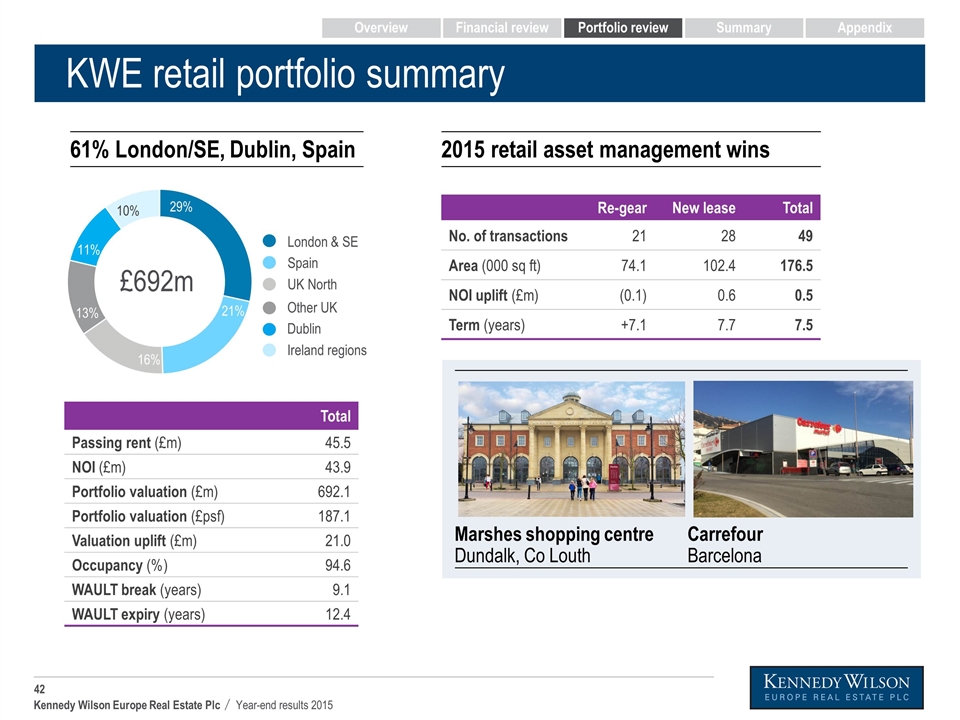
KWE retail portfolio summary 13% 10% 21% 29% 16% £692m 11% Other UK Dublin Ireland regions London & SE Spain UK North 61% London/SE, Dublin, Spain Marshes shopping centre Dundalk, Co Louth Carrefour Barcelona UK Ireland Spain Italy Total Passing rent (£m) 45.5 NOI (£m) 43.9 Portfolio valuation (£m) 692.1 Portfolio valuation (£psf) 187.1 Valuation uplift (£m) 21.0 Occupancy (%) 94.6 WAULT break (years) 9.1 WAULT expiry (years) 12.4 Re-gear New lease Total No. of transactions 21 28 49 Area (000 sq ft) 74.1 102.4 176.5 NOI uplift (£m) (0.1) 0.6 0.5 Term (years) +7.1 7.7 7.5 2015 retail asset management wins Overview Financial review Portfolio review Summary Appendix
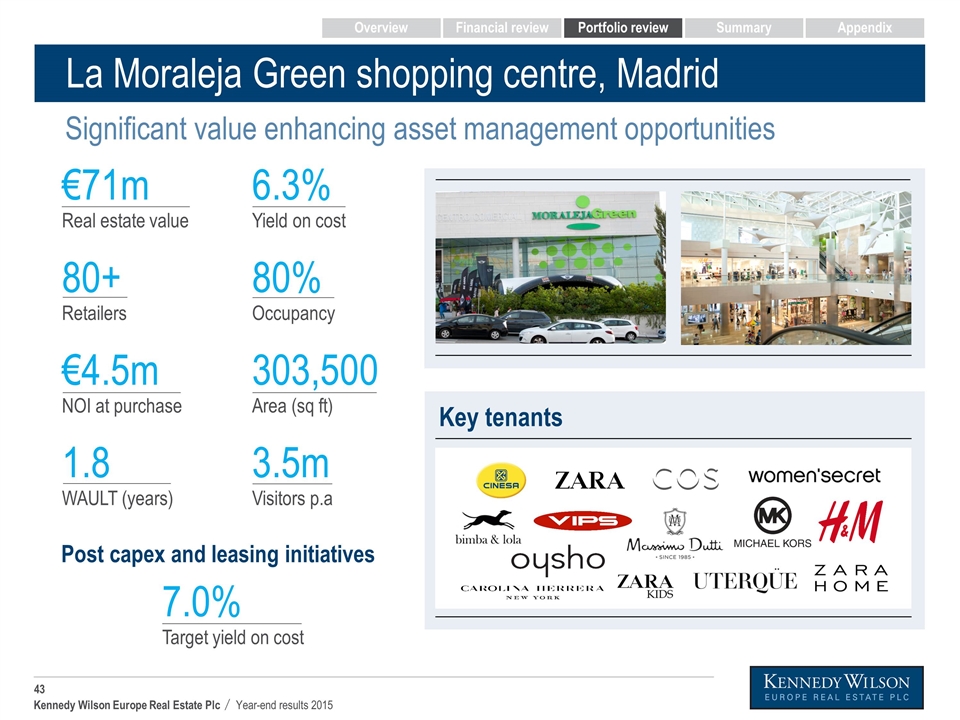
La Moraleja Green shopping centre, Madrid Significant value enhancing asset management opportunities 80+ Retailers €4.5m NOI at purchase 1.8 WAULT (years) 3.5m Visitors p.a 303,500 Area (sq ft) 6.3% Yield on cost €71m Real estate value Key tenants 7.0% Target yield on cost Post capex and leasing initiatives 80% Occupancy Overview Financial review Portfolio review Summary Appendix
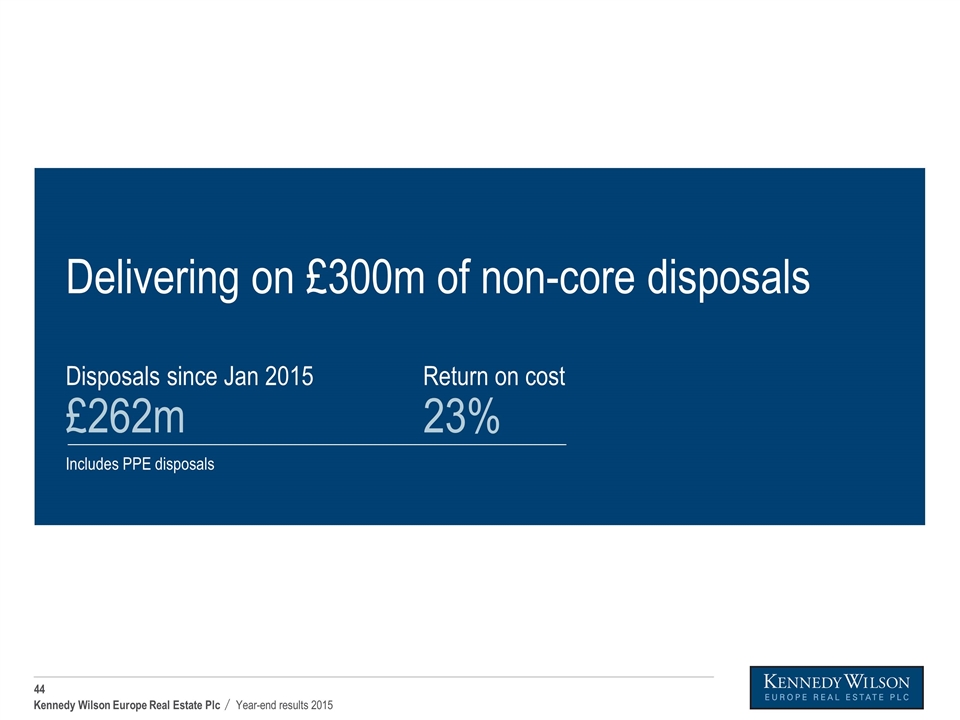
Delivering on £300m of non-core disposals Includes PPE disposals Return on cost 23% Disposals since Jan 2015 £262m
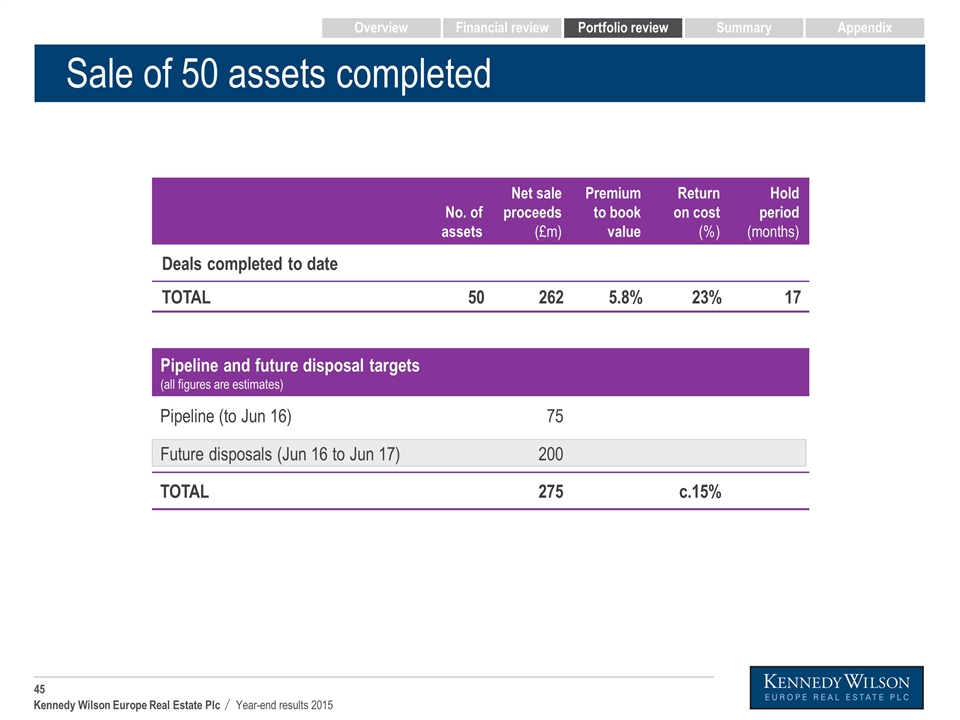
Sale of 50 assets completed Overview Financial review Portfolio review Summary Appendix No. of assets Net sale proceeds (£m) Premium to book value Return on cost (%) Hold period (months) Deals completed to date TOTAL 50 262 5.8% 23% 17 Pipeline and future disposal targets (all figures are estimates) Pipeline (to Jun 16) 75 Future disposals (Jun 16 to Jun 17) 200 TOTAL 275 c.15%
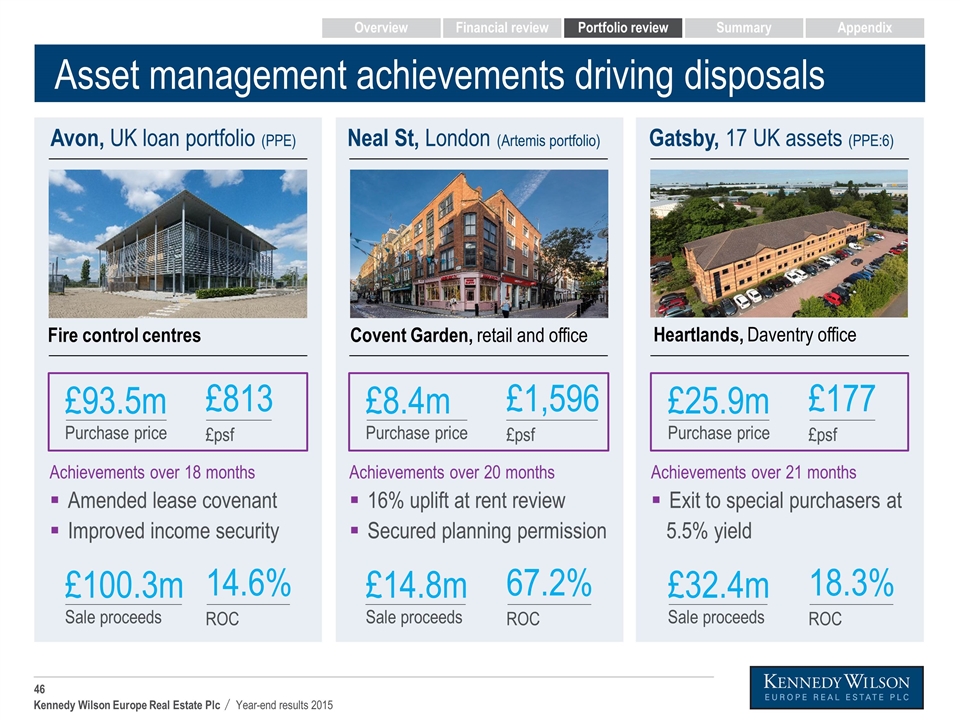
Asset management achievements driving disposals Avon, UK loan portfolio (PPE) Neal St, London (Artemis portfolio) Gatsby, 17 UK assets (PPE:6) £813 £psf Achievements over 18 months Amended lease covenant Improved income security £93.5m Purchase price 14.6% ROC £100.3m Sale proceeds £1,596 £psf Achievements over 20 months 16% uplift at rent review Secured planning permission £8.4m Purchase price 67.2% ROC £14.8m Sale proceeds £177 £psf £25.9m Purchase price 18.3% ROC £32.4m Sale proceeds Achievements over 21 months Exit to special purchasers at 5.5% yield Heartlands, Daventry office Covent Garden, retail and office Fire control centres Overview Financial review Portfolio review Summary Appendix
Summary Mary Ricks
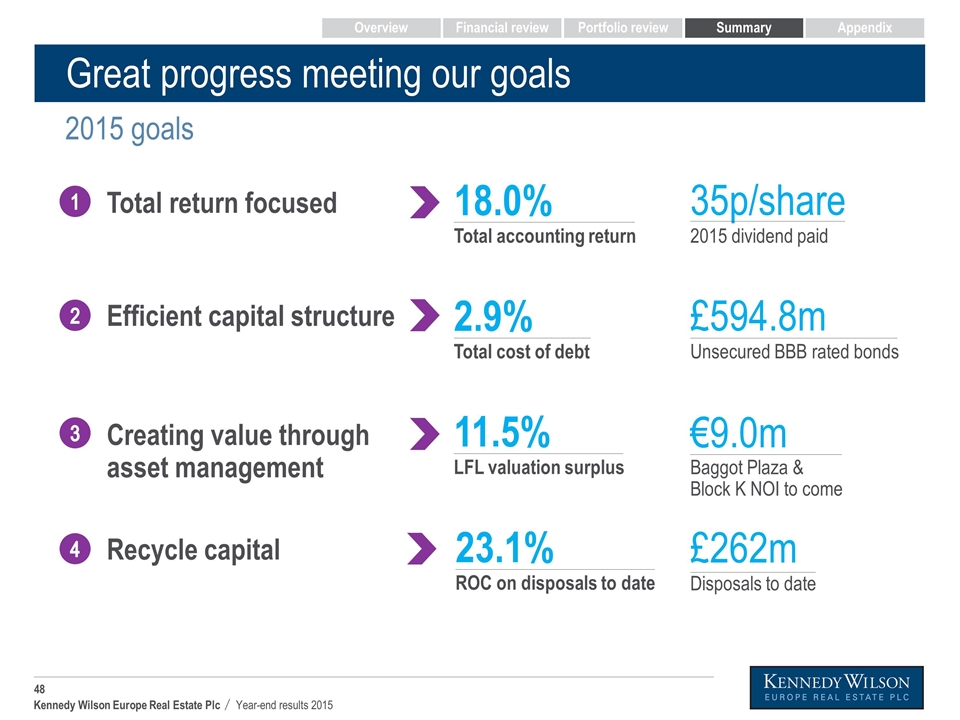
Great progress meeting our goals Overview Financial review Portfolio review Summary Appendix 2015 goals 35p/share 2015 dividend paid 11.5% LFL valuation surplus 23.1% ROC on disposals to date 18.0% Total accounting return 2.9% Total cost of debt €9.0m Baggot Plaza & Block K NOI to come £262m Disposals to date 1 Total return focused Efficient capital structure Creating value through asset management Recycle capital £594.8m Unsecured BBB rated bonds 2 3 4
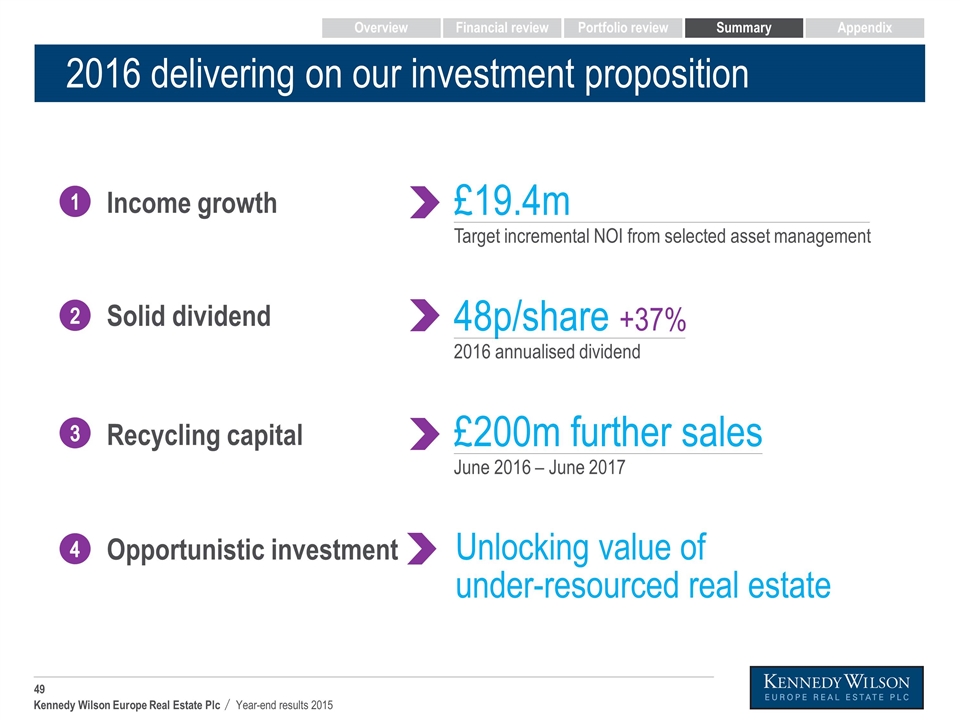
2016 delivering on our investment proposition Overview Financial review Portfolio review Summary Appendix 1 Income growth £19.4m Target incremental NOI from selected asset management £200m further sales June 2016 – June 2017 48p/share +37% 2016 annualised dividend Solid dividend Recycling capital 2 3 Unlocking value of under-resourced real estate Opportunistic investment 4

Questions

Appendix
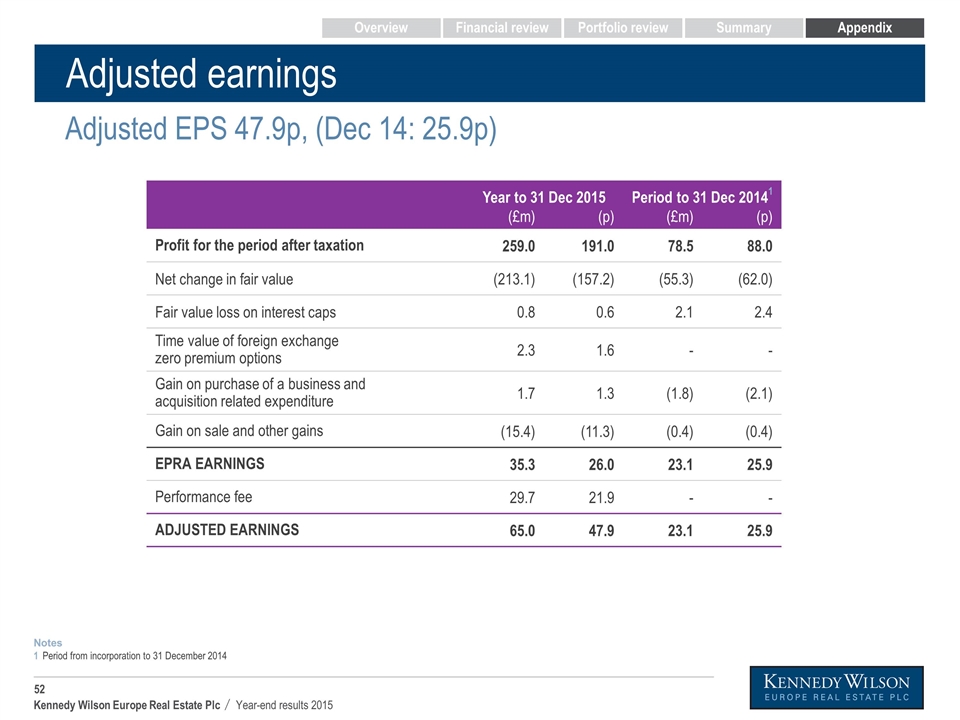
Adjusted earnings From note 16 in the financials Adjusted EPS 47.9p, (Dec 14: 25.9p) Overview Financial review Portfolio review Summary Appendix Year to 31 Dec 2015 Period to 31 Dec 20141 (£m) (p) (£m) (p) Profit for the period after taxation 259.0 191.0 78.5 88.0 Net change in fair value (213.1) (157.2) (55.3) (62.0) Fair value loss on interest caps 0.8 0.6 2.1 2.4 Time value of foreign exchange zero premium options 2.3 1.6 - - Gain on purchase of a business and acquisition related expenditure 1.7 1.3 (1.8) (2.1) Gain on sale and other gains (15.4) (11.3) (0.4) (0.4) EPRA EARNINGS 35.3 26.0 23.1 25.9 Performance fee 29.7 21.9 - - ADJUSTED EARNINGS 65.0 47.9 23.1 25.9 Period from incorporation to 31 December 2014 Notes 1
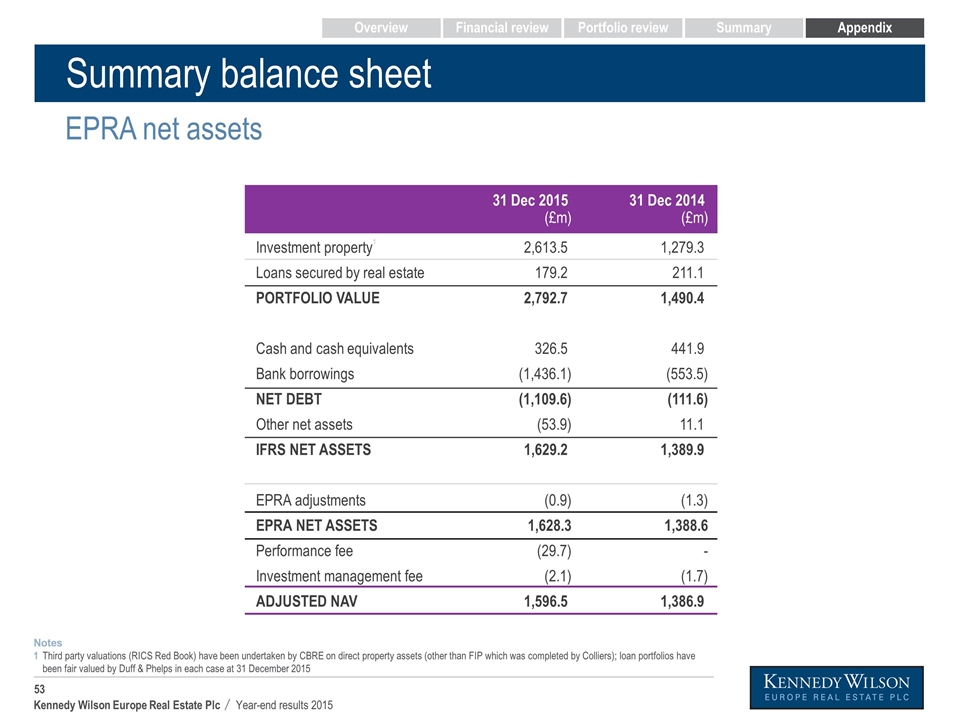
Summary balance sheet EPRA net assets Investment property1 Loans secured by real estate PORTFOLIO VALUE Cash and cash equivalents Bank borrowings NET DEBT Other net assets IFRS NET ASSETS EPRA adjustments EPRA NET ASSETS Performance fee Investment management fee ADJUSTED NAV 31 Dec 2015 (£m) 2,613.5 179.2 2,792.7 326.5 (1,436.1) (1,109.6) (53.9) 1,629.2 (0.9) 1,628.3 (29.7) (2.1) 1,596.5 31 Dec 2014 (£m) 1,279.3 211.1 1,490.4 441.9 (553.5) (111.6) 11.1 1,389.9 (1.3) 1,388.6 - (1.7) 1,386.9 Third party valuations (RICS Red Book) have been undertaken by CBRE on direct property assets (other than FIP which was completed by Colliers); loan portfolios have been fair valued by Duff & Phelps in each case at 31 December 2015 Notes 1 Overview Financial review Portfolio review Summary Appendix
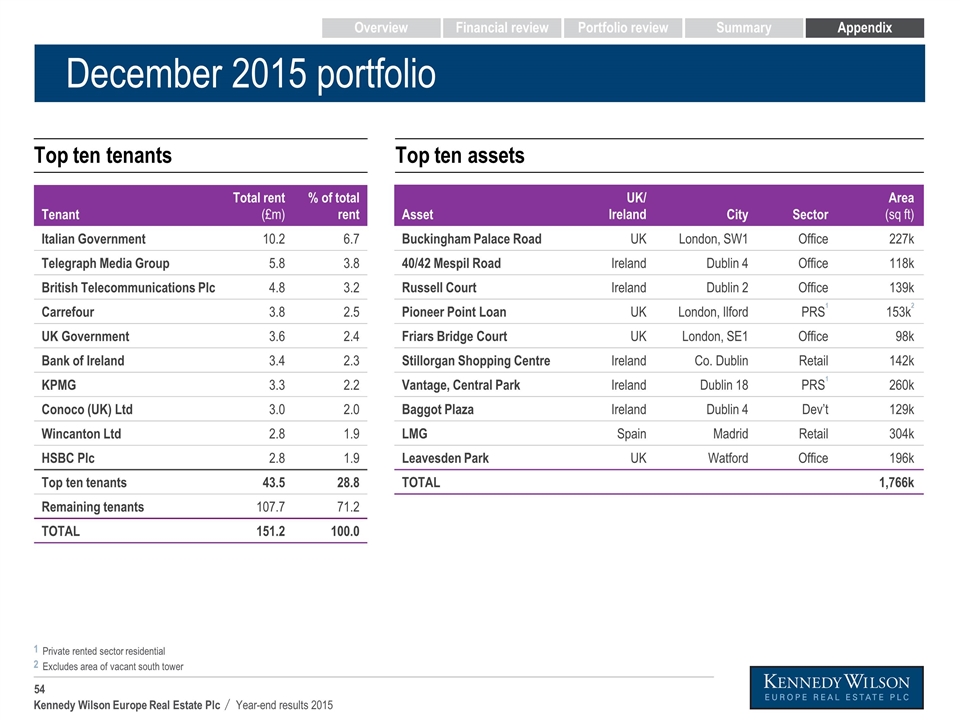
December 2015 portfolio Tenant Total rent (£m) % of total rent Italian Government 10.2 6.7 Telegraph Media Group 5.8 3.8 British Telecommunications Plc 4.8 3.2 Carrefour 3.8 2.5 UK Government 3.6 2.4 Bank of Ireland 3.4 2.3 KPMG 3.3 2.2 Conoco (UK) Ltd 3.0 2.0 Wincanton Ltd 2.8 1.9 HSBC Plc 2.8 1.9 Top ten tenants 43.5 28.8 Remaining tenants 107.7 71.2 TOTAL 151.2 100.0 1 2 Private rented sector residential Excludes area of vacant south tower Top ten tenants Top ten assets Asset UK/ Ireland City Sector Area (sq ft) Buckingham Palace Road UK London, SW1 Office 227k 40/42 Mespil Road Ireland Dublin 4 Office 118k Russell Court Ireland Dublin 2 Office 139k Pioneer Point Loan UK London, Ilford PRS1 153k2 Friars Bridge Court UK London, SE1 Office 98k Stillorgan Shopping Centre Ireland Co. Dublin Retail 142k Vantage, Central Park Ireland Dublin 18 PRS1 260k Baggot Plaza Ireland Dublin 4 Dev’t 129k LMG Spain Madrid Retail 304k Leavesden Park UK Watford Office 196k TOTAL 1,766k Overview Financial review Portfolio review Summary Appendix
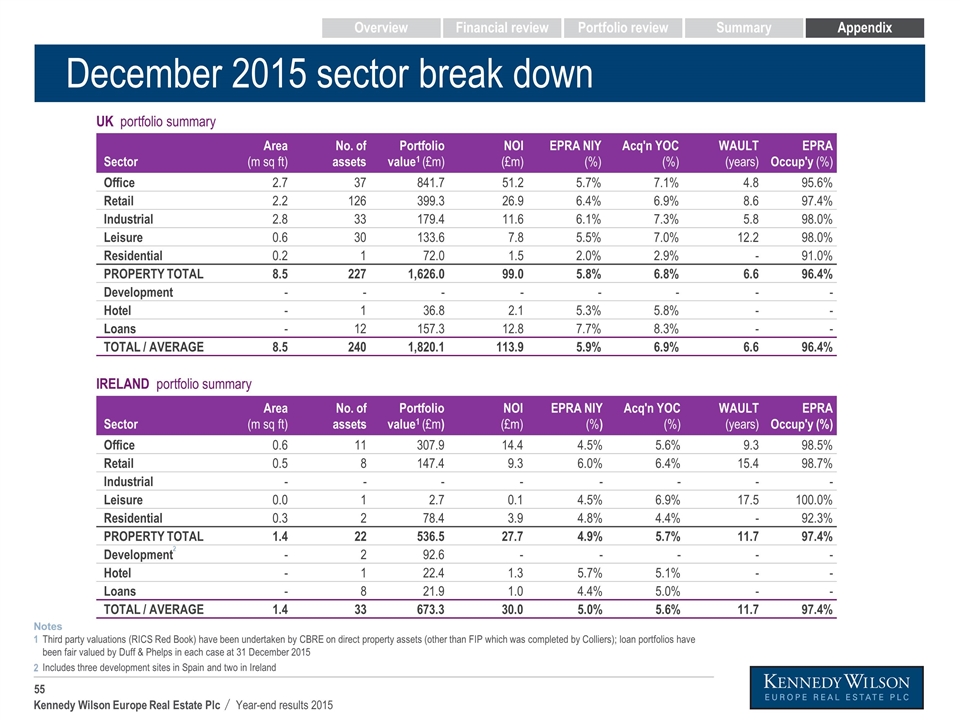
IRELAND portfolio summary Sector Area (m sq ft) No. of assets Portfolio value1 (£m) NOI (£m) EPRA NIY (%) Acq'n YOC (%) WAULT (years) EPRA Occup'y (%) Office 0.6 11 307.9 14.4 4.5% 5.6% 9.3 98.5% Retail 0.5 8 147.4 9.3 6.0% 6.4% 15.4 98.7% Industrial - - - - - - - - Leisure 0.0 1 2.7 0.1 4.5% 6.9% 17.5 100.0% Residential 0.3 2 78.4 3.9 4.8% 4.4% - 92.3% PROPERTY TOTAL 1.4 22 536.5 27.7 4.9% 5.7% 11.7 97.4% Development2 - 2 92.6 - - - - - Hotel - 1 22.4 1.3 5.7% 5.1% - - Loans - 8 21.9 1.0 4.4% 5.0% - - TOTAL / AVERAGE 1.4 33 673.3 30.0 5.0% 5.6% 11.7 97.4% December 2015 sector break down UK portfolio summary Sector Area (m sq ft) No. of assets Portfolio value1 (£m) NOI (£m) EPRA NIY (%) Acq'n YOC (%) WAULT (years) EPRA Occup'y (%) Office 2.7 37 841.7 51.2 5.7% 7.1% 4.8 95.6% Retail 2.2 126 399.3 26.9 6.4% 6.9% 8.6 97.4% Industrial 2.8 33 179.4 11.6 6.1% 7.3% 5.8 98.0% Leisure 0.6 30 133.6 7.8 5.5% 7.0% 12.2 98.0% Residential 0.2 1 72.0 1.5 2.0% 2.9% - 91.0% PROPERTY TOTAL 8.5 227 1,626.0 99.0 5.8% 6.8% 6.6 96.4% Development - - - - - - - - Hotel - 1 36.8 2.1 5.3% 5.8% - - Loans - 12 157.3 12.8 7.7% 8.3% - - TOTAL / AVERAGE 8.5 240 1,820.1 113.9 5.9% 6.9% 6.6 96.4% Third party valuations (RICS Red Book) have been undertaken by CBRE on direct property assets (other than FIP which was completed by Colliers); loan portfolios have been fair valued by Duff & Phelps in each case at 31 December 2015 Includes three development sites in Spain and two in Ireland Notes 1 2 Overview Financial review Portfolio review Summary Appendix
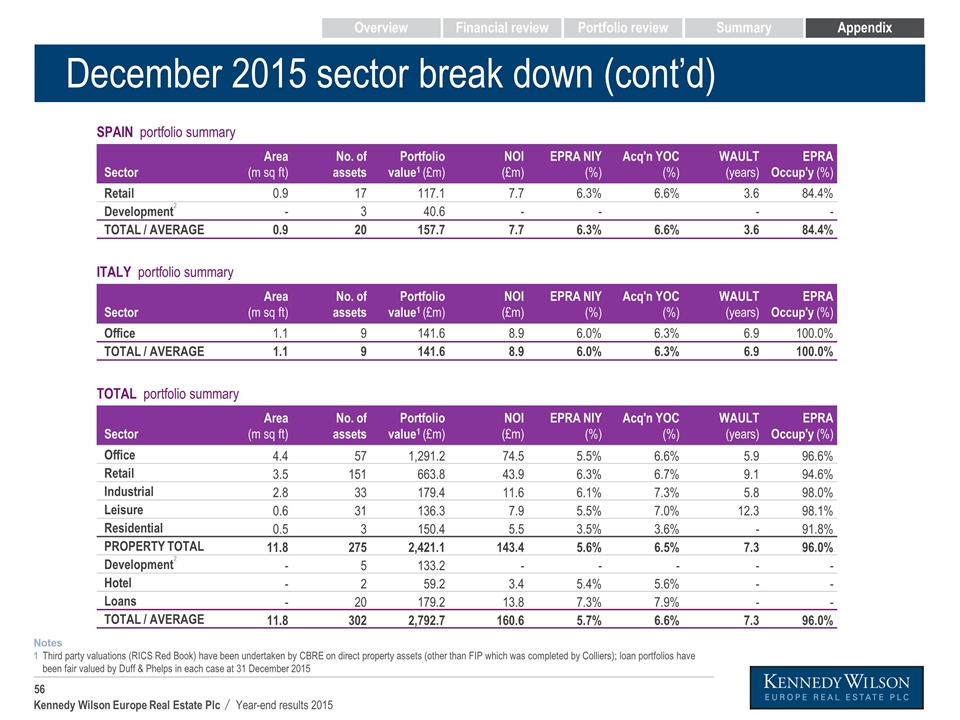
December 2015 sector break down (cont’d) Third party valuations (RICS Red Book) have been undertaken by CBRE on direct property assets (other than FIP which was completed by Colliers); loan portfolios have been fair valued by Duff & Phelps in each case at 31 December 2015 Notes 1 SPAIN portfolio summary Sector Area (m sq ft) No. of assets Portfolio value1 (£m) NOI (£m) EPRA NIY (%) Acq'n YOC (%) WAULT (years) EPRA Occup'y (%) Retail 0.9 17 117.1 7.7 6.3% 6.6% 3.6 84.4% Development2 - 3 40.6 - - - - TOTAL / AVERAGE 0.9 20 157.7 7.7 6.3% 6.6% 3.6 84.4% ITALY portfolio summary Sector Area (m sq ft) No. of assets Portfolio value1 (£m) NOI (£m) EPRA NIY (%) Acq'n YOC (%) WAULT (years) EPRA Occup'y (%) Office 1.1 9 141.6 8.9 6.0% 6.3% 6.9 100.0% TOTAL / AVERAGE 1.1 9 141.6 8.9 6.0% 6.3% 6.9 100.0% TOTAL portfolio summary Sector Area (m sq ft) No. of assets Portfolio value1 (£m) NOI (£m) EPRA NIY (%) Acq'n YOC (%) WAULT (years) EPRA Occup'y (%) Office 4.4 57 1,291.2 74.5 5.5% 6.6% 5.9 96.6% Retail 3.5 151 663.8 43.9 6.3% 6.7% 9.1 94.6% Industrial 2.8 33 179.4 11.6 6.1% 7.3% 5.8 98.0% Leisure 0.6 31 136.3 7.9 5.5% 7.0% 12.3 98.1% Residential 0.5 3 150.4 5.5 3.5% 3.6% - 91.8% PROPERTY TOTAL 11.8 275 2,421.1 143.4 5.6% 6.5% 7.3 96.0% Development2 - 5 133.2 - - - - - Hotel - 2 59.2 3.4 5.4% 5.6% - - Loans - 20 179.2 13.8 7.3% 7.9% - - TOTAL / AVERAGE 11.8 302 2,792.7 160.6 5.7% 6.6% 7.3 96.0% Overview Financial review Portfolio review Summary Appendix
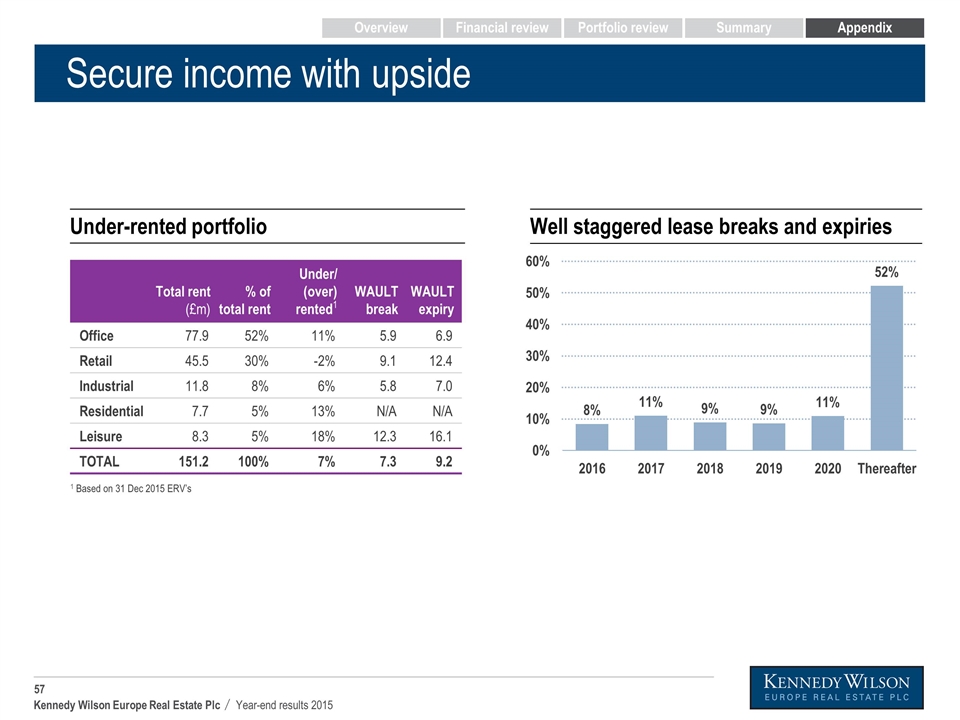
Secure income with upside Total rent (£m) % of total rent Under/ (over) rented1 WAULT break WAULT expiry Office 77.9 52% 11% 5.9 6.9 Retail 45.5 30% -2% 9.1 12.4 Industrial 11.8 8% 6% 5.8 7.0 Residential 7.7 5% 13% N/A N/A Leisure 8.3 5% 18% 12.3 16.1 TOTAL 151.2 100% 7% 7.3 9.2 1 Based on 31 Dec 2015 ERV’s Under-rented portfolio Well staggered lease breaks and expiries Overview Financial review Portfolio review Summary Appendix
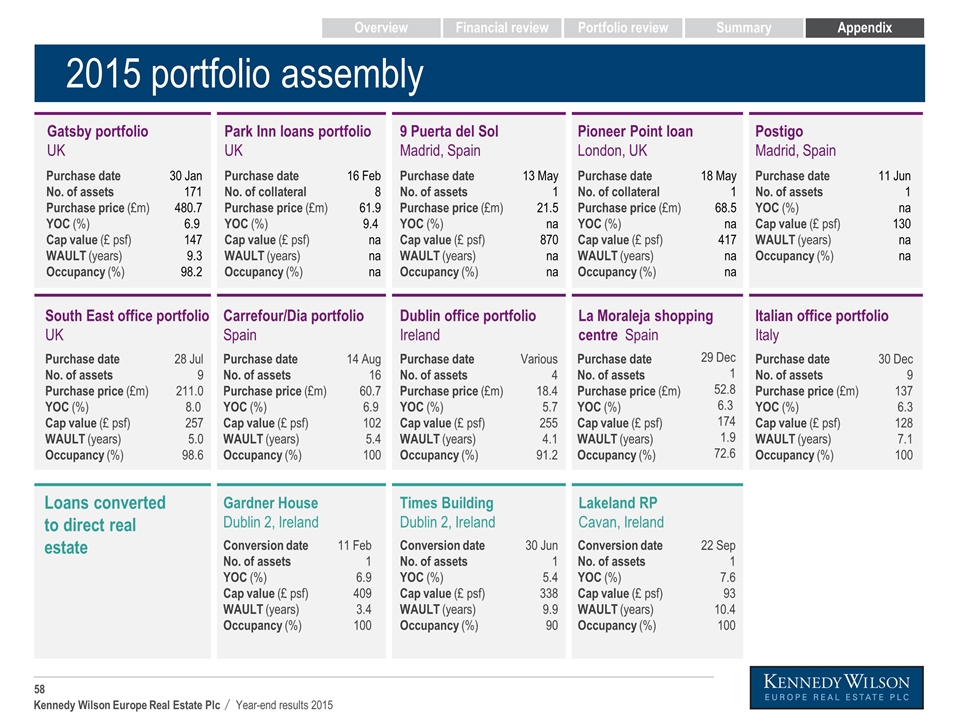
2015 portfolio assembly Gatsby portfolio UK Purchase date No. of assets Purchase price (£m) YOC (%) Cap value (£ psf) WAULT (years) Occupancy (%) 30 Jan 171 480.7 6.9 147 9.3 98.2 Park Inn loans portfolio UK Purchase date No. of collateral Purchase price (£m) YOC (%) Cap value (£ psf) WAULT (years) Occupancy (%) 16 Feb 8 61.9 9.4 na na na 9 Puerta del Sol Madrid, Spain Purchase date No. of assets Purchase price (£m) YOC (%) Cap value (£ psf) WAULT (years) Occupancy (%) 13 May 1 21.5 na 870 na na Pioneer Point loan London, UK Purchase date No. of collateral Purchase price (£m) YOC (%) Cap value (£ psf) WAULT (years) Occupancy (%) 18 May 1 68.5 na 417 na na Postigo Madrid, Spain Purchase date No. of assets YOC (%) Cap value (£ psf) WAULT (years) Occupancy (%) 11 Jun 1 na 130 na na South East office portfolio UK Purchase date No. of assets Purchase price (£m) YOC (%) Cap value (£ psf) WAULT (years) Occupancy (%) 28 Jul 9 211.0 8.0 257 5.0 98.6 Carrefour/Dia portfolio Spain Purchase date No. of assets Purchase price (£m) YOC (%) Cap value (£ psf) WAULT (years) Occupancy (%) 14 Aug 16 60.7 6.9 102 5.4 100 Italian office portfolio Italy Purchase date No. of assets Purchase price (£m) YOC (%) Cap value (£ psf) WAULT (years) Occupancy (%) 30 Dec 9 137 6.3 128 7.1 100 Dublin office portfolio Ireland Purchase date No. of assets Purchase price (£m) YOC (%) Cap value (£ psf) WAULT (years) Occupancy (%) Various 4 18.4 5.7 255 4.1 91.2 La Moraleja shopping centre Spain Purchase date No. of assets Purchase price (£m) YOC (%) Cap value (£ psf) WAULT (years) Occupancy (%) 29 Dec 1 52.8 6.3 174 1.9 72.6 Gardner House Dublin 2, Ireland Conversion date No. of assets YOC (%) Cap value (£ psf) WAULT (years) Occupancy (%) 11 Feb 1 6.9 409 3.4 100 Times Building Dublin 2, Ireland Conversion date No. of assets YOC (%) Cap value (£ psf) WAULT (years) Occupancy (%) 30 Jun 1 5.4 338 9.9 90 Lakeland RP Cavan, Ireland Conversion date No. of assets YOC (%) Cap value (£ psf) WAULT (years) Occupancy (%) 22 Sep 1 7.6 93 10.4 100 Loans converted to direct real estate Overview Financial review Portfolio review Summary Appendix
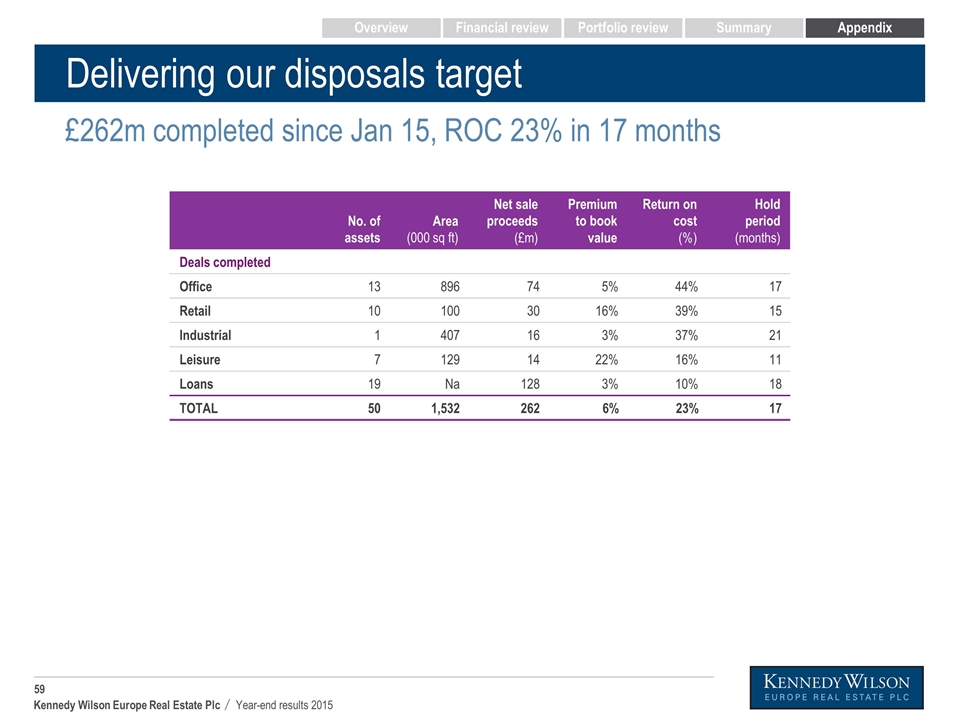
Delivering our disposals target £262m completed since Jan 15, ROC 23% in 17 months No. of assets Area (000 sq ft) Net sale proceeds (£m) Premium to book value Return on cost (%) Hold period (months) Deals completed Office 13 896 74 5% 44% 17 Retail 10 100 30 16% 39% 15 Industrial 1 407 16 3% 37% 21 Leisure 7 129 14 22% 16% 11 Loans 19 Na 128 3% 10% 18 TOTAL 50 1,532 262 6% 23% 17 Overview Financial review Portfolio review Summary Appendix
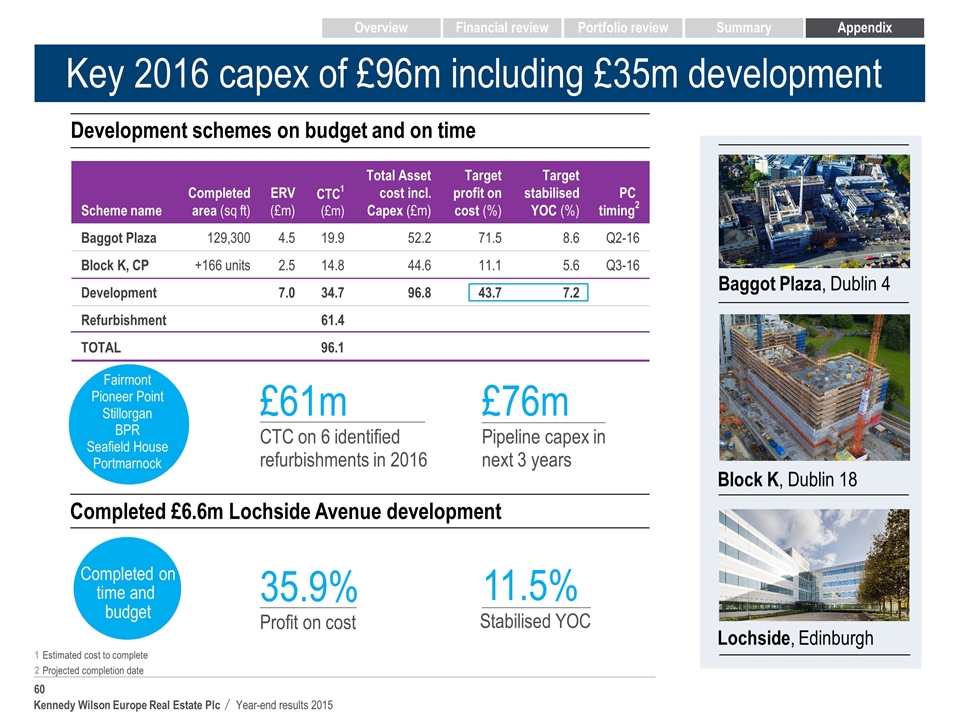
Key 2016 capex of £96m including £35m development Scheme name Completed area (sq ft) ERV (£m) CTC1 (£m) Total Asset cost incl. Capex (£m) Target profit on cost (%) Target stabilised YOC (%) PC timing2 Baggot Plaza 129,300 4.5 19.9 52.2 71.5 8.6 Q2-16 Block K, CP +166 units 2.5 14.8 44.6 11.1 5.6 Q3-16 Development 7.0 34.7 96.8 43.7 7.2 Refurbishment 61.4 TOTAL 96.1 11.5% Stabilised YOC Completed on time and budget Completed £6.6m Lochside Avenue development Development schemes on budget and on time 35.9% Profit on cost £61m CTC on 6 identified refurbishments in 2016 £76m Pipeline capex in next 3 years Fairmont Pioneer Point Stillorgan BPR Seafield House Portmarnock Lochside, Edinburgh Block K, Dublin 18 Baggot Plaza, Dublin 4 1 Estimated cost to complete Projected completion date 2 Overview Financial review Portfolio review Summary Appendix
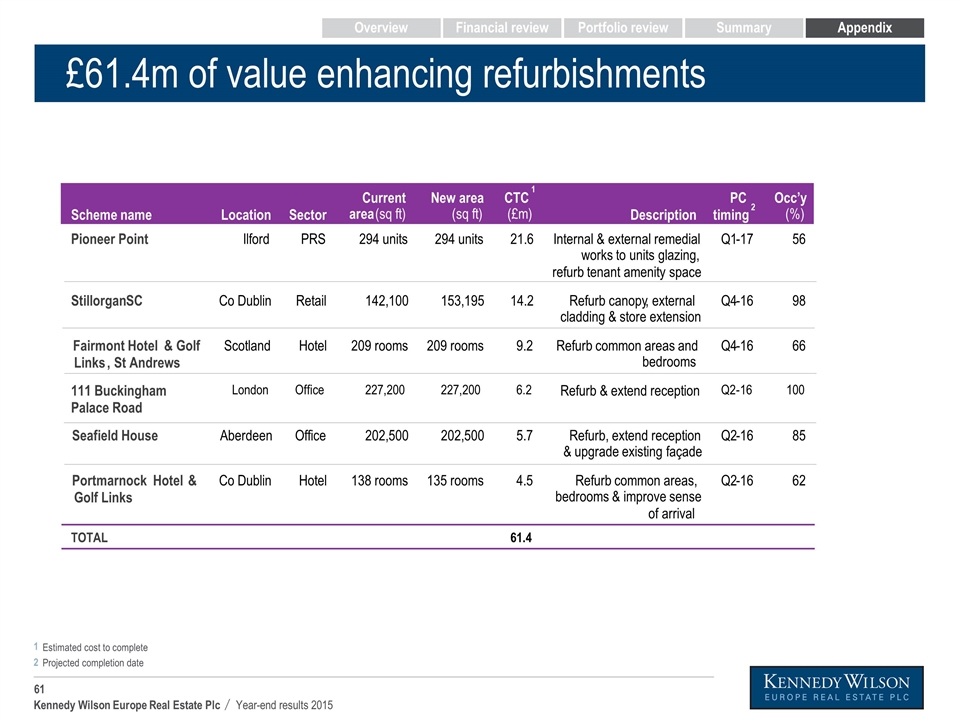
£61.4m of value enhancing refurbishments Overview Financial review Portfolio review Summary Appendix 1 Estimated cost to complete Projected completion date 2 Scheme name Location Sector Current area (sq ft) New area (sq ft) CTC 1 (£m) Description PC timing 2 Occ’y (%) Pioneer Point Ilford PRS 294 units 294 units 21.6 Internal & external remedial works to units glazing, refurb tenant amenity space Q1 - 17 56 Stillorgan SC Co Dublin Retail 142,100 153,195 14.2 Refurb canopy , external cladding & store extension Q4 - 16 98 Fairmont Hotel & Golf Links , St Andrews Scotland Hotel 209 rooms 209 rooms 9.2 Refurb common areas and bedrooms Q4 - 16 66 111 Buckingham Palace Road London Office 227,200 227,200 6.2 Refurb & extend reception Q2 - 16 100 Seafield House Aberdeen Office 202,500 202,500 5.7 Refurb, extend reception & upgrade existing façade Q2 - 16 85 Portmarnock Hotel & Golf Links Co Dublin Hotel 138 rooms 135 rooms 4.5 Refurb common areas, bedrooms & improve sense of arrival Q2 - 16 62 TOTAL 61.4
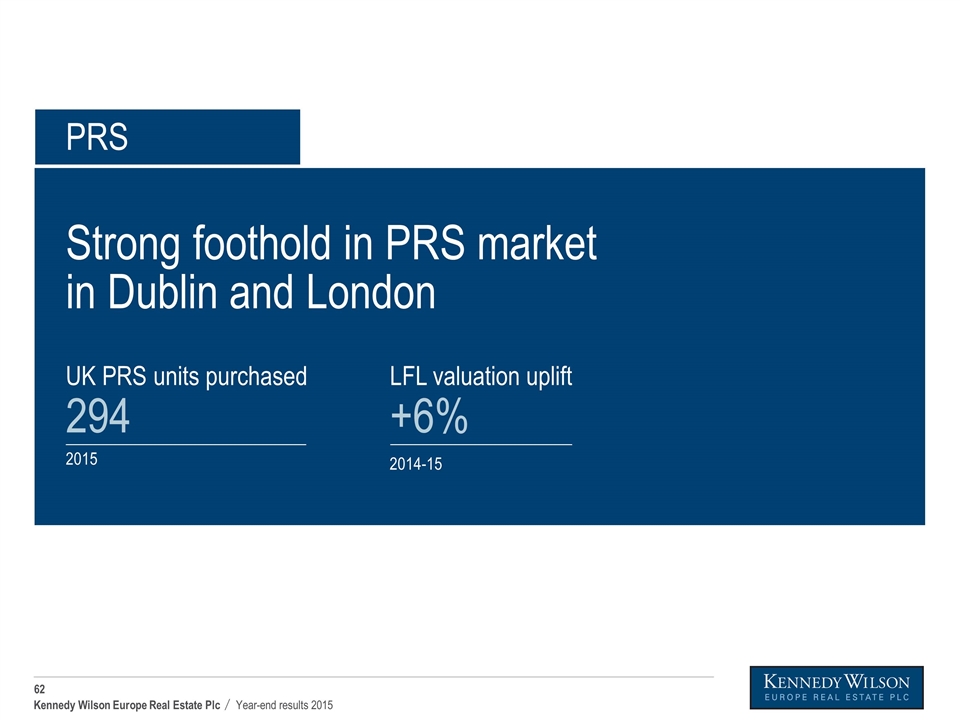
Strong foothold in PRS market in Dublin and London PRS PRS UK PRS units purchased 294 2015 LFL valuation uplift +6% 2014-15
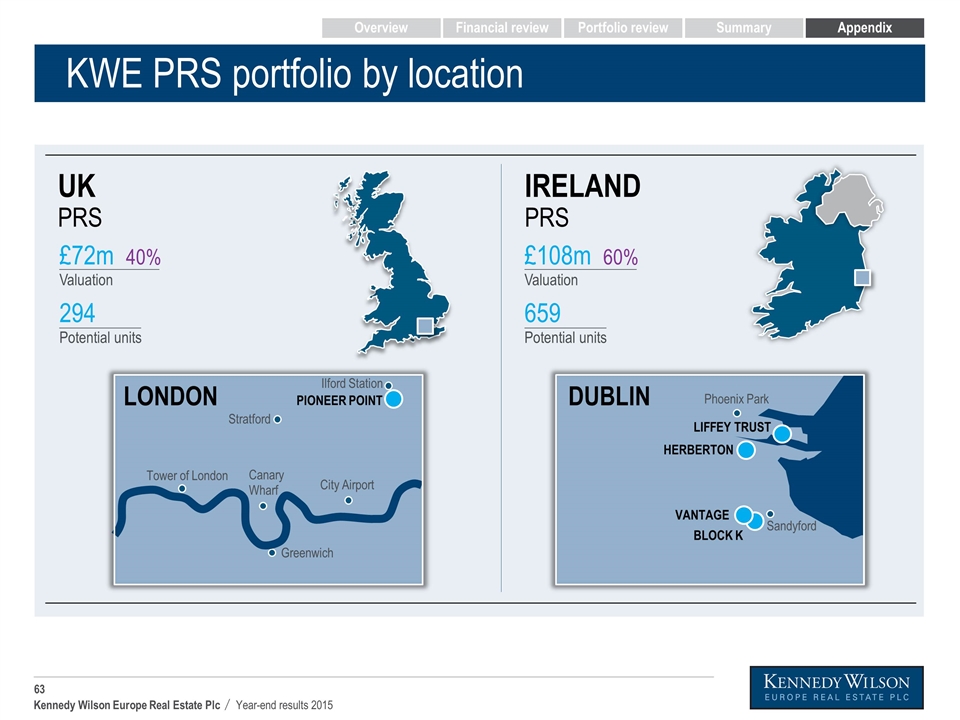
KWE PRS portfolio by location IRELAND PRS UK PRS Stratford Canary Wharf City Airport Greenwich Tower of London PIONEER POINT £72m 40% Valuation LONDON £108m 60% Valuation 659 Potential units 294 Potential units DUBLIN VANTAGE HERBERTON LIFFEY TRUST Phoenix Park Sandyford Ilford Station BLOCK K Overview Financial review Portfolio review Summary Appendix
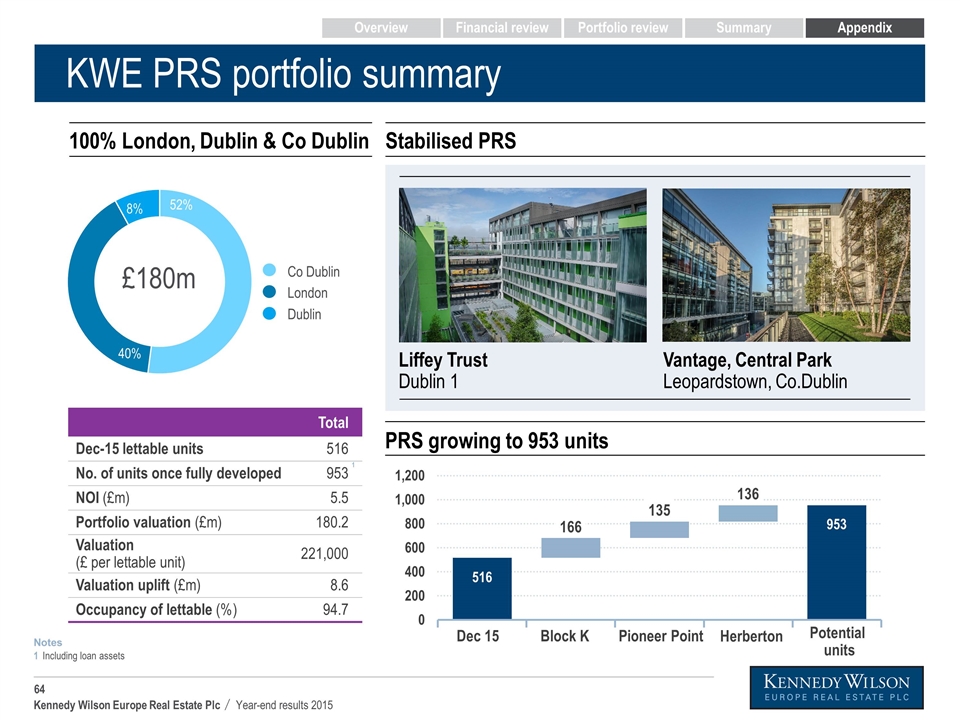
KWE PRS portfolio summary Vantage, Central Park Leopardstown, Co.Dublin Liffey Trust Dublin 1 Total Dec-15 lettable units 516 No. of units once fully developed 953 1 NOI (£m) 5.5 Portfolio valuation (£m) 180.2 Valuation (£ per lettable unit) 221,000 Valuation uplift (£m) 8.6 Occupancy of lettable (%) 94.7 40% 8% 52% £180m Co Dublin London Dublin 100% London, Dublin & Co Dublin Stabilised PRS Dec 15 Block K Pioneer Point Herberton Potential units PRS growing to 953 units Including loan assets 1 Notes Overview Financial review Portfolio review Summary Appendix
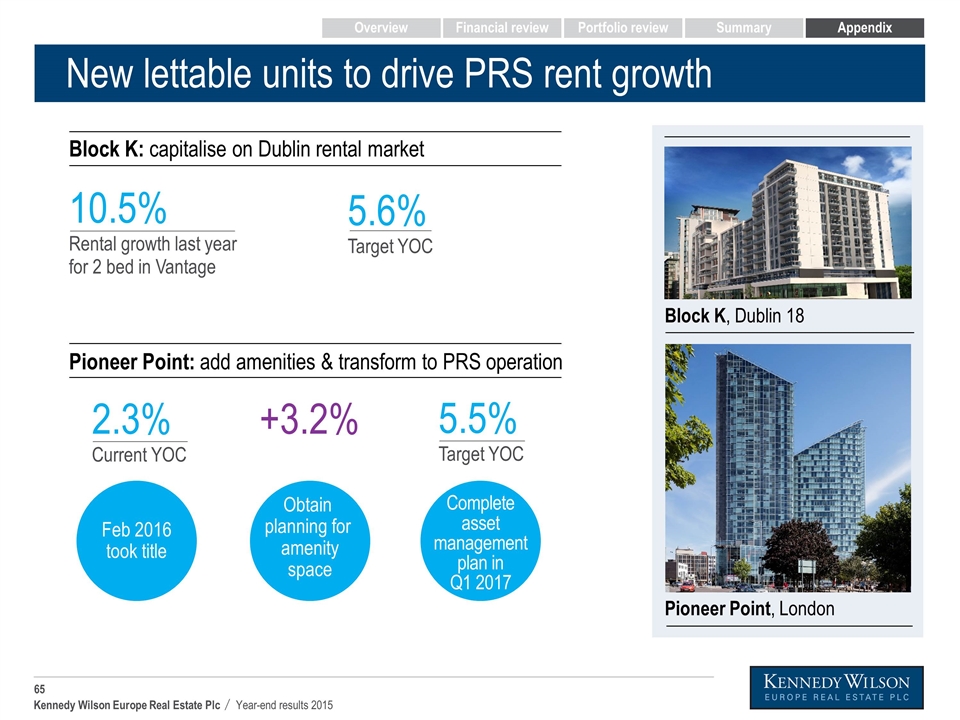
New lettable units to drive PRS rent growth 2.3% Current YOC 5.5% Target YOC +3.2% Feb 2016 took title Obtain planning for amenity space Complete asset management plan in Q1 2017 5.6% Target YOC 10.5% Rental growth last year for 2 bed in Vantage Block K, Dublin 18 Pioneer Point, London Block K: capitalise on Dublin rental market Pioneer Point: add amenities & transform to PRS operation Overview Financial review Portfolio review Summary Appendix
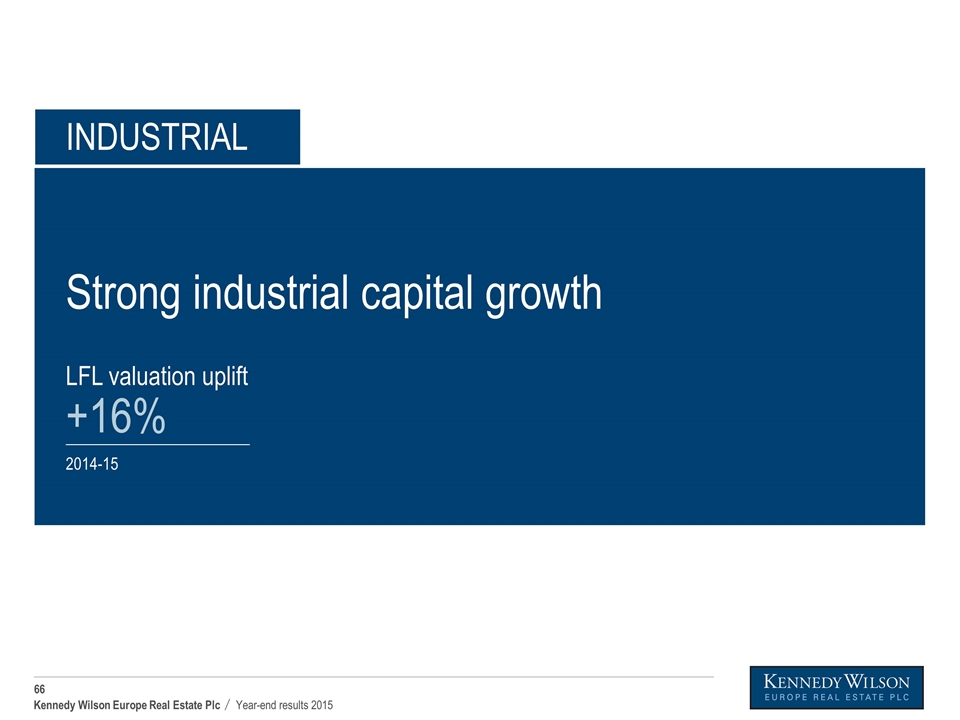
Strong industrial capital growth 2014-15 INDUSTRIAL LFL valuation uplift +16%
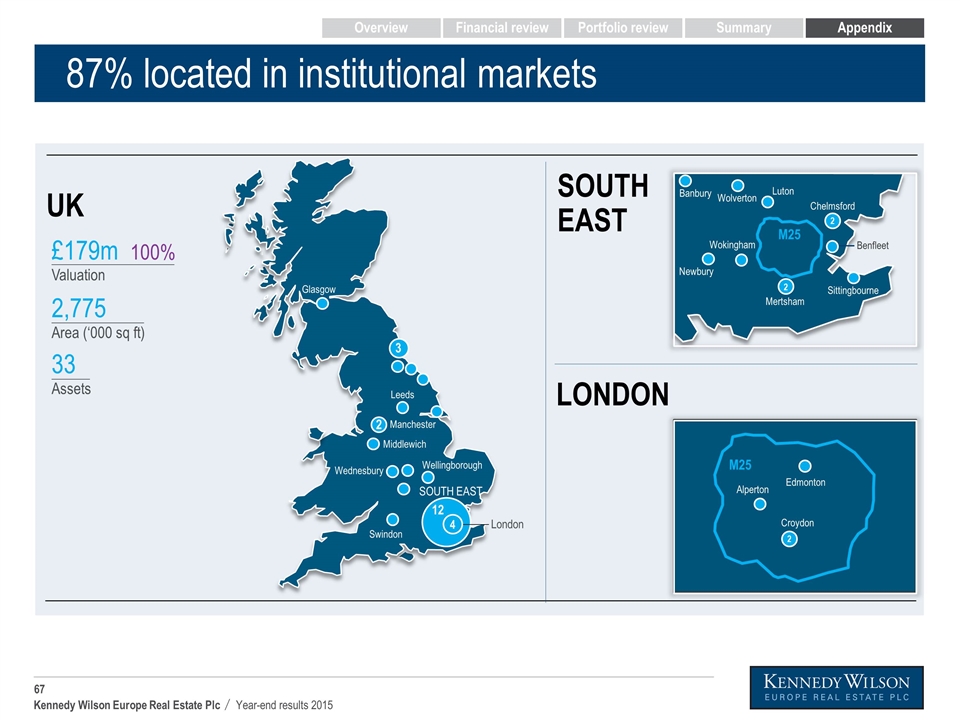
87% located in institutional markets x% Glasgow 3 Manchester 2 Leeds Wednesbury Middlewich Wellingborough Swindon London 12 4 SOUTH EAST UK £179m 100% Valuation 2,775 Area (‘000 sq ft) 33 Assets LONDON SOUTH EAST M25 Newbury Wokingham Mertsham Sittingbourne Chelmsford Luton Wolverton Banbury Benfleet 2 Edmonton Croydon Alperton M25 2 2 Overview Financial review Portfolio review Summary Appendix
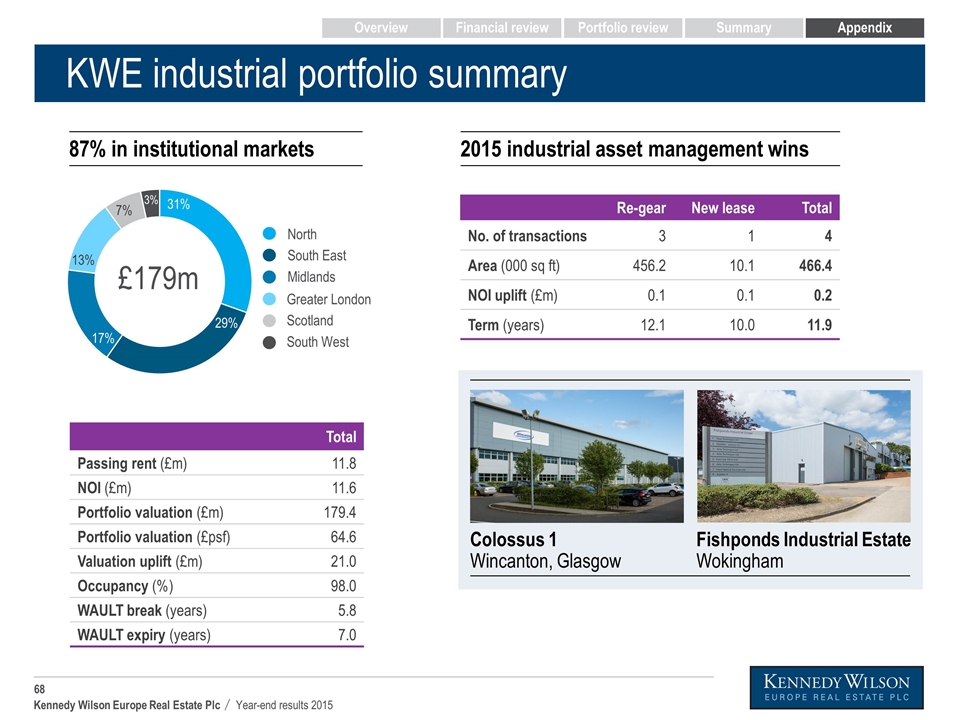
KWE industrial portfolio summary Other UK Dublin Ireland regions London & SE Spain UK North Dublin Central London South East Other UK Italy Re-gear New lease Total No. of transactions 3 1 4 Area (000 sq ft) 456.2 10.1 466.4 NOI uplift (£m) 0.1 0.1 0.2 Term (years) 12.1 10.0 11.9 Total Passing rent (£m) 11.8 NOI (£m) 11.6 Portfolio valuation (£m) 179.4 Portfolio valuation (£psf) 64.6 Valuation uplift (£m) 21.0 Occupancy (%) 98.0 WAULT break (years) 5.8 WAULT expiry (years) 7.0 17% 3% 29% 31% 7% 13% Greater London Scotland South West North South East Midlands Colossus 1 Wincanton, Glasgow Fishponds Industrial Estate Wokingham 87% in institutional markets 2015 industrial asset management wins £179m Overview Financial review Portfolio review Summary Appendix
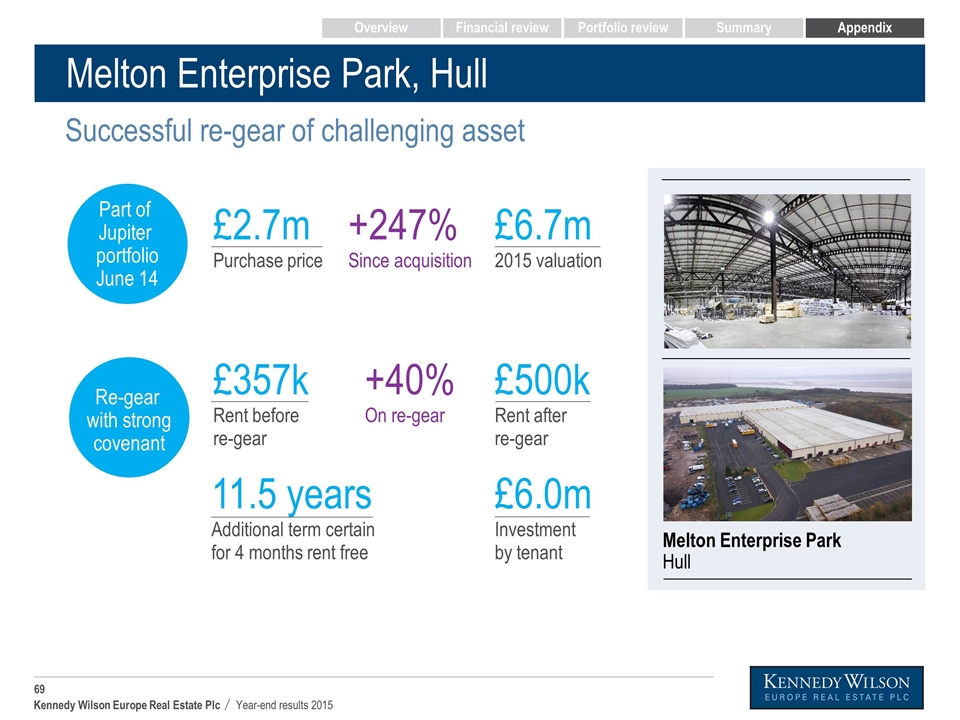
Melton Enterprise Park, Hull Successful re-gear of challenging asset £2.7m Purchase price Re-gear with strong covenant Melton Enterprise Park Hull 11.5 years Additional term certain for 4 months rent free Part of Jupiter portfolio June 14 +247% Since acquisition +40% On re-gear £357k Rent before re-gear £6.0m Investment by tenant £500k Rent after re-gear £6.7m 2015 valuation Overview Financial review Portfolio review Summary Appendix
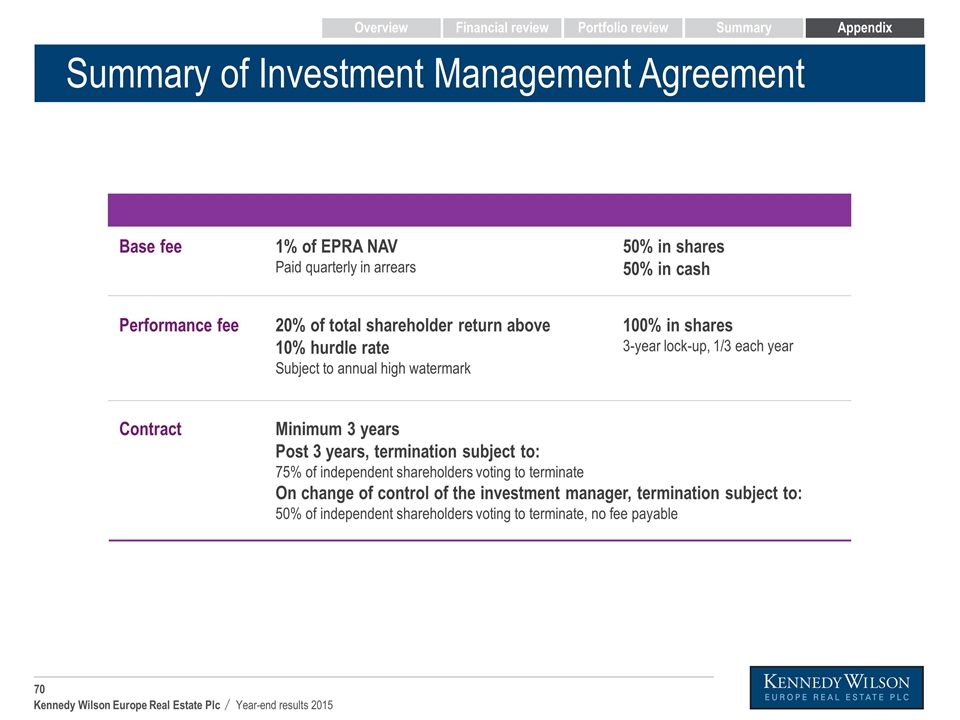
Annual fee Payment Base fee 1% of EPRA NAV Paid quarterly in arrears 50% in shares 50% in cash Performance fee 20% of total shareholder return above 10% hurdle rate Subject to annual high watermark 100% in shares 3-year lock-up, 1/3 each year Contract Minimum 3 years Post 3 years, termination subject to: 75% of independent shareholders voting to terminate On change of control of the investment manager, termination subject to: 50% of independent shareholders voting to terminate, no fee payable Summary of Investment Management Agreement Overview Financial review Portfolio review Summary Appendix
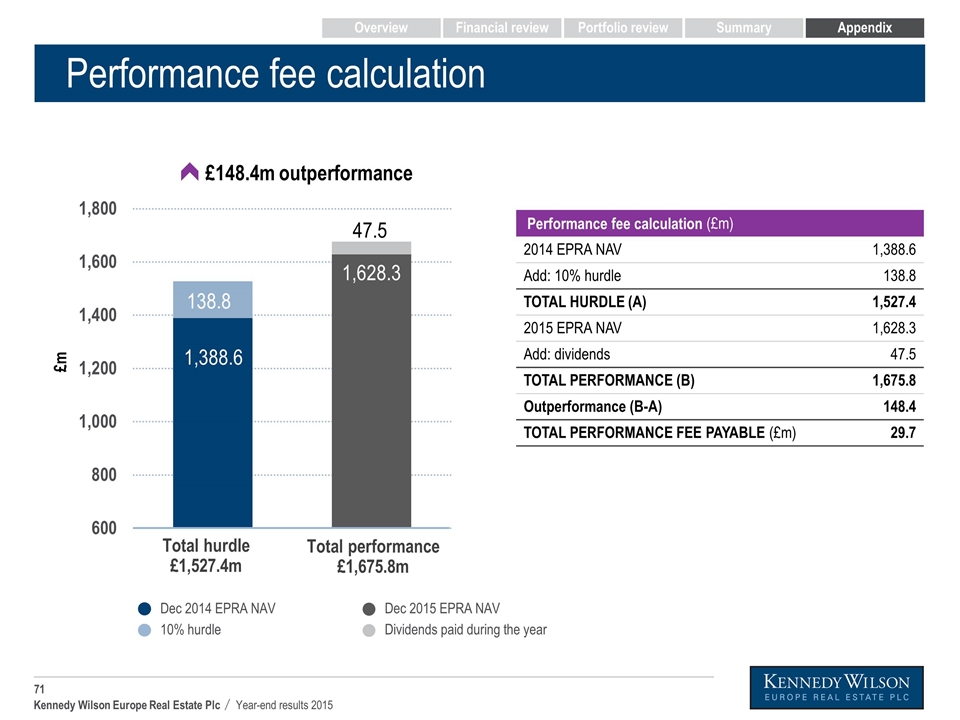
Performance fee calculation Total hurdle £1,527.4m Total performance £1,675.8m Dec 2014 EPRA NAV 10% hurdle £m Dec 2015 EPRA NAV Dividends paid during the year £148.4m outperformance Performance fee calculation (£m) 2014 EPRA NAV 1,388.6 Add: 10% hurdle 138.8 TOTAL HURDLE (A) 1,527.4 2015 EPRA NAV 1,628.3 Add: dividends 47.5 TOTAL PERFORMANCE (B) 1,675.8 Outperformance (B-A) 148.4 TOTAL PERFORMANCE FEE PAYABLE (£m) 29.7 Overview Financial review Portfolio review Summary Appendix
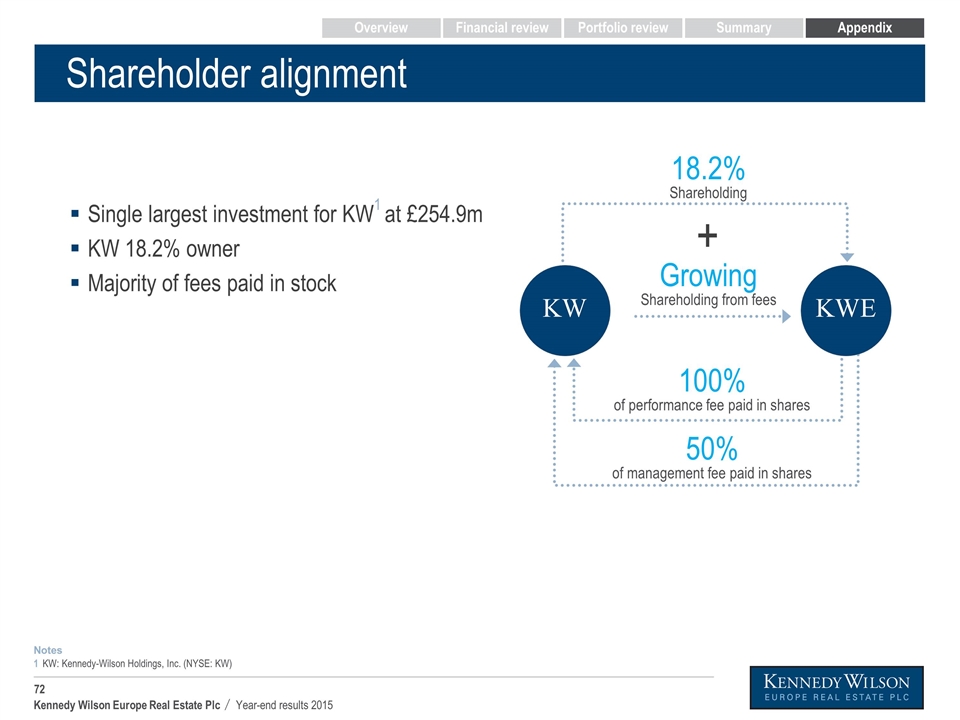
Shareholder alignment + KW: Kennedy-Wilson Holdings, Inc. (NYSE: KW) 1 Notes 18.2% Shareholding 100% of performance fee paid in shares 50% of management fee paid in shares KWE Growing Shareholding from fees KW Overview Financial review Portfolio review Summary Appendix Single largest investment for KW1 at £254.9m KW 18.2% owner Majority of fees paid in stock
Disclaimer This presentation is being provided to you for information purposes only. This presentation does not constitute an offering of securities or otherwise constitute an offer or invitation or inducement to any person to underwrite, subscribe for or otherwise acquire or dispose of securities in Kennedy Wilson Europe Real Estate Plc (“KWE”, and together with its subsidiaries, the “PLC Group”). KWE has not been, and will not be, registered under the US Investment Company Act of 1940, as amended. KWE's assets are managed by KW Investment Management Ltd (the “Investment Manager”), an indirect wholly owned subsidiary of Kennedy-Wilson Holdings, Inc. This presentation may not be reproduced in any form, further distributed or passed on, directly or indirectly, to any other person, or published, in whole or in part, for any purpose. Certain statements in this presentation are forward-looking statements which are based on the PLC Group's expectations, intentions and projections regarding its future performance, anticipated events or trends and other matters that are not historical facts. These statements are not guarantees of future performance and are subject to known and unknown risks, uncertainties and other factors that could cause actual results to differ materially from those expressed or implied by such forward-looking statements. Factors that would cause actual results or events to differ from current expectations, intentions or projections might include, amongst other things, changes in property prices, changes in equity markets, political risks, changes to regulations affecting the PLC Group's activities and delays in obtaining or failure to obtain any required regulatory approval. Given these risks and uncertainties, readers should not place undue reliance on forward-looking statements. Forward-looking statements speak only as of the date of such statements and, except as required by applicable law, no member of the PLC Group undertakes any obligation to update or revise publicly any forward-looking statements, whether as a result of new information, future events or otherwise. Past performance is no guide to future performance and persons needing advice should consult an independent financial adviser. Nothing in this presentation should be construed as a profit forecast. The information in this presentation, which does not purport to be comprehensive, has not been verified by the PLC Group or any other person. No representation or warranty, express or implied, is or will be given by any member of the PLC Group or its directors, officers, employees or advisers or any other person as to the accuracy or completeness of the presentation or any projections, targets, estimates, forecasts or opinions contained therein and, so far as permitted by law, no responsibility or liability is accepted for the accuracy or sufficiency thereof, or for any errors, omissions or miss-statements, negligent or otherwise, relating thereto. In particular, but without limitation, (subject as aforesaid) no representation or warranty, express or implied, is given as to the achievement or reasonableness of, and no reliance should be placed on any projections, targets, estimates or forecasts and nothing in this presentation is or should be relied on as a promise or representation as to the future. Accordingly, (subject as aforesaid), no member of the PLC Group, nor any of its directors, officers, employees or advisers, nor any other person, shall be liable for any direct, indirect or consequential loss or damage suffered by any person as a result of relying on any statement in or omission from the presentation or any other written or oral communication with the recipient or its advisers in connection with the presentation and (save in the case of fraudulent misrepresentation or wilful non-disclosure) any such liability is expressly disclaimed. The market data in the presentation has been sourced from third parties and has been so identified. In furnishing this presentation, the PLC Group does not undertake any obligation to provide any additional information or to update this presentation or to correct any inaccuracies that may become apparent. All property valuations in this presentation at 31 December 2015 have been undertaken by third party external valuers under RICS Red Book. CBRE have valued the direct property assets (other than FIP which was completed by Colliers) and the loan portfolios have been fair valued by Duff & Phelps, in each case at 31 December 2015. Unless stated otherwise, information presented “to date” is information as at 25 February 2016 or for the period from 1 January 2015 to 25 February 2016, and any PPE information presented under “PPE” is information for the period from 1 January 2016 to 25 February 2016. Unless stated otherwise, where balance sheet amounts in this presentation are presented in both £ and €, the £ amount has been calculated based on an exchange rate of €1:£0.73701, which was the rate on 31 December 2015. Income Statement amounts were translated at the average rate for the year.
