Exhibit 99.6
I N V E S T O R P R E S E N T A T I O N APRIL 2017
FORWARD-LOOKING STATEMENTS This presentation contains forward-looking statements concerning future events and financial performance. These forward-looking statements are necessarily estimates reflecting the judgment of senior management based on current estimates, expectations, forecasts and projections and include comments that express current opinions about trends and factors that may impact future operating results. Disclosures that use words such as believe, anticipate, estimate, intend, could, plan, expect, project or the negative of these, as well as similar expressions, are intended to identify forward-looking statements. Forward-looking statements are not guarantees of future performance, rely on a number of assumptions concerning future events, many of which are outside of the companies control, and involve known and unknown risks and uncertainties that could cause actual results, performance or achievement, or industry results, to differ materially from any future results, performance or achievements, expressed or implied by such forward-looking statements. No assurance can be given that the proposed acquisition described in this presentation (the Transaction ) will occur on terms described herein or at all. In evaluating these statements, you should specifically consider the risks referred to in our filings with the SEC, including our Form 10-K, which are available on our website and at www.sec.gov, including, but not limited to, the following factors: the occurrence of any event, change or other circumstance that could result in abandonment of the Transaction; the inability to complete the Transaction in a timely manner or at all; difficulties in successfully integrating the two companies following completion of the Transaction and the risk of not fully realizing expected synergies from the Transaction in the time frame expected or at all; the risk that the announcement and pendency of the Transaction disrupts current plans and operations, increases operating costs, results in management distraction or difficulties in establishing and maintaining relationships with third parties or makes employee retention and incentivization more difficult; the outcome of any legal proceedings that may be instituted against the companies in connection with the announcement and pendency of the Transaction; any limitations on the companies ability to operate their businesses during the pendency of the Transaction; disruptions in general economic and business conditions, particularly in geographies where the companies respective businesses may be concentrated; volatility and disruption of the capital and credit markets, higher interest rates, higher loan costs, less desirable loan terms and a reduction in the availability of mortgage loans, all of which could increase costs and could limit the companies ability to acquire additional real estate assets; continued high levels of, or increases in, unemployment and general slowdowns in commercial activity; the companies leverage and ability to refinance existing indebtedness or incur additional indebtedness; an increase in the companies debt service obligations; the companies ability to generate a sufficient amount of cash from operations to satisfy working capital requirements and to service their existing and future indebtedness; the companies ability to achieve improvements in operating efficiency; foreign currency fluctuations; adverse changes in the securities markets; the companies ability to retain their senior management and attract and retain qualified and experienced employees; the companies ability to retain major clients and renew related contracts; trends in use of large, full-service commercial real estate providers; changes in tax laws in the United States, Europe or Japan or other jurisdictions that reduce or eliminate deductions or other tax benefits the companies receive; the possibility that future acquisitions may not be available at favorable prices or upon advantageous terms and conditions; the companies ability to dispose of assets; and costs relating to the acquisition of assets the companies may acquire could be higher than anticipated. Any such forward-looking statements, whether made in this presentation or elsewhere, should be considered in the context of the various disclosures made by the companies about their respective businesses including, without limitation, the factors discussed above. Except as required by law, neither Kennedy- Wilson Holdings, Inc. ( Kennedy Wilson or KW ) nor Kennedy Wilson Europe Real Estate PLC ( Kennedy Wilson Europe or KWE ) intends to update publicly any forward-looking statements, whether as a result of new information, future events, changes in assumptions or otherwise.
ADDITIONAL INFORMATION AND WHERE TO FIND IT This presentation may be deemed to be solicitation material in respect of the proposed transaction between KW and KWE, including the issuance of shares of KW common stock in respect of the proposed transaction. In connection with such proposed issuance of KW common stock, KW expects to file a proxy statement on Schedule 14A with the Securities and Exchange Commission (the SEC ). To the extent KW effects the acquisition of KWE as a scheme under Jersey law, the issuance of KW common stock in the acquisition would not be expected to require registration under the Securities Act of 1933, as amended (the Securities Act ), pursuant to an exemption provided by Section 3(a)(10) under the Securities Act. In the event that KW determines to conduct the acquisition pursuant to an offer or otherwise in a manner that is not exempt from the registration requirements of the Securities Act, it will file a registration statement with the SEC containing a prospectus with respect to the KW common stock that would be issued in the acquisition. INVESTORS AND SECURITY HOLDERS OF KW ARE URGED TO READ THESE MATERIALS (INCLUDING ANY AMENDMENTS OR SUPPLEMENTS THERETO) AND ANY OTHER RELEVANT DOCUMENTS IN CONNECTION WITH THE ACQUISITION THAT KW WILL FILE WITH THE SEC WHEN THEY BECOME AVAILABLE BECAUSE THEY WILL CONTAIN IMPORTANT INFORMATION ABOUT KW, THE PROPOSED ISSUANCE OF KW COMMON STOCK, AND THE PROPOSED ACQUISITION. The proxy statement and other relevant materials in connection with the proposed issuance of KW common stock and the acquisition (when they become available), and if required, the registration statement/prospectus and other documents filed by KW with the SEC, may be obtained free of charge at the SEC s website at www.sec.gov. In addition, investors and security holders may obtain free copies of the documents filed with the SEC at KW s website, www.KennedyWilson.com, or by contacting our Investor Relations department in writing at 151 S. El Camino Dr. Beverly Hills, CA 90212. KW, KWE, their respective directors and certain of KW s executive officers may be deemed to be participants in the solicitation of proxies from KW stockholders with respect to the proposed acquisition, including the proposed issuance of KW shares. Information about KW s directors and executive officers and their ownership of KW shares and KWE shares or securities referencing KWE shares is provided in KW s Annual Report on Form 10-K for the fiscal year ended December 31, 2016, which was filed with the SEC on February 27, 2017, KW s proxy statement for its 2016 Annual Meeting of Stockholders, which was filed with the SEC on April 29, 2016, and KWE s Annual Report for the year ended December 31, 2016, which was filed with the SEC by KW on Form 8-K on March 23, 2017. Information about the directors of KWE is provided in KWE s Annual Report for the year ended December 31, 2016, which was filed with the SEC by KW on Form 8-K on March 23, 2017. Information regarding the identity of the potential participants, and their direct or indirect interests in the solicitation, by security holdings or otherwise, will be provided in the proxy statement and other materials to be filed with the SEC in connection with the proposed acquisition and issuance of shares of KW common stock. NON-GAAP MEASURES This presentation refers to certain non-GAAP measures including adjusted EBITDA and adjusted net income. You can find a description and other important information regarding adjusted EBITDA, adjusted net income and other non-GAAP financial measures used by KW in page 23 of this presentation and a reconciliation of the most directly comparable GAAP financial measures in page 22 of this presentation.
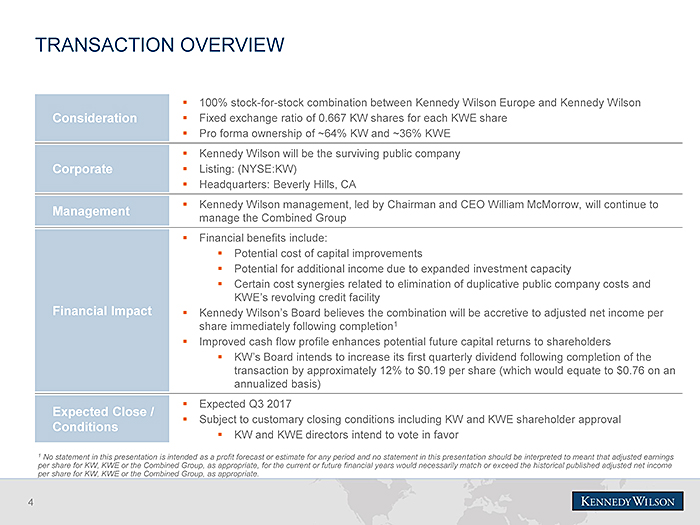
TRANSACTION OVERVIEW 100% stock-for-stock combination between Kennedy Wilson Europe and Kennedy Wilson Consideration Fixed exchange ratio of 0.667 KW shares for each KWE share Pro forma ownership of ~64% KW and ~36% KWE Kennedy Wilson will be the surviving public company Corporate Listing: (NYSE:KW) Headquarters: Beverly Hills, CA Kennedy Wilson management, led by Chairman and CEO William McMorrow, will continue to Management manage the Combined Group Financial benefits include: Potential cost of capital improvements Potential for additional income due to expanded investment capacity Certain cost synergies related to elimination of duplicative public company costs and KWE s revolving credit facility Financial Impact Kennedy Wilson s Board believes the combination will be accretive to adjusted net income per share immediately following completion1 Improved cash flow profile enhances potential future capital returns to shareholders KW s Board intends to increase its first quarterly dividend following completion of the transaction by approximately 12% to $0.19 per share (which would equate to $0.76 on an annualized basis) Expected Q3 2017 Expected Close / Subject to customary closing conditions including KW and KWE shareholder approval Conditions KW and KWE directors intend to vote in favor 1 No statement in this presentation is intended as a profit forecast or estimate for any period and no statement in this presentation should be interpreted to meant that adjusted earnings per share for KW, KWE or the Combined Group, as appropriate, for the current or future financial years would necessarily match or exceed the historical published adjusted net income per share for KW, KWE or the Combined Group, as appropriate.
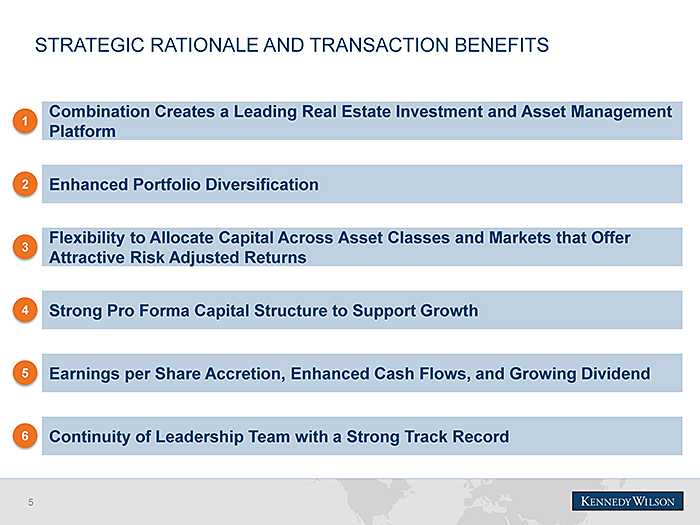
STRATEGIC RATIONALE AND TRANSACTION BENEFITS Combination Creates a Leading Real Estate Investment and Asset Management 1 Platform 2 Enhanced Portfolio Diversification Flexibility to Allocate Capital Across Asset Classes and Markets that Offer 3 Attractive Risk Adjusted Returns 4 Strong Pro Forma Capital Structure to Support Growth 5 Earnings per Share Accretion, Enhanced Cash Flows, and Growing Dividend 6 Continuity of Leadership Team with a Strong Track Record
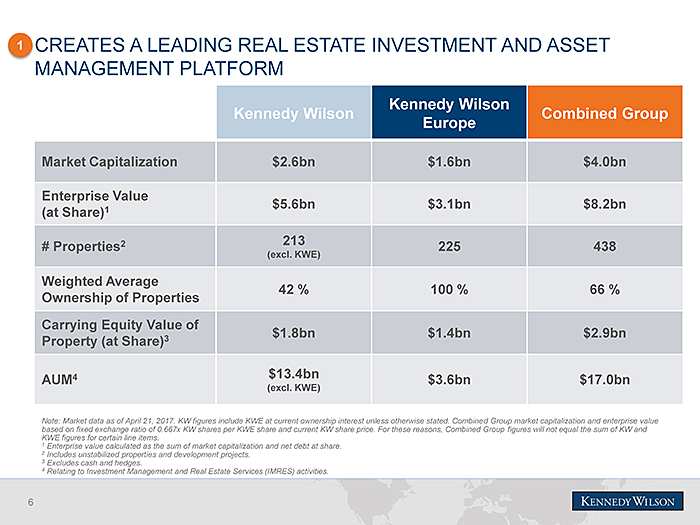
1 CREATES A LEADING REAL ESTATE INVESTMENT AND ASSET MANAGEMENT PLATFORM Kennedy Wilson Kennedy Wilson Europe Combined Group Market Capitalization $2.6bn $1.6bn $4.0bn Enterprise Value $5.6bn $3.1bn $8.2bn (at Share)1 # Properties2 213 225 438 (excl. KWE) Weighted Average 42 % 100 % 66 % Ownership of Properties Carrying Equity Value of Property (at Share)3 $1.8bn $1.4bn $2.9bn AUM4 $13.4bn $3.6bn $17.0bn (excl. KWE) Note: Market data as of April 21, 2017. KW figures include KWE at current ownership interest unless otherwise stated. Combined Group market capitalization and enterprise value based on fixed exchange ratio of 0.667x KW shares per KWE share and current KW share price. For these reasons, Combined Group figures will not equal the sum of KW and KWE figures for certain line items. 1 Enterprise value calculated as the sum of market capitalization and net debt at share. 2 Includes unstabilized properties and development projects. 3 Excludes cash and hedges. 4 Relating to Investment Management and Real Estate Services (IMRES) activities.
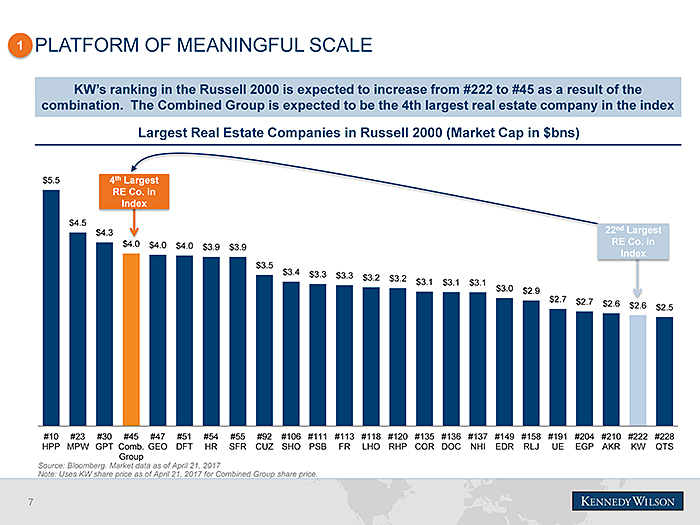
1 PLATFORM OF MEANINGFUL SCALE KW s ranking in the Russell 2000 is expected to increase from #222 to #45 as a result of the combination. The Combined Group is expected to be the 4th largest real estate company in the index Largest Real Estate Companies in Russell 2000 (Market Cap in $bns) $5.5 4th Largest RE Co. in Index $4.5 22nd Largest $4.3 $4.0 RE Co. in $4.0 $3.9 $3.9 Index $3.5 $3.4 $3.3 $3.3 $3.2 $3.2 $3.1 $3.1 $3.1 $3.0 $2.9 $2.7 $2.7 $2.6 $2.5 #10 #23 #30 #45 #47 #51 #54 #55 #92 #106 #111 #113 #118 #120 #135 #136 #137 #149 #158 #191 #204 #210 #222 #228 HPP MPW GPT Comb. GEO DFT HR SFR CUZ SHO PSB FR LHO RHP COR DOC NHI EDR RLJ UE EGP AKR KW QTS Group Source: Bloomberg. Market data as of April 21, 2017 Note: Uses KW share price as of April 21, 2017 for Combined Group share price.
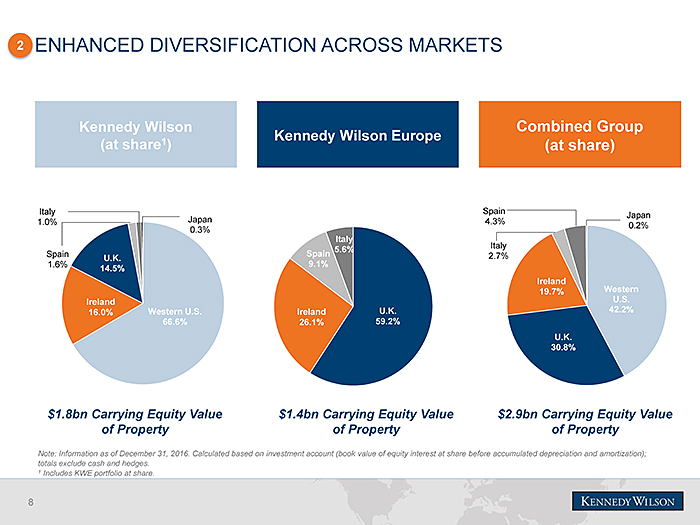
2 ENHANCED DIVERSIFICATION ACROSS MARKETS Kennedy Wilson Combined Group Kennedy Wilson Europe (at share1) (at share) Italy Spain Japan 1.0% Japan 4.3% 0.2% 0.3% Italy Spain 5.6% Italy Spain 2.7% U.K. 1.6% 9.1% 14.5% Ireland Western 19.7% U.S. Ireland 42.2% 16.0% Western U.S. Ireland U.K. 66.6% 26.1% 59.2% U.K. 30.8% $1.8bn Carrying Equity Value $1.4bn Carrying Equity Value $2.9bn Carrying Equity Value of Property of Property of Property Note: Information as of December 31, 2016. Calculated based on investment account (book value of equity interest at share before accumulated depreciation and amortization); totals exclude cash and hedges. 1 Includes KWE portfolio at share.

2 ENHANCED DIVERSIFICATION ACROSS ASSET CLASSES Kennedy Wilson Combined Group Kennedy Wilson Europe (at share1) (at share) Industrial Resid., Loans & Other Hotels Industrial 1.1% 2.4% 2.4% 3.0% Industrial Hotels Hotels 6.2% 7.1% 9.8% Resid., Multifamily Multifamily Loans & Retail Office 36.1% 7.3% Other 14.3% Office 32.7% 10.1% 47.7% Resid., Retail Retail 21.5% Loans & 34.1% Other Multifamily 14.6% Office 25.6% 24.1% $1.8bn Carrying Equity Value $1.4bn Carrying Equity Value $2.9bn Carrying Equity Value of Property of Property of Property Note: Information as of December 31, 2016. Calculated based on investment account (book value of equity interest at share before accumulated depreciation and amortization); totals exclude cash and hedges. 1 Includes KWE portfolio at share.
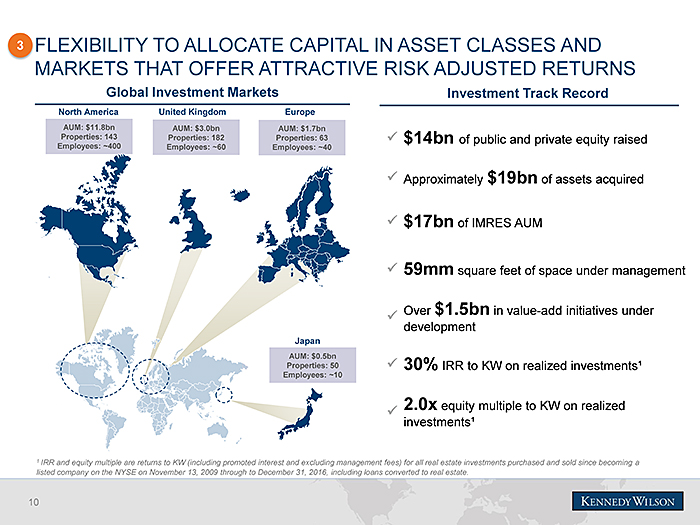
3 FLEXIBILITY TO ALLOCATE CAPITAL IN ASSET CLASSES AND MARKETS THAT OFFER ATTRACTIVE RISK ADJUSTED RETURNS Global Investment Markets Investment Track Record North America United Kingdom Europe AUM: $11.8bn AUM: $3.0bn AUM: $1.7bn Properties: 143 Properties: 182 Properties: 63 $14bn of public and private equity raised Employees: ~400 Employees: ~60 Employees: ~40 Approximately $19bn of assets acquired $17bn of IMRES AUM 59mm square feet of space under management Over $1.5bn in value-add initiatives under development Japan AUM: $0.5bn Properties: 50 30% IRR to KW on realized investments Employees: ~10 2.0x equity multiple to KW on realized investments 1 IRR and equity multiple are returns to KW (including promoted interest and excluding management fees) for all real estate investments purchased and sold since becoming a listed company on the NYSE on November 13, 2009 through to December 31, 2016, including loans converted to real estate.
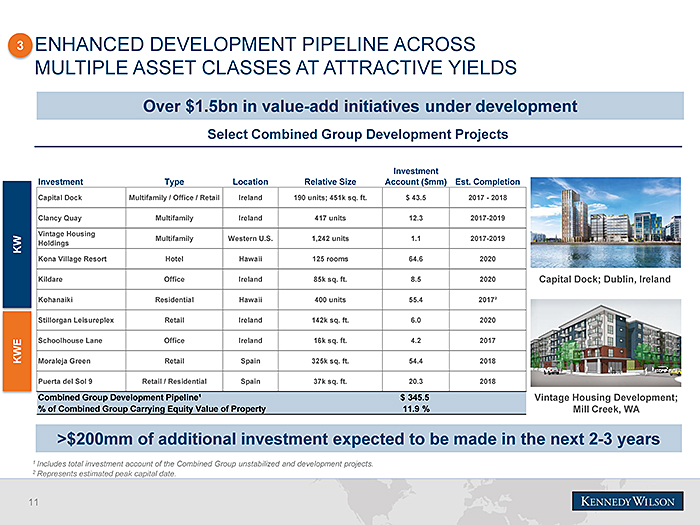
3 ENHANCED DEVELOPMENT PIPELINE ACROSS MULTIPLE ASSET CLASSES AT ATTRACTIVE YIELDS Over $1.5bn in value-add initiatives under development Select Combined Group Development Projects Investment Investment Type Location Relative Size Account ($mm) Est. Completion Capital Dock Multifamily / Office / Retail Ireland 190 units; 451k sq. ft. $ 43.5 2017—2018 Clancy Quay Multifamily Ireland 417 units 12.3 2017-2019 Vintage Housing Multifamily Western U.S. 1,242 units 1.1 2017-2019 KW Holdings Kona Village Resort Hotel Hawaii 125 rooms 64.6 2020 Kildare Office Ireland 85k sq. ft. 8.5 2020 Capital Dock; Dublin, Ireland Kohanaiki Residential Hawaii 400 units 55.4 2017 Stillorgan Leisureplex Retail Ireland 142k sq. ft. 6.0 2020 Schoolhouse Lane Office Ireland 16k sq. ft. 4.2 2017 KWE Moraleja Green Retail Spain 325k sq. ft. 54.4 2018 Puerta del Sol 9 Retail / Residential Spain 37k sq. ft. 20.3 2018 Combined Group Development Pipeline $ 345.5 Vintage Housing Development; % of Combined Group Carrying Equity Value of Property 11.9 % Mill Creek, WA >$200mm of additional investment expected to be made in the next 2-3 years 1 Includes total investment account of the Combined Group unstabilized and development projects. 2 Represents estimated peak capital date.
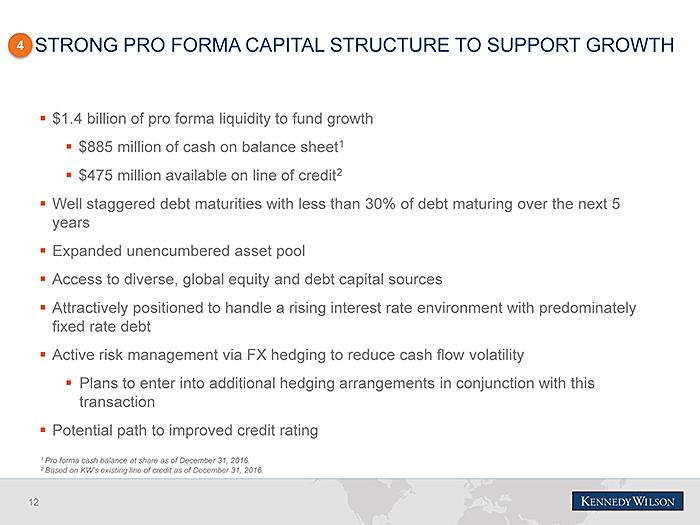
4 STRONG PRO FORMA CAPITAL STRUCTURE TO SUPPORT GROWTH $1.4 billion of pro forma liquidity to fund growth $885 million of cash on balance sheet1 $475 million available on line of credit2 Well staggered debt maturities with less than 30% of debt maturing over the next 5 years Expanded unencumbered asset pool Access to diverse, global equity and debt capital sources Attractively positioned to handle a rising interest rate environment with predominately fixed rate debt Active risk management via FX hedging to reduce cash flow volatility Plans to enter into additional hedging arrangements in conjunction with this transaction Potential path to improved credit rating 1 Pro forma cash balance at share as of December 31, 2016. 2 Based on KW s existing line of credit as of December 31, 2016.
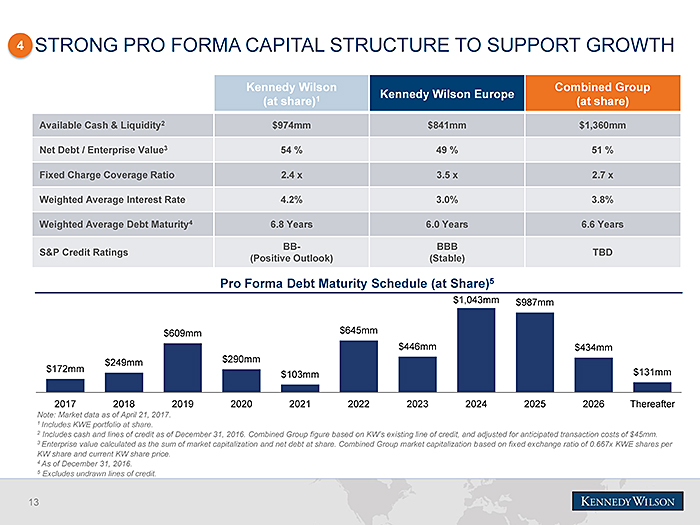
4 STRONG PRO FORMA CAPITAL STRUCTURE TO SUPPORT GROWTH Kennedy Wilson Combined Group Kennedy Wilson Europe (at share)1 (at share) Available Cash & Liquidity2 $974mm $841mm $1,360mm Net Debt / Enterprise Value3 54 % 49 % 51 % Fixed Charge Coverage Ratio 2.4 x 3.5 x 2.7 x Weighted Average Interest Rate 4.2% 3.0% 3.8% Weighted Average Debt Maturity4 6.8 Years 6.0 Years 6.6 Years BB- BBB S&P Credit Ratings TBD (Positive Outlook) (Stable) Pro Forma Debt Maturity Schedule (at Share)5 $1,043mm $987mm $609mm $645mm $446mm $434mm $249mm $290mm $172mm $131mm $103mm 2017 2018 2019 2020 2021 2022 2023 2024 2025 2026 Thereafter Note: Market data as of April 21, 2017. 1 Includes KWE portfolio at share. 2 Includes cash and lines of credit as of December 31, 2016. Combined Group figure based on KW’s existing line of credit, and adjusted for anticipated transaction costs of $45mm. 3 Enterprise value calculated as the sum of market capitalization and net debt at share. Combined Group market capitalization based on fixed exchange ratio of 0.667x KWE shares per KW share and current KW share price. 4 As of December 31, 2016. 5 Excludes undrawn lines of credit.
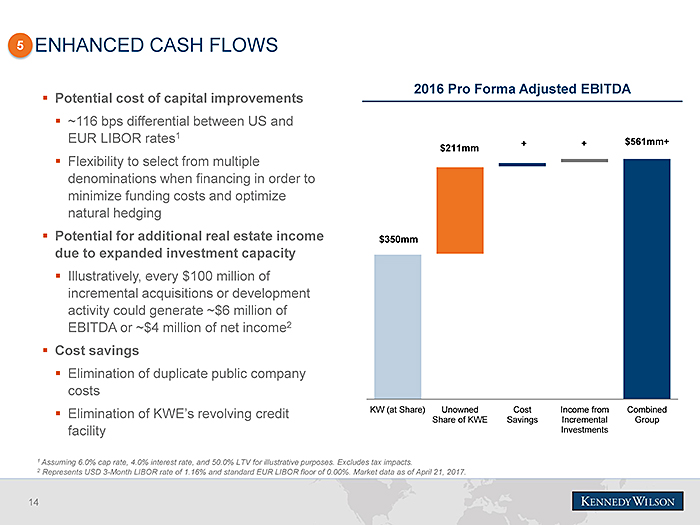
5 ENHANCED CASH FLOWS 2016 Pro Forma Adjusted EBITDA Potential cost of capital improvements ~116 bps differential between US and EUR LIBOR rates1 + + $561mm+ $211mm Flexibility to select from multiple denominations when financing in order to minimize funding costs and optimize natural hedging Potential for additional real estate income $350mm due to expanded investment capacity Illustratively, every $100 million of incremental acquisitions or development activity could generate ~$6 million of EBITDA or ~$4 million of net income2 Cost savings Elimination of duplicate public company costs Elimination of KWE’s revolving credit KW (at Share) Unowned Cost Income from Combined Share of KWE Savings Incremental Group facility Investments 1 Assuming 6.0% cap rate, 4.0% interest rate, and 50.0% LTV for illustrative purposes. Excludes tax impacts. 2 Represents USD 3-Month LIBOR rate of 1.16% and standard EUR LIBOR floor of 0.00%. Market data as of April 21, 2017.
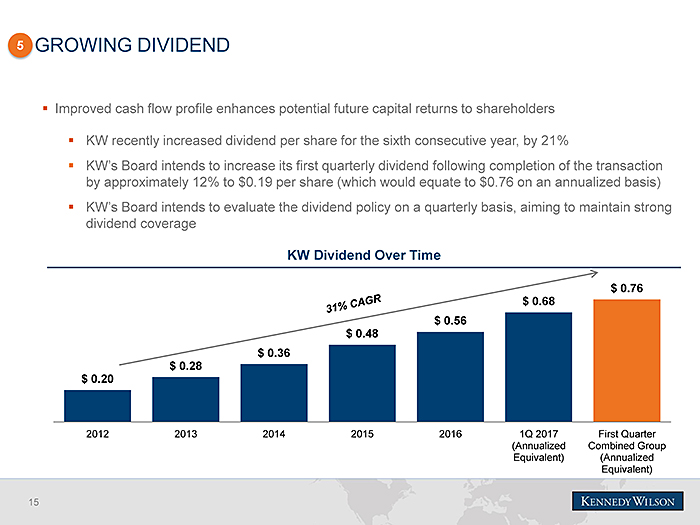
5 GROWING DIVIDEND Improved cash flow profile enhances potential future capital returns to shareholders KW recently increased dividend per share for the sixth consecutive year, by 21% KW’s Board intends to increase its first quarterly dividend following completion of the transaction by approximately 12% to $0.19 per share (which would equate to $0.76 on an annualized basis) KW’s Board intends to evaluate the dividend policy on a quarterly basis, aiming to maintain strong dividend coverage KW Dividend Over Time $ 0.76 $ 0.68 $ 0.56 $ 0.48 $ 0.36 $ 0.28 $ 0.20 2012 2013 2014 2015 2016 1Q 2017 First Quarter (Annualized Combined Group Equivalent) (Annualized Equivalent)
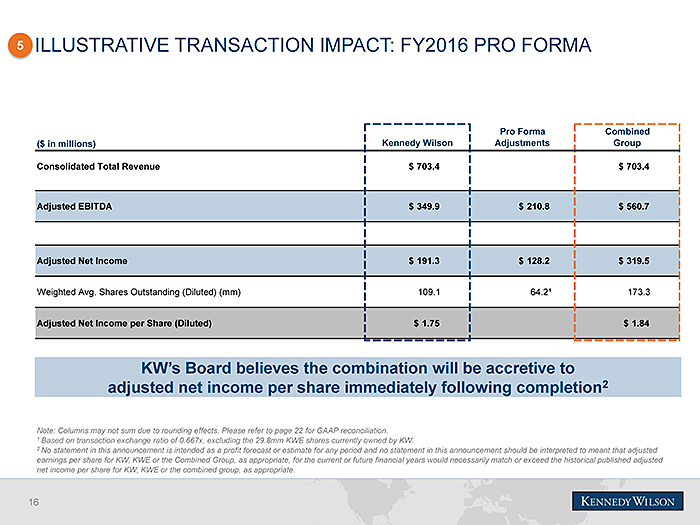
5 ILLUSTRATIVE TRANSACTION IMPACT: FY2016 PRO FORMA Pro Forma Combined ($ in millions) Kennedy Wilson Adjustments Group Consolidated Total Revenue $ 703.4 $ 703.4 Adjusted EBITDA $ 349.9 $ 210.8 $ 560.7 Adjusted Net Income $ 191.3 $ 128.2 $ 319.5 Weighted Avg. Shares Outstanding (Diluted) (mm) 109.1 64.2¹ 173.3 Adjusted Net Income per Share (Diluted) $ 1.75 $ 1.84 KW’s Board believes the combination will be accretive to adjusted net income per share immediately following completion2 Note: Columns may not sum due to rounding effects. Please refer to page 22 for GAAP reconciliation. 1 Based on transaction exchange ratio of 0.667x, excluding the 29.8mm KWE shares currently owned by KW. 2 No statement in this announcement is intended as a profit forecast or estimate for any period and no statement in this announcement should be interpreted to meant that adjusted earnings per share for KW, KWE or the Combined Group, as appropriate, for the current or future financial years would necessarily match or exceed the historical published adjusted net income per share for KW, KWE or the combined group, as appropriate.
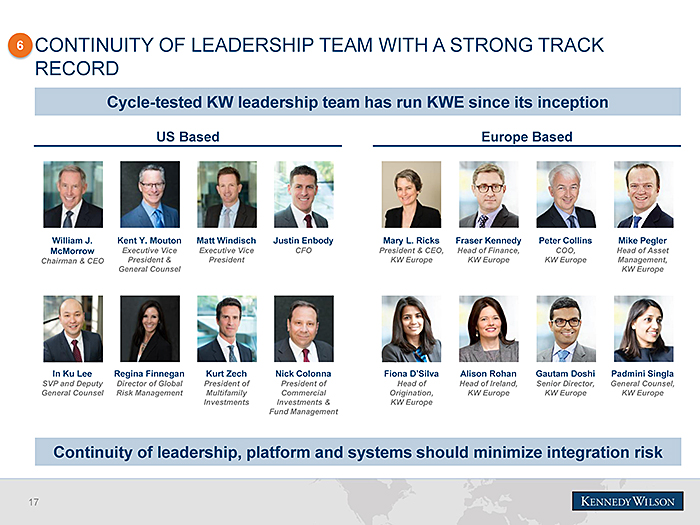
6 CONTINUITY OF LEADERSHIP TEAM WITH A STRONG TRACK RECORD Cycle-tested KW leadership team has run KWE since its inception US Based Europe Based William J. Kent Y. Mouton Matt Windisch Justin Enbody Mary L. Ricks Fraser Kennedy Peter Collins Mike Pegler McMorrow Executive Vice Executive Vice CFO President & CEO, Head of Finance, COO, Head of Asset Chairman & CEO President & President KW Europe KW Europe KW Europe Management, General Counsel KW Europe In Ku Lee Regina Finnegan Kurt Zech Nick Colonna Fiona D’Silva Alison Rohan Gautam Doshi Padmini Singla SVP and Deputy Director of Global President of President of Head of Head of Ireland, Senior Director, General Counsel, General Counsel Risk Management Multifamily Commercial Origination, KW Europe KW Europe KW Europe Investments Investments & KW Europe Fund Management Continuity of leadership, platform and systems should minimize integration risk
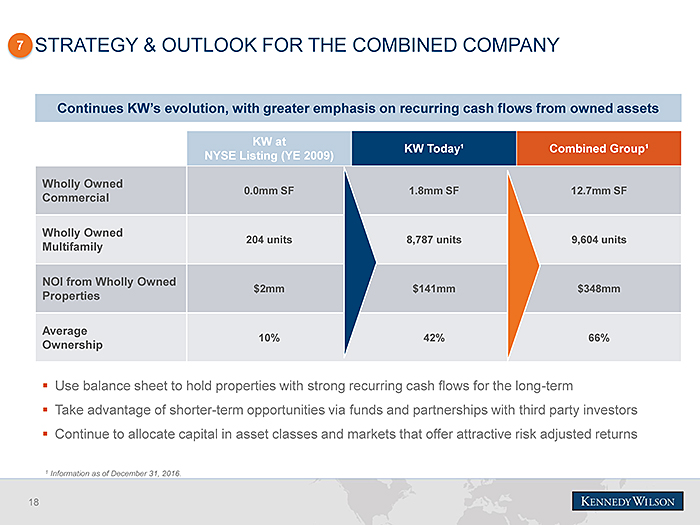
7 STRATEGY & OUTLOOK FOR THE COMBINED COMPANY Continues KW’s evolution, with greater emphasis on recurring cash flows from owned assets KW at KW Today¹ Combined Group¹ NYSE Listing (YE 2009) Wholly Owned 0.0mm SF 1.8mm SF 12.7mm SF Commercial Wholly Owned 204 units 8,787 units 9,604 units Multifamily NOI from Wholly Owned $2mm $141mm $348mm Properties Average 10% 42% 66% Ownership Use balance sheet to hold properties with strong recurring cash flows for the long-term Take advantage of shorter-term opportunities via funds and partnerships with third party investors Continue to allocate capital in asset classes and markets that offer attractive risk adjusted returns 1 Information as of December 31, 2016.
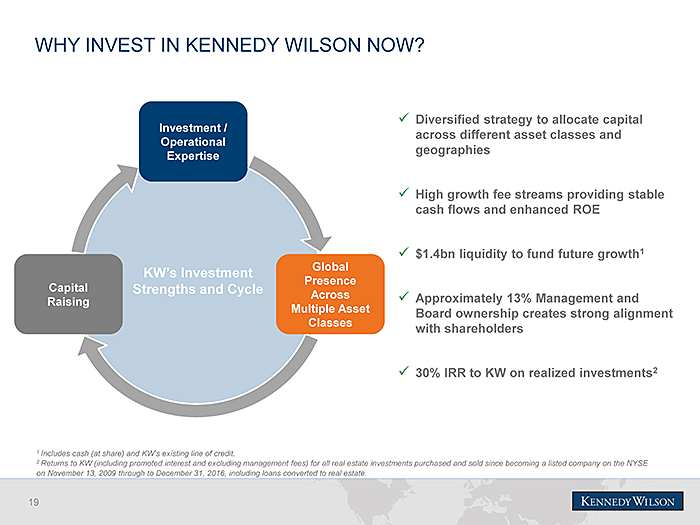
WHY INVEST IN KENNEDY WILSON NOW Diversified strategy to allocate capital Investment / across different asset classes and Operational geographies Expertise High growth fee streams providing stable cash flows and enhanced ROE $1.4bn liquidity to fund future growth1 KW’s Investment Global Presence Capital Strengths and Cycle Across Approximately 13% Management and Raising Multiple Asset Board ownership creates strong alignment Classes with shareholders 30% IRR to KW on realized investments2 1 Includes cash (at share) and KW’s existing line of credit. 2 Returns to KW (including promoted interest and excluding management fees) for all real estate investments purchased and sold since becoming a listed company on the NYSE on November 13, 2009 through to December 31, 2016, including loans converted to real estate.
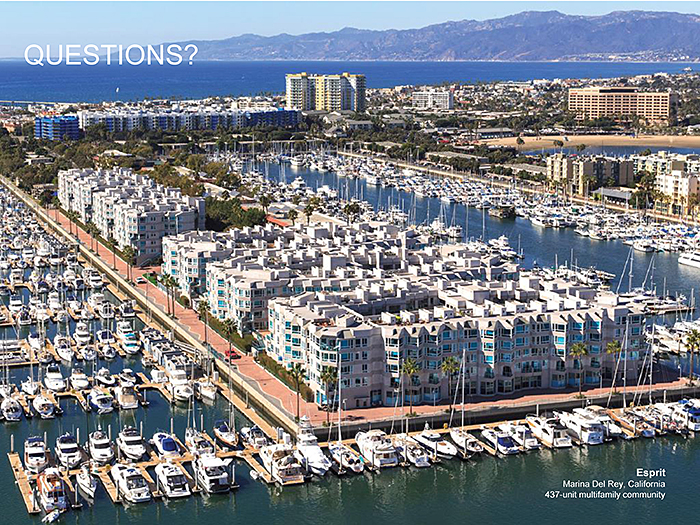
QUESTIONS Esprit Marina Del Rey, California 437-unit multifamily community

APPENDIX Buckingham Palace Road London, England ~224,000 sq. ft. office
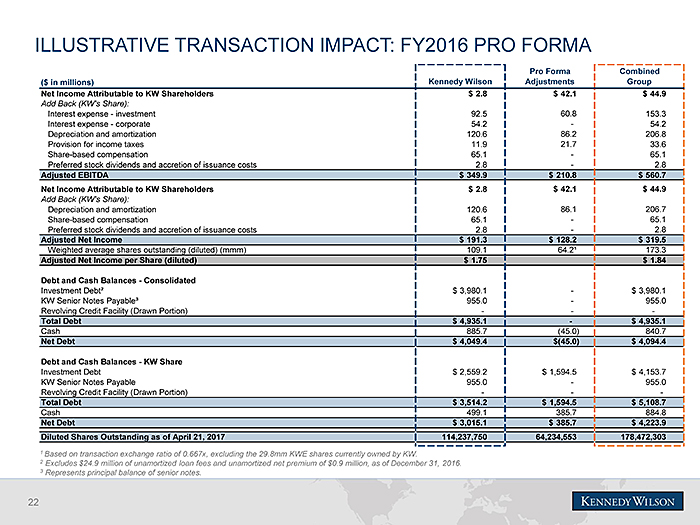
ILLUSTRATIVE TRANSACTION IMPACT: FY2016 PRO FORMA Pro Forma Combined ($ in millions) Kennedy Wilson Adjustments Group Net Income Attributable to KW Shareholders $ 2.8 $ 42.1 $ 44.9 Add Back (KW’s Share): Interest expense—investment 92.5 60.8 153.3 Interest expense—corporate 54.2 —54.2 Depreciation and amortization 120.6 86.2 206.8 Provision for income taxes 11.9 21.7 33.6 Share-based compensation 65.1 —65.1 Preferred stock dividends and accretion of issuance costs 2.8 —2.8 Adjusted EBITDA $ 349.9 $ 210.8 $ 560.7 Net Income Attributable to KW Shareholders $ 2.8 $ 42.1 $ 44.9 Add Back (KW’s Share): Depreciation and amortization 120.6 86.1 206.7 Share-based compensation 65.1 —65.1 Preferred stock dividends and accretion of issuance costs 2.8 —2.8 Adjusted Net Income $ 191.3 $ 128.2 $ 319.5 Weighted average shares outstanding (diluted) (mmm) 109.1 64.2¹ 173.3 Adjusted Net Income per Share (diluted) $ 1.75 $ 1.84 Debt and Cash Balances—Consolidated Investment Debt² $ 3,980.1 —$ 3,980.1 KW Senior Notes Payable³ 955.0 —955.0 Revolving Credit Facility (Drawn Portion) — — —Total Debt $ 4,935.1 —$ 4,935.1 Cash 885.7 (45.0) 840.7 Net Debt $ 4,049.4 $(45.0) $ 4,094.4 Debt and Cash Balances—KW Share Investment Debt $ 2,559.2 $ 1,594.5 $ 4,153.7 KW Senior Notes Payable 955.0 —955.0 Revolving Credit Facility (Drawn Portion) — — —Total Debt $ 3,514.2 $ 1,594.5 $ 5,108.7 Cash 499.1 385.7 884.8 Net Debt $ 3,015.1 $ 385.7 $ 4,223.9 Diluted Shares Outstanding as of April 21, 2017 114,237,750 64,234,553 178,472,303 1 Based on transaction exchange ratio of 0.667x, excluding the 29.8mm KWE shares currently owned by KW. 2 Excludes $24.9 million of unamortized loan fees and unamortized net premium of $0.9 million, as of December 31, 2016. 3 Represents principal balance of senior notes.
DEFINITIONS Adjusted EBITDA: Represents Consolidated EBITDA, as defined below, adjusted to exclude share-based compensation expense and EBITDA attributable to noncontrolling interests. Please also the reconciliation to GAAP included in page 22 of this presentation and also available at www.kennedywilson.com. Our management uses Adjusted EBITDA to analyze our business because it adjusts our net income for items we believe do not accurately reflect the nature of our business going forward or that relate to non-cash compensation expense or noncontrolling interests. Such items may vary for different companies for reasons unrelated to overall operating performance. Additionally, we believe Adjusted EBITDA is useful to investors to assist them in getting a more accurate picture of our results from operations. However, Adjusted EBITDA is not a recognized measurement under GAAP and when analyzing our operating performance, readers should use Adjusted EBITDA in addition to, and not as an alternative for, net income as determined in accordance with GAAP. Because not all companies use identical calculations, our presentation of Adjusted EBITDA may not be comparable to similarly titled measures of other companies. Furthermore, Adjusted EBITDA is not intended to be a measure of free cash flow for our management’s discretionary use, as it does not remove all non-cash items (such as acquisition-related gains) or consider certain cash requirements such as tax and debt service payments. The amount shown for Adjusted EBITDA also differs from the amount calculated under similarly titled definitions in our debt instruments, which are further adjusted to reflect certain other cash and non-cash charges and are used to determine compliance with financial covenants and our ability to engage in certain activities, such as incurring additional debt and making certain restricted payments. Adjusted Fees: Refers to KW’s gross investment management, property services and research fees adjusted to include fees eliminated in consolidation and KW’s share of fees in unconsolidated service businesses. Our management uses Adjusted fees to analyze our investment management and real estate services business because the measure removes required eliminations under GAAP for properties in which the Company provides services but also has an ownership interest. These eliminations understate he economic value of the investment management, property services and research fees and makes the Company comparable to other real estate companies that provide investment management and real estate services but do not have an ownership interest in the properties they manage. Our management believes that adjusting GAAP fees to reflect these amounts eliminated in consolidation presents a more holistic measure of the scope of our investment management and real estate services business. Adjusted Net Income: Represents net income before depreciation and amortization, our share of depreciation and amortization included in income from unconsolidated investments, share-based compensation and net income attributable to noncontrolling interests, before depreciation and amortization. Please also see the reconciliation to GAAP included in page 22 of this presentation and also available at www.kennedywilson.com. Cap Rate: Represents the net operating income of an investment for the year preceding its acquisition or disposition, as applicable, divided by the purchase or sale price, as applicable. Cap rates set forth in this presentation only includes data from income-producing properties. We calculate cap rates based on information that is supplied to us during the acquisition diligence process. This information is often not audited or reviewed by independent accountants and may be presented in a manner that is different from similar information included in our financial statements prepared in accordance with GAAP. In addition, cap rates represent historical performance and are not a guarantee of future NOI. Properties for which a cap rate is provided may not continue to perform at that cap rate. Combined Group at Share: Represents the Combined Group’s share calculated using proportionate economic ownership of each asset in the portfolio. Consolidated EBITDA: Represents net income before noncontrolling interest income, interest expense, the Company’s share of interest expense included in income from investments in unconsolidated investments, depreciation and amortization, the Company’s share of depreciation and amortization included in income from unconsolidated investments, loss on early extinguishment of corporate debt and income taxes. Equity Multiple: Calculated by dividing the amount of total distributions received by KW from an investment (including any gains, return of equity invested by KW and promoted interests) by the amount of total contributions invested by KW in such investment. This metric does not take into account management fees, organizational fees, or other similar expenses, all of which in the aggregate may be substantial and lower the overall return to KW. Equity multiples represent historical performance and are not a guarantee of the future performance of investments. Estimated Annualized NOI: A property-level non-GAAP measure representing the estimated annualized net operating income from each property as of the date shown, inclusive of rent abatements (if applicable). The calculation excludes depreciation and amortization expense, and does not capture the changes in the value of our properties that result from use or market conditions, nor the level of capital expenditures, tenant improvements, and leasing commissions necessary to maintain the operating performance of our properties. Any of the enumerated items above could have a material effect on the performance of our properties. Estimated annualized NOI is not an indicator of the actual annual net operating income that the Company will or expects to realize in any period. Please also see the definition of “Net Operating Income” below. Investment Account: Refers to the consolidated investment account presented after noncontrolling interest on invested assets gross of accumulated depreciation and amortization. Investment Management and Real Estate Services Assets under Management (“IMRES AUM”): Generally refers to the properties and other assets with respect to which we provide (or participate in) oversight, investment management services and other advice, and which generally consist of real estate properties or loans, and investments in joint ventures. Our AUM is principally intended to reflect the extent of our presence in the real estate market, not the basis for determining our management fees. Our AUM consists of the total estimated fair value of the real estate properties and other real estate related assets either owned by third parties, wholly owned by us or held by joint ventures and other entities in which our sponsored funds or investment vehicles and client accounts have invested. Committed (but unfunded) capital from investors in our sponsored funds is not included in our AUM. The estimated value of development properties is included at estimated completion cost. IRR: Based on cumulative distributions to date on each investment and is the leveraged internal rate of return on equity invested in the investment. The IRR measures the return on KW’s investment in each asset including promoted interests, expressed as a compound rate of interest over the entire investment period. This return does not take into account management fees, organizational fees, or other similar expenses, all of which in the aggregate may be substantial and lower the overall return to KW. IRR represents historical performance and is not a guarantee of the future performance of investments. KW at Share: Represents KW’s share calculated using proportionate economic ownership of each asset in the portfolio, including KW’s 23.6% ownership in KWE as of December 31, 2016. Unless otherwise stated, KW ownership of KWE shown at 23.6% as of December 31, 2016. Net Operating Income: A non-GAAP measure representing the income produced by a property calculated by deducting operating expenses from operating revenues. Our management uses net operating income to assess and compare the performance of our properties and to estimate their fair value. Net operating income does not include the effects of depreciation or amortization or gains or losses from the sale of properties because the effects of those items do not necessarily represent the actual change in the value of our properties resulting from our value-add initiatives or changing market conditions. Our management believes that net operating income reflects the core revenues and costs of operating our properties and is better suited to evaluate trends in occupancy and lease rates.
151 S. EL CAMINO DR. | BEVERLY HILLS, CA 90212 | TEL: 310-887-6400 | FAX: 310-887-3410 | WWW.KENNEDYWILSON.COM


