
ANNUAL REPORT AND ACCOUNTS 2015 K en n ed y W ilso n E u ro p e R eal E state P lc / A n n u al R ep o rt an d A cco u n ts 2015
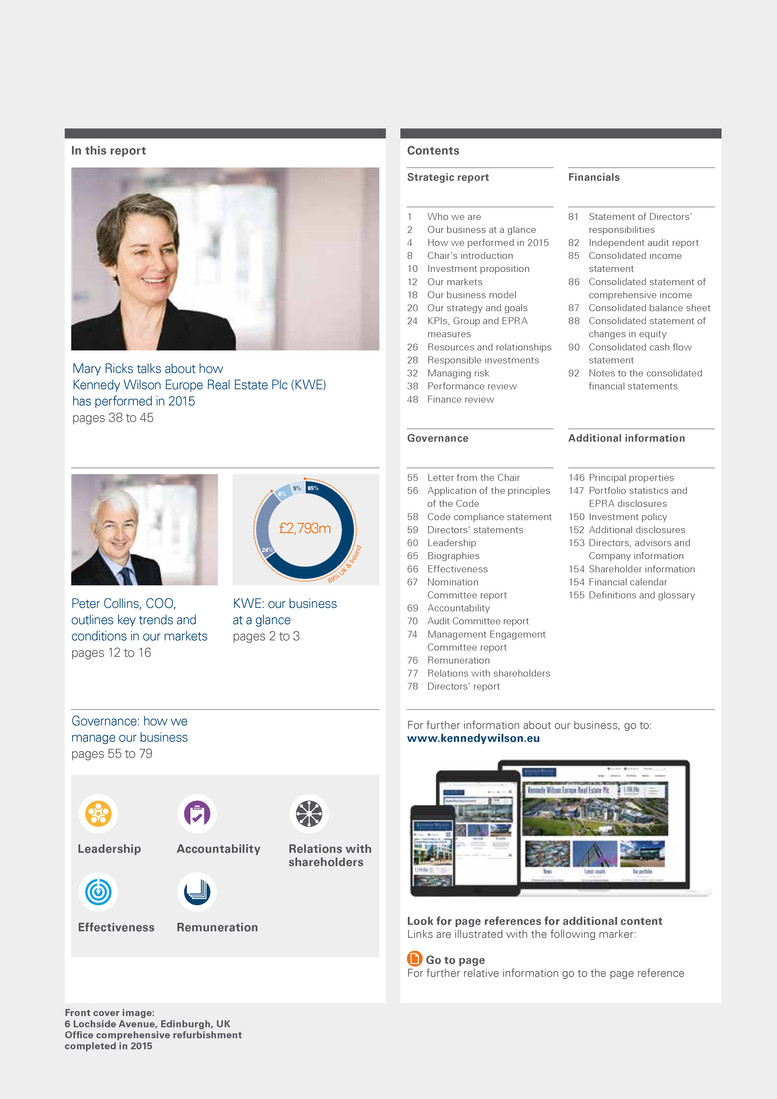
UK Ireland Spain Italy 6% 5% 24% Dublin London South East Other regions 65% 22% 19% 18% 41% £2,793m £2,793m 89% U K & Ire la nd 59% Dub lin, Lo nd on & th e So ut h Ea st In this report Contents Front cover image: 6 Lochside Avenue, Edinburgh, UK Office comprehensive refurbishment completed in 2015 Leadership Effectiveness Accountability Remuneration Relations with shareholders Strategic report 1 Who we are 2 Our business at a glance 4 How we performed in 2015 8 Chair’s introduction 10 Investment proposition 12 Our markets 18 Our business model 20 Our strategy and goals 24 KPIs, Group and EPRA measures 26 Resources and relationships 28 Responsible investments 32 Managing risk 38 Performance review 48 Finance review Financials 81 Statement of Directors’ responsibilities 82 Independent audit report 85 Consolidated income statement 86 Consolidated statement of comprehensive income 87 Consolidated balance sheet 88 Consolidated statement of changes in equity 90 Consolidated cash flow statement 92 Notes to the consolidated financial statements Additional information 146 Principal properties 147 Portfolio statistics and EPRA disclosures 150 Investment policy 152 Additional disclosures 153 Directors, advisors and Company information 154 Shareholder information 154 Financial calendar 155 Definitions and glossary For further information about our business, go to: www.kennedywilson.eu Look for page references for additional content Links are illustrated with the following marker: Governance 55 Letter from the Chair 56 Application of the principles of the Code 58 Code compliance statement 59 Directors’ statements 60 Leadership 65 Biographies 66 Effectiveness 67 Nomination Committee report 69 Accountability 70 Audit Committee report 74 Management Engagement Committee report 76 Remuneration 77 Relations with shareholders 78 Directors’ report Mary Ricks talks about how Kennedy Wilson Europe Real Estate Plc (KWE) has performed in 2015 pages 38 to 45 Peter Collins, COO, outlines key trends and conditions in our markets pages 12 to 16 KWE: our business at a glance pages 2 to 3 Governance: how we manage our business pages 55 to 79 Go to page For further relative information go to the page reference

Portfolio statistics £2,793m Portfolio value 302 Assets 11.8m sq ft Area 6.5% Acquisition yield on cost 7.3 years Weighted average unexpired lease term (9.2 years to expiry) 96.0% EPRA occupancy Image: Pioneer Point, Ilford, London, UK Private rented sector residential acquired in 2015 S trateg ic rep o rt G overnance Financials A dditional inform ation Kennedy Wilson Europe Real Estate Plc / Annual Report and Accounts 2015 1 Who we are Kennedy Wilson Europe Real Estate Plc (LSE: KWE) is a property company that invests in real estate and real estate loans across Europe. Our portfolio is valued at £2,793 million and is primarily invested in office and retail in the UK and Ireland, as well as in Spain and Italy. By strategically acquiring from vendors such as financial institutions, administrators and other vendors who are not core real estate operators, we aim to unlock the inherent value of under-resourced real estate – namely properties that are under-managed or under-capitalised – in order to generate superior returns for our shareholders. We listed on the Premium segment of the London Stock Exchange (LSE) in February 2014. Our shares are included in the FTSE 250 Index, in the Real Estate Holding & Development sub-sector and with effect from 21 March 2016 – two specialist real estate indices – the GPR 250 Index Series and the FTSE EPRA/NAREIT Global Real Estate Index Series. Our investment manager Our investment manager, KW Investment Management Ltd, is part of the Kennedy Wilson (NYSE: KW) group. KW is a global real estate investment company. KW owns, operates and invests in real estate both on its own and through its investment management platform. With the support of its investment advisors and the KW Europe Investment Committee, the Investment Manager actively manages KWE’s portfolio, under the overall supervision of our Board. See Resources and relationships (page 26) and Governance (pages 55 to 79).
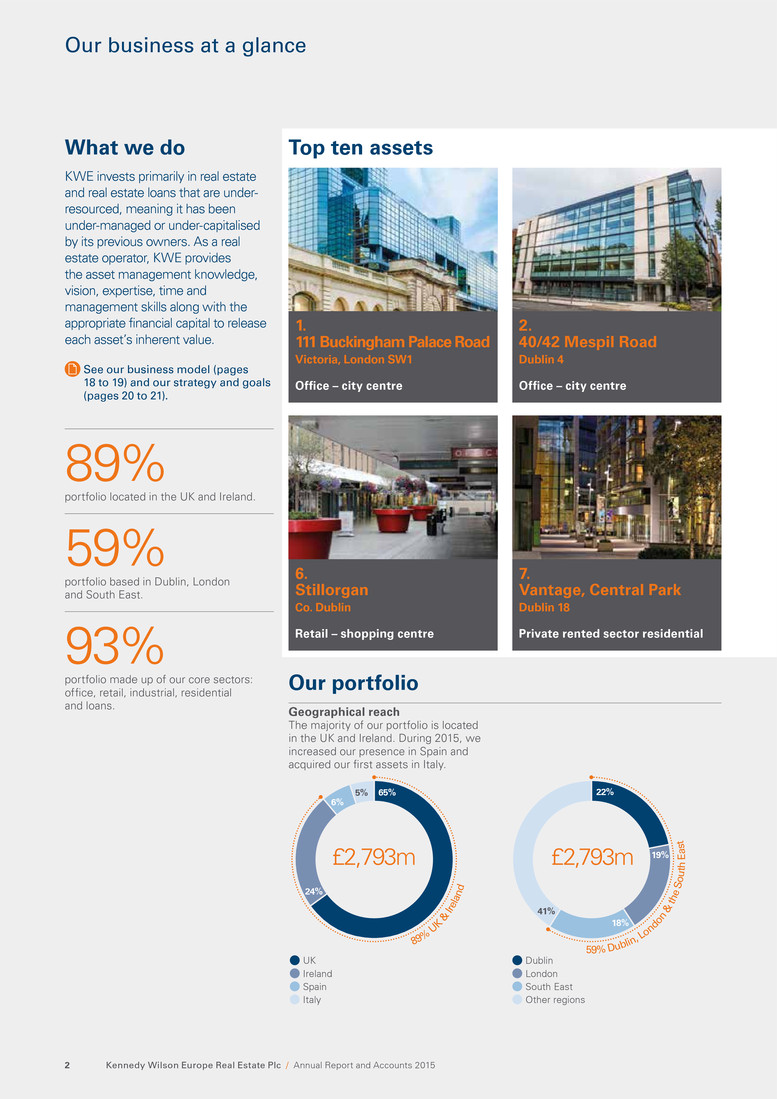
UK Ireland Spain Italy 6% 5% 24% Dublin London South East Other regions 65% 22% 19% 18% 41% £2,793m £2,793m 89% U K & Ire la nd 59% Dub lin, Lo nd on & th e So ut h Ea st 7. Vantage, Central Park Dublin 18 6. Stillorgan Co. Dublin 1. 111 Buckingham Palace Road Victoria, London SW1 2. 40/42 Mespil Road Dublin 4 Geographical reach The majority of our portfolio is located in the UK and Ireland. During 2015, we increased our presence in Spain and acquired our first assets in Italy. Our portfolio What we do KWE invests primarily in real estate and real estate loans that are under- resourced, meaning it has been under-managed or under-capitalised by its previous owners. As a real estate operator, KWE provides the asset management knowledge, vision, expertise, time and management skills along with the appropriate financial capital to release each asset’s inherent value. See our business model (pages 18 to 19) and our strategy and goals (pages 20 to 21). Top ten assets 89% portfolio located in the UK and Ireland. 59% portfolio based in Dublin, London and South East. 93% portfolio made up of our core sectors: office, retail, industrial, residential and loans. Retail – shopping centre Office – city centre Private rented sector residential Office – city centre Kennedy Wilson Europe Real Estate Plc / Annual Report and Accounts 20152 Our business at a glance

Off_ice Retail Residential Industrial Loans Other1 49% 25% 7% 6% 6% 7% 93% co re se ct or s £2,793m 3. Russell Court Dublin 2 4. Pioneer Point Ilford, London IG1 8. Baggot Plaza Dublin 4 5. Friars Bridge Court South Bank, London SE1 9. La Moraleja Green Madrid 10. Leavesden Park Watford Sector mix Our core sectors are office, retail, industrial and residential. Together with loans, these sectors made up 93% of our portfolio at the year end. See top ten assets table on page 148. Footnote: 1. Includes hotel and leisure assets Office – city centre Office – city centre Retail – shopping centre Private rented sector residential Office – suburban Office – city centre Strategic report G overnance Financials A dditional inform ation Kennedy Wilson Europe Real Estate Plc / Annual Report and Accounts 2015 3
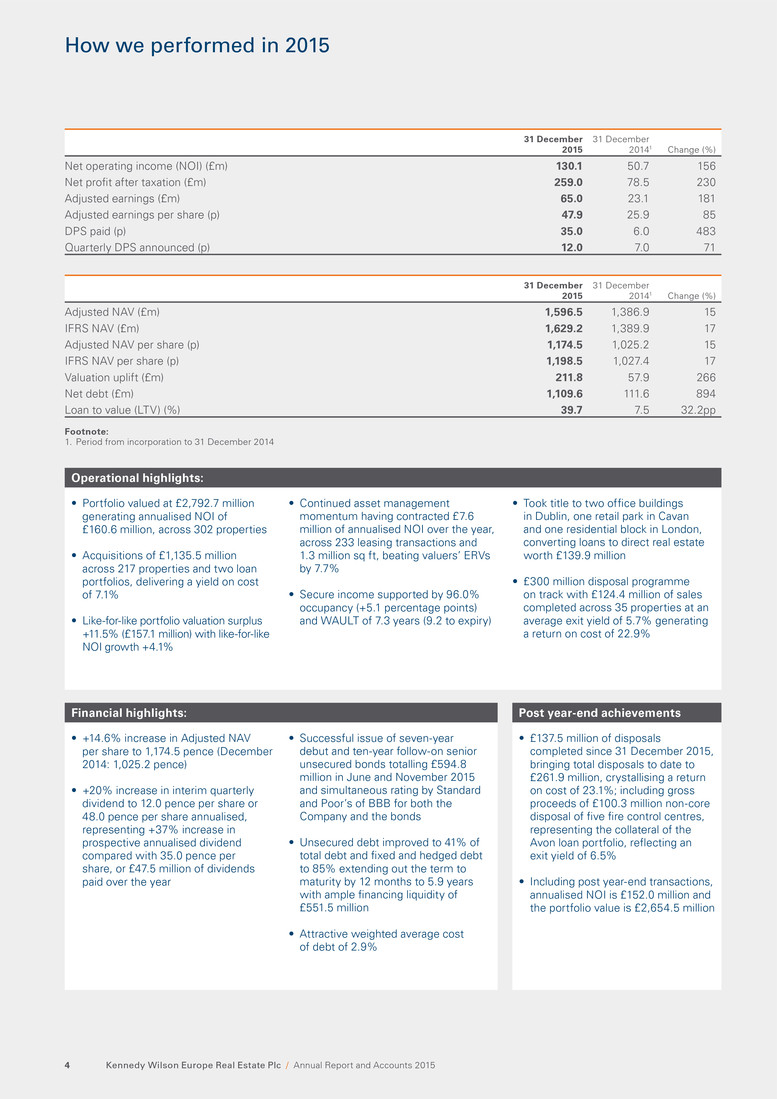
• Portfolio valued at £2,792.7 million generating annualised NOI of £160.6 million, across 302 properties • Acquisitions of £1,135.5 million across 217 properties and two loan portfolios, delivering a yield on cost of 7.1% • Like-for-like portfolio valuation surplus +11.5% (£157.1 million) with like-for-like NOI growth +4.1% • +14.6% increase in Adjusted NAV per share to 1,174.5 pence (December 2014: 1,025.2 pence) • +20% increase in interim quarterly dividend to 12.0 pence per share or 48.0 pence per share annualised, representing +37% increase in prospective annualised dividend compared with 35.0 pence per share, or £47.5 million of dividends paid over the year • £137.5 million of disposals completed since 31 December 2015, bringing total disposals to date to £261.9 million, crystallising a return on cost of 23.1%; including gross proceeds of £100.3 million non-core disposal of five fire control centres, representing the collateral of the Avon loan portfolio, reflecting an exit yield of 6.5% • Including post year-end transactions, annualised NOI is £152.0 million and the portfolio value is £2,654.5 million • Continued asset management momentum having contracted £7.6 million of annualised NOI over the year, across 233 leasing transactions and 1.3 million sq ft, beating valuers’ ERVs by 7.7% • Secure income supported by 96.0% occupancy (+5.1 percentage points) and WAULT of 7.3 years (9.2 to expiry) • Took title to two office buildings in Dublin, one retail park in Cavan and one residential block in London, converting loans to direct real estate worth £139.9 million • £300 million disposal programme on track with £124.4 million of sales completed across 35 properties at an average exit yield of 5.7% generating a return on cost of 22.9% • Successful issue of seven-year debut and ten-year follow-on senior unsecured bonds totalling £594.8 million in June and November 2015 and simultaneous rating by Standard and Poor’s of BBB for both the Company and the bonds • Unsecured debt improved to 41% of total debt and fixed and hedged debt to 85% extending out the term to maturity by 12 months to 5.9 years with ample financing liquidity of £551.5 million • Attractive weighted average cost of debt of 2.9% Kennedy Wilson Europe Real Estate Plc / Annual Report and Accounts 20154 How we performed in 2015 31 December 2015 31 December 20141 Change (%) Net operating income (NOI) (£m) 130.1 50.7 156 Net profit after taxation (£m) 259.0 78.5 230 Adjusted earnings (£m) 65.0 23.1 181 Adjusted earnings per share (p) 47.9 25.9 85 DPS paid (p) 35.0 6.0 483 Quarterly DPS announced (p) 12.0 7.0 71 31 December 2015 31 December 20141 Change (%) Adjusted NAV (£m) 1,596.5 1,386.9 15 IFRS NAV (£m) 1,629.2 1,389.9 17 Adjusted NAV per share (p) 1,174.5 1,025.2 15 IFRS NAV per share (p) 1,198.5 1,027.4 17 Valuation uplift (£m) 211.8 57.9 266 Net debt (£m) 1,109.6 111.6 894 Loan to value (LTV) (%) 39.7 7.5 32.2pp Footnote: 1. Period from incorporation to 31 December 2014 Operational highlights: Post year-end achievementsFinancial highlights:
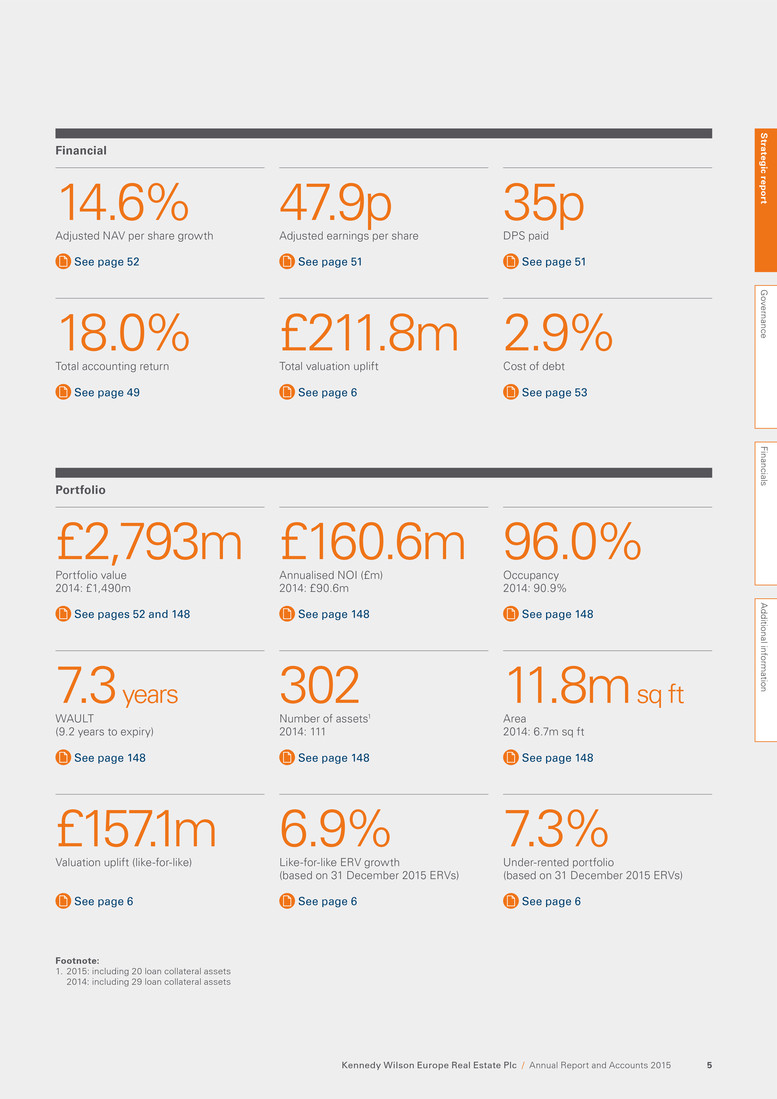
14.6% Adjusted NAV per share growth See page 52 £2,793m Portfolio value 2014: £1,490m See pages 52 and 148 18.0% Total accounting return See page 49 7.3 years WAULT (9.2 years to expiry) See page 148 £157.1m Valuation uplift (like-for-like) See page 6 47.9p Adjusted earnings per share See page 51 £160.6m Annualised NOI (£m) 2014: £90.6m See page 148 £211.8m Total valuation uplift See page 6 302 Number of assets1 2014: 111 See page 148 6.9% Like-for-like ERV growth (based on 31 December 2015 ERVs) See page 6 35p DPS paid See page 51 96.0% Occupancy 2014: 90.9% See page 148 2.9% Cost of debt See page 53 11.8m sq ft Area 2014: 6.7m sq ft See page 148 7.3% Under-rented portfolio (based on 31 December 2015 ERVs) See page 6 Financial Portfolio Footnote: 1. 2015: including 20 loan collateral assets 2014: including 29 loan collateral assets S trateg ic rep o rt G overnance Financials A dditional inform ation Kennedy Wilson Europe Real Estate Plc / Annual Report and Accounts 2015 5
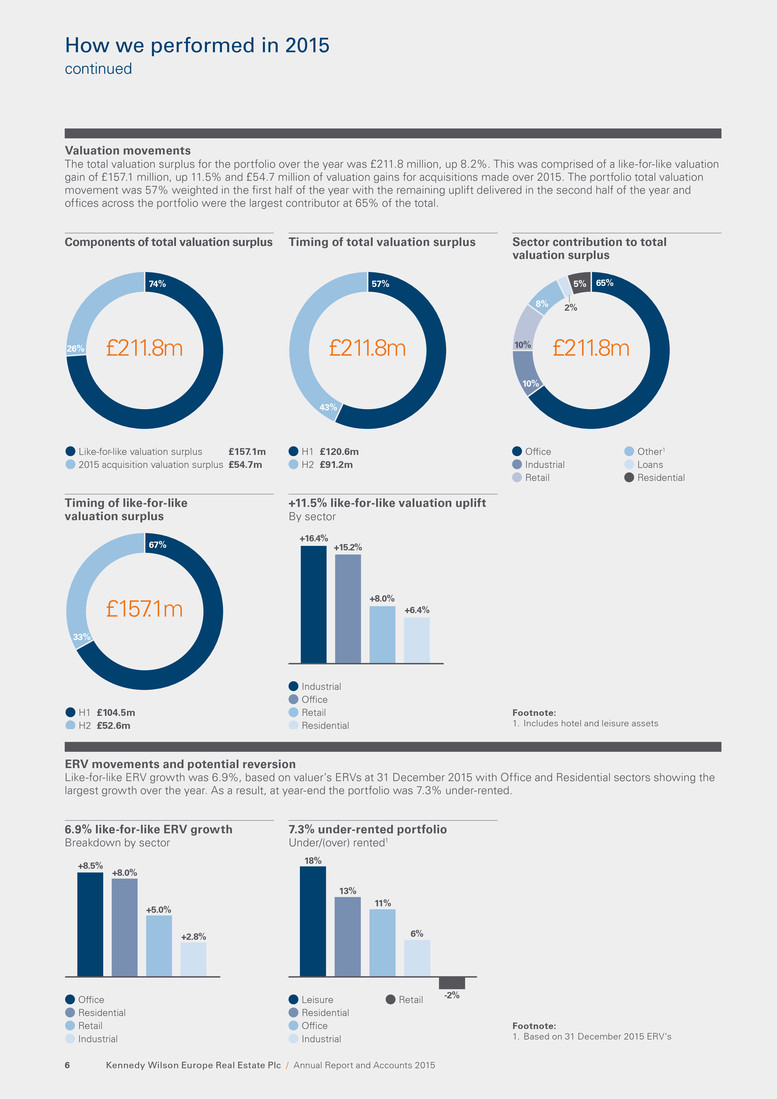
H1 £120.6m H2 £91.2m 43% 57% 65% 8% 2% 5% 10% 10%£211.8m £211.8m Like-for-like valuation surplus £157.1m 2015 acquisition valuation surplus £54.7m 26% 74% £211.8m Off_ice Industrial Retail Other1 Loans Residential H1 £104.5m H2 £52.6m 33% 67% £157.1m Industrial Off_ice Retail Residential +16.4% +8.0% +15.2% +6.4% Leisure Residential Off_ice Industrial RetailOff_ice Residential Retail Industrial +8.5% -2% 6% 11% 13% 18% +5.0% +8.0% +2.8% Timing of total valuation surplusComponents of total valuation surplus Timing of like-for-like valuation surplus +11.5% like-for-like valuation uplift By sector 6.9% like-for-like ERV growth Breakdown by sector 7.3% under-rented portfolio Under/(over) rented1 Sector contribution to total valuation surplus Valuation movements ERV movements and potential reversion The total valuation surplus for the portfolio over the year was £211.8 million, up 8.2%. This was comprised of a like-for-like valuation gain of £157.1 million, up 11.5% and £54.7 million of valuation gains for acquisitions made over 2015. The portfolio total valuation movement was 57% weighted in the first half of the year with the remaining uplift delivered in the second half of the year and offices across the portfolio were the largest contributor at 65% of the total. Like-for-like ERV growth was 6.9%, based on valuer’s ERVs at 31 December 2015 with Office and Residential sectors showing the largest growth over the year. As a result, at year-end the portfolio was 7.3% under-rented. Footnote: 1. Based on 31 December 2015 ERV’s Footnote: 1. Includes hotel and leisure assets Kennedy Wilson Europe Real Estate Plc / Annual Report and Accounts 20156 How we performed in 2015 continued
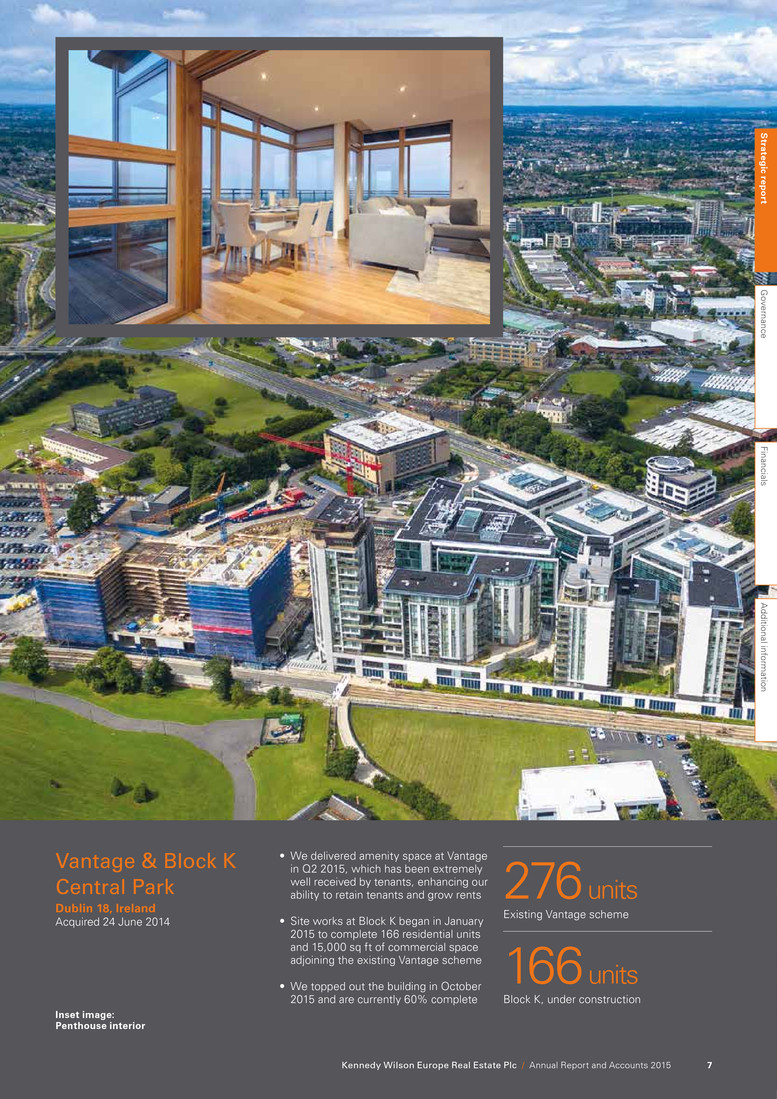
Vantage & Block K Central Park Dublin 18, Ireland Acquired 24 June 2014 276 units Existing Vantage scheme 166 units Block K, under construction • We delivered amenity space at Vantage in Q2 2015, which has been extremely well received by tenants, enhancing our ability to retain tenants and grow rents • Site works at Block K began in January 2015 to complete 166 residential units and 15,000 sq ft of commercial space adjoining the existing Vantage scheme • We topped out the building in October 2015 and are currently 60% complete Inset image: Penthouse interior S trateg ic rep o rt G overnance Financials A dditional inform ation Kennedy Wilson Europe Real Estate Plc / Annual Report and Accounts 2015 7
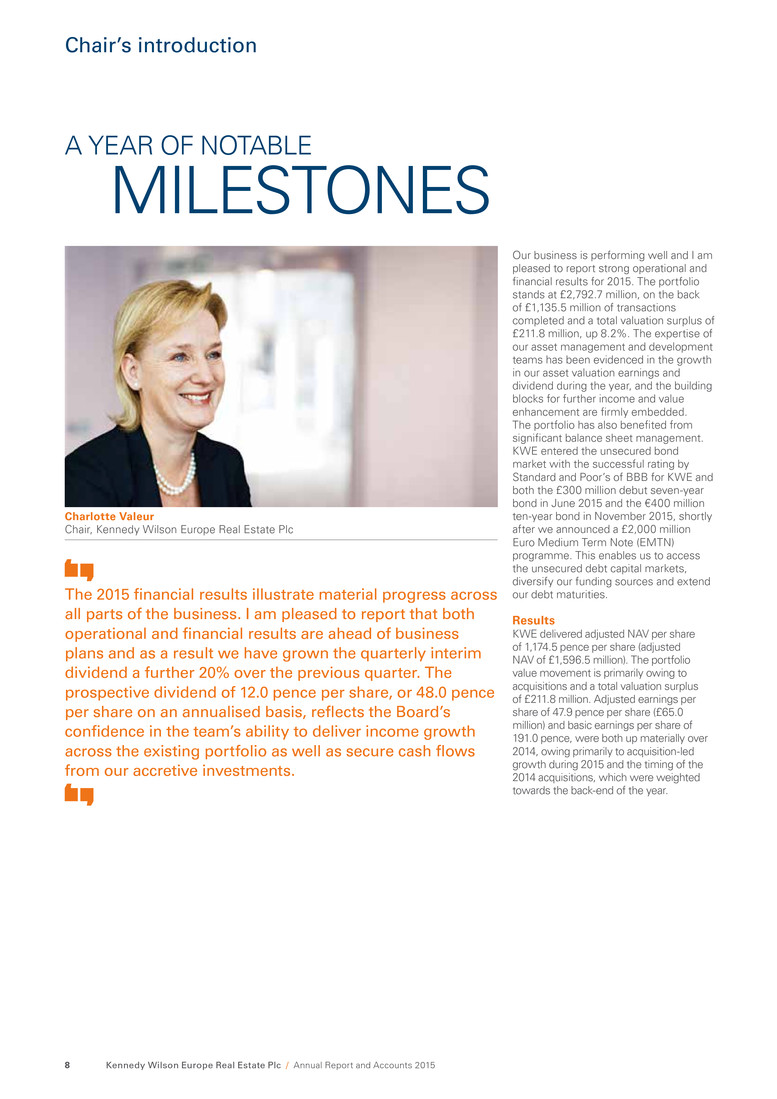
Charlotte Valeur Chair, Kennedy Wilson Europe Real Estate Plc Our business is performing well and I am pleased to report strong operational and financial results for 2015. The portfolio stands at £2,792.7 million, on the back of £1,135.5 million of transactions completed and a total valuation surplus of £211.8 million, up 8.2%. The expertise of our asset management and development teams has been evidenced in the growth in our asset valuation earnings and dividend during the year, and the building blocks for further income and value enhancement are firmly embedded. The portfolio has also benefited from significant balance sheet management. KWE entered the unsecured bond market with the successful rating by Standard and Poor’s of BBB for KWE and both the £300 million debut seven-year bond in June 2015 and the €400 million ten-year bond in November 2015, shortly after we announced a £2,000 million Euro Medium Term Note (EMTN) programme. This enables us to access the unsecured debt capital markets, diversify our funding sources and extend our debt maturities. Results KWE delivered adjusted NAV per share of 1,174.5 pence per share (adjusted NAV of £1,596.5 million). The portfolio value movement is primarily owing to acquisitions and a total valuation surplus of £211.8 million. Adjusted earnings per share of 47.9 pence per share (£65.0 million) and basic earnings per share of 191.0 pence, were both up materially over 2014, owing primarily to acquisition-led growth during 2015 and the timing of the 2014 acquisitions, which were weighted towards the back-end of the year. A YEAR OF NOTABLE MILESTONES The 2015 financial results illustrate material progress across all parts of the business. I am pleased to report that both operational and financial results are ahead of business plans and as a result we have grown the quarterly interim dividend a further 20% over the previous quarter. The prospective dividend of 12.0 pence per share, or 48.0 pence per share on an annualised basis, reflects the Board’s confidence in the team’s ability to deliver income growth across the existing portfolio as well as secure cash flows from our accretive investments. Kennedy Wilson Europe Real Estate Plc / Annual Report and Accounts 20158 Chair’s introduction
The Investment Manager has also invested in developing its finance and portfolio management systems, to ensure we continue to meet monthly reporting deadlines for our significantly expanded portfolio. A new approach to ‘on boarding’ new assets was also rolled out across the portfolio. This focuses on the critical first 90 days of ownership and ensures we take new assets onto the balance sheet in a systematic fashion. The Board The Board works closely with the Investment Manager and its advisors to achieve a high standard of governance, which remains a key priority. The Company is a fee-paying member of EPRA, the European trade body for listed real estate securities, and follows EPRA’s Best Practice Recommendations for reporting disclosure. In addition, KWE is a member of the Association of Investment Companies (AIC) and acknowledges the AIC Code of Corporate Governance. To demonstrate our commitment to applying high standards of corporate governance, we report against the UK Corporate Governance Code 2014. Outlook The real estate investment market across our four regions, the UK, Ireland, Spain and Italy, are all at different positions in their respective property cycles, providing us with a wider menu of entry points. Whilst all four markets remain competitive, KWE has a unique blend of debt and equity skills, strong market relationships and multi-sector approach. This drives pricing discipline and allows us to execute on attractive investment opportunities to accretively deploy capital and grow income and values, so we can deliver strong returns for shareholders. We are conscious of the current uncertainty in global investment markets, exacerbated in the UK by Brexit concerns. At this stage, we are not seeing that uncertainty feed into our occupier base, which is well diversified across countries and sectors. We continue to actively monitor the risk of investment market volatility feeding into the underlying fundamentals in which we operate. Bearing this in mind, property fundamentals across the UK and Ireland remain positive and investments across offices as well as selected residential and retail properties in key cities continue to perform well. In Spain, we remain positive on consumers’ prospects and are pleased to have increased our retail exposure there, and in Italy, a market we entered in October 2015, we remain focused on offices and retail sectors in the north of the country and are seeing increasing opportunities. Charlotte Valeur Chair Strategic goals The Board is delighted with the investment management team’s success in delivering against our goals for the year. During 2015 we focused on: • Delivering total returns for shareholders with a focus on dividend returns • Ensuring an efficient capital structure • Employing accretive asset management initiatives, and • Recycling capital to actively manage the portfolio. Refer to the Performance review on pages 38 to 45 for further details on our achievements. Dividends Dividends of 35.0 pence per share, or £47.5 million were paid during the year, reflecting a dividend cover based on 2015 adjusted earnings of 1.4 times. The Board has announced an increase in the quarterly interim dividend of 20% to 12.0 pence per share or 48.0 pence annualised, representing a 37% uplift over 2015 and implying an attractive dividend yield of 4.5%, as at 25 February 2016. KWE continues to deliver robust, quarter- on-quarter dividend growth, as the portfolio’s accretive acquisitions deliver improving sustainable cash flows. The Board believes the new dividend level provides an appropriate balance between NOI growth within the portfolio, and our planned net investments, taking into account future disposals. The Board will continue to monitor the portfolio cash flows and the resulting dividend coverage ratio to provide shareholders with a secure dividend whilst maintaining sufficient headroom to provide business flexibility. An enhanced platform The Investment Manager and its advisors have continued to enhance the platform that supports our business, enabling the Group to execute and manage our investments across multiple jurisdictions. KWE has access to top professionals across real estate asset management, development, investment, and finance and operations, across the UK, Ireland, Spain, Italy, Jersey and Luxembourg. During the year, the investment management group added a further 26 employees, including 13 new asset managers and development managers. This took its total employees at year end to over 80, up from approximately 50 at the time of the IPO in February 2014. S trateg ic rep o rt G overnance Financials A dditional inform ation Kennedy Wilson Europe Real Estate Plc / Annual Report and Accounts 2015 9
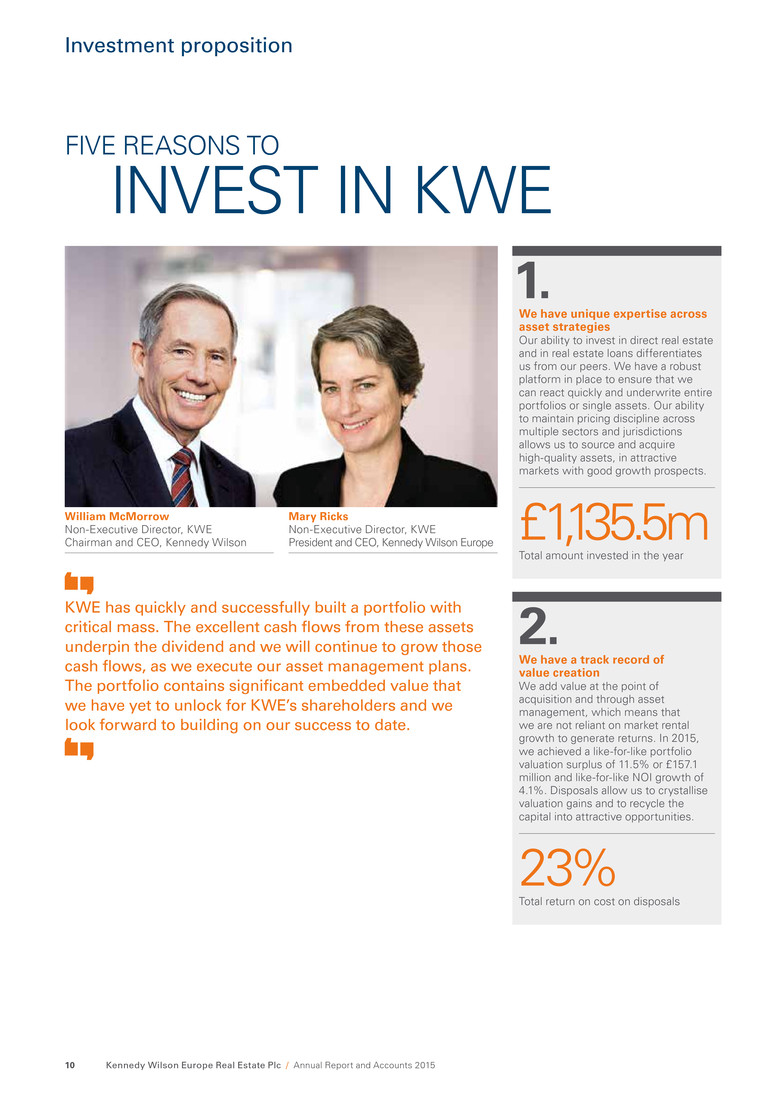
1. We have unique expertise across asset strategies Our ability to invest in direct real estate and in real estate loans differentiates us from our peers. We have a robust platform in place to ensure that we can react quickly and underwrite entire portfolios or single assets. Our ability to maintain pricing discipline across multiple sectors and jurisdictions allows us to source and acquire high-quality assets, in attractive markets with good growth prospects. £1,135.5m Total amount invested in the year 2. We have a track record of value creation We add value at the point of acquisition and through asset management, which means that we are not reliant on market rental growth to generate returns. In 2015, we achieved a like-for-like portfolio valuation surplus of 11.5% or £157.1 million and like-for-like NOI growth of 4.1%. Disposals allow us to crystallise valuation gains and to recycle the capital into attractive opportunities. 23% Total return on cost on disposals William McMorrow Non-Executive Director, KWE Chairman and CEO, Kennedy Wilson Mary Ricks Non-Executive Director, KWE President and CEO, Kennedy Wilson Europe FIVE REASONS TO INVEST IN KWE KWE has quickly and successfully built a portfolio with critical mass. The excellent cash flows from these assets underpin the dividend and we will continue to grow those cash flows, as we execute our asset management plans. The portfolio contains significant embedded value that we have yet to unlock for KWE’s shareholders and we look forward to building on our success to date. Kennedy Wilson Europe Real Estate Plc / Annual Report and Accounts 201510 Investment proposition
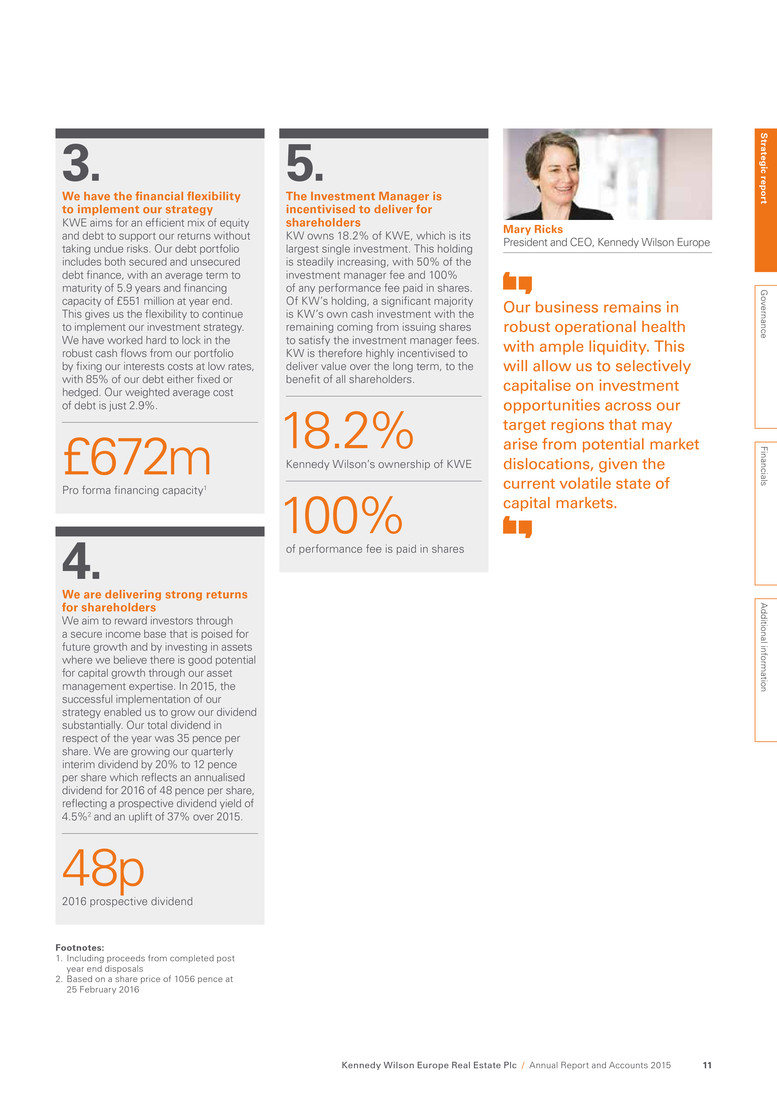
4. We are delivering strong returns for shareholders We aim to reward investors through a secure income base that is poised for future growth and by investing in assets where we believe there is good potential for capital growth through our asset management expertise. In 2015, the successful implementation of our strategy enabled us to grow our dividend substantially. Our total dividend in respect of the year was 35 pence per share. We are growing our quarterly interim dividend by 20% to 12 pence per share which reflects an annualised dividend for 2016 of 48 pence per share, reflecting a prospective dividend yield of 4.5%2 and an uplift of 37% over 2015. 48p 2016 prospective dividend 5. The Investment Manager is incentivised to deliver for shareholders KW owns 18.2% of KWE, which is its largest single investment. This holding is steadily increasing, with 50% of the investment manager fee and 100% of any performance fee paid in shares. Of KW’s holding, a significant majority is KW’s own cash investment with the remaining coming from issuing shares to satisfy the investment manager fees. KW is therefore highly incentivised to deliver value over the long term, to the benefit of all shareholders. 18.2% Kennedy Wilson’s ownership of KWE 100% of performance fee is paid in shares 3. We have the financial flexibility to implement our strategy KWE aims for an efficient mix of equity and debt to support our returns without taking undue risks. Our debt portfolio includes both secured and unsecured debt finance, with an average term to maturity of 5.9 years and financing capacity of £551 million at year end. This gives us the flexibility to continue to implement our investment strategy. We have worked hard to lock in the robust cash flows from our portfolio by fixing our interests costs at low rates, with 85% of our debt either fixed or hedged. Our weighted average cost of debt is just 2.9%. £672m Pro forma financing capacity1 Footnotes: 1. Including proceeds from completed post year end disposals 2. Based on a share price of 1056 pence at 25 February 2016 Mary Ricks President and CEO, Kennedy Wilson Europe Our business remains in robust operational health with ample liquidity. This will allow us to selectively capitalise on investment opportunities across our target regions that may arise from potential market dislocations, given the current volatile state of capital markets. S trateg ic rep o rt G overnance Financials A dditional inform ation Kennedy Wilson Europe Real Estate Plc / Annual Report and Accounts 2015 11
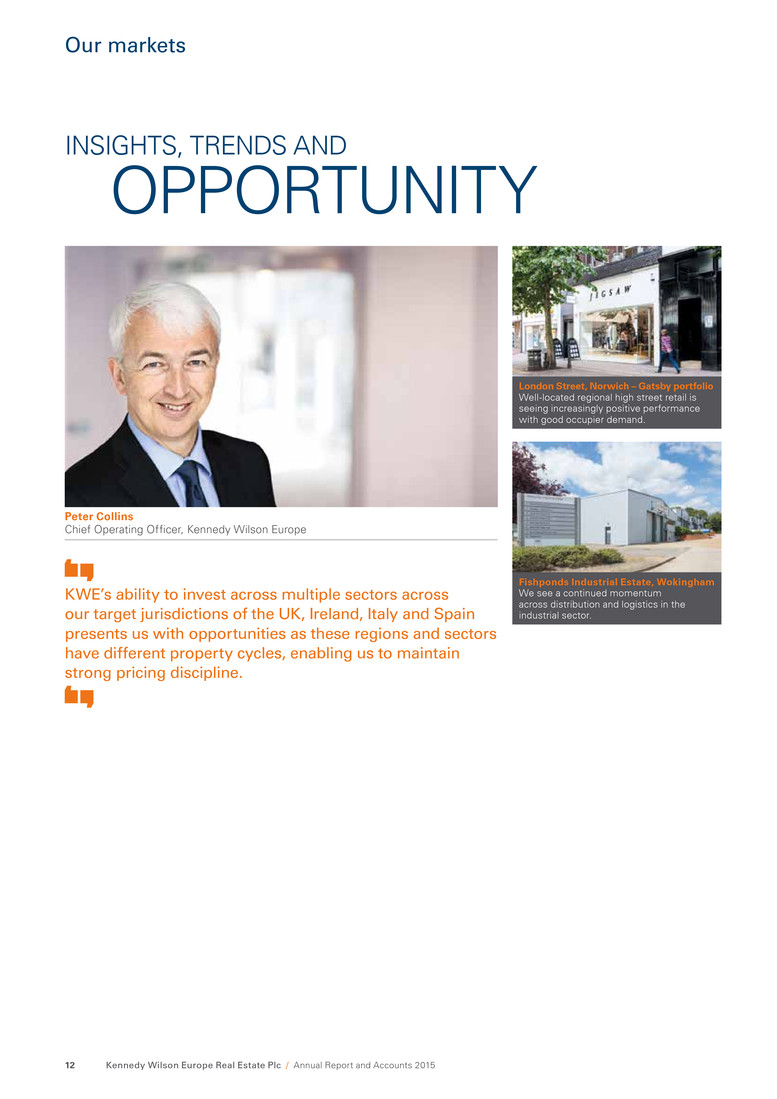
Peter Collins Chief Operating Officer, Kennedy Wilson Europe INSIGHTS, TRENDS AND OPPORTUNITY KWE’s ability to invest across multiple sectors across our target jurisdictions of the UK, Ireland, Italy and Spain presents us with opportunities as these regions and sectors have different property cycles, enabling us to maintain strong pricing discipline. London Street, Norwich – Gatsby portfolio Well-located regional high street retail is seeing increasingly positive performance with good occupier demand. Fishponds Industrial Estate, Wokingham We see a continued momentum across distribution and logistics in the industrial sector. Kennedy Wilson Europe Real Estate Plc / Annual Report and Accounts 201512 Our markets
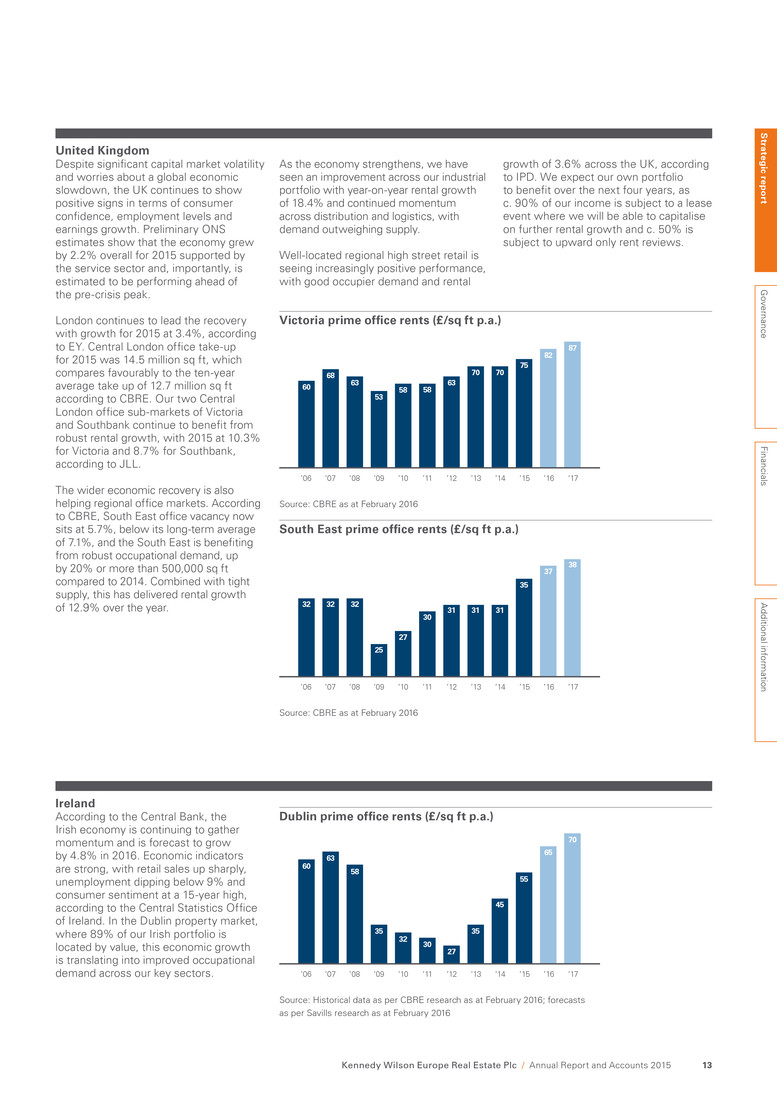
Source: CBRE as at February 2016 60 68 63 53 58 58 63 70 70 75 82 87 ‘06 ‘07 ‘08 ‘09 ‘10 ‘11 ‘12 ‘13 ‘14 ‘15 ‘16 ‘17 Source: CBRE as at February 2016 32 32 32 25 27 30 31 31 31 35 37 38 ‘06 ‘07 ‘08 ‘09 ‘10 ‘11 ‘12 ‘13 ‘14 ‘15 ‘16 ‘17 Source: Historical data as per CBRE research as at February 2016; forecasts as per Savills research as at February 2016 60 63 58 35 32 30 27 35 45 55 65 70 ‘06 ‘07 ‘08 ‘09 ‘10 ‘11 ‘12 ‘13 ‘14 ‘15 ‘16 ‘17 Despite significant capital market volatility and worries about a global economic slowdown, the UK continues to show positive signs in terms of consumer confidence, employment levels and earnings growth. Preliminary ONS estimates show that the economy grew by 2.2% overall for 2015 supported by the service sector and, importantly, is estimated to be performing ahead of the pre-crisis peak. London continues to lead the recovery with growth for 2015 at 3.4%, according to EY. Central London office take-up for 2015 was 14.5 million sq ft, which compares favourably to the ten-year average take up of 12.7 million sq ft according to CBRE. Our two Central London office sub-markets of Victoria and Southbank continue to benefit from robust rental growth, with 2015 at 10.3% for Victoria and 8.7% for Southbank, according to JLL. The wider economic recovery is also helping regional office markets. According to CBRE, South East office vacancy now sits at 5.7%, below its long-term average of 7.1%, and the South East is benefiting from robust occupational demand, up by 20% or more than 500,000 sq ft compared to 2014. Combined with tight supply, this has delivered rental growth of 12.9% over the year. Victoria prime office rents (£/sq ft p.a.) According to the Central Bank, the Irish economy is continuing to gather momentum and is forecast to grow by 4.8% in 2016. Economic indicators are strong, with retail sales up sharply, unemployment dipping below 9% and consumer sentiment at a 15-year high, according to the Central Statistics Office of Ireland. In the Dublin property market, where 89% of our Irish portfolio is located by value, this economic growth is translating into improved occupational demand across our key sectors. Ireland United Kingdom South East prime office rents (£/sq ft p.a.) Dublin prime office rents (£/sq ft p.a.) As the economy strengthens, we have seen an improvement across our industrial portfolio with year-on-year rental growth of 18.4% and continued momentum across distribution and logistics, with demand outweighing supply. Well-located regional high street retail is seeing increasingly positive performance, with good occupier demand and rental growth of 3.6% across the UK, according to IPD. We expect our own portfolio to benefit over the next four years, as c. 90% of our income is subject to a lease event where we will be able to capitalise on further rental growth and c. 50% is subject to upward only rent reviews. Strategic report Governance Financials Additional information Kennedy Wilson Europe Real Estate Plc / Annual Report and Accounts 2015 13
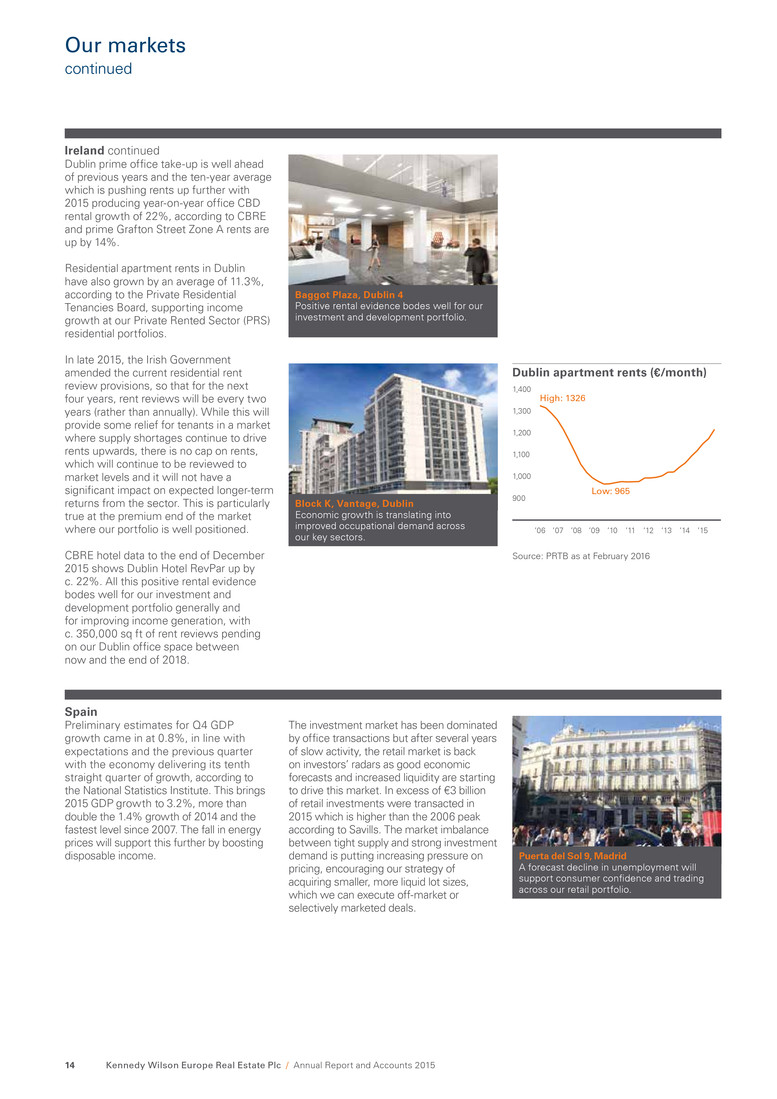
Source: PRTB as at February 2016 ‘06 ‘07 ‘08 ‘09 ‘10 ‘11 ‘12 ‘13 ‘14 ‘15 High: 1326 Low: 965 900 1,000 1,100 1,200 1,300 1,400 Spain Preliminary estimates for Q4 GDP growth came in at 0.8%, in line with expectations and the previous quarter with the economy delivering its tenth straight quarter of growth, according to the National Statistics Institute. This brings 2015 GDP growth to 3.2%, more than double the 1.4% growth of 2014 and the fastest level since 2007. The fall in energy prices will support this further by boosting disposable income. Puerta del Sol 9, Madrid A forecast decline in unemployment will support consumer confidence and trading across our retail portfolio. Baggot Plaza, Dublin 4 Positive rental evidence bodes well for our investment and development portfolio. The investment market has been dominated by office transactions but after several years of slow activity, the retail market is back on investors’ radars as good economic forecasts and increased liquidity are starting to drive this market. In excess of €3 billion of retail investments were transacted in 2015 which is higher than the 2006 peak according to Savills. The market imbalance between tight supply and strong investment demand is putting increasing pressure on pricing, encouraging our strategy of acquiring smaller, more liquid lot sizes, which we can execute off-market or selectively marketed deals. Dublin apartment rents (€/month) Dublin prime office take-up is well ahead of previous years and the ten-year average which is pushing rents up further with 2015 producing year-on-year office CBD rental growth of 22%, according to CBRE and prime Grafton Street Zone A rents are up by 14%. Residential apartment rents in Dublin have also grown by an average of 11.3%, according to the Private Residential Tenancies Board, supporting income growth at our Private Rented Sector (PRS) residential portfolios. In late 2015, the Irish Government amended the current residential rent review provisions, so that for the next four years, rent reviews will be every two years (rather than annually). While this will provide some relief for tenants in a market where supply shortages continue to drive rents upwards, there is no cap on rents, which will continue to be reviewed to market levels and it will not have a significant impact on expected longer-term returns from the sector. This is particularly true at the premium end of the market where our portfolio is well positioned. CBRE hotel data to the end of December 2015 shows Dublin Hotel RevPar up by c. 22%. All this positive rental evidence bodes well for our investment and development portfolio generally and for improving income generation, with c. 350,000 sq ft of rent reviews pending on our Dublin office space between now and the end of 2018. Ireland continued Block K, Vantage, Dublin Economic growth is translating into improved occupational demand across our key sectors. K e n n e d y Wil son Eu rope R e al E s t a t e P l c / Annual Report and Accounts 201514 O ur mar ke t s continued
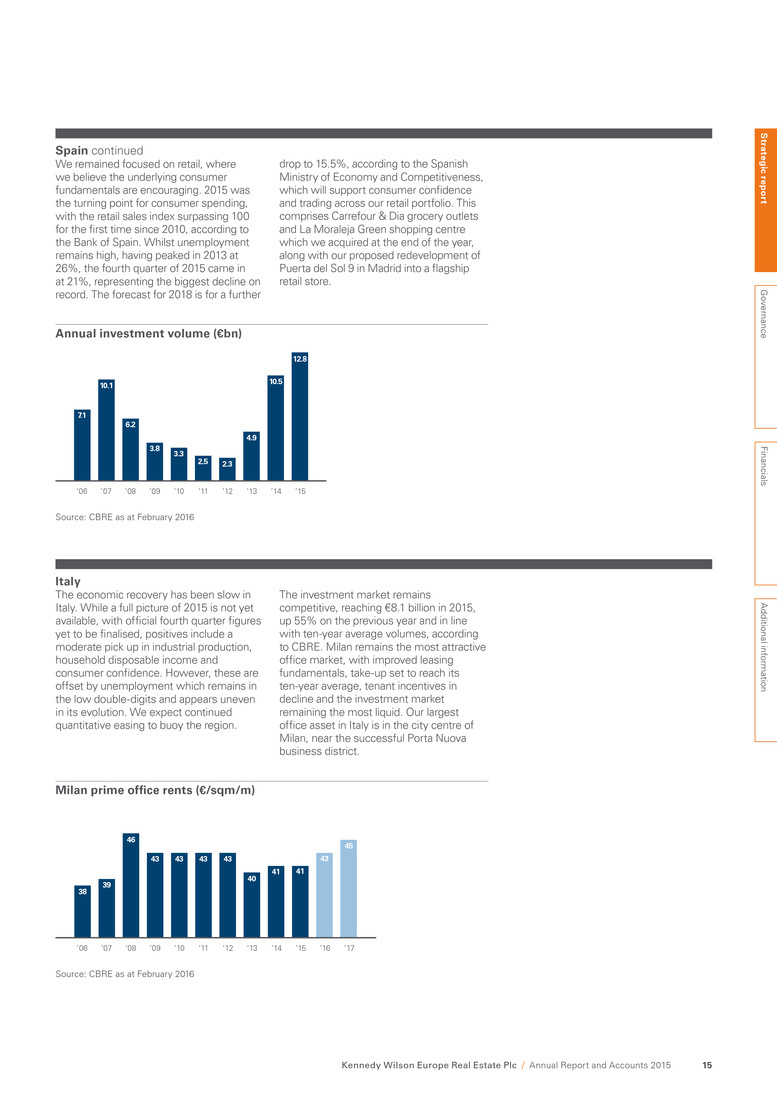
Source: CBRE as at February 2016 38 39 46 43 43 43 43 40 41 41 43 45 ‘06 ‘07 ‘08 ‘09 ‘10 ‘11 ‘12 ‘13 ‘14 ‘15 ‘16 ‘17 Source: CBRE as at February 2016 ‘06 ‘07 ‘08 ‘09 ‘10 ‘11 ‘12 ‘13 ‘14 ‘15 7.1 10.1 6.2 3.8 3.3 2.5 2.3 4.9 10.5 12.8 The economic recovery has been slow in Italy. While a full picture of 2015 is not yet available, with official fourth quarter figures yet to be finalised, positives include a moderate pick up in industrial production, household disposable income and consumer confidence. However, these are offset by unemployment which remains in the low double-digits and appears uneven in its evolution. We expect continued quantitative easing to buoy the region. The investment market remains competitive, reaching €8.1 billion in 2015, up 55% on the previous year and in line with ten-year average volumes, according to CBRE. Milan remains the most attractive office market, with improved leasing fundamentals, take-up set to reach its ten-year average, tenant incentives in decline and the investment market remaining the most liquid. Our largest office asset in Italy is in the city centre of Milan, near the successful Porta Nuova business district. Italy Milan prime office rents (€/sqm/m) Annual investment volume (€bn) Spain continued We remained focused on retail, where we believe the underlying consumer fundamentals are encouraging. 2015 was the turning point for consumer spending, with the retail sales index surpassing 100 for the first time since 2010, according to the Bank of Spain. Whilst unemployment remains high, having peaked in 2013 at 26%, the fourth quarter of 2015 came in at 21%, representing the biggest decline on record. The forecast for 2018 is for a further drop to 15.5%, according to the Spanish Ministry of Economy and Competitiveness, which will support consumer confidence and trading across our retail portfolio. This comprises Carrefour & Dia grocery outlets and La Moraleja Green shopping centre which we acquired at the end of the year, along with our proposed redevelopment of Puerta del Sol 9 in Madrid into a flagship retail store. Strategic report Governance Financials Additional information Kennedy Wilson Europe Real Estate Plc / Annual Report and Accounts 2015 15
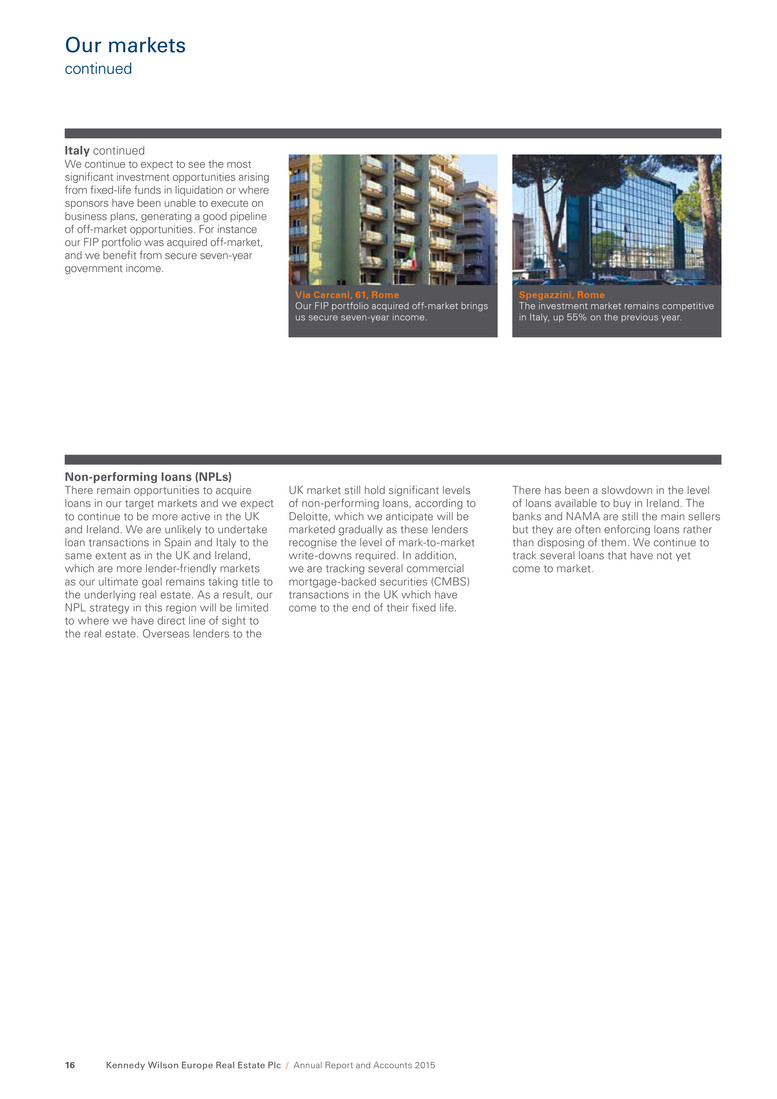
There remain opportunities to acquire loans in our target markets and we expect to continue to be more active in the UK and Ireland. We are unlikely to undertake loan transactions in Spain and Italy to the same extent as in the UK and Ireland, which are more lender-friendly markets as our ultimate goal remains taking title to the underlying real estate. As a result, our NPL strategy in this region will be limited to where we have direct line of sight to the real estate. Overseas lenders to the Non-performing loans (NPLs) UK market still hold significant levels of non-performing loans, according to Deloitte, which we anticipate will be marketed gradually as these lenders recognise the level of mark-to-market write-downs required. In addition, we are tracking several commercial mortgage-backed securities (CMBS) transactions in the UK which have come to the end of their fixed life. There has been a slowdown in the level of loans available to buy in Ireland. The banks and NAMA are still the main sellers but they are often enforcing loans rather than disposing of them. We continue to track several loans that have not yet come to market. Via Carcani, 61, Rome Our FIP portfolio acquired off-market brings us secure seven-year income. Spegazzini, Rome The investment market remains competitive in Italy, up 55% on the previous year. Italy continued We continue to expect to see the most significant investment opportunities arising from fixed-life funds in liquidation or where sponsors have been unable to execute on business plans, generating a good pipeline of off-market opportunities. For instance our FIP portfolio was acquired off-market, and we benefit from secure seven-year government income. Kennedy Wilson Europe Real Estate Plc / Annual Report and Accounts 201516 Our markets continued

Pioneer Point loan Ilford, London IG1, UK Acquired 18 May 2015 as part of asset via loan (AVL) strategy Underlying collateral 294 PRS units 54% Discount to unpaid principal balance (UPB) 294 PRS units to let • Acquired non-performing loan for £68.5 million, compared to UPB of £149 million • Plan to transform scheme into a professionally run PRS operation by refurbishing existing units and adding an amenity package in the 12,600 sq ft of vacant commercial space, upon receiving planning permission • Completed AVL strategy on 5 February 2016 and now hold the property as direct real estate S trateg ic rep o rt G overnance Financials A dditional inform ation Kennedy Wilson Europe Real Estate Plc / Annual Report and Accounts 2015 17
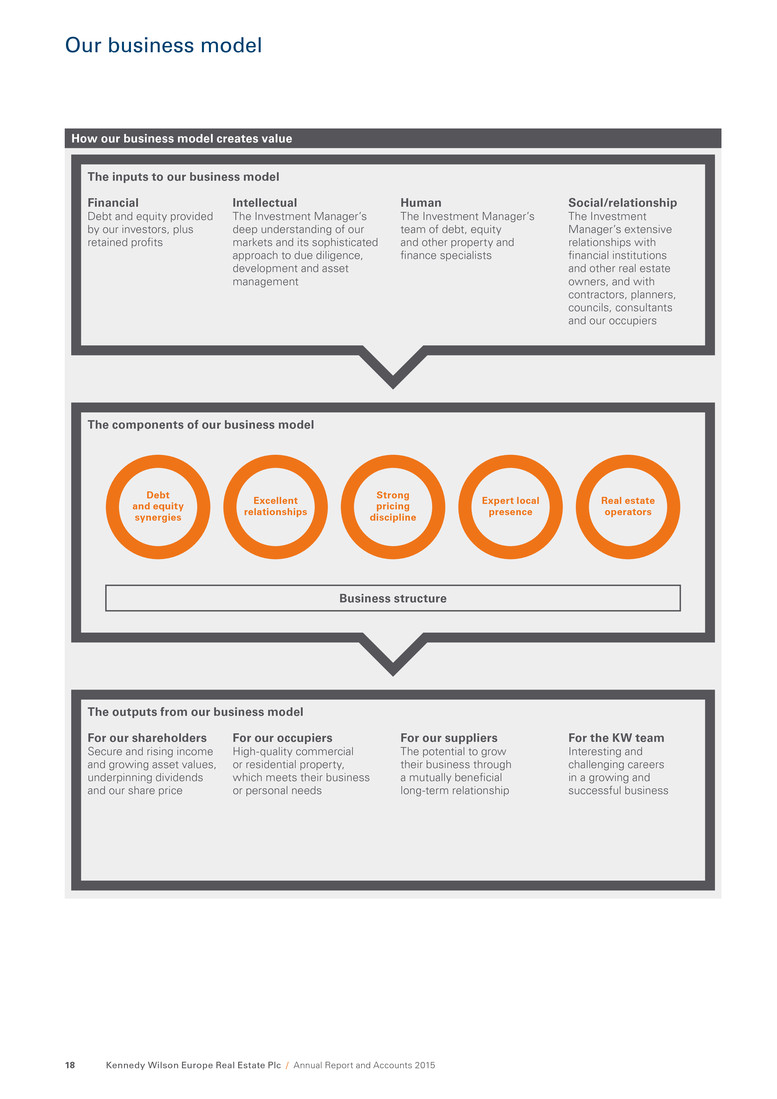
Financial Debt and equity provided by our investors, plus retained profits Intellectual The Investment Manager’s deep understanding of our markets and its sophisticated approach to due diligence, development and asset management Human The Investment Manager’s team of debt, equity and other property and finance specialists Social/relationship The Investment Manager’s extensive relationships with financial institutions and other real estate owners, and with contractors, planners, councils, consultants and our occupiers Debt and equity synergies Excellent relationships Strong pricing discipline Expert local presence Real estate operators For our shareholders Secure and rising income and growing asset values, underpinning dividends and our share price For our occupiers High-quality commercial or residential property, which meets their business or personal needs For our suppliers The potential to grow their business through a mutually beneficial long-term relationship For the KW team Interesting and challenging careers in a growing and successful business Kennedy Wilson Europe Real Estate Plc / Annual Report and Accounts 201518 Our business model How our business model creates value The inputs to our business model The components of our business model Business structure The outputs from our business model
KWE unlocks the value of real estate that has been under-managed or under-capitalised by its previous owners. We use our strong balance sheet to acquire assets, which we source through our excellent relationships with financial institutions, administrators and other vendors who are not natural real estate operators. We then use our asset management and development skills to release each asset’s inherent value, for the benefit of all our stakeholders. The key components of our business model are described below. Our business structure Being externally managed has a number of advantages for us. In particular, we have access to the experience and relationships of KW’s senior management and to the expertise of KW’s substantial wider team in Europe, at a cost to us that is substantially less then employing those resources in-house. Our business platform also benefits from the Investment Manager’s robust systems and processes, which it continues to enhance, and from our strong corporate governance, which ensures we meet our compliance, regulatory and filing requirements in each of the jurisdictions we operate in. See Resources and relationships on page 26 for more on our relationship with the Investment Manager. Debt and equity synergies The Investment Manager and its advisors employ debt and equity professionals who work seamlessly together. Uniquely among our listed peers, this allows us to invest in both direct real estate and loans, and to carefully assess the quality of both the debt and the underlying property asset before making a purchasing decision. Acquiring debt at a discount to its market value gives us control of the underlying asset. We can then execute asset management strategies (see below) that create further value for our shareholders. Strong pricing discipline Our distinctive investment strategy opens up a wide range of opportunities for us, meaning we can be highly selective about the ones we pursue and can exercise strong risk-return pricing discipline. We apply the KW team’s expertise and resources to perform detailed due diligence on everything we buy, whether it is a single asset or a large portfolio. This means we develop a deep understanding of what we are acquiring and the value we can add to it, enabling us to determine the appropriate price. This differentiates us from private equity firms, who are amongst our main competitors for the portfolios we acquire. Real estate operators Asset management sits at the heart of our value creation. During due diligence we produce a business plan for every asset, so the asset management team can start implementing actions on day one. An experienced in-house development team also helps to generate new thinking about the best way to develop an asset. KWE has permanent capital, so we can take a long-term view of each asset’s potential. An asset that is currently a core part of our portfolio may present asset management or development opportunities in several years’ time. We will also dispose of assets, for example where we have completed our value enhancement initiatives, so we can recycle the proceeds into other opportunities. Expert local presence Having expert people located in each of our markets is crucial for capitalising on local opportunities. We continue to grow to support our business and the wider KW team has grown to over 80 employees, comprising asset managers, investment specialists, and finance and operations, located in the UK, Ireland, Spain, Jersey and Luxembourg. This local expert knowledge and presence ensures we take a bottom- up approach to investment and asset management, and gives us the infrastructure to execute large portfolio transactions. Excellent relationships The Investment Manager and its advisors have excellent, strong relationships with financial institutions, as well as other potential sellers of under-resourced assets such as government agencies, commercial real estate lenders, receivers, REITs and property funds. These relationships give us a critical advantage in sourcing attractive investment opportunities, either off-market or with limited competition. Our ability to expeditiously complete transactions encourages vendors to transact with us and leads to repeat deal flow. S trateg ic rep o rt G overnance Financials A dditional inform ation Kennedy Wilson Europe Real Estate Plc / Annual Report and Accounts 2015 19
Our investment strategy We aim to create value by: • Capitalising on the recovery of the European real estate sector, through opportunistic investments and value enhancing asset management. Our target markets are the UK, Ireland, Spain and Italy. • Sourcing good quality real estate assets from sellers such as financial institutions, administrators and other vendors who are not core real estate operators. Often they are looking to deleverage by divesting such assets. • Targeting investments, directly or through loans, that have one of more of the following characteristics: – good quality properties in prime or just off-prime locations – underlying loan collateral that fits our asset-via-loan strategy for direct ownership – scope for short and medium-term asset management opportunities to deliver rental income and capital growth – properties which are under-managed and under-capitalised, where there are immediate opportunities to add value and/or – properties in locations that we expect to benefit from external factors such as infrastructure improvements, government or foreign direct investment. • Enhancing both rental and capital values through an active programme of asset management to improve the quality of our income. This also helps to maintain close and positive relationships with our tenants. 2. Efficient capital structure Progress in 2015 We continued to optimise our capital structure, including: • Issuing a £300 million, seven-year, unsecured, BBB rated bond • Establishing a £2,000 million EMTN programme and issuing €400 million of ten-year, unsecured, BBB rated loan notes • Agreeing vendor financing secured on the Gatsby portfolio of £348.9 million At the year end, the weighted average term to maturity of our debt had increased to 5.9 years (31 December 2014: 4.9 years) and the weighted average cost of debt was 2.9% (2014: 2.4%). The LTV was 39.7%. Announced quarterly interim dividend of 12 pence per share, or an annualised dividend of 48 pence per share, up 37% on 2015. See the Finance review on pages 48 to 53 for more on our capital structure 1. Income growth 2. Solid dividend Progress in 2015 We increased our total dividend for the year to 35 pence per share, which was covered 1.4 times by earnings. This contributed to a solid total accounting return of 18%, which reflects the increase in our net asset value plus dividends. Targeting £19.4 million of incremental NOI from selected asset management, over the next two years, of which £8.2 million is contracted. See the Finance review on pages 48 to 53 for more on the components of total return 1. Total return focused Kennedy Wilson Europe Real Estate Plc / Annual Report and Accounts 201520 Our strategy and goals Great progress meeting our 2015 goals 2016 goals
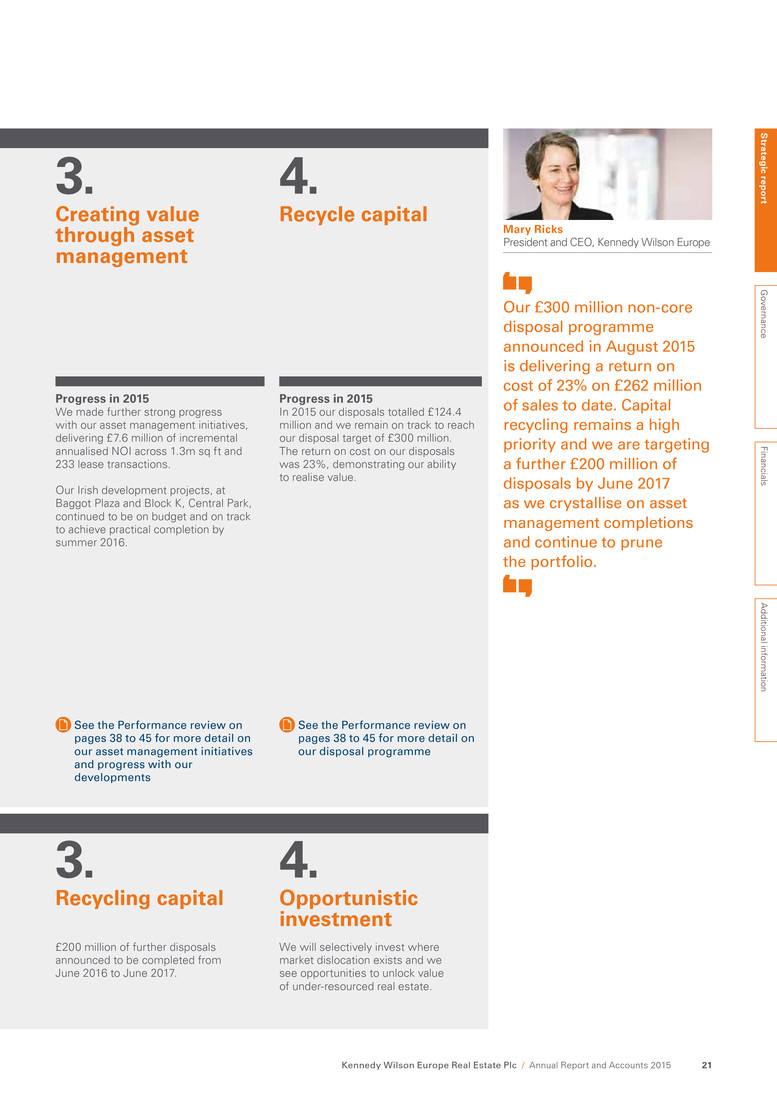
Progress in 2015 We made further strong progress with our asset management initiatives, delivering £7.6 million of incremental annualised NOI across 1.3m sq ft and 233 lease transactions. Our Irish development projects, at Baggot Plaza and Block K, Central Park, continued to be on budget and on track to achieve practical completion by summer 2016. £200 million of further disposals announced to be completed from June 2016 to June 2017. See the Performance review on pages 38 to 45 for more detail on our asset management initiatives and progress with our developments 3. Creating value through asset management Progress in 2015 In 2015 our disposals totalled £124.4 million and we remain on track to reach our disposal target of £300 million. The return on cost on our disposals was 23%, demonstrating our ability to realise value. We will selectively invest where market dislocation exists and we see opportunities to unlock value of under-resourced real estate. See the Performance review on pages 38 to 45 for more detail on our disposal programme 3. Recycling capital 4. Opportunistic investment 4. Recycle capital Mary Ricks President and CEO, Kennedy Wilson Europe Our £300 million non-core disposal programme announced in August 2015 is delivering a return on cost of 23% on £262 million of sales to date. Capital recycling remains a high priority and we are targeting a further £200 million of disposals by June 2017 as we crystallise on asset management completions and continue to prune the portfolio. S trateg ic rep o rt G overnance Financials A dditional inform ation Kennedy Wilson Europe Real Estate Plc / Annual Report and Accounts 2015 21 Great progress meeting our 2015 goals 2016 goals
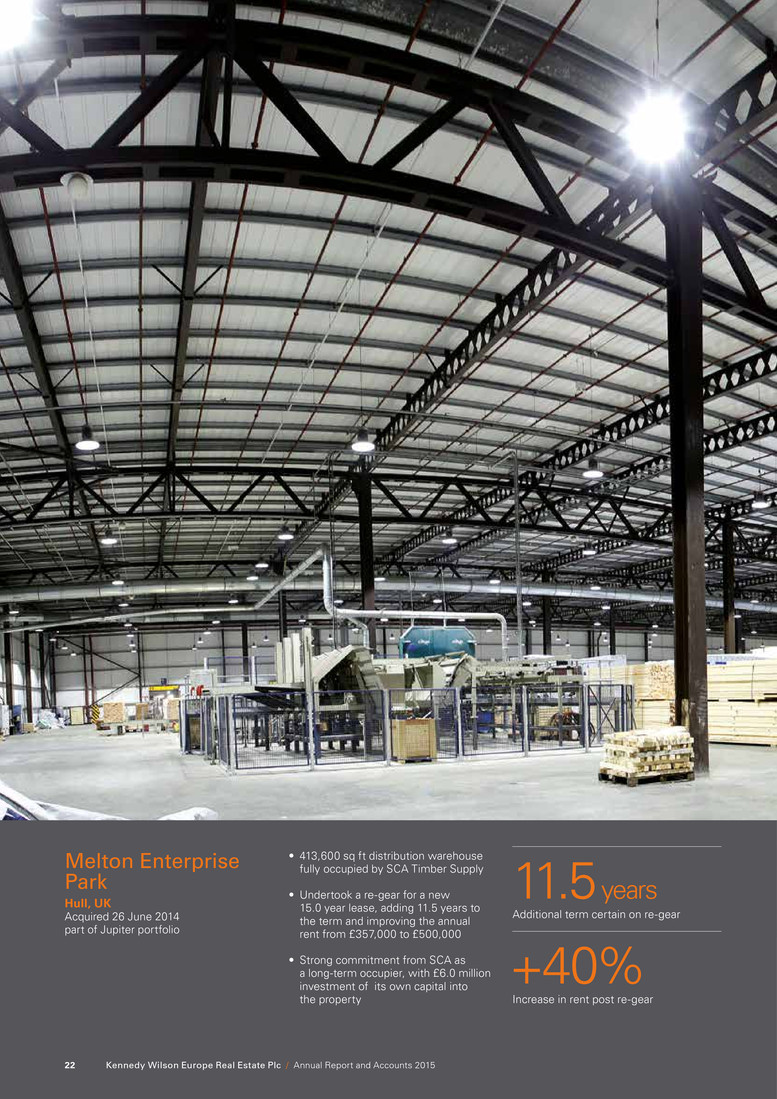
Melton Enterprise Park Hull, UK Acquired 26 June 2014 part of Jupiter portfolio 11.5 years Additional term certain on re-gear +40% Increase in rent post re-gear • 413,600 sq ft distribution warehouse fully occupied by SCA Timber Supply • Undertook a re-gear for a new 15.0 year lease, adding 11.5 years to the term and improving the annual rent from £357,000 to £500,000 • Strong commitment from SCA as a long-term occupier, with £6.0 million investment of its own capital into the property Kennedy Wilson Europe Real Estate Plc / Annual Report and Accounts 201522
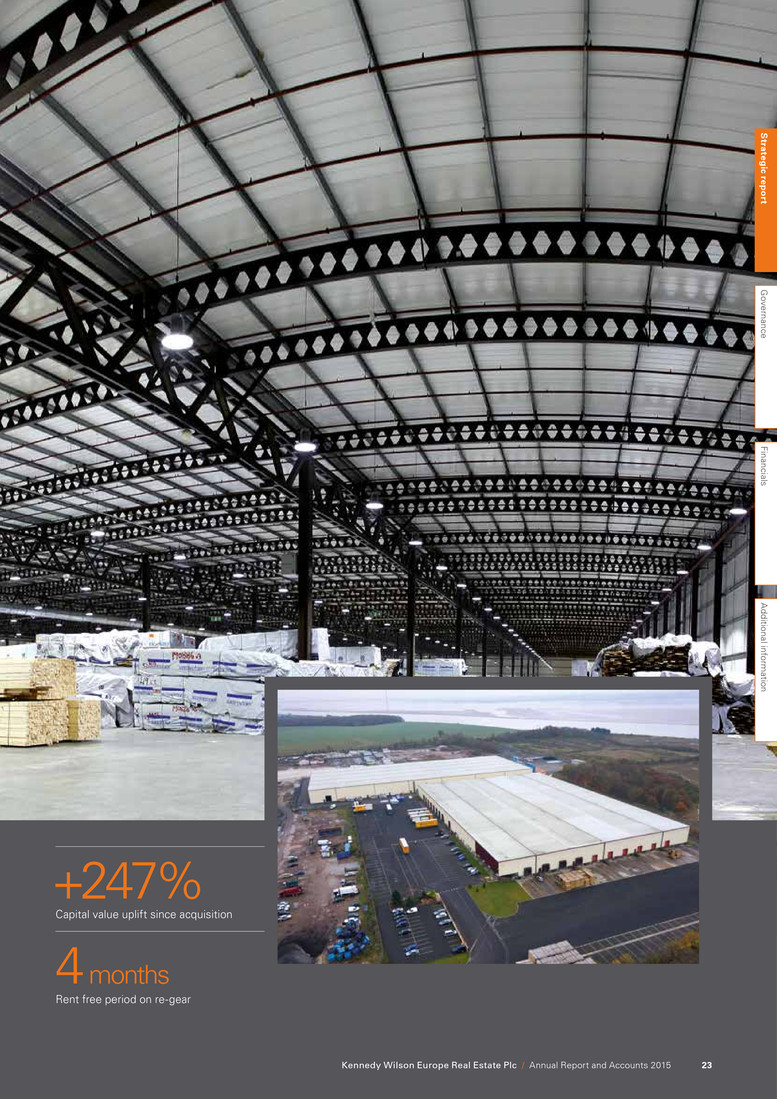
+247% Capital value uplift since acquisition 4 months Rent free period on re-gear S trateg ic rep o rt G overnance Financials A dditional inform ation Kennedy Wilson Europe Real Estate Plc / Annual Report and Accounts 2015 23
We use the following financial and non-financial metrics to track the implementation of our strategy and our operational and financial performance. Yield on cost The estimated annual NOI at the date of purchase, divided by the purchase price using actual purchaser’s cost Relevance to strategy Shows our ability to source assets at attractive entry points Performance in 2015 The yield on cost across our 2015 acquisitions of £1,135.5 million was 7.1%, this compares to our total performance yield on cost of 6.6% Performance in 2015 The adjusted NAV per share growth was 14.6% for the year. This was driven primarily through a strong valuation surplus but also gains on sale in the year where the premium achieved to preceding valuation was 5.8% Relevance to strategy Shows our ability to buy well and to add value to our properties through asset management and development activities Adjusted NAV The EPRA NAV after adjusting for the impact of the performance fee which is accounted for in the share-based payments reserve. The EPRA NAV definition excludes certain items not expected to be realised in a long-term investment property business model, such as the fair value of certain financial derivatives Adjusted NAV per share Adjusted NAV divided by the number of shares in issue at the period end 7.1% 2015 acquisition yield on cost 6.6% Total portfolio yield on cost at 31 December 2015 1,174.5p Adjusted NAV per share 14.6% Adjusted NAV per share growth Kennedy Wilson Europe Real Estate Plc / Annual Report and Accounts 201524 KPIs, Group and EPRA measures Measures, definition and performance

Performance in 2015 Adjusted earnings per share were 47.9 pence for the year. This is an increase of 85% on the prior period owing to a full year of 2014 operating income and supplemented by 2015 acquisition activity Adjusted earning per share covered the 2015 paid dividend of 35 pence per share 1.4 times Performance in 2015 The portfolio occupancy improved by 5.1 percentage points over the year from 90.9% at the end of 2014 to 96.0% at the end of 2015. The WAULT to first break is an attractive 7.3 years, with the WAULT to expiry at 9.2 years Performance in 2015 LTV at year end was 39.7% driven by the financing activity during the year including the issue to two senior unsecured bonds meaning that we now have a flexible mix of secured and unsecured finance WAIR is 2.9% and the weighted average term to maturity improved during 2015 by 12 months from 4.9 years to 5.9 years Relevance to strategy Shows that we have appropriate and affordable levels of gearing Relevance to strategy Shows our ability to generate earnings that cover our dividend payouts, which are a key part of our total return to shareholders Relevance to strategy Shows the security of cash flow, through tenants’ willingness to occupy them and to sign up to long leases EPRA occupancy Estimated Rental Value (ERV) of portfolio which is let, divided by the ERV of the whole portfolio, excluding loans, hotels and development properties WAULT The weighted average unexpired lease term remaining to first break across the portfolio, weighted by contracted rental income, excluding loans, hotels, development and residential properties LTV Loan to value is the ratio of net debt (gross debt less cash) to the total portfolio value (value of investment and development properties, loans secured by real estate and hotels) WAIR The weighted average interest rate is the Group’s interest rate across all drawn facilities weighted by all drawn debt at the period end Adjusted earnings EPRA earnings adding back the performance fee which is considered capital in nature. EPRA Earnings is a measure of the underlying operating performance of an investment property company excluding fair value gains, investment property disposals and other items that are not considered to be part of the core activity Adjusted earnings per share Adjusted earnings divided by the weighted average number of ordinary shares in issue during the period 39.7% Loan to value 2.9% WAIR 47.9p Adjusted earnings per share 85% Adjusted earnings per share growth 96.0% EPRA occupancy 7.3 years WAULT S trateg ic rep o rt G overnance Financials A dditional inform ation Kennedy Wilson Europe Real Estate Plc / Annual Report and Accounts 2015 25 Measures, definition and performance
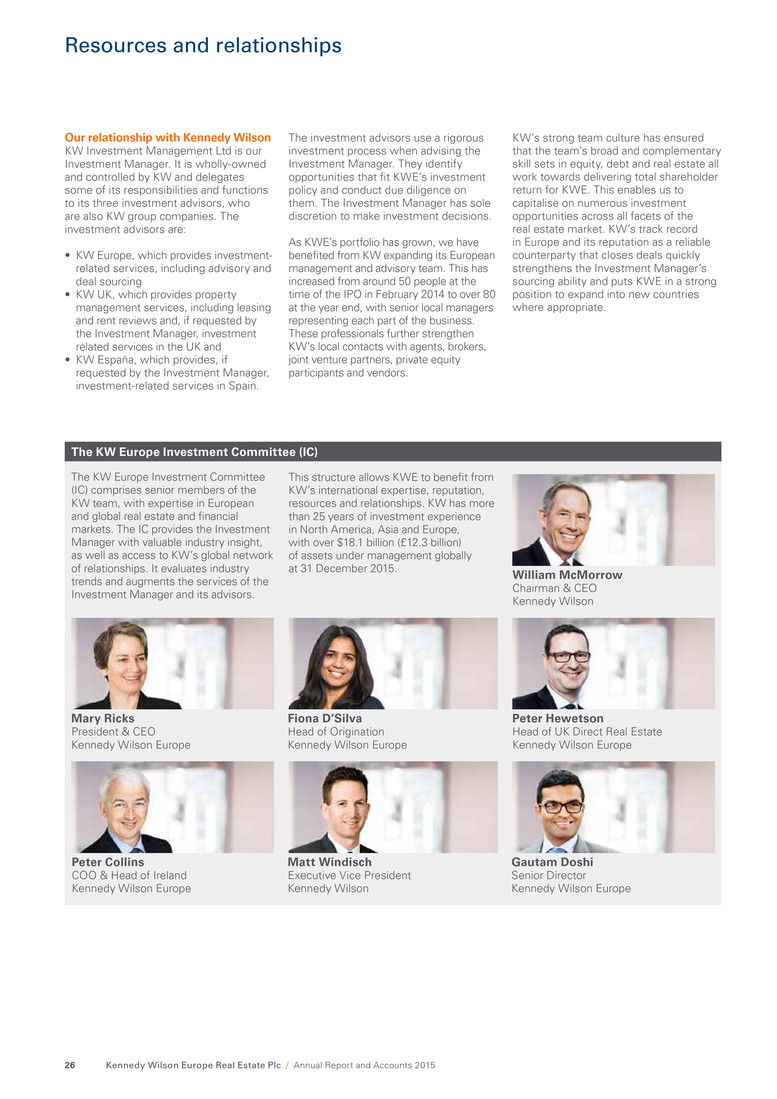
Our relationship with Kennedy Wilson KW Investment Management Ltd is our Investment Manager. It is wholly-owned and controlled by KW and delegates some of its responsibilities and functions to its three investment advisors, who are also KW group companies. The investment advisors are: • KW Europe, which provides investment- related services, including advisory and deal sourcing • KW UK, which provides property management services, including leasing and rent reviews and, if requested by the Investment Manager, investment related services in the UK and • KW España, which provides, if requested by the Investment Manager, investment-related services in Spain. The investment advisors use a rigorous investment process when advising the Investment Manager. They identify opportunities that fit KWE’s investment policy and conduct due diligence on them. The Investment Manager has sole discretion to make investment decisions. As KWE’s portfolio has grown, we have benefited from KW expanding its European management and advisory team. This has increased from around 50 people at the time of the IPO in February 2014 to over 80 at the year end, with senior local managers representing each part of the business. These professionals further strengthen KW’s local contacts with agents, brokers, joint venture partners, private equity participants and vendors. KW’s strong team culture has ensured that the team’s broad and complementary skill sets in equity, debt and real estate all work towards delivering total shareholder return for KWE. This enables us to capitalise on numerous investment opportunities across all facets of the real estate market. KW’s track record in Europe and its reputation as a reliable counterparty that closes deals quickly strengthens the Investment Manager’s sourcing ability and puts KWE in a strong position to expand into new countries where appropriate. The KW Europe Investment Committee (IC) comprises senior members of the KW team, with expertise in European and global real estate and financial markets. The IC provides the Investment Manager with valuable industry insight, as well as access to KW’s global network of relationships. It evaluates industry trends and augments the services of the Investment Manager and its advisors. Fiona D’Silva Head of Origination Kennedy Wilson Europe Matt Windisch Executive Vice President Kennedy Wilson Gautam Doshi Senior Director Kennedy Wilson Europe Peter Collins COO & Head of Ireland Kennedy Wilson Europe Peter Hewetson Head of UK Direct Real Estate Kennedy Wilson Europe Mary Ricks President & CEO Kennedy Wilson Europe William McMorrow Chairman & CEO Kennedy Wilson This structure allows KWE to benefit from KW’s international expertise, reputation, resources and relationships. KW has more than 25 years of investment experience in North America, Asia and Europe, with over $18.1 billion (£12.3 billion) of assets under management globally at 31 December 2015. Kennedy Wilson Europe Real Estate Plc / Annual Report and Accounts 201526 The KW Europe Investment Committee (IC) Resources and relationships
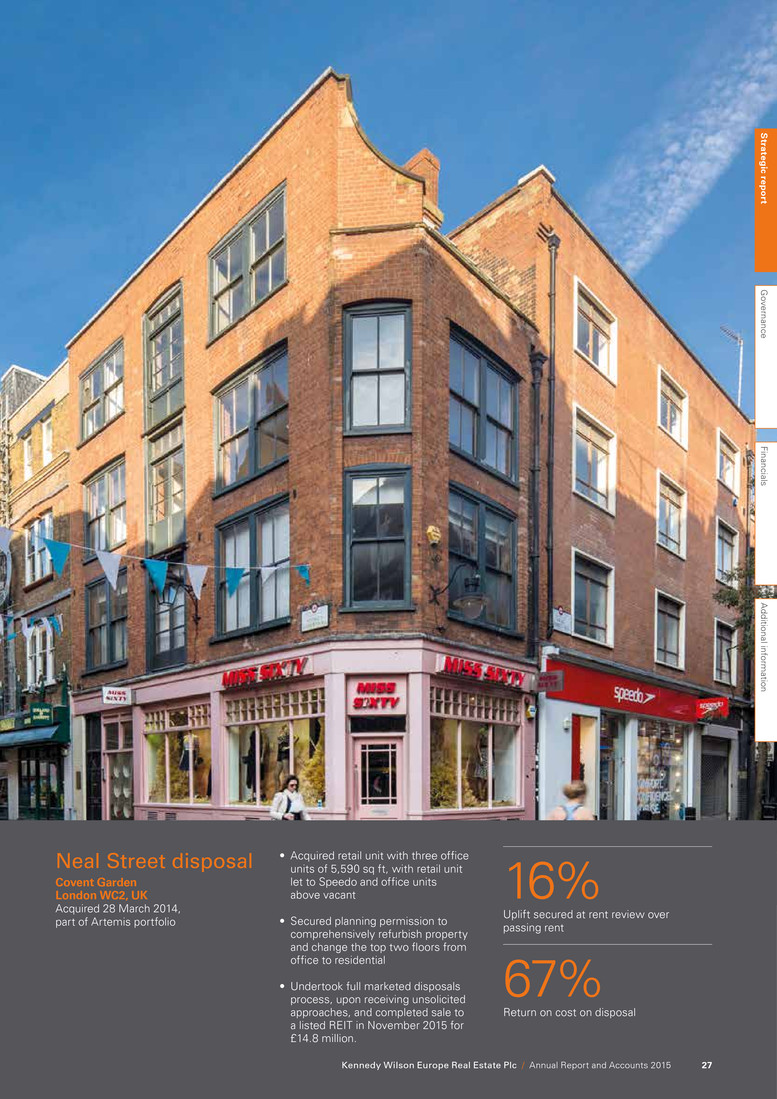
Neal Street disposal Covent Garden London WC2, UK Acquired 28 March 2014, part of Artemis portfolio 16% Uplift secured at rent review over passing rent 67% Return on cost on disposal • Acquired retail unit with three office units of 5,590 sq ft, with retail unit let to Speedo and office units above vacant • Secured planning permission to comprehensively refurbish property and change the top two floors from office to residential • Undertook full marketed disposals process, upon receiving unsolicited approaches, and completed sale to a listed REIT in November 2015 for £14.8 million. S trateg ic rep o rt G overnance Financials A dditional inform ation Kennedy Wilson Europe Real Estate Plc / Annual Report and Accounts 2015 27
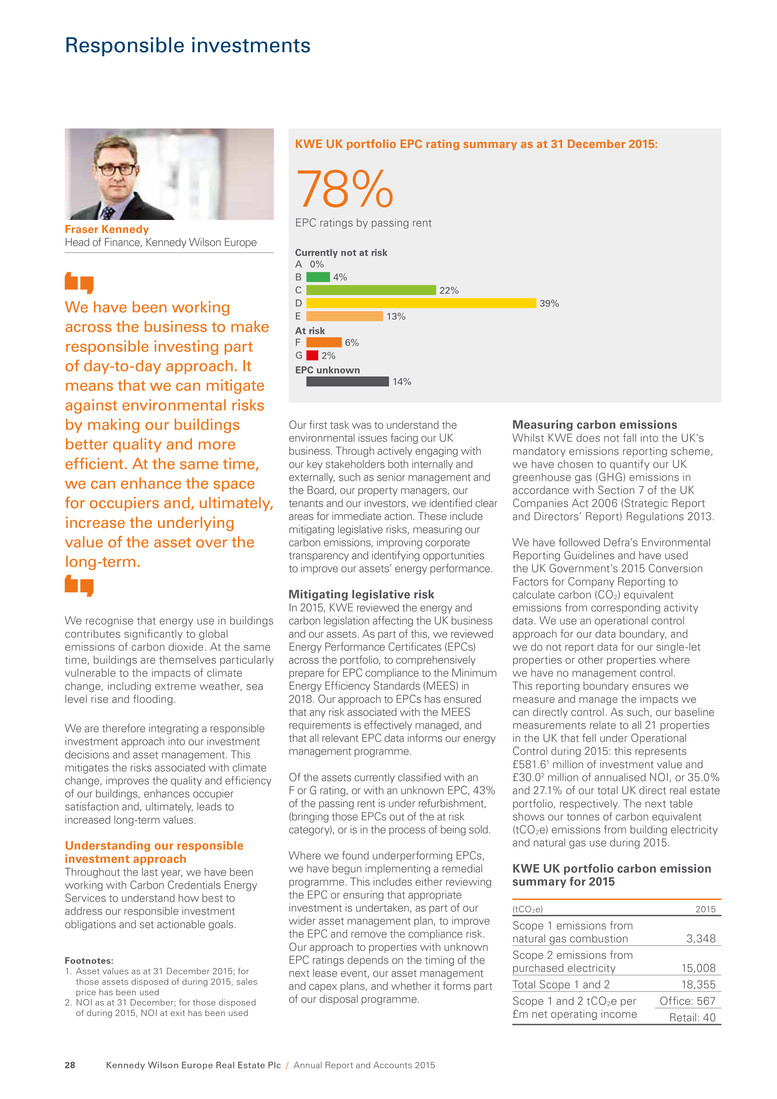
4% 0% 22% 39% 13% 6% 2% 14% Currently not at risk A B C D E F G At risk EPC unknown We recognise that energy use in buildings contributes significantly to global emissions of carbon dioxide. At the same time, buildings are themselves particularly vulnerable to the impacts of climate change, including extreme weather, sea level rise and flooding. We are therefore integrating a responsible investment approach into our investment decisions and asset management. This mitigates the risks associated with climate change, improves the quality and efficiency of our buildings, enhances occupier satisfaction and, ultimately, leads to increased long-term values. Understanding our responsible investment approach Throughout the last year, we have been working with Carbon Credentials Energy Services to understand how best to address our responsible investment obligations and set actionable goals. Our first task was to understand the environmental issues facing our UK business. Through actively engaging with our key stakeholders both internally and externally, such as senior management and the Board, our property managers, our tenants and our investors, we identified clear areas for immediate action. These include mitigating legislative risks, measuring our carbon emissions, improving corporate transparency and identifying opportunities to improve our assets’ energy performance. Mitigating legislative risk In 2015, KWE reviewed the energy and carbon legislation affecting the UK business and our assets. As part of this, we reviewed Energy Performance Certificates (EPCs) across the portfolio, to comprehensively prepare for EPC compliance to the Minimum Energy Efficiency Standards (MEES) in 2018. Our approach to EPCs has ensured that any risk associated with the MEES requirements is effectively managed, and that all relevant EPC data informs our energy management programme. Of the assets currently classified with an F or G rating, or with an unknown EPC, 43% of the passing rent is under refurbishment, (bringing those EPCs out of the at risk category), or is in the process of being sold. Where we found underperforming EPCs, we have begun implementing a remedial programme. This includes either reviewing the EPC or ensuring that appropriate investment is undertaken, as part of our wider asset management plan, to improve the EPC and remove the compliance risk. Our approach to properties with unknown EPC ratings depends on the timing of the next lease event, our asset management and capex plans, and whether it forms part of our disposal programme. KWE UK portfolio EPC rating summary as at 31 December 2015: Measuring carbon emissions Whilst KWE does not fall into the UK’s mandatory emissions reporting scheme, we have chosen to quantify our UK greenhouse gas (GHG) emissions in accordance with Section 7 of the UK Companies Act 2006 (Strategic Report and Directors’ Report) Regulations 2013. We have followed Defra’s Environmental Reporting Guidelines and have used the UK Government’s 2015 Conversion Factors for Company Reporting to calculate carbon (CO2) equivalent emissions from corresponding activity data. We use an operational control approach for our data boundary, and we do not report data for our single-let properties or other properties where we have no management control. This reporting boundary ensures we measure and manage the impacts we can directly control. As such, our baseline measurements relate to all 21 properties in the UK that fell under Operational Control during 2015: this represents £581.61 million of investment value and £30.02 million of annualised NOI, or 35.0% and 27.1% of our total UK direct real estate portfolio, respectively. The next table shows our tonnes of carbon equivalent (tCO2e) emissions from building electricity and natural gas use during 2015. KWE UK portfolio carbon emission summary for 2015 (tCO2e) 2015 Scope 1 emissions from natural gas combustion 3,348 Scope 2 emissions from purchased electricity 15,008 Total Scope 1 and 2 18,355 Scope 1 and 2 tCO2e per £m net operating income Office: 567 Retail: 40 78% EPC ratings by passing rent We have been working across the business to make responsible investing part of day-to-day approach. It means that we can mitigate against environmental risks by making our buildings better quality and more efficient. At the same time, we can enhance the space for occupiers and, ultimately, increase the underlying value of the asset over the long-term. Fraser Kennedy Head of Finance, Kennedy Wilson Europe Footnotes: 1. Asset values as at 31 December 2015; for those assets disposed of during 2015, sales price has been used 2. NOI as at 31 December; for those disposed of during 2015, NOI at exit has been used Kennedy Wilson Europe Real Estate Plc / Annual Report and Accounts 201528 Responsible investments
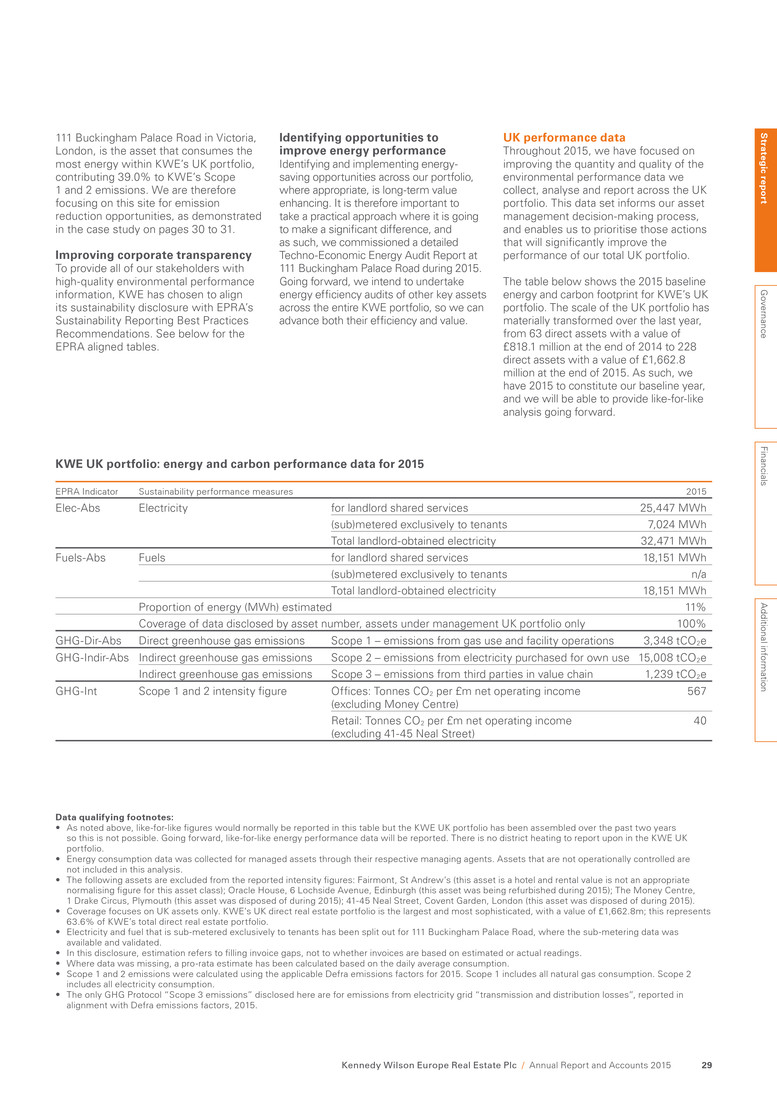
111 Buckingham Palace Road in Victoria, London, is the asset that consumes the most energy within KWE’s UK portfolio, contributing 39.0% to KWE’s Scope 1 and 2 emissions. We are therefore focusing on this site for emission reduction opportunities, as demonstrated in the case study on pages 30 to 31. Improving corporate transparency To provide all of our stakeholders with high-quality environmental performance information, KWE has chosen to align its sustainability disclosure with EPRA’s Sustainability Reporting Best Practices Recommendations. See below for the EPRA aligned tables. Identifying opportunities to improve energy performance Identifying and implementing energy- saving opportunities across our portfolio, where appropriate, is long-term value enhancing. It is therefore important to take a practical approach where it is going to make a significant difference, and as such, we commissioned a detailed Techno-Economic Energy Audit Report at 111 Buckingham Palace Road during 2015. Going forward, we intend to undertake energy efficiency audits of other key assets across the entire KWE portfolio, so we can advance both their efficiency and value. KWE UK portfolio: energy and carbon performance data for 2015 EPRA Indicator Sustainability performance measures 2015 Elec-Abs Electricity for landlord shared services 25,447 MWh (sub)metered exclusively to tenants 7,024 MWh Total landlord-obtained electricity 32,471 MWh Fuels-Abs Fuels for landlord shared services 18,151 MWh (sub)metered exclusively to tenants n/a Total landlord-obtained electricity 18,151 MWh Proportion of energy (MWh) estimated 11% Coverage of data disclosed by asset number, assets under management UK portfolio only 100% GHG-Dir-Abs Direct greenhouse gas emissions Scope 1 – emissions from gas use and facility operations 3,348 tCO2e GHG-Indir-Abs Indirect greenhouse gas emissions Scope 2 – emissions from electricity purchased for own use 15,008 tCO2e Indirect greenhouse gas emissions Scope 3 – emissions from third parties in value chain 1,239 tCO2e GHG-Int Scope 1 and 2 intensity figure Offices: Tonnes CO2 per £m net operating income (excluding Money Centre) 567 Retail: Tonnes CO2 per £m net operating income (excluding 41-45 Neal Street) 40 Data qualifying footnotes: • As noted above, like-for-like figures would normally be reported in this table but the KWE UK portfolio has been assembled over the past two years so this is not possible. Going forward, like-for-like energy performance data will be reported. There is no district heating to report upon in the KWE UK portfolio. • Energy consumption data was collected for managed assets through their respective managing agents. Assets that are not operationally controlled are not included in this analysis. • The following assets are excluded from the reported intensity figures: Fairmont, St Andrew’s (this asset is a hotel and rental value is not an appropriate normalising figure for this asset class); Oracle House, 6 Lochside Avenue, Edinburgh (this asset was being refurbished during 2015); The Money Centre, 1 Drake Circus, Plymouth (this asset was disposed of during 2015); 41-45 Neal Street, Covent Garden, London (this asset was disposed of during 2015). • Coverage focuses on UK assets only. KWE’s UK direct real estate portfolio is the largest and most sophisticated, with a value of £1,662.8m; this represents 63.6% of KWE’s total direct real estate portfolio. • Electricity and fuel that is sub-metered exclusively to tenants has been split out for 111 Buckingham Palace Road, where the sub-metering data was available and validated. • In this disclosure, estimation refers to filling invoice gaps, not to whether invoices are based on estimated or actual readings. • Where data was missing, a pro-rata estimate has been calculated based on the daily average consumption. • Scope 1 and 2 emissions were calculated using the applicable Defra emissions factors for 2015. Scope 1 includes all natural gas consumption. Scope 2 includes all electricity consumption. • The only GHG Protocol “Scope 3 emissions” disclosed here are for emissions from electricity grid “transmission and distribution losses”, reported in alignment with Defra emissions factors, 2015. UK performance data Throughout 2015, we have focused on improving the quantity and quality of the environmental performance data we collect, analyse and report across the UK portfolio. This data set informs our asset management decision-making process, and enables us to prioritise those actions that will significantly improve the performance of our total UK portfolio. The table below shows the 2015 baseline energy and carbon footprint for KWE’s UK portfolio. The scale of the UK portfolio has materially transformed over the last year, from 63 direct assets with a value of £818.1 million at the end of 2014 to 228 direct assets with a value of £1,662.8 million at the end of 2015. As such, we have 2015 to constitute our baseline year, and we will be able to provide like-for-like analysis going forward. S trateg ic rep o rt G overnance Financials A dditional inform ation Kennedy Wilson Europe Real Estate Plc / Annual Report and Accounts 2015 29

Electricity Natural gas Tenant Landlord/tenant electricity split 96% 4% 55% 45% Site electricity and gas Landlord 111 Buckingham Palace Road (111 BPR) is the largest office building in our UK portfolio. We have already invested in a number of energy conservation measures in the building, including the installation of air handling unit optimisers, improved Building Management System controllers and energy efficient lighting in communal areas. Additionally we have worked with Telegraph Media Group, the largest tenant at 111 BPR who complies with the Energy Savings Opportunity Scheme, to identify further energy efficiency opportunities in the building. We have worked with Carbon Credentials Energy Services to carry out a Techno- Economic Energy Audit Report at the site and provide energy saving recommendations. The energy audit was commissioned to enable us to build on our previous initiatives and to help us understand the property’s full energy performance potential. Each year, 15.7 GWh of electricity and gas is consumed at 111 BPR. Within this, approximately 55% of electricity consumption is attributable to the tenants, with the remaining 45% used by central landlord plant and equipment. The building already has a detailed sub-metering system, which allows consumption to be broken down into parent sub-meter and plant equipment level where required. Energy saving recommendations identified by the Techno-Economic Energy Audit The Techno-Economic Energy Audit highlighted four key areas for improvement, which will lead to both immediate and longer-term reductions in energy use. These areas are: Energy usage at 111 Buckingham Palace Road Optimisation and upgrades – A number of opportunities to upgrade the building have been highlighted. Through improved control and low-cost investment relating to the central plant, building management system and lighting, we forecast an annual saving of up to £38,800. Engagement – Thermal conditions vary throughout the building, as they are currently dictated by each tenant. This leads to high levels of equipment energy consumption, as the plant has long running hours and heating and cooling can be required simultaneously. Improving tenant engagement through increasing awareness initiatives and implementing a change to the ‘out of hours’ working process will drive significant energy savings. Renewables – The large roof space at 111 BPR offers the possibility of installing solar photovoltaics (PV). The roof’s structural properties are to be further analysed by a solar PV installation company. Lifecycle replacement – An asset replacement strategy that looks beyond the manufacturer’s expected lifecycle will deliver significant energy savings over a five to ten-year programme. At the point of replacement, all major plant equipment will be assessed for energy efficient alternatives. Plant equipment sizing and location will also be carefully considered in relation to current operations, improved controls and future enhancement. 15.7 GWh Total electricity and gas usage Kennedy Wilson Europe Real Estate Plc / Annual Report and Accounts 201530 Responsible investments continued Case Study – 111 Buckingham Palace Road, Victoria, London SW1
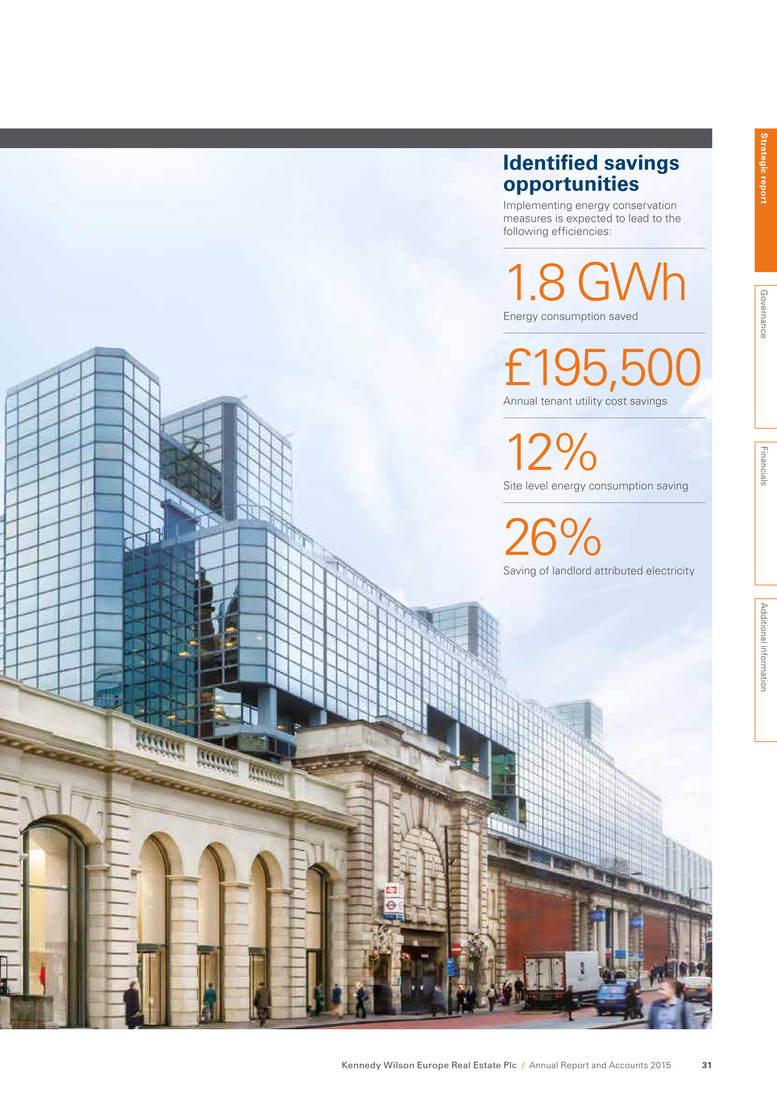
Identified savings opportunities Implementing energy conservation measures is expected to lead to the following efficiencies: 1.8 GWh Energy consumption saved £195,500 Annual tenant utility cost savings 12% Site level energy consumption saving 26% Saving of landlord attributed electricity S trateg ic rep o rt G overnance Financials A dditional inform ation Kennedy Wilson Europe Real Estate Plc / Annual Report and Accounts 2015 31 Case Study – 111 Buckingham Palace Road, Victoria, London SW1
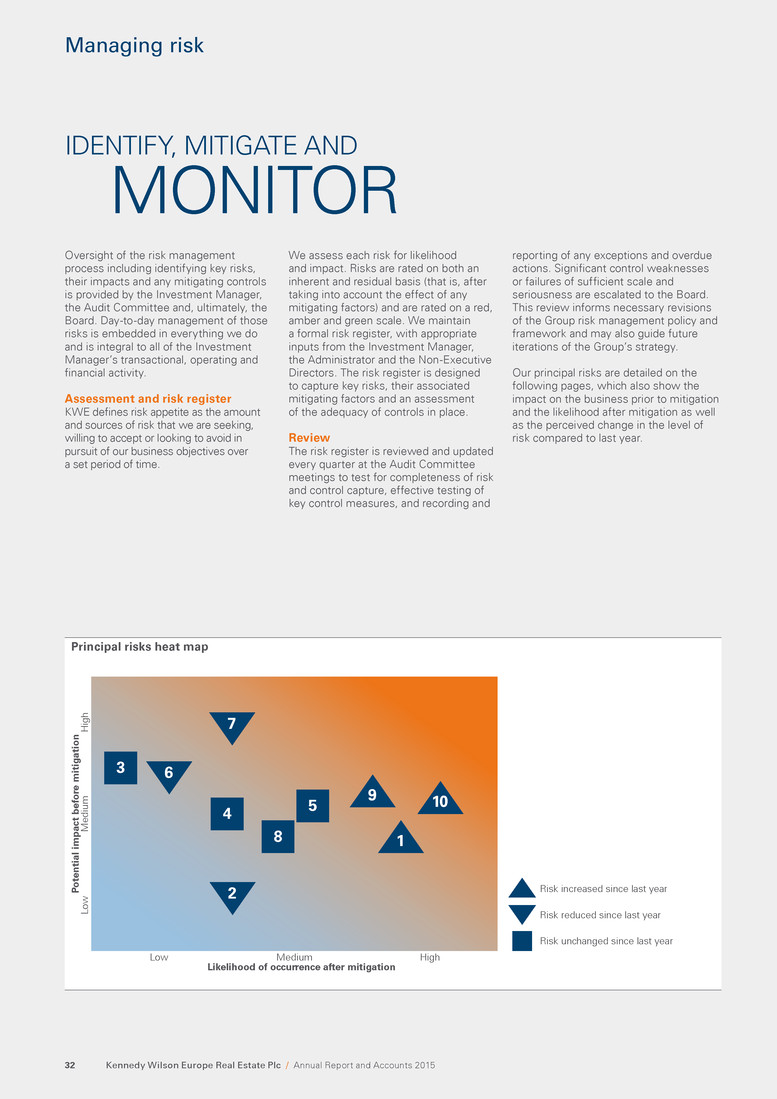
Likelihood of occurrence after mitigation Medium HighLow Po tential impact be fo re miti gatio n Mediu m Hig h Lo w Risk increased since last year Risk reduced since last year Risk unchanged since last year 3 4 5 8 2 6 7 1 9 10 IDENTIFY, MITIGATE AND MONITOR Oversight of the risk management process including identifying key risks, their impacts and any mitigating controls is provided by the Investment Manager, the Audit Committee and, ultimately, the Board. Day-to-day management of those risks is embedded in everything we do and is integral to all of the Investment Manager’s transactional, operating and financial activity. Assessment and risk register KWE defines risk appetite as the amount and sources of risk that we are seeking, willing to accept or looking to avoid in pursuit of our business objectives over a set period of time. We assess each risk for likelihood and impact. Risks are rated on both an inherent and residual basis (that is, after taking into account the effect of any mitigating factors) and are rated on a red, amber and green scale. We maintain a formal risk register, with appropriate inputs from the Investment Manager, the Administrator and the Non-Executive Directors. The risk register is designed to capture key risks, their associated mitigating factors and an assessment of the adequacy of controls in place. Review The risk register is reviewed and updated every quarter at the Audit Committee meetings to test for completeness of risk and control capture, effective testing of key control measures, and recording and Principal risks heat map reporting of any exceptions and overdue actions. Significant control weaknesses or failures of sufficient scale and seriousness are escalated to the Board. This review informs necessary revisions of the Group risk management policy and framework and may also guide future iterations of the Group’s strategy. Our principal risks are detailed on the following pages, which also show the impact on the business prior to mitigation and the likelihood after mitigation as well as the perceived change in the level of risk compared to last year. Kennedy Wilson Europe Real Estate Plc / Annual Report and Accounts 201532 Managing risk
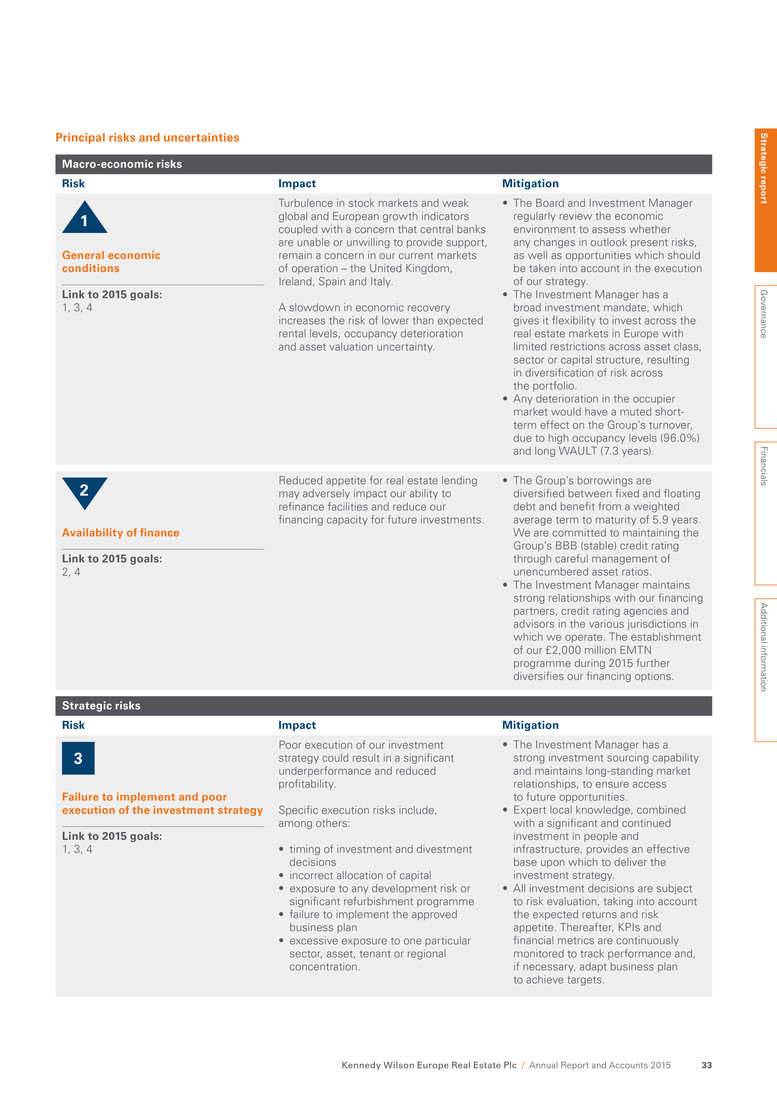
Principal risks and uncertainties Macro-economic risks Risk Impact Mitigation 1 General economic conditions Link to 2015 goals: 1, 3, 4 Turbulence in stock markets and weak global and European growth indicators coupled with a concern that central banks are unable or unwilling to provide support, remain a concern in our current markets of operation – the United Kingdom, Ireland, Spain and Italy. A slowdown in economic recovery increases the risk of lower than expected rental levels, occupancy deterioration and asset valuation uncertainty. • The Board and Investment Manager regularly review the economic environment to assess whether any changes in outlook present risks, as well as opportunities which should be taken into account in the execution of our strategy. • The Investment Manager has a broad investment mandate, which gives it flexibility to invest across the real estate markets in Europe with limited restrictions across asset class, sector or capital structure, resulting in diversification of risk across the portfolio. • Any deterioration in the occupier market would have a muted short- term effect on the Group’s turnover, due to high occupancy levels (96.0%) and long WAULT (7.3 years). 2 Availability of finance Link to 2015 goals: 2, 4 Reduced appetite for real estate lending may adversely impact our ability to refinance facilities and reduce our financing capacity for future investments. • The Group’s borrowings are diversified between fixed and floating debt and benefit from a weighted average term to maturity of 5.9 years. We are committed to maintaining the Group’s BBB (stable) credit rating through careful management of unencumbered asset ratios. • The Investment Manager maintains strong relationships with our financing partners, credit rating agencies and advisors in the various jurisdictions in which we operate. The establishment of our £2,000 million EMTN programme during 2015 further diversifies our financing options. Strategic risks Risk Impact Mitigation 3 Failure to implement and poor execution of the investment strategy Link to 2015 goals: 1, 3, 4 Poor execution of our investment strategy could result in a significant underperformance and reduced profitability. Specific execution risks include, among others: • timing of investment and divestment decisions • incorrect allocation of capital • exposure to any development risk or significant refurbishment programme • failure to implement the approved business plan • excessive exposure to one particular sector, asset, tenant or regional concentration. • The Investment Manager has a strong investment sourcing capability and maintains long-standing market relationships, to ensure access to future opportunities. • Expert local knowledge, combined with a significant and continued investment in people and infrastructure, provides an effective base upon which to deliver the investment strategy. • All investment decisions are subject to risk evaluation, taking into account the expected returns and risk appetite. Thereafter, KPIs and financial metrics are continuously monitored to track performance and, if necessary, adapt business plan to achieve targets. S trateg ic rep o rt G overnance Financials A dditional inform ation Kennedy Wilson Europe Real Estate Plc / Annual Report and Accounts 2015 33

Strategic risks continued Risk Impact Mitigation 4 Development and construction Link to 2015 goals: 1, 3 Property development projects inherently carry risks with them. These include: • planning risk: the inability to secure planning consent due to political, legislative, regulatory and other risks inherent in the planning environment • construction risk: timing delays, reliance on third parties, including the risk of contractor failure, and additional cost overruns • occupier risk: occupiers may be reluctant to take space upon project completion. • At any point, aggregate development costs will not exceed 15% of the Group’s most recently published NAV, thereby reducing the overall potential impact of development risk. • The Investment Manager has a strong and experienced construction and development management team. They undertake extensive consultation, design and technical work prior to beginning any project, as well as engaging with relevant authorities at a local and national level, to ensure development proposals are in line with current and emerging policy. • For each project, we make a judgement about apportioning of construction risk. Where we retain this risk, we fix costs early in the process, subject to other market factors, with key contractors subject to a formal tender process and ongoing financial covenant review. • Market cycle and likely customer demand are assessed before committing to new developments and pre-lets are secured where appropriate. Operational risks Risk Impact Mitigation 5 Leverage and Treasury Link to 2015 goals: 2 Adverse interest rate or foreign currency movements may result in reduced earnings. Breach of bank facility or bond covenants could result in default and the requirement to repay debt ahead of planned maturities. Lack of control over bank accounts and cash movements across multiple jurisdictions and/or failure to monitor the creditworthiness of counterparties could result in sub-optimal returns or financial loss. • Interest rate risk is mitigated through a combination of fixed rate debt and derivative instruments, such as interest rate caps. As at 31 December 2015 85% of our borrowings were fixed or subject to hedging. • Foreign currency movements are offset by a combination of natural hedging through local currency borrowing and derivative instruments, such as cross-currency swaps. As at 31 December 2015 83% of Euro assets are hedged in this manner. • We regularly monitor our LTV and associated covenants, both on an actual and forecast. Our prudent treasury management policy ensures the Group always carries a sufficient level of cash to deal with unforeseen contingencies, as well as ensuring loan documentation includes cure rights for covenant breaches. • The Investment Manager provides a dedicated treasury management team, with cash control and monthly cash sweep mechanisms in place across the Group. The credit-rating and deposit rates of our banking partners are continuously monitored. Kennedy Wilson Europe Real Estate Plc / Annual Report and Accounts 201534 Managing risk continued
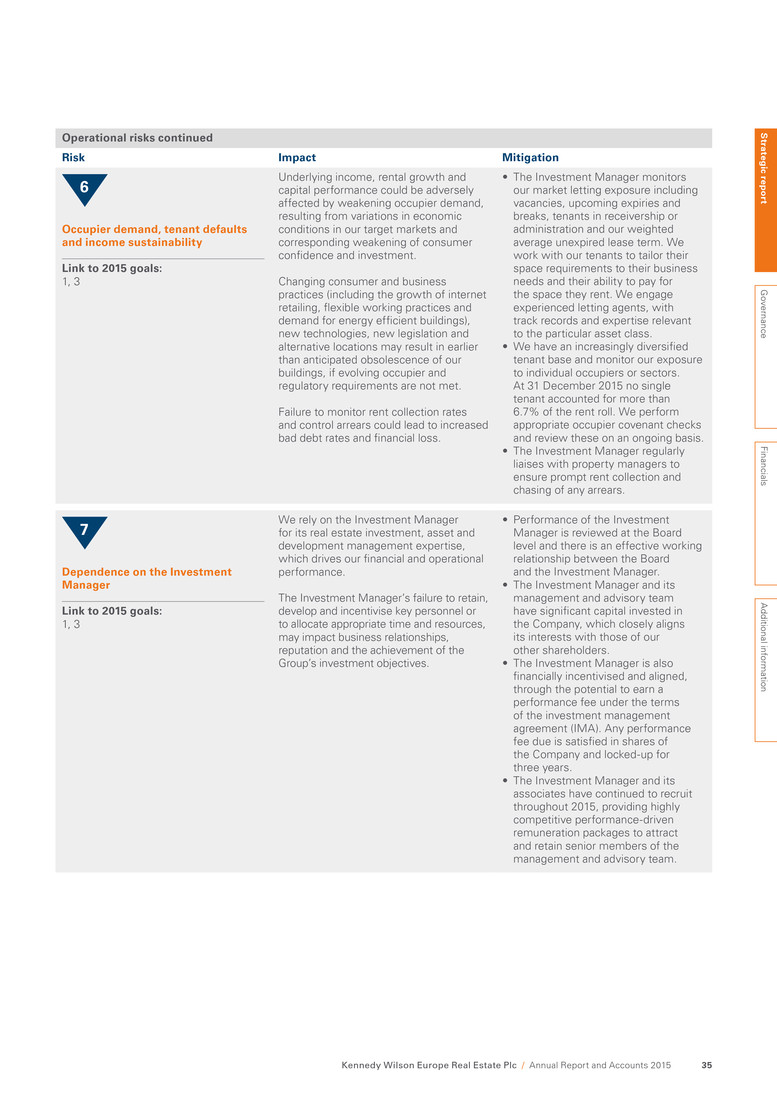
Operational risks continued Risk Impact Mitigation 6 Occupier demand, tenant defaults and income sustainability Link to 2015 goals: 1, 3 Underlying income, rental growth and capital performance could be adversely affected by weakening occupier demand, resulting from variations in economic conditions in our target markets and corresponding weakening of consumer confidence and investment. Changing consumer and business practices (including the growth of internet retailing, flexible working practices and demand for energy efficient buildings), new technologies, new legislation and alternative locations may result in earlier than anticipated obsolescence of our buildings, if evolving occupier and regulatory requirements are not met. Failure to monitor rent collection rates and control arrears could lead to increased bad debt rates and financial loss. • The Investment Manager monitors our market letting exposure including vacancies, upcoming expiries and breaks, tenants in receivership or administration and our weighted average unexpired lease term. We work with our tenants to tailor their space requirements to their business needs and their ability to pay for the space they rent. We engage experienced letting agents, with track records and expertise relevant to the particular asset class. • We have an increasingly diversified tenant base and monitor our exposure to individual occupiers or sectors. At 31 December 2015 no single tenant accounted for more than 6.7% of the rent roll. We perform appropriate occupier covenant checks and review these on an ongoing basis. • The Investment Manager regularly liaises with property managers to ensure prompt rent collection and chasing of any arrears. 7 Dependence on the Investment Manager Link to 2015 goals: 1, 3 We rely on the Investment Manager for its real estate investment, asset and development management expertise, which drives our financial and operational performance. The Investment Manager’s failure to retain, develop and incentivise key personnel or to allocate appropriate time and resources, may impact business relationships, reputation and the achievement of the Group’s investment objectives. • Performance of the Investment Manager is reviewed at the Board level and there is an effective working relationship between the Board and the Investment Manager. • The Investment Manager and its management and advisory team have significant capital invested in the Company, which closely aligns its interests with those of our other shareholders. • The Investment Manager is also financially incentivised and aligned, through the potential to earn a performance fee under the terms of the investment management agreement (IMA). Any performance fee due is satisfied in shares of the Company and locked-up for three years. • The Investment Manager and its associates have continued to recruit throughout 2015, providing highly competitive performance-driven remuneration packages to attract and retain senior members of the management and advisory team. S trateg ic rep o rt G overnance Financials A dditional inform ation Kennedy Wilson Europe Real Estate Plc / Annual Report and Accounts 2015 35
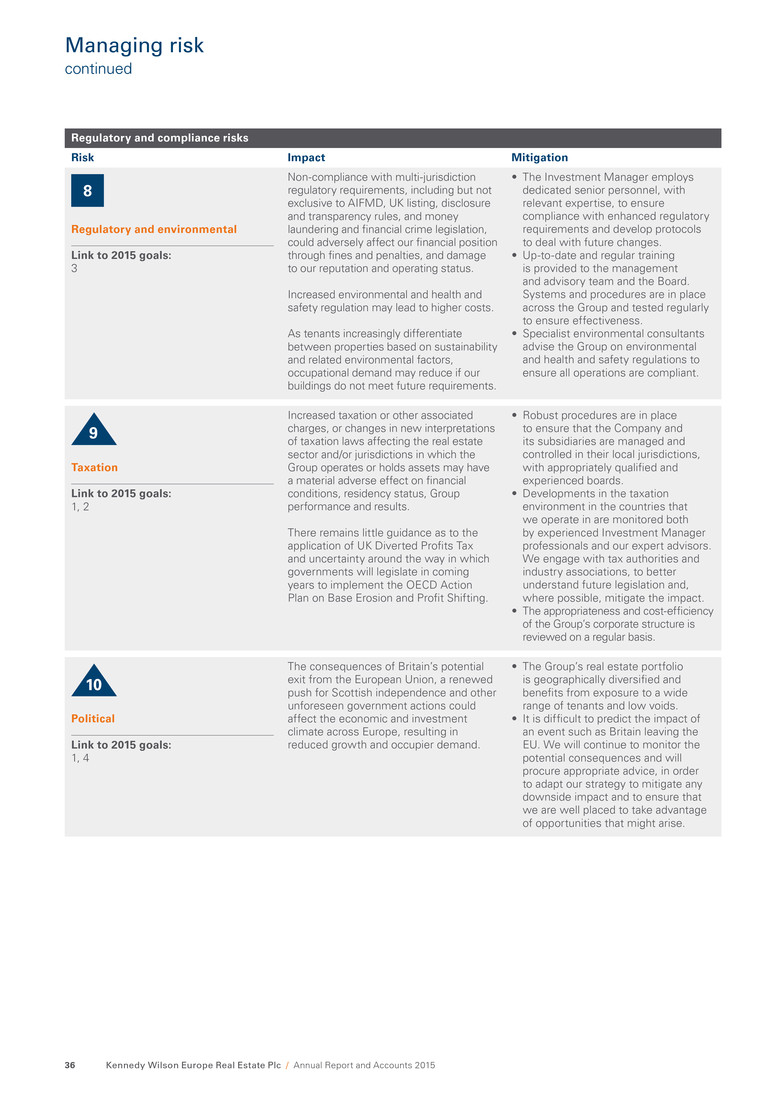
Regulatory and compliance risks Risk Impact Mitigation 8 Regulatory and environmental Link to 2015 goals: 3 Non-compliance with multi-jurisdiction regulatory requirements, including but not exclusive to AIFMD, UK listing, disclosure and transparency rules, and money laundering and financial crime legislation, could adversely affect our financial position through fines and penalties, and damage to our reputation and operating status. Increased environmental and health and safety regulation may lead to higher costs. As tenants increasingly differentiate between properties based on sustainability and related environmental factors, occupational demand may reduce if our buildings do not meet future requirements. • The Investment Manager employs dedicated senior personnel, with relevant expertise, to ensure compliance with enhanced regulatory requirements and develop protocols to deal with future changes. • Up-to-date and regular training is provided to the management and advisory team and the Board. Systems and procedures are in place across the Group and tested regularly to ensure effectiveness. • Specialist environmental consultants advise the Group on environmental and health and safety regulations to ensure all operations are compliant. 9 Taxation Link to 2015 goals: 1, 2 Increased taxation or other associated charges, or changes in new interpretations of taxation laws affecting the real estate sector and/or jurisdictions in which the Group operates or holds assets may have a material adverse effect on financial conditions, residency status, Group performance and results. There remains little guidance as to the application of UK Diverted Profits Tax and uncertainty around the way in which governments will legislate in coming years to implement the OECD Action Plan on Base Erosion and Profit Shifting. • Robust procedures are in place to ensure that the Company and its subsidiaries are managed and controlled in their local jurisdictions, with appropriately qualified and experienced boards. • Developments in the taxation environment in the countries that we operate in are monitored both by experienced Investment Manager professionals and our expert advisors. We engage with tax authorities and industry associations, to better understand future legislation and, where possible, mitigate the impact. • The appropriateness and cost-efficiency of the Group’s corporate structure is reviewed on a regular basis. 10 Political Link to 2015 goals: 1, 4 The consequences of Britain’s potential exit from the European Union, a renewed push for Scottish independence and other unforeseen government actions could affect the economic and investment climate across Europe, resulting in reduced growth and occupier demand. • The Group’s real estate portfolio is geographically diversified and benefits from exposure to a wide range of tenants and low voids. • It is difficult to predict the impact of an event such as Britain leaving the EU. We will continue to monitor the potential consequences and will procure appropriate advice, in order to adapt our strategy to mitigate any downside impact and to ensure that we are well placed to take advantage of opportunities that might arise. Kennedy Wilson Europe Real Estate Plc / Annual Report and Accounts 201536 Managing risk continued
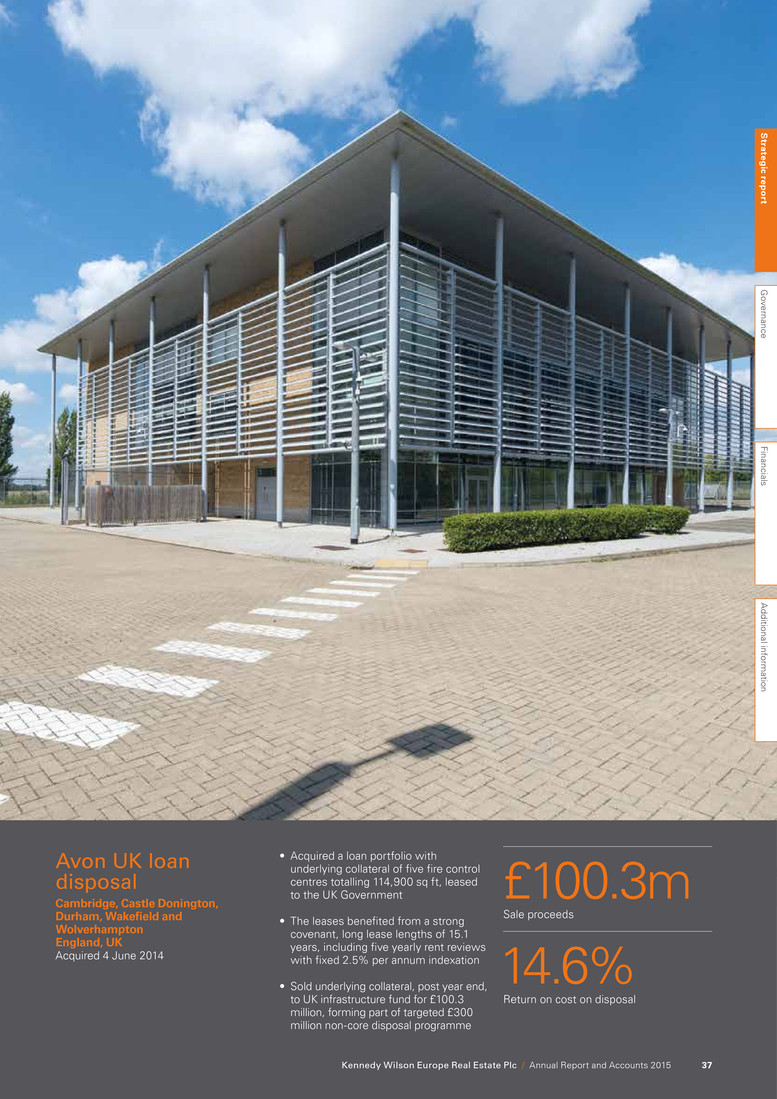
Avon UK loan disposal Cambridge, Castle Donington, Durham, Wakefield and Wolverhampton England, UK Acquired 4 June 2014 £100.3m Sale proceeds 14.6% Return on cost on disposal • Acquired a loan portfolio with underlying collateral of five fire control centres totalling 114,900 sq ft, leased to the UK Government • The leases benefited from a strong covenant, long lease lengths of 15.1 years, including five yearly rent reviews with fixed 2.5% per annum indexation • Sold underlying collateral, post year end, to UK infrastructure fund for £100.3 million, forming part of targeted £300 million non-core disposal programme S trateg ic rep o rt G overnance Financials A dditional inform ation Kennedy Wilson Europe Real Estate Plc / Annual Report and Accounts 2015 37
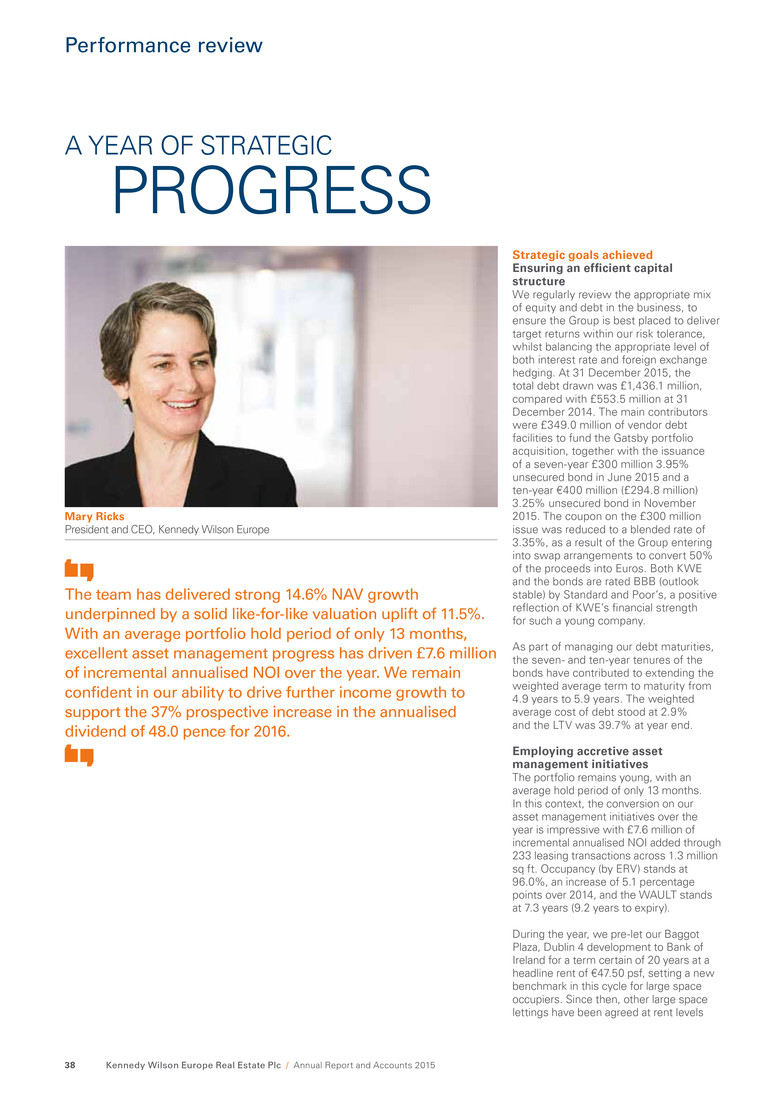
Mary Ricks President and CEO, Kennedy Wilson Europe Strategic goals achieved Ensuring an efficient capital structure We regularly review the appropriate mix of equity and debt in the business, to ensure the Group is best placed to deliver target returns within our risk tolerance, whilst balancing the appropriate level of both interest rate and foreign exchange hedging. At 31 December 2015, the total debt drawn was £1,436.1 million, compared with £553.5 million at 31 December 2014. The main contributors were £349.0 million of vendor debt facilities to fund the Gatsby portfolio acquisition, together with the issuance of a seven-year £300 million 3.95% unsecured bond in June 2015 and a ten-year €400 million (£294.8 million) 3.25% unsecured bond in November 2015. The coupon on the £300 million issue was reduced to a blended rate of 3.35%, as a result of the Group entering into swap arrangements to convert 50% of the proceeds into Euros. Both KWE and the bonds are rated BBB (outlook stable) by Standard and Poor’s, a positive reflection of KWE’s financial strength for such a young company. As part of managing our debt maturities, the seven- and ten-year tenures of the bonds have contributed to extending the weighted average term to maturity from 4.9 years to 5.9 years. The weighted average cost of debt stood at 2.9% and the LTV was 39.7% at year end. Employing accretive asset management initiatives The portfolio remains young, with an average hold period of only 13 months. In this context, the conversion on our asset management initiatives over the year is impressive with £7.6 million of incremental annualised NOI added through 233 leasing transactions across 1.3 million sq ft. Occupancy (by ERV) stands at 96.0%, an increase of 5.1 percentage points over 2014, and the WAULT stands at 7.3 years (9.2 years to expiry). During the year, we pre-let our Baggot Plaza, Dublin 4 development to Bank of Ireland for a term certain of 20 years at a headline rent of €47.50 psf, setting a new benchmark in this cycle for large space occupiers. Since then, other large space lettings have been agreed at rent levels A YEAR OF STRATEGIC PROGRESS The team has delivered strong 14.6% NAV growth underpinned by a solid like-for-like valuation uplift of 11.5%. With an average portfolio hold period of only 13 months, excellent asset management progress has driven £7.6 million of incremental annualised NOI over the year. We remain confident in our ability to drive further income growth to support the 37% prospective increase in the annualised dividend of 48.0 pence for 2016. Kennedy Wilson Europe Real Estate Plc / Annual Report and Accounts 201538 Performance review
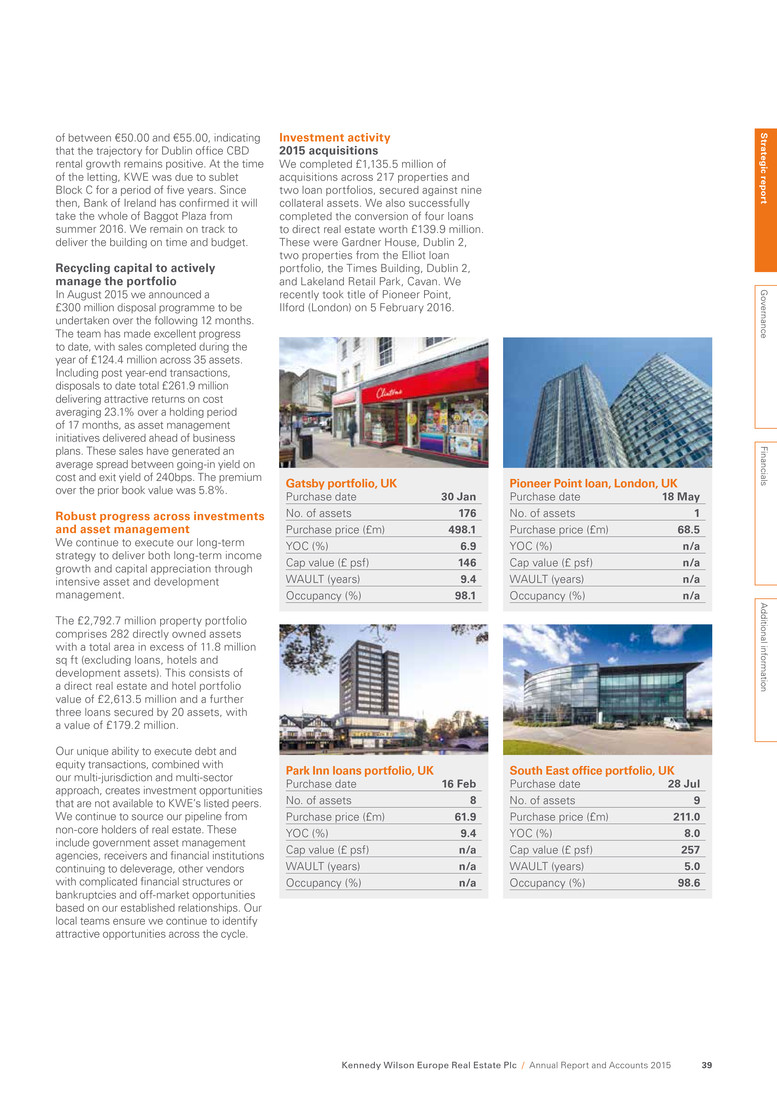
Gatsby portfolio, UK Purchase date 30 Jan No. of assets 176 Purchase price (£m) 498.1 YOC (%) 6.9 Cap value (£ psf) 146 WAULT (years) 9.4 Occupancy (%) 98.1 Park Inn loans portfolio, UK Purchase date 16 Feb No. of assets 8 Purchase price (£m) 61.9 YOC (%) 9.4 Cap value (£ psf) n/a WAULT (years) n/a Occupancy (%) n/a Pioneer Point loan, London, UK Purchase date 18 May No. of assets 1 Purchase price (£m) 68.5 YOC (%) n/a Cap value (£ psf) n/a WAULT (years) n/a Occupancy (%) n/a South East office portfolio, UK Purchase date 28 Jul No. of assets 9 Purchase price (£m) 211.0 YOC (%) 8.0 Cap value (£ psf) 257 WAULT (years) 5.0 Occupancy (%) 98.6 Investment activity 2015 acquisitions We completed £1,135.5 million of acquisitions across 217 properties and two loan portfolios, secured against nine collateral assets. We also successfully completed the conversion of four loans to direct real estate worth £139.9 million. These were Gardner House, Dublin 2, two properties from the Elliot loan portfolio, the Times Building, Dublin 2, and Lakeland Retail Park, Cavan. We recently took title of Pioneer Point, Ilford (London) on 5 February 2016. of between €50.00 and €55.00, indicating that the trajectory for Dublin office CBD rental growth remains positive. At the time of the letting, KWE was due to sublet Block C for a period of five years. Since then, Bank of Ireland has confirmed it will take the whole of Baggot Plaza from summer 2016. We remain on track to deliver the building on time and budget. Recycling capital to actively manage the portfolio In August 2015 we announced a £300 million disposal programme to be undertaken over the following 12 months. The team has made excellent progress to date, with sales completed during the year of £124.4 million across 35 assets. Including post year-end transactions, disposals to date total £261.9 million delivering attractive returns on cost averaging 23.1% over a holding period of 17 months, as asset management initiatives delivered ahead of business plans. These sales have generated an average spread between going-in yield on cost and exit yield of 240bps. The premium over the prior book value was 5.8%. Robust progress across investments and asset management We continue to execute our long-term strategy to deliver both long-term income growth and capital appreciation through intensive asset and development management. The £2,792.7 million property portfolio comprises 282 directly owned assets with a total area in excess of 11.8 million sq ft (excluding loans, hotels and development assets). This consists of a direct real estate and hotel portfolio value of £2,613.5 million and a further three loans secured by 20 assets, with a value of £179.2 million. Our unique ability to execute debt and equity transactions, combined with our multi-jurisdiction and multi-sector approach, creates investment opportunities that are not available to KWE’s listed peers. We continue to source our pipeline from non-core holders of real estate. These include government asset management agencies, receivers and financial institutions continuing to deleverage, other vendors with complicated financial structures or bankruptcies and off-market opportunities based on our established relationships. Our local teams ensure we continue to identify attractive opportunities across the cycle. S trateg ic rep o rt G overnance Financials A dditional inform ation Kennedy Wilson Europe Real Estate Plc / Annual Report and Accounts 2015 39
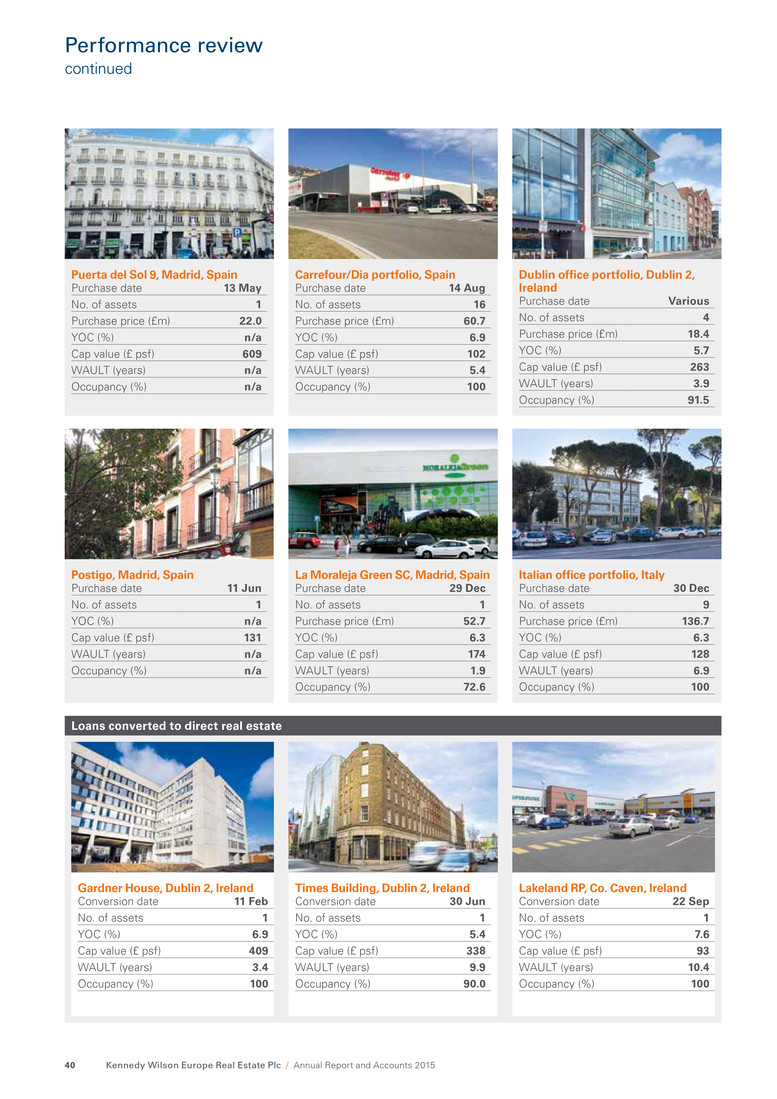
Carrefour/Dia portfolio, Spain Purchase date 14 Aug No. of assets 16 Purchase price (£m) 60.7 YOC (%) 6.9 Cap value (£ psf) 102 WAULT (years) 5.4 Occupancy (%) 100 Italian office portfolio, Italy Purchase date 30 Dec No. of assets 9 Purchase price (£m) 136.7 YOC (%) 6.3 Cap value (£ psf) 128 WAULT (years) 6.9 Occupancy (%) 100 Dublin office portfolio, Dublin 2, Ireland Purchase date Various No. of assets 4 Purchase price (£m) 18.4 YOC (%) 5.7 Cap value (£ psf) 263 WAULT (years) 3.9 Occupancy (%) 91.5 La Moraleja Green SC, Madrid, Spain Purchase date 29 Dec No. of assets 1 Purchase price (£m) 52.7 YOC (%) 6.3 Cap value (£ psf) 174 WAULT (years) 1.9 Occupancy (%) 72.6 Gardner House, Dublin 2, Ireland Conversion date 11 Feb No. of assets 1 YOC (%) 6.9 Cap value (£ psf) 409 WAULT (years) 3.4 Occupancy (%) 100 Lakeland RP, Co. Caven, Ireland Conversion date 22 Sep No. of assets 1 YOC (%) 7.6 Cap value (£ psf) 93 WAULT (years) 10.4 Occupancy (%) 100 Times Building, Dublin 2, Ireland Conversion date 30 Jun No. of assets 1 YOC (%) 5.4 Cap value (£ psf) 338 WAULT (years) 9.9 Occupancy (%) 90.0 Puerta del Sol 9, Madrid, Spain Purchase date 13 May No. of assets 1 Purchase price (£m) 22.0 YOC (%) n/a Cap value (£ psf) 609 WAULT (years) n/a Occupancy (%) n/a Postigo, Madrid, Spain Purchase date 11 Jun No. of assets 1 YOC (%) n/a Cap value (£ psf) 131 WAULT (years) n/a Occupancy (%) n/a Kennedy Wilson Europe Real Estate Plc / Annual Report and Accounts 201540 Performance review continued Loans converted to direct real estate
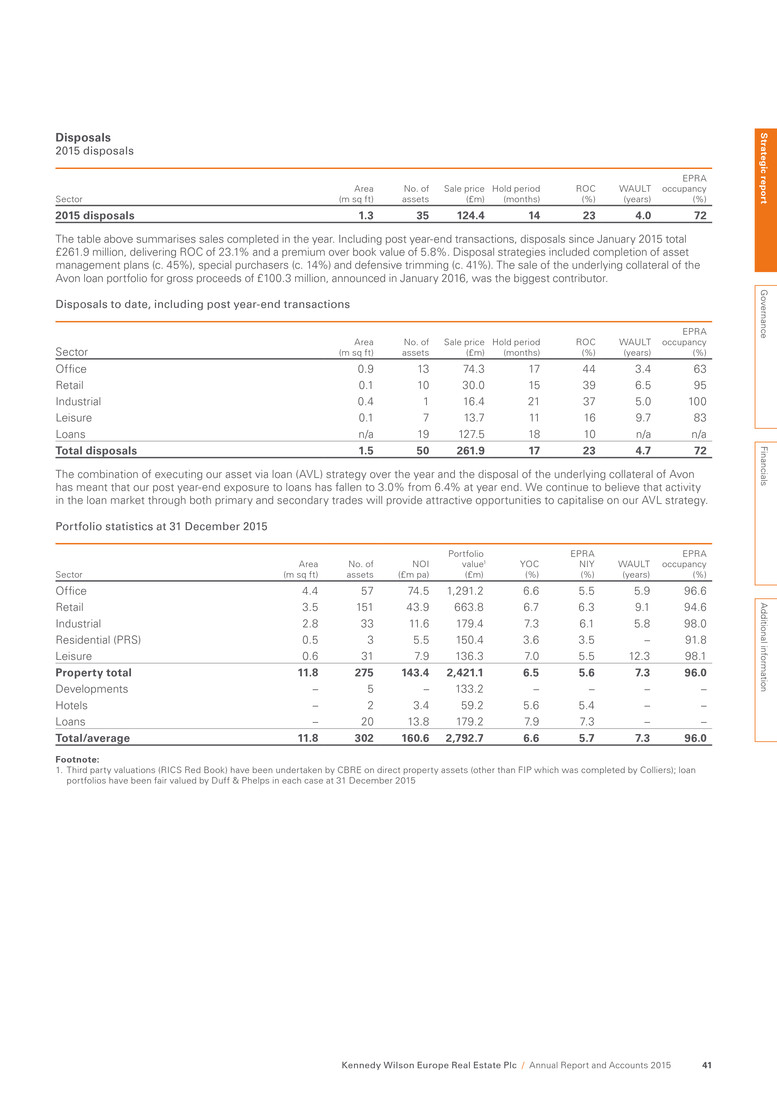
Disposals 2015 disposals Sector Area (m sq ft) No. of assets Sale price (£m) Hold period (months) ROC (%) WAULT (years) EPRA occupancy (%) 2015 disposals 1.3 35 124.4 14 23 4.0 72 The table above summarises sales completed in the year. Including post year-end transactions, disposals since January 2015 total £261.9 million, delivering ROC of 23.1% and a premium over book value of 5.8%. Disposal strategies included completion of asset management plans (c. 45%), special purchasers (c. 14%) and defensive trimming (c. 41%). The sale of the underlying collateral of the Avon loan portfolio for gross proceeds of £100.3 million, announced in January 2016, was the biggest contributor. Disposals to date, including post year-end transactions Sector Area (m sq ft) No. of assets Sale price (£m) Hold period (months) ROC (%) WAULT (years) EPRA occupancy (%) Office 0.9 13 74.3 17 44 3.4 63 Retail 0.1 10 30.0 15 39 6.5 95 Industrial 0.4 1 16.4 21 37 5.0 100 Leisure 0.1 7 13.7 11 16 9.7 83 Loans n/a 19 127.5 18 10 n/a n/a Total disposals 1.5 50 261.9 17 23 4.7 72 The combination of executing our asset via loan (AVL) strategy over the year and the disposal of the underlying collateral of Avon has meant that our post year-end exposure to loans has fallen to 3.0% from 6.4% at year end. We continue to believe that activity in the loan market through both primary and secondary trades will provide attractive opportunities to capitalise on our AVL strategy. Portfolio statistics at 31 December 2015 Sector Area (m sq ft) No. of assets NOI (£m pa) Portfolio value1 (£m) YOC (%) EPRA NIY (%) WAULT (years) EPRA occupancy (%) Office 4.4 57 74.5 1,291.2 6.6 5.5 5.9 96.6 Retail 3.5 151 43.9 663.8 6.7 6.3 9.1 94.6 Industrial 2.8 33 11.6 179.4 7.3 6.1 5.8 98.0 Residential (PRS) 0.5 3 5.5 150.4 3.6 3.5 – 91.8 Leisure 0.6 31 7.9 136.3 7.0 5.5 12.3 98.1 Property total 11.8 275 143.4 2,421.1 6.5 5.6 7.3 96.0 Developments – 5 – 133.2 – – – – Hotels – 2 3.4 59.2 5.6 5.4 – – Loans – 20 13.8 179.2 7.9 7.3 – – Total/average 11.8 302 160.6 2,792.7 6.6 5.7 7.3 96.0 Footnote: 1. Third party valuations (RICS Red Book) have been undertaken by CBRE on direct property assets (other than FIP which was completed by Colliers); loan portfolios have been fair valued by Duff & Phelps in each case at 31 December 2015 S trateg ic rep o rt G overnance Financials A dditional inform ation Kennedy Wilson Europe Real Estate Plc / Annual Report and Accounts 2015 41
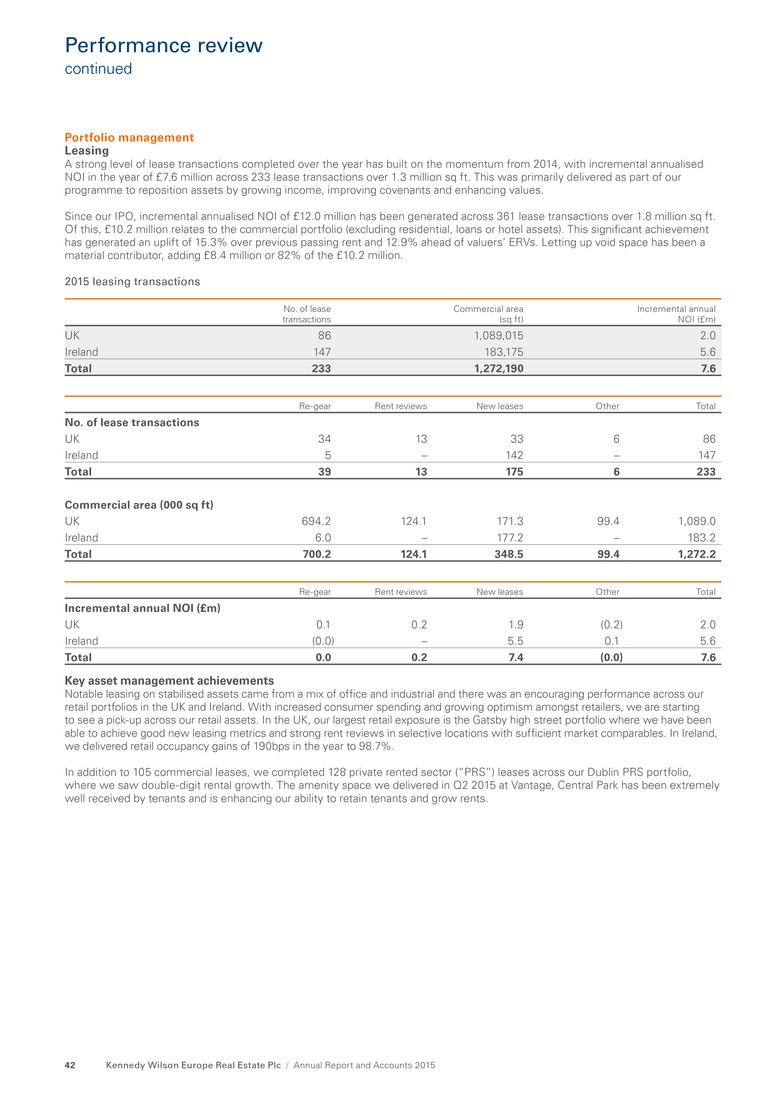
Portfolio management Leasing A strong level of lease transactions completed over the year has built on the momentum from 2014, with incremental annualised NOI in the year of £7.6 million across 233 lease transactions over 1.3 million sq ft. This was primarily delivered as part of our programme to reposition assets by growing income, improving covenants and enhancing values. Since our IPO, incremental annualised NOI of £12.0 million has been generated across 361 lease transactions over 1.8 million sq ft. Of this, £10.2 million relates to the commercial portfolio (excluding residential, loans or hotel assets). This significant achievement has generated an uplift of 15.3% over previous passing rent and 12.9% ahead of valuers’ ERVs. Letting up void space has been a material contributor, adding £8.4 million or 82% of the £10.2 million. 2015 leasing transactions No. of lease transactions Commercial area (sq ft) Incremental annual NOI (£m) UK 86 1,089,015 2.0 Ireland 147 183,175 5.6 Total 233 1,272,190 7.6 Re-gear Rent reviews New leases Other Total No. of lease transactions UK 34 13 33 6 86 Ireland 5 – 142 – 147 Total 39 13 175 6 233 Commercial area (000 sq ft) UK 694.2 124.1 171.3 99.4 1,089.0 Ireland 6.0 – 177.2 – 183.2 Total 700.2 124.1 348.5 99.4 1,272.2 Re-gear Rent reviews New leases Other Total Incremental annual NOI (£m) UK 0.1 0.2 1.9 (0.2) 2.0 Ireland (0.0) – 5.5 0.1 5.6 Total 0.0 0.2 7.4 (0.0) 7.6 Key asset management achievements Notable leasing on stabilised assets came from a mix of office and industrial and there was an encouraging performance across our retail portfolios in the UK and Ireland. With increased consumer spending and growing optimism amongst retailers, we are starting to see a pick-up across our retail assets. In the UK, our largest retail exposure is the Gatsby high street portfolio where we have been able to achieve good new leasing metrics and strong rent reviews in selective locations with sufficient market comparables. In Ireland, we delivered retail occupancy gains of 190bps in the year to 98.7%. In addition to 105 commercial leases, we completed 128 private rented sector (“PRS”) leases across our Dublin PRS portfolio, where we saw double-digit rental growth. The amenity space we delivered in Q2 2015 at Vantage, Central Park has been extremely well received by tenants and is enhancing our ability to retain tenants and grow rents. Kennedy Wilson Europe Real Estate Plc / Annual Report and Accounts 201542 Performance review continued
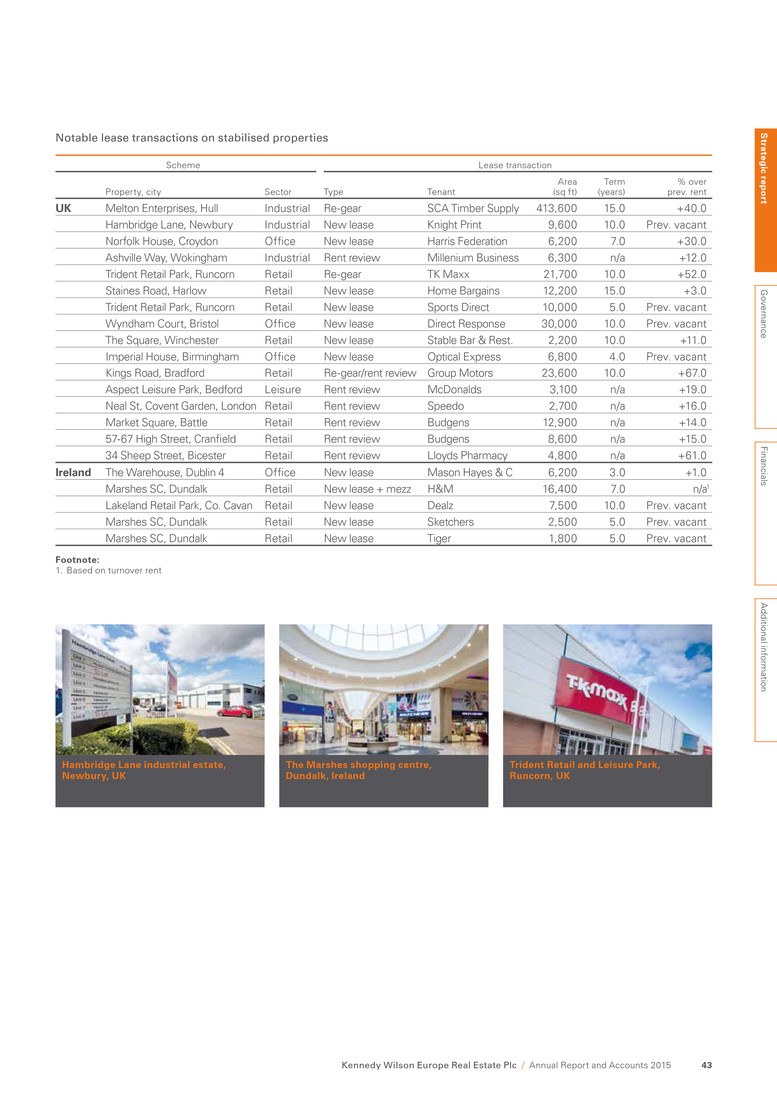
Notable lease transactions on stabilised properties Scheme Lease transaction Property, city Sector Type Tenant Area (sq ft) Term (years) % over prev. rent UK Melton Enterprises, Hull Industrial Re-gear SCA Timber Supply 413,600 15.0 +40.0 Hambridge Lane, Newbury Industrial New lease Knight Print 9,600 10.0 Prev. vacant Norfolk House, Croydon Office New lease Harris Federation 6,200 7.0 +30.0 Ashville Way, Wokingham Industrial Rent review Millenium Business 6,300 n/a +12.0 Trident Retail Park, Runcorn Retail Re-gear TK Maxx 21,700 10.0 +52.0 Staines Road, Harlow Retail New lease Home Bargains 12,200 15.0 +3.0 Trident Retail Park, Runcorn Retail New lease Sports Direct 10,000 5.0 Prev. vacant Wyndham Court, Bristol Office New lease Direct Response 30,000 10.0 Prev. vacant The Square, Winchester Retail New lease Stable Bar & Rest. 2,200 10.0 +11.0 Imperial House, Birmingham Office New lease Optical Express 6,800 4.0 Prev. vacant Kings Road, Bradford Retail Re-gear/rent review Group Motors 23,600 10.0 +67.0 Aspect Leisure Park, Bedford Leisure Rent review McDonalds 3,100 n/a +19.0 Neal St, Covent Garden, London Retail Rent review Speedo 2,700 n/a +16.0 Market Square, Battle Retail Rent review Budgens 12,900 n/a +14.0 57-67 High Street, Cranfield Retail Rent review Budgens 8,600 n/a +15.0 34 Sheep Street, Bicester Retail Rent review Lloyds Pharmacy 4,800 n/a +61.0 Ireland The Warehouse, Dublin 4 Office New lease Mason Hayes & C 6,200 3.0 +1.0 Marshes SC, Dundalk Retail New lease + mezz H&M 16,400 7.0 n/a1 Lakeland Retail Park, Co. Cavan Retail New lease Dealz 7,500 10.0 Prev. vacant Marshes SC, Dundalk Retail New lease Sketchers 2,500 5.0 Prev. vacant Marshes SC, Dundalk Retail New lease Tiger 1,800 5.0 Prev. vacant Footnote: 1. Based on turnover rent Hambridge Lane industrial estate, Newbury, UK The Marshes shopping centre, Dundalk, Ireland Trident Retail and Leisure Park, Runcorn, UK S trateg ic rep o rt G overnance Financials A dditional inform ation Kennedy Wilson Europe Real Estate Plc / Annual Report and Accounts 2015 43
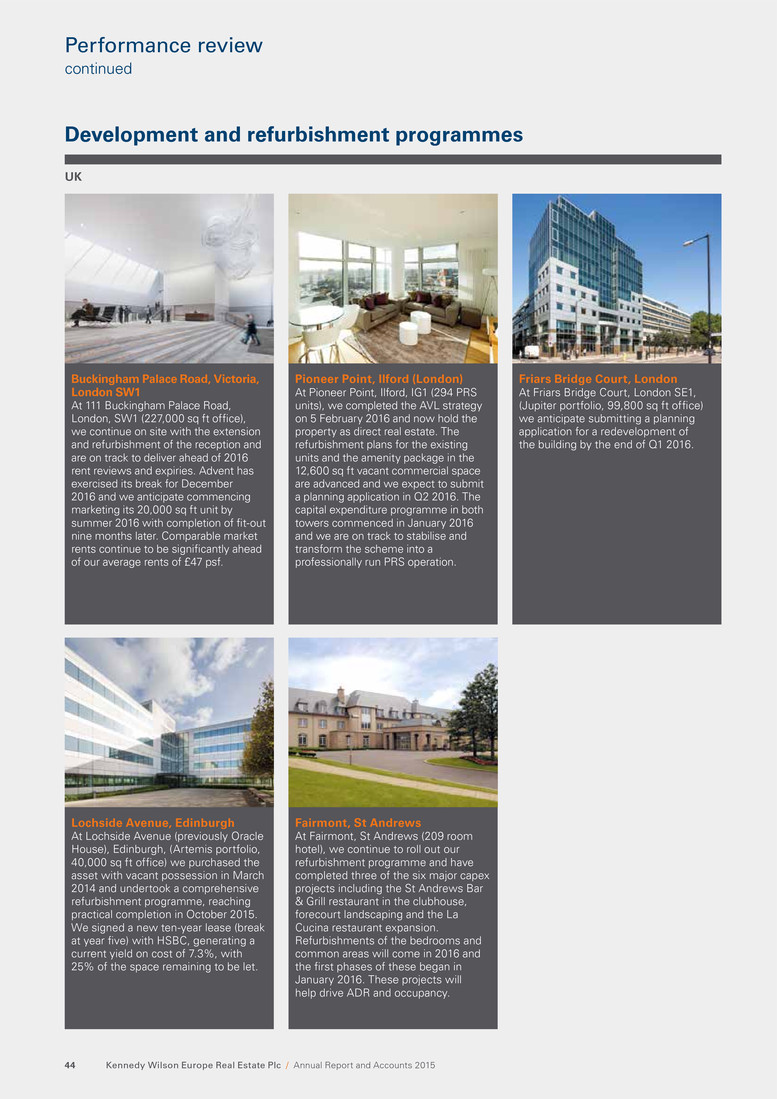
UK Lochside Avenue, Edinburgh At Lochside Avenue (previously Oracle House), Edinburgh, (Artemis portfolio, 40,000 sq ft office) we purchased the asset with vacant possession in March 2014 and undertook a comprehensive refurbishment programme, reaching practical completion in October 2015. We signed a new ten-year lease (break at year five) with HSBC, generating a current yield on cost of 7.3%, with 25% of the space remaining to be let. Buckingham Palace Road, Victoria, London SW1 At 111 Buckingham Palace Road, London, SW1 (227,000 sq ft office), we continue on site with the extension and refurbishment of the reception and are on track to deliver ahead of 2016 rent reviews and expiries. Advent has exercised its break for December 2016 and we anticipate commencing marketing its 20,000 sq ft unit by summer 2016 with completion of fit-out nine months later. Comparable market rents continue to be significantly ahead of our average rents of £47 psf. Pioneer Point, Ilford (London) At Pioneer Point, Ilford, IG1 (294 PRS units), we completed the AVL strategy on 5 February 2016 and now hold the property as direct real estate. The refurbishment plans for the existing units and the amenity package in the 12,600 sq ft vacant commercial space are advanced and we expect to submit a planning application in Q2 2016. The capital expenditure programme in both towers commenced in January 2016 and we are on track to stabilise and transform the scheme into a professionally run PRS operation. Friars Bridge Court, London At Friars Bridge Court, London SE1, (Jupiter portfolio, 99,800 sq ft office) we anticipate submitting a planning application for a redevelopment of the building by the end of Q1 2016. Fairmont, St Andrews At Fairmont, St Andrews (209 room hotel), we continue to roll out our refurbishment programme and have completed three of the six major capex projects including the St Andrews Bar & Grill restaurant in the clubhouse, forecourt landscaping and the La Cucina restaurant expansion. Refurbishments of the bedrooms and common areas will come in 2016 and the first phases of these began in January 2016. These projects will help drive ADR and occupancy. Development and refurbishment programmes Kennedy Wilson Europe Real Estate Plc / Annual Report and Accounts 201544 Performance review continued
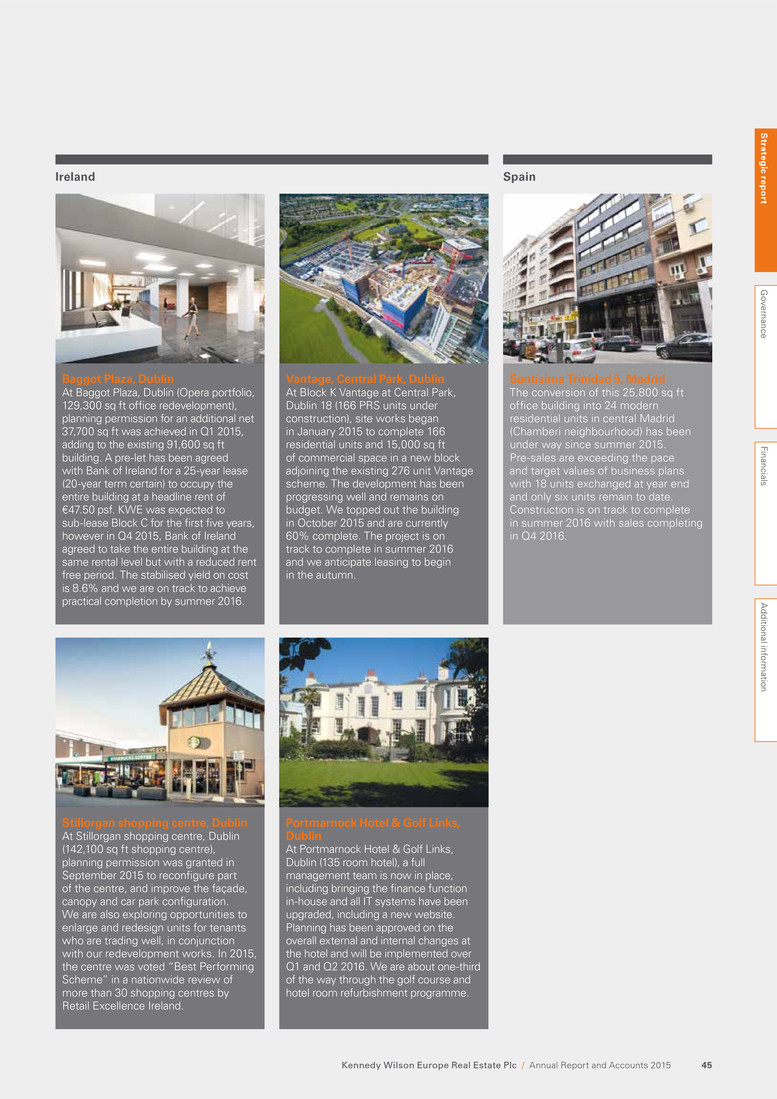
Baggot Plaza, Dublin At Baggot Plaza, Dublin (Opera portfolio, 129,300 sq ft office redevelopment), planning permission for an additional net 37,700 sq ft was achieved in Q1 2015, adding to the existing 91,600 sq ft building. A pre-let has been agreed with Bank of Ireland for a 25-year lease (20-year term certain) to occupy the entire building at a headline rent of €47.50 psf. KWE was expected to sub-lease Block C for the first five years, however in Q4 2015, Bank of Ireland agreed to take the entire building at the same rental level but with a reduced rent free period. The stabilised yield on cost is 8.6% and we are on track to achieve practical completion by summer 2016. Stillorgan shopping centre, Dublin At Stillorgan shopping centre, Dublin (142,100 sq ft shopping centre), planning permission was granted in September 2015 to reconfigure part of the centre, and improve the façade, canopy and car park configuration. We are also exploring opportunities to enlarge and redesign units for tenants who are trading well, in conjunction with our redevelopment works. In 2015, the centre was voted “Best Performing Scheme” in a nationwide review of more than 30 shopping centres by Retail Excellence Ireland. Vantage, Central Park, Dublin At Block K Vantage at Central Park, Dublin 18 (166 PRS units under construction), site works began in January 2015 to complete 166 residential units and 15,000 sq ft of commercial space in a new block adjoining the existing 276 unit Vantage scheme. The development has been progressing well and remains on budget. We topped out the building in October 2015 and are currently 60% complete. The project is on track to complete in summer 2016 and we anticipate leasing to begin in the autumn. Santísima Trinidad 5, Madrid The conversion of this 25,800 sq ft office building into 24 modern residential units in central Madrid (Chamberi neighbourhood) has been under way since summer 2015. Pre-sales are exceeding the pace and target values of business plans with 18 units exchanged at year end and only six units remain to date. Construction is on track to complete in summer 2016 with sales completing in Q4 2016. Portmarnock Hotel & Golf Links, Dublin At Portmarnock Hotel & Golf Links, Dublin (135 room hotel), a full management team is now in place, including bringing the finance function in-house and all IT systems have been upgraded, including a new website. Planning has been approved on the overall external and internal changes at the hotel and will be implemented over Q1 and Q2 2016. We are about one-third of the way through the golf course and hotel room refurbishment programme. Ireland Spain S trateg ic rep o rt G overnance Financials A dditional inform ation Kennedy Wilson Europe Real Estate Plc / Annual Report and Accounts 2015 45

Baggot Plaza Dublin 4, Ireland Acquired 24 June 2014 part of Opera portfolio 8.6% Stabilised yield on cost €47.50 psf Contracted rent to Bank of Ireland • Achieved planning permission for additional net 37,700 sq ft to existing 91,600 sq ft office building, bringing the total redeveloped area to 129,300 sq ft • Agreed pre-let with Bank of Ireland for a 25-year lease (20-year term certain) to occupy the entire building at a headline rent of €47.50 psf • On budget and on track to achieve practical completion by summer 2016 Kennedy Wilson Europe Real Estate Plc / Annual Report and Accounts 201546

20 years Term certain 67% Profit on cost on redevelopment S trateg ic rep o rt G overnance Financials A dditional inform ation Kennedy Wilson Europe Real Estate Plc / Annual Report and Accounts 2015 47
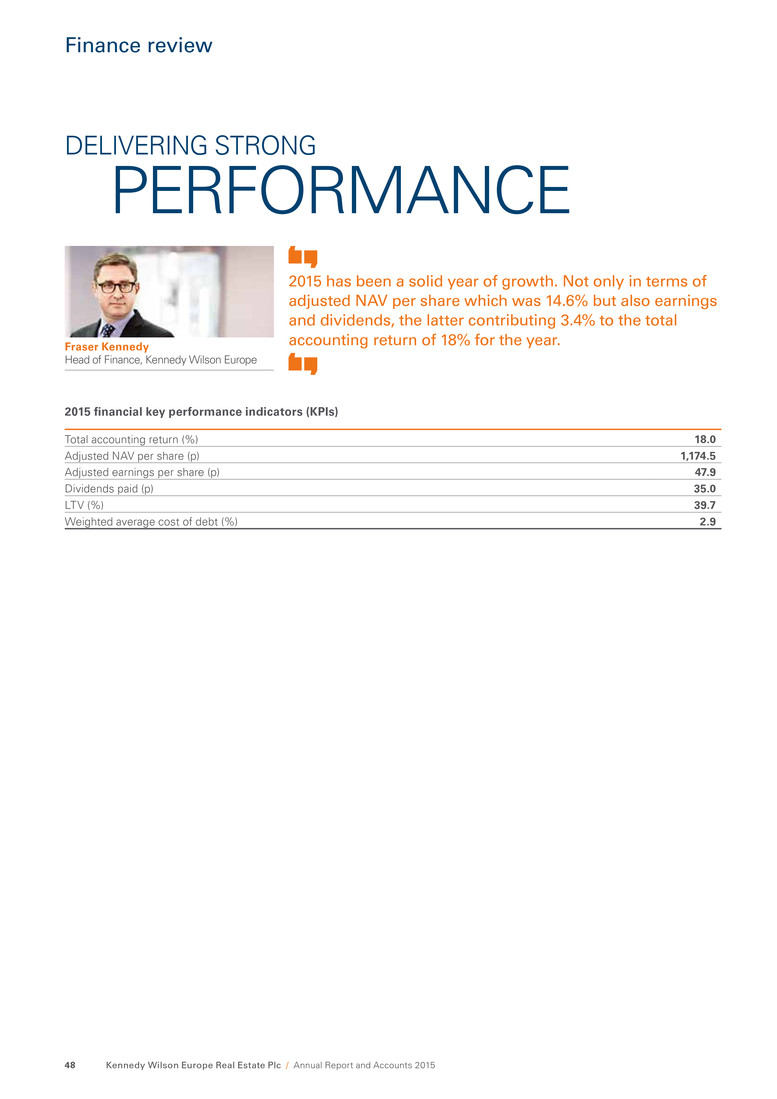
DELIVERING STRONG PERFORMANCE 2015 has been a solid year of growth. Not only in terms of adjusted NAV per share which was 14.6% but also earnings and dividends, the latter contributing 3.4% to the total accounting return of 18% for the year. 2015 financial key performance indicators (KPIs) Total accounting return (%) 18.0 Adjusted NAV per share (p) 1,174.5 Adjusted earnings per share (p) 47.9 Dividends paid (p) 35.0 LTV (%) 39.7 Weighted average cost of debt (%) 2.9 Fraser Kennedy Head of Finance, Kennedy Wilson Europe Kennedy Wilson Europe Real Estate Plc / Annual Report and Accounts 201548 Finance review

Overview KWE had a successful year having built on its debut in 2014. Many areas of the financial results reflect the strong acquisition-led growth that continued to be a feature of our operations in 2015. Transaction levels were high during the year consisting of £1,180.2 million of investments in direct real estate and loans (including associated purchaser’s costs), as well as £124.4 million in cash generated from disposals. The total accounting return for the year was 18.0% which was the combination of significant NAV growth, chiefly driven by portfolio valuation increases, plus dividends paid which contributed 3.4% to the total return. Adjusted earnings of 47.9 pence per share grew by 85% on the prior year, primarily owing to a full year of 2014 operating income supplemented by 2015 acquisition activity. Increased earnings and cash generated from operations drove the quarterly dividend from 7.0 pence to 10.0 pence per share during the year. The total dividend paid of 35.0 pence per share represented a 1.4 coverage ratio to adjusted earnings. The first dividend of 2016 declared by the Board of 12.0 pence per share is a 20% quarter-on-quarter increase and indicative of the portfolio’s strong cash generation and the Board’s commitment to delivering a significant income component within total return. Moreover, on an annualised basis, the prospective dividend of 48 pence per share for 2016 represents a significant 37% increase over 2015’s 35 pence per share. We achieved a significant milestone in June, with the successful issue of our debut £300 million seven-year senior unsecured bond, with simultaneous rating by Standard and Poor’s of BBB (stable) for both the KWE and the bond. This was followed by the establishment of a £2,000 million EMTN programme and a subsequent €400 million ten-year unsecured bond issue in November. During the year we have been actively managing our debt profile, to extend the term to maturity, which we have moved out by a full year to 5.9 years and fixing our rates – either through fixed rate debt or hedging, which now stands at 85% of total debt. Our average cost of debt now stands at a very competitive 2.9%. The LTV is 39.7%, providing us with further financing capacity, and our fixed charge coverage for 2015 was a comfortable 2.9 times. The financing mix has now matured to complement the expanded and diversified real estate portfolio and reflects our goals of achieving the appropriate combination of tenor, cost and leverage. Net operating income Net operating income consists of net rental income, the hotel earnings and loan portfolio interest income. The chief drivers of the substantial net operating income growth in the year are the full period impact of acquisitions completed in 2014 and the ongoing deployment of capital into real estate acquisitions during 2015. Movements in income statement net operating income (£m) 2014 income statement NOI 50.7 Part period NOI from 2014 acquisitions 39.1 Part period NOI from 2015 acquisitions 45.0 Part period NOI from 2015 disposals (4.7) 2015 income statement NOI 130.1 Administrative expenses Total administrative expenses (excluding hotel operations which are included in NOI) have fallen in 2015 to £10.9 million (2014: £11.5 million). A significant proportion of the administrative expenses are fixed in nature or are non-recurring relating to set-up and acquisition activity. £1.2 million of the costs incurred in 2015 related to real estate loan acquisition costs which, unlike direct real estate deal costs, are not capitalised in accordance with our accounting policies and IAS39. As KWE grows and invests capital, we see the benefit of scale – meaning that the administrative cost ratio to portfolio value is 39bps this year compared to 76bps in 2014. S trateg ic rep o rt G overnance Financials A dditional inform ation Kennedy Wilson Europe Real Estate Plc / Annual Report and Accounts 2015 49
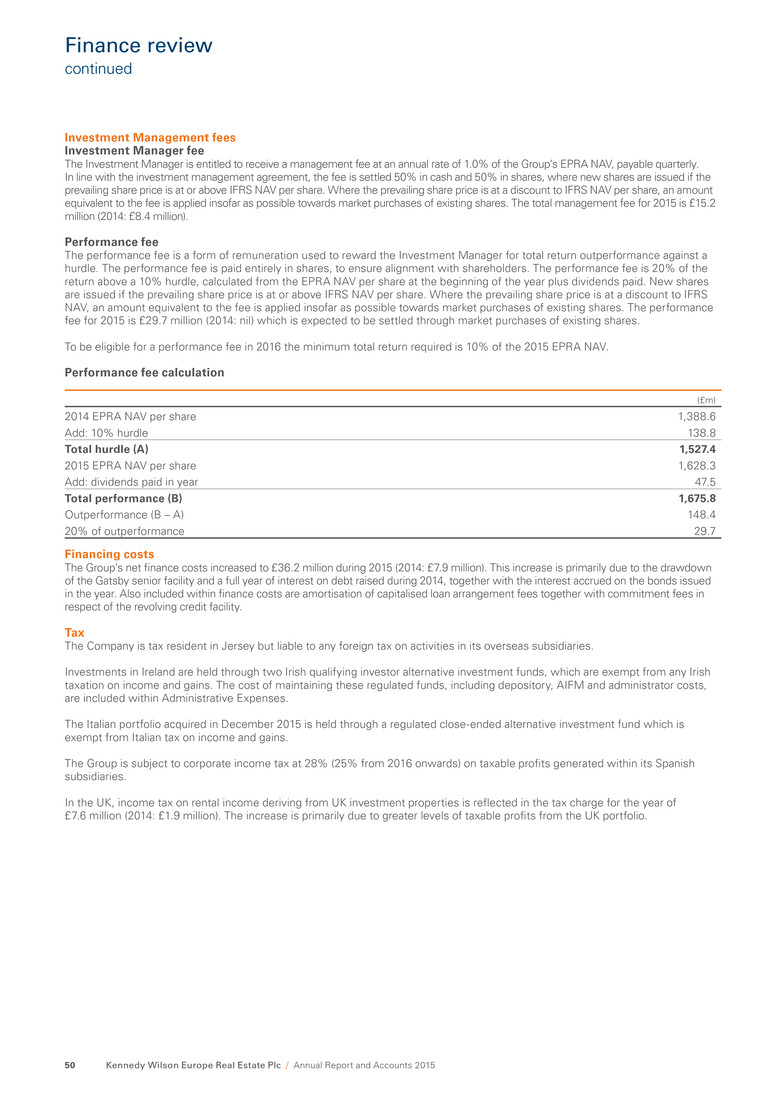
Investment Management fees Investment Manager fee The Investment Manager is entitled to receive a management fee at an annual rate of 1.0% of the Group’s EPRA NAV, payable quarterly. In line with the investment management agreement, the fee is settled 50% in cash and 50% in shares, where new shares are issued if the prevailing share price is at or above IFRS NAV per share. Where the prevailing share price is at a discount to IFRS NAV per share, an amount equivalent to the fee is applied insofar as possible towards market purchases of existing shares. The total management fee for 2015 is £15.2 million (2014: £8.4 million). Performance fee The performance fee is a form of remuneration used to reward the Investment Manager for total return outperformance against a hurdle. The performance fee is paid entirely in shares, to ensure alignment with shareholders. The performance fee is 20% of the return above a 10% hurdle, calculated from the EPRA NAV per share at the beginning of the year plus dividends paid. New shares are issued if the prevailing share price is at or above IFRS NAV per share. Where the prevailing share price is at a discount to IFRS NAV, an amount equivalent to the fee is applied insofar as possible towards market purchases of existing shares. The performance fee for 2015 is £29.7 million (2014: nil) which is expected to be settled through market purchases of existing shares. To be eligible for a performance fee in 2016 the minimum total return required is 10% of the 2015 EPRA NAV. Performance fee calculation (£m) 2014 EPRA NAV per share 1,388.6 Add: 10% hurdle 138.8 Total hurdle (A) 1,527.4 2015 EPRA NAV per share 1,628.3 Add: dividends paid in year 47.5 Total performance (B) 1,675.8 Outperformance (B – A) 148.4 20% of outperformance 29.7 Financing costs The Group’s net finance costs increased to £36.2 million during 2015 (2014: £7.9 million). This increase is primarily due to the drawdown of the Gatsby senior facility and a full year of interest on debt raised during 2014, together with the interest accrued on the bonds issued in the year. Also included within finance costs are amortisation of capitalised loan arrangement fees together with commitment fees in respect of the revolving credit facility. Tax The Company is tax resident in Jersey but liable to any foreign tax on activities in its overseas subsidiaries. Investments in Ireland are held through two Irish qualifying investor alternative investment funds, which are exempt from any Irish taxation on income and gains. The cost of maintaining these regulated funds, including depository, AIFM and administrator costs, are included within Administrative Expenses. The Italian portfolio acquired in December 2015 is held through a regulated close-ended alternative investment fund which is exempt from Italian tax on income and gains. The Group is subject to corporate income tax at 28% (25% from 2016 onwards) on taxable profits generated within its Spanish subsidiaries. In the UK, income tax on rental income deriving from UK investment properties is reflected in the tax charge for the year of £7.6 million (2014: £1.9 million). The increase is primarily due to greater levels of taxable profits from the UK portfolio. Kennedy Wilson Europe Real Estate Plc / Annual Report and Accounts 201550 Finance review continued

Adjusted earnings To indicate the extent to which the dividends paid to shareholders are underpinned by earnings, we report adjusted earnings. The only adjustment to the standard EPRA earnings definition is the addback of the performance fee expense, as this is considered capital in nature. Adjusted earnings per share were 47.9 pence in 2015 (2014: 25.9 pence per share). Adjusted earnings statement 31 December 2015 (£m) NOI 130.1 Investment manager fees (15.2) Administrative expenses (10.9) Net finance cost (36.2) Tax (7.6) EPRA adjustments 4.8 Adjusted earnings 65.0 Adjusted earnings per share (p) 47.9 Dividends Dividends paid during 2015 total £47.5 million, comprising: • the 7 pence per share interim dividend paid on 20 March 2015, in the amount of £9.5 million • the 8 pence per share interim dividend paid on 29 May 2015, in the amount of £10.8 million • the 10 pence per share interim dividend paid on 28 August 2015, in the amount of £13.6 million and • the 10 pence per share interim dividend paid on 27 November 2015, in the amount of £13.6 million. The Company will pay an interim dividend of 12.0 pence per share on 31 March 2016 (£16.3 million), to shareholders on the register at the close of business on 11 March 2016. Balance sheet 31 December 2015 (£m) 31 December 2014 (£m) Total portfolio 2,792.7 1,490.4 Cash 326.5 441.9 Gross debt (1,436.1) (553.5) Other assets and liabilities (53.9) 11.1 IFRS net assets 1,629.2 1,389.9 Adjusted for: Mark-to-market of derivative financial assets (0.9) (1.3) EPRA net assets 1,628.3 1,388.6 Adjust for share-based payments reserve: Performance fee (29.7) – Investment management fee (2.1) (1.7) Adjusted net assets 1,596.5 1,386.9 Adjusted NAV per share (p) 1,174.5 1,025.2 S trateg ic rep o rt G overnance Financials A dditional inform ation Kennedy Wilson Europe Real Estate Plc / Annual Report and Accounts 2015 51

Portfolio valuation As at 31 December 2015 the Group’s investment portfolio was valued at £2,792.7 million, reflecting significant acquisition activity in the year as well as the valuation surplus. Portfolio valuation movements (£m) 2014 portfolio valuation 1,490.4 Acquisitions 1,180.2 Disposals (114.7) Capital expenditure 54.2 Foreign exchange/other (29.2) Valuation surplus 211.8 2015 portfolio valuation 2,792.7 Adjusted NAV We report an Adjusted NAV to illustrate EPRA NAV after the impact of the fees recognised in the share-based payments reserve. The 14.6% Adjusted NAV growth reflects a strong valuation surplus of £211.8 million, primarily from assets held throughout 2014 and, importantly, also from acquisitions during the year, where we have more than made up the associated acquisition costs. Disposals in the year also contributed a total of £14.6 million to NAV, reflecting a 5.8% premium over the preceding valuation. Adjusted NAV movements (£m) (p per share) 2014 adjusted NAV 1,386.9 1,025.2 Valuation surplus 211.8 Gains on sale 14.6 Adjusted earnings 65.0 Dividends (47.5) Performance fee (29.7) Foreign exchange/other (4.6) 2015 adjusted NAV 1,596.5 1,174.5 Cash flow and treasury management Liquidity, comprising cash and undrawn facilities, totalled £551.5 million at 31 December 2015, compared with £666.9 million at 31 December 2014. The major sources of cash during the year were: • operating activities, which generated cash of £120.6 million • secured and unsecured financing activity of £925.7 million and • proceeds on disposal of assets, which generated cash of £124.4 million. KWE maintains a £225.0 million multi-currency revolving credit facility. At 31 December 2015, the full £225.0 million facility was available to be drawn. The Group’s interest rate hedging policy is to eliminate substantially the risk associated with interest rate volatility, through a combination of fixed rate borrowings and, in respect of floating rate debt, the use of interest rate caps. Kennedy Wilson Europe Real Estate Plc / Annual Report and Accounts 201552 Finance review continued
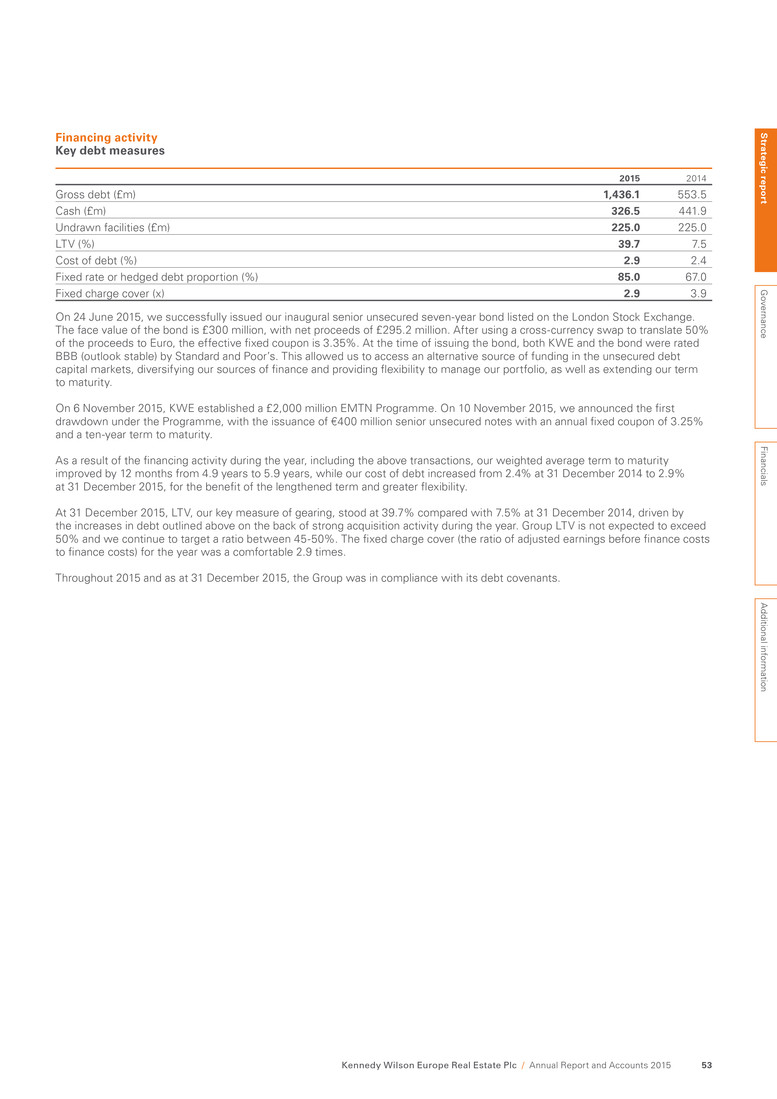
Financing activity Key debt measures 2015 2014 Gross debt (£m) 1,436.1 553.5 Cash (£m) 326.5 441.9 Undrawn facilities (£m) 225.0 225.0 LTV (%) 39.7 7.5 Cost of debt (%) 2.9 2.4 Fixed rate or hedged debt proportion (%) 85.0 67.0 Fixed charge cover (x) 2.9 3.9 On 24 June 2015, we successfully issued our inaugural senior unsecured seven-year bond listed on the London Stock Exchange. The face value of the bond is £300 million, with net proceeds of £295.2 million. After using a cross-currency swap to translate 50% of the proceeds to Euro, the effective fixed coupon is 3.35%. At the time of issuing the bond, both KWE and the bond were rated BBB (outlook stable) by Standard and Poor’s. This allowed us to access an alternative source of funding in the unsecured debt capital markets, diversifying our sources of finance and providing flexibility to manage our portfolio, as well as extending our term to maturity. On 6 November 2015, KWE established a £2,000 million EMTN Programme. On 10 November 2015, we announced the first drawdown under the Programme, with the issuance of €400 million senior unsecured notes with an annual fixed coupon of 3.25% and a ten-year term to maturity. As a result of the financing activity during the year, including the above transactions, our weighted average term to maturity improved by 12 months from 4.9 years to 5.9 years, while our cost of debt increased from 2.4% at 31 December 2014 to 2.9% at 31 December 2015, for the benefit of the lengthened term and greater flexibility. At 31 December 2015, LTV, our key measure of gearing, stood at 39.7% compared with 7.5% at 31 December 2014, driven by the increases in debt outlined above on the back of strong acquisition activity during the year. Group LTV is not expected to exceed 50% and we continue to target a ratio between 45-50%. The fixed charge cover (the ratio of adjusted earnings before finance costs to finance costs) for the year was a comfortable 2.9 times. Throughout 2015 and as at 31 December 2015, the Group was in compliance with its debt covenants. S trateg ic rep o rt G overnance Financials A dditional inform ation Kennedy Wilson Europe Real Estate Plc / Annual Report and Accounts 2015 53
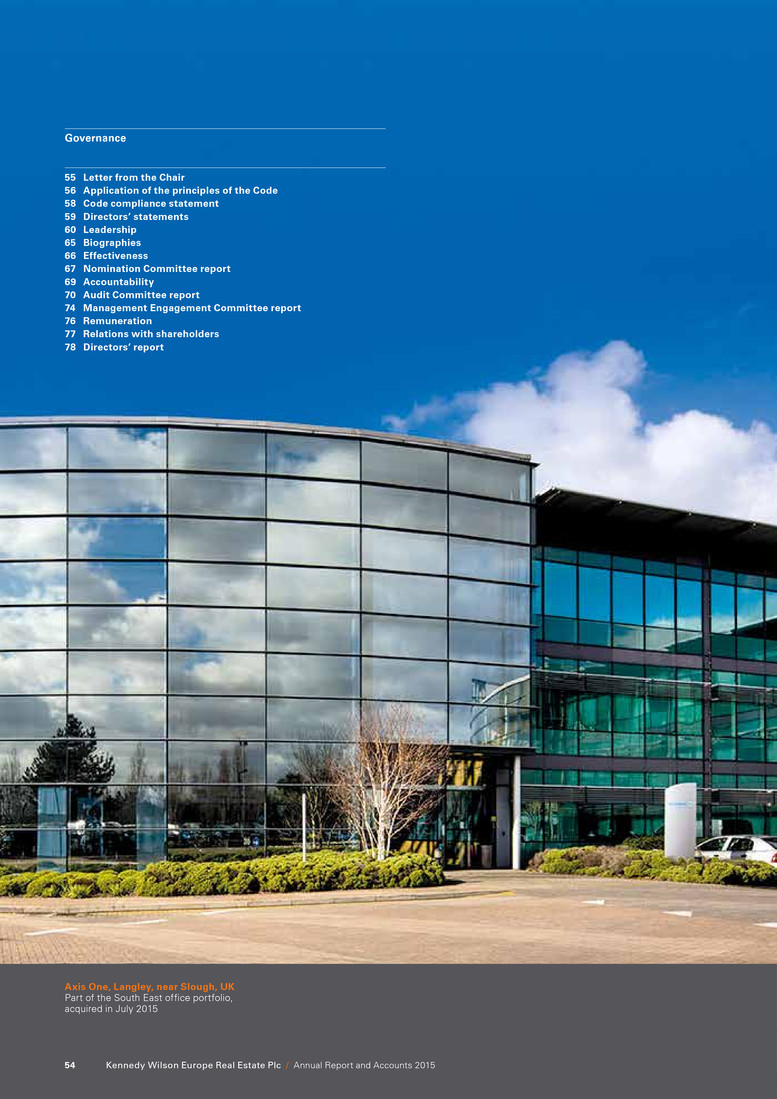
Axis One, Langley, near Slough, UK Part of the South East office portfolio, acquired in July 2015 Kennedy Wilson Europe Real Estate Plc / Annual Report and Accounts 201554 Governance 55 Letter from the Chair 56 Application of the principles of the Code 58 Code compliance statement 59 Directors’ statements 60 Leadership 65 Biographies 66 Effectiveness 67 Nomination Committee report 69 Accountability 70 Audit Committee report 74 Management Engagement Committee report 76 Remuneration 77 Relations with shareholders 78 Directors’ report
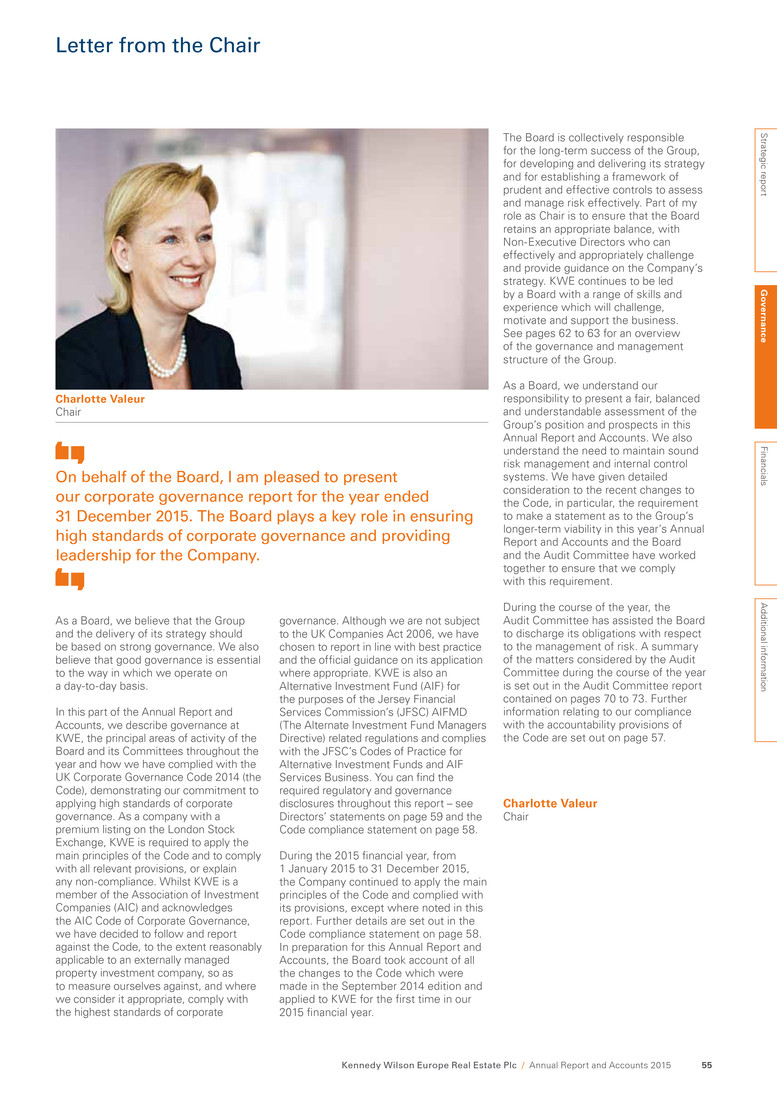
governance. Although we are not subject to the UK Companies Act 2006, we have chosen to report in line with best practice and the official guidance on its application where appropriate. KWE is also an Alternative Investment Fund (AIF) for the purposes of the Jersey Financial Services Commission’s (JFSC) AIFMD (The Alternate Investment Fund Managers Directive) related regulations and complies with the JFSC’s Codes of Practice for Alternative Investment Funds and AIF Services Business. You can find the required regulatory and governance disclosures throughout this report – see Directors’ statements on page 59 and the Code compliance statement on page 58. During the 2015 financial year, from 1 January 2015 to 31 December 2015, the Company continued to apply the main principles of the Code and complied with its provisions, except where noted in this report. Further details are set out in the Code compliance statement on page 58. In preparation for this Annual Report and Accounts, the Board took account of all the changes to the Code which were made in the September 2014 edition and applied to KWE for the first time in our 2015 financial year. As a Board, we believe that the Group and the delivery of its strategy should be based on strong governance. We also believe that good governance is essential to the way in which we operate on a day-to-day basis. In this part of the Annual Report and Accounts, we describe governance at KWE, the principal areas of activity of the Board and its Committees throughout the year and how we have complied with the UK Corporate Governance Code 2014 (the Code), demonstrating our commitment to applying high standards of corporate governance. As a company with a premium listing on the London Stock Exchange, KWE is required to apply the main principles of the Code and to comply with all relevant provisions, or explain any non-compliance. Whilst KWE is a member of the Association of Investment Companies (AIC) and acknowledges the AIC Code of Corporate Governance, we have decided to follow and report against the Code, to the extent reasonably applicable to an externally managed property investment company, so as to measure ourselves against, and where we consider it appropriate, comply with the highest standards of corporate The Board is collectively responsible for the long-term success of the Group, for developing and delivering its strategy and for establishing a framework of prudent and effective controls to assess and manage risk effectively. Part of my role as Chair is to ensure that the Board retains an appropriate balance, with Non-Executive Directors who can effectively and appropriately challenge and provide guidance on the Company’s strategy. KWE continues to be led by a Board with a range of skills and experience which will challenge, motivate and support the business. See pages 62 to 63 for an overview of the governance and management structure of the Group. As a Board, we understand our responsibility to present a fair, balanced and understandable assessment of the Group’s position and prospects in this Annual Report and Accounts. We also understand the need to maintain sound risk management and internal control systems. We have given detailed consideration to the recent changes to the Code, in particular, the requirement to make a statement as to the Group’s longer-term viability in this year’s Annual Report and Accounts and the Board and the Audit Committee have worked together to ensure that we comply with this requirement. During the course of the year, the Audit Committee has assisted the Board to discharge its obligations with respect to the management of risk. A summary of the matters considered by the Audit Committee during the course of the year is set out in the Audit Committee report contained on pages 70 to 73. Further information relating to our compliance with the accountability provisions of the Code are set out on page 57. Charlotte Valeur Chair Charlotte Valeur Chair On behalf of the Board, I am pleased to present our corporate governance report for the year ended 31 December 2015. The Board plays a key role in ensuring high standards of corporate governance and providing leadership for the Company. Strategic report G overn an ce Financials A dditional inform ation Kennedy Wilson Europe Real Estate Plc / Annual Report and Accounts 2015 55 Letter from the Chair

Set out on the following pages is the Board’s assessment of the Company’s application of the main principles of the Code during the year under review and up to the date of this report: Icons used in our Governance report Leadership Running the Board and the Company to deliver the strategy Effectiveness Ensuring the Board has the right skills, experience and balance Accountability Monitoring and controlling the workings of the Company, especially risk, audit and the Investment Manager Remuneration Setting appropriate standards, in line with best practice Relations with shareholders Constructive engagement with our stakeholders A1. The role of the Board The Board is responsible for the overall strategy and success of the Company and provides a framework of oversight and control within which the Investment Manager operates. The ultimate responsibility for the management, strategic direction, governance, values and performance of the Group vests with the Board. The relationship between the Board and the Investment Manager is supportive, co-operative and open. A2. Division of responsibilities The Chair is responsible for the leadership and effectiveness of the Board. The Investment Manager is responsible for leading the day-to-day management of the Company, with oversight from the Board. The Board has all of the customary legal powers for the overall control and administration of the Company, and has assessed the relationship between the Company and the Investment Manager to be one of principal and agent. A3. The Chair The Chair leads the Board and ensures it operates effectively. With input from the Investment Manager and Administrator, the Chair is responsible for setting the agendas for meetings, managing the meeting timetable and facilitating open and constructive dialogue during meetings. A4. Non-Executive Directors The Chair promotes an open and constructive environment in the boardroom and actively invites the Non-Executive Directors’ views. The independent Non-Executive Directors provide objective, rigorous and constructive challenges to the Investment Manager and communicate regularly amongst themselves. They bring an external perspective to the business and contribute their expertise to the Board. Board-level Committees, with delegated specific responsibilities by the Board and operating in accordance with written terms of reference, are formed of the Chair of the Board, who is considered independent in character and judgement (and was independent on appointment for the purposes of the Code), and independent Non-Executive Directors, except the Nomination Committee which is formed of the Chair of the Board, one independent Non-Executive Director and one additional Non-Executive Director. B1. The composition of the Board Our Nomination Committee is responsible for regularly reviewing the composition of the Board. In making appointments to the Board, the Nomination Committee considers the wide range of skills, knowledge and experience required in order to maintain an effective Board. During the year, the Board reviewed the overall balance of skills, experience, diversity, independence and knowledge of the Board and the Committee members, and the Board considers it to be appropriate and that the Board and its Committees operate effectively. B2. Appointments to the Board The appointment of new Directors to the Board is led by our Nomination Committee. Further details of the activities of the Nomination Committee can be found on pages 67 to 68. B3. Commitment On appointment, Directors are notified of the time commitment expected from them, recognising the need for availability according to business requirements. In practice, the time given by Directors goes beyond preparation and attendance at scheduled meetings and training sessions. B4. Development All Directors receive induction training when they are appointed to the Board and, as part of the annual effectiveness evaluation, the training and development needs of each of our Directors are assessed. B5. Information and support The Chair, with assistance from the Administrator and Investment Manager, ensures that all our Board members receive accurate and timely information. B6. Evaluation The Chair, members of the Audit Committee and each of the individual Directors are evaluated each year. In addition, we have committed to an external evaluation every three years and anticipate that the first such evaluation will be carried out in 2016. B7. Re-election At each Annual General Meeting, our Directors retire and offer themselves for re-election. Kennedy Wilson Europe Real Estate Plc / Annual Report and Accounts 201556 A. Leadership B. Effectiveness Application of the principles of the Code
C1. Financial and business reporting The Strategic report is set out on pages 1 to 53. It provides information about our business model, performance, investment policy, strategy and the risks and uncertainties relating to our future prospects. Details of the arrangements the Board has established to ensure that the information it presents is fair, balanced and understandable can be found on page 71. C2. Risk management and internal control The Board determines the Group’s risk appetite and monitors and reviews the effectiveness of the Group’s risk management and internal control systems. The activities of our Audit Committee, which assists the Board with its responsibilities in relation to the management of risk, are summarised on pages 70 to 73. C3. Audit Committee and auditors The Board has delegated a number of responsibilities to our Audit Committee, which assists the Board in fulfilling its responsibilities in relation to overseeing our financial reporting processes, internal control and risk management framework and maintaining an appropriate relationship with the external auditor and reviewing their effectiveness, independence and objectivity. The Chair of our Audit Committee provides regular updates to the Board. D1. The levels and components of remuneration As the Company is externally managed, we have no executive directors or senior management employees (see note 38 of the consolidated financial statements regarding disclosure of personnel directly employed by certain of our wholly-owned operating subsidiaries). Each of the Non-Executive Directors receives a fixed fee for directorship on the Board and membership/ chairmanship of the Board Committees, as set out on page 76. D2. Procedure The Directors are entitled to such remuneration as the Board may determine, subject to any limitation as the Company may set by ordinary resolution. No Director is involved in any decisions in respect of his or her own individual remuneration. The Chair and other independent Directors received a fixed fee as members of the Board and the members/chairs of our Board Committees received a fixed supplementary fee. William McMorrow and Mary Ricks have waived their entitlement to receive fees for their respective appointments as Non- Executive Directors on the Board. E1. Dialogue with shareholders Representatives of the Investment Manager and the investor relations team meet regularly with our shareholders and the Board receives regular feedback on shareholder issues. The senior independent director (SID) was appointed on 25 February 2015. The Chair and the SID are available to attend one-on-one shareholder meetings if requested or appropriate. E2. Constructive use of general meetings Our Annual General Meeting provides an important opportunity to meet with our shareholders. The Board welcomes questions from shareholders. They have an opportunity to raise issues formally at the Annual General Meeting or informally with the Board before or after the meeting as well. The Company’s next Annual General Meeting will be held on 27 April 2016. Strategic report G overn an ce Financials A dditional inform ation Kennedy Wilson Europe Real Estate Plc / Annual Report and Accounts 2015 57 C. Accountability D. Remuneration E. Relations with shareholders
As a Board, we support and are committed to implementing high standards of corporate governance and the development of corporate governance policies and procedures derived from the Code. We consider, that reporting in line with the principles and provisions of the Code, with explanations as necessary, and taking account of AIC guidance where appropriate, will ensure full transparency and provide clear information to all our stakeholders. A copy of the Code is publicly available at www.frc.org.uk. The AIC’s materials can be found at www.theaic.co.uk. During the financial year under review, we believe that the Company has complied with all of the provisions of the Code, with the exception of the items noted below. The areas of non- compliance with the provisions of the Code, and our explanations for these, are as follows: • A.1.1: The Board should meet sufficiently regularly to discharge its duties effectively, with a formal schedule of matters specifically reserved for its decision. Being externally managed, except for matters involving any conflict of interest, the Board has delegated full discretionary authority to make all investment and financing decisions (on behalf of the Group) to the Investment Manager. However, the Board is responsible for determining the Company’s strategy and investment policy, its corporate governance practices, and is responsible for overseeing the performance of the Investment Manager and other service providers. The Board does not currently have a formal written schedule of matters reserved for its decision, but is planning to adopt such a schedule during the 2016 financial year, as recommended by the Code. • B.2.1: The Nomination Committee requires a composition of a majority of independent non-executive directors. The Board has established a Nomination Committee of three Non-Executive directors, including: the SID; the Chair (who was independent on appointment for the purposes of the Code but is not considered independent following such appointment), and one non-executive director who is not considered to be independent. The Board is of the view that as the Company is externally managed and does not have any executive directors, the Chair provides a significant degree of independent challenge to the non-independent Non-Executive Directors on the Board as well as the Investment Manager, making her independent in character and judgment. The Board considers that this is in keeping with the spirit of the recommendation that a majority of committee members should be independent non-executive directors. • C.3.1: The Audit Committee requires a composition of at least three independent non-executive directors. The Board has established an Audit Committee of three Non-Executive directors, including the Board’s two independent non-executive directors and the Chair (who was independent on appointment for the purposes of the Code but is not considered independent following such appointment). The Board considers that as the Company is externally managed with no executive directors and the overall composition of the Board comprises five Non-Executive directors (two of whom are independent for the purposes of the Code), the Chair provides a significant degree of independent challenge to the non- independent Non-Executive Directors on the Board as well as the Investment Manager, making her, in the Board’s view, independent in character and judgment. Accordingly the Board is of the view that currently no additional appointments are necessary and that the Audit Committee’s composition and level of experience and knowledge are appropriate for the size and nature of the Company. The Board does not feel that this in any way impeded good corporate governance and believes that the practice is in compliance with the main principle of the Code regarding composition and effectiveness of the Audit Committee. • D.1.1, D.1.2, D.2.1, D.2.2 and D.2.4: The recommendations relating to the remuneration arrangements for executive directors under provisions D.1.1, D.1.2 and D.2.4 are not relevant as the Company is externally managed by the Investment Manager and has no executive directors and does not operate any long-term incentive schemes. The Board has not established a remuneration committee per the recommendation in provision D.2.1. The Company’s Board consists of Non-Executive non-independent directors together with non-executive independent directors and a Chair. William McMorrow and Mary Ricks, as the non-independent directors, do not charge a directorship fee to the Company. The Nomination Committee has recognised that, given that no fee is charged by the non-independent directors, there is no value in establishing a remuneration committee. The Board is satisfied that any issues relating remuneration can be properly considered by the Board as a whole and no director is involved in any decisions in respect of his or her own individual remuneration. The position is kept under regular review by the Board. Further explanation of the Board’s remuneration arrangements can be found on page 76. • E.1.1: Details of the Company’s approach to shareholder dialogue can be found on page 77. Meetings with investors in the year under review were led by the non-independent Directors, senior representatives of the Investment Manager Group and the Company’s investor relations team. The Chair and the SID are available to attend meetings with investors as appropriate or requested. As explained in the Annual Report and Accounts 2014, for the period prior to 24 February 2015, there was no SID appointed by the Board. Mark McNicholas was appointed as SID on 25 February 2015. Kennedy Wilson Europe Real Estate Plc / Annual Report and Accounts 201558 Code compliance statement
Fair, balanced and understandable In accordance with the principles of the Code, the Board has established arrangements to evaluate whether the information presented in this Annual Report and Accounts is fair, balanced and understandable. Further details of these arrangements can be found on page 71. Having taken advice from the Audit Committee, the Board considers that the Annual Report and Accounts, taken as a whole, are fair, balanced and understandable and provide the information necessary to assess the Group’s position and performance, business model and strategy. Viability statement In accordance with provision C.2.2 of the Code, the Directors have assessed the prospects of the Group over a three-year period, taking account of its current position, and the potential impact of the principal risks documented in the Strategic report on pages 1 to 53. Based on this assessment, the Directors have a reasonable expectation that the Company will be able to continue in operation and meet its liabilities as they fall due over the period to December 2018. In doing so, it is recognised that such future assessments are subject to a level of uncertainty that increases with time and, therefore, future outcomes cannot be guaranteed or predicted with certainty. The period of three years was selected by the Board for the following reasons: • The Group’s strategic review period is three years; • Underlying individual asset (bottom-up) business plans and cash flow forecasts are prepared on a one and three year basis; and • The Group’s WAULT is 7.3 years, and therefore, a three year period captures sufficient reversionary risk. The three-year strategic review considers the Group’s cash flows, income profile, dividend cover, loan to value and other key financial metrics, as well as the level of capital recycling and reinvestment likely to occur, over the period. These metrics were subject to sensitivity analysis which involved flexing a number of the main assumptions underlying the forecast, both individually and in aggregate. This involved stress-testing the business model with the impact of occupational demand on the net operating income, the impact of increased interest rates on finance costs, dividend cover and overall interest coverage ratio, the impact of foreign exchange movements on net asset value and cash flow, as well as the impact of valuation falls on loan to value covenants in the Group’s debt facilities. Further explanation of the process used in preparing the Board to make this statement is set out on page 71 (Audit Committee report). Review of principal risks, risk management and internal control In accordance with provision C.2.1 of the Code, the Directors confirm that they have carried out a robust assessment of the principal risks facing the Company, including those that would threaten its business model, future performance, solvency or liquidity. The process upon which this statement is based is described on page 72 (Audit Committee report) and the principal risks and uncertainties and how they are managed and mitigated are described on pages 32 to 36. The Directors have also given due consideration to the review of the Company’s risk management framework and internal control systems during the year ended 31 December 2015. Further details are provided on page 72. Going concern The Group’s business activities and assets, together with factors likely to affect its future development, performance and position, are set out in the Strategic report on pages 1 to 53. The financial position of the Group, its cash flows, liquidity position and leverage, are described on pages 48 to 53. Details of the Group’s financial instruments and derivative and hedging activities, and details of other financial and non-financial liabilities are described on pages 125 to 129. Lastly, the Group’s exposure to risks, including credit risk and liquidity risk, and its management of these risks is described on pages 130 to 134. After making enquiries about the Group’s business activities and financial resources, and bearing in mind the nature of the Group’s business and assets, the Directors consider that the Group has access to: sufficient liquidity comprising cash and undrawn facilities, together with flexible financing options under the EMTN programme established in November 2015, secure income from strong covenants supported by a high occupancy and a high WAULT; and value and income enhancing asset management initiatives. As a consequence, the Directors believe that the Group is well placed to successfully manage its business risks. The Directors have considered the Group’s asset position and valuation of the investment portfolio at the year end, together with projected cash flows for a period of one year from the date of signing these consolidated financial statements, and have concluded that the Group has adequate resources to continue in operation for the next 12 months from the date of this statement. The Directors are satisfied that: • the Group’s and Company’s activities are sustainable for the foreseeable future, being a period of not less than 12 months from the date of approval of this statement and the business is a going concern; and • it is therefore appropriate to continue to adopt the going concern basis in preparing the consolidated financial statements. Directors’ responsibility statements The Directors’ further statements in respect of their responsibility for the Annual Report and Accounts can be found on page 81. Strategic report G overn an ce Financials A dditional inform ation Kennedy Wilson Europe Real Estate Plc / Annual Report and Accounts 2015 59 Directors’ statements
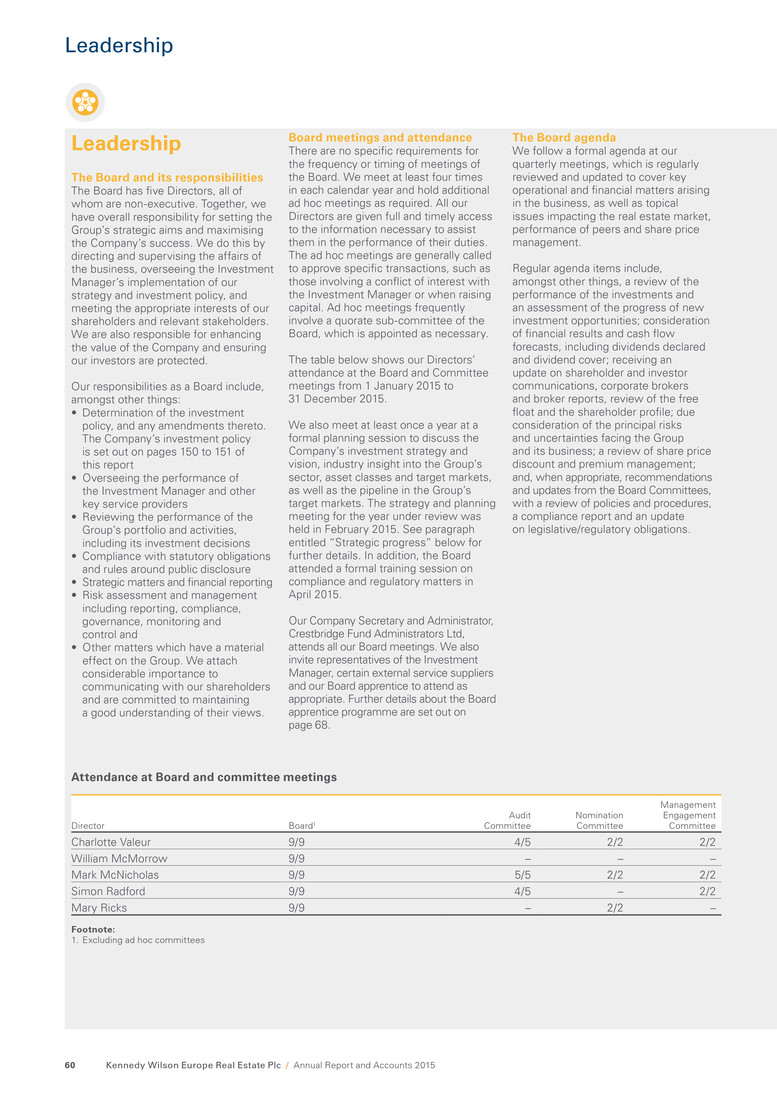
Leadership The Board and its responsibilities The Board has five Directors, all of whom are non-executive. Together, we have overall responsibility for setting the Group’s strategic aims and maximising the Company’s success. We do this by directing and supervising the affairs of the business, overseeing the Investment Manager’s implementation of our strategy and investment policy, and meeting the appropriate interests of our shareholders and relevant stakeholders. We are also responsible for enhancing the value of the Company and ensuring our investors are protected. Our responsibilities as a Board include, amongst other things: • Determination of the investment policy, and any amendments thereto. The Company’s investment policy is set out on pages 150 to 151 of this report • Overseeing the performance of the Investment Manager and other key service providers • Reviewing the performance of the Group’s portfolio and activities, including its investment decisions • Compliance with statutory obligations and rules around public disclosure • Strategic matters and financial reporting • Risk assessment and management including reporting, compliance, governance, monitoring and control and • Other matters which have a material effect on the Group. We attach considerable importance to communicating with our shareholders and are committed to maintaining a good understanding of their views. Board meetings and attendance There are no specific requirements for the frequency or timing of meetings of the Board. We meet at least four times in each calendar year and hold additional ad hoc meetings as required. All our Directors are given full and timely access to the information necessary to assist them in the performance of their duties. The ad hoc meetings are generally called to approve specific transactions, such as those involving a conflict of interest with the Investment Manager or when raising capital. Ad hoc meetings frequently involve a quorate sub-committee of the Board, which is appointed as necessary. The table below shows our Directors’ attendance at the Board and Committee meetings from 1 January 2015 to 31 December 2015. We also meet at least once a year at a formal planning session to discuss the Company’s investment strategy and vision, industry insight into the Group’s sector, asset classes and target markets, as well as the pipeline in the Group’s target markets. The strategy and planning meeting for the year under review was held in February 2015. See paragraph entitled “Strategic progress” below for further details. In addition, the Board attended a formal training session on compliance and regulatory matters in April 2015. Our Company Secretary and Administrator, Crestbridge Fund Administrators Ltd, attends all our Board meetings. We also invite representatives of the Investment Manager, certain external service suppliers and our Board apprentice to attend as appropriate. Further details about the Board apprentice programme are set out on page 68. The Board agenda We follow a formal agenda at our quarterly meetings, which is regularly reviewed and updated to cover key operational and financial matters arising in the business, as well as topical issues impacting the real estate market, performance of peers and share price management. Regular agenda items include, amongst other things, a review of the performance of the investments and an assessment of the progress of new investment opportunities; consideration of financial results and cash flow forecasts, including dividends declared and dividend cover; receiving an update on shareholder and investor communications, corporate brokers and broker reports, review of the free float and the shareholder profile; due consideration of the principal risks and uncertainties facing the Group and its business; a review of share price discount and premium management; and, when appropriate, recommendations and updates from the Board Committees, with a review of policies and procedures, a compliance report and an update on legislative/regulatory obligations. Attendance at Board and committee meetings Director Board1 Audit Committee Nomination Committee Management Engagement Committee Charlotte Valeur 9/9 4/5 2/2 2/2 William McMorrow 9/9 – – – Mark McNicholas 9/9 5/5 2/2 2/2 Simon Radford 9/9 4/5 – 2/2 Mary Ricks 9/9 – 2/2 – Footnote: 1. Excluding ad hoc committees Kennedy Wilson Europe Real Estate Plc / Annual Report and Accounts 201560 Leadership
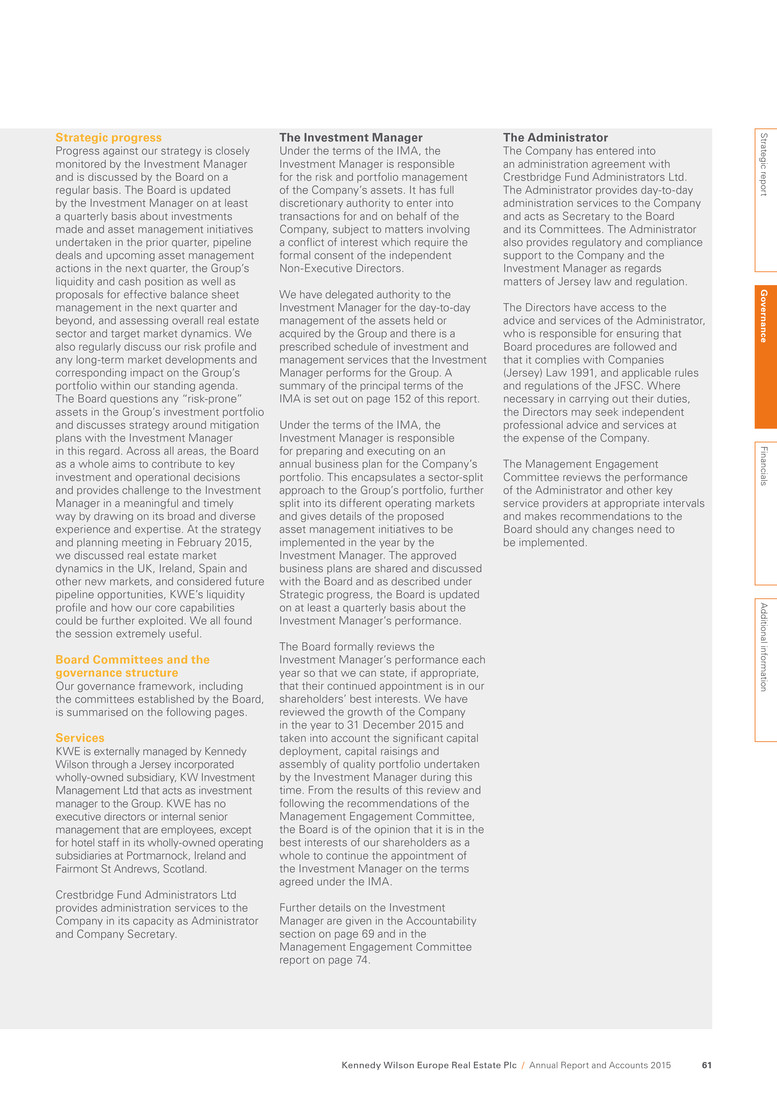
Strategic progress Progress against our strategy is closely monitored by the Investment Manager and is discussed by the Board on a regular basis. The Board is updated by the Investment Manager on at least a quarterly basis about investments made and asset management initiatives undertaken in the prior quarter, pipeline deals and upcoming asset management actions in the next quarter, the Group’s liquidity and cash position as well as proposals for effective balance sheet management in the next quarter and beyond, and assessing overall real estate sector and target market dynamics. We also regularly discuss our risk profile and any long-term market developments and corresponding impact on the Group’s portfolio within our standing agenda. The Board questions any “risk-prone” assets in the Group’s investment portfolio and discusses strategy around mitigation plans with the Investment Manager in this regard. Across all areas, the Board as a whole aims to contribute to key investment and operational decisions and provides challenge to the Investment Manager in a meaningful and timely way by drawing on its broad and diverse experience and expertise. At the strategy and planning meeting in February 2015, we discussed real estate market dynamics in the UK, Ireland, Spain and other new markets, and considered future pipeline opportunities, KWE’s liquidity profile and how our core capabilities could be further exploited. We all found the session extremely useful. Board Committees and the governance structure Our governance framework, including the committees established by the Board, is summarised on the following pages. Services KWE is externally managed by Kennedy Wilson through a Jersey incorporated wholly-owned subsidiary, KW Investment Management Ltd that acts as investment manager to the Group. KWE has no executive directors or internal senior management that are employees, except for hotel staff in its wholly-owned operating subsidiaries at Portmarnock, Ireland and Fairmont St Andrews, Scotland. Crestbridge Fund Administrators Ltd provides administration services to the Company in its capacity as Administrator and Company Secretary. The Investment Manager Under the terms of the IMA, the Investment Manager is responsible for the risk and portfolio management of the Company’s assets. It has full discretionary authority to enter into transactions for and on behalf of the Company, subject to matters involving a conflict of interest which require the formal consent of the independent Non-Executive Directors. We have delegated authority to the Investment Manager for the day-to-day management of the assets held or acquired by the Group and there is a prescribed schedule of investment and management services that the Investment Manager performs for the Group. A summary of the principal terms of the IMA is set out on page 152 of this report. Under the terms of the IMA, the Investment Manager is responsible for preparing and executing on an annual business plan for the Company’s portfolio. This encapsulates a sector-split approach to the Group’s portfolio, further split into its different operating markets and gives details of the proposed asset management initiatives to be implemented in the year by the Investment Manager. The approved business plans are shared and discussed with the Board and as described under Strategic progress, the Board is updated on at least a quarterly basis about the Investment Manager’s performance. The Board formally reviews the Investment Manager’s performance each year so that we can state, if appropriate, that their continued appointment is in our shareholders’ best interests. We have reviewed the growth of the Company in the year to 31 December 2015 and taken into account the significant capital deployment, capital raisings and assembly of quality portfolio undertaken by the Investment Manager during this time. From the results of this review and following the recommendations of the Management Engagement Committee, the Board is of the opinion that it is in the best interests of our shareholders as a whole to continue the appointment of the Investment Manager on the terms agreed under the IMA. Further details on the Investment Manager are given in the Accountability section on page 69 and in the Management Engagement Committee report on page 74. The Administrator The Company has entered into an administration agreement with Crestbridge Fund Administrators Ltd. The Administrator provides day-to-day administration services to the Company and acts as Secretary to the Board and its Committees. The Administrator also provides regulatory and compliance support to the Company and the Investment Manager as regards matters of Jersey law and regulation. The Directors have access to the advice and services of the Administrator, who is responsible for ensuring that Board procedures are followed and that it complies with Companies (Jersey) Law 1991, and applicable rules and regulations of the JFSC. Where necessary in carrying out their duties, the Directors may seek independent professional advice and services at the expense of the Company. The Management Engagement Committee reviews the performance of the Administrator and other key service providers at appropriate intervals and makes recommendations to the Board should any changes need to be implemented. Strategic report G overn an ce Financials A dditional inform ation Kennedy Wilson Europe Real Estate Plc / Annual Report and Accounts 2015 61
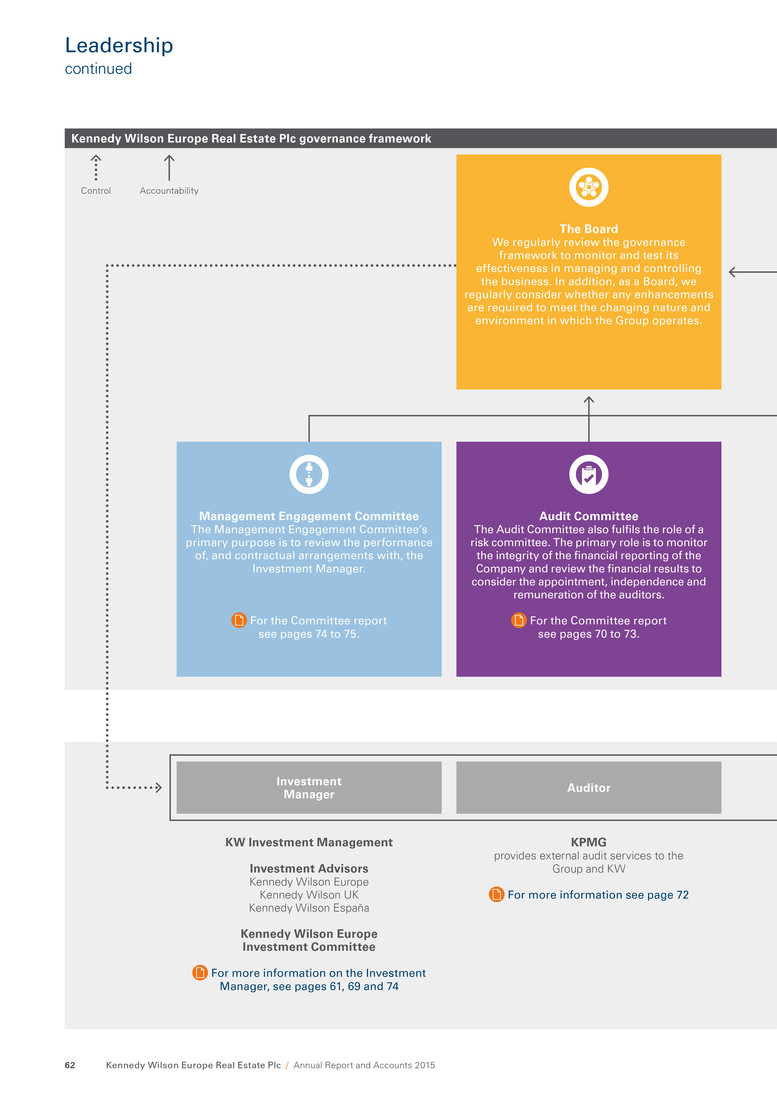
The Board We regularly review the governance framework to monitor and test its effectiveness in managing and controlling the business. In addition, as a Board, we regularly consider whether any enhancements are required to meet the changing nature and environment in which the Group operates. Management Engagement Committee The Management Engagement Committee’s primary purpose is to review the performance of, and contractual arrangements with, the Investment Manager. For the Committee report see pages 74 to 75. Investment Manager Auditor KW Investment Management Investment Advisors Kennedy Wilson Europe Kennedy Wilson UK Kennedy Wilson España Kennedy Wilson Europe Investment Committee For more information on the Investment Manager, see pages 61, 69 and 74 KPMG provides external audit services to the Group and KW For more information see page 72 Audit Committee The Audit Committee also fulfils the role of a risk committee. The primary role is to monitor the integrity of the financial reporting of the Company and review the financial results to consider the appointment, independence and remuneration of the auditors. For the Committee report see pages 70 to 73. Control Accountability Kennedy Wilson Europe Real Estate Plc / Annual Report and Accounts 201562 Kennedy Wilson Europe Real Estate Plc governance framework Leadership continued

We have an Audit Committee, which also fulfils the role of a risk committee (see pages 70 to 73), a Nomination Committee (see pages 67 to 68) and a Management Engagement Committee (see pages 74 to 75). Each Committee has formally delegated duties and responsibilities and written terms of reference which the Board has approved. The Committees’ terms of reference are available on the KWE website. Under the provisions of the terms of reference, the Board formally reviews the membership and chairing of each committee at least once every three years. As the Company has no executive officers, we have not established a separate remuneration committee. The Board is satisfied that any relevant issues that arise in connection with the fees payable to the independent Non-Executive Directors can be properly considered by the Board as a whole. No director is involved in any decisions in respect of his or her own individual remuneration. For more information on Remuneration, see page 76. Administrator and Company Secretary Key external service suppliers The Company appoints key service providers to enable it to deliver its strategy to its stakeholdersCrestbridge Fund Administrators provides day-to-day administration services and acts as Secretary to the Board and its Committees For more information see page 61 Nomination Committee The primary purpose of the Nomination Committee is to fill vacancies on the Board and ensure that the Board maintains an appropriate level and balance of skills and experience to effectively lead the Company. For the Committee report see pages 67 to 68. Strategic report G overn an ce Financials A dditional inform ation Kennedy Wilson Europe Real Estate Plc / Annual Report and Accounts 2015 63 Kennedy Wilson Europe Real Estate Plc governance framework
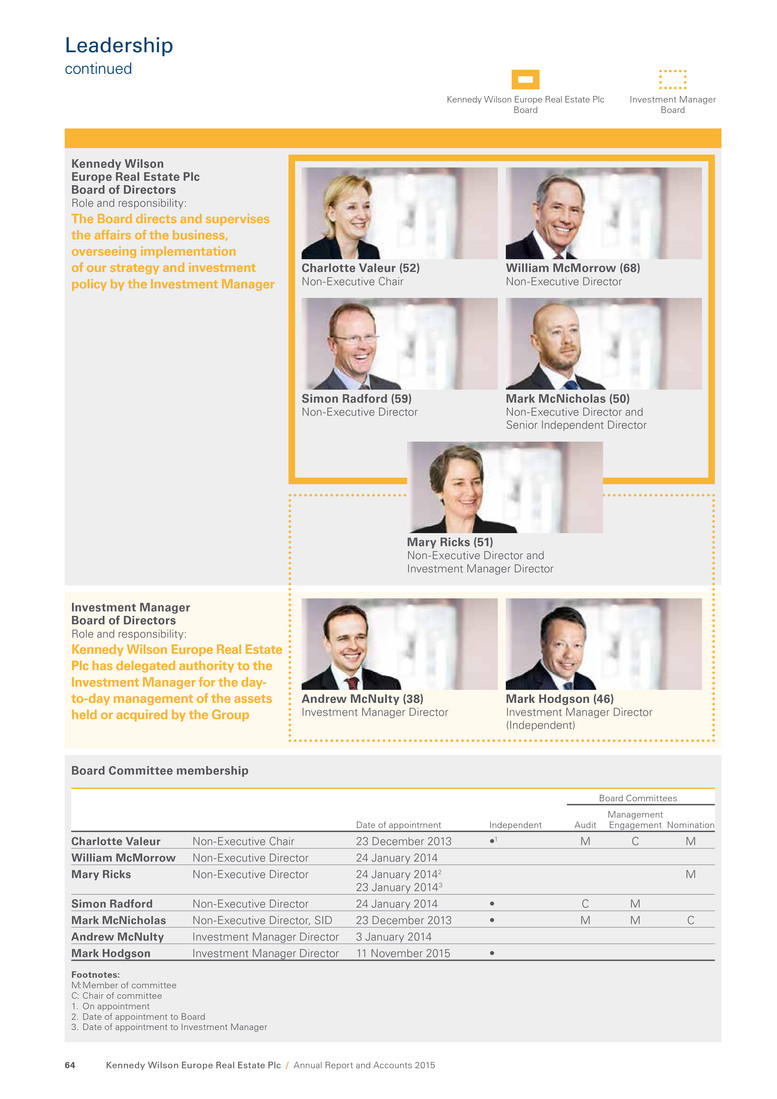
Kennedy Wilson Europe Real Estate Plc Board of Directors Role and responsibility: The Board directs and supervises the affairs of the business, overseeing implementation of our strategy and investment policy by the Investment Manager Board Committee membership Date of appointment Independent Board Committees Audit Management Engagement Nomination Charlotte Valeur Non-Executive Chair 23 December 2013 •1 M C M William McMorrow Non-Executive Director 24 January 2014 Mary Ricks Non-Executive Director 24 January 20142 23 January 20143 M Simon Radford Non-Executive Director 24 January 2014 • C M Mark McNicholas Non-Executive Director, SID 23 December 2013 • M M C Andrew McNulty Investment Manager Director 3 January 2014 Mark Hodgson Investment Manager Director 11 November 2015 • Footnotes: M: Member of committee C: Chair of committee 1. On appointment 2. Date of appointment to Board 3. Date of appointment to Investment Manager Investment Manager Board of Directors Role and responsibility: Kennedy Wilson Europe Real Estate Plc has delegated authority to the Investment Manager for the day- to-day management of the assets held or acquired by the Group Charlotte Valeur (52) Non-Executive Chair Simon Radford (59) Non-Executive Director William McMorrow (68) Non-Executive Director Mark McNicholas (50) Non-Executive Director and Senior Independent Director Mary Ricks (51) Non-Executive Director and Investment Manager Director Andrew McNulty (38) Investment Manager Director Mark Hodgson (46) Investment Manager Director (Independent) Kennedy Wilson Europe Real Estate Plc Board Investment Manager Board Kennedy Wilson Europe Real Estate Plc / Annual Report and Accounts 201564 Leadership continued
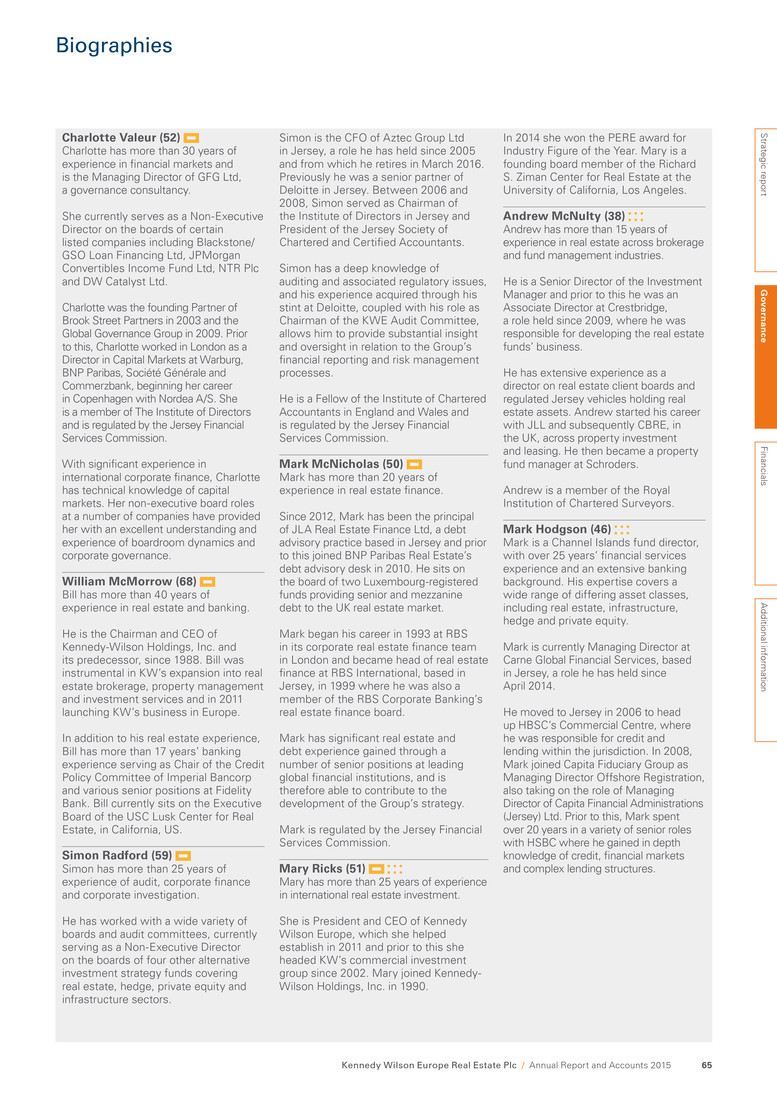
Charlotte Valeur (52) Charlotte has more than 30 years of experience in financial markets and is the Managing Director of GFG Ltd, a governance consultancy. She currently serves as a Non-Executive Director on the boards of certain listed companies including Blackstone/ GSO Loan Financing Ltd, JPMorgan Convertibles Income Fund Ltd, NTR Plc and DW Catalyst Ltd. Charlotte was the founding Partner of Brook Street Partners in 2003 and the Global Governance Group in 2009. Prior to this, Charlotte worked in London as a Director in Capital Markets at Warburg, BNP Paribas, Société Générale and Commerzbank, beginning her career in Copenhagen with Nordea A/S. She is a member of The Institute of Directors and is regulated by the Jersey Financial Services Commission. With significant experience in international corporate finance, Charlotte has technical knowledge of capital markets. Her non-executive board roles at a number of companies have provided her with an excellent understanding and experience of boardroom dynamics and corporate governance. William McMorrow (68) Bill has more than 40 years of experience in real estate and banking. He is the Chairman and CEO of Kennedy-Wilson Holdings, Inc. and its predecessor, since 1988. Bill was instrumental in KW’s expansion into real estate brokerage, property management and investment services and in 2011 launching KW’s business in Europe. In addition to his real estate experience, Bill has more than 17 years’ banking experience serving as Chair of the Credit Policy Committee of Imperial Bancorp and various senior positions at Fidelity Bank. Bill currently sits on the Executive Board of the USC Lusk Center for Real Estate, in California, US. Simon Radford (59) Simon has more than 25 years of experience of audit, corporate finance and corporate investigation. He has worked with a wide variety of boards and audit committees, currently serving as a Non-Executive Director on the boards of four other alternative investment strategy funds covering real estate, hedge, private equity and infrastructure sectors. Simon is the CFO of Aztec Group Ltd in Jersey, a role he has held since 2005 and from which he retires in March 2016. Previously he was a senior partner of Deloitte in Jersey. Between 2006 and 2008, Simon served as Chairman of the Institute of Directors in Jersey and President of the Jersey Society of Chartered and Certified Accountants. Simon has a deep knowledge of auditing and associated regulatory issues, and his experience acquired through his stint at Deloitte, coupled with his role as Chairman of the KWE Audit Committee, allows him to provide substantial insight and oversight in relation to the Group’s financial reporting and risk management processes. He is a Fellow of the Institute of Chartered Accountants in England and Wales and is regulated by the Jersey Financial Services Commission. Mark McNicholas (50) Mark has more than 20 years of experience in real estate finance. Since 2012, Mark has been the principal of JLA Real Estate Finance Ltd, a debt advisory practice based in Jersey and prior to this joined BNP Paribas Real Estate’s debt advisory desk in 2010. He sits on the board of two Luxembourg-registered funds providing senior and mezzanine debt to the UK real estate market. Mark began his career in 1993 at RBS in its corporate real estate finance team in London and became head of real estate finance at RBS International, based in Jersey, in 1999 where he was also a member of the RBS Corporate Banking’s real estate finance board. Mark has significant real estate and debt experience gained through a number of senior positions at leading global financial institutions, and is therefore able to contribute to the development of the Group’s strategy. Mark is regulated by the Jersey Financial Services Commission. Mary Ricks (51) Mary has more than 25 years of experience in international real estate investment. She is President and CEO of Kennedy Wilson Europe, which she helped establish in 2011 and prior to this she headed KW’s commercial investment group since 2002. Mary joined Kennedy- Wilson Holdings, Inc. in 1990. In 2014 she won the PERE award for Industry Figure of the Year. Mary is a founding board member of the Richard S. Ziman Center for Real Estate at the University of California, Los Angeles. Andrew McNulty (38) Andrew has more than 15 years of experience in real estate across brokerage and fund management industries. He is a Senior Director of the Investment Manager and prior to this he was an Associate Director at Crestbridge, a role held since 2009, where he was responsible for developing the real estate funds’ business. He has extensive experience as a director on real estate client boards and regulated Jersey vehicles holding real estate assets. Andrew started his career with JLL and subsequently CBRE, in the UK, across property investment and leasing. He then became a property fund manager at Schroders. Andrew is a member of the Royal Institution of Chartered Surveyors. Mark Hodgson (46) Mark is a Channel Islands fund director, with over 25 years’ financial services experience and an extensive banking background. His expertise covers a wide range of differing asset classes, including real estate, infrastructure, hedge and private equity. Mark is currently Managing Director at Carne Global Financial Services, based in Jersey, a role he has held since April 2014. He moved to Jersey in 2006 to head up HBSC’s Commercial Centre, where he was responsible for credit and lending within the jurisdiction. In 2008, Mark joined Capita Fiduciary Group as Managing Director Offshore Registration, also taking on the role of Managing Director of Capita Financial Administrations (Jersey) Ltd. Prior to this, Mark spent over 20 years in a variety of senior roles with HSBC where he gained in depth knowledge of credit, financial markets and complex lending structures. Strategic report G overn an ce Financials A dditional inform ation Kennedy Wilson Europe Real Estate Plc / Annual Report and Accounts 2015 65 Biographies
Effectiveness The members of the Board We currently consider the overall size and composition of the Board to be appropriate, whilst this is continually monitored by the Nomination Committee and also the Board. This opinion is informed by the results of the recent evaluation of our Board members (described below), particularly regarding the independence of character and integrity of all our Directors, and the skills and experience they bring to their duties. These qualities prevent any individual or small group from dominating the Board’s decision making or exercising undue influence. We monitor developments in corporate governance standards to ensure that as a Board we remain aligned with the best practices followed by our peers. We acknowledge the importance of diversity, including gender and nationality, for the effective functioning of the Board and are committed to supporting diversity of business skills, experience and background in the boardroom. Further information on our diversity policy can be found on page 68. The Board considers that the skills and experience of our members, particularly in the areas of investment, real estate, financial services, corporate governance and corporate finance, are fundamental to the pursuit of the Company’s strategic objectives. In addition, the international and quoted company experience of members of the Board in a variety of markets is invaluable to the Company. The Board’s policy on tenure is that continuity and experience are considered to add significantly to the strength of the Board and, as such, other than an initial term of three years from the date of appointment, no limit on the overall length of service of any of the Directors, including the Chair, has been imposed. There have been no changes to the other significant commitments of the Chair or any of the other Non-Executive Directors during the year under review. Mark McNicholas was appointed to the role of senior independent director on 25 February 2015. The Directors are subject to re-election on an annual basis and their biographies, setting out their relevant skills, experience, their other professional commitments and their individual contributions to the Board, are described on pages 64 to 65. Independence of Non-Executive Directors Mark McNicholas and Simon Radford are considered to meet the independence requirements of the Code. The Chair, Charlotte Valeur, was considered independent on appointment in accordance with the Code. Taking into account the provisions of the Code, two of our five Non-Executive Directors, William McMorrow and Mary Ricks, are not considered independent by the Board because of their employment with KW and its group companies. Mary Ricks is also a Director on the Board of the Investment Manager, and both of them have been nominated for appointment to the Board by the Investment Manager, in accordance with a right set out in the IMA. Board, Committee and Directors’ evaluation Our Board is committed to evaluating its performance each year. Towards the end of 2015 and in the early part of 2016, we held a second evaluation, which was internally managed like the first evaluation which took place at the end of 2014, through questionnaires which were completed by each of our Directors. In addition, members of the Audit Committee completed evaluation questionnaires to assess the performance and effectiveness of the Audit Committee and the responses to all the questionnaires were formally discussed at the Nomination Committee meeting. The evaluation reviewed the Board’s balance of skills, experience, independence and knowledge of the Company, its diversity, including gender, how the Board works together as a unit and other factors relevant to its effectiveness. The evaluation concluded that the Board, the Chair and its Committees operate effectively and that Board communication as well as quality and transparency of disclosure to all stakeholders had been enhanced since the time of the first evaluation. The evaluation further confirmed that each Director’s performance continues to be effective and demonstrates commitment to the role. It was observed that whilst the size, composition and competency of the Board is ideal to discharge its responsibilities, the Nomination Committee should also consider the appointment of a new independent non-executive director to the Board in 2016. The Board has planned training for the coming year on topics including real estate market and industry trends in order to further enhance its knowledge and skills. The Board has committed to an external evaluation on a three-year basis and it is anticipated that the first external evaluation exercise will be conducted in 2016. Kennedy Wilson Europe Real Estate Plc / Annual Report and Accounts 201566 Effectiveness
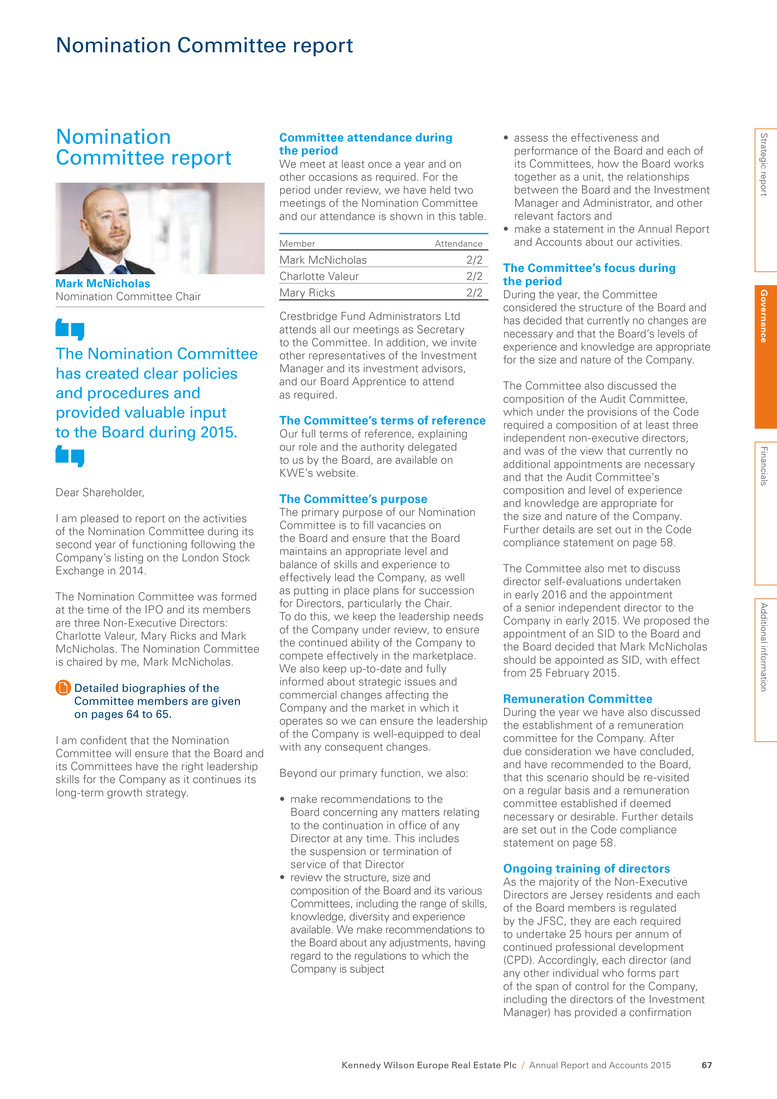
Nomination Committee report Mark McNicholas Nomination Committee Chair The Nomination Committee has created clear policies and procedures and provided valuable input to the Board during 2015. Dear Shareholder, I am pleased to report on the activities of the Nomination Committee during its second year of functioning following the Company’s listing on the London Stock Exchange in 2014. The Nomination Committee was formed at the time of the IPO and its members are three Non-Executive Directors: Charlotte Valeur, Mary Ricks and Mark McNicholas. The Nomination Committee is chaired by me, Mark McNicholas. Detailed biographies of the Committee members are given on pages 64 to 65. I am confident that the Nomination Committee will ensure that the Board and its Committees have the right leadership skills for the Company as it continues its long-term growth strategy. Committee attendance during the period We meet at least once a year and on other occasions as required. For the period under review, we have held two meetings of the Nomination Committee and our attendance is shown in this table. Member Attendance Mark McNicholas 2/2 Charlotte Valeur 2/2 Mary Ricks 2/2 Crestbridge Fund Administrators Ltd attends all our meetings as Secretary to the Committee. In addition, we invite other representatives of the Investment Manager and its investment advisors, and our Board Apprentice to attend as required. The Committee’s terms of reference Our full terms of reference, explaining our role and the authority delegated to us by the Board, are available on KWE’s website. The Committee’s purpose The primary purpose of our Nomination Committee is to fill vacancies on the Board and ensure that the Board maintains an appropriate level and balance of skills and experience to effectively lead the Company, as well as putting in place plans for succession for Directors, particularly the Chair. To do this, we keep the leadership needs of the Company under review, to ensure the continued ability of the Company to compete effectively in the marketplace. We also keep up-to-date and fully informed about strategic issues and commercial changes affecting the Company and the market in which it operates so we can ensure the leadership of the Company is well-equipped to deal with any consequent changes. Beyond our primary function, we also: • make recommendations to the Board concerning any matters relating to the continuation in office of any Director at any time. This includes the suspension or termination of service of that Director • review the structure, size and composition of the Board and its various Committees, including the range of skills, knowledge, diversity and experience available. We make recommendations to the Board about any adjustments, having regard to the regulations to which the Company is subject • assess the effectiveness and performance of the Board and each of its Committees, how the Board works together as a unit, the relationships between the Board and the Investment Manager and Administrator, and other relevant factors and • make a statement in the Annual Report and Accounts about our activities. The Committee’s focus during the period During the year, the Committee considered the structure of the Board and has decided that currently no changes are necessary and that the Board’s levels of experience and knowledge are appropriate for the size and nature of the Company. The Committee also discussed the composition of the Audit Committee, which under the provisions of the Code required a composition of at least three independent non-executive directors, and was of the view that currently no additional appointments are necessary and that the Audit Committee’s composition and level of experience and knowledge are appropriate for the size and nature of the Company. Further details are set out in the Code compliance statement on page 58. The Committee also met to discuss director self-evaluations undertaken in early 2016 and the appointment of a senior independent director to the Company in early 2015. We proposed the appointment of an SID to the Board and the Board decided that Mark McNicholas should be appointed as SID, with effect from 25 February 2015. Remuneration Committee During the year we have also discussed the establishment of a remuneration committee for the Company. After due consideration we have concluded, and have recommended to the Board, that this scenario should be re-visited on a regular basis and a remuneration committee established if deemed necessary or desirable. Further details are set out in the Code compliance statement on page 58. Ongoing training of directors As the majority of the Non-Executive Directors are Jersey residents and each of the Board members is regulated by the JFSC, they are each required to undertake 25 hours per annum of continued professional development (CPD). Accordingly, each director (and any other individual who forms part of the span of control for the Company, including the directors of the Investment Manager) has provided a confirmation Strategic report G overn an ce Financials A dditional inform ation Kennedy Wilson Europe Real Estate Plc / Annual Report and Accounts 2015 67 Nomination Committee report
that the appropriate CPD requirements have been met during the year ended 31 December 2015. In addition, Jersey regulations require that all Directors of the Company undergo anti-bribery and anti-money laundering training. In April 2015, a training session covering the Group’s regulatory and compliance practices to address anti-bribery, anti-money laundering and other topical areas of compliance such as insider trading and cyber security risks was attended by the Directors of the Company as well as the Investment Manager. Board appointment process No new Director has been appointed since the Company’s IPO in February 2014 and we do not believe that there is a gap that currently needs to be filled. We have a formal policy for the appointment process and this is set out in the terms of reference of the Nomination Committee. We will use open advertising or the services of external advisors to facilitate the search for suitable candidates. Consideration will be given to candidates from a wide range of backgrounds, based on merit and against objective criteria, including assurance that appointees have enough time available to devote to the position and with due regard for the benefits of diversity in all its forms on the Board, as well as the applicable requirements under AIFMD. Any short-listed candidates we select will be seen in the first instance by the Chair and one other Committee member. If appropriate, the potential candidate(s) will be invited to meet the Committee as a whole. We will then decide whether to recommend an appointment to the Board and the Board will decide whether to make the appointment. Diversity policy We consider that together the Directors have a balance of skills, qualifications and experience which are relevant to the Company and the Group as a whole. The Board and this Committee support the recommendations of the Davies Report and believe in the value and importance of diversity in the boardroom. The Committee formally adopted a diversity policy for the Board, which sets out the Board’s approach to diversity in relation to its composition. Under the terms of the adopted policy, the Committee will review and assess Board composition periodically, and take into account the benefits of all aspects of diversity, including, but not limited to, nationalities, race, skill sets, age groups, industry experience and gender as well as the personal attributes and experience of the Directors. To implement the diversity policy effectively in the context of any future Board appointments, the Committee may use various practical tools such as the Smile composition model or checklist that will identify and grade the various diversifying factors to be considered in the selection process. The Committee will also discuss and agree any targets or objectives for achieving diversity on the Board, taking into account any applicable rules or regulations that apply at the time, such as those around director residency and domicile requirements and make recommendations in this regard to the Board for approval. All appointments to the Board will always be made on merit and suitability for the role. Currently, we do not consider that it is appropriate or in the interest of the Company and its shareholders to set prescriptive diversity targets for the Board. The proportion of female Directors on the Board is currently 40%. Board apprenticeship The Board is committed to improving the opportunities for people from a diverse range of backgrounds to understand and prepare for membership of corporate boards. During the period under review, the apprentice from Board Apprentice Ltd (a not-for-profit organisation dedicated to increasing diversity on boards by widening the pool of board-ready candidates and which looks at diversity beyond gender and encompassing ethnicity, culture, age, disability, personality and skill set) completed a year of board apprenticeship with the Company. This was the Company’s first apprentice on the Board under the programme, and given the potential for positive impact and influence the scheme can create, the Board has committed to take on an apprentice for the year 2016 as well. The Committee’s effectiveness This was the Company’s and the Nomination Committee’s second year of operation, and I am very pleased to report on behalf of the Committee that it has acted in accordance with its documented terms of reference, established policies and procedures with a view to creating a platform for the future, and overall provided valuable input to the Board on the areas set out above. The Board and its committees were comprised appropriately for the size and needs of the Company, and were operating effectively. Mark McNicholas Nomination Committee Chair Kennedy Wilson Europe Real Estate Plc / Annual Report and Accounts 201568 Nomination Committee report continued
Accountability Introduction The Board has ultimate responsibility for ensuring that there are sufficient, appropriate and effective systems, procedures, policies and processes in place for internal control of financial, operational, compliance and risk management matters to manage the risks which are an inherent part of business. The Board receives regular reports from the Investment Manager on the Group’s business risk profile and key risks. All key risk, compliance and control activities are considered at the Audit Committee. This framework is designed to manage and mitigate risk rather than eliminate it in order to permit the Company to meet its financial and other objectives and can only provide reasonable, and not absolute, assurance against material loss or misstatement. Financial reporting The Group maintains a control environment that is regularly reviewed by the Board. The principal elements of the control environment include comprehensive management and financial reporting systems and processes, defined operating controls and authorisation limits, regular Board meetings, and clear subsidiary board and operating structures. Internal control and risk management systems relating to the financial reporting process and the process for preparing consolidated accounts ensure the accuracy and timeliness of internal and external financial reporting. Regular monthly reporting cycles allow the Investment Manager to assess performance, and identify risks and opportunities at the earliest opportunity. Performance is assessed against budget and against the latest forecast expectations. The Group has a well-understood externally managed structure with documented levels for the authorisation of business transactions and clear bank mandates to control the approval of payments. Control of the Group’s cash resources is operated by a centralised treasury function in the Investment Manager Group. Internal management reporting and external statutory reporting timetables and delivery requirements are well established and documented. Control of these is maintained centrally and communicated regularly. The Investment Manager, on behalf of the Group, maintains computer systems to record and consolidate all of its financial transactions. These ledger systems are used to produce the information for the monthly management accounts, and for the annual statutory financial statements. The accounts production process ensures that there is a clear audit trail from the output of the Group’s financial reporting systems, through the conversion and consolidation processes, to the Group’s consolidated financial statements. Risk management The Group risk management cycle is an iterative cycle of identification, assessment, mitigation and monitoring of risks facing the Group. Further details are set out on pages 32 to 36 of this report under Managing risks. Investment processes adopted by the Investment Manager We are responsible for reviewing (and challenging where appropriate) the adequacy and efficacy of the systems and procedures adopted by the Investment Manager regarding the Group’s operations and investments. The Investment Manager has delegated certain responsibilities and functions, including property level services to the investment advisors, and has contracted to receive portfolio advisory services from them. The investment advisors are all subsidiaries of Kennedy Wilson in Europe. The investment advisors engaged by the Investment Manager utilise a thorough and rigorous investment process when advising the Investment Manager on investment opportunities for the Company. They are responsible for identifying investment opportunities and conducting due diligence on those opportunities. However, investment decisions are made at the sole discretion of the Investment Manager, who has been authorised by the Board to make such decisions, other than in relation to matters involving a conflict of interest which require the formal approval of the independent Directors. Statement of review The risk management process detailed earlier was in place for the year under review and up to the date of approval of this report. The Board has given due consideration to the adequacy of the Company’s risk management framework and its internal control systems, including all material financial, operational and compliance controls, during the year ended 31 December 2015 and believes them to be operating effectively. No significant failings or weaknesses were noted by the Board. Strategic report G overn an ce Financials A dditional inform ation Kennedy Wilson Europe Real Estate Plc / Annual Report and Accounts 2015 69 Accountability

Audit Committee report Simon Radford Audit Committee Chair The Committee has supported the Board in maintaining sound financial reporting, risk management and internal control procedures during the year. Dear Shareholder, I am pleased to report on the activities of the Audit Committee during its second year of functioning. Our Audit Committee members are Charlotte Valeur, Mark McNicholas and Simon Radford. The Audit Committee is chaired by me, Simon Radford. I am a chartered accountant in England and Wales and I am deemed by the Board to have recent and relevant financial experience for the purposes of the Code. Detailed biographies of the Committee members are given on pages 64 to 65. During the year, the Committee has supported the Board in maintaining sound financial reporting, risk management and internal control procedures. I have regular meetings with the Group’s external auditors, and the finance and risk management teams at the Investment Manager to discuss matters which are relevant to the Committee’s work. To assist us in understanding the business and the risks associated with it, I and other members of the Committee visited a number of the Group’s sites during the year and met members of the Investment Management team to discuss matters relevant to the Committee. These visits and meetings, together with the reports we receive throughout the year, supported the effective operation of the Committee. The key area of focus for the Committee for the year under review was to monitor the principal changes to the Code which extended the Board’s responsibilities to confirm that it has undertaken a robust assessment of the principal risks facing the Company, including those that would threaten the Group’s business model, future performance, solvency and liquidity; to provide a statement of the longer-term prospects and viability of the Group; and also to monitor the Company’s risk management and internal control systems on a continuing basis. I believe that the Committee has supported the Board well in relation to these additional requirements being reported on for the first time in this Annual Report and Accounts. Committee attendance during the period We meet formally as a committee at least three times a year. For the period under review, we have held five meetings and our attendance is shown in this table. Member Attendance Simon Radford 4/5 Mark McNicholas 5/5 Charlotte Valeur 4/5 Crestbridge Fund Administrators Ltd attends all our meetings as Secretary to the Committee. In addition, we invite William McMorrow, Mary Ricks, other representatives of the Investment Manager and its investment advisors, our Board apprentice and our external auditors to attend as required. The Committee’s terms of reference Our full terms of reference, explaining our role and the authority delegated to us by the Board, are available on the KWE website. The Committee’s purpose Our primary purpose is: • to monitor the integrity of the Company’s financial reporting and review its financial results • to consider the appointment, independence and remuneration of the auditors and • to undertake regular reviews of the assurance reports related to key control and risk procedures adopted by the Group. Accordingly, the Audit Committee also serves the role of a risk committee. Beyond our primary function, we also undertake the following principal duties: • to discuss and agree with the external auditors the nature and scope of the audit • to keep under review the scope, results and cost effectiveness of the audit and the independence and objectivity of the auditors • to review the external auditors’ letter of engagement and management representation letters and make recommendations to the Board • to evaluate the need for an internal audit function and • to review the scope and effectiveness of the key internal control and compliance procedures and risk management systems. The Committee’s other responsibilities In addition to our principal duties, we are responsible for: • assessing the effectiveness of the Company’s financial reporting procedures and • reviewing the adequacy and soundness of procedures adopted by the Company for preventing and detecting fraud, and the adequacy and soundness of the Company’s systems and controls for the prevention of bribery and anti- money laundering. The Committee’s focus during the period During the year, we discussed the following main matters at our meetings: • the detailed review of the content, tone and format of the annual and half-year press releases, financial reports (including the annual report and accounts), as well as the quarterly business updates released by the Company, and making recommendations to the Board for approval • the review and approval of the annual audit plan of the external auditor, and approval of the fee for the external audit • discussion of reports from the external auditor following their audit • the assessment of the effectiveness of the external audit process, as described below • the review and consideration of the report on the formal external risk assessment of the Group’s key risks; the principal risks and uncertainties facing the Company are set out on pages 32 to 36 Kennedy Wilson Europe Real Estate Plc / Annual Report and Accounts 201570 Audit Committee report
• the commissioning and review of the report on the adequacy of the procedures and protocols in place for the appointment and retention of key third party service providers to the Group • the need for an internal audit function specific to the Company • the Company’s tax framework, structure and risks • the appointment of third party valuers, the valuation methodology adopted and approval of the valuation reports • the regulatory solvency requirements relating to the declaration and payment of quarterly dividends and • reporting to the Board on how the Committee has discharged its responsibilities. Financial reporting and significant judgements A detailed review of the Group’s financial reporting processes is set out on page 69. During the period under review, we monitored the integrity of the financial information published in the interim and annual consolidated financial statements as well as quarterly updates and considered the extent to which suitable accounting policies have been adopted, presented and disclosed. In making our assessment, the Audit Committee received and considered reports from the Investment Manager, the audit strategy and focus of the external auditors and the methodology adopted by our external valuers. Taking into account information from these activities, we considered whether the Investment Manager had made suitable and appropriate estimates and judgements. In addition, we assessed the independence, objectivity and competence of our valuers. As the valuation of the Group’s portfolio is fundamental to the Group’s balance sheet, the Audit Committee invited the independent valuers along with our auditors to discuss the valuations included within the annual consolidated financial statements. This included a rigorous review of the valuation process undertaken, changes in market conditions and recent transactions in the market and how these have impacted upon the third party valuations. It also included valuation movements on individual properties and the independent valuers’ expectations in relation to future rental growth and yield movement, as well as the potential impact of the British referendum on EU membership on the Group’s UK portfolio. At the same time, it challenged the assumptions and judgements made by the valuers. The external auditors had discussions with the independent valuers separately from the Audit Committee, using real estate specialists where appropriate, and have provided the Audit Committee with a summary of their review as part of their report on the half-year and full-year results. For details of the Group’s properties and related accounting policies see notes 3, 5, 17, 18, and 19 of the consolidated financial statements. For the year ended 31 December 2015, the Audit Committee also specifically reviewed the calculation of the performance fee and agreed that the accounting treatment of the performance fee to be paid to the Investment Manager as included within the share-based payments reserve was appropriate and consistent with the relevant accounting standards applicable to the Group. Fair, balanced and understandable (FBU) The production and the audit of the Company’s Annual Report and Accounts is a comprehensive process requiring input from a number of different contributors. In order to reach a conclusion on whether the Company’s Annual Report and Accounts, taken as a whole, is fair, balanced and understandable, as required under the Code, the Board requested that we advise on whether we consider that the Annual Report and Accounts fulfils these requirements. In giving our advice, we have considered the following: • the comprehensive documentation that is in place outlining the controls in place for the production of the Annual Report and Accounts, including the verification processes in place to confirm the factual content and • the detailed reviews undertaken at various stages of the production process by the Investment Manager, Administrator, auditors and ourselves, that are intended to ensure consistency, accuracy and truthfulness of content, and overall balance in presentation. As a result of the work performed, we have concluded and reported to the Board that, in our view, the Annual Report and Accounts for the year ended 31 December 2015, taken as a whole, is fair, balanced and understandable and provides the information necessary for our shareholders to assess the Company’s position and performance, business model and strategy. The Board’s conclusions in this respect are set out in the Directors’ statements on page 59. Viability statement Recent revisions to the UK Corporate Governance Code introduced a new requirement for the Directors: taking account of the Company’s current position and principal risks, to explain how they have assessed the prospects of the Company, over what period they have done so and why they consider that period to be appropriate; and to state whether they have a reasonable expectation that the Company will be able to continue in operation over the period of their assessment, drawing attention to any qualifications and assumptions as necessary. This process requires the Directors to take into account their robust, systematic assessment of the Group’s principal risks (as referred to on page 32 to 36) and the Company’s resilience to the threats to its viability posed by those risks in severe but plausible scenarios. These have been considered within the timeframe of three years which aligns with our viability statement contained in the Directors’ statements on page 59. To enable it to support the Board in its preparation of the viability statement, the Committee spent time, at a formal meeting and two working group sessions, reviewing information provided by the Investment Manager. At its December meeting, the Committee considered and provided input into the determination of which of the Group’s principal risks and combinations thereof might have an impact on the Group’s liquidity and solvency, its business model and future performance. At its January 2016 meeting, the Committee reviewed the results of management’s scenario modelling and stress tests of key sensitivities. The viability statement can be found on page 59. Strategic report G overn an ce Financials A dditional inform ation Kennedy Wilson Europe Real Estate Plc / Annual Report and Accounts 2015 71

Risk review and internal control A detailed review of the Group’s risk management cycle and framework is set out on pages 32 to 36. The Audit Committee has reviewed the Company’s risk management framework and its policies for preventing or detecting fraud, and is satisfied that the Company has systems and procedures in place to safeguard compliance with relevant regulatory and legal requirements. The Audit Committee has overseen the external risk assessment of the third party service provider engagement protocols in place at the Investment Manager and the Company. This process involved the Audit Committee authorising the scope of work and fee proposal, giving interviews to provide independent feedback and assisting with the preparation of the assessment report and participating in ad hoc sessions discussing draft findings in the report. A final report has since been submitted with the results and recommendations. Further details are set out in the Management Engagement Committee report on pages 74 to 75. In addition, the Company engaged a leading risk and business consulting firm to undertake a comprehensive risk assessment and evaluation of the principal inherent risks facing the Group and developing a strategic assessment plan representative of the Company’s specific business, strategic objectives and risk profile. Many of these areas of high inherent risk identified under the assessment are aligned to the risks identified by the Board in the Group’s risk register and also articulated in the Group’s public disclosure documents. Given the nature of the high inherent risks identified, it was noted that the Board is in a position to influence the Group’s net exposure to these risks through its governance, oversight of the Investment Manager and adopting a robust internal control structure. The final results of the risk assessment exercise have since been used to update the Group’s risk register. A description of the principal risks and uncertainties facing the Group is set out on pages 32 to 36. The proposed strategic assessment plan for the next 18 months recognises differing types/ levels of review based on the importance and perceived risk to the Group and preliminary insight into control maturity, and identifies certain strategic assessment projects such as regulatory compliance and, data governance and reporting. The Committee agrees with the inherent risk findings and intends to authorise the proposed strategic assessment projects that, in the Committee’s view, signify an appropriate level of assessment for the Group given its current size, operations, maturity and growth strategies over the next 18 months. Internal audit During the year under review, the Board discussed and considered the need for a formal internal audit function. The Board reviewed the Company’s operating model and, in particular, the external management structure which it has put in place to manage the Company. After deliberation and consideration of the brief period of operation of the Company, and weighing the costs of an internal audit function against the current needs of the business, and taking into account the role the Investment Manager Group can play in assessing and evaluating current business risks, an internal audit function specific to the Company was considered by the Audit Committee to be unnecessary at this point in the Company’s life. However, as the Company matures, a regular discussion on an annual basis, in accordance with the Code should take place, with input from the Audit Committee. The Board also noted that it was open to the Audit Committee to appoint external advisors to undertake individual assessment projects on specific risk areas where it was felt that this was necessary or where in its view the Investment Manager was conflicted. External audit KPMG provides audit services to the Group and has been the Company’s auditor since its incorporation in 2013. The Annual Report and Accounts have been prepared in accordance with IFRS as adopted by the EU. Since the fees charged by our external auditor will depend on the services provided and the time spent by our auditor on the affairs of the Group, there is no maximum amount payable to the auditor, although the Board continually keeps the auditor’s fees under review and benchmarks against the fees paid by its peers. KPMG was re-appointed as external auditor to the Company at the AGM held in 2015 and is recommended by the Audit Committee and the Board for re-appointment in 2016. No formal tender process was initiated in connection with KPMG’s first appointment in 2013, since it was considered at that time that KPMG’s knowledge of the Investment Manager Group made it the most suitable candidate for the role. KPMG continues to provide audit services to the Investment Manager Group. To maintain audit quality and provide comfort on the integrity of financial reporting, we reviewed, challenged and approved the annual audit plan of our external auditor. We ensured that the audit work focused on matters we considered to be important, by virtue of their size, potential impact, complexity and level of judgement. We are responsible for the evaluation of our external auditors and for communicating the results of this evaluation to the Board. In doing so we considered a range of factors including the quality of service, our external auditor’s specialist expertise, the level of audit fee, and independence. We have evaluated the work completed by our external auditor in the year to 31 December 2015, taking into account the fees paid to KPMG, and are satisfied with their effectiveness, objectivity and their independence. We do not consider it necessary to require our external auditor to tender for the audit work at this time, although we will review this matter annually and any recommendation to re-appoint the auditor will be subject to continued satisfactory performance. As KPMG also provides audit services to the Investment Manager Group, the Committee discussed whether there were any rules in the US (applicable to the ultimate parent of the Investment Manager) that provided for re-tendering for audit services and the time frame for that, and noted the US rules required a rotation of the audit partner every five years but there was no requirement to change the auditor. Non-audit services Following EU rules (to be implemented from June 2016) and investor feedback on the auditor appointment resolution at the AGM in 2015, the Committee has taken serious note of the levels of certain non-audit fees in the Group, and has implemented a non-audit services policy to ensure auditor objectivity and independence are safeguarded. These services include any financial and tax due diligence as well as tax structuring undertaken on any new investments; overall tax structuring for the Group; tax compliance services (ongoing and ad hoc); and any other matters that would customarily be within the scope of non-audit services (such as audit related assurance services). Kennedy Wilson Europe Real Estate Plc / Annual Report and Accounts 201572 Audit Committee report continued
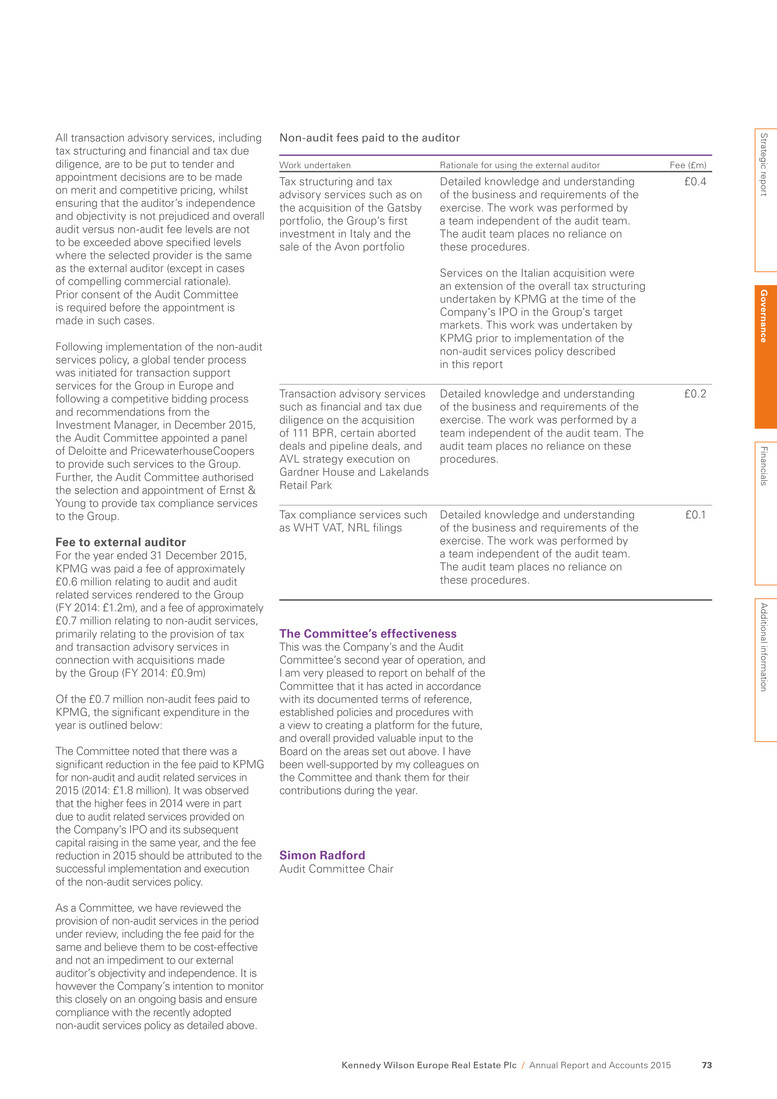
All transaction advisory services, including tax structuring and financial and tax due diligence, are to be put to tender and appointment decisions are to be made on merit and competitive pricing, whilst ensuring that the auditor’s independence and objectivity is not prejudiced and overall audit versus non-audit fee levels are not to be exceeded above specified levels where the selected provider is the same as the external auditor (except in cases of compelling commercial rationale). Prior consent of the Audit Committee is required before the appointment is made in such cases. Following implementation of the non-audit services policy, a global tender process was initiated for transaction support services for the Group in Europe and following a competitive bidding process and recommendations from the Investment Manager, in December 2015, the Audit Committee appointed a panel of Deloitte and PricewaterhouseCoopers to provide such services to the Group. Further, the Audit Committee authorised the selection and appointment of Ernst & Young to provide tax compliance services to the Group. Fee to external auditor For the year ended 31 December 2015, KPMG was paid a fee of approximately £0.6 million relating to audit and audit related services rendered to the Group (FY 2014: £1.2m), and a fee of approximately £0.7 million relating to non-audit services, primarily relating to the provision of tax and transaction advisory services in connection with acquisitions made by the Group (FY 2014: £0.9m) Of the £0.7 million non-audit fees paid to KPMG, the significant expenditure in the year is outlined below: The Committee noted that there was a significant reduction in the fee paid to KPMG for non-audit and audit related services in 2015 (2014: £1.8 million). It was observed that the higher fees in 2014 were in part due to audit related services provided on the Company’s IPO and its subsequent capital raising in the same year, and the fee reduction in 2015 should be attributed to the successful implementation and execution of the non-audit services policy. As a Committee, we have reviewed the provision of non-audit services in the period under review, including the fee paid for the same and believe them to be cost-effective and not an impediment to our external auditor’s objectivity and independence. It is however the Company’s intention to monitor this closely on an ongoing basis and ensure compliance with the recently adopted non-audit services policy as detailed above. Non-audit fees paid to the auditor Work undertaken Rationale for using the external auditor Fee (£m) Tax structuring and tax advisory services such as on the acquisition of the Gatsby portfolio, the Group’s first investment in Italy and the sale of the Avon portfolio Detailed knowledge and understanding of the business and requirements of the exercise. The work was performed by a team independent of the audit team. The audit team places no reliance on these procedures. Services on the Italian acquisition were an extension of the overall tax structuring undertaken by KPMG at the time of the Company’s IPO in the Group’s target markets. This work was undertaken by KPMG prior to implementation of the non-audit services policy described in this report £0.4 Transaction advisory services such as financial and tax due diligence on the acquisition of 111 BPR, certain aborted deals and pipeline deals, and AVL strategy execution on Gardner House and Lakelands Retail Park Detailed knowledge and understanding of the business and requirements of the exercise. The work was performed by a team independent of the audit team. The audit team places no reliance on these procedures. £0.2 Tax compliance services such as WHT VAT, NRL filings Detailed knowledge and understanding of the business and requirements of the exercise. The work was performed by a team independent of the audit team. The audit team places no reliance on these procedures. £0.1 The Committee’s effectiveness This was the Company’s and the Audit Committee’s second year of operation, and I am very pleased to report on behalf of the Committee that it has acted in accordance with its documented terms of reference, established policies and procedures with a view to creating a platform for the future, and overall provided valuable input to the Board on the areas set out above. I have been well-supported by my colleagues on the Committee and thank them for their contributions during the year. Simon Radford Audit Committee Chair Strategic report G overn an ce Financials A dditional inform ation Kennedy Wilson Europe Real Estate Plc / Annual Report and Accounts 2015 73
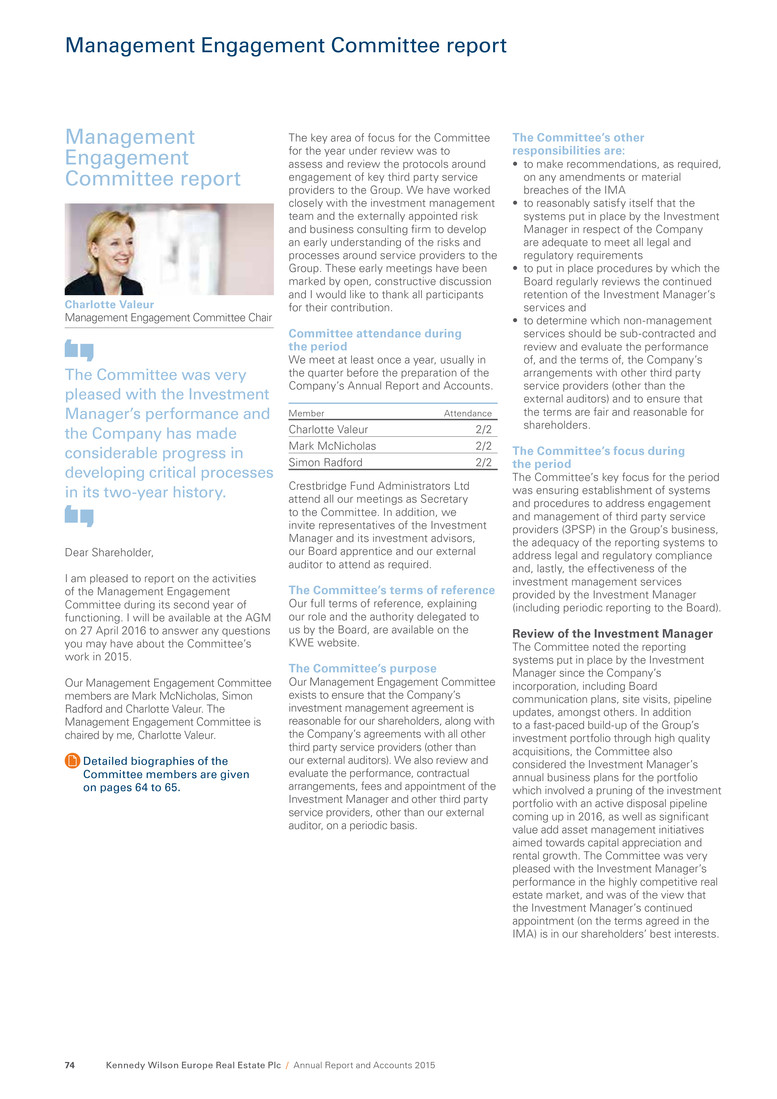
Management Engagement Committee report Charlotte Valeur Management Engagement Committee Chair The Committee was very pleased with the Investment Manager’s performance and the Company has made considerable progress in developing critical processes in its two-year history. Dear Shareholder, I am pleased to report on the activities of the Management Engagement Committee during its second year of functioning. I will be available at the AGM on 27 April 2016 to answer any questions you may have about the Committee’s work in 2015. Our Management Engagement Committee members are Mark McNicholas, Simon Radford and Charlotte Valeur. The Management Engagement Committee is chaired by me, Charlotte Valeur. Detailed biographies of the Committee members are given on pages 64 to 65. The key area of focus for the Committee for the year under review was to assess and review the protocols around engagement of key third party service providers to the Group. We have worked closely with the investment management team and the externally appointed risk and business consulting firm to develop an early understanding of the risks and processes around service providers to the Group. These early meetings have been marked by open, constructive discussion and I would like to thank all participants for their contribution. Committee attendance during the period We meet at least once a year, usually in the quarter before the preparation of the Company’s Annual Report and Accounts. Member Attendance Charlotte Valeur 2/2 Mark McNicholas 2/2 Simon Radford 2/2 Crestbridge Fund Administrators Ltd attend all our meetings as Secretary to the Committee. In addition, we invite representatives of the Investment Manager and its investment advisors, our Board apprentice and our external auditor to attend as required. The Committee’s terms of reference Our full terms of reference, explaining our role and the authority delegated to us by the Board, are available on the KWE website. The Committee’s purpose Our Management Engagement Committee exists to ensure that the Company’s investment management agreement is reasonable for our shareholders, along with the Company’s agreements with all other third party service providers (other than our external auditors). We also review and evaluate the performance, contractual arrangements, fees and appointment of the Investment Manager and other third party service providers, other than our external auditor, on a periodic basis. The Committee’s other responsibilities are: • to make recommendations, as required, on any amendments or material breaches of the IMA • to reasonably satisfy itself that the systems put in place by the Investment Manager in respect of the Company are adequate to meet all legal and regulatory requirements • to put in place procedures by which the Board regularly reviews the continued retention of the Investment Manager’s services and • to determine which non-management services should be sub-contracted and review and evaluate the performance of, and the terms of, the Company’s arrangements with other third party service providers (other than the external auditors) and to ensure that the terms are fair and reasonable for shareholders. The Committee’s focus during the period The Committee’s key focus for the period was ensuring establishment of systems and procedures to address engagement and management of third party service providers (3PSP) in the Group’s business, the adequacy of the reporting systems to address legal and regulatory compliance and, lastly, the effectiveness of the investment management services provided by the Investment Manager (including periodic reporting to the Board). Review of the Investment Manager The Committee noted the reporting systems put in place by the Investment Manager since the Company’s incorporation, including Board communication plans, site visits, pipeline updates, amongst others. In addition to a fast-paced build-up of the Group’s investment portfolio through high quality acquisitions, the Committee also considered the Investment Manager’s annual business plans for the portfolio which involved a pruning of the investment portfolio with an active disposal pipeline coming up in 2016, as well as significant value add asset management initiatives aimed towards capital appreciation and rental growth. The Committee was very pleased with the Investment Manager’s performance in the highly competitive real estate market, and was of the view that the Investment Manager’s continued appointment (on the terms agreed in the IMA) is in our shareholders’ best interests. Kennedy Wilson Europe Real Estate Plc / Annual Report and Accounts 201574 Management Engagement Committee report
Evaluation of key third party service providers Consistent with other equivalent externally managed investment companies, the Committee is cognisant of the fact that the Company is dependent on the involvement of third party service providers (3PSP) in all aspects of its business operations. With no direct employees of the Company and externally managed by the Investment Manager, the delegation of activities to 3PSPs represented one of the significant costs to the Company (in addition to acquisitions) enabling the Company to draw on the expertise of such providers in delivering its strategy to its investors. Whereas the most critical delegation of services, being investment management services, is to the Investment Manager, the Company also appoints other key service providers in relation to acquisitions/disposals, asset management, development projects and general administrative operations and other ongoing operations services. In 2015, the Company engaged an external risk and business consulting firm to undertake a high level review of the Company’s 3PSP control environment and management of oversight risk. The review spanned areas of adequacy of governance, existence of risk-based policies and procedures governing the 3PSP process, selection and due diligence, execution of service contracts with clearly defined terms, conditions and service provisions including appropriate contract approvals, performance monitoring and lastly exit and transition planning. The Committee noted the results of evaluation and is of the view that the Company and the Investment Manager (through its management team) had made considerable progress in developing critical processes and baseline controls over the end to end 3PSP processes in the limited two-year operating history. The existing framework is adequately supported by policies and procedures, employee training and management reporting which allows the Board to have visibility over the delegation function and related risks, and certain of the recommendations from the external report add to the robustness of the existing approvals framework. The Committee also noted, that following discussions with the investment management team, it was evident that there is a strong control consciousness amongst those who play a key day-to-day role in managing 3PSP relationships and activities on behalf of the Company and this was key towards mitigating any risks arising out of 3PSP engagement and management. Legal and regulatory compliance Separately, the Committee also considered the adequacy and robustness of systems put in place by the Investment Manager in respect of the Company to satisfy itself that they are adequate to meet all its legal and regulatory requirements, and was satisfied with the reporting systems on this front covering Jersey, UK, Ireland, Luxembourg, Spain and more recently, Italy. The Committee’s effectiveness This was the Company’s and the Management Engagement Committee’s second year of operation, and I am very pleased to report on behalf of the Committee that it has acted in accordance with its documented terms of reference, established policies and procedures with a view to creating a platform for the future, and overall provided valuable input to the Board on the areas set out above. The Investment Manager and other key service providers were functioning effectively and there were robust systems, policies and procedures in place to support a strong governance framework expected of the Company by its stakeholders. Charlotte Valeur Management Engagement Committee Chair Strategic report Govern an ce Financials A dditional inform ation Kennedy Wilson Europe Real Estate Plc / Annual Report and Accounts 2015 75
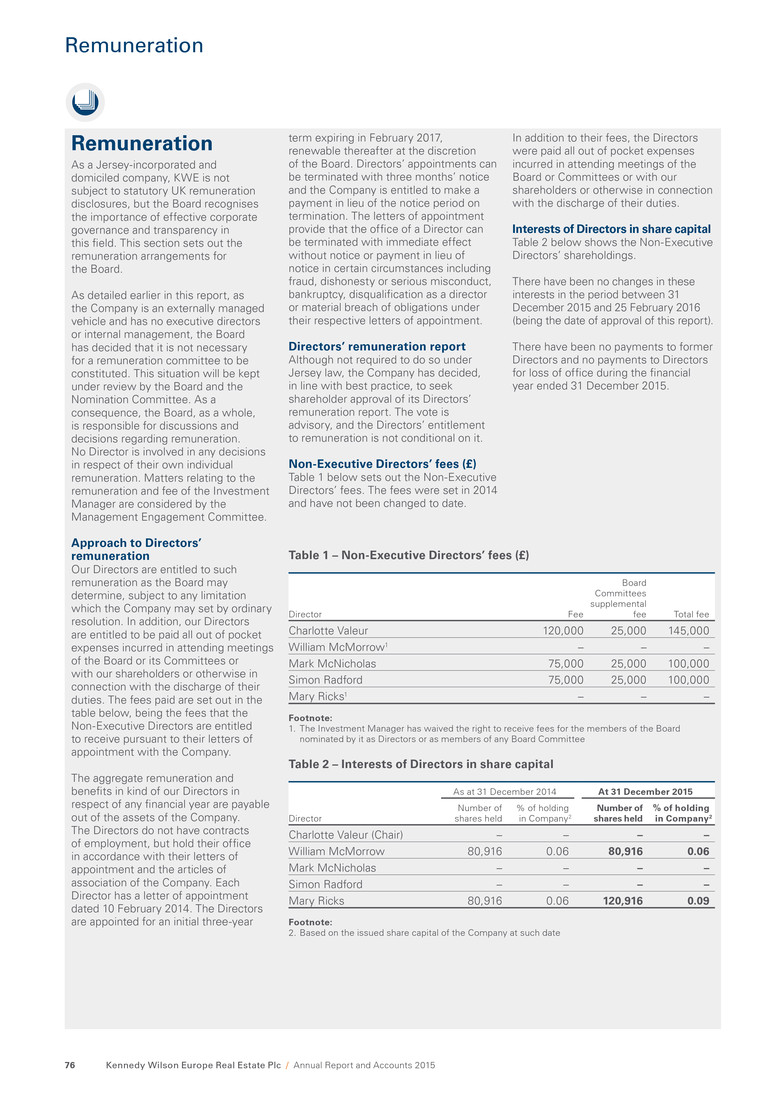
Table 1 – Non-Executive Directors’ fees (£) Director Fee Board Committees supplemental fee Total fee Charlotte Valeur 120,000 25,000 145,000 William McMorrow1 – – – Mark McNicholas 75,000 25,000 100,000 Simon Radford 75,000 25,000 100,000 Mary Ricks1 – – – Footnote: 1. The Investment Manager has waived the right to receive fees for the members of the Board nominated by it as Directors or as members of any Board Committee Table 2 – Interests of Directors in share capital Director As at 31 December 2014 At 31 December 2015 Number of shares held % of holding in Company2 Number of shares held % of holding in Company2 Charlotte Valeur (Chair) – – – – William McMorrow 80,916 0.06 80,916 0.06 Mark McNicholas – – – – Simon Radford – – – – Mary Ricks 80,916 0.06 120,916 0.09 Footnote: 2. Based on the issued share capital of the Company at such date Remuneration As a Jersey-incorporated and domiciled company, KWE is not subject to statutory UK remuneration disclosures, but the Board recognises the importance of effective corporate governance and transparency in this field. This section sets out the remuneration arrangements for the Board. As detailed earlier in this report, as the Company is an externally managed vehicle and has no executive directors or internal management, the Board has decided that it is not necessary for a remuneration committee to be constituted. This situation will be kept under review by the Board and the Nomination Committee. As a consequence, the Board, as a whole, is responsible for discussions and decisions regarding remuneration. No Director is involved in any decisions in respect of their own individual remuneration. Matters relating to the remuneration and fee of the Investment Manager are considered by the Management Engagement Committee. Approach to Directors’ remuneration Our Directors are entitled to such remuneration as the Board may determine, subject to any limitation which the Company may set by ordinary resolution. In addition, our Directors are entitled to be paid all out of pocket expenses incurred in attending meetings of the Board or its Committees or with our shareholders or otherwise in connection with the discharge of their duties. The fees paid are set out in the table below, being the fees that the Non-Executive Directors are entitled to receive pursuant to their letters of appointment with the Company. The aggregate remuneration and benefits in kind of our Directors in respect of any financial year are payable out of the assets of the Company. The Directors do not have contracts of employment, but hold their office in accordance with their letters of appointment and the articles of association of the Company. Each Director has a letter of appointment dated 10 February 2014. The Directors are appointed for an initial three-year term expiring in February 2017, renewable thereafter at the discretion of the Board. Directors’ appointments can be terminated with three months’ notice and the Company is entitled to make a payment in lieu of the notice period on termination. The letters of appointment provide that the office of a Director can be terminated with immediate effect without notice or payment in lieu of notice in certain circumstances including fraud, dishonesty or serious misconduct, bankruptcy, disqualification as a director or material breach of obligations under their respective letters of appointment. Directors’ remuneration report Although not required to do so under Jersey law, the Company has decided, in line with best practice, to seek shareholder approval of its Directors’ remuneration report. The vote is advisory, and the Directors’ entitlement to remuneration is not conditional on it. Non-Executive Directors’ fees (£) Table 1 below sets out the Non-Executive Directors’ fees. The fees were set in 2014 and have not been changed to date. In addition to their fees, the Directors were paid all out of pocket expenses incurred in attending meetings of the Board or Committees or with our shareholders or otherwise in connection with the discharge of their duties. Interests of Directors in share capital Table 2 below shows the Non-Executive Directors’ shareholdings. There have been no changes in these interests in the period between 31 December 2015 and 25 February 2016 (being the date of approval of this report). There have been no payments to former Directors and no payments to Directors for loss of office during the financial year ended 31 December 2015. Kennedy Wilson Europe Real Estate Plc / Annual Report and Accounts 201576 Remuneration
Relations with shareholders The Board is committed to communicating regularly with our shareholders. We aim to help our investors achieve a clear understanding of the Group’s strategy and to ensure their feedback is understood and examined by the Board. We attach significant importance to the effectiveness of our communications with all of our shareholders and set ourselves the target of providing information that is timely, clear and concise. The Group has an Investor Relations team led by the Investor Relations Director who reports to Mary Ricks (in her capacity as CEO and President of Kennedy Wilson Europe and a Director on the Board of the Investment Manager and the Board). The investor relations team has been in direct contact with more than 75% of the Group’s share register over the course of the year. The feedback from this level of regular interaction is communicated to the Board through updates to the Chair and the other Non-Executive Directors by way of presentations to the Board which include, amongst other things, share price performance, peer group comparison of relevant metrics, the composition of the shareholder register, feedback from investor meetings, including key questions asked, and recommendations and expectations from sell-side analysts. During the year the Board received regular insight into shareholder perception of KWE’s shares through detailed market updates from our corporate brokers. As market awareness about the Kennedy Wilson brand in Europe increased through the Group’s activities and successful performance in its second year of operation, a visible increase in investor appetite was beginning to emerge and this is expected to result in further diversification of the shareholder base of the Company. The Board as a whole is informed on a regular basis about the views of key stakeholders, including their concerns and feedback, along with any new analyst research. We communicate with existing and target shareholders and analysts throughout the year by various means, which has been structured in the following way: • Regular meetings with key shareholders • Face-to-face presentations of full-year and half-year results where the Investment Manager and its senior management team were available for discussions • Telephone briefings for shareholders and analysts • Participation in industry conferences • Live and post-event webcasts of key presentations • Investor meetings with existing and target shareholders • Investor days, briefings and ad hoc meetings on request, where permitted by calendar and regulatory requirements • Conducted tours of the Group’s key sites for shareholders and analysts • Presentations with bank sales teams • Notification of key financial calendar information • Notification of the provision of live webcasting services for key presentations and • Notification of availability of past key presentations via our corporate website. In February 2015, Mark McNicholas was appointed SID and, along with the Chair, is available to address concerns that investors may wish to raise, in addition to channels of contact through the Investment Manager and the investor relations team. The Group’s corporate website is an important source of information to analysts and investors and through it we aim to give all our stakeholders full access to material information. Presentations made following announcement of the Group’s financial results and other ad hoc presentations are immediately made available on the website to ensure full transparency. In addition, the market is kept informed of the Company’s progress through results statements and other announcements released through the website of the London Stock Exchange. Existing and prospective equity and debt investors as well as analysts can raise queries directly with the Company at any time through the investor relations email address provided on the website. The entire Board attends the Company’s AGM which provides a forum for communication with all sizes of shareholders. The Annual Report and Accounts is sent to all shareholders at least 20 working days before the AGM, together with the Notice of Meeting, which includes details of the resolutions to be proposed at the AGM. Details of the outcome of the AGM resolutions are posted on our corporate website at www.kennedywilson.eu and announced to the market following the meeting. AGM 2015 – Feedback from shareholders and proxy advisors The Board observed that the feedback detailed in the proxy advisor reports in connection with the AGM held in 2015 was positive on the whole; however two common issues had been identified by investors: • the level of audit fees versus non- audit fees incurred by the Group and • the absence of a remuneration policy. In relation to the level of non-audit fees, it was noted that this issue had been discussed at length by the Audit Committee throughout the year and a non-audit services policy had been specifically implemented to address this. For further details, see page 72 of the Audit Committee report. With regard to the remuneration policy, the Board had again considered this and it was of the view, as a Jersey- incorporated and externally managed vehicle, and taking into account the fact that the Company has no executive directors or internal senior management and the Investment Manager director representatives on the Board having waived their director fee in entirety, there was no requirement to institute a remuneration policy specific to Directors’ remuneration or constitute a remuneration committee. Matters relating to the remuneration of the Investment Manager are considered by the Management Engagement Committee. In any event, this situation will be kept under review by the Board and the Nomination Committee. Strategic report G overn an ce Financials A dditional inform ation Kennedy Wilson Europe Real Estate Plc / Annual Report and Accounts 2015 77 Relations with shareholders

Introduction The Directors are pleased to present their Annual Report and Accounts, including the Company’s audited consolidated financial statements as at, and for the year ended, 31 December 2015. Information contained elsewhere in the Annual Report and Accounts The following information can be found elsewhere in the Annual Report and Accounts as indicated in the table below and is incorporated into this report by reference: Information Pages Post balance sheet events Note 34 on page 141 Likely future developments in the business of the Company or its subsidiaries 12 to 16 and 44 to 45 Directors 64 to 65 Directors’ interests in shares 76 Manager and service providers 61 Fair, Balanced and Understandable statement 59 Going Concern statement 59 Viability statement 59 Statement on review of principal risks 32 to 36 Directors’ statement of responsibilities in respect of the Annual Report and Accounts 81 Statement of disclosure of information to the auditor 82 Share capital Note 28 on pages 135 to 136 Financial instruments: Information on the Group’s financial risk management objectives and policies, and its exposure to credit risk, liquidity risk, interest rate risk and foreign currency risk Note 27 on pages 130 to 134 Management report This Directors’ report together with the Strategic report on pages 1 to 53 would form the Management report for the purposes of DTR 4.1.5 R. Corporate governance statement The information that fulfils the requirements of the Corporate governance statement can be found on pages 55 to 77 (which are incorporated into this Directors’ report by reference), with the exception of the information referred to in DTR 7.2.6, which is located in this Directors’ report. Disclosure of information under LR 9.8.4R The information that fulfils the reporting requirements relating to the following matters can be found on the pages identified. Subject matter Page reference Details of any arrangements under which a director of the Company has waived or agreed to waive any emoluments from the company or any subsidiary undertaking 58, 76 and 77 Details of the IMA, as a contract of significance, subsisting during the period to which the Company is a party and in which a director of the listed company is or was materially interested 152 Results and dividends The financial results for the year ended 31 December 2015 can be found in the consolidated statement of comprehensive income as set out on page 86 and in the financial review as set out on pages 48 to 53. Details of the dividends declared and paid during the financial year ended 31 December 2015 are set out in note 29 on page 136 of the consolidated financial statements. An additional interim dividend of 12 pence per share was declared on 26 February 2016 and will be paid on 31 March to shareholders on the register on 11 March 2016. Political donations No political donations were made during the period under review. Employees The Company has no employees. The Group has no employees (except in certain of its wholly-owned operating subsidiaries) and accordingly, there are no employee share schemes in place. Restrictions on transfer of securities and voting rights in the Company There are no restrictions on the transfer of securities in the Company, save as follows: • Pursuant to the Listing Rules of the Financial Conduct Authority (the Listing Rules) and the Company’s share dealing code, whereby certain individuals (being directors and Investment Manager employees) require approval prior to dealing in the Company’s shares and • Pursuant to the Company’s articles of association, whereby the Board may decline to register a transfer of shares or otherwise impose a restriction on shares to prevent the Company breaching any law or regulation. Except as described in note 31A on pages 137 to 139 to the consolidated financial statements, the Company is not aware of any agreements between holders of securities that may result in restrictions on the transfer of securities in the Company. As at the date of this report, the Company is not aware of any such agreements. There are no restrictions on voting rights of securities in the Company. The Notice of Meeting specifies deadlines for appointing a proxy or proxies to vote in relation to resolutions to be passed at the Annual General Meeting. Securities carrying special rights No person holds securities in the Company carrying special rights with regard to control of the Company. Substantial shareholdings The Company is aware of the following material shareholders shown in Table 1 who were, directly or indirectly, interested in 5% or more of the total voting rights in the Company’s issued share capital: Kennedy Wilson Europe Real Estate Plc / Annual Report and Accounts 201578 Directors’ report
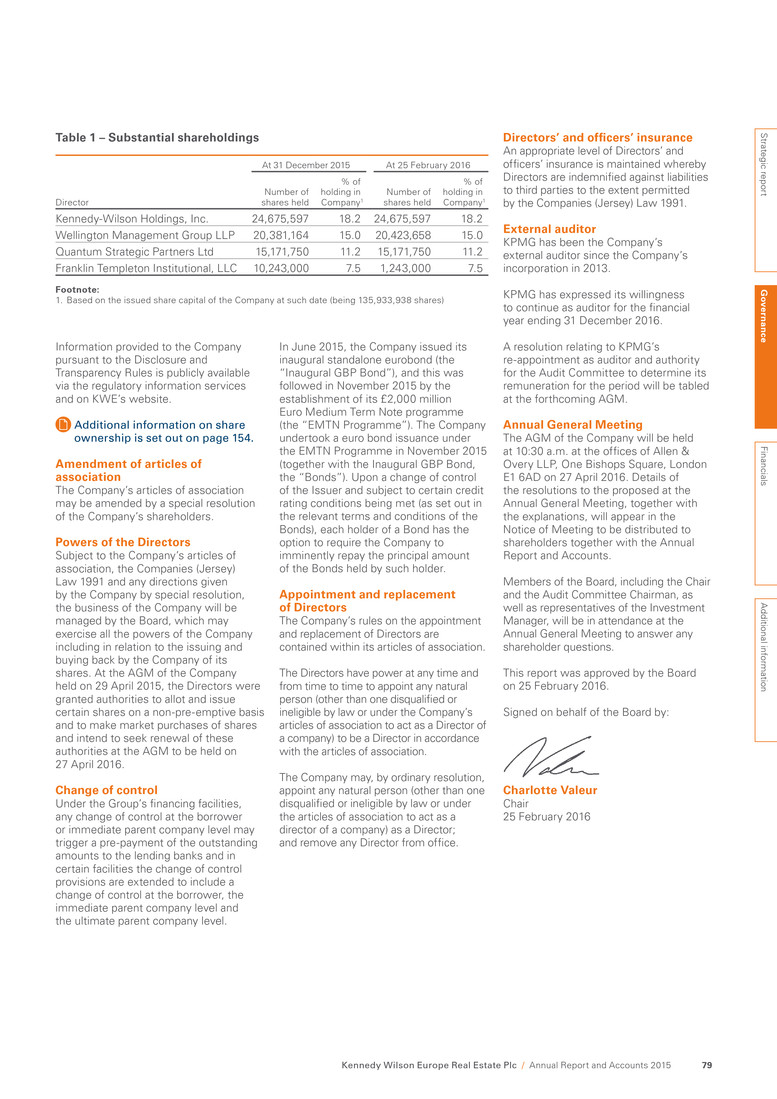
Table 1 – Substantial shareholdings Director At 31 December 2015 At 25 February 2016 Number of shares held % of holding in Company1 Number of shares held % of holding in Company1 Kennedy-Wilson Holdings, Inc. 24,675,597 18.2 24,675,597 18.2 Wellington Management Group LLP 20,381,164 15.0 20,423,658 15.0 Quantum Strategic Partners Ltd 15,171,750 11.2 15,171,750 11.2 Franklin Templeton Institutional, LLC 10,243,000 7.5 1,243,000 7.5 Footnote: 1. Based on the issued share capital of the Company at such date (being 135,933,938 shares) In June 2015, the Company issued its inaugural standalone eurobond (the “Inaugural GBP Bond”), and this was followed in November 2015 by the establishment of its £2,000 million Euro Medium Term Note programme (the “EMTN Programme”). The Company undertook a euro bond issuance under the EMTN Programme in November 2015 (together with the Inaugural GBP Bond, the “Bonds”). Upon a change of control of the Issuer and subject to certain credit rating conditions being met (as set out in the relevant terms and conditions of the Bonds), each holder of a Bond has the option to require the Company to imminently repay the principal amount of the Bonds held by such holder. Appointment and replacement of Directors The Company’s rules on the appointment and replacement of Directors are contained within its articles of association. The Directors have power at any time and from time to time to appoint any natural person (other than one disqualified or ineligible by law or under the Company’s articles of association to act as a Director of a company) to be a Director in accordance with the articles of association. The Company may, by ordinary resolution, appoint any natural person (other than one disqualified or ineligible by law or under the articles of association to act as a director of a company) as a Director; and remove any Director from office. Directors’ and officers’ insurance An appropriate level of Directors’ and officers’ insurance is maintained whereby Directors are indemnified against liabilities to third parties to the extent permitted by the Companies (Jersey) Law 1991. External auditor KPMG has been the Company’s external auditor since the Company’s incorporation in 2013. KPMG has expressed its willingness to continue as auditor for the financial year ending 31 December 2016. A resolution relating to KPMG’s re-appointment as auditor and authority for the Audit Committee to determine its remuneration for the period will be tabled at the forthcoming AGM. Annual General Meeting The AGM of the Company will be held at 10:30 a.m. at the offices of Allen & Overy LLP, One Bishops Square, London E1 6AD on 27 April 2016. Details of the resolutions to the proposed at the Annual General Meeting, together with the explanations, will appear in the Notice of Meeting to be distributed to shareholders together with the Annual Report and Accounts. Members of the Board, including the Chair and the Audit Committee Chairman, as well as representatives of the Investment Manager, will be in attendance at the Annual General Meeting to answer any shareholder questions. This report was approved by the Board on 25 February 2016. Signed on behalf of the Board by: Charlotte Valeur Chair 25 February 2016 Information provided to the Company pursuant to the Disclosure and Transparency Rules is publicly available via the regulatory information services and on KWE’s website. Additional information on share ownership is set out on page 154. Amendment of articles of association The Company’s articles of association may be amended by a special resolution of the Company’s shareholders. Powers of the Directors Subject to the Company’s articles of association, the Companies (Jersey) Law 1991 and any directions given by the Company by special resolution, the business of the Company will be managed by the Board, which may exercise all the powers of the Company including in relation to the issuing and buying back by the Company of its shares. At the AGM of the Company held on 29 April 2015, the Directors were granted authorities to allot and issue certain shares on a non-pre-emptive basis and to make market purchases of shares and intend to seek renewal of these authorities at the AGM to be held on 27 April 2016. Change of control Under the Group’s financing facilities, any change of control at the borrower or immediate parent company level may trigger a pre-payment of the outstanding amounts to the lending banks and in certain facilities the change of control provisions are extended to include a change of control at the borrower, the immediate parent company level and the ultimate parent company level. Strategic report G overn an ce Financials A dditional inform ation Kennedy Wilson Europe Real Estate Plc / Annual Report and Accounts 2015 79
Leavesden Park, Watford, UK Part of the South East office portfolio acquired in July 2015 Kennedy Wilson Europe Real Estate Plc / Annual Report and Accounts 201580 Financials 81 Statement of Directors’ responsibilities 82 Independent audit report 85 Consolidated income statement 86 Consolidated statement of comprehensive income 87 Consolidated balance sheet 88 Consolidated statement of changes in equity 90 Consolidated cash flow statement 92 Notes to the consolidated financial statements

Introduction The Directors, whose names are set out on pages 64 to 65, are responsible for preparing the Annual Report and the consolidated financial statements in accordance with applicable law and regulations. Company law requires the Directors to prepare the consolidated financial statements for each financial year. The consolidated financial statements have been prepared in accordance with International Financial Reporting Standards (IFRS) as adopted by the European Union. Under the Companies (Jersey) Law 1991, the Directors must not approve the consolidated financial statements unless they are satisfied that, to the best of their knowledge, they give a true and fair view of, or are presented fairly in all material respects so as to show, the Group’s profit or loss for the financial period and the state of affairs of the Group as at the end of that period. In preparing the financial statements, the Directors are required to: • present fairly the financial position, the financial performance and cash flows of the Group; • select suitable accounting policies and then apply them consistently; • present information, including accounting policies, in a manner that provides relevant, reliable, comparable and understandable information; • make judgements and estimates that are reasonable and prudent; • provide additional disclosures when compliance with specific requirements in IFRS is insufficient to enable users to understand the impact of particular transactions, other events and conditions on the Group’s financial position and financial performance; • for the consolidated financial statements, state whether they have been prepared in accordance with IFRS; and • prepare the consolidated financial statements on the going concern basis unless it is inappropriate to presume that the Group will continue in business. The Directors are responsible for keeping adequate accounting records that are sufficient to show and explain the Group’s transactions and disclose with reasonable accuracy at any time the financial position of the Group and enable them to ensure that its consolidated financial statements comply with the provision of the Companies (Jersey) Law 1991 and Article 4 of the IAS Regulation. They also have a general responsibility for taking such steps as are reasonably open to them to safeguard the assets of the Group and hence for taking reasonable steps for the prevention and detection of fraud and other irregularities. The Directors are also responsible for preparing components of the Strategic report, the Directors’ report, and the Corporate governance statement in accordance with applicable regulations, including the requirements of the UK Listing Rules and the Disclosure and Transparency Rules, which can be found at pages 1 to 53, pages 78 to 79 and pages 55 to 77, respectively. Statement of responsibility Pursuant to Rule 4.1.12 of the DTRs, each of the Directors, whose names and functions are listed on pages 64 to 65 of this Annual Report and Accounts, confirm that, to the best of his or her knowledge: • the consolidated financial statements, prepared in accordance with International Financial Reporting Standards (IFRS) as adopted by the European Union, give a true and fair view of the assets, liabilities, financial position and profit or loss of the Company and the undertakings included in the consolidation taken as a whole; and • the Directors’ report, together with the Strategic report, contained in the Annual Report and Accounts, includes a fair review of the development and performance of the business and the position of the Company and the undertakings included in the consolidation taken as a whole, together with a description of the principal risks and uncertainties that they face. Statement of disclosure of information to the auditor Each of the Directors has approved this report and confirmed that, having made requisite enquiries and so far as they are aware, there is no relevant audit information (being information needed by the auditors in connection with preparing their audit report) of which the Company’s auditors are unaware, and the Directors have taken all the steps that they ought to have taken as Directors in order to make themselves aware of any relevant audit information and to establish that the Company’s auditors are aware of that information. Website publication The Directors are responsible for ensuring the Annual Report and Accounts, including the consolidated financial statements, is made available on the Company’s website. The maintenance and integrity of the corporate and financial information included on the Company’s website is the responsibility of the Directors. Legislation in the United Kingdom and Jersey governing the preparation and dissemination of financial statements may vary from legislation in other jurisdictions. Signed on behalf of the Board by: Charlotte Valeur Simon Radford Chair Director 25 February 2016 Strategic report G overnance Fin an cials A dditional inform ation Kennedy Wilson Europe Real Estate Plc / Annual Report and Accounts 2015 81 Statement of Directors’ responsibilities
Independent auditor’s report to the members of Kennedy Wilson Europe Real Estate Plc Opinions and conclusions arising from our audit 1. Our opinion on the financial statements is unmodified We have audited the consolidated financial statements of Kennedy Wilson Europe Real Estate Plc for the year ended 31 December 2015 which comprise the consolidated statement of comprehensive income, the consolidated balance sheet, the consolidated statement of changes in equity, the consolidated cash flow statement and the related accounting policies and notes. Our audit was conducted in accordance with International Standards on Auditing (ISAs) (UK & Ireland). In our opinion: • the consolidated financial statements give a true and fair view of the state of the Group’s affairs as at 31 December 2015 and of its profit for the year then ended; • the consolidated financial statements have been properly prepared in accordance with International Financial Reporting Standards (IFRS) as adopted by the European Union; • the consolidated financial statements have been properly prepared in accordance with the requirements of the Companies (Jersey) Law 1991. 2. Our assessment of risks of material misstatement We designed our audit by determining materiality and assessing the risks of a material misstatement in the financial statements. In particular, we considered areas where the directors were required to make subjective judgments and assumptions and to consider future events that are inherently uncertain. We also addressed the risk of management override of internal controls, including evaluating whether there was evidence of bias in those judgments that created a risk of misstatement due to fraud. The risks of material misstatement detailed in this section of this report are those that we deemed to have had the greatest effect on: the overall audit strategy; the allocation of resources in our audit; and directing the efforts of the engagement team. Our audit procedures relating to these risks were designed in the context of our audit of the financial statements as a whole, and our report is not a complete list of all risks identified by our audit. Our opinion on the financial statements is not modified with respect to any of these risks, and we do not express an opinion on these individual risks. In arriving at our audit opinion above on the consolidated financial statements the risks of material misstatement that had the greatest effect on our group audit was the valuation of the investment property portfolio £2,792.7 million (2014: £1,489.0 million): (i) The risks The valuation of the Group’s investment properties and loans secured by real estate involves significant management judgments particularly those relating to current and expected market conditions. In recent times, macroeconomic conditions in Europe have been characterized by lower growth and inflation expectations, accommodative monetary policies by central banks and generally lower interest rates, all of which have provided a supportive backdrop for many real estate investments. Local market conditions also have a great bearing on real estate valuations and can differ significantly across markets, property types and over time. For development properties, additional subjective factors include projections of the amount and timing of the costs required to complete a project. To assist in determining the value of the Group’s portfolio, the directors engaged external valuers, CBRE, Colliers and Duff & Phelps Ltd. (the “Valuers”). The Directors’ estimates of the value of the portfolio were developed using the advice and input of the Valuers. Unreasonable or outdated inputs used in these judgments, such as those in respect to estimated rental value or yield, could result in material misstatement of the income statement and balance sheet. There is also a risk that management could influence these judgments to report valuations that assist in meeting market expectations or performance targets. (ii) How our audit work addressed these risks Among other procedures: • We read the valuation reports for all properties and confirmed that the valuation approach for each was in accordance with Royal Institution of Chartered Surveyors Valuation – Professional Standards (“RICS”) and suitable for use in determining the carrying value for the purpose of the financial statements. • We assessed the qualifications, independence and objectivity of the Valuers by reviewing their terms of engagement, fee arrangements, and the existence of any potential conflicts created if they had advised on a transaction that they were subsequently valuing. We obtained confirmation from the Valuers that they had not been subject to influence from management and we found no evidence to suggest their objectivity was compromised. • We held several discussions with the Valuers to understand their view of market dynamics, the valuation techniques used, the performance of the portfolio, and the significant assumptions including future expected rental income and likely yields. • We included a Chartered Surveyor on our team who considered the Valuers qualifications and together, we discussed with the Valuers the valuation approaches and assumptions. • We considered the yield assumptions used in performing the valuations to assess their reasonableness in comparison to relevant market evidence, benchmarking expected rental values and yields against comparables and other external data. • We performed substantive analytical procedures by reference to external market data to evaluate the appropriateness of the valuations adopted by the Group, and investigated further the valuation of those properties that were outside of our expectations. • We conducted site visits on major properties to corroborate certain details of the external valuation reports. • We evaluated whether sufficient disclosures were provided in relation to risks inherent in the asset valuations. Kennedy Wilson Europe Real Estate Plc / Annual Report and Accounts 201582
3. Our application of materiality and an overview of the scope of our audit We apply a concept of materiality in planning and performing our audit, and also in evaluating the effects of misstatements on our audit and on the financial statements. In considering whether the financial statements are free of material misstatement, we consider the magnitude of misstatement that makes it probable that the economic decisions of a knowledgeable member, relying on the financial statements, would be altered or influenced. We then use this materiality to determine the extent of testing needed to reduce the probability that the aggregate of uncorrected and undetected misstatements exceeds materiality for the financial statements as a whole to an appropriately low level. The materiality for the consolidated financial statements as a whole was set at £30 million (2014: £19 million), or 1% of total assets. Because real estate investments represent almost 88% of total assets, we consider total assets to be one of the principal measurements for members of the Company in assessing the financial performance of the Group. For account balances not related to the investment property portfolio, we applied materiality of £7.4 million, or 2.75% of pre-tax profit, as we believe a misstatement of amounts less than materiality for the financial statements as a whole could be reasonably expected to influence a members’ assessment of the financial performance of the Group. We agreed with the Audit Committee to report corrected and uncorrected misstatements we identified through our audit with a value in excess of £1.5 million (2014: £0.95 million), in respect of investment property, loans secured by real estate and property, plant and equipment, as well as those with a value in excess of £0.37 million (2014: £0.3 million) for other account balances. We also agreed to report other audit misstatements below that threshold that we believe warranted reporting on qualitative grounds. The structure of the Group’s finance function is such that transactions and balances are accounted for by a central group finance team. We performed audit procedures, including those in relation to the risks set out above, on those transactions and balances accounted for at group level. Our audits covered 100% of total consolidated revenue, 100% of consolidated profit before tax and 100% of consolidated total assets. 4. We have nothing to report on the disclosures of principal risks Based on the knowledge we acquired during our audit, we have nothing material to add or draw attention to in relation to: • The Directors’ statement on page 59 concerning the principal risks, their management, and, based on that, the directors’ assessment and expectations of the Group continuing in operation over the three year period to 2019; or • The disclosures in the Directors’ statement on page 59 concerning the use of the going concern basis of accounting. 5. We have nothing to report in respect of the matters on which we are required to report by exception Under the ISAs (UK & Ireland) we are required to report to you if, based on the knowledge we acquired during our audit, we have identified information in the annual report that contains a material inconsistency with either that knowledge or the financial statements, a material misstatement of fact, or that is otherwise misleading. In particular, we are required to report to you if: • We have identified any inconsistencies between the knowledge we acquired during our audit and the Directors’ statement that they consider the annual report is fair, balanced and understandable and provides information necessary for shareholders to assess the entity’s performance, business model and strategy; or • The report from the audit committee does not appropriately disclose those matters that we communicated to the audit committee. The Listing Rules of the Financial Conduct Authority require us to review: • The Directors’ statement, set out on page 59, in relation to going concern; • The part of the Corporate Governance Statement on page 58 relating to the Company’s compliance with the ten provisions of the UK Corporate Governance Code specified for our review; and • Certain elements of remuneration disclosures in the report to shareholders by the directors. 6. Our conclusions on other matters on which we are required to report by the Companies (Jersey) Law 1991 are set out below We have nothing to report in respect of the following matters where the Companies (Jersey) Law 1991 which requires us to report to you if, in our opinion: • Adequate accounting records have not been kept by the parent company; • Returns adequate for our audit have not been received from branches not visited by us; • The financial statements are not in agreement with the accounting records; or • We have not received all the information and explanations we require for our audit. Strategic report G overnance Fin an cials A dditional inform ation Kennedy Wilson Europe Real Estate Plc / Annual Report and Accounts 2015 83
Basis of our report, responsibilities and restrictions on use As explained more fully in the Directors’ responsibilities statement set out on page 81, the Directors are responsible for the preparation of the financial statements and for being satisfied that they give a true and fair view. Our responsibility is to audit and express an opinion on the consolidated financial statements in accordance with applicable law and International Standards on Auditing (ISAs) (UK & Ireland). Those standards require us to comply with the Financial Reporting Council’s Ethical Standards for Auditors. An audit undertaken in accordance with ISAs (UK & Ireland) involves obtaining evidence about the amounts and disclosures in the financial statements sufficient to give reasonable assurance that the financial statements are free from material misstatement, whether caused by fraud or error. This includes an assessment of: whether the accounting policies are appropriate to the Group’s circumstances and have been consistently applied and adequately disclosed; the reasonableness of significant accounting estimates made by the directors; and the overall presentation of the financial statements. In addition, we read all the financial and non-financial information in the Annual Report and Accounts to identify material inconsistencies with the audited consolidated financial statements and to identify any information that is apparently materially incorrect based on, or materially inconsistent with, the knowledge acquired by us in the course of performing the audit. If we become aware of any apparent material misstatements or inconsistencies we consider the implications for our report. While an audit conducted in accordance with ISAs (UK & Ireland) is designed to provide reasonable assurance of identifying material misstatements or omissions it is not guaranteed to do so. Rather, the auditor plans the audit to determine the extent of testing needed to reduce to an appropriately low level the probability that the aggregate of uncorrected and undetected misstatements does not exceed materiality for the financial statements as a whole. This testing requires us to conduct significant audit work on a broad range of assets, liabilities, income and expense as well as devoting significant time of the most experienced members of the audit team, in particular the engagement partner responsible for the audit, to subjective areas of the accounting and reporting. Our report is made solely to the Company’s members, as a body, in accordance with Article 113A of the Companies (Jersey) Law 1991. Our audit work has been undertaken so that we might state to the Company’s members those matters we are required to state to them in an auditor’s report and for no other purpose. To the fullest extent permitted by law, we do not accept or assume responsibility to anyone other than the Company and the Company’s members as a body, for our audit work, for this report, or for the opinions we have formed. Michael Gibbons for and on behalf of KPMG Chartered Accountants, Statutory Audit Firm 1 Stokes Place, St Stephen’s Green, Dublin 2, Ireland 25 February 2016 Independent auditor’s report to the members of Kennedy Wilson Europe Real Estate Plc continued Kennedy Wilson Europe Real Estate Plc / Annual Report and Accounts 201584

Consolidated income statement Notes Year ended 31 December 2015 £m Period from incorporation to 31 December 20141 Re-presented £m Revenue Rental income 7 138.8 51.4 Hotel revenue 10 20.0 8.4 Interest income from loans secured by real estate 13 13.4 6.6 172.2 66.4 Property related expenses 8 (22.7) (8.3) Hotel cost of sales 11 (14.4) (4.3) (37.1) (12.6) Gross profit 135.1 53.8 Gain on sale of investment property and loan collateral 9 14.6 0.4 Net change in fair value of investment and development property 17 208.0 49.3 Net change in fair value of loans secured by real estate 18 5.1 6.0 Other gains 0.8 – Gain on purchase of a business – 1.8 363.6 111.3 Expenses Administrative expenses 12 (15.9) (14.6) Investment management fee 31A (i) (15.2) (8.4) Performance fee 31A(ii) (29.7) – (60.8) (23.0) Results from operating activities before financing income and costs 302.8 88.3 Interest income from cash and cash equivalents 13 0.6 1.3 Finance costs 14 (36.8) (9.2) Net finance expense (36.2) (7.9) Profit before taxation 266.6 80.4 Taxation 15 (7.6) (1.9) Profit for the year after taxation 259.0 78.5 Earnings per share (basic and diluted) 16A 191.0p 88.0p Footnote: 1. Date of incorporation was 23 December 2013 The accompanying notes form an integral part of these consolidated financial statements. On behalf of the Board Simon Radford Mark McNicholas Director Director Strategic report G overnance Fin an cials A dditional inform ation Kennedy Wilson Europe Real Estate Plc / Annual Report and Accounts 2015 85
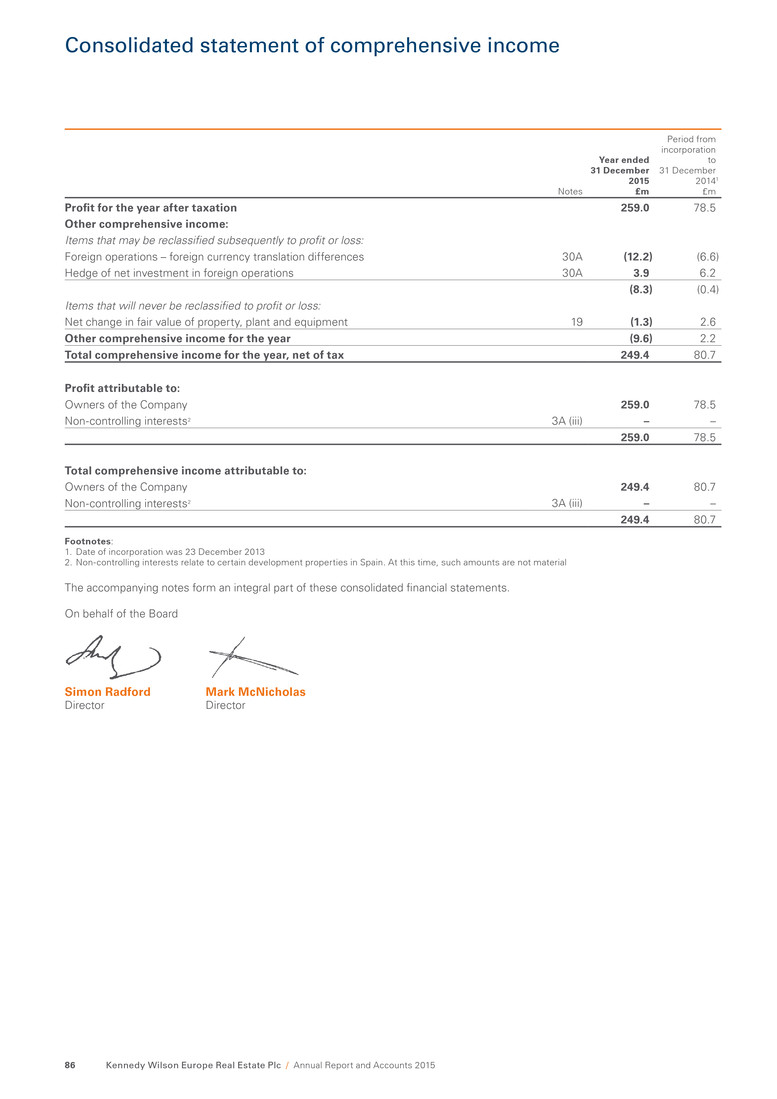
Consolidated statement of comprehensive income Notes Year ended 31 December 2015 £m Period from incorporation to 31 December 20141 £m Profit for the year after taxation 259.0 78.5 Other comprehensive income: Items that may be reclassified subsequently to profit or loss: Foreign operations – foreign currency translation differences 30A (12.2) (6.6) Hedge of net investment in foreign operations 30A 3.9 6.2 (8.3) (0.4) Items that will never be reclassified to profit or loss: Net change in fair value of property, plant and equipment 19 (1.3) 2.6 Other comprehensive income for the year (9.6) 2.2 Total comprehensive income for the year, net of tax 249.4 80.7 Profit attributable to: Owners of the Company 259.0 78.5 Non-controlling interests2 3A (iii) – – 259.0 78.5 Total comprehensive income attributable to: Owners of the Company 249.4 80.7 Non-controlling interests2 3A (iii) – – 249.4 80.7 Footnotes: 1. Date of incorporation was 23 December 2013 2. Non-controlling interests relate to certain development properties in Spain. At this time, such amounts are not material The accompanying notes form an integral part of these consolidated financial statements. On behalf of the Board Simon Radford Mark McNicholas Director Director Kennedy Wilson Europe Real Estate Plc / Annual Report and Accounts 201586
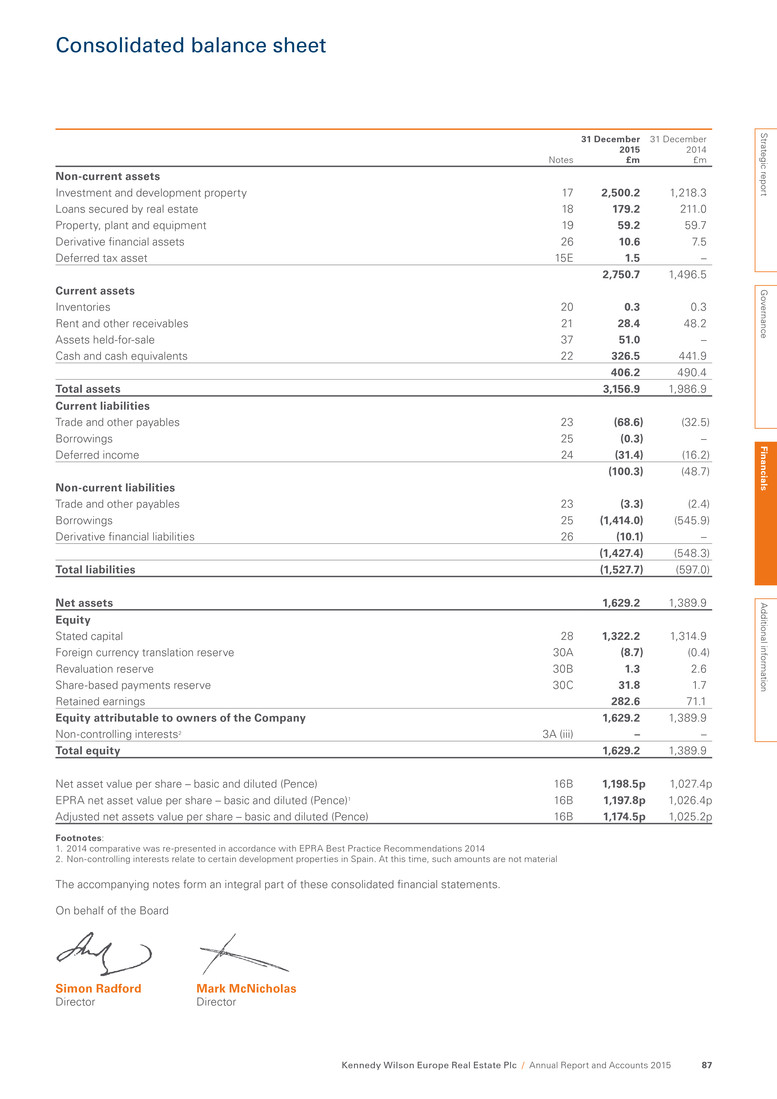
Consolidated balance sheet Notes 31 December 2015 £m 31 December 2014 £m Non-current assets Investment and development property 17 2,500.2 1,218.3 Loans secured by real estate 18 179.2 211.0 Property, plant and equipment 19 59.2 59.7 Derivative financial assets 26 10.6 7.5 Deferred tax asset 15E 1.5 – 2,750.7 1,496.5 Current assets Inventories 20 0.3 0.3 Rent and other receivables 21 28.4 48.2 Assets held-for-sale 37 51.0 – Cash and cash equivalents 22 326.5 441.9 406.2 490.4 Total assets 3,156.9 1,986.9 Current liabilities Trade and other payables 23 (68.6) (32.5) Borrowings 25 (0.3) – Deferred income 24 (31.4) (16.2) (100.3) (48.7) Non-current liabilities Trade and other payables 23 (3.3) (2.4) Borrowings 25 (1,414.0) (545.9) Derivative financial liabilities 26 (10.1) – (1,427.4) (548.3) Total liabilities (1,527.7) (597.0) Net assets 1,629.2 1,389.9 Equity Stated capital 28 1,322.2 1,314.9 Foreign currency translation reserve 30A (8.7) (0.4) Revaluation reserve 30B 1.3 2.6 Share-based payments reserve 30C 31.8 1.7 Retained earnings 282.6 71.1 Equity attributable to owners of the Company 1,629.2 1,389.9 Non-controlling interests2 3A (iii) – – Total equity 1,629.2 1,389.9 Net asset value per share – basic and diluted (Pence) 16B 1,198.5p 1,027.4p EPRA net asset value per share – basic and diluted (Pence)1 16B 1,197.8p 1,026.4p Adjusted net assets value per share – basic and diluted (Pence) 16B 1,174.5p 1,025.2p Footnotes: 1. 2014 comparative was re-presented in accordance with EPRA Best Practice Recommendations 2014 2. Non-controlling interests relate to certain development properties in Spain. At this time, such amounts are not material The accompanying notes form an integral part of these consolidated financial statements. On behalf of the Board Simon Radford Mark McNicholas Director Director Strategic report G overnance Fin an cials A dditional inform ation Kennedy Wilson Europe Real Estate Plc / Annual Report and Accounts 2015 87
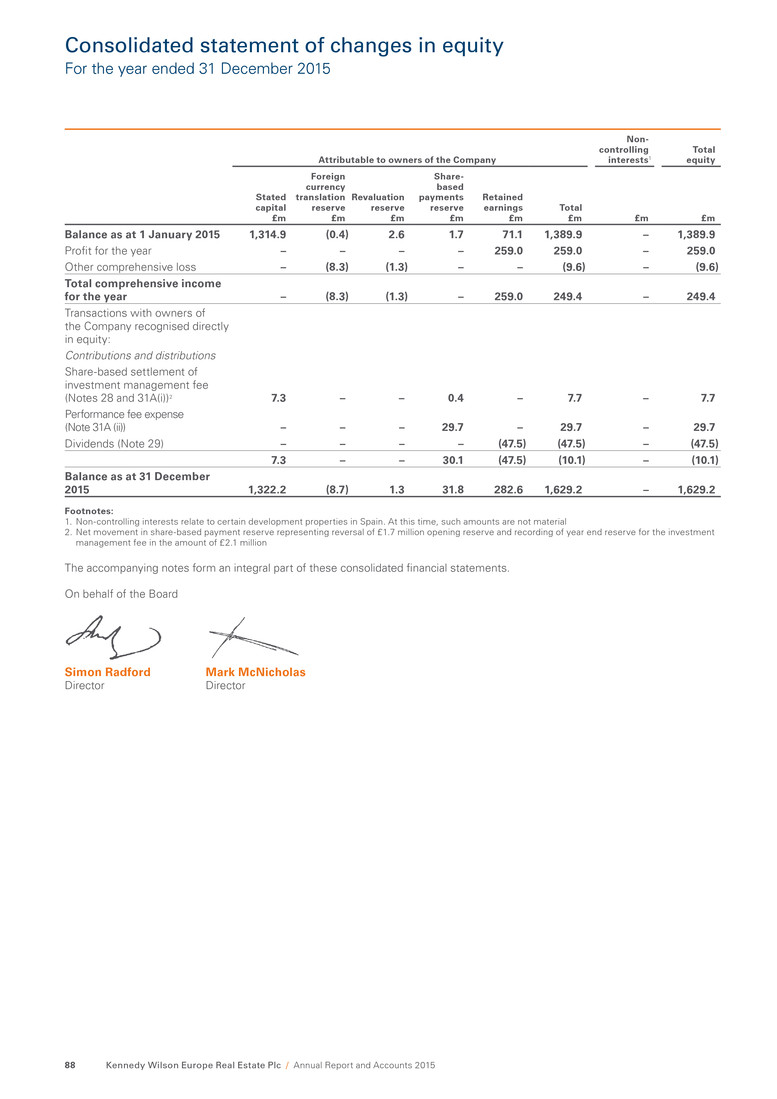
Consolidated statement of changes in equity For the year ended 31 December 2015 Attributable to owners of the Company Non- controlling interests1 Total equity Stated capital £m Foreign currency translation reserve £m Revaluation reserve £m Share- based payments reserve £m Retained earnings £m Total £m £m £m Balance as at 1 January 2015 1,314.9 (0.4) 2.6 1.7 71.1 1,389.9 – 1,389.9 Profit for the year – – – – 259.0 259.0 – 259.0 Other comprehensive loss – (8.3) (1.3) – – (9.6) – (9.6) Total comprehensive income for the year – (8.3) (1.3) – 259.0 249.4 – 249.4 Transactions with owners of the Company recognised directly in equity: Contributions and distributions Share-based settlement of investment management fee (Notes 28 and 31A(i))2 7.3 – – 0.4 – 7.7 – 7.7 Performance fee expense (Note 31A (ii)) – – – 29.7 – 29.7 – 29.7 Dividends (Note 29) – – – – (47.5) (47.5) – (47.5) 7.3 – – 30.1 (47.5) (10.1) – (10.1) Balance as at 31 December 2015 1,322.2 (8.7) 1.3 31.8 282.6 1,629.2 – 1,629.2 Footnotes: 1. Non-controlling interests relate to certain development properties in Spain. At this time, such amounts are not material 2. Net movement in share-based payment reserve representing reversal of £1.7 million opening reserve and recording of year end reserve for the investment management fee in the amount of £2.1 million The accompanying notes form an integral part of these consolidated financial statements. On behalf of the Board Simon Radford Mark McNicholas Director Director Kennedy Wilson Europe Real Estate Plc / Annual Report and Accounts 201588
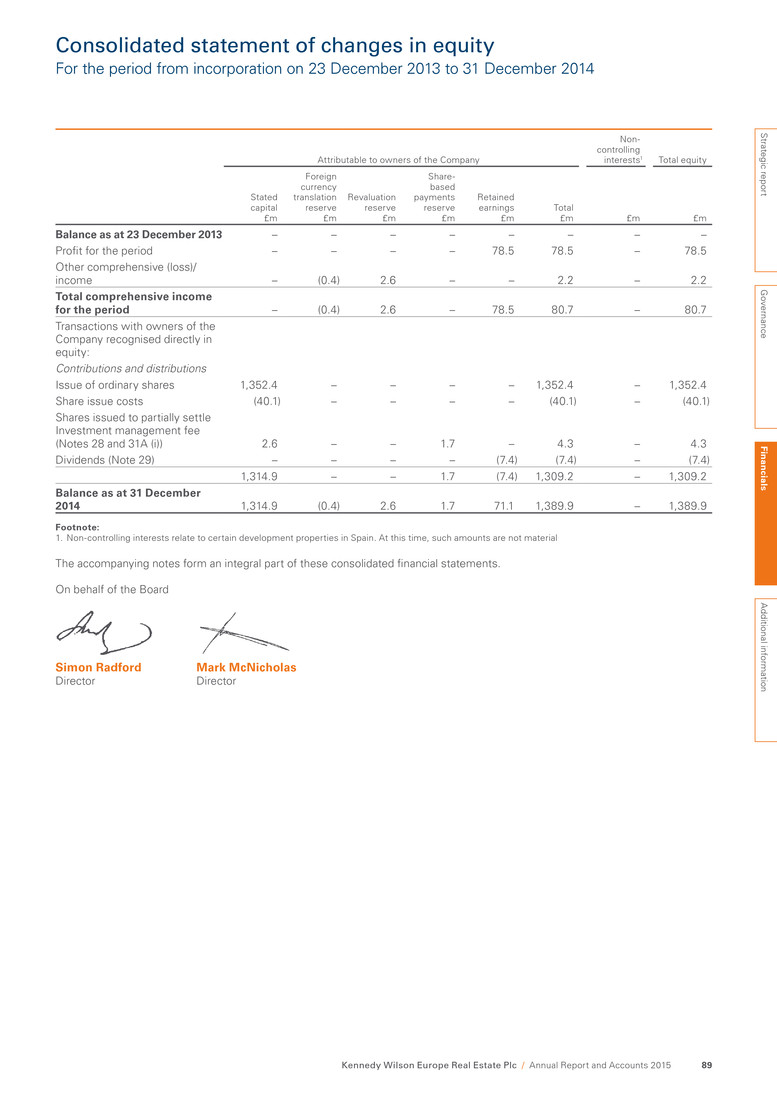
Consolidated statement of changes in equity For the period from incorporation on 23 December 2013 to 31 December 2014 Attributable to owners of the Company Non- controlling interests1 Total equity Stated capital £m Foreign currency translation reserve £m Revaluation reserve £m Share- based payments reserve £m Retained earnings £m Total £m £m £m Balance as at 23 December 2013 – – – – – – – – Profit for the period – – – – 78.5 78.5 – 78.5 Other comprehensive (loss)/ income – (0.4) 2.6 – – 2.2 – 2.2 Total comprehensive income for the period – (0.4) 2.6 – 78.5 80.7 – 80.7 Transactions with owners of the Company recognised directly in equity: Contributions and distributions Issue of ordinary shares 1,352.4 – – – – 1,352.4 – 1,352.4 Share issue costs (40.1) – – – – (40.1) – (40.1) Shares issued to partially settle Investment management fee (Notes 28 and 31A (i)) 2.6 – – 1.7 – 4.3 – 4.3 Dividends (Note 29) – – – – (7.4) (7.4) – (7.4) 1,314.9 – – 1.7 (7.4) 1,309.2 – 1,309.2 Balance as at 31 December 2014 1,314.9 (0.4) 2.6 1.7 71.1 1,389.9 – 1,389.9 Footnote: 1. Non-controlling interests relate to certain development properties in Spain. At this time, such amounts are not material The accompanying notes form an integral part of these consolidated financial statements. On behalf of the Board Simon Radford Mark McNicholas Director Director Strategic report G overnance Fin an cials A dditional inform ation Kennedy Wilson Europe Real Estate Plc / Annual Report and Accounts 2015 89
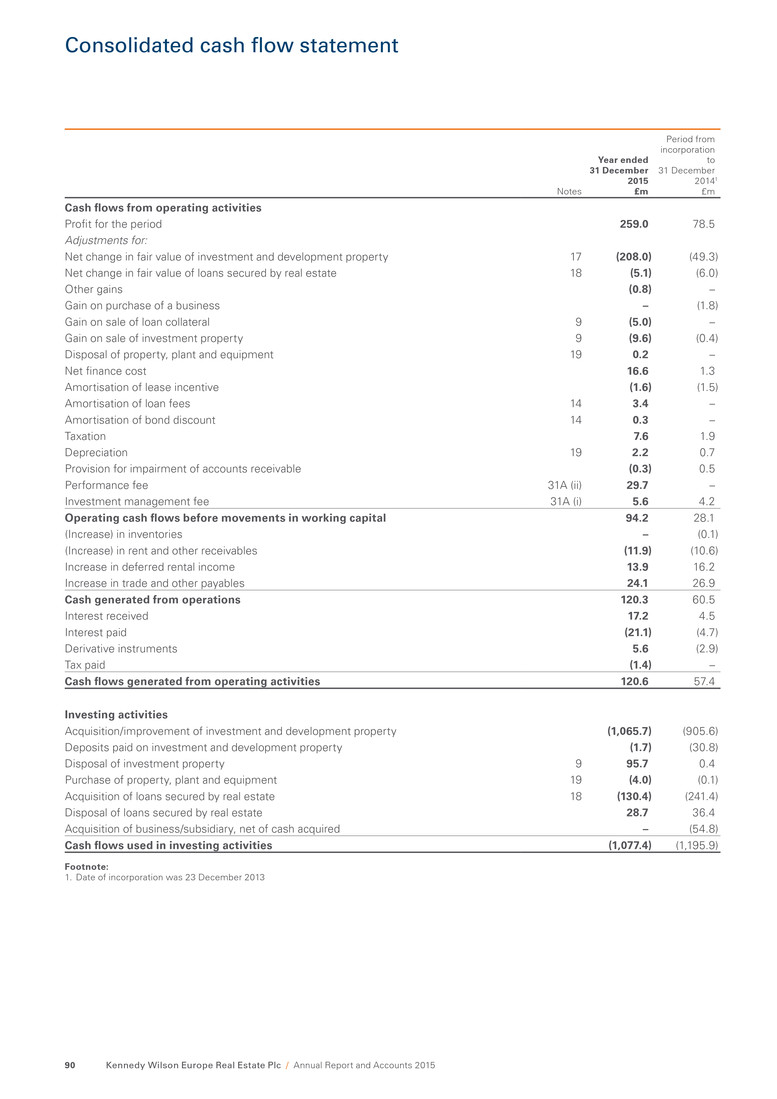
Consolidated cash flow statement Notes Year ended 31 December 2015 £m Period from incorporation to 31 December 20141 £m Cash flows from operating activities Profit for the period 259.0 78.5 Adjustments for: Net change in fair value of investment and development property 17 (208.0) (49.3) Net change in fair value of loans secured by real estate 18 (5.1) (6.0) Other gains (0.8) – Gain on purchase of a business – (1.8) Gain on sale of loan collateral 9 (5.0) – Gain on sale of investment property 9 (9.6) (0.4) Disposal of property, plant and equipment 19 0.2 – Net finance cost 16.6 1.3 Amortisation of lease incentive (1.6) (1.5) Amortisation of loan fees 14 3.4 – Amortisation of bond discount 14 0.3 – Taxation 7.6 1.9 Depreciation 19 2.2 0.7 Provision for impairment of accounts receivable (0.3) 0.5 Performance fee 31A (ii) 29.7 – Investment management fee 31A (i) 5.6 4.2 Operating cash flows before movements in working capital 94.2 28.1 (Increase) in inventories – (0.1) (Increase) in rent and other receivables (11.9) (10.6) Increase in deferred rental income 13.9 16.2 Increase in trade and other payables 24.1 26.9 Cash generated from operations 120.3 60.5 Interest received 17.2 4.5 Interest paid (21.1) (4.7) Derivative instruments 5.6 (2.9) Tax paid (1.4) – Cash flows generated from operating activities 120.6 57.4 Investing activities Acquisition/improvement of investment and development property (1,065.7) (905.6) Deposits paid on investment and development property (1.7) (30.8) Disposal of investment property 9 95.7 0.4 Purchase of property, plant and equipment 19 (4.0) (0.1) Acquisition of loans secured by real estate 18 (130.4) (241.4) Disposal of loans secured by real estate 28.7 36.4 Acquisition of business/subsidiary, net of cash acquired – (54.8) Cash flows used in investing activities (1,077.4) (1,195.9) Footnote: 1. Date of incorporation was 23 December 2013 Kennedy Wilson Europe Real Estate Plc / Annual Report and Accounts 201590
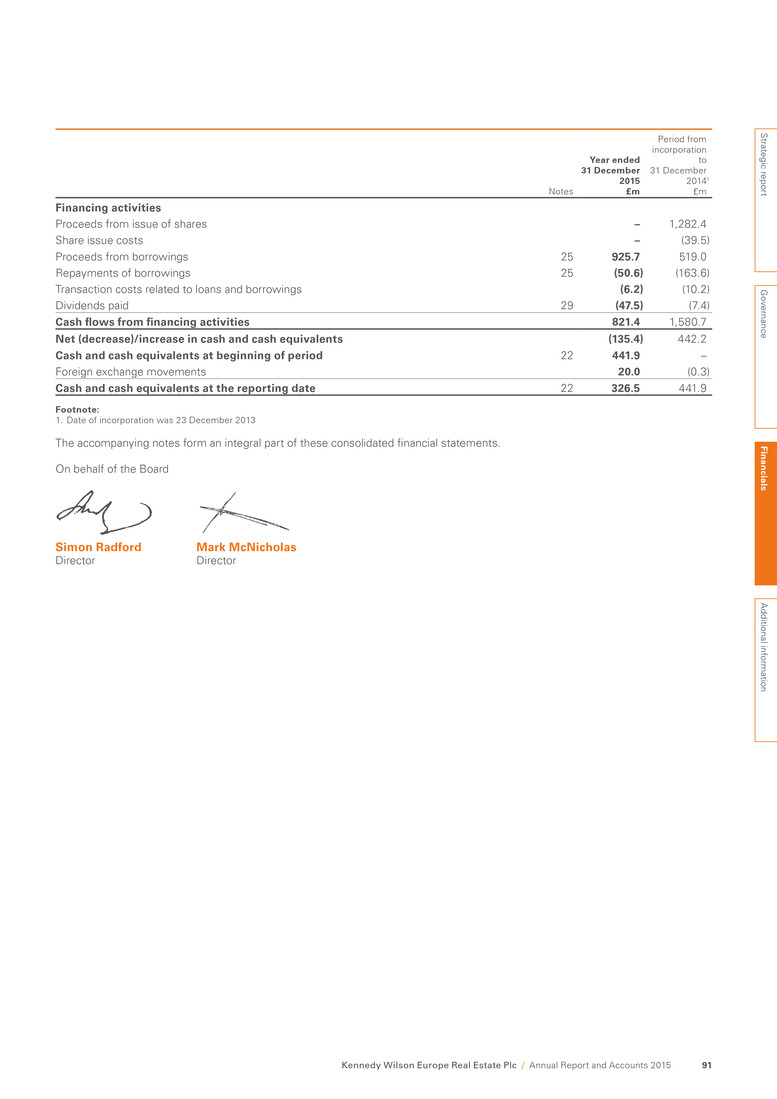
Notes Year ended 31 December 2015 £m Period from incorporation to 31 December 20141 £m Financing activities Proceeds from issue of shares – 1,282.4 Share issue costs – (39.5) Proceeds from borrowings 25 925.7 519.0 Repayments of borrowings 25 (50.6) (163.6) Transaction costs related to loans and borrowings (6.2) (10.2) Dividends paid 29 (47.5) (7.4) Cash flows from financing activities 821.4 1,580.7 Net (decrease)/increase in cash and cash equivalents (135.4) 442.2 Cash and cash equivalents at beginning of period 22 441.9 – Foreign exchange movements 20.0 (0.3) Cash and cash equivalents at the reporting date 22 326.5 441.9 Footnote: 1. Date of incorporation was 23 December 2013 The accompanying notes form an integral part of these consolidated financial statements. On behalf of the Board Simon Radford Mark McNicholas Director Director Strategic report G overnance Fin an cials A dditional inform ation Kennedy Wilson Europe Real Estate Plc / Annual Report and Accounts 2015 91

Notes to the consolidated financial statements For the year ended 31 December 2015 1. General information The Company is a limited liability, closed-ended investment company incorporated and domiciled in Jersey on 23 December 2013. The Group comprises the Company and its subsidiaries (collectively the ‘Group’ and individually ‘Group companies’). The Company’s ordinary shares are listed on the main market for listed securities of the London Stock Exchange. The registered office of the Company is 47 Esplanade, St Helier, Jersey, JE1 0BD, Channel Islands. The Company invests in investment and development property, hotel businesses and loans secured by real estate in Europe with the objective of generating and growing long-term cash flows to pay dividends and to enhance capital values through focused asset management and strategic acquisitions. The consolidated financial statements were approved and authorised for issue on 25 February 2016 and signed by Simon Radford and Mark McNicholas on behalf of the Board. 2. Basis of preparation A. Statement of compliance The consolidated financial statements included in this report have been prepared in accordance with International Financial Reporting Standards as adopted by the European Union (‘IFRS’). The Company has not early adopted any forthcoming IASB standards. Note 4 sets out the details of such upcoming standards. The consolidated financial statements have been prepared on a basis consistent with the prior period, save for the re-presentation of the consolidated income statement. Note 40 sets out the details of the re-presentation. B. Basis of measurement The consolidated financial statements are for the year ended 31 December 2015 and have been prepared on the going concern basis, applying the historical cost convention except for investment and development property, certain loans secured by real estate, certain property, plant and equipment and derivative financial instruments which are stated at their fair value using the accounting policies as set out in Note 3. C. Functional and presentational currency These consolidated financial statements are presented in Pound Sterling as this is the Company’s functional currency. All financial information presented in Pound Sterling has been rounded to the nearest million, and presented to one decimal place, except where otherwise stated. D. Use of estimates and judgements The preparation of the consolidated financial statements in conformity with IFRS requires management to make judgements, estimates and assumptions that affect the application of the Group’s accounting policies and the reported amounts of assets, liabilities, income and expenses. Actual results may differ from these estimates. Estimates and underlying assumptions are reviewed on an ongoing basis. Revisions to accounting estimates are recognised in the period in which the estimates are revised if the revision affects only that period or in the period of revision and future periods if the revision affects both current and future periods. Critical judgements in applying accounting policies that have the most significant effect on amounts recognised in the financial statements in the year ending 31 December 2015 include management’s estimates of the fair value of investment and development property (Note 17), loans secured by real estate (Note 18) and land and buildings (Note 19). 3. Significant accounting policies The following new and amended standards and interpretations are effective for the Group for the first time for the financial year beginning 1 January 2015. None of these had a material impact on the Group: • IAS 27 Separate Financial Statements (2011) • IAS 28 Investments in Associates and Joint Ventures (2011) • Annual Improvements to IFRS 2011-2013 Cycle • Offsetting Financial Assets and Financial Liabilities (Amendments to IAS 32) • IAS 36 Recoverable Amount Disclosures for Non-Financial Assets • IFRS 10 Consolidated Financial Statements • IFRS 11 Joint Arrangements • IFRS 12 Disclosure of Interests in Other Entities • Amendments to IFRS 10, IFRS 11 and IAS 27 Investment Entities and • IFRIC 21 Levies. A. Basis of consolidation (i). Subsidiaries Subsidiaries are those entities controlled by the Group. The Group controls an entity when it is exposed to, or has rights to, variable returns from its involvement with the entity and has the ability to affect those returns through its power over the entity. The financial statements of subsidiaries are included in the consolidated financial statements from the date on which control commences until the date on which control ceases. Kennedy Wilson Europe Real Estate Plc / Annual Report and Accounts 201592
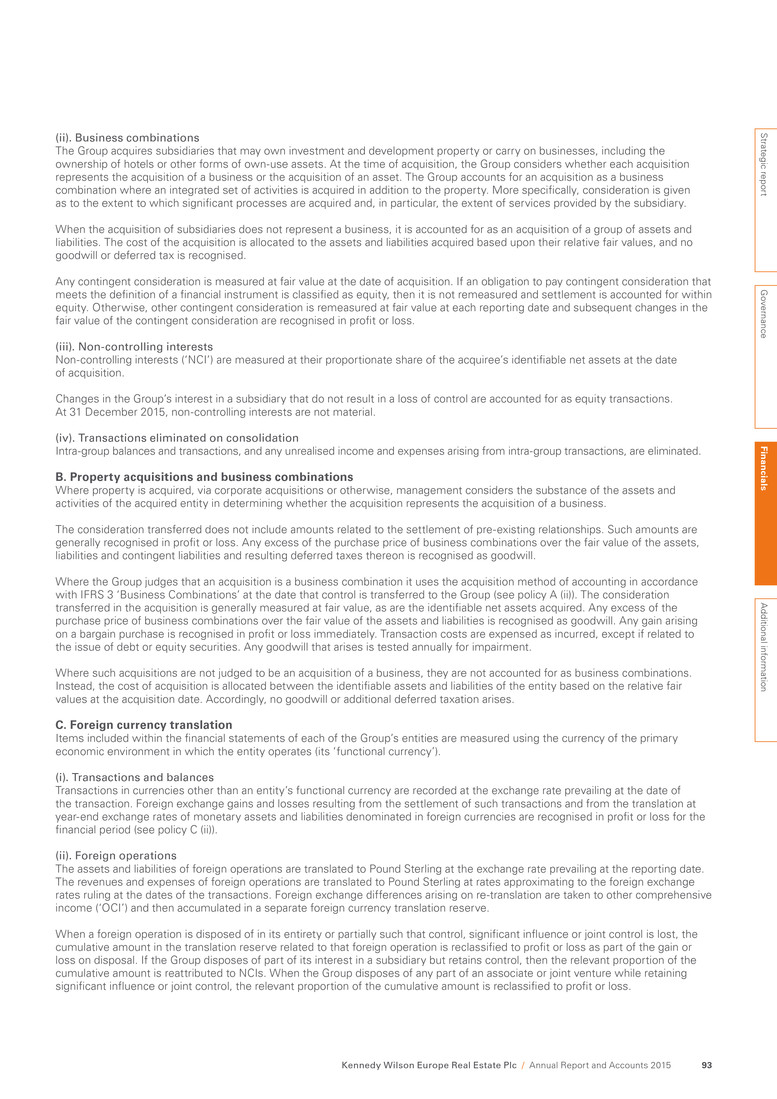
(ii). Business combinations The Group acquires subsidiaries that may own investment and development property or carry on businesses, including the ownership of hotels or other forms of own-use assets. At the time of acquisition, the Group considers whether each acquisition represents the acquisition of a business or the acquisition of an asset. The Group accounts for an acquisition as a business combination where an integrated set of activities is acquired in addition to the property. More specifically, consideration is given as to the extent to which significant processes are acquired and, in particular, the extent of services provided by the subsidiary. When the acquisition of subsidiaries does not represent a business, it is accounted for as an acquisition of a group of assets and liabilities. The cost of the acquisition is allocated to the assets and liabilities acquired based upon their relative fair values, and no goodwill or deferred tax is recognised. Any contingent consideration is measured at fair value at the date of acquisition. If an obligation to pay contingent consideration that meets the definition of a financial instrument is classified as equity, then it is not remeasured and settlement is accounted for within equity. Otherwise, other contingent consideration is remeasured at fair value at each reporting date and subsequent changes in the fair value of the contingent consideration are recognised in profit or loss. (iii). Non-controlling interests Non-controlling interests (‘NCI’) are measured at their proportionate share of the acquiree’s identifiable net assets at the date of acquisition. Changes in the Group’s interest in a subsidiary that do not result in a loss of control are accounted for as equity transactions. At 31 December 2015, non-controlling interests are not material. (iv). Transactions eliminated on consolidation Intra-group balances and transactions, and any unrealised income and expenses arising from intra-group transactions, are eliminated. B. Property acquisitions and business combinations Where property is acquired, via corporate acquisitions or otherwise, management considers the substance of the assets and activities of the acquired entity in determining whether the acquisition represents the acquisition of a business. The consideration transferred does not include amounts related to the settlement of pre-existing relationships. Such amounts are generally recognised in profit or loss. Any excess of the purchase price of business combinations over the fair value of the assets, liabilities and contingent liabilities and resulting deferred taxes thereon is recognised as goodwill. Where the Group judges that an acquisition is a business combination it uses the acquisition method of accounting in accordance with IFRS 3 ‘Business Combinations’ at the date that control is transferred to the Group (see policy A (ii)). The consideration transferred in the acquisition is generally measured at fair value, as are the identifiable net assets acquired. Any excess of the purchase price of business combinations over the fair value of the assets and liabilities is recognised as goodwill. Any gain arising on a bargain purchase is recognised in profit or loss immediately. Transaction costs are expensed as incurred, except if related to the issue of debt or equity securities. Any goodwill that arises is tested annually for impairment. Where such acquisitions are not judged to be an acquisition of a business, they are not accounted for as business combinations. Instead, the cost of acquisition is allocated between the identifiable assets and liabilities of the entity based on the relative fair values at the acquisition date. Accordingly, no goodwill or additional deferred taxation arises. C. Foreign currency translation Items included within the financial statements of each of the Group’s entities are measured using the currency of the primary economic environment in which the entity operates (its ‘functional currency’). (i). Transactions and balances Transactions in currencies other than an entity’s functional currency are recorded at the exchange rate prevailing at the date of the transaction. Foreign exchange gains and losses resulting from the settlement of such transactions and from the translation at year-end exchange rates of monetary assets and liabilities denominated in foreign currencies are recognised in profit or loss for the financial period (see policy C (ii)). (ii). Foreign operations The assets and liabilities of foreign operations are translated to Pound Sterling at the exchange rate prevailing at the reporting date. The revenues and expenses of foreign operations are translated to Pound Sterling at rates approximating to the foreign exchange rates ruling at the dates of the transactions. Foreign exchange differences arising on re-translation are taken to other comprehensive income (‘OCI’) and then accumulated in a separate foreign currency translation reserve. When a foreign operation is disposed of in its entirety or partially such that control, significant influence or joint control is lost, the cumulative amount in the translation reserve related to that foreign operation is reclassified to profit or loss as part of the gain or loss on disposal. If the Group disposes of part of its interest in a subsidiary but retains control, then the relevant proportion of the cumulative amount is reattributed to NCIs. When the Group disposes of any part of an associate or joint venture while retaining significant influence or joint control, the relevant proportion of the cumulative amount is reclassified to profit or loss. Strategic report G overnance Fin an cials A dditional inform ation Kennedy Wilson Europe Real Estate Plc / Annual Report and Accounts 2015 93
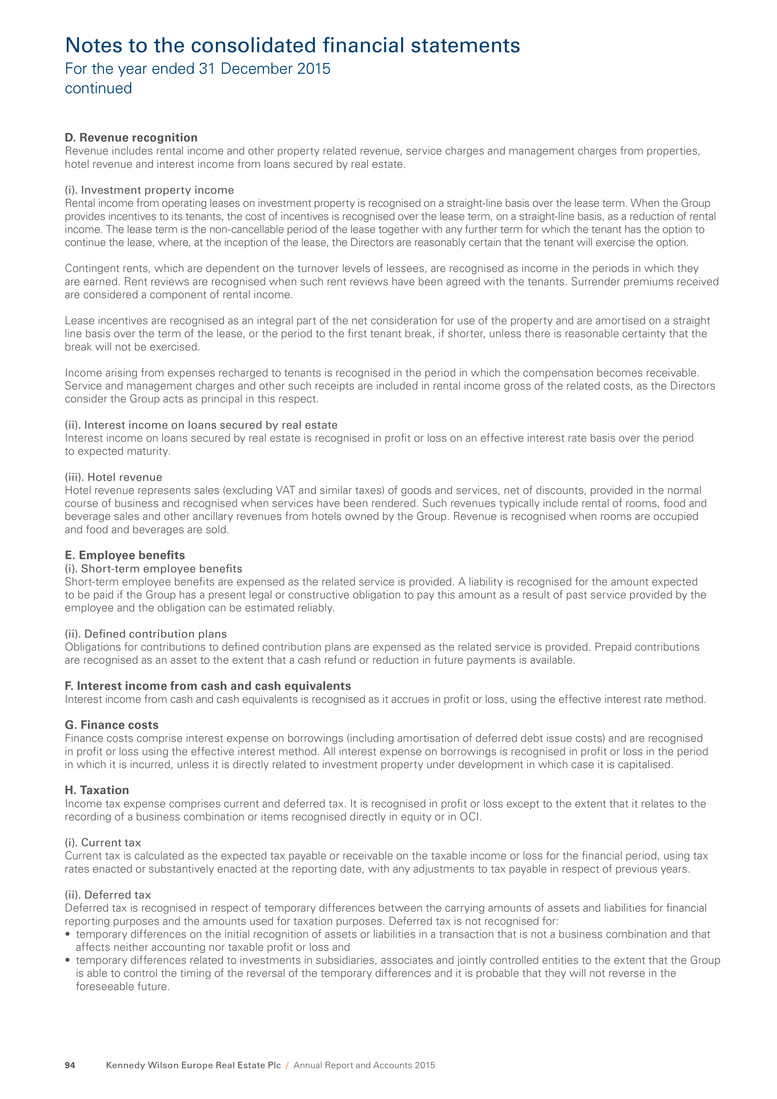
D. Revenue recognition Revenue includes rental income and other property related revenue, service charges and management charges from properties, hotel revenue and interest income from loans secured by real estate. (i). Investment property income Rental income from operating leases on investment property is recognised on a straight-line basis over the lease term. When the Group provides incentives to its tenants, the cost of incentives is recognised over the lease term, on a straight-line basis, as a reduction of rental income. The lease term is the non-cancellable period of the lease together with any further term for which the tenant has the option to continue the lease, where, at the inception of the lease, the Directors are reasonably certain that the tenant will exercise the option. Contingent rents, which are dependent on the turnover levels of lessees, are recognised as income in the periods in which they are earned. Rent reviews are recognised when such rent reviews have been agreed with the tenants. Surrender premiums received are considered a component of rental income. Lease incentives are recognised as an integral part of the net consideration for use of the property and are amortised on a straight line basis over the term of the lease, or the period to the first tenant break, if shorter, unless there is reasonable certainty that the break will not be exercised. Income arising from expenses recharged to tenants is recognised in the period in which the compensation becomes receivable. Service and management charges and other such receipts are included in rental income gross of the related costs, as the Directors consider the Group acts as principal in this respect. (ii). Interest income on loans secured by real estate Interest income on loans secured by real estate is recognised in profit or loss on an effective interest rate basis over the period to expected maturity. (iii). Hotel revenue Hotel revenue represents sales (excluding VAT and similar taxes) of goods and services, net of discounts, provided in the normal course of business and recognised when services have been rendered. Such revenues typically include rental of rooms, food and beverage sales and other ancillary revenues from hotels owned by the Group. Revenue is recognised when rooms are occupied and food and beverages are sold. E. Employee benefits (i). Short-term employee benefits Short-term employee benefits are expensed as the related service is provided. A liability is recognised for the amount expected to be paid if the Group has a present legal or constructive obligation to pay this amount as a result of past service provided by the employee and the obligation can be estimated reliably. (ii). Defined contribution plans Obligations for contributions to defined contribution plans are expensed as the related service is provided. Prepaid contributions are recognised as an asset to the extent that a cash refund or reduction in future payments is available. F. Interest income from cash and cash equivalents Interest income from cash and cash equivalents is recognised as it accrues in profit or loss, using the effective interest rate method. G. Finance costs Finance costs comprise interest expense on borrowings (including amortisation of deferred debt issue costs) and are recognised in profit or loss using the effective interest method. All interest expense on borrowings is recognised in profit or loss in the period in which it is incurred, unless it is directly related to investment property under development in which case it is capitalised. H. Taxation Income tax expense comprises current and deferred tax. It is recognised in profit or loss except to the extent that it relates to the recording of a business combination or items recognised directly in equity or in OCI. (i). Current tax Current tax is calculated as the expected tax payable or receivable on the taxable income or loss for the financial period, using tax rates enacted or substantively enacted at the reporting date, with any adjustments to tax payable in respect of previous years. (ii). Deferred tax Deferred tax is recognised in respect of temporary differences between the carrying amounts of assets and liabilities for financial reporting purposes and the amounts used for taxation purposes. Deferred tax is not recognised for: • temporary differences on the initial recognition of assets or liabilities in a transaction that is not a business combination and that affects neither accounting nor taxable profit or loss and • temporary differences related to investments in subsidiaries, associates and jointly controlled entities to the extent that the Group is able to control the timing of the reversal of the temporary differences and it is probable that they will not reverse in the foreseeable future. Notes to the consolidated financial statements For the year ended 31 December 2015 continued Kennedy Wilson Europe Real Estate Plc / Annual Report and Accounts 201594
The measurement of deferred tax reflects the tax consequences that follow the manner in which the Group expects, at the end of the reporting period, to recover or settle the carrying amount of its assets and liabilities. For investment and development property that is expected to be measured at fair value, the presumption that the carrying amount of investment and development property will be recovered through sale is not expected to be rebutted. Deferred tax is measured at the tax rates that are expected to be applied to temporary differences when they reverse, using tax rates enacted or substantively enacted at the reporting date. Deferred tax assets and liabilities are offset if there is a legally enforceable right to offset current tax liabilities and assets, and they relate to taxes levied by the same tax authority on the same taxable entity, or on different tax entities, but the Group intends to settle current tax liabilities and assets on a net basis or the Group’s tax assets and liabilities are realised simultaneously. A deferred tax asset is recognised for unused tax losses, tax credits and deductible temporary differences to the extent that it is probable that future taxable profits will be available against which they can be utilised. Deferred tax assets are reviewed at each reporting date and reduced to the extent that it is no longer expected to be probable that the related tax benefit will be realised. I. Dividends Dividends are recognised as a liability in the period in which they become obligations of the Company. J. Investment and development property Property held for long-term rental yields or for capital appreciation or both, and that is not occupied by the Group, is classified as investment property and recorded at fair value. Investment property also includes property that is being constructed or developed for future use as investment property (see Note 5A). Investment property is recognised when it has been acquired and future economic benefits are expected to be derived from its ownership. Investment property is measured initially at its cost, including related transaction costs and subsequently measured at fair value with any change recognised in profit or loss. Investment property is derecognised when it has been disposed of or permanently withdrawn from use and no future economic benefit is expected from its disposal. The difference between the net disposal proceeds and the carrying amount of the asset would result in either gains or losses at the retirement or disposal of the investment property. Any gains or losses are recognised in the income statement in the year of retirement or disposal. Any gain or loss on disposal of an investment property (calculated as the difference between the proceeds from disposal, net of selling costs, and the carrying amount of the item) is recognised in profit or loss. Properties that are currently being developed or that are to be developed in the near future are held as development properties. These properties are initially valued at cost. Any direct expenditure on development properties is capitalised and the properties are then valued by external valuers at their respective fair value at each reporting date. A fair value measurement of a non-financial asset takes into account a market participant’s ability to generate economic benefits by using the asset in its highest and best use or by selling it to another market participant that would use the asset in its highest and best use. Valuations reflect, when appropriate, the type of tenants actually in occupation or responsible for meeting lease commitments or likely to be in occupation after letting vacant accommodation, the allocation of maintenance and insurance responsibilities between the Group and the lessee, and the expected remaining economic life of the property. When rent reviews or lease renewals are pending with anticipated reversionary increases, it is assumed that all notices, and when appropriate counter-notices, have been served validly and within the appropriate time. K. Property, plant and equipment Land and buildings which represent hotels are initially measured at cost plus any costs that are directly attributable to acquiring, and thereafter they are measured at fair value (see Note 5C). Revaluation gains are credited to other comprehensive income and accumulated in equity within a revaluation reserve unless representing the reversal of an impairment of the same asset previously recognised in profit or loss, in which case the reversal is recognised in profit or loss. A decrease arising as a result of a revaluation is recognised as an expense to the extent that it exceeds any amount previously credited to the revaluation surplus relating to the same asset. Any gain recognised in OCI is not re-classified into the profit or loss upon disposal of the associated asset. Other items of property, plant and equipment are stated at cost less depreciation and any impairment. Impairment losses are recognised in profit or loss. Repairs and maintenance costs are expensed as incurred. Any gain or loss on disposal of an item of property, plant and equipment is recognised in profit or loss. All property, plant and equipment (excluding land) are depreciated to residual value over their estimated useful lives, namely: Buildings – 40 years Fixtures, fittings and equipment – 5 years All depreciation is charged on a straight-line basis. Strategic report G overnance Fin an cials A dditional inform ation Kennedy Wilson Europe Real Estate Plc / Annual Report and Accounts 2015 95
L. Expenses Expenses are recognised in the profit or loss in the period in which they are incurred, on an accruals basis. M. Inventories Inventories are measured at the lower of cost and net realisable value. The cost of inventories is based on a first-in, first-out basis. N. Assets held-for-sale Non-current assets, or disposal groups comprising assets and liabilities, are classified as held-for-sale if it is highly probable that they will be recovered primarily through sale rather than through continuing use. Such assets, or disposal groups, are generally measured at the lower of their carrying amount and fair value less costs to sell. Any impairment loss on a disposal group is allocated first to goodwill, and then to the remaining assets and liabilities on a pro rata basis, except that no loss is allocated to inventories, financial assets, deferred tax assets, employee benefit assets, investment property, which continue to be measured in accordance with the Group’s other accounting policies. Impairment losses on initial classification as held-for-sale or held-for-distribution and subsequent gains and losses on re-measurement are recognised in the profit or loss. Once classified as held-for-sale, intangible assets and property, plant and equipment are no longer amortised or depreciated. O. Borrowings All borrowings are initially recognised at fair value less directly attributable transaction costs. After initial recognition, borrowings are subsequently measured at amortised cost using the effective interest method (see Note 5D). P. Financial instruments (i). Non-derivative financial assets The Group initially recognises loans secured by real estate on the date that they are purchased. All other financial assets are recognised initially on the trade date, which is the date that the Group becomes a party to the contractual provisions of the instrument. The Group derecognises a financial asset when the contractual rights to the cash flows from the asset expire, or it transfers the rights to receive the contractual cash flows in a transaction in which substantially all the risks and rewards of ownership of the financial asset are transferred. Any interest in such transferred financial assets that is created or retained by the Group is recognised as a separate asset or liability. The Group classifies its cash and cash equivalents and rent and other receivables as loans and receivables which are measured at amortised cost with loans secured by real estate being designated at fair value through the profit or loss. At 31 December 2015 the Group had the following non-derivative financial assets: (a). Cash and cash equivalents Cash and cash equivalents comprise cash balances and call deposits with maturities of three months or less from the acquisition date that are subject to an insignificant risk of changes in their fair value, and are used by the Group in the management of its short-term commitments. These assets are classified as loans and receivables initially measured at fair value less initial direct costs and subsequently at amortised cost. (b). Rent and other receivables Rent and other receivables are initially recognised at fair value less initial direct costs, which is usually the original invoiced amount and subsequently carried at amortised cost using the effective interest method less provision made for impairment, if applicable. Where there is objective evidence that an incurred impairment loss has arisen, appropriate allowances for any irrecoverable amounts are recognised through profit or loss in the statement of comprehensive income. (c). Loans secured by real estate Loans secured by real estate have been designated to be measured at fair value through profit or loss as the assets are managed, evaluated and reported internally on a fair value basis. Any related initial direct costs relating to these loans are charged immediately as an expense through profit or loss. Interest income will be accreted to profit or loss separately using the effective interest rate method (see policy D (ii)). (ii). Non-derivative financial liabilities All financial liabilities are recognised initially at the date that the Group becomes a party to the contractual provisions of the instrument and are measured initially at fair value less initial direct costs and subsequently measured at amortised cost. The Group derecognises a financial liability when its contractual obligations are discharged, cancelled or expire. Notes to the consolidated financial statements For the year ended 31 December 2015 continued Kennedy Wilson Europe Real Estate Plc / Annual Report and Accounts 201596
(iii). Derivative financial instruments and hedge accounting The Group uses a variety of derivative instruments to mitigate certain interest rate and foreign currency financial risks including interest rate caps, cross-currency swaps and foreign currency forward contracts and foreign currency zero premium options. The Group does not enter into derivative contracts for speculative purposes. Derivative instruments are used for hedging purposes to alter the risk profile of an existing underlying exposure of the Group in line with its risk management policies. All derivatives are recognised at fair value. The treatment of the change in fair value depends on whether the derivative is designated as a hedging instrument, the nature of the item being hedged and the effectiveness of the hedge (see Note 5E). Derivative financial instruments are initially recognised at fair value on the date on which a derivative contract is entered into and are subsequently re-measured at fair value. Derivatives are carried as assets when the fair value is positive and as liabilities when the fair value is negative. (a). Net investment hedges The Group designates foreign currency forward contracts, options, cross-currency swaps and certain foreign currency denominated corporate debt as hedges of its net investment in foreign operations. At inception the Group documents the relationship between the hedging instrument and the hedged items, its risk management objectives and the strategy for undertaking the transaction. The Group also documents its assessment of whether the derivative is highly effective in offsetting changes in fair value or cash flows of hedged items, both at inception and future periods. Any gain or loss on the hedging instrument relating to the effective portion of the hedge is recognised in OCI. The gain or loss relating to the ineffective portion is recognised immediately in profit or loss within finance income or costs, as appropriate. If the hedging instrument no longer meets the criteria for hedge accounting, expires or is sold, terminated or exercised, or if the foreign operation is sold then hedge accounting is discontinued prospectively and gains or losses accumulated in OCI are reclassified to profit or loss. (b). Derivatives not designated as hedges Interest rate caps are used to economically hedge the Group’s exposure to certain borrowing related interest rate risks and are not formally designated as hedges for hedge accounting purposes. Changes in the fair value of these derivatives are recognised in profit or loss within finance income or finance cost as appropriate. The fair values of derivative instruments used for hedging purposes are disclosed in Note 26 and Note 27. The full fair value of a derivative is classified as a non-current asset or liability when its remaining maturity is more than one year; it is classified as a current asset or liability when its remaining maturity is less than one year. (c). Master netting or similar agreements The derivatives do not meet the criteria for offsetting in the balance sheet. This is because the Group does not have any currently legally enforceable right to offset recognised amounts, because the right to offset is enforceable only on the occurrence of future events such as credit events. Q. Share-based payments The Group enters into equity-settled share-based payment arrangements in respect of services provided to it by KW Investment Management Ltd (the ‘Investment Manager’). Where the method of settlement of the award is dependent on the achievement of a market-based performance condition which is outside of the control of the Company, and the award may be settled either through market purchase of shares or the issue of shares, the Company assesses the recognition by references to IAS 37. (i). Investment management fee In relation to the Investment Manager’s management fee at grant date, the monetary value of the award it will receive is dependent on a non-market performance condition, being the EPRA NAV at each quarter end. The award is accounted for as an equity-settled share-based payment arrangement. The cost of the services received in respect of the shares is recognised in the profit or loss over the vesting period, with a corresponding credit to equity. (ii). Performance fee The performance fee arrangement is accounted for as an equity-settled share-based payment arrangement. The grant date is 1 January and on that date, the Company estimates the grant date fair value of each equity instrument and the number of equity instruments for which the service and non-market performance conditions are expected to be satisfied, resulting in the initial estimate of the total share-based payment cost which is expensed over the vesting period. Subsequent to the initial recognition and measurement, the estimate of the number of equity instruments for which the service and non-market performance conditions are expected to be satisfied is revised during the vesting period, that is, the period from 1 January to 31 December. Ultimately, the share-based payment cost is based on the fair value of the number of equity instruments issued upon satisfaction of these conditions. R. Stated capital (i). Ordinary shares Ordinary shares are classified as equity. Incremental costs directly attributable to the issue of ordinary shares are recognised as a deduction from the stated capital account included in equity. S. Provisions Provisions are determined by discounting the expected future cash flows at a pre-tax rate that reflects current market assessments of the time value of money and the risk specific to the liability. Strategic report G overnance Fin an cials A dditional inform ation Kennedy Wilson Europe Real Estate Plc / Annual Report and Accounts 2015 97
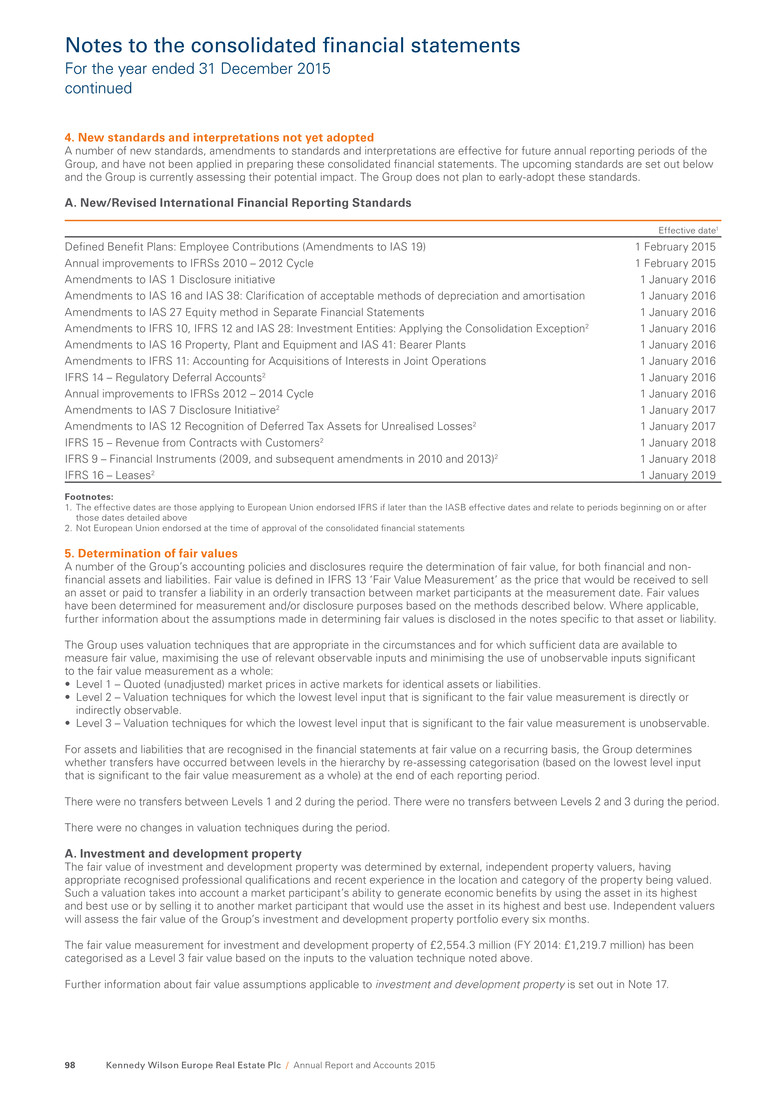
4. New standards and interpretations not yet adopted A number of new standards, amendments to standards and interpretations are effective for future annual reporting periods of the Group, and have not been applied in preparing these consolidated financial statements. The upcoming standards are set out below and the Group is currently assessing their potential impact. The Group does not plan to early-adopt these standards. A. New/Revised International Financial Reporting Standards Effective date1 Defined Benefit Plans: Employee Contributions (Amendments to IAS 19) 1 February 2015 Annual improvements to IFRSs 2010 – 2012 Cycle 1 February 2015 Amendments to IAS 1 Disclosure initiative 1 January 2016 Amendments to IAS 16 and IAS 38: Clarification of acceptable methods of depreciation and amortisation 1 January 2016 Amendments to IAS 27 Equity method in Separate Financial Statements 1 January 2016 Amendments to IFRS 10, IFRS 12 and IAS 28: Investment Entities: Applying the Consolidation Exception2 1 January 2016 Amendments to IAS 16 Property, Plant and Equipment and IAS 41: Bearer Plants 1 January 2016 Amendments to IFRS 11: Accounting for Acquisitions of Interests in Joint Operations 1 January 2016 IFRS 14 – Regulatory Deferral Accounts2 1 January 2016 Annual improvements to IFRSs 2012 – 2014 Cycle 1 January 2016 Amendments to IAS 7 Disclosure Initiative2 1 January 2017 Amendments to IAS 12 Recognition of Deferred Tax Assets for Unrealised Losses2 1 January 2017 IFRS 15 – Revenue from Contracts with Customers2 1 January 2018 IFRS 9 – Financial Instruments (2009, and subsequent amendments in 2010 and 2013)2 1 January 2018 IFRS 16 – Leases2 1 January 2019 Footnotes: 1. The effective dates are those applying to European Union endorsed IFRS if later than the IASB effective dates and relate to periods beginning on or after those dates detailed above 2. Not European Union endorsed at the time of approval of the consolidated financial statements 5. Determination of fair values A number of the Group’s accounting policies and disclosures require the determination of fair value, for both financial and non- financial assets and liabilities. Fair value is defined in IFRS 13 ‘Fair Value Measurement’ as the price that would be received to sell an asset or paid to transfer a liability in an orderly transaction between market participants at the measurement date. Fair values have been determined for measurement and/or disclosure purposes based on the methods described below. Where applicable, further information about the assumptions made in determining fair values is disclosed in the notes specific to that asset or liability. The Group uses valuation techniques that are appropriate in the circumstances and for which sufficient data are available to measure fair value, maximising the use of relevant observable inputs and minimising the use of unobservable inputs significant to the fair value measurement as a whole: • Level 1 – Quoted (unadjusted) market prices in active markets for identical assets or liabilities. • Level 2 – Valuation techniques for which the lowest level input that is significant to the fair value measurement is directly or indirectly observable. • Level 3 – Valuation techniques for which the lowest level input that is significant to the fair value measurement is unobservable. For assets and liabilities that are recognised in the financial statements at fair value on a recurring basis, the Group determines whether transfers have occurred between levels in the hierarchy by re-assessing categorisation (based on the lowest level input that is significant to the fair value measurement as a whole) at the end of each reporting period. There were no transfers between Levels 1 and 2 during the period. There were no transfers between Levels 2 and 3 during the period. There were no changes in valuation techniques during the period. A. Investment and development property The fair value of investment and development property was determined by external, independent property valuers, having appropriate recognised professional qualifications and recent experience in the location and category of the property being valued. Such a valuation takes into account a market participant’s ability to generate economic benefits by using the asset in its highest and best use or by selling it to another market participant that would use the asset in its highest and best use. Independent valuers will assess the fair value of the Group’s investment and development property portfolio every six months. The fair value measurement for investment and development property of £2,554.3 million (FY 2014: £1,219.7 million) has been categorised as a Level 3 fair value based on the inputs to the valuation technique noted above. Further information about fair value assumptions applicable to investment and development property is set out in Note 17. Notes to the consolidated financial statements For the year ended 31 December 2015 continued Kennedy Wilson Europe Real Estate Plc / Annual Report and Accounts 201598

B. Loans secured by real estate The fair value of loans secured by real estate was determined by independent valuers having appropriate and recent experience in the valuation of loans. Such independent valuers will assess the fair value of the Group’s portfolio of loans secured by real estate every six months. The fair value measurement for loans secured by real estate of £179.2 million (FY 2014: £211.0 million) has been categorised as a Level 3 fair value based on the inputs to the valuation technique noted above. Further information about fair value assumptions applicable to loans secured by real estate is set out in Note 18. C. Land and buildings The fair value of property, plant and equipment was determined by external, independent valuers, having appropriate recognised professional qualifications and recent experience in the location and category of the asset being valued. Such a valuation takes into account a market participant’s ability to generate economic benefits by using the asset in its highest and best use or by selling it to another market participant that would use the asset in its highest and best use. Independent valuers will assess the fair value of the Group’s land and buildings every six months. The fair value measurement for land and buildings (included within property, plant and equipment) of £54.6 million (FY 2014: £55.2 million) has been categorised as a Level 3 fair value based on the inputs to the valuation technique noted above. Further information about fair value assumptions applicable to property, plant and equipment is set out in Note 19. D. Borrowings The valuation technique used in the disclosures for borrowings and other debt is a comparison of debt stock to the marginal cost of debt (from main funding markets) in addition to discounting using the zero coupon discount curve of the relevant currency. The fair value measurement for bonds of £589.4 million (FY 2014: £nil) has been categorised as a Level 2 fair value based on the inputs to the valuation technique noted above. The fair value measurement for secured borrowings of £832.0 million (FY 2014: £545.9 million) has been categorised as a Level 3 fair value based on the inputs to the valuation technique noted above. Further information about borrowings is set out in Note 25. E. Derivative financial instruments The fair value of forward foreign currency contracts is based on independent third party valuations. Fair value is estimated by discounting the difference between the contractual forward price and the current forward price for the residual maturity of the contract using a risk-free interest rate (based on government bonds), adjusting for credit risk where appropriate. The fair value of interest rate caps is based on independent third party valuations. Fair value is estimated using Black’s model to calculate the net present value of expected future cash flows based on observable market volatility and interest rates, adjusting for credit risk, where appropriate. The fair value of foreign currency options is based on independent third party valuations. Fair value is estimated using a variant of the Black-Scholes model tailored for currency derivatives. The net present value of expected future cash flows is calculated based on observable market foreign exchange volatility, foreign exchange rates and interest rates, adjusting for credit risk, where appropriate. Further information about fair value assumptions applicable to derivative financial instruments is set out in Note 26. Strategic report G overnance Fin an cials A dditional inform ation Kennedy Wilson Europe Real Estate Plc / Annual Report and Accounts 2015 99
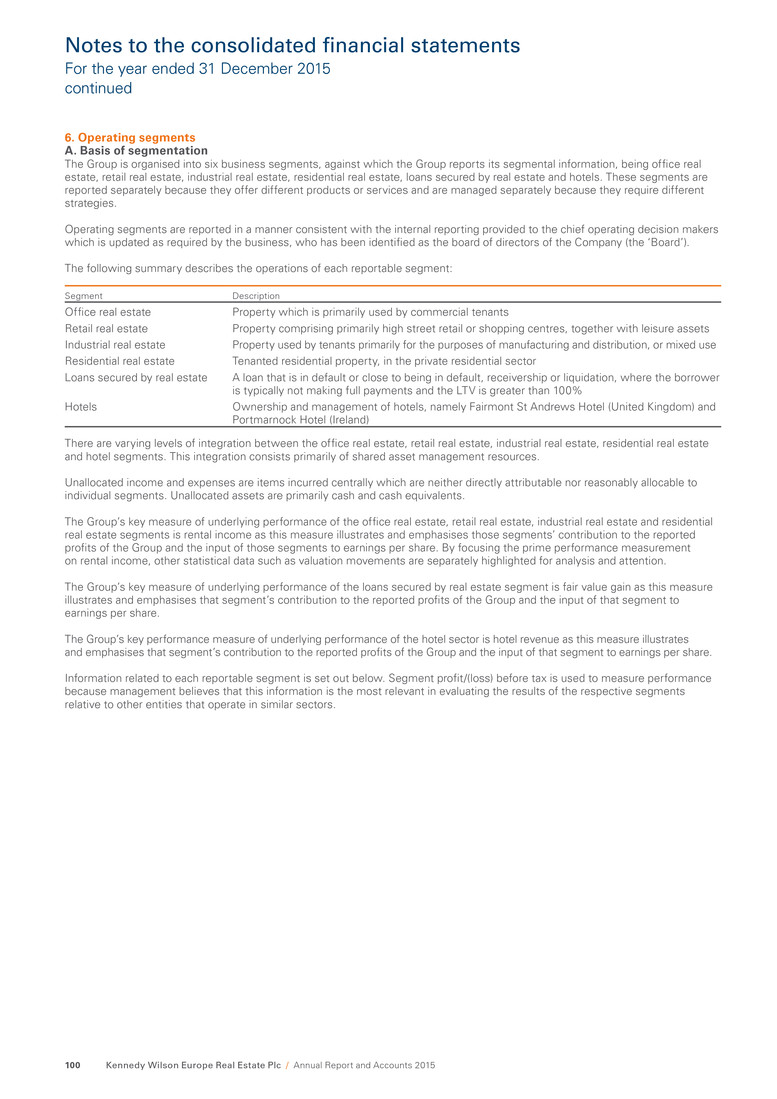
6. Operating segments A. Basis of segmentation The Group is organised into six business segments, against which the Group reports its segmental information, being office real estate, retail real estate, industrial real estate, residential real estate, loans secured by real estate and hotels. These segments are reported separately because they offer different products or services and are managed separately because they require different strategies. Operating segments are reported in a manner consistent with the internal reporting provided to the chief operating decision makers which is updated as required by the business, who has been identified as the board of directors of the Company (the ‘Board’). The following summary describes the operations of each reportable segment: Segment Description Office real estate Property which is primarily used by commercial tenants Retail real estate Property comprising primarily high street retail or shopping centres, together with leisure assets Industrial real estate Property used by tenants primarily for the purposes of manufacturing and distribution, or mixed use Residential real estate Tenanted residential property, in the private residential sector Loans secured by real estate A loan that is in default or close to being in default, receivership or liquidation, where the borrower is typically not making full payments and the LTV is greater than 100% Hotels Ownership and management of hotels, namely Fairmont St Andrews Hotel (United Kingdom) and Portmarnock Hotel (Ireland) There are varying levels of integration between the office real estate, retail real estate, industrial real estate, residential real estate and hotel segments. This integration consists primarily of shared asset management resources. Unallocated income and expenses are items incurred centrally which are neither directly attributable nor reasonably allocable to individual segments. Unallocated assets are primarily cash and cash equivalents. The Group’s key measure of underlying performance of the office real estate, retail real estate, industrial real estate and residential real estate segments is rental income as this measure illustrates and emphasises those segments’ contribution to the reported profits of the Group and the input of those segments to earnings per share. By focusing the prime performance measurement on rental income, other statistical data such as valuation movements are separately highlighted for analysis and attention. The Group’s key measure of underlying performance of the loans secured by real estate segment is fair value gain as this measure illustrates and emphasises that segment’s contribution to the reported profits of the Group and the input of that segment to earnings per share. The Group’s key performance measure of underlying performance of the hotel sector is hotel revenue as this measure illustrates and emphasises that segment’s contribution to the reported profits of the Group and the input of that segment to earnings per share. Information related to each reportable segment is set out below. Segment profit/(loss) before tax is used to measure performance because management believes that this information is the most relevant in evaluating the results of the respective segments relative to other entities that operate in similar sectors. Notes to the consolidated financial statements For the year ended 31 December 2015 continued Kennedy Wilson Europe Real Estate Plc / Annual Report and Accounts 2015100
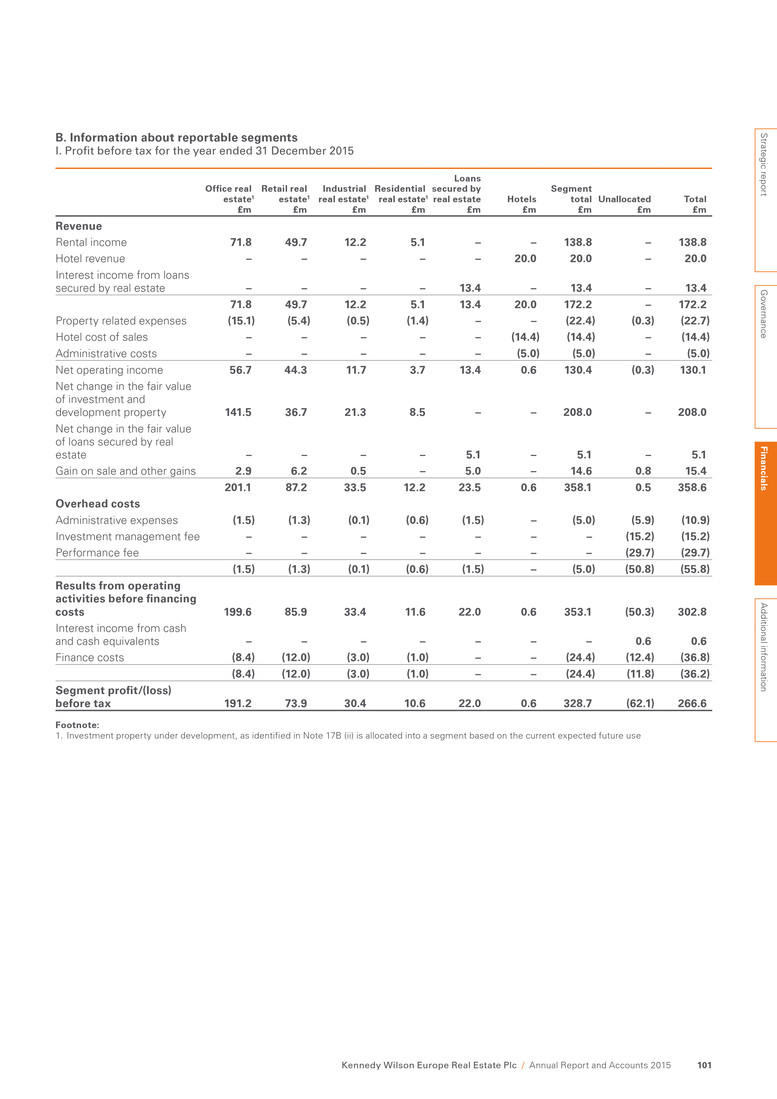
B. Information about reportable segments I. Profit before tax for the year ended 31 December 2015 Office real estate1 £m Retail real estate1 £m Industrial real estate1 £m Residential real estate1 £m Loans secured by real estate £m Hotels £m Segment total £m Unallocated £m Total £m Revenue Rental income 71.8 49.7 12.2 5.1 – – 138.8 – 138.8 Hotel revenue – – – – – 20.0 20.0 – 20.0 Interest income from loans secured by real estate – – – – 13.4 – 13.4 – 13.4 71.8 49.7 12.2 5.1 13.4 20.0 172.2 – 172.2 Property related expenses (15.1) (5.4) (0.5) (1.4) – – (22.4) (0.3) (22.7) Hotel cost of sales – – – – – (14.4) (14.4) – (14.4) Administrative costs – – – – – (5.0) (5.0) – (5.0) Net operating income 56.7 44.3 11.7 3.7 13.4 0.6 130.4 (0.3) 130.1 Net change in the fair value of investment and development property 141.5 36.7 21.3 8.5 – – 208.0 – 208.0 Net change in the fair value of loans secured by real estate – – – – 5.1 – 5.1 – 5.1 Gain on sale and other gains 2.9 6.2 0.5 – 5.0 – 14.6 0.8 15.4 201.1 87.2 33.5 12.2 23.5 0.6 358.1 0.5 358.6 Overhead costs Administrative expenses (1.5) (1.3) (0.1) (0.6) (1.5) – (5.0) (5.9) (10.9) Investment management fee – – – – – – – (15.2) (15.2) Performance fee – – – – – – – (29.7) (29.7) (1.5) (1.3) (0.1) (0.6) (1.5) – (5.0) (50.8) (55.8) Results from operating activities before financing costs 199.6 85.9 33.4 11.6 22.0 0.6 353.1 (50.3) 302.8 Interest income from cash and cash equivalents – – – – – – – 0.6 0.6 Finance costs (8.4) (12.0) (3.0) (1.0) – – (24.4) (12.4) (36.8) (8.4) (12.0) (3.0) (1.0) – – (24.4) (11.8) (36.2) Segment profit/(loss) before tax 191.2 73.9 30.4 10.6 22.0 0.6 328.7 (62.1) 266.6 Footnote: 1. Investment property under development, as identified in Note 17B (ii) is allocated into a segment based on the current expected future use Strategic report G overnance Fin an cials A dditional inform ation Kennedy Wilson Europe Real Estate Plc / Annual Report and Accounts 2015 101
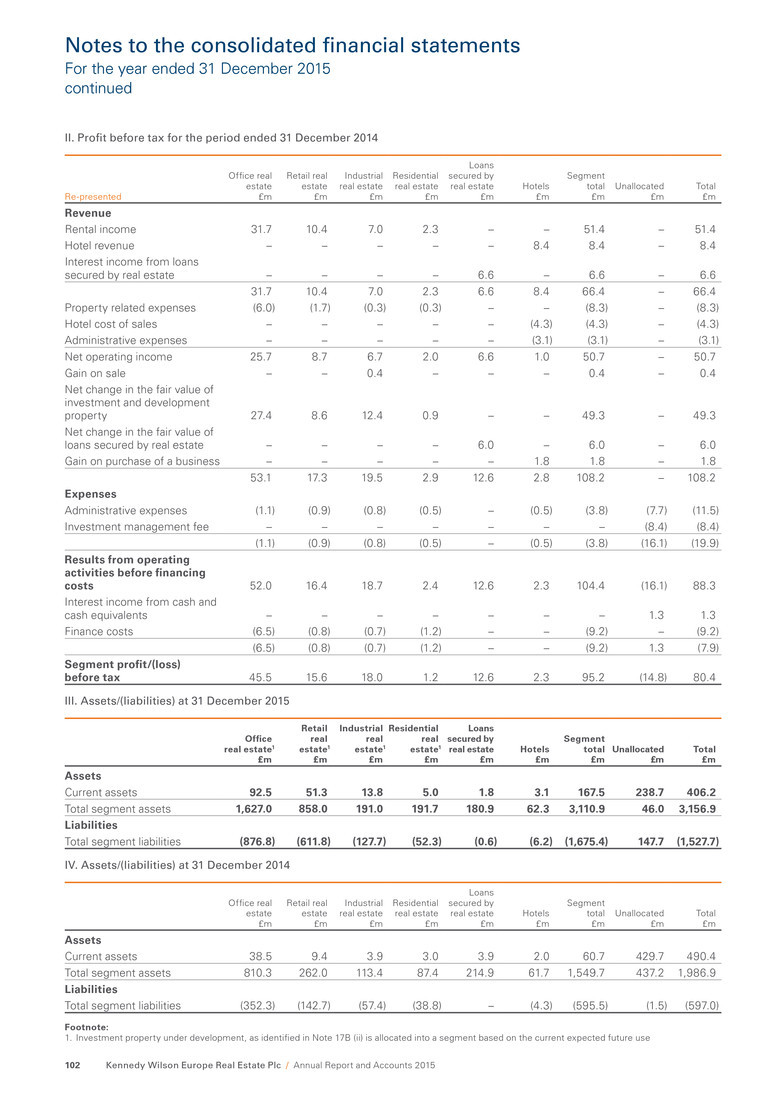
II. Profit before tax for the period ended 31 December 2014 Re-presented Office real estate £m Retail real estate £m Industrial real estate £m Residential real estate £m Loans secured by real estate £m Hotels £m Segment total £m Unallocated £m Total £m Revenue Rental income 31.7 10.4 7.0 2.3 – – 51.4 – 51.4 Hotel revenue – – – – – 8.4 8.4 – 8.4 Interest income from loans secured by real estate – – – – 6.6 – 6.6 – 6.6 31.7 10.4 7.0 2.3 6.6 8.4 66.4 – 66.4 Property related expenses (6.0) (1.7) (0.3) (0.3) – – (8.3) – (8.3) Hotel cost of sales – – – – – (4.3) (4.3) – (4.3) Administrative expenses – – – – – (3.1) (3.1) – (3.1) Net operating income 25.7 8.7 6.7 2.0 6.6 1.0 50.7 – 50.7 Gain on sale – – 0.4 – – – 0.4 – 0.4 Net change in the fair value of investment and development property 27.4 8.6 12.4 0.9 – – 49.3 – 49.3 Net change in the fair value of loans secured by real estate – – – – 6.0 – 6.0 – 6.0 Gain on purchase of a business – – – – – 1.8 1.8 – 1.8 53.1 17.3 19.5 2.9 12.6 2.8 108.2 – 108.2 Expenses Administrative expenses (1.1) (0.9) (0.8) (0.5) – (0.5) (3.8) (7.7) (11.5) Investment management fee – – – – – – – (8.4) (8.4) (1.1) (0.9) (0.8) (0.5) – (0.5) (3.8) (16.1) (19.9) Results from operating activities before financing costs 52.0 16.4 18.7 2.4 12.6 2.3 104.4 (16.1) 88.3 Interest income from cash and cash equivalents – – – – – – – 1.3 1.3 Finance costs (6.5) (0.8) (0.7) (1.2) – – (9.2) – (9.2) (6.5) (0.8) (0.7) (1.2) – – (9.2) 1.3 (7.9) Segment profit/(loss) before tax 45.5 15.6 18.0 1.2 12.6 2.3 95.2 (14.8) 80.4 III. Assets/(liabilities) at 31 December 2015 Office real estate1 £m Retail real estate1 £m Industrial real estate1 £m Residential real estate1 £m Loans secured by real estate £m Hotels £m Segment total £m Unallocated £m Total £m Assets Current assets 92.5 51.3 13.8 5.0 1.8 3.1 167.5 238.7 406.2 Total segment assets 1,627.0 858.0 191.0 191.7 180.9 62.3 3,110.9 46.0 3,156.9 Liabilities Total segment liabilities (876.8) (611.8) (127.7) (52.3) (0.6) (6.2) (1,675.4) 147.7 (1,527.7) IV. Assets/(liabilities) at 31 December 2014 Office real estate £m Retail real estate £m Industrial real estate £m Residential real estate £m Loans secured by real estate £m Hotels £m Segment total £m Unallocated £m Total £m Assets Current assets 38.5 9.4 3.9 3.0 3.9 2.0 60.7 429.7 490.4 Total segment assets 810.3 262.0 113.4 87.4 214.9 61.7 1,549.7 437.2 1,986.9 Liabilities Total segment liabilities (352.3) (142.7) (57.4) (38.8) – (4.3) (595.5) (1.5) (597.0) Footnote: 1. Investment property under development, as identified in Note 17B (ii) is allocated into a segment based on the current expected future use Notes to the consolidated financial statements For the year ended 31 December 2015 continued Kennedy Wilson Europe Real Estate Plc / Annual Report and Accounts 2015102
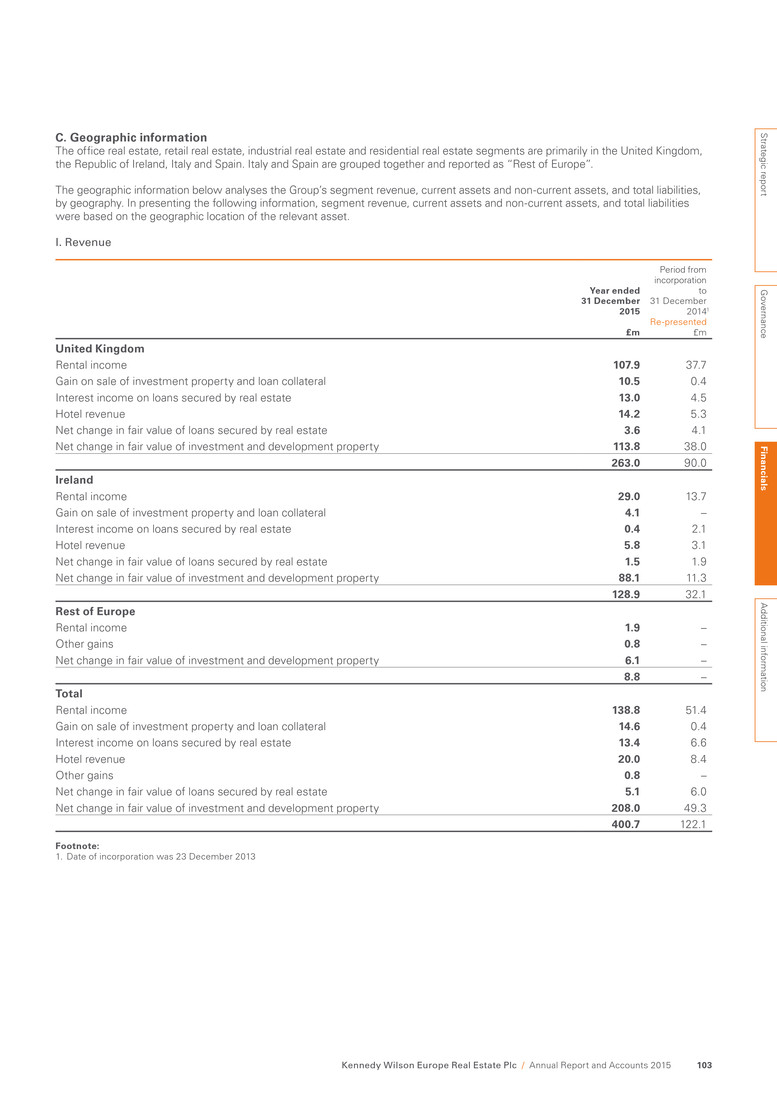
C. Geographic information The office real estate, retail real estate, industrial real estate and residential real estate segments are primarily in the United Kingdom, the Republic of Ireland, Italy and Spain. Italy and Spain are grouped together and reported as “Rest of Europe”. The geographic information below analyses the Group’s segment revenue, current assets and non-current assets, and total liabilities, by geography. In presenting the following information, segment revenue, current assets and non-current assets, and total liabilities were based on the geographic location of the relevant asset. I. Revenue Year ended 31 December 2015 £m Period from incorporation to 31 December 20141 Re-presented £m United Kingdom Rental income 107.9 37.7 Gain on sale of investment property and loan collateral 10.5 0.4 Interest income on loans secured by real estate 13.0 4.5 Hotel revenue 14.2 5.3 Net change in fair value of loans secured by real estate 3.6 4.1 Net change in fair value of investment and development property 113.8 38.0 263.0 90.0 Ireland Rental income 29.0 13.7 Gain on sale of investment property and loan collateral 4.1 – Interest income on loans secured by real estate 0.4 2.1 Hotel revenue 5.8 3.1 Net change in fair value of loans secured by real estate 1.5 1.9 Net change in fair value of investment and development property 88.1 11.3 128.9 32.1 Rest of Europe Rental income 1.9 – Other gains 0.8 – Net change in fair value of investment and development property 6.1 – 8.8 – Total Rental income 138.8 51.4 Gain on sale of investment property and loan collateral 14.6 0.4 Interest income on loans secured by real estate 13.4 6.6 Hotel revenue 20.0 8.4 Other gains 0.8 – Net change in fair value of loans secured by real estate 5.1 6.0 Net change in fair value of investment and development property 208.0 49.3 400.7 122.1 Footnote: 1. Date of incorporation was 23 December 2013 Strategic report G overnance Fin an cials A dditional inform ation Kennedy Wilson Europe Real Estate Plc / Annual Report and Accounts 2015 103
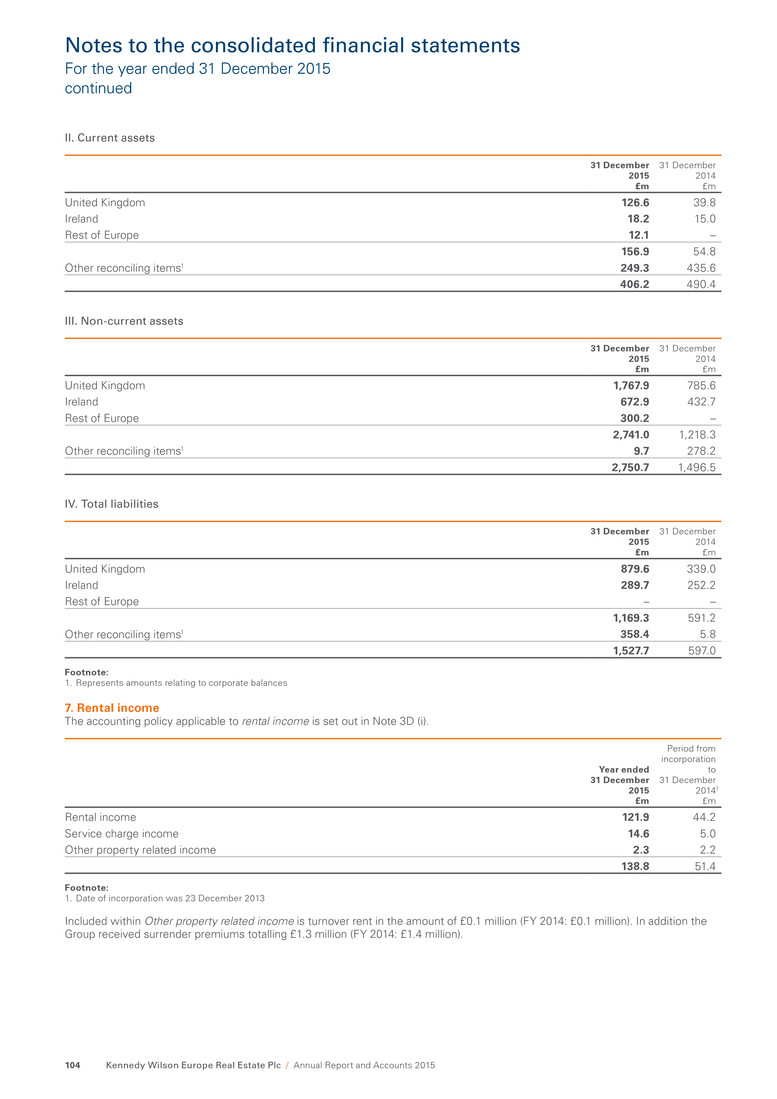
II. Current assets 31 December 2015 £m 31 December 2014 £m United Kingdom 126.6 39.8 Ireland 18.2 15.0 Rest of Europe 12.1 – 156.9 54.8 Other reconciling items1 249.3 435.6 406.2 490.4 III. Non-current assets 31 December 2015 £m 31 December 2014 £m United Kingdom 1,767.9 785.6 Ireland 672.9 432.7 Rest of Europe 300.2 – 2,741.0 1,218.3 Other reconciling items1 9.7 278.2 2,750.7 1,496.5 IV. Total liabilities 31 December 2015 £m 31 December 2014 £m United Kingdom 879.6 339.0 Ireland 289.7 252.2 Rest of Europe – – 1,169.3 591.2 Other reconciling items1 358.4 5.8 1,527.7 597.0 Footnote: 1. Represents amounts relating to corporate balances 7. Rental income The accounting policy applicable to rental income is set out in Note 3D (i). Year ended 31 December 2015 £m Period from incorporation to 31 December 20141 £m Rental income 121.9 44.2 Service charge income 14.6 5.0 Other property related income 2.3 2.2 138.8 51.4 Footnote: 1. Date of incorporation was 23 December 2013 Included within Other property related income is turnover rent in the amount of £0.1 million (FY 2014: £0.1 million). In addition the Group received surrender premiums totalling £1.3 million (FY 2014: £1.4 million). Notes to the consolidated financial statements For the year ended 31 December 2015 continued Kennedy Wilson Europe Real Estate Plc / Annual Report and Accounts 2015104
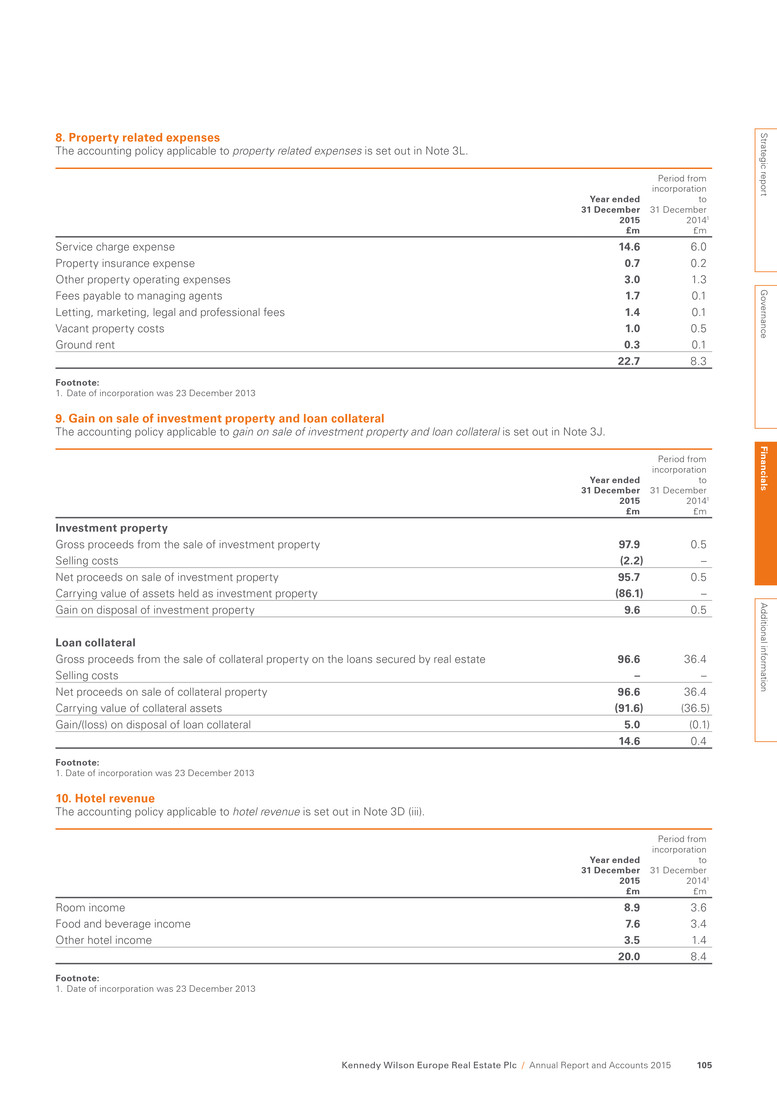
8. Property related expenses The accounting policy applicable to property related expenses is set out in Note 3L. Year ended 31 December 2015 £m Period from incorporation to 31 December 20141 £m Service charge expense 14.6 6.0 Property insurance expense 0.7 0.2 Other property operating expenses 3.0 1.3 Fees payable to managing agents 1.7 0.1 Letting, marketing, legal and professional fees 1.4 0.1 Vacant property costs 1.0 0.5 Ground rent 0.3 0.1 22.7 8.3 Footnote: 1. Date of incorporation was 23 December 2013 9. Gain on sale of investment property and loan collateral The accounting policy applicable to gain on sale of investment property and loan collateral is set out in Note 3J. Year ended 31 December 2015 £m Period from incorporation to 31 December 20141 £m Investment property Gross proceeds from the sale of investment property 97.9 0.5 Selling costs (2.2) – Net proceeds on sale of investment property 95.7 0.5 Carrying value of assets held as investment property (86.1) – Gain on disposal of investment property 9.6 0.5 Loan collateral Gross proceeds from the sale of collateral property on the loans secured by real estate 96.6 36.4 Selling costs – – Net proceeds on sale of collateral property 96.6 36.4 Carrying value of collateral assets (91.6) (36.5) Gain/(loss) on disposal of loan collateral 5.0 (0.1) 14.6 0.4 Footnote: 1. Date of incorporation was 23 December 2013 10. Hotel revenue The accounting policy applicable to hotel revenue is set out in Note 3D (iii). Year ended 31 December 2015 £m Period from incorporation to 31 December 20141 £m Room income 8.9 3.6 Food and beverage income 7.6 3.4 Other hotel income 3.5 1.4 20.0 8.4 Footnote: 1. Date of incorporation was 23 December 2013 Strategic report G overnance Fin an cials A dditional inform ation Kennedy Wilson Europe Real Estate Plc / Annual Report and Accounts 2015 105
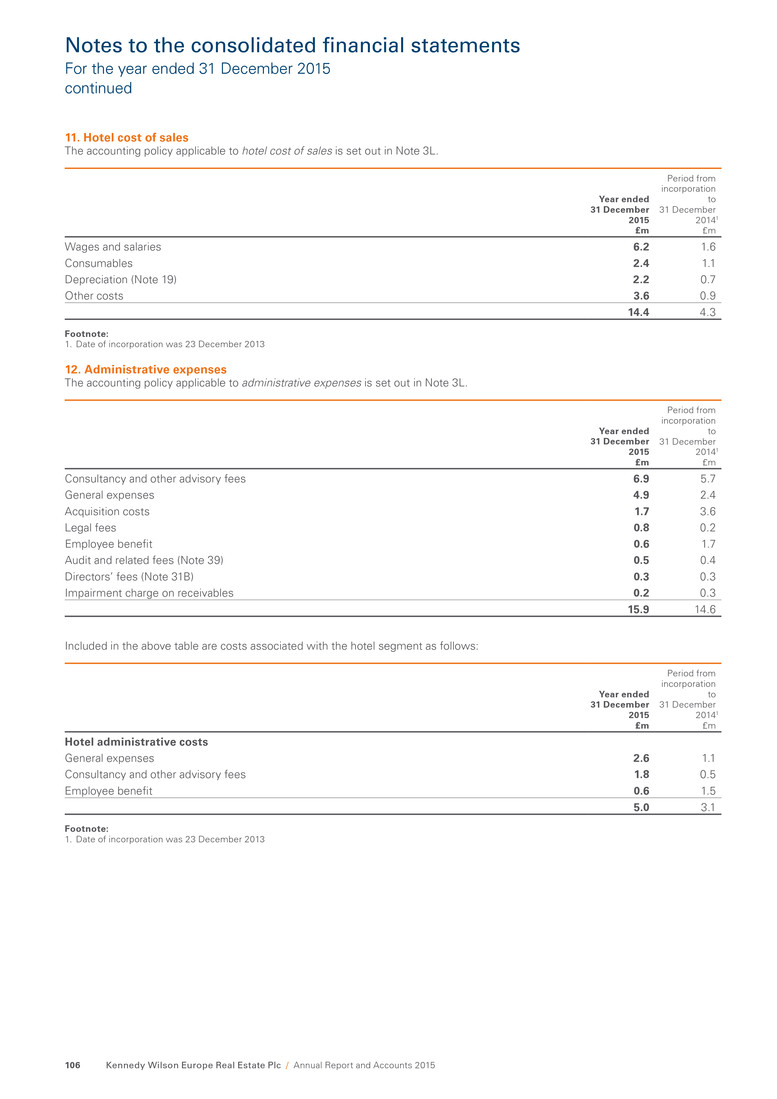
11. Hotel cost of sales The accounting policy applicable to hotel cost of sales is set out in Note 3L. Year ended 31 December 2015 £m Period from incorporation to 31 December 20141 £m Wages and salaries 6.2 1.6 Consumables 2.4 1.1 Depreciation (Note 19) 2.2 0.7 Other costs 3.6 0.9 14.4 4.3 Footnote: 1. Date of incorporation was 23 December 2013 12. Administrative expenses The accounting policy applicable to administrative expenses is set out in Note 3L. Year ended 31 December 2015 £m Period from incorporation to 31 December 20141 £m Consultancy and other advisory fees 6.9 5.7 General expenses 4.9 2.4 Acquisition costs 1.7 3.6 Legal fees 0.8 0.2 Employee benefit 0.6 1.7 Audit and related fees (Note 39) 0.5 0.4 Directors’ fees (Note 31B) 0.3 0.3 Impairment charge on receivables 0.2 0.3 15.9 14.6 Included in the above table are costs associated with the hotel segment as follows: Year ended 31 December 2015 £m Period from incorporation to 31 December 20141 £m Hotel administrative costs General expenses 2.6 1.1 Consultancy and other advisory fees 1.8 0.5 Employee benefit 0.6 1.5 5.0 3.1 Footnote: 1. Date of incorporation was 23 December 2013 Notes to the consolidated financial statements For the year ended 31 December 2015 continued Kennedy Wilson Europe Real Estate Plc / Annual Report and Accounts 2015106
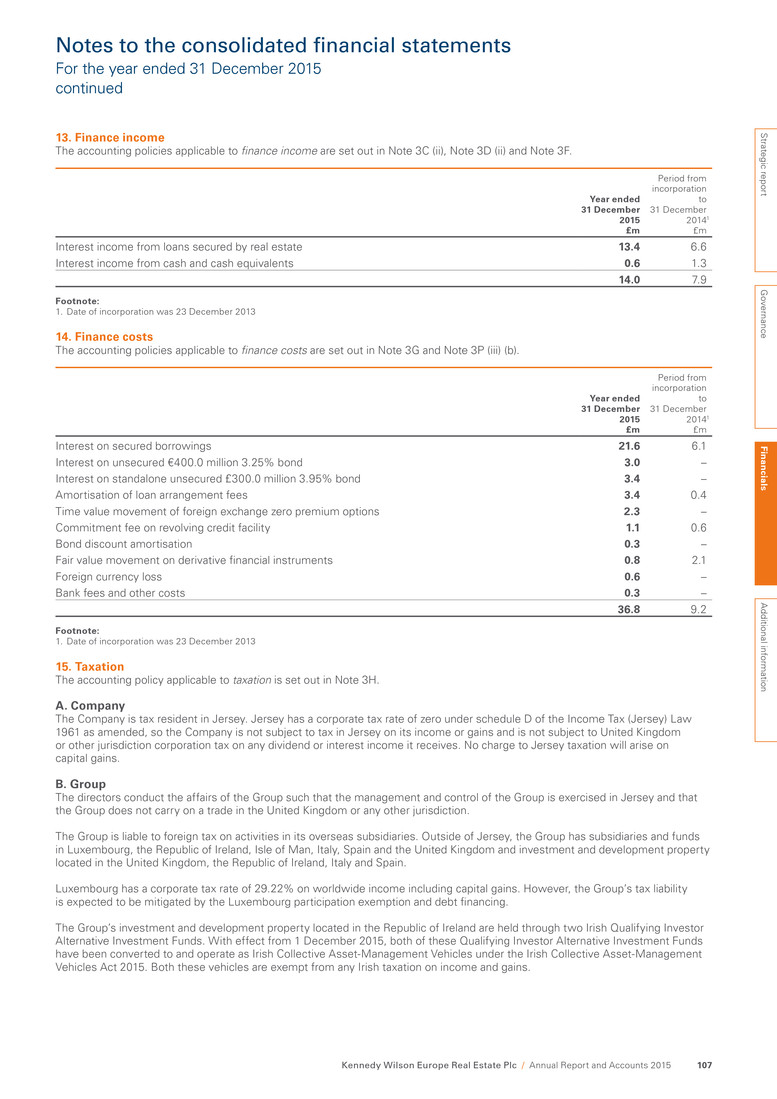
13. Finance income The accounting policies applicable to finance income are set out in Note 3C (ii), Note 3D (ii) and Note 3F. Year ended 31 December 2015 £m Period from incorporation to 31 December 20141 £m Interest income from loans secured by real estate 13.4 6.6 Interest income from cash and cash equivalents 0.6 1.3 14.0 7.9 Footnote: 1. Date of incorporation was 23 December 2013 14. Finance costs The accounting policies applicable to finance costs are set out in Note 3G and Note 3P (iii) (b). Year ended 31 December 2015 £m Period from incorporation to 31 December 20141 £m Interest on secured borrowings 21.6 6.1 Interest on unsecured €400.0 million 3.25% bond 3.0 – Interest on standalone unsecured £300.0 million 3.95% bond 3.4 – Amortisation of loan arrangement fees 3.4 0.4 Time value movement of foreign exchange zero premium options 2.3 – Commitment fee on revolving credit facility 1.1 0.6 Bond discount amortisation 0.3 – Fair value movement on derivative financial instruments 0.8 2.1 Foreign currency loss 0.6 – Bank fees and other costs 0.3 – 36.8 9.2 Footnote: 1. Date of incorporation was 23 December 2013 15. Taxation The accounting policy applicable to taxation is set out in Note 3H. A. Company The Company is tax resident in Jersey. Jersey has a corporate tax rate of zero under schedule D of the Income Tax (Jersey) Law 1961 as amended, so the Company is not subject to tax in Jersey on its income or gains and is not subject to United Kingdom or other jurisdiction corporation tax on any dividend or interest income it receives. No charge to Jersey taxation will arise on capital gains. B. Group The directors conduct the affairs of the Group such that the management and control of the Group is exercised in Jersey and that the Group does not carry on a trade in the United Kingdom or any other jurisdiction. The Group is liable to foreign tax on activities in its overseas subsidiaries. Outside of Jersey, the Group has subsidiaries and funds in Luxembourg, the Republic of Ireland, Isle of Man, Italy, Spain and the United Kingdom and investment and development property located in the United Kingdom, the Republic of Ireland, Italy and Spain. Luxembourg has a corporate tax rate of 29.22% on worldwide income including capital gains. However, the Group’s tax liability is expected to be mitigated by the Luxembourg participation exemption and debt financing. The Group’s investment and development property located in the Republic of Ireland are held through two Irish Qualifying Investor Alternative Investment Funds. With effect from 1 December 2015, both of these Qualifying Investor Alternative Investment Funds have been converted to and operate as Irish Collective Asset-Management Vehicles under the Irish Collective Asset-Management Vehicles Act 2015. Both these vehicles are exempt from any Irish taxation on income and gains. Notes to the consolidated financial statements For the year ended 31 December 2015 continued Strategic report G overnance Fin an cials A dditional inform ation Kennedy Wilson Europe Real Estate Plc / Annual Report and Accounts 2015 107

Notes to the consolidated financial statements For the year ended 31 December 2015 continued The Group’s investment property located in Italy is held through a closed-end real estate alternative investment fund named Olimpia Investment Fund, wholly-owned by the Company and managed by Savills Investment Management Sgr Spa. Olimpia Investment Fund is exempt from Italian tax on income and gains. The Group’s investment in St Andrew’s Bay Development Limited, a company domiciled in Scotland and which owns the Fairmont St Andrews Hotel, is subject to United Kingdom corporate tax at a rate of 20% (expected to reduce to 19% on 1 April 2017). The Group is subject to corporate income tax at 28% (25% from 2016 onwards) on taxable profits generated within its Spanish subsidiaries. The Group is subject to United Kingdom income tax on rental income arising on the investment properties, after deduction of allowable debt financing and allowable expenses. The treatment of such costs and expenses is estimated in the overall tax liability for the Group and requires judgement and assumptions regarding their deductibility. The Directors have considered comparable market evidence and practice in determining the extent to which such items are allowable. Taxation is currently calculated at a rate applicable to the relevant Group undertakings of 20%. C. Amounts recognised in the profit or loss Year ended 31 December 2015 £m Period from incorporation to 31 December 20141 £m Current tax expense Current period 7.6 1.9 7.6 1.9 Footnote: 1. Date of incorporation was 23 December 2013 D. Reconciliation of effective tax rate The charge for the year can be reconciled to the consolidated income statement as follows: Year ended 31 December 2015 £m Period from incorporation to 31 December 20141 £m Tax expense reconciliation Profit before tax for the period 266.6 80.4 Income tax charge using weighted average applicable tax rates 53.3 16.1 Tax effect of non-taxable income (22.9) (6.5) Non-taxable net fair value gains (23.3) (7.9) Tax effect of losses not previously recognised 0.1 0.1 Expenses disallowed 0.4 0.1 Tax charge 7.6 1.9 Effective tax rate on profit before tax (%) 20.0 20.0 Effective tax rate after allowable adjustments (%) 2.8 2.4 Analysed as arising from: Investment and development property located in the United Kingdom 7.4 1.9 Investment and development property located in Spain 0.2 – 7.6 1.9 Footnote: 1. Date of incorporation was 23 December 2013 Kennedy Wilson Europe Real Estate Plc / Annual Report and Accounts 2015108
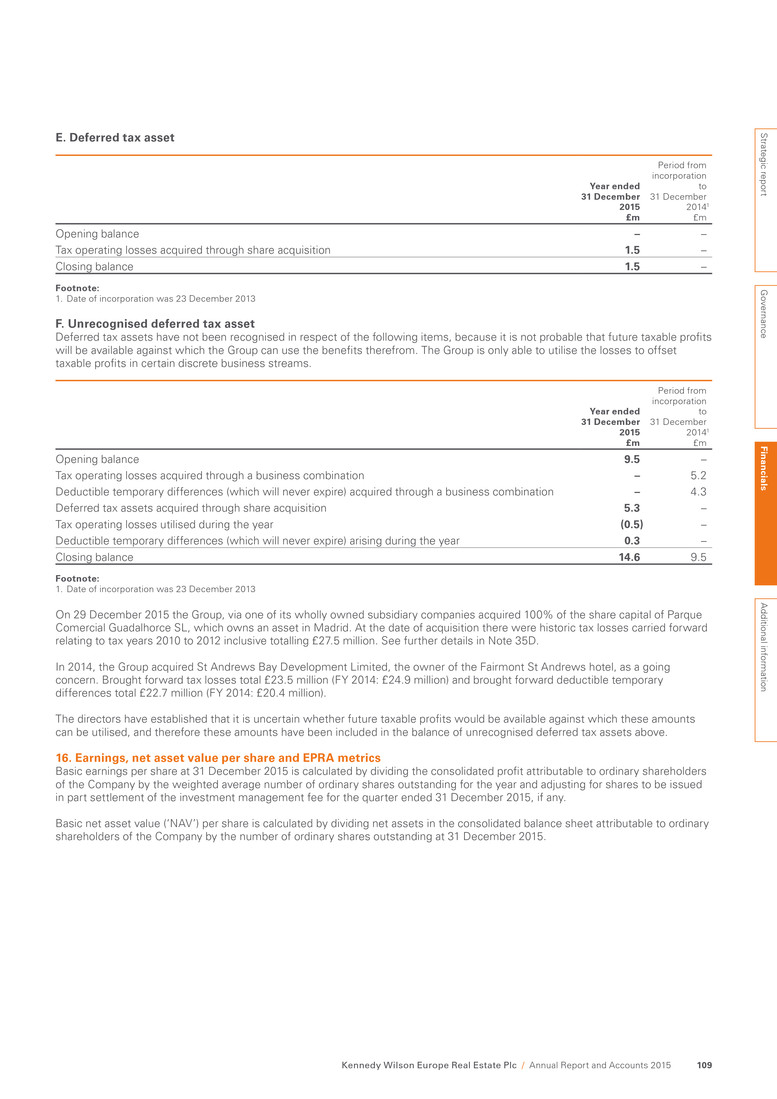
E. Deferred tax asset Year ended 31 December 2015 £m Period from incorporation to 31 December 20141 £m Opening balance – – Tax operating losses acquired through share acquisition 1.5 – Closing balance 1.5 – Footnote: 1. Date of incorporation was 23 December 2013 F. Unrecognised deferred tax asset Deferred tax assets have not been recognised in respect of the following items, because it is not probable that future taxable profits will be available against which the Group can use the benefits therefrom. The Group is only able to utilise the losses to offset taxable profits in certain discrete business streams. Year ended 31 December 2015 £m Period from incorporation to 31 December 20141 £m Opening balance 9.5 – Tax operating losses acquired through a business combination – 5.2 Deductible temporary differences (which will never expire) acquired through a business combination – 4.3 Deferred tax assets acquired through share acquisition 5.3 – Tax operating losses utilised during the year (0.5) – Deductible temporary differences (which will never expire) arising during the year 0.3 – Closing balance 14.6 9.5 Footnote: 1. Date of incorporation was 23 December 2013 On 29 December 2015 the Group, via one of its wholly owned subsidiary companies acquired 100% of the share capital of Parque Comercial Guadalhorce SL, which owns an asset in Madrid. At the date of acquisition there were historic tax losses carried forward relating to tax years 2010 to 2012 inclusive totalling £27.5 million. See further details in Note 35D. In 2014, the Group acquired St Andrews Bay Development Limited, the owner of the Fairmont St Andrews hotel, as a going concern. Brought forward tax losses total £23.5 million (FY 2014: £24.9 million) and brought forward deductible temporary differences total £22.7 million (FY 2014: £20.4 million). The directors have established that it is uncertain whether future taxable profits would be available against which these amounts can be utilised, and therefore these amounts have been included in the balance of unrecognised deferred tax assets above. 16. Earnings, net asset value per share and EPRA metrics Basic earnings per share at 31 December 2015 is calculated by dividing the consolidated profit attributable to ordinary shareholders of the Company by the weighted average number of ordinary shares outstanding for the year and adjusting for shares to be issued in part settlement of the investment management fee for the quarter ended 31 December 2015, if any. Basic net asset value (‘NAV’) per share is calculated by dividing net assets in the consolidated balance sheet attributable to ordinary shareholders of the Company by the number of ordinary shares outstanding at 31 December 2015. Strategic report G overnance Fin an cials A dditional inform ation Kennedy Wilson Europe Real Estate Plc / Annual Report and Accounts 2015 109

Notes to the consolidated financial statements For the year ended 31 December 2015 continued A. Basic, diluted, EPRA earnings and Adjusted earnings per share reconciliation Year ended 31 December 2015 Period from incorporation to 31 December 20141 £m p2 £m p2 Profit for the period after taxation 259.0 191.0 78.5 88.0 Adjusted for: Net change in fair value of investment and development property (Note 17) (208.0) (153.4) (49.3) (55.3) Net change in the fair value of loans secured by real estate (Note 18) (5.1) (3.8) (6.0) (6.7) Fair value loss on interest rate caps (Note 14) 0.8 0.6 2.1 2.4 Time value of foreign exchange zero premium options (Note 14) 2.3 1.6 – – Gain on purchase of a business and acquisition related expenditure 1.7 1.3 (1.8) (2.1) Gain on sale of investment property and loan collateral (Note 9) and other gains (15.4) (11.3) (0.4) (0.4) EPRA earnings 35.3 26.0 23.1 25.9 Group adjustments: Performance fee 29.7 21.9 – – Adjusted earnings 65.0 47.9 23.1 25.9 Weighted average number of ordinary shares (Note 28B) 135,613,838 89,071,782 Footnotes: 1. Date of incorporation was 23 December 2013 2. Per share amount The European Public Real Estate Association (‘EPRA’) issued Best Practices Recommendations, most recently in December 2014. The EPRA earnings are presented to provide what the Company believes is a more appropriate assessment of the operational income accruing to the Group’s activities. Hence, the Company adjusts basic earnings for income and costs which are not of a recurrent nature or which may be more of a capital nature. In addition, the Group has made additional adjustments to EPRA earnings in order to remove other non-trading items not considered by EPRA in its Best Practice Recommendations, in order to present an “Adjusted earnings” figure. B. Basic, EPRA NAV, Adjusted NAV and EPRA NNNAV per share reconciliation 31 December 2015 31 December 2014 £m p1 £m2 p1,2 Basic NAV 1,629.2 1,198.5 1,389.9 1,027.4 Adjusted for: Mark-to-market of derivative financial assets (Note 26) (0.9) (0.7) (1.3) (1.0) EPRA NAV 1,628.3 1,197.8 1,388.6 1,026.4 Group adjustments: Performance fee (Note 31A (ii)) (29.7) (21.8) – – Investment management fee (Note 31A (i)) (2.1) (1.5) (1.7) (1.2) Adjusted NAV 1,596.5 1,174.5 1,386.9 1,025.2 EPRA NNNAV EPRA NAV 1,628.3 1,197.8 1,388.6 1,026.4 Fair value of derivative financial assets (Note 26) 0.9 0.7 1.3 1.0 Fair value of borrowings3 (Note 25) (6.0) (4.2) – – EPRA NNNAV 1,623.2 1,194.3 1,389.9 1,027.4 Number of shares Ordinary shares in issue (Note 28B) 135,933,938 135,283,293 Footnotes: 1. Per share amount 2. 2014 comparative was re-presented in accordance with EPRA Best Practice Recommendations 2014 3. Represents the difference between the book value of borrowings and the fair value of borrowings Kennedy Wilson Europe Real Estate Plc / Annual Report and Accounts 2015110
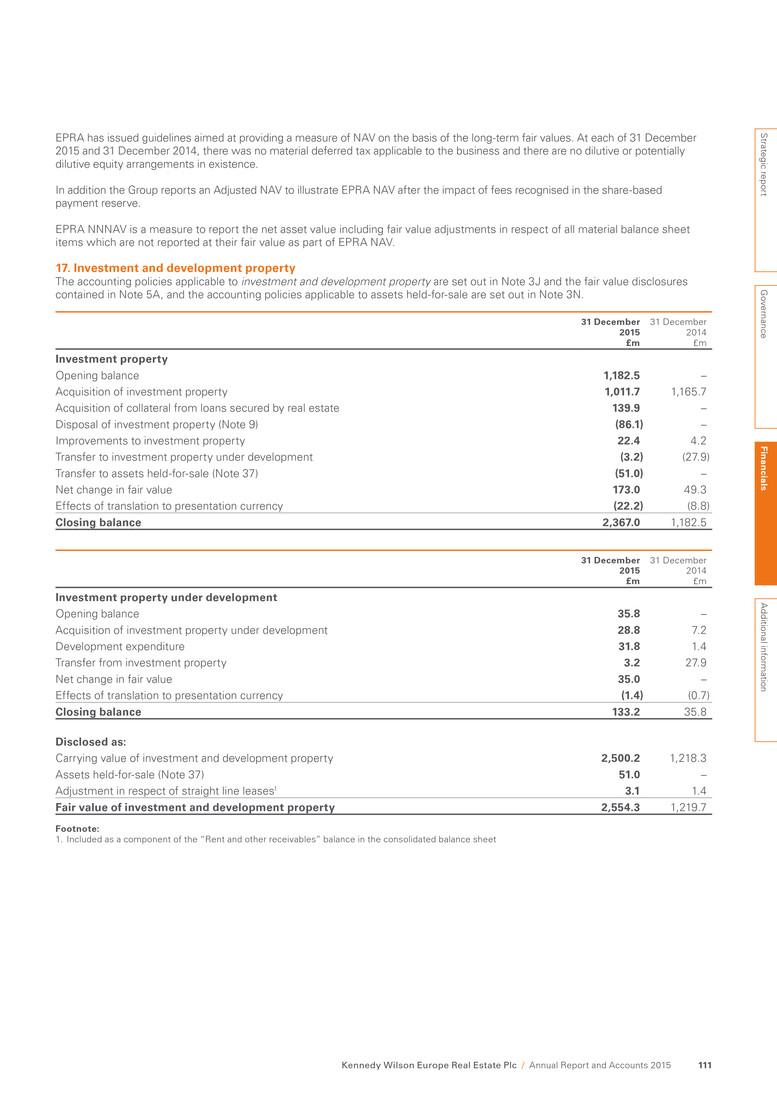
EPRA has issued guidelines aimed at providing a measure of NAV on the basis of the long-term fair values. At each of 31 December 2015 and 31 December 2014, there was no material deferred tax applicable to the business and there are no dilutive or potentially dilutive equity arrangements in existence. In addition the Group reports an Adjusted NAV to illustrate EPRA NAV after the impact of fees recognised in the share-based payment reserve. EPRA NNNAV is a measure to report the net asset value including fair value adjustments in respect of all material balance sheet items which are not reported at their fair value as part of EPRA NAV. 17. Investment and development property The accounting policies applicable to investment and development property are set out in Note 3J and the fair value disclosures contained in Note 5A, and the accounting policies applicable to assets held-for-sale are set out in Note 3N. 31 December 2015 £m 31 December 2014 £m Investment property Opening balance 1,182.5 – Acquisition of investment property 1,011.7 1,165.7 Acquisition of collateral from loans secured by real estate 139.9 – Disposal of investment property (Note 9) (86.1) – Improvements to investment property 22.4 4.2 Transfer to investment property under development (3.2) (27.9) Transfer to assets held-for-sale (Note 37) (51.0) – Net change in fair value 173.0 49.3 Effects of translation to presentation currency (22.2) (8.8) Closing balance 2,367.0 1,182.5 31 December 2015 £m 31 December 2014 £m Investment property under development Opening balance 35.8 – Acquisition of investment property under development 28.8 7.2 Development expenditure 31.8 1.4 Transfer from investment property 3.2 27.9 Net change in fair value 35.0 – Effects of translation to presentation currency (1.4) (0.7) Closing balance 133.2 35.8 Disclosed as: Carrying value of investment and development property 2,500.2 1,218.3 Assets held-for-sale (Note 37) 51.0 – Adjustment in respect of straight line leases1 3.1 1.4 Fair value of investment and development property 2,554.3 1,219.7 Footnote: 1. Included as a component of the “Rent and other receivables” balance in the consolidated balance sheet Strategic report G overnance Fin an cials A dditional inform ation Kennedy Wilson Europe Real Estate Plc / Annual Report and Accounts 2015 111
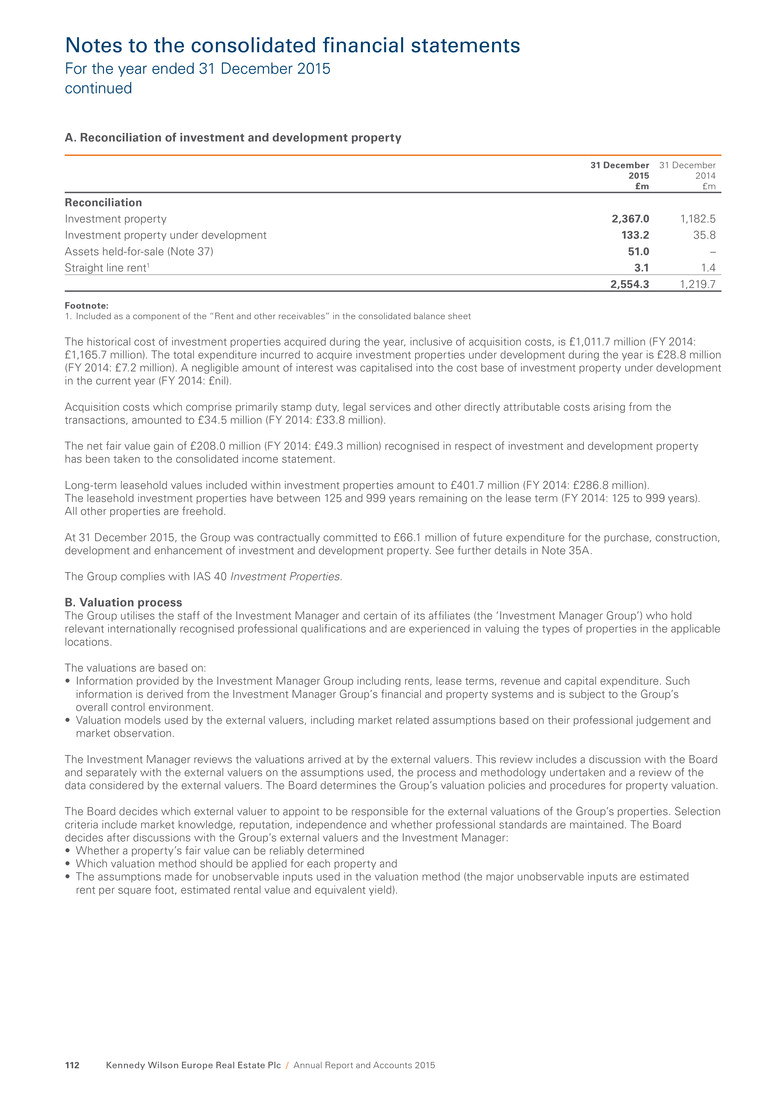
Notes to the consolidated financial statements For the year ended 31 December 2015 continued A. Reconciliation of investment and development property 31 December 2015 £m 31 December 2014 £m Reconciliation Investment property 2,367.0 1,182.5 Investment property under development 133.2 35.8 Assets held-for-sale (Note 37) 51.0 – Straight line rent1 3.1 1.4 2,554.3 1,219.7 Footnote: 1. Included as a component of the “Rent and other receivables” in the consolidated balance sheet The historical cost of investment properties acquired during the year, inclusive of acquisition costs, is £1,011.7 million (FY 2014: £1,165.7 million). The total expenditure incurred to acquire investment properties under development during the year is £28.8 million (FY 2014: £7.2 million). A negligible amount of interest was capitalised into the cost base of investment property under development in the current year (FY 2014: £nil). Acquisition costs which comprise primarily stamp duty, legal services and other directly attributable costs arising from the transactions, amounted to £34.5 million (FY 2014: £33.8 million). The net fair value gain of £208.0 million (FY 2014: £49.3 million) recognised in respect of investment and development property has been taken to the consolidated income statement. Long-term leasehold values included within investment properties amount to £401.7 million (FY 2014: £286.8 million). The leasehold investment properties have between 125 and 999 years remaining on the lease term (FY 2014: 125 to 999 years). All other properties are freehold. At 31 December 2015, the Group was contractually committed to £66.1 million of future expenditure for the purchase, construction, development and enhancement of investment and development property. See further details in Note 35A. The Group complies with IAS 40 Investment Properties. B. Valuation process The Group utilises the staff of the Investment Manager and certain of its affiliates (the ‘Investment Manager Group’) who hold relevant internationally recognised professional qualifications and are experienced in valuing the types of properties in the applicable locations. The valuations are based on: • Information provided by the Investment Manager Group including rents, lease terms, revenue and capital expenditure. Such information is derived from the Investment Manager Group’s financial and property systems and is subject to the Group’s overall control environment. • Valuation models used by the external valuers, including market related assumptions based on their professional judgement and market observation. The Investment Manager reviews the valuations arrived at by the external valuers. This review includes a discussion with the Board and separately with the external valuers on the assumptions used, the process and methodology undertaken and a review of the data considered by the external valuers. The Board determines the Group’s valuation policies and procedures for property valuation. The Board decides which external valuer to appoint to be responsible for the external valuations of the Group’s properties. Selection criteria include market knowledge, reputation, independence and whether professional standards are maintained. The Board decides after discussions with the Group’s external valuers and the Investment Manager: • Whether a property’s fair value can be reliably determined • Which valuation method should be applied for each property and • The assumptions made for unobservable inputs used in the valuation method (the major unobservable inputs are estimated rent per square foot, estimated rental value and equivalent yield). Kennedy Wilson Europe Real Estate Plc / Annual Report and Accounts 2015112
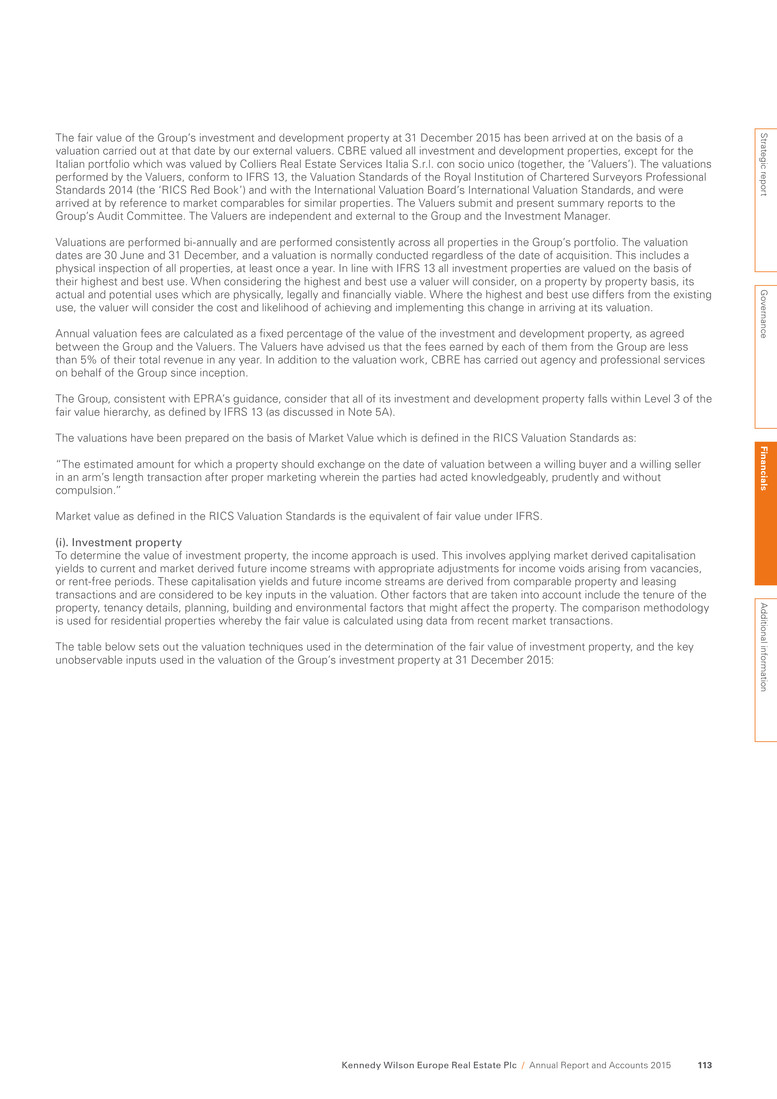
The fair value of the Group’s investment and development property at 31 December 2015 has been arrived at on the basis of a valuation carried out at that date by our external valuers. CBRE valued all investment and development properties, except for the Italian portfolio which was valued by Colliers Real Estate Services Italia S.r.l. con socio unico (together, the ‘Valuers’). The valuations performed by the Valuers, conform to IFRS 13, the Valuation Standards of the Royal Institution of Chartered Surveyors Professional Standards 2014 (the ‘RICS Red Book’) and with the International Valuation Board’s International Valuation Standards, and were arrived at by reference to market comparables for similar properties. The Valuers submit and present summary reports to the Group’s Audit Committee. The Valuers are independent and external to the Group and the Investment Manager. Valuations are performed bi-annually and are performed consistently across all properties in the Group’s portfolio. The valuation dates are 30 June and 31 December, and a valuation is normally conducted regardless of the date of acquisition. This includes a physical inspection of all properties, at least once a year. In line with IFRS 13 all investment properties are valued on the basis of their highest and best use. When considering the highest and best use a valuer will consider, on a property by property basis, its actual and potential uses which are physically, legally and financially viable. Where the highest and best use differs from the existing use, the valuer will consider the cost and likelihood of achieving and implementing this change in arriving at its valuation. Annual valuation fees are calculated as a fixed percentage of the value of the investment and development property, as agreed between the Group and the Valuers. The Valuers have advised us that the fees earned by each of them from the Group are less than 5% of their total revenue in any year. In addition to the valuation work, CBRE has carried out agency and professional services on behalf of the Group since inception. The Group, consistent with EPRA’s guidance, consider that all of its investment and development property falls within Level 3 of the fair value hierarchy, as defined by IFRS 13 (as discussed in Note 5A). The valuations have been prepared on the basis of Market Value which is defined in the RICS Valuation Standards as: “The estimated amount for which a property should exchange on the date of valuation between a willing buyer and a willing seller in an arm’s length transaction after proper marketing wherein the parties had acted knowledgeably, prudently and without compulsion.” Market value as defined in the RICS Valuation Standards is the equivalent of fair value under IFRS. (i). Investment property To determine the value of investment property, the income approach is used. This involves applying market derived capitalisation yields to current and market derived future income streams with appropriate adjustments for income voids arising from vacancies, or rent-free periods. These capitalisation yields and future income streams are derived from comparable property and leasing transactions and are considered to be key inputs in the valuation. Other factors that are taken into account include the tenure of the property, tenancy details, planning, building and environmental factors that might affect the property. The comparison methodology is used for residential properties whereby the fair value is calculated using data from recent market transactions. The table below sets out the valuation techniques used in the determination of the fair value of investment property, and the key unobservable inputs used in the valuation of the Group’s investment property at 31 December 2015: Strategic report G overnance Fin an cials A dditional inform ation Kennedy Wilson Europe Real Estate Plc / Annual Report and Accounts 2015 113
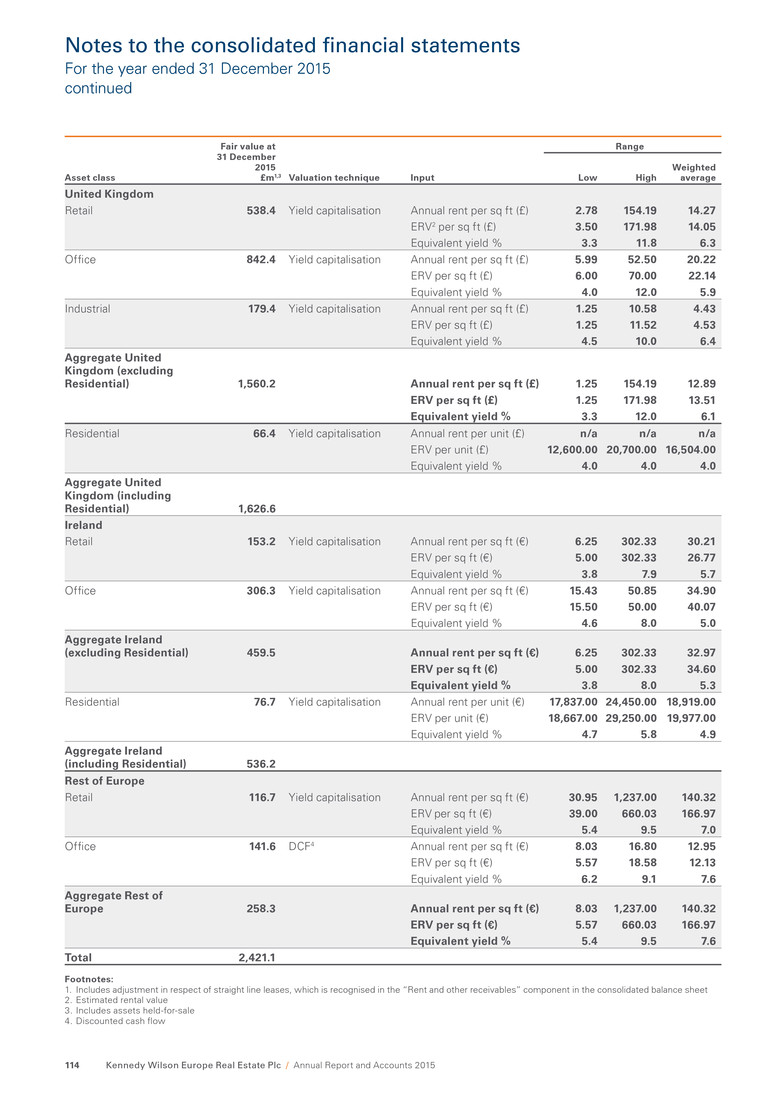
Notes to the consolidated financial statements For the year ended 31 December 2015 continued Asset class Fair value at 31 December 2015 £m1,3 Valuation technique Input Range Low High Weighted average United Kingdom Retail 538.4 Yield capitalisation Annual rent per sq ft (£) 2.78 154.19 14.27 ERV2 per sq ft (£) 3.50 171.98 14.05 Equivalent yield % 3.3 11.8 6.3 Office 842.4 Yield capitalisation Annual rent per sq ft (£) 5.99 52.50 20.22 ERV per sq ft (£) 6.00 70.00 22.14 Equivalent yield % 4.0 12.0 5.9 Industrial 179.4 Yield capitalisation Annual rent per sq ft (£) 1.25 10.58 4.43 ERV per sq ft (£) 1.25 11.52 4.53 Equivalent yield % 4.5 10.0 6.4 Aggregate United Kingdom (excluding Residential) 1,560.2 Annual rent per sq ft (£) 1.25 154.19 12.89 ERV per sq ft (£) 1.25 171.98 13.51 Equivalent yield % 3.3 12.0 6.1 Residential 66.4 Yield capitalisation Annual rent per unit (£) n/a n/a n/a ERV per unit (£) 12,600.00 20,700.00 16,504.00 Equivalent yield % 4.0 4.0 4.0 Aggregate United Kingdom (including Residential) 1,626.6 Ireland Retail 153.2 Yield capitalisation Annual rent per sq ft (€) 6.25 302.33 30.21 ERV per sq ft (€) 5.00 302.33 26.77 Equivalent yield % 3.8 7.9 5.7 Office 306.3 Yield capitalisation Annual rent per sq ft (€) 15.43 50.85 34.90 ERV per sq ft (€) 15.50 50.00 40.07 Equivalent yield % 4.6 8.0 5.0 Aggregate Ireland (excluding Residential) 459.5 Annual rent per sq ft (€) 6.25 302.33 32.97 ERV per sq ft (€) 5.00 302.33 34.60 Equivalent yield % 3.8 8.0 5.3 Residential 76.7 Yield capitalisation Annual rent per unit (€) 17,837.00 24,450.00 18,919.00 ERV per unit (€) 18,667.00 29,250.00 19,977.00 Equivalent yield % 4.7 5.8 4.9 Aggregate Ireland (including Residential) 536.2 Rest of Europe Retail 116.7 Yield capitalisation Annual rent per sq ft (€) 30.95 1,237.00 140.32 ERV per sq ft (€) 39.00 660.03 166.97 Equivalent yield % 5.4 9.5 7.0 Office 141.6 DCF4 Annual rent per sq ft (€) 8.03 16.80 12.95 ERV per sq ft (€) 5.57 18.58 12.13 Equivalent yield % 6.2 9.1 7.6 Aggregate Rest of Europe 258.3 Annual rent per sq ft (€) 8.03 1,237.00 140.32 ERV per sq ft (€) 5.57 660.03 166.97 Equivalent yield % 5.4 9.5 7.6 Total 2,421.1 Footnotes: 1. Includes adjustment in respect of straight line leases, which is recognised in the “Rent and other receivables” component in the consolidated balance sheet 2. Estimated rental value 3. Includes assets held-for-sale 4. Discounted cash flow Kennedy Wilson Europe Real Estate Plc / Annual Report and Accounts 2015114

The table below sets out the valuation techniques used in the determination of the fair value of investment property, and the key unobservable inputs used in the valuation of the Group’s investment property at 31 December 2014: Asset class Fair value at 31 December 2014 £m1 Valuation technique Input Range Low High Weighted average United Kingdom Retail 106.8 Yield capitalisation Annual rent per sq ft (£) 3.02 59.91 10.98 ERV2 per sq ft (£) 4.72 98.97 10.59 Equivalent yield % 4.2 23.4 7.3 Office 565.3 Yield capitalisation Annual rent per sq ft (£) 0.90 47.17 14.91 ERV per sq ft (£) 6.66 54.57 18.94 Equivalent yield % 5.0 17.0 6.5 Industrial 109.5 Yield capitalisation Annual rent per sq ft (£) 0.89 10.54 3.94 ERV per sq ft (£) 1.75 10.48 4.17 Equivalent yield % 5.4 16.3 7.3 Aggregate United Kingdom 781.6 Annual rent per sq ft (£) 0.89 59.91 9.95 ERV per sq ft (£) 1.75 98.97 11.82 Equivalent yield % 4.2 23.4 6.7 Ireland Retail 145.0 Yield capitalisation Annual rent per sq ft (€) 7.64 210.53 22.14 ERV per sq ft (€) 7.49 206.19 19.17 Equivalent yield % 4.6 8.0 6.0 Office 183.5 Yield capitalisation Annual rent per sq ft (€) 15.43 51.93 37.63 ERV per sq ft (€) 30.00 40.00 34.92 Equivalent yield % 4.7 6.0 5.0 Aggregate Ireland (excluding Residential) 328.5 Annual rent per sq ft (€) 15.43 210.53 28.18 ERV per sq ft (€) 7.49 206.19 25.31 Equivalent yield % 4.7 8.0 5.5 Residential 72.4 Yield capitalisation Annual rent per unit (€) 16,081.00 16,718.00 16,227.00 ERV per unit (€) 15,744.00 19,696.00 18,789.00 Equivalent yield % 5.0 5.9 5.1 Aggregate Ireland (including Residential) 400.9 Total 1,182.5 Footnotes: 1. Includes adjustment in respect of straight line leases, which is recognised in the “Rent and other receivables” component in the consolidated balance sheet 2. Estimated rental value Strategic report G overnance Fin an cials A dditional inform ation Kennedy Wilson Europe Real Estate Plc / Annual Report and Accounts 2015 115
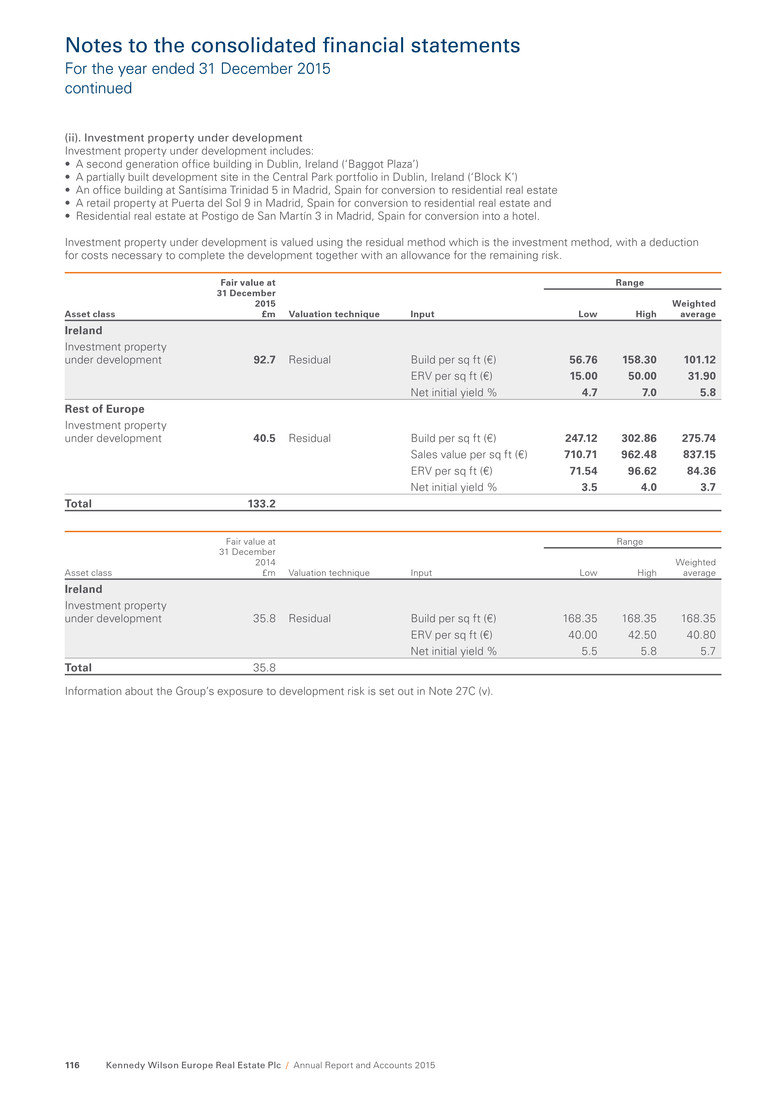
Notes to the consolidated financial statements For the year ended 31 December 2015 continued (ii). Investment property under development Investment property under development includes: • A second generation office building in Dublin, Ireland (‘Baggot Plaza’) • A partially built development site in the Central Park portfolio in Dublin, Ireland (‘Block K’) • An office building at Santísima Trinidad 5 in Madrid, Spain for conversion to residential real estate • A retail property at Puerta del Sol 9 in Madrid, Spain for conversion to residential real estate and • Residential real estate at Postigo de San Martín 3 in Madrid, Spain for conversion into a hotel. Investment property under development is valued using the residual method which is the investment method, with a deduction for costs necessary to complete the development together with an allowance for the remaining risk. Asset class Fair value at 31 December 2015 £m Valuation technique Input Range Low High Weighted average Ireland Investment property under development 92.7 Residual Build per sq ft (€) 56.76 158.30 101.12 ERV per sq ft (€) 15.00 50.00 31.90 Net initial yield % 4.7 7.0 5.8 Rest of Europe Investment property under development 40.5 Residual Build per sq ft (€) 247.12 302.86 275.74 Sales value per sq ft (€) 710.71 962.48 837.15 ERV per sq ft (€) 71.54 96.62 84.36 Net initial yield % 3.5 4.0 3.7 Total 133.2 Asset class Fair value at 31 December 2014 £m Valuation technique Input Range Low High Weighted average Ireland Investment property under development 35.8 Residual Build per sq ft (€) 168.35 168.35 168.35 ERV per sq ft (€) 40.00 42.50 40.80 Net initial yield % 5.5 5.8 5.7 Total 35.8 Information about the Group’s exposure to development risk is set out in Note 27C (v). Kennedy Wilson Europe Real Estate Plc / Annual Report and Accounts 2015116
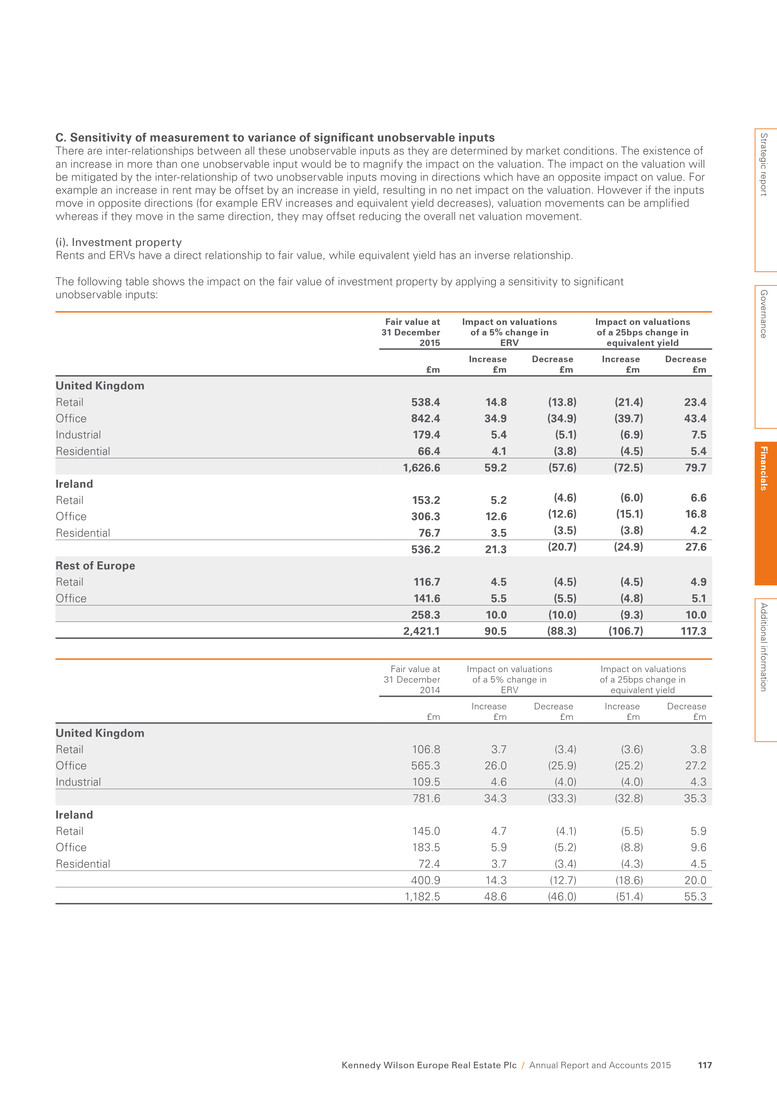
C. Sensitivity of measurement to variance of significant unobservable inputs There are inter-relationships between all these unobservable inputs as they are determined by market conditions. The existence of an increase in more than one unobservable input would be to magnify the impact on the valuation. The impact on the valuation will be mitigated by the inter-relationship of two unobservable inputs moving in directions which have an opposite impact on value. For example an increase in rent may be offset by an increase in yield, resulting in no net impact on the valuation. However if the inputs move in opposite directions (for example ERV increases and equivalent yield decreases), valuation movements can be amplified whereas if they move in the same direction, they may offset reducing the overall net valuation movement. (i). Investment property Rents and ERVs have a direct relationship to fair value, while equivalent yield has an inverse relationship. The following table shows the impact on the fair value of investment property by applying a sensitivity to significant unobservable inputs: Fair value at 31 December 2015 Impact on valuations of a 5% change in ERV Impact on valuations of a 25bps change in equivalent yield £m Increase £m Decrease £m Increase £m Decrease £m United Kingdom Retail 538.4 14.8 (13.8) (21.4) 23.4 Office 842.4 34.9 (34.9) (39.7) 43.4 Industrial 179.4 5.4 (5.1) (6.9) 7.5 Residential 66.4 4.1 (3.8) (4.5) 5.4 1,626.6 59.2 (57.6) (72.5) 79.7 Ireland Retail 153.2 5.2 (4.6) (6.0) 6.6 Office 306.3 12.6 (12.6) (15.1) 16.8 Residential 76.7 3.5 (3.5) (3.8) 4.2 536.2 21.3 (20.7) (24.9) 27.6 Rest of Europe Retail 116.7 4.5 (4.5) (4.5) 4.9 Office 141.6 5.5 (5.5) (4.8) 5.1 258.3 10.0 (10.0) (9.3) 10.0 2,421.1 90.5 (88.3) (106.7) 117.3 Fair value at 31 December 2014 Impact on valuations of a 5% change in ERV Impact on valuations of a 25bps change in equivalent yield £m Increase £m Decrease £m Increase £m Decrease £m United Kingdom Retail 106.8 3.7 (3.4) (3.6) 3.8 Office 565.3 26.0 (25.9) (25.2) 27.2 Industrial 109.5 4.6 (4.0) (4.0) 4.3 781.6 34.3 (33.3) (32.8) 35.3 Ireland Retail 145.0 4.7 (4.1) (5.5) 5.9 Office 183.5 5.9 (5.2) (8.8) 9.6 Residential 72.4 3.7 (3.4) (4.3) 4.5 400.9 14.3 (12.7) (18.6) 20.0 1,182.5 48.6 (46.0) (51.4) 55.3 Strategic report G overnance Fin an cials A dditional inform ation Kennedy Wilson Europe Real Estate Plc / Annual Report and Accounts 2015 117

Notes to the consolidated financial statements For the year ended 31 December 2015 continued (ii). Investment property under development An increase/decrease in costs to complete and the discount factor will decrease/increase valuations respectively. The following table shows the impact on the fair value of investment property under development by applying a sensitivity to significant unobservable inputs used: Fair value at 31 December 2015 Impact on valuation of a 5% change in build costs Impact on valuations of a 5% change on ERV/sales value Impact on valuations of a 25bps change in net initial yield £m Increase £m Decrease £m Increase £m Decrease £m Increase £m Decrease £m Ireland Investment property under development 92.7 (1.1) 1.1 5.6 (5.6) (6.4) 7.2 Rest of Europe Investment property under development 40.5 (0.4) 0.3 2.7 (2.8) (2.3) 2.6 133.2 (1.5) 1.4 8.3 (8.4) (8.7) 9.8 Fair value at 31 December 2014 Impact on valuation of a 5% change in build costs Impact on valuations of a 5% change on rental value Impact on valuations of a 25bps change in net initial yield £m Increase £m Decrease £m Increase £m Decrease £m Increase £m Decrease £m Ireland Investment property under development 35.8 (2.2) 2.2 2.0 (2.2) (1.1) 1.1 35.8 (2.2) 2.2 2.0 (2.2) (1.1) 1.1 D. Fair value of collateral At 31 December 2015 the Group had pledged a total of 269 investment properties with a fair value of £1,567.8 million (FY 2014: 75 investment properties with a fair value of £987.9 million). See further details in Note 25F. 18. Loans secured by real estate The accounting policy applicable to loans secured by real estate is set out in Note 3P (i) (c) and the fair value disclosures contained in Note 5B. 31 December 2015 £m 31 December 2014 £m Opening balance 211.0 – Acquisition of loans secured by real estate 130.4 241.4 Disposal of collateral (161.9) (36.4) Net fair value movement 5.1 6.0 Effects of translation to presentation currency (5.4) – Closing balance 179.2 211.0 Loans secured by real estate are non-performing and were acquired at a discount to their nominal value reflecting their distressed state at the time of acquisition. At 31 December 2015, all of the loans are past due. None of the loans are expected to be repaid by recourse to the original borrower, although income from certain underlying collateral properties is being generated. The majority of the loans were the subject of a receivership when acquired and thus all cash flow from the property is transferred to the Group. As a result of these factors, no disclosures are made in relation to maturity, age or interest rate risk. The objective in purchasing these loans was to generate returns for the Group in the following ways: • Property operating income will be generated from the portfolio of loans secured by real estate or • Disposal of the collateral assets over time to achieve a redemption of the loan at a value greater than the acquisition cost or • Acquisition of the collateral asset by the Company for inclusion in the investment and development property portfolio. The Board is responsible for determining the fair value of the loans secured by real estate bi-annually. The valuation dates are 30 June and 31 December. Duff & Phelps Ltd., an independent valuation firm, provided third party valuation consulting services to the Board which consisted of certain limited procedures that the Board identified and requested them to perform. Kennedy Wilson Europe Real Estate Plc / Annual Report and Accounts 2015118
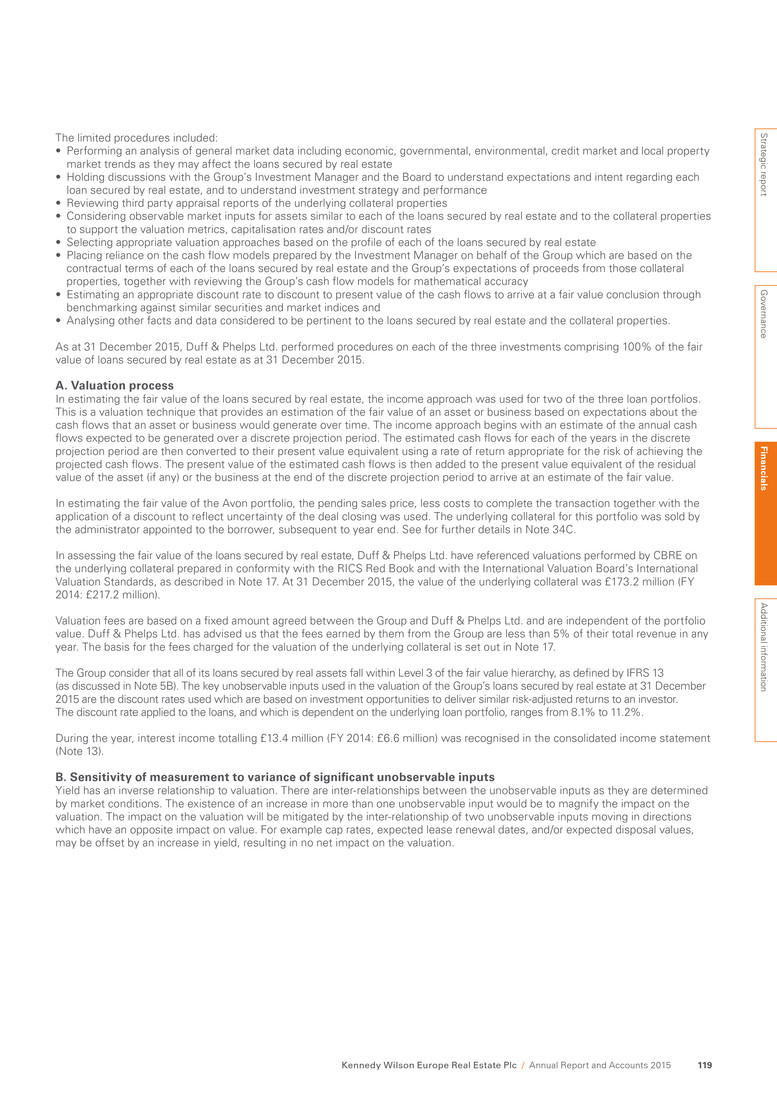
The limited procedures included: • Performing an analysis of general market data including economic, governmental, environmental, credit market and local property market trends as they may affect the loans secured by real estate • Holding discussions with the Group’s Investment Manager and the Board to understand expectations and intent regarding each loan secured by real estate, and to understand investment strategy and performance • Reviewing third party appraisal reports of the underlying collateral properties • Considering observable market inputs for assets similar to each of the loans secured by real estate and to the collateral properties to support the valuation metrics, capitalisation rates and/or discount rates • Selecting appropriate valuation approaches based on the profile of each of the loans secured by real estate • Placing reliance on the cash flow models prepared by the Investment Manager on behalf of the Group which are based on the contractual terms of each of the loans secured by real estate and the Group’s expectations of proceeds from those collateral properties, together with reviewing the Group’s cash flow models for mathematical accuracy • Estimating an appropriate discount rate to discount to present value of the cash flows to arrive at a fair value conclusion through benchmarking against similar securities and market indices and • Analysing other facts and data considered to be pertinent to the loans secured by real estate and the collateral properties. As at 31 December 2015, Duff & Phelps Ltd. performed procedures on each of the three investments comprising 100% of the fair value of loans secured by real estate as at 31 December 2015. A. Valuation process In estimating the fair value of the loans secured by real estate, the income approach was used for two of the three loan portfolios. This is a valuation technique that provides an estimation of the fair value of an asset or business based on expectations about the cash flows that an asset or business would generate over time. The income approach begins with an estimate of the annual cash flows expected to be generated over a discrete projection period. The estimated cash flows for each of the years in the discrete projection period are then converted to their present value equivalent using a rate of return appropriate for the risk of achieving the projected cash flows. The present value of the estimated cash flows is then added to the present value equivalent of the residual value of the asset (if any) or the business at the end of the discrete projection period to arrive at an estimate of the fair value. In estimating the fair value of the Avon portfolio, the pending sales price, less costs to complete the transaction together with the application of a discount to reflect uncertainty of the deal closing was used. The underlying collateral for this portfolio was sold by the administrator appointed to the borrower, subsequent to year end. See for further details in Note 34C. In assessing the fair value of the loans secured by real estate, Duff & Phelps Ltd. have referenced valuations performed by CBRE on the underlying collateral prepared in conformity with the RICS Red Book and with the International Valuation Board’s International Valuation Standards, as described in Note 17. At 31 December 2015, the value of the underlying collateral was £173.2 million (FY 2014: £217.2 million). Valuation fees are based on a fixed amount agreed between the Group and Duff & Phelps Ltd. and are independent of the portfolio value. Duff & Phelps Ltd. has advised us that the fees earned by them from the Group are less than 5% of their total revenue in any year. The basis for the fees charged for the valuation of the underlying collateral is set out in Note 17. The Group consider that all of its loans secured by real assets fall within Level 3 of the fair value hierarchy, as defined by IFRS 13 (as discussed in Note 5B). The key unobservable inputs used in the valuation of the Group’s loans secured by real estate at 31 December 2015 are the discount rates used which are based on investment opportunities to deliver similar risk-adjusted returns to an investor. The discount rate applied to the loans, and which is dependent on the underlying loan portfolio, ranges from 8.1% to 11.2%. During the year, interest income totalling £13.4 million (FY 2014: £6.6 million) was recognised in the consolidated income statement (Note 13). B. Sensitivity of measurement to variance of significant unobservable inputs Yield has an inverse relationship to valuation. There are inter-relationships between the unobservable inputs as they are determined by market conditions. The existence of an increase in more than one unobservable input would be to magnify the impact on the valuation. The impact on the valuation will be mitigated by the inter-relationship of two unobservable inputs moving in directions which have an opposite impact on value. For example cap rates, expected lease renewal dates, and/or expected disposal values, may be offset by an increase in yield, resulting in no net impact on the valuation. Strategic report G overnance Fin an cials A dditional inform ation Kennedy Wilson Europe Real Estate Plc / Annual Report and Accounts 2015 119
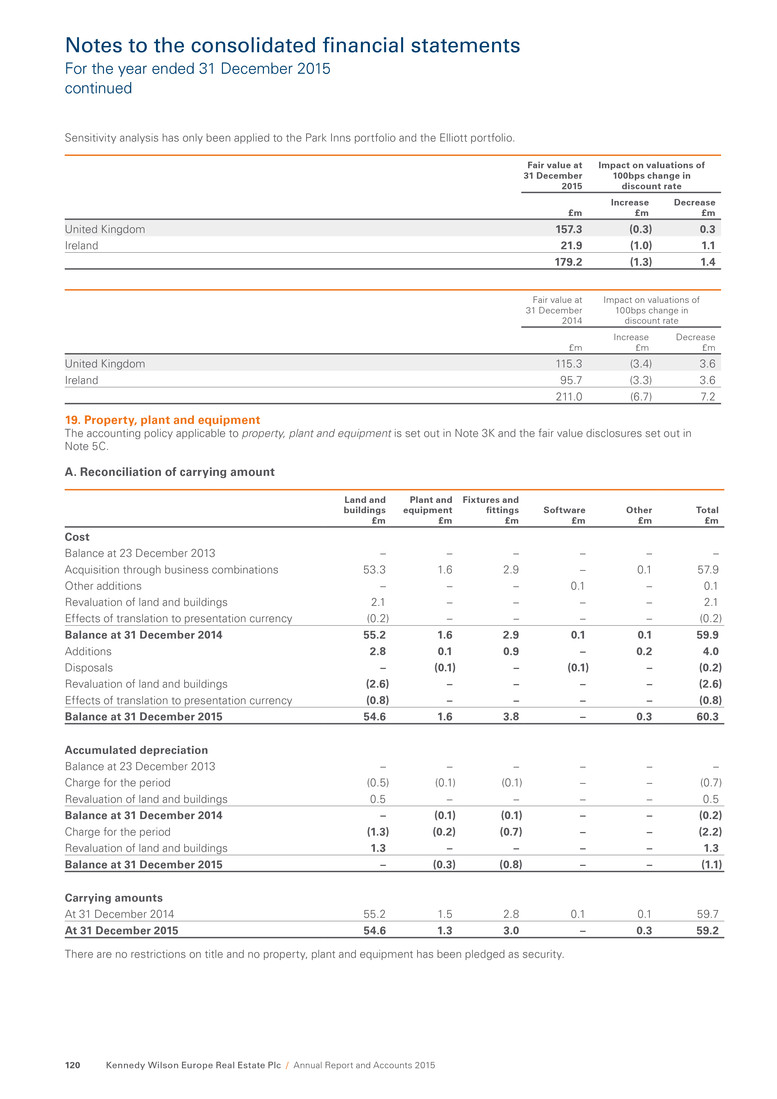
Notes to the consolidated financial statements For the year ended 31 December 2015 continued Sensitivity analysis has only been applied to the Park Inns portfolio and the Elliott portfolio. Fair value at 31 December 2015 Impact on valuations of 100bps change in discount rate £m Increase £m Decrease £m United Kingdom 157.3 (0.3) 0.3 Ireland 21.9 (1.0) 1.1 179.2 (1.3) 1.4 Fair value at 31 December 2014 Impact on valuations of 100bps change in discount rate £m Increase £m Decrease £m United Kingdom 115.3 (3.4) 3.6 Ireland 95.7 (3.3) 3.6 211.0 (6.7) 7.2 19. Property, plant and equipment The accounting policy applicable to property, plant and equipment is set out in Note 3K and the fair value disclosures set out in Note 5C. A. Reconciliation of carrying amount Land and buildings £m Plant and equipment £m Fixtures and fittings £m Software £m Other £m Total £m Cost Balance at 23 December 2013 – – – – – – Acquisition through business combinations 53.3 1.6 2.9 – 0.1 57.9 Other additions – – – 0.1 – 0.1 Revaluation of land and buildings 2.1 – – – – 2.1 Effects of translation to presentation currency (0.2) – – – – (0.2) Balance at 31 December 2014 55.2 1.6 2.9 0.1 0.1 59.9 Additions 2.8 0.1 0.9 – 0.2 4.0 Disposals – (0.1) – (0.1) – (0.2) Revaluation of land and buildings (2.6) – – – – (2.6) Effects of translation to presentation currency (0.8) – – – – (0.8) Balance at 31 December 2015 54.6 1.6 3.8 – 0.3 60.3 Accumulated depreciation Balance at 23 December 2013 – – – – – – Charge for the period (0.5) (0.1) (0.1) – – (0.7) Revaluation of land and buildings 0.5 – – – – 0.5 Balance at 31 December 2014 – (0.1) (0.1) – – (0.2) Charge for the period (1.3) (0.2) (0.7) – – (2.2) Revaluation of land and buildings 1.3 – – – – 1.3 Balance at 31 December 2015 – (0.3) (0.8) – – (1.1) Carrying amounts At 31 December 2014 55.2 1.5 2.8 0.1 0.1 59.7 At 31 December 2015 54.6 1.3 3.0 – 0.3 59.2 There are no restrictions on title and no property, plant and equipment has been pledged as security. Kennedy Wilson Europe Real Estate Plc / Annual Report and Accounts 2015120
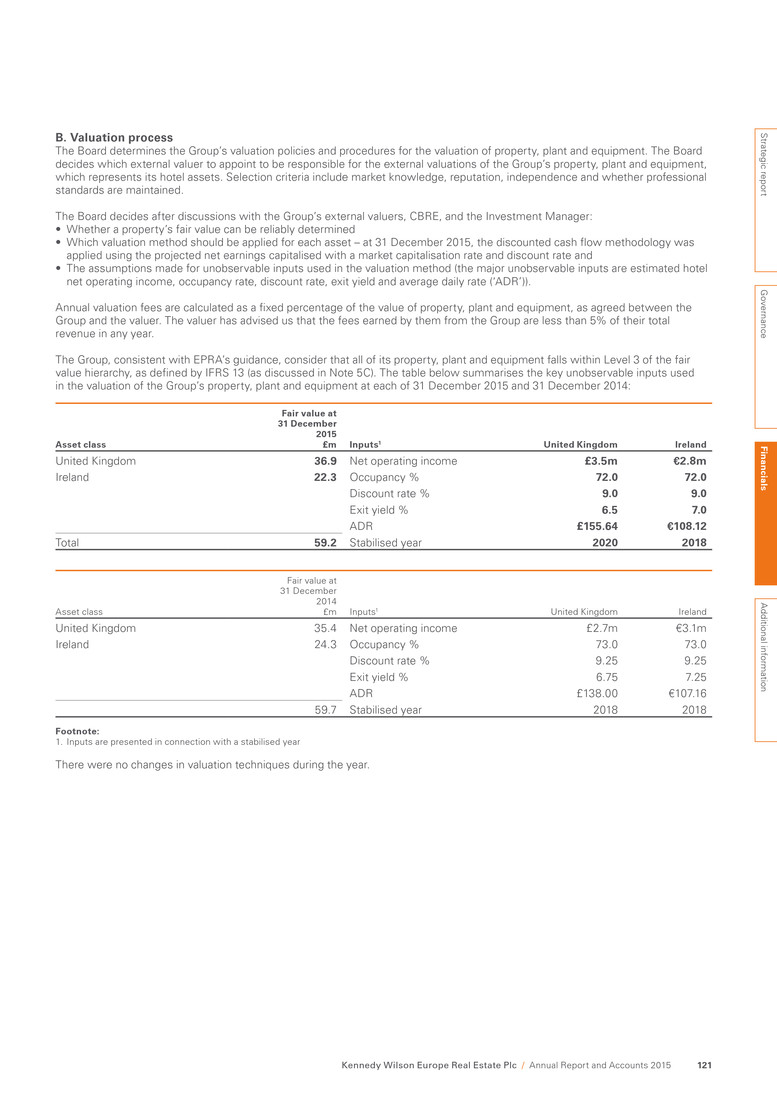
B. Valuation process The Board determines the Group’s valuation policies and procedures for the valuation of property, plant and equipment. The Board decides which external valuer to appoint to be responsible for the external valuations of the Group’s property, plant and equipment, which represents its hotel assets. Selection criteria include market knowledge, reputation, independence and whether professional standards are maintained. The Board decides after discussions with the Group’s external valuers, CBRE, and the Investment Manager: • Whether a property’s fair value can be reliably determined • Which valuation method should be applied for each asset – at 31 December 2015, the discounted cash flow methodology was applied using the projected net earnings capitalised with a market capitalisation rate and discount rate and • The assumptions made for unobservable inputs used in the valuation method (the major unobservable inputs are estimated hotel net operating income, occupancy rate, discount rate, exit yield and average daily rate (‘ADR’)). Annual valuation fees are calculated as a fixed percentage of the value of property, plant and equipment, as agreed between the Group and the valuer. The valuer has advised us that the fees earned by them from the Group are less than 5% of their total revenue in any year. The Group, consistent with EPRA’s guidance, consider that all of its property, plant and equipment falls within Level 3 of the fair value hierarchy, as defined by IFRS 13 (as discussed in Note 5C). The table below summarises the key unobservable inputs used in the valuation of the Group’s property, plant and equipment at each of 31 December 2015 and 31 December 2014: Asset class Fair value at 31 December 2015 £m Inputs1 United Kingdom Ireland United Kingdom 36.9 Net operating income £3.5m €2.8m Ireland 22.3 Occupancy % 72.0 72.0 Discount rate % 9.0 9.0 Exit yield % 6.5 7.0 ADR £155.64 €108.12 Total 59.2 Stabilised year 2020 2018 Asset class Fair value at 31 December 2014 £m Inputs1 United Kingdom Ireland United Kingdom 35.4 Net operating income £2.7m €3.1m Ireland 24.3 Occupancy % 73.0 73.0 Discount rate % 9.25 9.25 Exit yield % 6.75 7.25 ADR £138.00 €107.16 59.7 Stabilised year 2018 2018 Footnote: 1. Inputs are presented in connection with a stabilised year There were no changes in valuation techniques during the year. Strategic report G overnance Fin an cials A dditional inform ation Kennedy Wilson Europe Real Estate Plc / Annual Report and Accounts 2015 121

Notes to the consolidated financial statements For the year ended 31 December 2015 continued C. Sensitivity of measurement to variance of significant unobservable inputs There are inter-relationships between all these unobservable inputs as they are determined by market conditions. The existence of an increase in more than one unobservable input would be to magnify the impact on the valuation. The impact on the valuation will be mitigated by the inter-relationship of two unobservable inputs moving in directions which have an opposite impact on value. For example an increase in hotel net operating income may be offset by an increase in exit yield, resulting in no net impact on the valuation. However if the inputs move in opposite directions (for example ADR increases and exit yield decreases), valuation movements can be amplified whereas if they move in the same direction, they may offset reducing the overall net valuation movement. Fair value at 31 December 2015 Impact on valuations of a 10% change in estimated Hotel NOI Impact on valuations of 10% change in occupancy % Impact on valuations of 100bps change in discount rate Impact on valuations of a 50bps change in exit yield Impact of a 5% change in ADR £m Increase £m Decrease £m Increase £m Decrease £m Increase £m Decrease £m Increase £m Decrease £m Increase £m Decrease £m United Kingdom 36.9 3.6 (3.6) 11.7 (11.7) (5.9) 8.1 (3.2) 3.7 10.0 (10.0) Ireland 22.3 2.7 (2.7) 8.6 (8.6) (3.3) 4.4 (1.8) 2.0 1.8 (1.8) 59.2 6.3 (6.3) 20.3 (20.3) (9.2) 12.5 (5.0) 5.7 11.8 (11.8) Fair value at 31 December 2014 Impact on valuations of a 10% change in estimated Hotel NOI Impact on valuations of 10% change in occupancy % Impact on valuations of 100bps change in discount rate Impact on valuations of a 50bps change in exit yield Impact of a 5% change in ADR £m Increase £m Decrease £m Increase £m Decrease £m Increase £m Decrease £m Increase £m Decrease £m Increase £m Decrease £m United Kingdom 35.4 3.6 (3.5) 10.6 (10.5) (6.2) 4.6 (2.9) 2.4 4.7 (4.6) Ireland 24.3 2.0 (2.0) 8.2 (8.2) (3.2) 4.3 (1.7) 2.0 1.6 (1.7) 59.7 5.6 (5.5) 18.8 (18.7) (9.4) 8.9 (4.6) 4.4 6.3 (6.3) 20. Inventories The accounting policy applicable to inventories is set out in Note 3M. 31 December 2015 £m 31 December 2014 £m Current Consumable stores 0.3 0.3 0.3 0.3 Inventories of £2.4 million (FY 2014: £1.1 million) were expensed during the year. The carrying value of inventories approximates their fair value. 21. Rent and other receivables The accounting policy applicable to rent and other receivables is set out in Note 3P (i) (b). 31 December 2015 £m 31 December 2014 £m Current Rent and trade receivables 9.0 4.5 VAT receivable 7.4 2.3 Prepayments, accrued interest and other receivables 6.6 7.0 Straight line rent 3.1 1.5 Deposits paid 1.7 30.8 Prepaid borrowing costs on undrawn facility 0.6 2.1 28.4 48.2 The Group’s exposure to credit risks is disclosed in Note 27C (ii) and its exposure to market risks, impairment losses related to rent and other receivables is disclosed in Note 27C (iii). Kennedy Wilson Europe Real Estate Plc / Annual Report and Accounts 2015122

A. Deposits paid At 31 December 2015 deposits totalling £1.7 million were paid on executing the purchase agreements for a number of acquisitions. See further details in Note 35C. At 31 December 2014, deposits totalling £30.8 million were paid on executing the purchase agreements for the acquisition of the Park Inns portfolio of loans secured by real estate in the amount of £5.5 million, and a further £25.3 million for the acquisition of the Gatsby portfolio of mixed use assets acquired from Aviva. These deposits were subsequently transferred to the acquisition of investment property and loans secured by real estate, as appropriate, on closing of the respective acquisitions of the Gatsby portfolio and the Park Inns portfolio during 2015. B. Rent and trade receivables The Group does not typically extend credit terms to its investment property tenants, instead requiring them to pay in advance. Consequently the Group is not exposed to a significant credit risk. Rent for investment property falls due on contractual quarter days. Rent and service charge receivables are non-interest bearing and are typically due within 30 days. Rent on tenanted residential property falls due monthly, also payable in advance. The Group’s exposure to credit risk in its hotel operations is influenced mainly by the individual characteristics of each customer. There is no concentration of credit risk or dependence on individual customers. Management of the hotels has a credit policy in place and the exposure to credit risk is monitored on an ongoing basis. At 31 December 2015 the maximum exposure to credit risk for rent and trade receivables was £9.0 million (FY 2014: £4.5 million). (i). Aged rent and trade receivables Gross £m Allowance for impaired balances £m Net £m At 31 December 2015 Current 6.5 – 6.5 Overdue 31 – 60 days 0.6 – 0.6 Overdue 61 – 90 days 0.8 – 0.8 Overdue 91 – 120 days 0.5 – 0.5 Overdue 121 days and more 0.8 (0.2) 0.6 9.2 (0.2) 9.0 Gross £m Allowance for impaired balances £m Net £m At 31 December 2014 Current 3.5 – 3.5 Overdue 31 – 60 days 0.2 – 0.2 Overdue 61 – 90 days 0.1 – 0.1 Overdue 91 – 120 days 0.6 – 0.6 Overdue 121 days and more 0.6 (0.5) 0.1 5.0 (0.5) 4.5 Allowances for impaired balances are calculated on the basis of management’s knowledge of the tenants, business and the market. (ii). Allowance for impaired balances The table below provides a reconciliation of changes in allowances for impaired balances: 31 December 2015 £m 31 December 2014 £m Opening balance 0.5 – Additions 1.2 0.8 Written off as a bad debt (0.2) (0.2) Released (1.3) (0.1) Closing balance 0.2 0.5 Strategic report G overnance Fin an cials A dditional inform ation Kennedy Wilson Europe Real Estate Plc / Annual Report and Accounts 2015 123
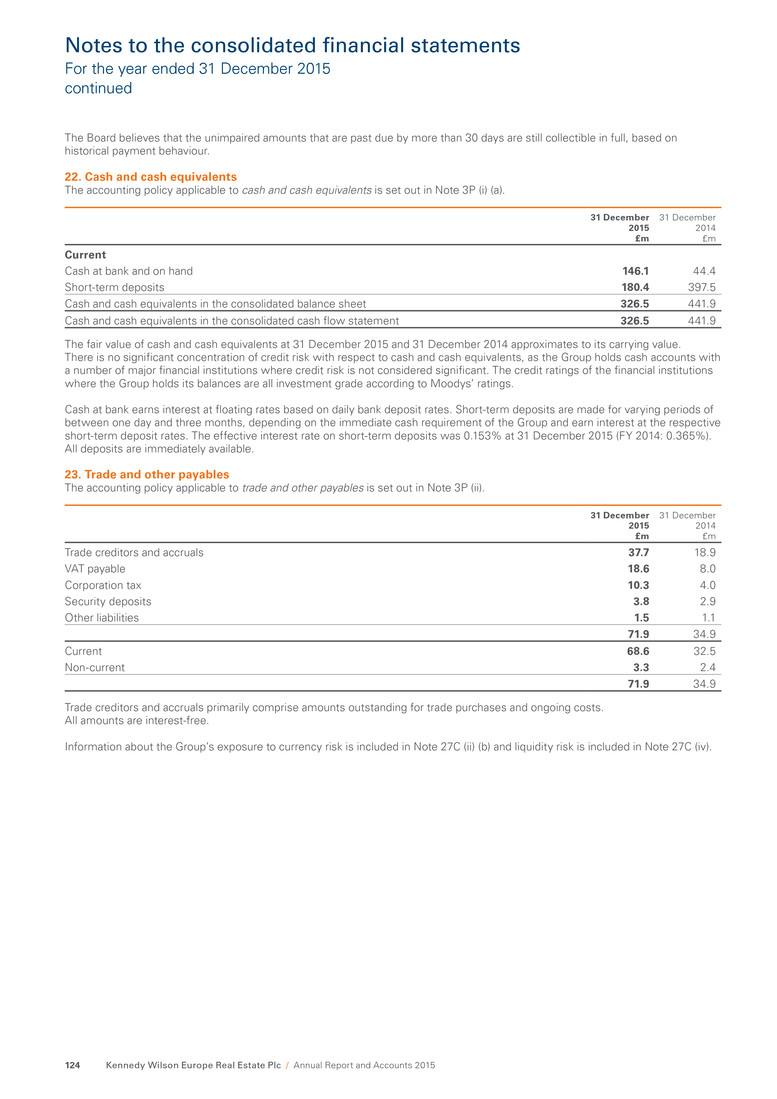
Notes to the consolidated financial statements For the year ended 31 December 2015 continued The Board believes that the unimpaired amounts that are past due by more than 30 days are still collectible in full, based on historical payment behaviour. 22. Cash and cash equivalents The accounting policy applicable to cash and cash equivalents is set out in Note 3P (i) (a). 31 December 2015 £m 31 December 2014 £m Current Cash at bank and on hand 146.1 44.4 Short-term deposits 180.4 397.5 Cash and cash equivalents in the consolidated balance sheet 326.5 441.9 Cash and cash equivalents in the consolidated cash flow statement 326.5 441.9 The fair value of cash and cash equivalents at 31 December 2015 and 31 December 2014 approximates to its carrying value. There is no significant concentration of credit risk with respect to cash and cash equivalents, as the Group holds cash accounts with a number of major financial institutions where credit risk is not considered significant. The credit ratings of the financial institutions where the Group holds its balances are all investment grade according to Moodys’ ratings. Cash at bank earns interest at floating rates based on daily bank deposit rates. Short-term deposits are made for varying periods of between one day and three months, depending on the immediate cash requirement of the Group and earn interest at the respective short-term deposit rates. The effective interest rate on short-term deposits was 0.153% at 31 December 2015 (FY 2014: 0.365%). All deposits are immediately available. 23. Trade and other payables The accounting policy applicable to trade and other payables is set out in Note 3P (ii). 31 December 2015 £m 31 December 2014 £m Trade creditors and accruals 37.7 18.9 VAT payable 18.6 8.0 Corporation tax 10.3 4.0 Security deposits 3.8 2.9 Other liabilities 1.5 1.1 71.9 34.9 Current 68.6 32.5 Non-current 3.3 2.4 71.9 34.9 Trade creditors and accruals primarily comprise amounts outstanding for trade purchases and ongoing costs. All amounts are interest-free. Information about the Group’s exposure to currency risk is included in Note 27C (ii) (b) and liquidity risk is included in Note 27C (iv). Kennedy Wilson Europe Real Estate Plc / Annual Report and Accounts 2015124
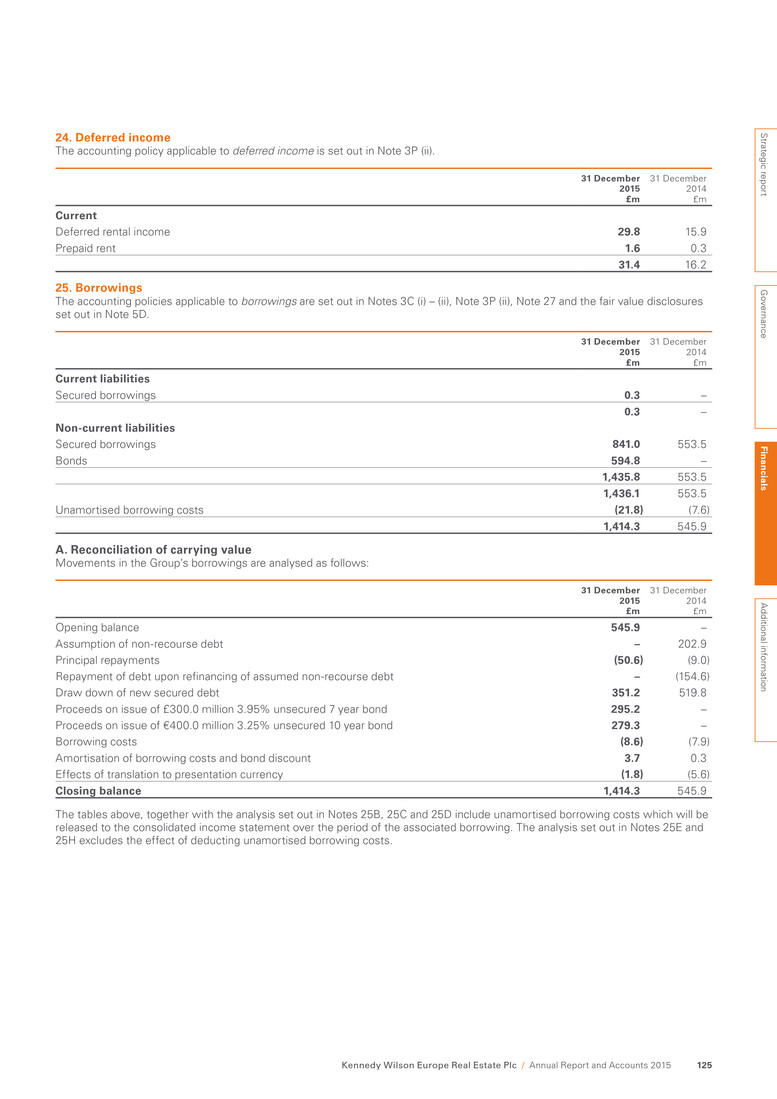
24. Deferred income The accounting policy applicable to deferred income is set out in Note 3P (ii). 31 December 2015 £m 31 December 2014 £m Current Deferred rental income 29.8 15.9 Prepaid rent 1.6 0.3 31.4 16.2 25. Borrowings The accounting policies applicable to borrowings are set out in Notes 3C (i) – (ii), Note 3P (ii), Note 27 and the fair value disclosures set out in Note 5D. 31 December 2015 £m 31 December 2014 £m Current liabilities Secured borrowings 0.3 – 0.3 – Non-current liabilities Secured borrowings 841.0 553.5 Bonds 594.8 – 1,435.8 553.5 1,436.1 553.5 Unamortised borrowing costs (21.8) (7.6) 1,414.3 545.9 A. Reconciliation of carrying value Movements in the Group’s borrowings are analysed as follows: 31 December 2015 £m 31 December 2014 £m Opening balance 545.9 – Assumption of non-recourse debt – 202.9 Principal repayments (50.6) (9.0) Repayment of debt upon refinancing of assumed non-recourse debt – (154.6) Draw down of new secured debt 351.2 519.8 Proceeds on issue of £300.0 million 3.95% unsecured 7 year bond 295.2 – Proceeds on issue of €400.0 million 3.25% unsecured 10 year bond 279.3 – Borrowing costs (8.6) (7.9) Amortisation of borrowing costs and bond discount 3.7 0.3 Effects of translation to presentation currency (1.8) (5.6) Closing balance 1,414.3 545.9 The tables above, together with the analysis set out in Notes 25B, 25C and 25D include unamortised borrowing costs which will be released to the consolidated income statement over the period of the associated borrowing. The analysis set out in Notes 25E and 25H excludes the effect of deducting unamortised borrowing costs. Strategic report G overnance Fin an cials A dditional inform ation Kennedy Wilson Europe Real Estate Plc / Annual Report and Accounts 2015 125
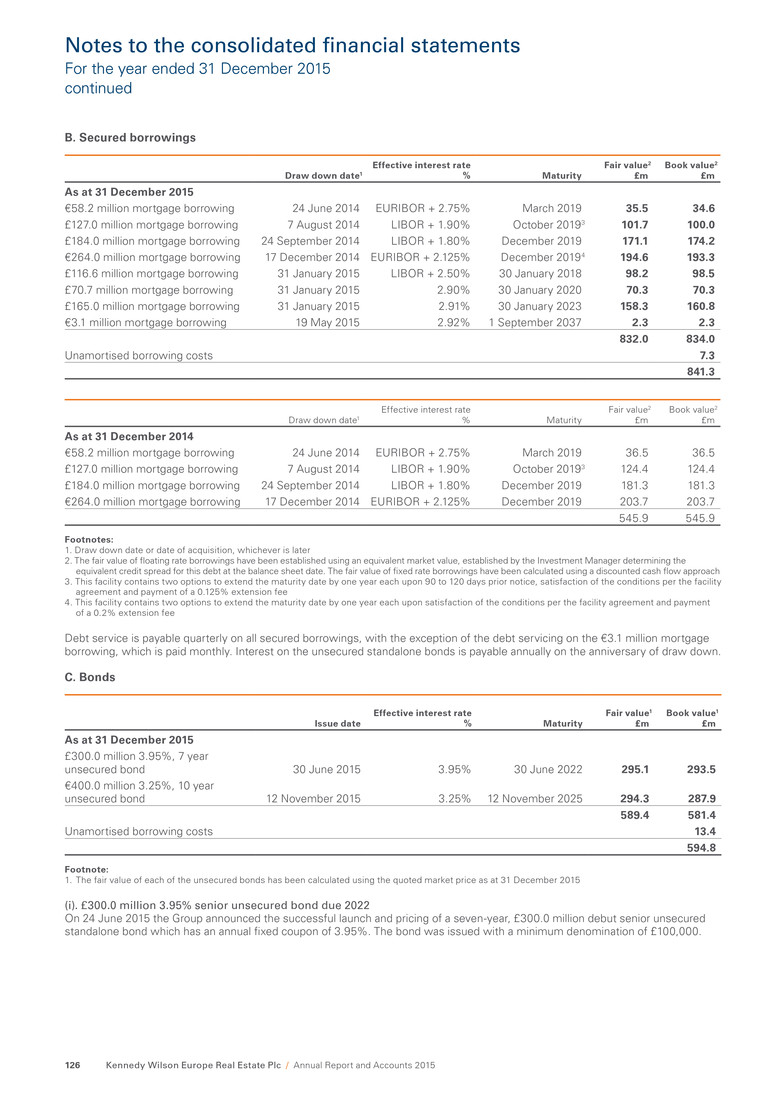
Notes to the consolidated financial statements For the year ended 31 December 2015 continued B. Secured borrowings Draw down date1 Effective interest rate % Maturity Fair value2 £m Book value2 £m As at 31 December 2015 €58.2 million mortgage borrowing 24 June 2014 EURIBOR + 2.75% March 2019 35.5 34.6 £127.0 million mortgage borrowing 7 August 2014 LIBOR + 1.90% October 20193 101.7 100.0 £184.0 million mortgage borrowing 24 September 2014 LIBOR + 1.80% December 2019 171.1 174.2 €264.0 million mortgage borrowing 17 December 2014 EURIBOR + 2.125% December 20194 194.6 193.3 £116.6 million mortgage borrowing 31 January 2015 LIBOR + 2.50% 30 January 2018 98.2 98.5 £70.7 million mortgage borrowing 31 January 2015 2.90% 30 January 2020 70.3 70.3 £165.0 million mortgage borrowing 31 January 2015 2.91% 30 January 2023 158.3 160.8 €3.1 million mortgage borrowing 19 May 2015 2.92% 1 September 2037 2.3 2.3 832.0 834.0 Unamortised borrowing costs 7.3 841.3 Draw down date1 Effective interest rate % Maturity Fair value2 £m Book value2 £m As at 31 December 2014 €58.2 million mortgage borrowing 24 June 2014 EURIBOR + 2.75% March 2019 36.5 36.5 £127.0 million mortgage borrowing 7 August 2014 LIBOR + 1.90% October 20193 124.4 124.4 £184.0 million mortgage borrowing 24 September 2014 LIBOR + 1.80% December 2019 181.3 181.3 €264.0 million mortgage borrowing 17 December 2014 EURIBOR + 2.125% December 2019 203.7 203.7 545.9 545.9 Footnotes: 1. Draw down date or date of acquisition, whichever is later 2. The fair value of floating rate borrowings have been established using an equivalent market value, established by the Investment Manager determining the equivalent credit spread for this debt at the balance sheet date. The fair value of fixed rate borrowings have been calculated using a discounted cash flow approach 3. This facility contains two options to extend the maturity date by one year each upon 90 to 120 days prior notice, satisfaction of the conditions per the facility agreement and payment of a 0.125% extension fee 4. This facility contains two options to extend the maturity date by one year each upon satisfaction of the conditions per the facility agreement and payment of a 0.2% extension fee Debt service is payable quarterly on all secured borrowings, with the exception of the debt servicing on the €3.1 million mortgage borrowing, which is paid monthly. Interest on the unsecured standalone bonds is payable annually on the anniversary of draw down. C. Bonds Issue date Effective interest rate % Maturity Fair value1 £m Book value1 £m As at 31 December 2015 £300.0 million 3.95%, 7 year unsecured bond 30 June 2015 3.95% 30 June 2022 295.1 293.5 €400.0 million 3.25%, 10 year unsecured bond 12 November 2015 3.25% 12 November 2025 294.3 287.9 589.4 581.4 Unamortised borrowing costs 13.4 594.8 Footnote: 1. The fair value of each of the unsecured bonds has been calculated using the quoted market price as at 31 December 2015 (i). £300.0 million 3.95% senior unsecured bond due 2022 On 24 June 2015 the Group announced the successful launch and pricing of a seven-year, £300.0 million debut senior unsecured standalone bond which has an annual fixed coupon of 3.95%. The bond was issued with a minimum denomination of £100,000. Kennedy Wilson Europe Real Estate Plc / Annual Report and Accounts 2015126
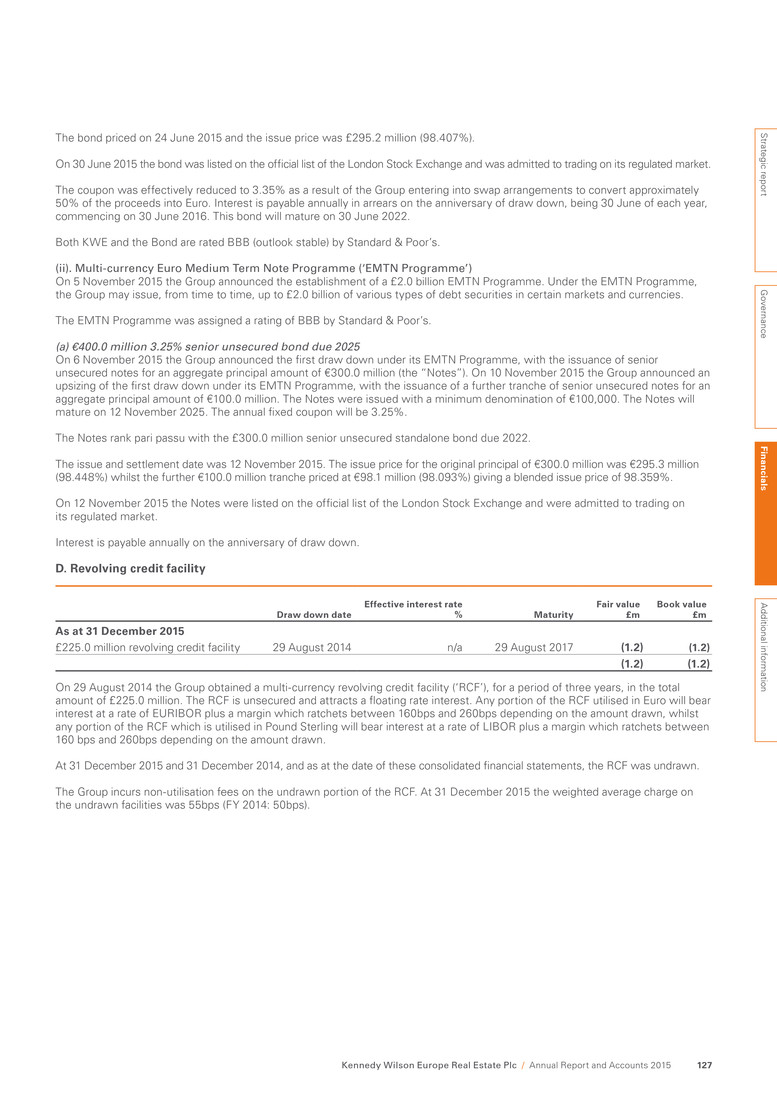
The bond priced on 24 June 2015 and the issue price was £295.2 million (98.407%). On 30 June 2015 the bond was listed on the official list of the London Stock Exchange and was admitted to trading on its regulated market. The coupon was effectively reduced to 3.35% as a result of the Group entering into swap arrangements to convert approximately 50% of the proceeds into Euro. Interest is payable annually in arrears on the anniversary of draw down, being 30 June of each year, commencing on 30 June 2016. This bond will mature on 30 June 2022. Both KWE and the Bond are rated BBB (outlook stable) by Standard & Poor’s. (ii). Multi-currency Euro Medium Term Note Programme (‘EMTN Programme’) On 5 November 2015 the Group announced the establishment of a £2.0 billion EMTN Programme. Under the EMTN Programme, the Group may issue, from time to time, up to £2.0 billion of various types of debt securities in certain markets and currencies. The EMTN Programme was assigned a rating of BBB by Standard & Poor’s. (a) €400.0 million 3.25% senior unsecured bond due 2025 On 6 November 2015 the Group announced the first draw down under its EMTN Programme, with the issuance of senior unsecured notes for an aggregate principal amount of €300.0 million (the “Notes”). On 10 November 2015 the Group announced an upsizing of the first draw down under its EMTN Programme, with the issuance of a further tranche of senior unsecured notes for an aggregate principal amount of €100.0 million. The Notes were issued with a minimum denomination of €100,000. The Notes will mature on 12 November 2025. The annual fixed coupon will be 3.25%. The Notes rank pari passu with the £300.0 million senior unsecured standalone bond due 2022. The issue and settlement date was 12 November 2015. The issue price for the original principal of €300.0 million was €295.3 million (98.448%) whilst the further €100.0 million tranche priced at €98.1 million (98.093%) giving a blended issue price of 98.359%. On 12 November 2015 the Notes were listed on the official list of the London Stock Exchange and were admitted to trading on its regulated market. Interest is payable annually on the anniversary of draw down. D. Revolving credit facility Draw down date Effective interest rate % Maturity Fair value £m Book value £m As at 31 December 2015 £225.0 million revolving credit facility 29 August 2014 n/a 29 August 2017 (1.2) (1.2) (1.2) (1.2) On 29 August 2014 the Group obtained a multi-currency revolving credit facility (‘RCF’), for a period of three years, in the total amount of £225.0 million. The RCF is unsecured and attracts a floating rate interest. Any portion of the RCF utilised in Euro will bear interest at a rate of EURIBOR plus a margin which ratchets between 160bps and 260bps depending on the amount drawn, whilst any portion of the RCF which is utilised in Pound Sterling will bear interest at a rate of LIBOR plus a margin which ratchets between 160 bps and 260bps depending on the amount drawn. At 31 December 2015 and 31 December 2014, and as at the date of these consolidated financial statements, the RCF was undrawn. The Group incurs non-utilisation fees on the undrawn portion of the RCF. At 31 December 2015 the weighted average charge on the undrawn facilities was 55bps (FY 2014: 50bps). Strategic report G overnance Fin an cials A dditional inform ation Kennedy Wilson Europe Real Estate Plc / Annual Report and Accounts 2015 127
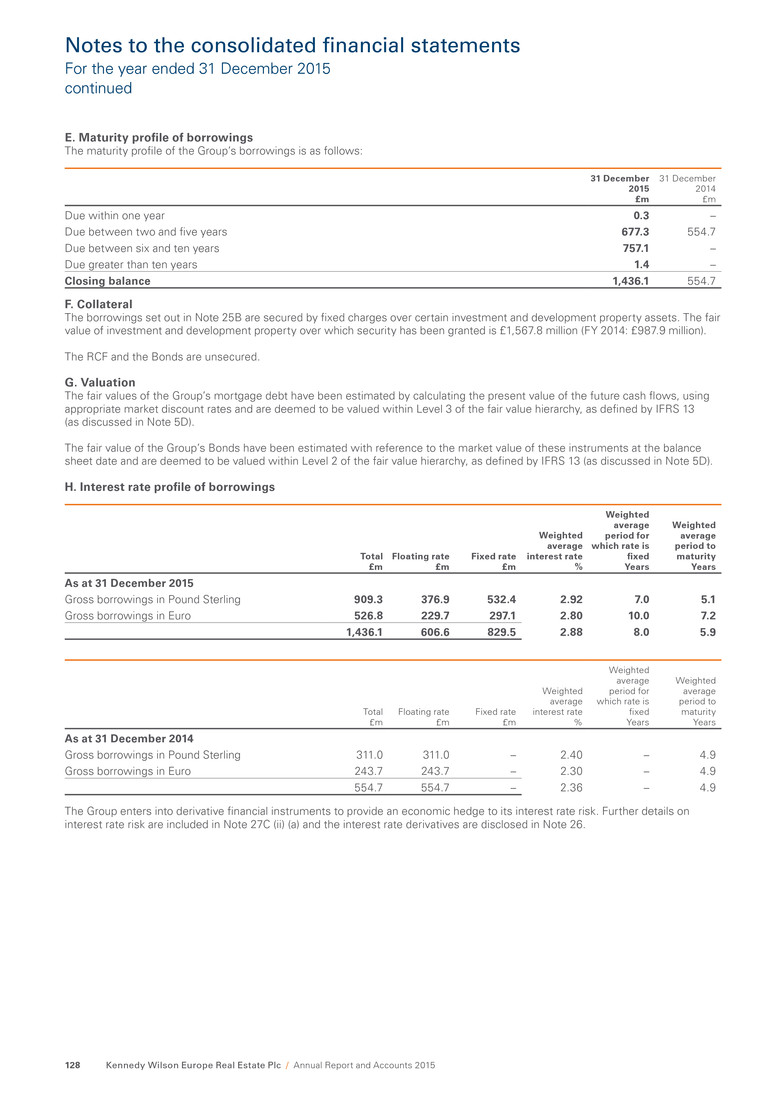
Notes to the consolidated financial statements For the year ended 31 December 2015 continued E. Maturity profile of borrowings The maturity profile of the Group’s borrowings is as follows: 31 December 2015 £m 31 December 2014 £m Due within one year 0.3 – Due between two and five years 677.3 554.7 Due between six and ten years 757.1 – Due greater than ten years 1.4 – Closing balance 1,436.1 554.7 F. Collateral The borrowings set out in Note 25B are secured by fixed charges over certain investment and development property assets. The fair value of investment and development property over which security has been granted is £1,567.8 million (FY 2014: £987.9 million). The RCF and the Bonds are unsecured. G. Valuation The fair values of the Group’s mortgage debt have been estimated by calculating the present value of the future cash flows, using appropriate market discount rates and are deemed to be valued within Level 3 of the fair value hierarchy, as defined by IFRS 13 (as discussed in Note 5D). The fair value of the Group’s Bonds have been estimated with reference to the market value of these instruments at the balance sheet date and are deemed to be valued within Level 2 of the fair value hierarchy, as defined by IFRS 13 (as discussed in Note 5D). H. Interest rate profile of borrowings Total £m Floating rate £m Fixed rate £m Weighted average interest rate % Weighted average period for which rate is fixed Years Weighted average period to maturity Years As at 31 December 2015 Gross borrowings in Pound Sterling 909.3 376.9 532.4 2.92 7.0 5.1 Gross borrowings in Euro 526.8 229.7 297.1 2.80 10.0 7.2 1,436.1 606.6 829.5 2.88 8.0 5.9 Total £m Floating rate £m Fixed rate £m Weighted average interest rate % Weighted average period for which rate is fixed Years Weighted average period to maturity Years As at 31 December 2014 Gross borrowings in Pound Sterling 311.0 311.0 – 2.40 – 4.9 Gross borrowings in Euro 243.7 243.7 – 2.30 – 4.9 554.7 554.7 – 2.36 – 4.9 The Group enters into derivative financial instruments to provide an economic hedge to its interest rate risk. Further details on interest rate risk are included in Note 27C (ii) (a) and the interest rate derivatives are disclosed in Note 26. Kennedy Wilson Europe Real Estate Plc / Annual Report and Accounts 2015128
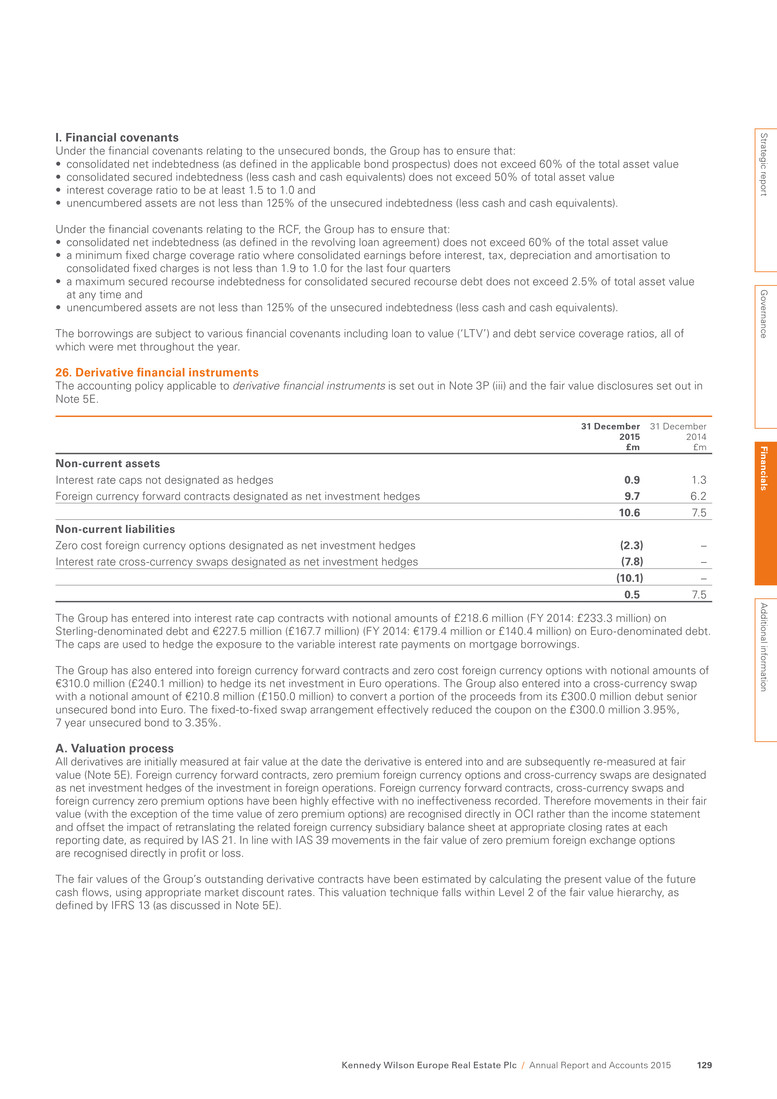
I. Financial covenants Under the financial covenants relating to the unsecured bonds, the Group has to ensure that: • consolidated net indebtedness (as defined in the applicable bond prospectus) does not exceed 60% of the total asset value • consolidated secured indebtedness (less cash and cash equivalents) does not exceed 50% of total asset value • interest coverage ratio to be at least 1.5 to 1.0 and • unencumbered assets are not less than 125% of the unsecured indebtedness (less cash and cash equivalents). Under the financial covenants relating to the RCF, the Group has to ensure that: • consolidated net indebtedness (as defined in the revolving loan agreement) does not exceed 60% of the total asset value • a minimum fixed charge coverage ratio where consolidated earnings before interest, tax, depreciation and amortisation to consolidated fixed charges is not less than 1.9 to 1.0 for the last four quarters • a maximum secured recourse indebtedness for consolidated secured recourse debt does not exceed 2.5% of total asset value at any time and • unencumbered assets are not less than 125% of the unsecured indebtedness (less cash and cash equivalents). The borrowings are subject to various financial covenants including loan to value (‘LTV’) and debt service coverage ratios, all of which were met throughout the year. 26. Derivative financial instruments The accounting policy applicable to derivative financial instruments is set out in Note 3P (iii) and the fair value disclosures set out in Note 5E. 31 December 2015 £m 31 December 2014 £m Non-current assets Interest rate caps not designated as hedges 0.9 1.3 Foreign currency forward contracts designated as net investment hedges 9.7 6.2 10.6 7.5 Non-current liabilities Zero cost foreign currency options designated as net investment hedges (2.3) – Interest rate cross-currency swaps designated as net investment hedges (7.8) – (10.1) – 0.5 7.5 The Group has entered into interest rate cap contracts with notional amounts of £218.6 million (FY 2014: £233.3 million) on Sterling-denominated debt and €227.5 million (£167.7 million) (FY 2014: €179.4 million or £140.4 million) on Euro-denominated debt. The caps are used to hedge the exposure to the variable interest rate payments on mortgage borrowings. The Group has also entered into foreign currency forward contracts and zero cost foreign currency options with notional amounts of €310.0 million (£240.1 million) to hedge its net investment in Euro operations. The Group also entered into a cross-currency swap with a notional amount of €210.8 million (£150.0 million) to convert a portion of the proceeds from its £300.0 million debut senior unsecured bond into Euro. The fixed-to-fixed swap arrangement effectively reduced the coupon on the £300.0 million 3.95%, 7 year unsecured bond to 3.35%. A. Valuation process All derivatives are initially measured at fair value at the date the derivative is entered into and are subsequently re-measured at fair value (Note 5E). Foreign currency forward contracts, zero premium foreign currency options and cross-currency swaps are designated as net investment hedges of the investment in foreign operations. Foreign currency forward contracts, cross-currency swaps and foreign currency zero premium options have been highly effective with no ineffectiveness recorded. Therefore movements in their fair value (with the exception of the time value of zero premium options) are recognised directly in OCI rather than the income statement and offset the impact of retranslating the related foreign currency subsidiary balance sheet at appropriate closing rates at each reporting date, as required by IAS 21. In line with IAS 39 movements in the fair value of zero premium foreign exchange options are recognised directly in profit or loss. The fair values of the Group’s outstanding derivative contracts have been estimated by calculating the present value of the future cash flows, using appropriate market discount rates. This valuation technique falls within Level 2 of the fair value hierarchy, as defined by IFRS 13 (as discussed in Note 5E). Strategic report G overnance Fin an cials A dditional inform ation Kennedy Wilson Europe Real Estate Plc / Annual Report and Accounts 2015 129

27. Financial instruments – fair value and risk management The accounting policy applicable to financial instruments is set out in Note 3P and the fair value disclosures set out in Note 5. A. Accounting classifications and fair values The following table shows the book values and fair values of financial assets and financial liabilities, including their levels in the fair value hierarchy. It does not include fair value information for financial assets and financial liabilities not measured at fair value if the carrying amount is a reasonable approximation of fair value. Carrying value £m Fair value £m Fair value through the profit and loss £m Fair value hedging instruments £m Other financial liabilities £m Level 1 £m Level 2 £m Level 3 £m At 31 December 2015 Loans secured by real estate 179.2 179.2 179.2 – – – – 179.2 Derivative financial assets 10.6 10.6 0.9 9.7 – – 10.6 – Total financial assets disclosed at fair value 189.8 189.8 180.1 9.7 – – 10.6 179.2 Borrowings 1,414.3 1,421.4 – – 1,421.4 – 589.4 832.0 Derivative financial liabilities 10.1 10.1 – 10.1 – – 10.1 – Total financial liabilities disclosed at fair value 1,424.4 1,431.5 – 10.1 1,421.4 – 599.5 832.0 Carrying value £m Fair value £m Fair value through the profit and loss £m Fair value hedging instruments £m Other financial liabilities £m Level 1 £m Level 2 £m Level 3 £m At 31 December 2014 Loans secured by real estate 211.0 211.0 211.0 – – – – 211.0 Derivative financial assets 7.5 7.5 1.3 6.2 – – 7.5 – Total financial assets disclosed at fair value 218.5 218.5 212.3 6.2 – – 7.5 211.0 Borrowings 545.9 545.9 – – 545.9 – 545.9 – Total financial liabilities disclosed at fair value 545.9 545.9 – – 545.9 – 545.9 – B. Measurement of fair values The fair value of rent and other receivables, cash and cash equivalents, and trade and other payables approximate their carrying value and they are carried at amortised cost. C. Financial risk management The Group’s activities expose it to a variety of financial risks: • market risk (including interest rate risk and foreign currency risk) • credit risk • liquidity risk and • development risk. This note presents information about the Group’s exposure to each of the above risks, the Group’s objectives, policies and processes for measuring and managing risk, and the Group’s management of capital. There have been no changes in any risk management policies since 31 December 2014. (i). Risk management framework The Investment Manager and the Audit Committee oversee the management of these risks. All derivative activities for risk management purposes are carried out by specialist teams that have the appropriate skills, experience and supervision. The Board reviews and agrees policies for managing each of these risks which are summarised below. The Group’s risk management policies are established to identify and analyse the risks faced by the Group, to set appropriate risk limits and controls and to monitor risks and adherence to limits. Risk management policies and systems are reviewed regularly to reflect changes in market conditions and the Group’s activities. The Audit Committee oversees how the Investment Manager monitors compliance with the Group’s risk management policies and procedures, and reviews the adequacy of the risk management framework in relation to the risks faced by the Group. Notes to the consolidated financial statements For the year ended 31 December 2015 continued Kennedy Wilson Europe Real Estate Plc / Annual Report and Accounts 2015130
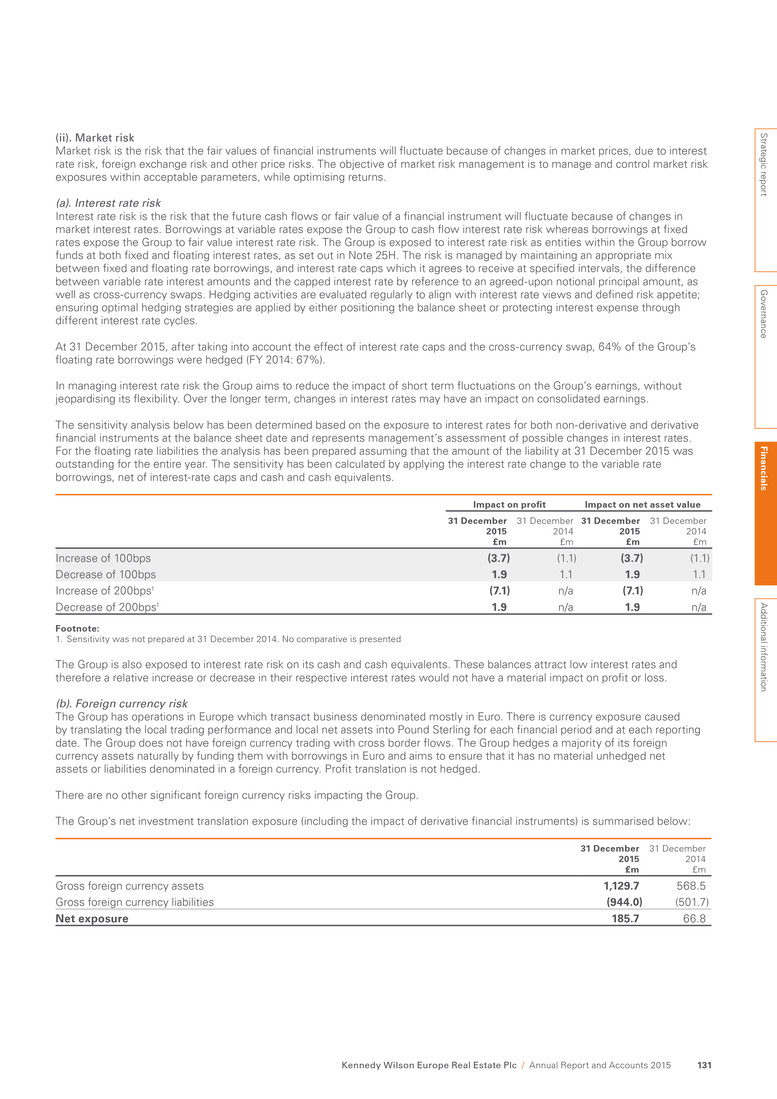
(ii). Market risk Market risk is the risk that the fair values of financial instruments will fluctuate because of changes in market prices, due to interest rate risk, foreign exchange risk and other price risks. The objective of market risk management is to manage and control market risk exposures within acceptable parameters, while optimising returns. (a). Interest rate risk Interest rate risk is the risk that the future cash flows or fair value of a financial instrument will fluctuate because of changes in market interest rates. Borrowings at variable rates expose the Group to cash flow interest rate risk whereas borrowings at fixed rates expose the Group to fair value interest rate risk. The Group is exposed to interest rate risk as entities within the Group borrow funds at both fixed and floating interest rates, as set out in Note 25H. The risk is managed by maintaining an appropriate mix between fixed and floating rate borrowings, and interest rate caps which it agrees to receive at specified intervals, the difference between variable rate interest amounts and the capped interest rate by reference to an agreed-upon notional principal amount, as well as cross-currency swaps. Hedging activities are evaluated regularly to align with interest rate views and defined risk appetite; ensuring optimal hedging strategies are applied by either positioning the balance sheet or protecting interest expense through different interest rate cycles. At 31 December 2015, after taking into account the effect of interest rate caps and the cross-currency swap, 64% of the Group’s floating rate borrowings were hedged (FY 2014: 67%). In managing interest rate risk the Group aims to reduce the impact of short term fluctuations on the Group’s earnings, without jeopardising its flexibility. Over the longer term, changes in interest rates may have an impact on consolidated earnings. The sensitivity analysis below has been determined based on the exposure to interest rates for both non-derivative and derivative financial instruments at the balance sheet date and represents management’s assessment of possible changes in interest rates. For the floating rate liabilities the analysis has been prepared assuming that the amount of the liability at 31 December 2015 was outstanding for the entire year. The sensitivity has been calculated by applying the interest rate change to the variable rate borrowings, net of interest-rate caps and cash and cash equivalents. Impact on profit Impact on net asset value 31 December 2015 £m 31 December 2014 £m 31 December 2015 £m 31 December 2014 £m Increase of 100bps (3.7) (1.1) (3.7) (1.1) Decrease of 100bps 1.9 1.1 1.9 1.1 Increase of 200bps1 (7.1) n/a (7.1) n/a Decrease of 200bps1 1.9 n/a 1.9 n/a Footnote: 1. Sensitivity was not prepared at 31 December 2014. No comparative is presented The Group is also exposed to interest rate risk on its cash and cash equivalents. These balances attract low interest rates and therefore a relative increase or decrease in their respective interest rates would not have a material impact on profit or loss. (b). Foreign currency risk The Group has operations in Europe which transact business denominated mostly in Euro. There is currency exposure caused by translating the local trading performance and local net assets into Pound Sterling for each financial period and at each reporting date. The Group does not have foreign currency trading with cross border flows. The Group hedges a majority of its foreign currency assets naturally by funding them with borrowings in Euro and aims to ensure that it has no material unhedged net assets or liabilities denominated in a foreign currency. Profit translation is not hedged. There are no other significant foreign currency risks impacting the Group. The Group’s net investment translation exposure (including the impact of derivative financial instruments) is summarised below: 31 December 2015 £m 31 December 2014 £m Gross foreign currency assets 1,129.7 568.5 Gross foreign currency liabilities (944.0) (501.7) Net exposure 185.7 66.8 Strategic report G overnance Fin an cials A dditional inform ation Kennedy Wilson Europe Real Estate Plc / Annual Report and Accounts 2015 131
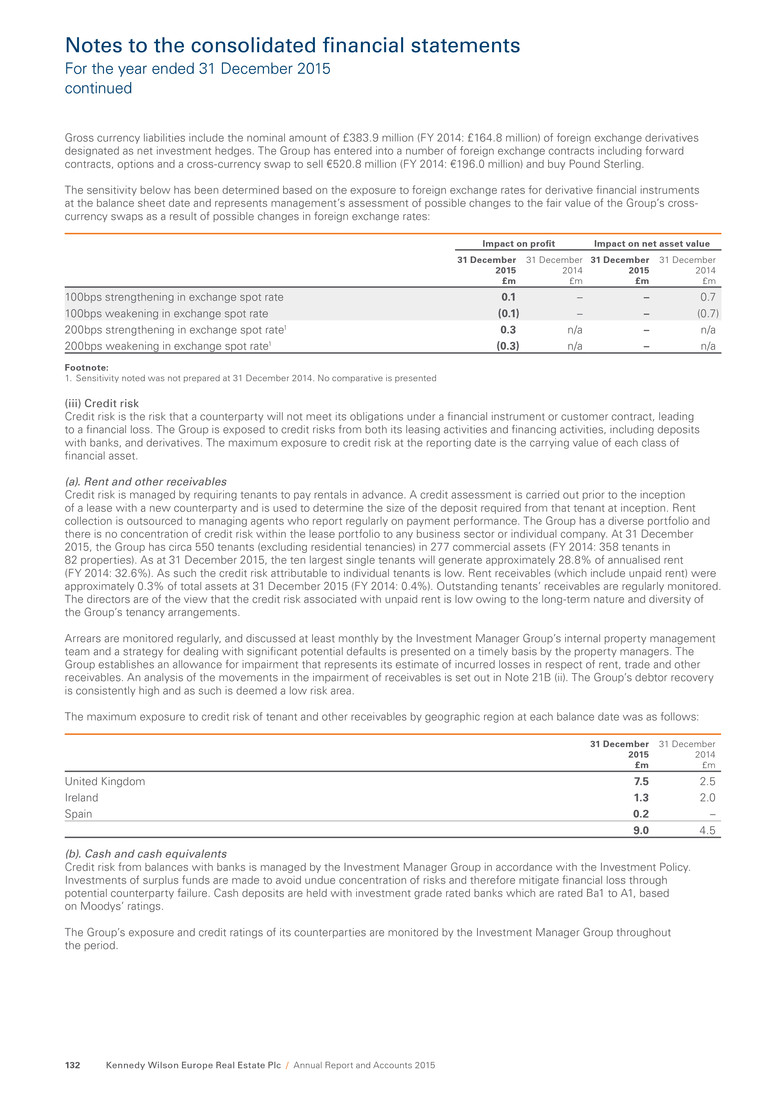
Gross currency liabilities include the nominal amount of £383.9 million (FY 2014: £164.8 million) of foreign exchange derivatives designated as net investment hedges. The Group has entered into a number of foreign exchange contracts including forward contracts, options and a cross-currency swap to sell €520.8 million (FY 2014: €196.0 million) and buy Pound Sterling. The sensitivity below has been determined based on the exposure to foreign exchange rates for derivative financial instruments at the balance sheet date and represents management’s assessment of possible changes to the fair value of the Group’s cross- currency swaps as a result of possible changes in foreign exchange rates: Impact on profit Impact on net asset value 31 December 2015 £m 31 December 2014 £m 31 December 2015 £m 31 December 2014 £m 100bps strengthening in exchange spot rate 0.1 – – 0.7 100bps weakening in exchange spot rate (0.1) – – (0.7) 200bps strengthening in exchange spot rate1 0.3 n/a – n/a 200bps weakening in exchange spot rate1 (0.3) n/a – n/a Footnote: 1. Sensitivity noted was not prepared at 31 December 2014. No comparative is presented (iii) Credit risk Credit risk is the risk that a counterparty will not meet its obligations under a financial instrument or customer contract, leading to a financial loss. The Group is exposed to credit risks from both its leasing activities and financing activities, including deposits with banks, and derivatives. The maximum exposure to credit risk at the reporting date is the carrying value of each class of financial asset. (a). Rent and other receivables Credit risk is managed by requiring tenants to pay rentals in advance. A credit assessment is carried out prior to the inception of a lease with a new counterparty and is used to determine the size of the deposit required from that tenant at inception. Rent collection is outsourced to managing agents who report regularly on payment performance. The Group has a diverse portfolio and there is no concentration of credit risk within the lease portfolio to any business sector or individual company. At 31 December 2015, the Group has circa 550 tenants (excluding residential tenancies) in 277 commercial assets (FY 2014: 358 tenants in 82 properties). As at 31 December 2015, the ten largest single tenants will generate approximately 28.8% of annualised rent (FY 2014: 32.6%). As such the credit risk attributable to individual tenants is low. Rent receivables (which include unpaid rent) were approximately 0.3% of total assets at 31 December 2015 (FY 2014: 0.4%). Outstanding tenants’ receivables are regularly monitored. The directors are of the view that the credit risk associated with unpaid rent is low owing to the long-term nature and diversity of the Group’s tenancy arrangements. Arrears are monitored regularly, and discussed at least monthly by the Investment Manager Group’s internal property management team and a strategy for dealing with significant potential defaults is presented on a timely basis by the property managers. The Group establishes an allowance for impairment that represents its estimate of incurred losses in respect of rent, trade and other receivables. An analysis of the movements in the impairment of receivables is set out in Note 21B (ii). The Group’s debtor recovery is consistently high and as such is deemed a low risk area. The maximum exposure to credit risk of tenant and other receivables by geographic region at each balance date was as follows: 31 December 2015 £m 31 December 2014 £m United Kingdom 7.5 2.5 Ireland 1.3 2.0 Spain 0.2 – 9.0 4.5 (b). Cash and cash equivalents Credit risk from balances with banks is managed by the Investment Manager Group in accordance with the Investment Policy. Investments of surplus funds are made to avoid undue concentration of risks and therefore mitigate financial loss through potential counterparty failure. Cash deposits are held with investment grade rated banks which are rated Ba1 to A1, based on Moodys’ ratings. The Group’s exposure and credit ratings of its counterparties are monitored by the Investment Manager Group throughout the period. Notes to the consolidated financial statements For the year ended 31 December 2015 continued Kennedy Wilson Europe Real Estate Plc / Annual Report and Accounts 2015132
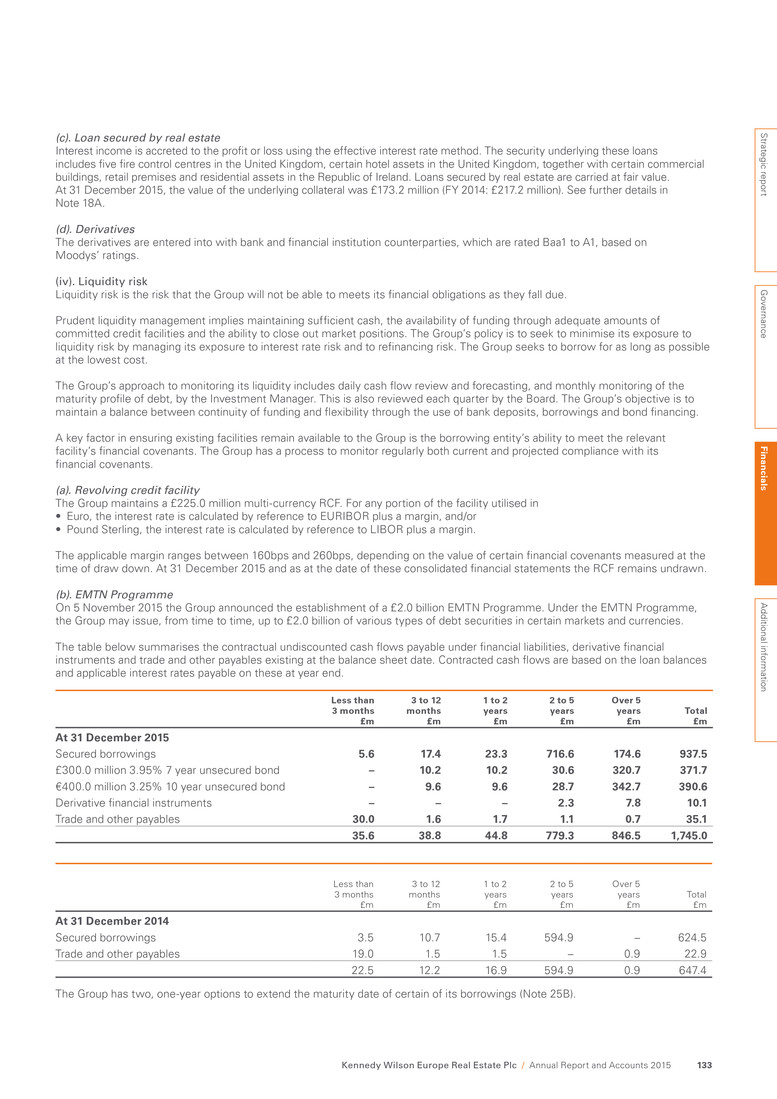
(c). Loan secured by real estate Interest income is accreted to the profit or loss using the effective interest rate method. The security underlying these loans includes five fire control centres in the United Kingdom, certain hotel assets in the United Kingdom, together with certain commercial buildings, retail premises and residential assets in the Republic of Ireland. Loans secured by real estate are carried at fair value. At 31 December 2015, the value of the underlying collateral was £173.2 million (FY 2014: £217.2 million). See further details in Note 18A. (d). Derivatives The derivatives are entered into with bank and financial institution counterparties, which are rated Baa1 to A1, based on Moodys’ ratings. (iv). Liquidity risk Liquidity risk is the risk that the Group will not be able to meets its financial obligations as they fall due. Prudent liquidity management implies maintaining sufficient cash, the availability of funding through adequate amounts of committed credit facilities and the ability to close out market positions. The Group’s policy is to seek to minimise its exposure to liquidity risk by managing its exposure to interest rate risk and to refinancing risk. The Group seeks to borrow for as long as possible at the lowest cost. The Group’s approach to monitoring its liquidity includes daily cash flow review and forecasting, and monthly monitoring of the maturity profile of debt, by the Investment Manager. This is also reviewed each quarter by the Board. The Group’s objective is to maintain a balance between continuity of funding and flexibility through the use of bank deposits, borrowings and bond financing. A key factor in ensuring existing facilities remain available to the Group is the borrowing entity’s ability to meet the relevant facility’s financial covenants. The Group has a process to monitor regularly both current and projected compliance with its financial covenants. (a). Revolving credit facility The Group maintains a £225.0 million multi-currency RCF. For any portion of the facility utilised in • Euro, the interest rate is calculated by reference to EURIBOR plus a margin, and/or • Pound Sterling, the interest rate is calculated by reference to LIBOR plus a margin. The applicable margin ranges between 160bps and 260bps, depending on the value of certain financial covenants measured at the time of draw down. At 31 December 2015 and as at the date of these consolidated financial statements the RCF remains undrawn. (b). EMTN Programme On 5 November 2015 the Group announced the establishment of a £2.0 billion EMTN Programme. Under the EMTN Programme, the Group may issue, from time to time, up to £2.0 billion of various types of debt securities in certain markets and currencies. The table below summarises the contractual undiscounted cash flows payable under financial liabilities, derivative financial instruments and trade and other payables existing at the balance sheet date. Contracted cash flows are based on the loan balances and applicable interest rates payable on these at year end. Less than 3 months £m 3 to 12 months £m 1 to 2 years £m 2 to 5 years £m Over 5 years £m Total £m At 31 December 2015 Secured borrowings 5.6 17.4 23.3 716.6 174.6 937.5 £300.0 million 3.95% 7 year unsecured bond – 10.2 10.2 30.6 320.7 371.7 €400.0 million 3.25% 10 year unsecured bond – 9.6 9.6 28.7 342.7 390.6 Derivative financial instruments – – – 2.3 7.8 10.1 Trade and other payables 30.0 1.6 1.7 1.1 0.7 35.1 35.6 38.8 44.8 779.3 846.5 1,745.0 Less than 3 months £m 3 to 12 months £m 1 to 2 years £m 2 to 5 years £m Over 5 years £m Total £m At 31 December 2014 Secured borrowings 3.5 10.7 15.4 594.9 – 624.5 Trade and other payables 19.0 1.5 1.5 – 0.9 22.9 22.5 12.2 16.9 594.9 0.9 647.4 The Group has two, one-year options to extend the maturity date of certain of its borrowings (Note 25B). Strategic report G overnance Fin an cials A dditional inform ation Kennedy Wilson Europe Real Estate Plc / Annual Report and Accounts 2015 133
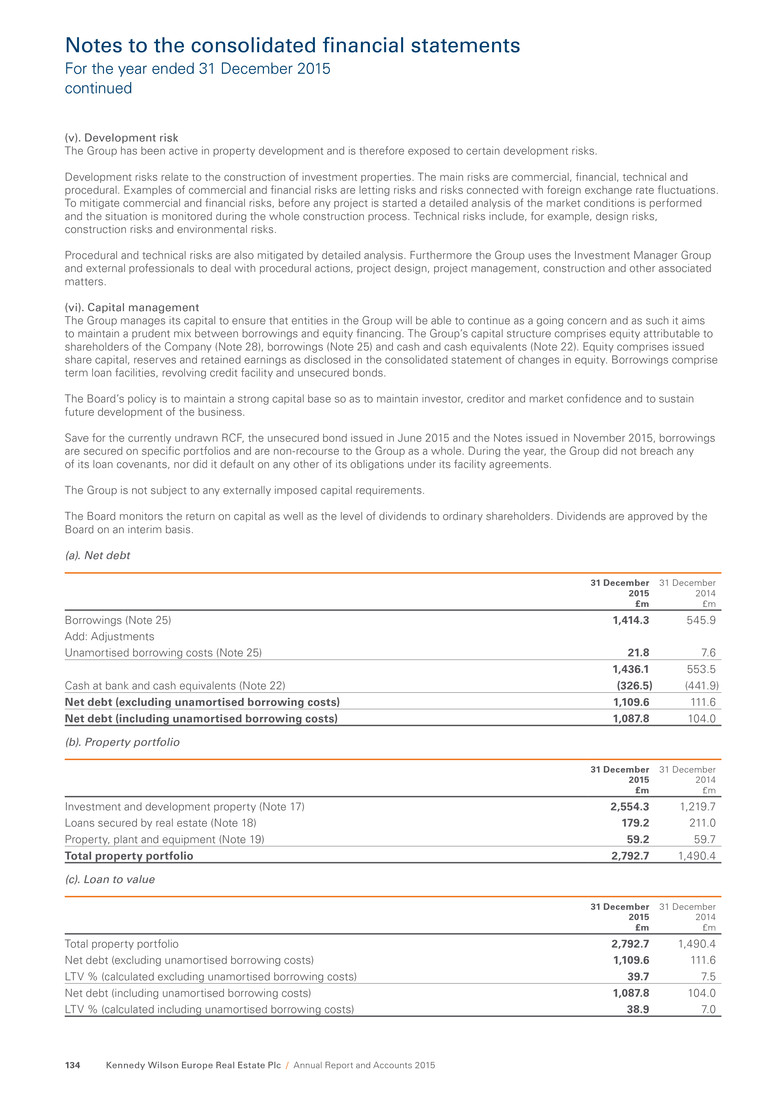
(v). Development risk The Group has been active in property development and is therefore exposed to certain development risks. Development risks relate to the construction of investment properties. The main risks are commercial, financial, technical and procedural. Examples of commercial and financial risks are letting risks and risks connected with foreign exchange rate fluctuations. To mitigate commercial and financial risks, before any project is started a detailed analysis of the market conditions is performed and the situation is monitored during the whole construction process. Technical risks include, for example, design risks, construction risks and environmental risks. Procedural and technical risks are also mitigated by detailed analysis. Furthermore the Group uses the Investment Manager Group and external professionals to deal with procedural actions, project design, project management, construction and other associated matters. (vi). Capital management The Group manages its capital to ensure that entities in the Group will be able to continue as a going concern and as such it aims to maintain a prudent mix between borrowings and equity financing. The Group’s capital structure comprises equity attributable to shareholders of the Company (Note 28), borrowings (Note 25) and cash and cash equivalents (Note 22). Equity comprises issued share capital, reserves and retained earnings as disclosed in the consolidated statement of changes in equity. Borrowings comprise term loan facilities, revolving credit facility and unsecured bonds. The Board’s policy is to maintain a strong capital base so as to maintain investor, creditor and market confidence and to sustain future development of the business. Save for the currently undrawn RCF, the unsecured bond issued in June 2015 and the Notes issued in November 2015, borrowings are secured on specific portfolios and are non-recourse to the Group as a whole. During the year, the Group did not breach any of its loan covenants, nor did it default on any other of its obligations under its facility agreements. The Group is not subject to any externally imposed capital requirements. The Board monitors the return on capital as well as the level of dividends to ordinary shareholders. Dividends are approved by the Board on an interim basis. (a). Net debt 31 December 2015 £m 31 December 2014 £m Borrowings (Note 25) 1,414.3 545.9 Add: Adjustments Unamortised borrowing costs (Note 25) 21.8 7.6 1,436.1 553.5 Cash at bank and cash equivalents (Note 22) (326.5) (441.9) Net debt (excluding unamortised borrowing costs) 1,109.6 111.6 Net debt (including unamortised borrowing costs) 1,087.8 104.0 (b). Property portfolio 31 December 2015 £m 31 December 2014 £m Investment and development property (Note 17) 2,554.3 1,219.7 Loans secured by real estate (Note 18) 179.2 211.0 Property, plant and equipment (Note 19) 59.2 59.7 Total property portfolio 2,792.7 1,490.4 (c). Loan to value 31 December 2015 £m 31 December 2014 £m Total property portfolio 2,792.7 1,490.4 Net debt (excluding unamortised borrowing costs) 1,109.6 111.6 LTV % (calculated excluding unamortised borrowing costs) 39.7 7.5 Net debt (including unamortised borrowing costs) 1,087.8 104.0 LTV % (calculated including unamortised borrowing costs) 38.9 7.0 Notes to the consolidated financial statements For the year ended 31 December 2015 continued Kennedy Wilson Europe Real Estate Plc / Annual Report and Accounts 2015134
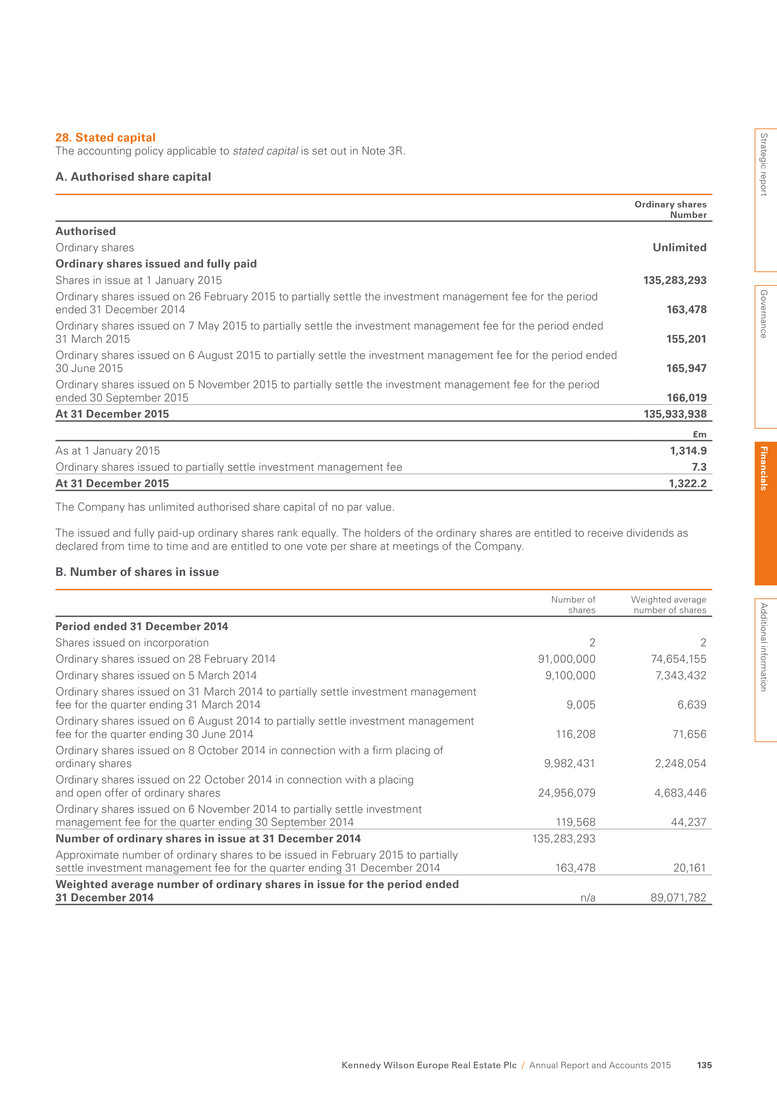
28. Stated capital The accounting policy applicable to stated capital is set out in Note 3R. A. Authorised share capital Ordinary shares Number Authorised Ordinary shares Unlimited Ordinary shares issued and fully paid Shares in issue at 1 January 2015 135,283,293 Ordinary shares issued on 26 February 2015 to partially settle the investment management fee for the period ended 31 December 2014 163,478 Ordinary shares issued on 7 May 2015 to partially settle the investment management fee for the period ended 31 March 2015 155,201 Ordinary shares issued on 6 August 2015 to partially settle the investment management fee for the period ended 30 June 2015 165,947 Ordinary shares issued on 5 November 2015 to partially settle the investment management fee for the period ended 30 September 2015 166,019 At 31 December 2015 135,933,938 £m As at 1 January 2015 1,314.9 Ordinary shares issued to partially settle investment management fee 7.3 At 31 December 2015 1,322.2 The Company has unlimited authorised share capital of no par value. The issued and fully paid-up ordinary shares rank equally. The holders of the ordinary shares are entitled to receive dividends as declared from time to time and are entitled to one vote per share at meetings of the Company. B. Number of shares in issue Number of shares Weighted average number of shares Period ended 31 December 2014 Shares issued on incorporation 2 2 Ordinary shares issued on 28 February 2014 91,000,000 74,654,155 Ordinary shares issued on 5 March 2014 9,100,000 7,343,432 Ordinary shares issued on 31 March 2014 to partially settle investment management fee for the quarter ending 31 March 2014 9,005 6,639 Ordinary shares issued on 6 August 2014 to partially settle investment management fee for the quarter ending 30 June 2014 116,208 71,656 Ordinary shares issued on 8 October 2014 in connection with a firm placing of ordinary shares 9,982,431 2,248,054 Ordinary shares issued on 22 October 2014 in connection with a placing and open offer of ordinary shares 24,956,079 4,683,446 Ordinary shares issued on 6 November 2014 to partially settle investment management fee for the quarter ending 30 September 2014 119,568 44,237 Number of ordinary shares in issue at 31 December 2014 135,283,293 Approximate number of ordinary shares to be issued in February 2015 to partially settle investment management fee for the quarter ending 31 December 2014 163,478 20,161 Weighted average number of ordinary shares in issue for the period ended 31 December 2014 n/a 89,071,782 Strategic report G overnance Fin an cials A dditional inform ation Kennedy Wilson Europe Real Estate Plc / Annual Report and Accounts 2015 135
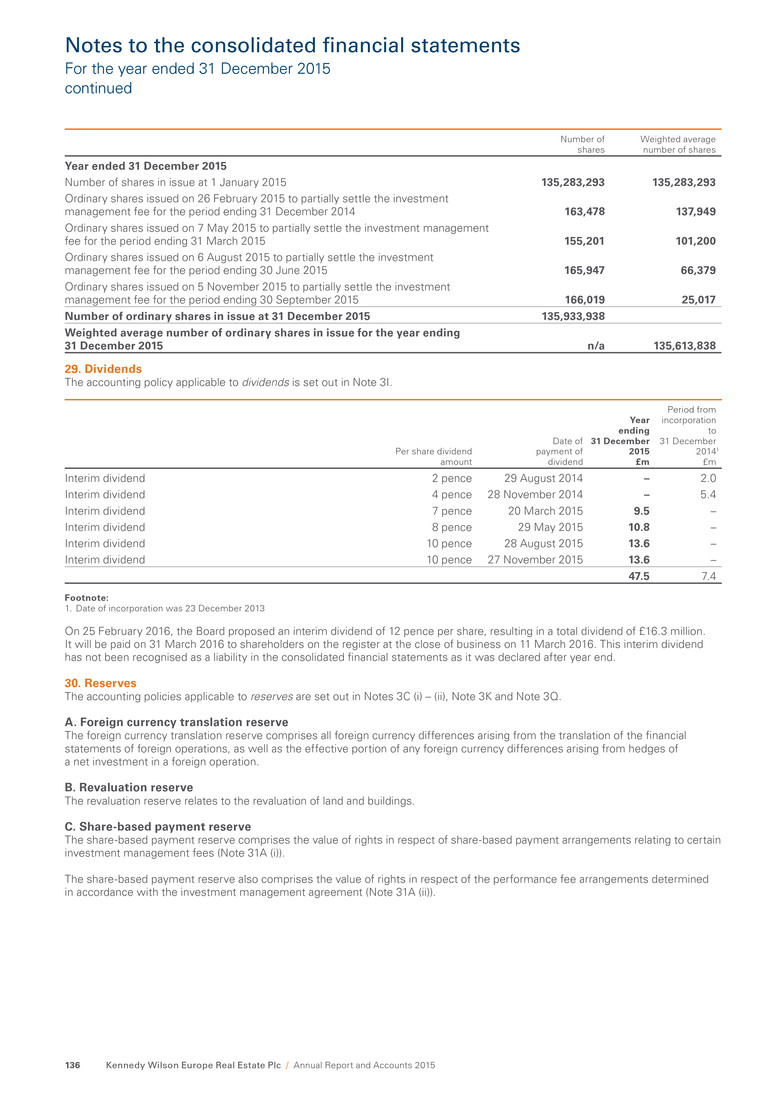
Number of shares Weighted average number of shares Year ended 31 December 2015 Number of shares in issue at 1 January 2015 135,283,293 135,283,293 Ordinary shares issued on 26 February 2015 to partially settle the investment management fee for the period ending 31 December 2014 163,478 137,949 Ordinary shares issued on 7 May 2015 to partially settle the investment management fee for the period ending 31 March 2015 155,201 101,200 Ordinary shares issued on 6 August 2015 to partially settle the investment management fee for the period ending 30 June 2015 165,947 66,379 Ordinary shares issued on 5 November 2015 to partially settle the investment management fee for the period ending 30 September 2015 166,019 25,017 Number of ordinary shares in issue at 31 December 2015 135,933,938 Weighted average number of ordinary shares in issue for the year ending 31 December 2015 n/a 135,613,838 29. Dividends The accounting policy applicable to dividends is set out in Note 3I. Per share dividend amount Date of payment of dividend Year ending 31 December 2015 £m Period from incorporation to 31 December 20141 £m Interim dividend 2 pence 29 August 2014 – 2.0 Interim dividend 4 pence 28 November 2014 – 5.4 Interim dividend 7 pence 20 March 2015 9.5 – Interim dividend 8 pence 29 May 2015 10.8 – Interim dividend 10 pence 28 August 2015 13.6 – Interim dividend 10 pence 27 November 2015 13.6 – 47.5 7.4 Footnote: 1. Date of incorporation was 23 December 2013 On 25 February 2016, the Board proposed an interim dividend of 12 pence per share, resulting in a total dividend of £16.3 million. It will be paid on 31 March 2016 to shareholders on the register at the close of business on 11 March 2016. This interim dividend has not been recognised as a liability in the consolidated financial statements as it was declared after year end. 30. Reserves The accounting policies applicable to reserves are set out in Notes 3C (i) – (ii), Note 3K and Note 3Q. A. Foreign currency translation reserve The foreign currency translation reserve comprises all foreign currency differences arising from the translation of the financial statements of foreign operations, as well as the effective portion of any foreign currency differences arising from hedges of a net investment in a foreign operation. B. Revaluation reserve The revaluation reserve relates to the revaluation of land and buildings. C. Share-based payment reserve The share-based payment reserve comprises the value of rights in respect of share-based payment arrangements relating to certain investment management fees (Note 31A (i)). The share-based payment reserve also comprises the value of rights in respect of the performance fee arrangements determined in accordance with the investment management agreement (Note 31A (ii)). Notes to the consolidated financial statements For the year ended 31 December 2015 continued Kennedy Wilson Europe Real Estate Plc / Annual Report and Accounts 2015136
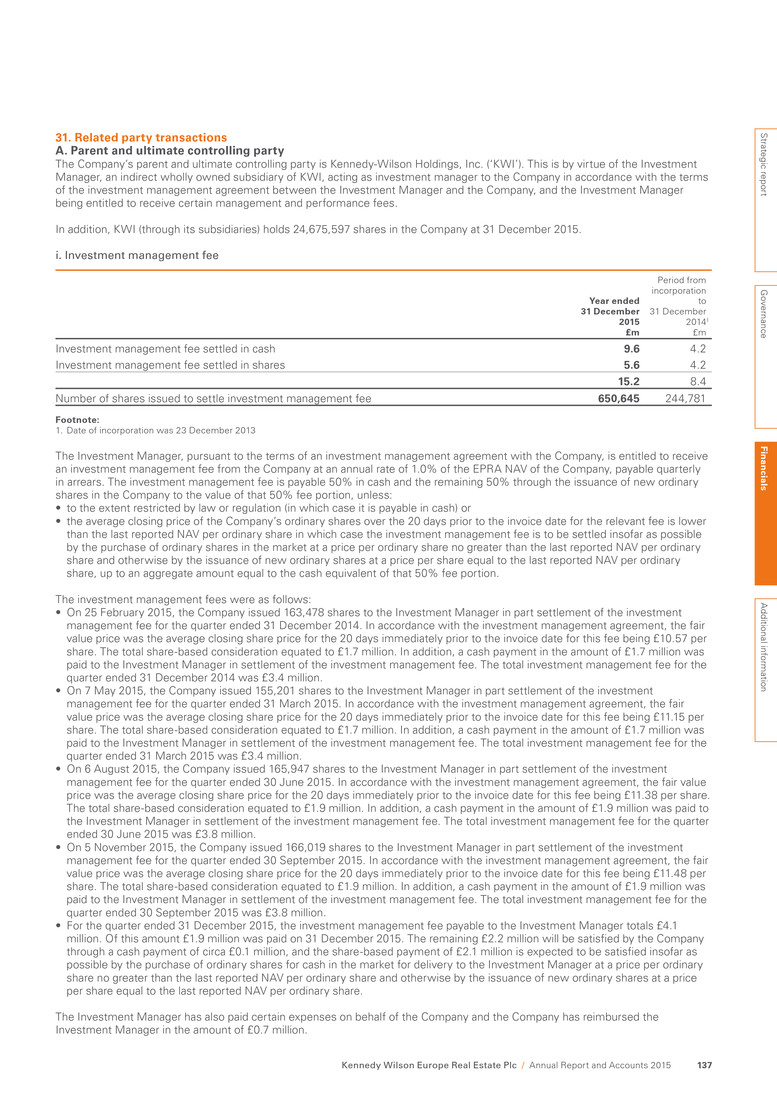
31. Related party transactions A. Parent and ultimate controlling party The Company’s parent and ultimate controlling party is Kennedy-Wilson Holdings, Inc. (‘KWI’). This is by virtue of the Investment Manager, an indirect wholly owned subsidiary of KWI, acting as investment manager to the Company in accordance with the terms of the investment management agreement between the Investment Manager and the Company, and the Investment Manager being entitled to receive certain management and performance fees. In addition, KWI (through its subsidiaries) holds 24,675,597 shares in the Company at 31 December 2015. i. Investment management fee Year ended 31 December 2015 £m Period from incorporation to 31 December 20141 £m Investment management fee settled in cash 9.6 4.2 Investment management fee settled in shares 5.6 4.2 15.2 8.4 Number of shares issued to settle investment management fee 650,645 244,781 Footnote: 1. Date of incorporation was 23 December 2013 The Investment Manager, pursuant to the terms of an investment management agreement with the Company, is entitled to receive an investment management fee from the Company at an annual rate of 1.0% of the EPRA NAV of the Company, payable quarterly in arrears. The investment management fee is payable 50% in cash and the remaining 50% through the issuance of new ordinary shares in the Company to the value of that 50% fee portion, unless: • to the extent restricted by law or regulation (in which case it is payable in cash) or • the average closing price of the Company’s ordinary shares over the 20 days prior to the invoice date for the relevant fee is lower than the last reported NAV per ordinary share in which case the investment management fee is to be settled insofar as possible by the purchase of ordinary shares in the market at a price per ordinary share no greater than the last reported NAV per ordinary share and otherwise by the issuance of new ordinary shares at a price per share equal to the last reported NAV per ordinary share, up to an aggregate amount equal to the cash equivalent of that 50% fee portion. The investment management fees were as follows: • On 25 February 2015, the Company issued 163,478 shares to the Investment Manager in part settlement of the investment management fee for the quarter ended 31 December 2014. In accordance with the investment management agreement, the fair value price was the average closing share price for the 20 days immediately prior to the invoice date for this fee being £10.57 per share. The total share-based consideration equated to £1.7 million. In addition, a cash payment in the amount of £1.7 million was paid to the Investment Manager in settlement of the investment management fee. The total investment management fee for the quarter ended 31 December 2014 was £3.4 million. • On 7 May 2015, the Company issued 155,201 shares to the Investment Manager in part settlement of the investment management fee for the quarter ended 31 March 2015. In accordance with the investment management agreement, the fair value price was the average closing share price for the 20 days immediately prior to the invoice date for this fee being £11.15 per share. The total share-based consideration equated to £1.7 million. In addition, a cash payment in the amount of £1.7 million was paid to the Investment Manager in settlement of the investment management fee. The total investment management fee for the quarter ended 31 March 2015 was £3.4 million. • On 6 August 2015, the Company issued 165,947 shares to the Investment Manager in part settlement of the investment management fee for the quarter ended 30 June 2015. In accordance with the investment management agreement, the fair value price was the average closing share price for the 20 days immediately prior to the invoice date for this fee being £11.38 per share. The total share-based consideration equated to £1.9 million. In addition, a cash payment in the amount of £1.9 million was paid to the Investment Manager in settlement of the investment management fee. The total investment management fee for the quarter ended 30 June 2015 was £3.8 million. • On 5 November 2015, the Company issued 166,019 shares to the Investment Manager in part settlement of the investment management fee for the quarter ended 30 September 2015. In accordance with the investment management agreement, the fair value price was the average closing share price for the 20 days immediately prior to the invoice date for this fee being £11.48 per share. The total share-based consideration equated to £1.9 million. In addition, a cash payment in the amount of £1.9 million was paid to the Investment Manager in settlement of the investment management fee. The total investment management fee for the quarter ended 30 September 2015 was £3.8 million. • For the quarter ended 31 December 2015, the investment management fee payable to the Investment Manager totals £4.1 million. Of this amount £1.9 million was paid on 31 December 2015. The remaining £2.2 million will be satisfied by the Company through a cash payment of circa £0.1 million, and the share-based payment of £2.1 million is expected to be satisfied insofar as possible by the purchase of ordinary shares for cash in the market for delivery to the Investment Manager at a price per ordinary share no greater than the last reported NAV per ordinary share and otherwise by the issuance of new ordinary shares at a price per share equal to the last reported NAV per ordinary share. The Investment Manager has also paid certain expenses on behalf of the Company and the Company has reimbursed the Investment Manager in the amount of £0.7 million. Strategic report G overnance Fin an cials A dditional inform ation Kennedy Wilson Europe Real Estate Plc / Annual Report and Accounts 2015 137
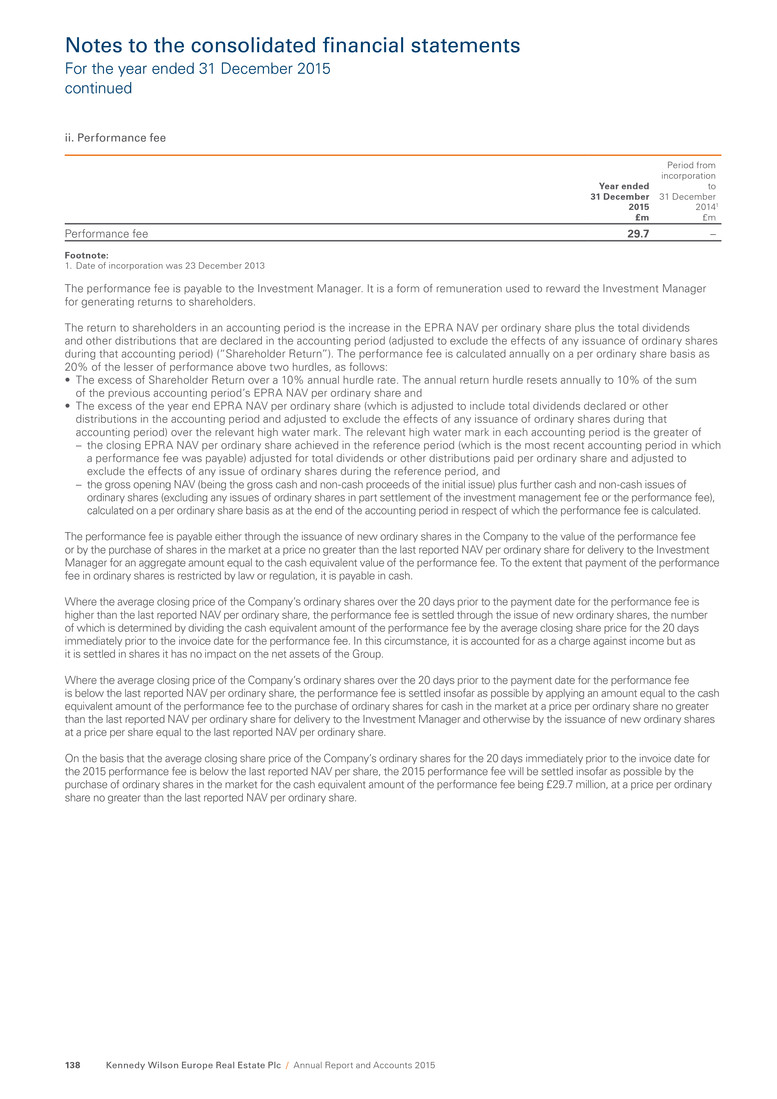
ii. Performance fee Year ended 31 December 2015 £m Period from incorporation to 31 December 20141 £m Performance fee 29.7 – Footnote: 1. Date of incorporation was 23 December 2013 The performance fee is payable to the Investment Manager. It is a form of remuneration used to reward the Investment Manager for generating returns to shareholders. The return to shareholders in an accounting period is the increase in the EPRA NAV per ordinary share plus the total dividends and other distributions that are declared in the accounting period (adjusted to exclude the effects of any issuance of ordinary shares during that accounting period) (“Shareholder Return”). The performance fee is calculated annually on a per ordinary share basis as 20% of the lesser of performance above two hurdles, as follows: • The excess of Shareholder Return over a 10% annual hurdle rate. The annual return hurdle resets annually to 10% of the sum of the previous accounting period’s EPRA NAV per ordinary share and • The excess of the year end EPRA NAV per ordinary share (which is adjusted to include total dividends declared or other distributions in the accounting period and adjusted to exclude the effects of any issuance of ordinary shares during that accounting period) over the relevant high water mark. The relevant high water mark in each accounting period is the greater of – the closing EPRA NAV per ordinary share achieved in the reference period (which is the most recent accounting period in which a performance fee was payable) adjusted for total dividends or other distributions paid per ordinary share and adjusted to exclude the effects of any issue of ordinary shares during the reference period, and – the gross opening NAV (being the gross cash and non-cash proceeds of the initial issue) plus further cash and non-cash issues of ordinary shares (excluding any issues of ordinary shares in part settlement of the investment management fee or the performance fee), calculated on a per ordinary share basis as at the end of the accounting period in respect of which the performance fee is calculated. The performance fee is payable either through the issuance of new ordinary shares in the Company to the value of the performance fee or by the purchase of shares in the market at a price no greater than the last reported NAV per ordinary share for delivery to the Investment Manager for an aggregate amount equal to the cash equivalent value of the performance fee. To the extent that payment of the performance fee in ordinary shares is restricted by law or regulation, it is payable in cash. Where the average closing price of the Company’s ordinary shares over the 20 days prior to the payment date for the performance fee is higher than the last reported NAV per ordinary share, the performance fee is settled through the issue of new ordinary shares, the number of which is determined by dividing the cash equivalent amount of the performance fee by the average closing share price for the 20 days immediately prior to the invoice date for the performance fee. In this circumstance, it is accounted for as a charge against income but as it is settled in shares it has no impact on the net assets of the Group. Where the average closing price of the Company’s ordinary shares over the 20 days prior to the payment date for the performance fee is below the last reported NAV per ordinary share, the performance fee is settled insofar as possible by applying an amount equal to the cash equivalent amount of the performance fee to the purchase of ordinary shares for cash in the market at a price per ordinary share no greater than the last reported NAV per ordinary share for delivery to the Investment Manager and otherwise by the issuance of new ordinary shares at a price per share equal to the last reported NAV per ordinary share. On the basis that the average closing share price of the Company’s ordinary shares for the 20 days immediately prior to the invoice date for the 2015 performance fee is below the last reported NAV per share, the 2015 performance fee will be settled insofar as possible by the purchase of ordinary shares in the market for the cash equivalent amount of the performance fee being £29.7 million, at a price per ordinary share no greater than the last reported NAV per ordinary share. Notes to the consolidated financial statements For the year ended 31 December 2015 continued Kennedy Wilson Europe Real Estate Plc / Annual Report and Accounts 2015138
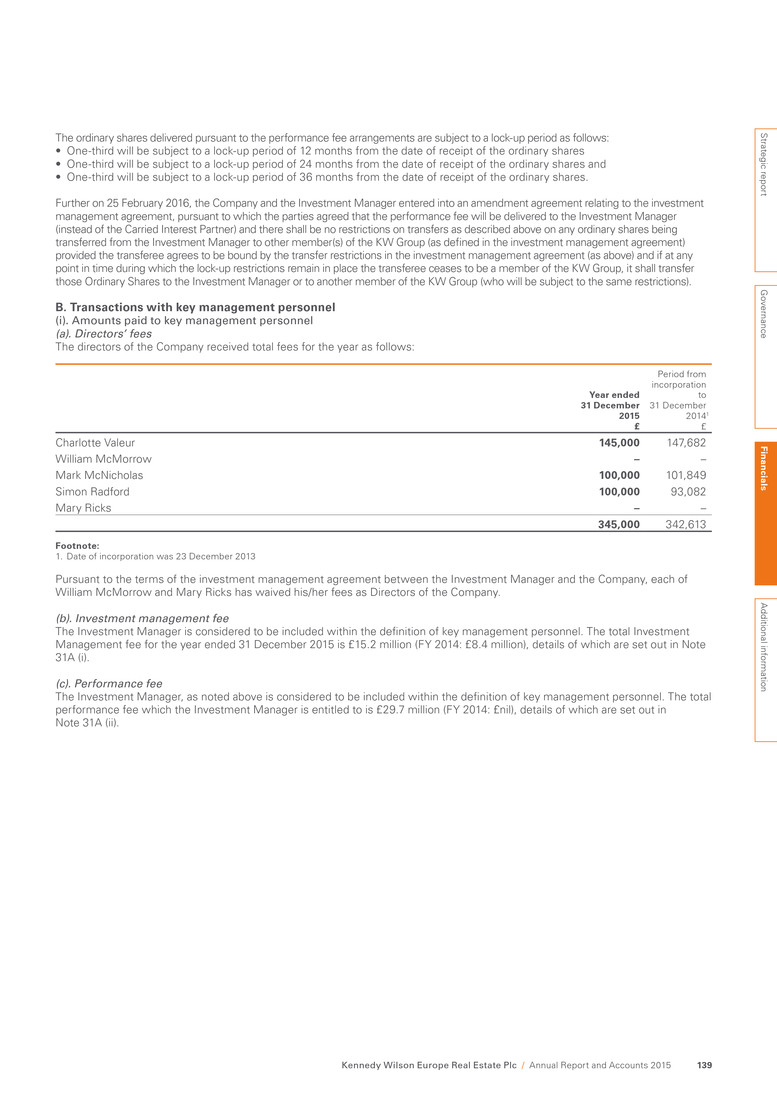
The ordinary shares delivered pursuant to the performance fee arrangements are subject to a lock-up period as follows: • One-third will be subject to a lock-up period of 12 months from the date of receipt of the ordinary shares • One-third will be subject to a lock-up period of 24 months from the date of receipt of the ordinary shares and • One-third will be subject to a lock-up period of 36 months from the date of receipt of the ordinary shares. Further on 25 February 2016, the Company and the Investment Manager entered into an amendment agreement relating to the investment management agreement, pursuant to which the parties agreed that the performance fee will be delivered to the Investment Manager (instead of the Carried Interest Partner) and there shall be no restrictions on transfers as described above on any ordinary shares being transferred from the Investment Manager to other member(s) of the KW Group (as defined in the investment management agreement) provided the transferee agrees to be bound by the transfer restrictions in the investment management agreement (as above) and if at any point in time during which the lock-up restrictions remain in place the transferee ceases to be a member of the KW Group, it shall transfer those Ordinary Shares to the Investment Manager or to another member of the KW Group (who will be subject to the same restrictions). B. Transactions with key management personnel (i). Amounts paid to key management personnel (a). Directors’ fees The directors of the Company received total fees for the year as follows: Year ended 31 December 2015 £ Period from incorporation to 31 December 20141 £ Charlotte Valeur 145,000 147,682 William McMorrow – – Mark McNicholas 100,000 101,849 Simon Radford 100,000 93,082 Mary Ricks – – 345,000 342,613 Footnote: 1. Date of incorporation was 23 December 2013 Pursuant to the terms of the investment management agreement between the Investment Manager and the Company, each of William McMorrow and Mary Ricks has waived his/her fees as Directors of the Company. (b). Investment management fee The Investment Manager is considered to be included within the definition of key management personnel. The total Investment Management fee for the year ended 31 December 2015 is £15.2 million (FY 2014: £8.4 million), details of which are set out in Note 31A (i). (c). Performance fee The Investment Manager, as noted above is considered to be included within the definition of key management personnel. The total performance fee which the Investment Manager is entitled to is £29.7 million (FY 2014: £nil), details of which are set out in Note 31A (ii). Strategic report G overnance Fin an cials A dditional inform ation Kennedy Wilson Europe Real Estate Plc / Annual Report and Accounts 2015 139
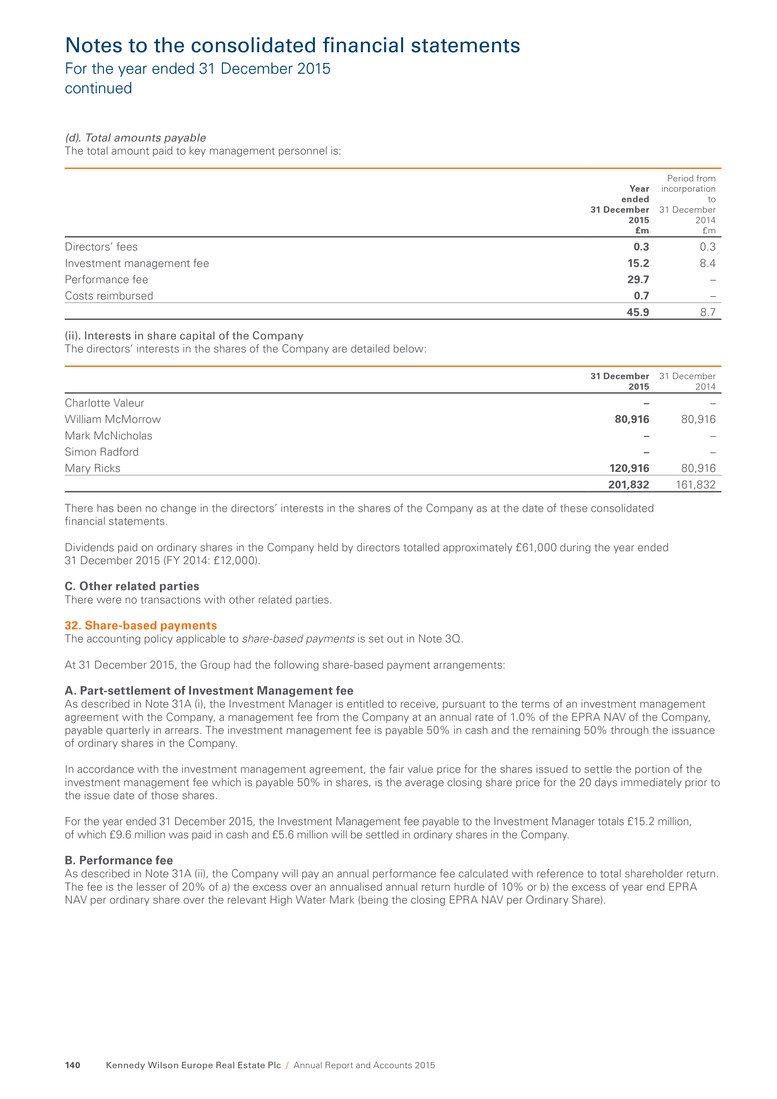
(d). Total amounts payable The total amount paid to key management personnel is: Year ended 31 December 2015 £m Period from incorporation to 31 December 2014 £m Directors’ fees 0.3 0.3 Investment management fee 15.2 8.4 Performance fee 29.7 – Costs reimbursed 0.7 – 45.9 8.7 (ii). Interests in share capital of the Company The directors’ interests in the shares of the Company are detailed below: 31 December 2015 31 December 2014 Charlotte Valeur – – William McMorrow 80,916 80,916 Mark McNicholas – – Simon Radford – – Mary Ricks 120,916 80,916 201,832 161,832 There has been no change in the directors’ interests in the shares of the Company as at the date of these consolidated financial statements. Dividends paid on ordinary shares in the Company held by directors totalled approximately £61,000 during the year ended 31 December 2015 (FY 2014: £12,000). C. Other related parties There were no transactions with other related parties. 32. Share-based payments The accounting policy applicable to share-based payments is set out in Note 3Q. At 31 December 2015, the Group had the following share-based payment arrangements: A. Part-settlement of Investment Management fee As described in Note 31A (i), the Investment Manager is entitled to receive, pursuant to the terms of an investment management agreement with the Company, a management fee from the Company at an annual rate of 1.0% of the EPRA NAV of the Company, payable quarterly in arrears. The investment management fee is payable 50% in cash and the remaining 50% through the issuance of ordinary shares in the Company. In accordance with the investment management agreement, the fair value price for the shares issued to settle the portion of the investment management fee which is payable 50% in shares, is the average closing share price for the 20 days immediately prior to the issue date of those shares. For the year ended 31 December 2015, the Investment Management fee payable to the Investment Manager totals £15.2 million, of which £9.6 million was paid in cash and £5.6 million will be settled in ordinary shares in the Company. B. Performance fee As described in Note 31A (ii), the Company will pay an annual performance fee calculated with reference to total shareholder return. The fee is the lesser of 20% of a) the excess over an annualised annual return hurdle of 10% or b) the excess of year end EPRA NAV per ordinary share over the relevant High Water Mark (being the closing EPRA NAV per Ordinary Share). Notes to the consolidated financial statements For the year ended 31 December 2015 continued Kennedy Wilson Europe Real Estate Plc / Annual Report and Accounts 2015140
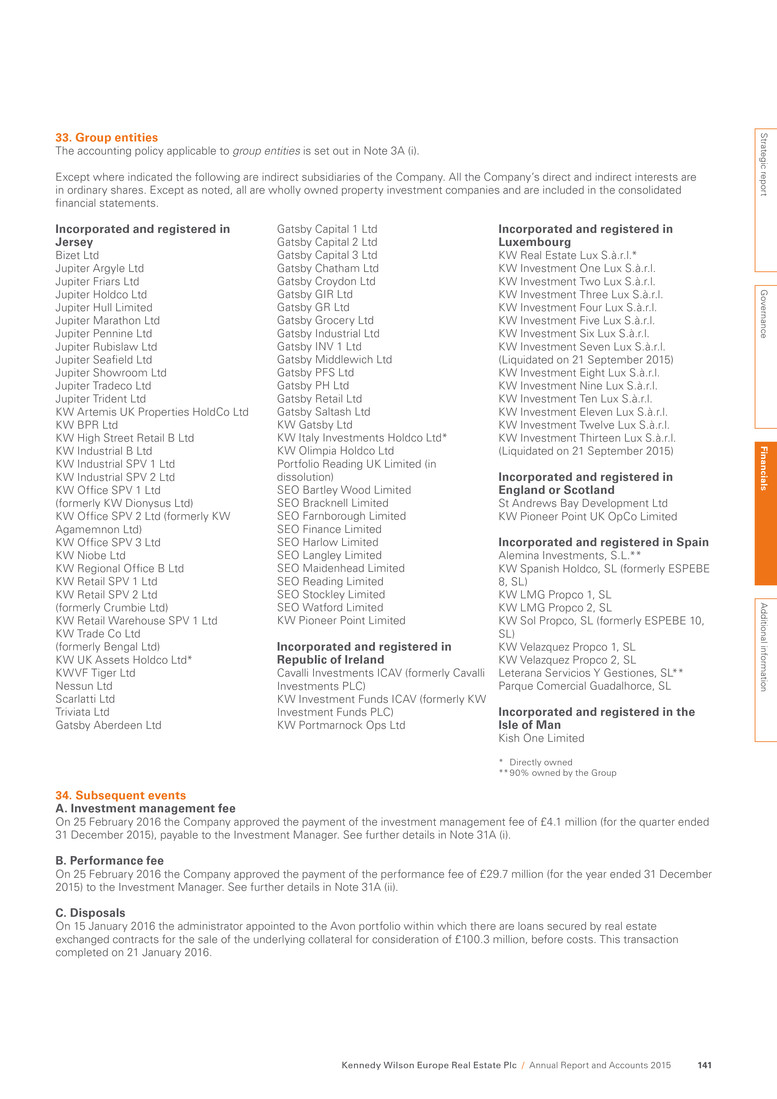
33. Group entities The accounting policy applicable to group entities is set out in Note 3A (i). Except where indicated the following are indirect subsidiaries of the Company. All the Company’s direct and indirect interests are in ordinary shares. Except as noted, all are wholly owned property investment companies and are included in the consolidated financial statements. Incorporated and registered in Jersey Bizet Ltd Jupiter Argyle Ltd Jupiter Friars Ltd Jupiter Holdco Ltd Jupiter Hull Limited Jupiter Marathon Ltd Jupiter Pennine Ltd Jupiter Rubislaw Ltd Jupiter Seafield Ltd Jupiter Showroom Ltd Jupiter Tradeco Ltd Jupiter Trident Ltd KW Artemis UK Properties HoldCo Ltd KW BPR Ltd KW High Street Retail B Ltd KW Industrial B Ltd KW Industrial SPV 1 Ltd KW Industrial SPV 2 Ltd KW Office SPV 1 Ltd (formerly KW Dionysus Ltd) KW Office SPV 2 Ltd (formerly KW Agamemnon Ltd) KW Office SPV 3 Ltd KW Niobe Ltd KW Regional Office B Ltd KW Retail SPV 1 Ltd KW Retail SPV 2 Ltd (formerly Crumbie Ltd) KW Retail Warehouse SPV 1 Ltd KW Trade Co Ltd (formerly Bengal Ltd) KW UK Assets Holdco Ltd* KWVF Tiger Ltd Nessun Ltd Scarlatti Ltd Triviata Ltd Gatsby Aberdeen Ltd Gatsby Capital 1 Ltd Gatsby Capital 2 Ltd Gatsby Capital 3 Ltd Gatsby Chatham Ltd Gatsby Croydon Ltd Gatsby GIR Ltd Gatsby GR Ltd Gatsby Grocery Ltd Gatsby Industrial Ltd Gatsby INV 1 Ltd Gatsby Middlewich Ltd Gatsby PFS Ltd Gatsby PH Ltd Gatsby Retail Ltd Gatsby Saltash Ltd KW Gatsby Ltd KW Italy Investments Holdco Ltd* KW Olimpia Holdco Ltd Portfolio Reading UK Limited (in dissolution) SEO Bartley Wood Limited SEO Bracknell Limited SEO Farnborough Limited SEO Finance Limited SEO Harlow Limited SEO Langley Limited SEO Maidenhead Limited SEO Reading Limited SEO Stockley Limited SEO Watford Limited KW Pioneer Point Limited Incorporated and registered in Republic of Ireland Cavalli Investments ICAV (formerly Cavalli Investments PLC) KW Investment Funds ICAV (formerly KW Investment Funds PLC) KW Portmarnock Ops Ltd Incorporated and registered in Luxembourg KW Real Estate Lux S.à.r.l.* KW Investment One Lux S.à.r.l. KW Investment Two Lux S.à.r.l. KW Investment Three Lux S.à.r.l. KW Investment Four Lux S.à.r.l. KW Investment Five Lux S.à.r.l. KW Investment Six Lux S.à.r.l. KW Investment Seven Lux S.à.r.l. (Liquidated on 21 September 2015) KW Investment Eight Lux S.à.r.l. KW Investment Nine Lux S.à.r.l. KW Investment Ten Lux S.à.r.l. KW Investment Eleven Lux S.à.r.l. KW Investment Twelve Lux S.à.r.l. KW Investment Thirteen Lux S.à.r.l. (Liquidated on 21 September 2015) Incorporated and registered in England or Scotland St Andrews Bay Development Ltd KW Pioneer Point UK OpCo Limited Incorporated and registered in Spain Alemina Investments, S.L.** KW Spanish Holdco, SL (formerly ESPEBE 8, SL) KW LMG Propco 1, SL KW LMG Propco 2, SL KW Sol Propco, SL (formerly ESPEBE 10, SL) KW Velazquez Propco 1, SL KW Velazquez Propco 2, SL Leterana Servicios Y Gestiones, SL** Parque Comercial Guadalhorce, SL Incorporated and registered in the Isle of Man Kish One Limited * Directly owned ** 90% owned by the Group 34. Subsequent events A. Investment management fee On 25 February 2016 the Company approved the payment of the investment management fee of £4.1 million (for the quarter ended 31 December 2015), payable to the Investment Manager. See further details in Note 31A (i). B. Performance fee On 25 February 2016 the Company approved the payment of the performance fee of £29.7 million (for the year ended 31 December 2015) to the Investment Manager. See further details in Note 31A (ii). C. Disposals On 15 January 2016 the administrator appointed to the Avon portfolio within which there are loans secured by real estate exchanged contracts for the sale of the underlying collateral for consideration of £100.3 million, before costs. This transaction completed on 21 January 2016. Strategic report G overnance Fin an cials A dditional inform ation Kennedy Wilson Europe Real Estate Plc / Annual Report and Accounts 2015 141
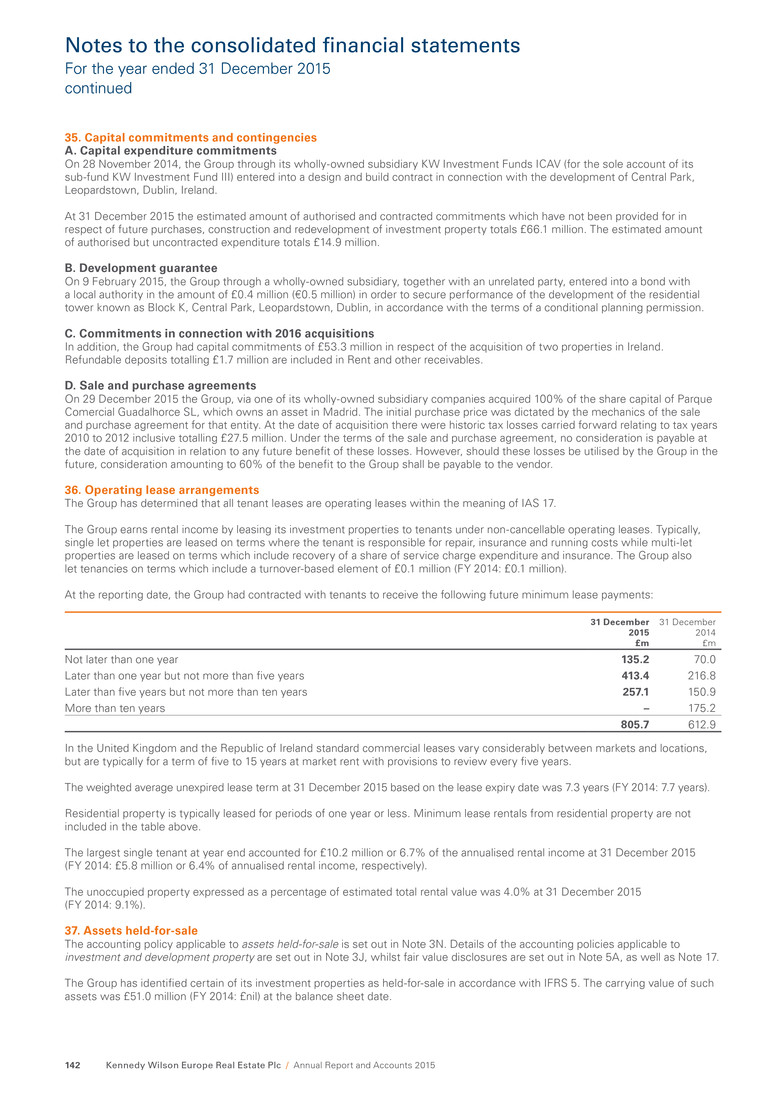
35. Capital commitments and contingencies A. Capital expenditure commitments On 28 November 2014, the Group through its wholly-owned subsidiary KW Investment Funds ICAV (for the sole account of its sub-fund KW Investment Fund III) entered into a design and build contract in connection with the development of Central Park, Leopardstown, Dublin, Ireland. At 31 December 2015 the estimated amount of authorised and contracted commitments which have not been provided for in respect of future purchases, construction and redevelopment of investment property totals £66.1 million. The estimated amount of authorised but uncontracted expenditure totals £14.9 million. B. Development guarantee On 9 February 2015, the Group through a wholly-owned subsidiary, together with an unrelated party, entered into a bond with a local authority in the amount of £0.4 million (€0.5 million) in order to secure performance of the development of the residential tower known as Block K, Central Park, Leopardstown, Dublin, in accordance with the terms of a conditional planning permission. C. Commitments in connection with 2016 acquisitions In addition, the Group had capital commitments of £53.3 million in respect of the acquisition of two properties in Ireland. Refundable deposits totalling £1.7 million are included in Rent and other receivables. D. Sale and purchase agreements On 29 December 2015 the Group, via one of its wholly-owned subsidiary companies acquired 100% of the share capital of Parque Comercial Guadalhorce SL, which owns an asset in Madrid. The initial purchase price was dictated by the mechanics of the sale and purchase agreement for that entity. At the date of acquisition there were historic tax losses carried forward relating to tax years 2010 to 2012 inclusive totalling £27.5 million. Under the terms of the sale and purchase agreement, no consideration is payable at the date of acquisition in relation to any future benefit of these losses. However, should these losses be utilised by the Group in the future, consideration amounting to 60% of the benefit to the Group shall be payable to the vendor. 36. Operating lease arrangements The Group has determined that all tenant leases are operating leases within the meaning of IAS 17. The Group earns rental income by leasing its investment properties to tenants under non-cancellable operating leases. Typically, single let properties are leased on terms where the tenant is responsible for repair, insurance and running costs while multi-let properties are leased on terms which include recovery of a share of service charge expenditure and insurance. The Group also let tenancies on terms which include a turnover-based element of £0.1 million (FY 2014: £0.1 million). At the reporting date, the Group had contracted with tenants to receive the following future minimum lease payments: 31 December 2015 £m 31 December 2014 £m Not later than one year 135.2 70.0 Later than one year but not more than five years 413.4 216.8 Later than five years but not more than ten years 257.1 150.9 More than ten years – 175.2 805.7 612.9 In the United Kingdom and the Republic of Ireland standard commercial leases vary considerably between markets and locations, but are typically for a term of five to 15 years at market rent with provisions to review every five years. The weighted average unexpired lease term at 31 December 2015 based on the lease expiry date was 7.3 years (FY 2014: 7.7 years). Residential property is typically leased for periods of one year or less. Minimum lease rentals from residential property are not included in the table above. The largest single tenant at year end accounted for £10.2 million or 6.7% of the annualised rental income at 31 December 2015 (FY 2014: £5.8 million or 6.4% of annualised rental income, respectively). The unoccupied property expressed as a percentage of estimated total rental value was 4.0% at 31 December 2015 (FY 2014: 9.1%). 37. Assets held-for-sale The accounting policy applicable to assets held-for-sale is set out in Note 3N. Details of the accounting policies applicable to investment and development property are set out in Note 3J, whilst fair value disclosures are set out in Note 5A, as well as Note 17. The Group has identified certain of its investment properties as held-for-sale in accordance with IFRS 5. The carrying value of such assets was £51.0 million (FY 2014: £nil) at the balance sheet date. Notes to the consolidated financial statements For the year ended 31 December 2015 continued Kennedy Wilson Europe Real Estate Plc / Annual Report and Accounts 2015142

38. Employee benefit expense The accounting policy applicable to employee benefit expense is set out in Note 3E. Year ended 31 December 2015 £m Period from incorporation to 31 December 20141 £m Aggregate remuneration of employees comprises: Wages and salaries 6.1 3.0 Social security costs 0.5 0.3 Other pension costs 0.1 – Other employment cost 0.1 – 6.8 3.3 Average number of employees2 377 357 Footnotes: 1. Date of incorporation was 23 December 2013 2. 2014 number is the average number over a 12-month period to 31 December 2014 Details of directors’ emoluments are set out in Note 31B. All employees are employed by subsidiaries of the Group within the hotel operations segment. 39. Auditor’s remuneration The remuneration of KPMG, the Group’s auditor is disclosed below: Year ended 31 December 2015 £m Period from incorporation to 31 December 20141 £m Audit services2 Audit of the consolidated financial statements 0.3 0.2 Audit of subsidiary undertakings 0.1 0.1 0.4 0.3 Audit related services Review of interim financial statements2 0.1 0.1 Capital markets transactions3 4 0.1 0.8 0.2 0.9 Fees for other services Tax advisory services5 0.4 0.8 Transaction advisory services5 0.2 0.1 Tax compliance services2 0.1 – 0.7 0.9 1.3 2.1 Footnotes: 1. Date of incorporation was 23 December 2013 2. Costs associated with these items are typically expensed through the income statement in the period in which the expense is incurred 3. Costs associated with equity fundraisings are typically applied against the Stated Capital balance in the consolidated balance sheet. For further information refer to Note 28 4. Costs associated with debt transactions are typically capitalised into borrowing costs and amortised over the period of the associated debt. For further information refer to Note 25 5. Costs associated with these items may, depending on the nature of the transaction for which services are being provided, either be expensed during the period that a cost is incurred, or capitalised into the underlying cost base of the associated asset Details of the Group’s policy on the use of its auditors for other services, the reason the audit firm was used rather than another supplier and how the auditor’s independence and objectivity was safeguarded are set out in the Audit Committee report in the Corporate Governance section of the Annual Report and Accounts. The Group continues to monitor the provision of non-audit services provided by the auditor and fees charged for other services. No services were provided pursuant to contingent fee arrangements. Strategic report G overnance Fin an cials A dditional inform ation Kennedy Wilson Europe Real Estate Plc / Annual Report and Accounts 2015 143
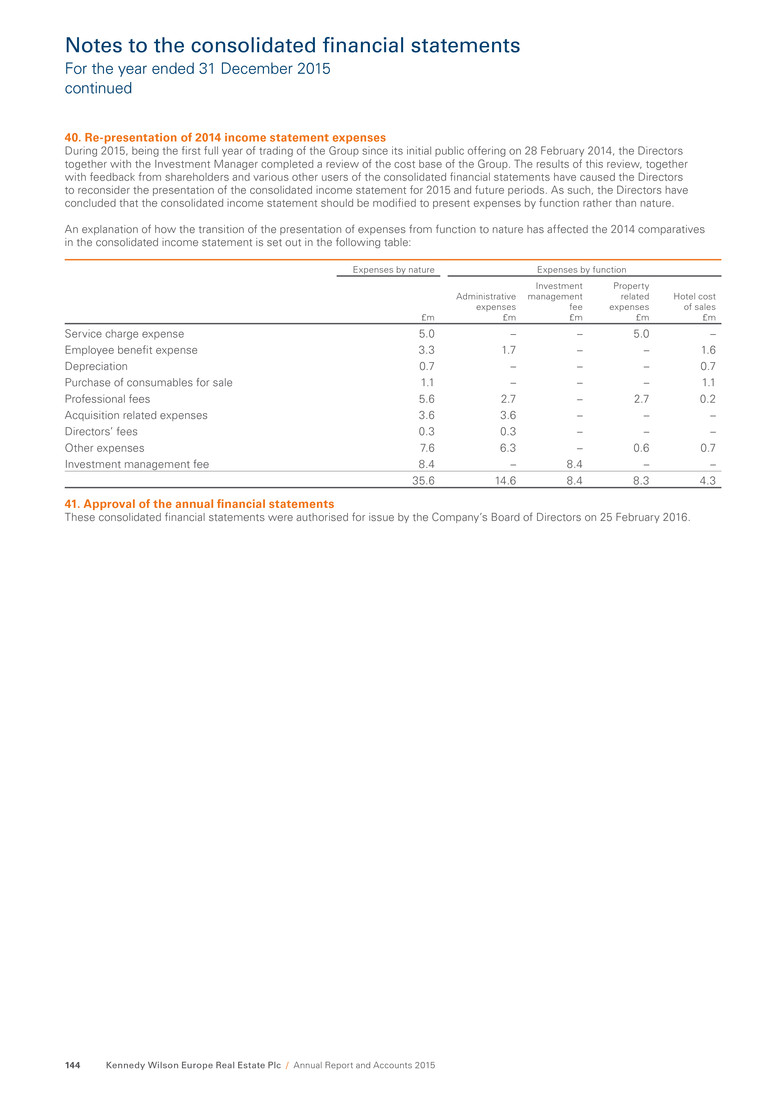
Notes to the consolidated financial statements For the year ended 31 December 2015 continued 40. Re-presentation of 2014 income statement expenses During 2015, being the first full year of trading of the Group since its initial public offering on 28 February 2014, the Directors together with the Investment Manager completed a review of the cost base of the Group. The results of this review, together with feedback from shareholders and various other users of the consolidated financial statements have caused the Directors to reconsider the presentation of the consolidated income statement for 2015 and future periods. As such, the Directors have concluded that the consolidated income statement should be modified to present expenses by function rather than nature. An explanation of how the transition of the presentation of expenses from function to nature has affected the 2014 comparatives in the consolidated income statement is set out in the following table: Expenses by nature Expenses by function £m Administrative expenses £m Investment management fee £m Property related expenses £m Hotel cost of sales £m Service charge expense 5.0 – – 5.0 – Employee benefit expense 3.3 1.7 – – 1.6 Depreciation 0.7 – – – 0.7 Purchase of consumables for sale 1.1 – – – 1.1 Professional fees 5.6 2.7 – 2.7 0.2 Acquisition related expenses 3.6 3.6 – – – Directors’ fees 0.3 0.3 – – – Other expenses 7.6 6.3 – 0.6 0.7 Investment management fee 8.4 – 8.4 – – 35.6 14.6 8.4 8.3 4.3 41. Approval of the annual financial statements These consolidated financial statements were authorised for issue by the Company’s Board of Directors on 25 February 2016. Kennedy Wilson Europe Real Estate Plc / Annual Report and Accounts 2015144
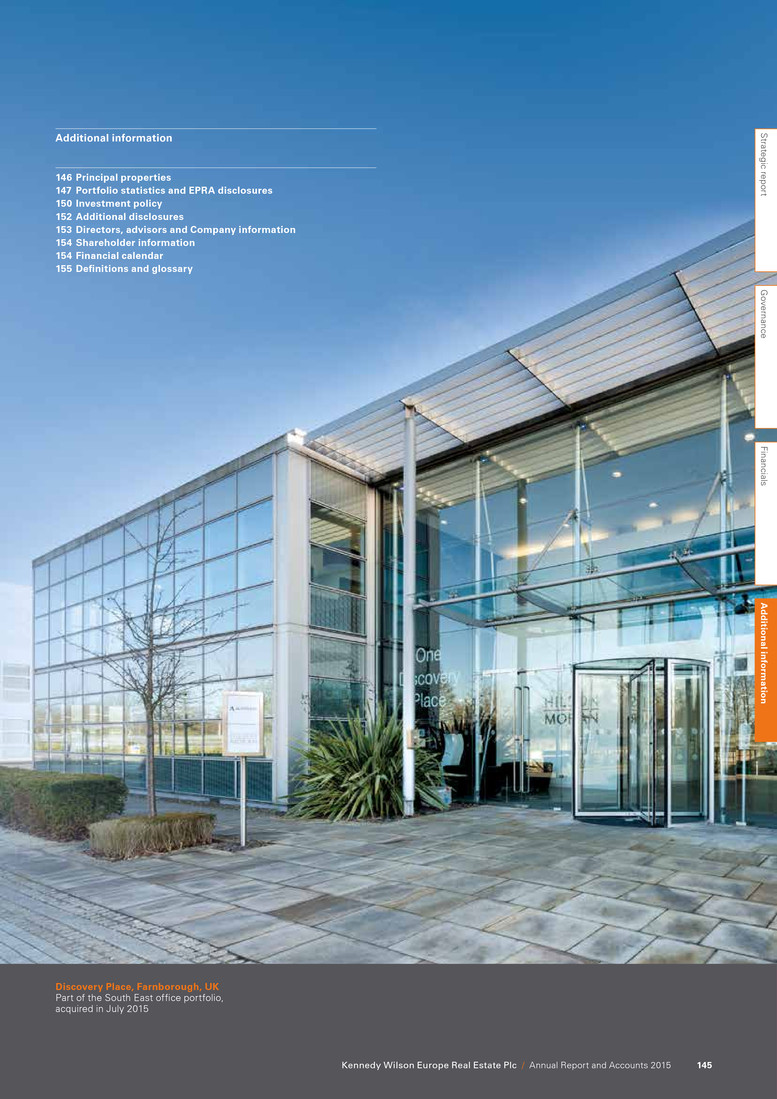
Discovery Place, Farnborough, UK Part of the South East office portfolio, acquired in July 2015 Kennedy Wilson Europe Real Estate Plc / Annual Report and Accounts 2015 145 Strategic report G overnance Financials A d d itio n al in fo rm atio n Additional information 146 Principal properties 147 Portfolio statistics and EPRA disclosures 150 Investment policy 152 Additional disclosures 153 Directors, advisors and Company information 154 Shareholder information 154 Financial calendar 155 Definitions and glossary
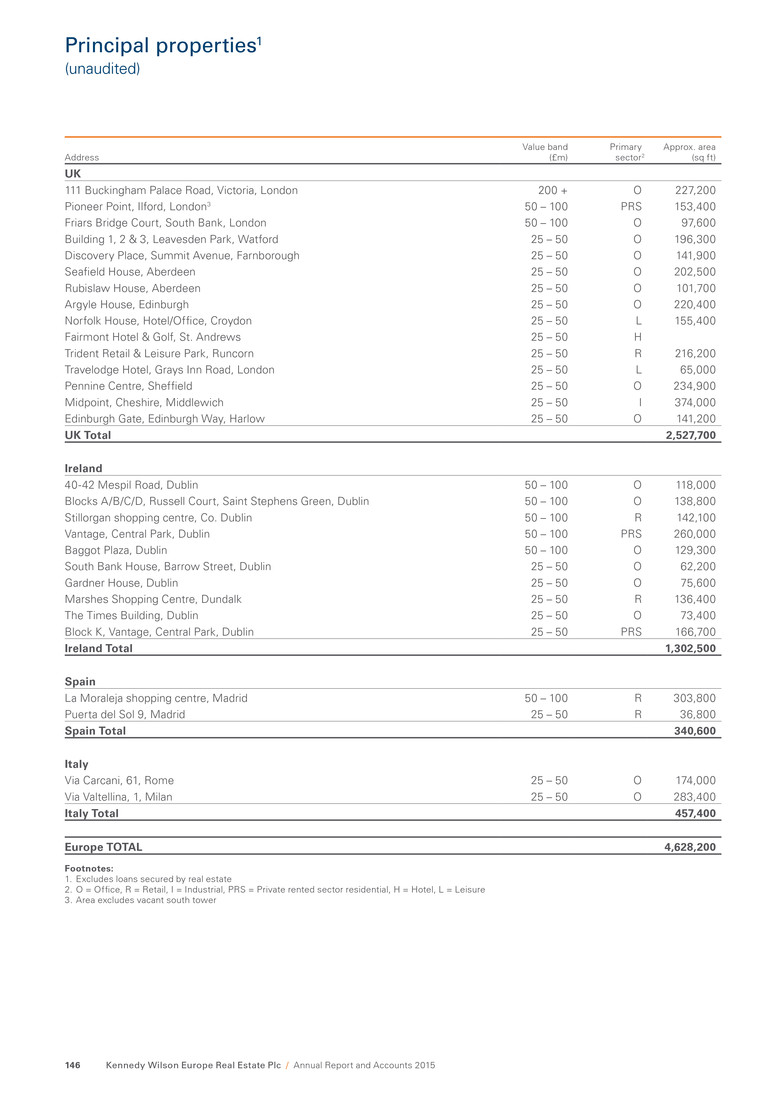
Principal properties1 (unaudited) Address Value band (£m) Primary sector2 Approx. area (sq ft) UK 111 Buckingham Palace Road, Victoria, London 200 + O 227,200 Pioneer Point, Ilford, London3 50 – 100 PRS 153,400 Friars Bridge Court, South Bank, London 50 – 100 O 97,600 Building 1, 2 & 3, Leavesden Park, Watford 25 – 50 O 196,300 Discovery Place, Summit Avenue, Farnborough 25 – 50 O 141,900 Seafield House, Aberdeen 25 – 50 O 202,500 Rubislaw House, Aberdeen 25 – 50 O 101,700 Argyle House, Edinburgh 25 – 50 O 220,400 Norfolk House, Hotel/Office, Croydon 25 – 50 L 155,400 Fairmont Hotel & Golf, St. Andrews 25 – 50 H Trident Retail & Leisure Park, Runcorn 25 – 50 R 216,200 Travelodge Hotel, Grays Inn Road, London 25 – 50 L 65,000 Pennine Centre, Sheffield 25 – 50 O 234,900 Midpoint, Cheshire, Middlewich 25 – 50 I 374,000 Edinburgh Gate, Edinburgh Way, Harlow 25 – 50 O 141,200 UK Total 2,527,700 Ireland 40-42 Mespil Road, Dublin 50 – 100 O 118,000 Blocks A/B/C/D, Russell Court, Saint Stephens Green, Dublin 50 – 100 O 138,800 Stillorgan shopping centre, Co. Dublin 50 – 100 R 142,100 Vantage, Central Park, Dublin 50 – 100 PRS 260,000 Baggot Plaza, Dublin 50 – 100 O 129,300 South Bank House, Barrow Street, Dublin 25 – 50 O 62,200 Gardner House, Dublin 25 – 50 O 75,600 Marshes Shopping Centre, Dundalk 25 – 50 R 136,400 The Times Building, Dublin 25 – 50 O 73,400 Block K, Vantage, Central Park, Dublin 25 – 50 PRS 166,700 Ireland Total 1,302,500 Spain La Moraleja shopping centre, Madrid 50 – 100 R 303,800 Puerta del Sol 9, Madrid 25 – 50 R 36,800 Spain Total 340,600 Italy Via Carcani, 61, Rome 25 – 50 O 174,000 Via Valtellina, 1, Milan 25 – 50 O 283,400 Italy Total 457,400 Europe TOTAL 4,628,200 Footnotes: 1. Excludes loans secured by real estate 2. O = Office, R = Retail, I = Industrial, PRS = Private rented sector residential, H = Hotel, L = Leisure 3. Area excludes vacant south tower Kennedy Wilson Europe Real Estate Plc / Annual Report and Accounts 2015146
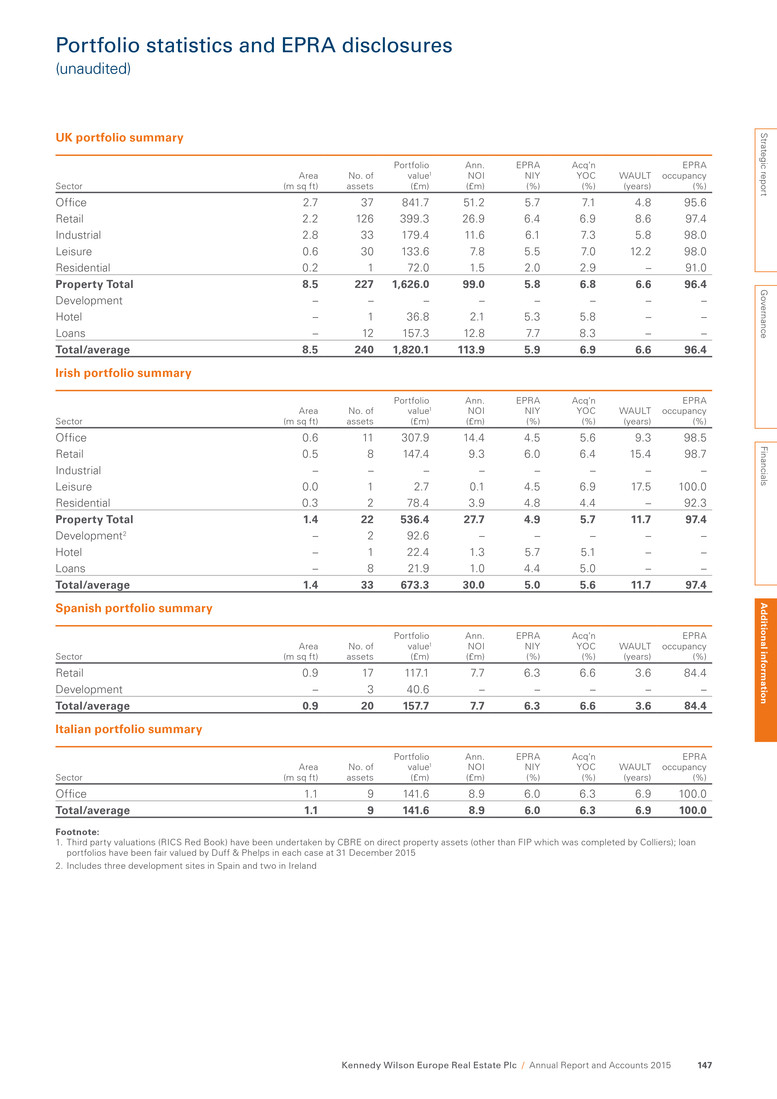
Portfolio statistics and EPRA disclosures (unaudited) UK portfolio summary Sector Area (m sq ft) No. of assets Portfolio value1 (£m) Ann. NOI (£m) EPRA NIY (%) Acq’n YOC (%) WAULT (years) EPRA occupancy (%) Office 2.7 37 841.7 51.2 5.7 7.1 4.8 95.6 Retail 2.2 126 399.3 26.9 6.4 6.9 8.6 97.4 Industrial 2.8 33 179.4 11.6 6.1 7.3 5.8 98.0 Leisure 0.6 30 133.6 7.8 5.5 7.0 12.2 98.0 Residential 0.2 1 72.0 1.5 2.0 2.9 – 91.0 Property Total 8.5 227 1,626.0 99.0 5.8 6.8 6.6 96.4 Development – – – – – – – – Hotel – 1 36.8 2.1 5.3 5.8 – – Loans – 12 157.3 12.8 7.7 8.3 – – Total/average 8.5 240 1,820.1 113.9 5.9 6.9 6.6 96.4 Irish portfolio summary Sector Area (m sq ft) No. of assets Portfolio value1 (£m) Ann. NOI (£m) EPRA NIY (%) Acq’n YOC (%) WAULT (years) EPRA occupancy (%) Office 0.6 11 307.9 14.4 4.5 5.6 9.3 98.5 Retail 0.5 8 147.4 9.3 6.0 6.4 15.4 98.7 Industrial – – – – – – – – Leisure 0.0 1 2.7 0.1 4.5 6.9 17.5 100.0 Residential 0.3 2 78.4 3.9 4.8 4.4 – 92.3 Property Total 1.4 22 536.4 27.7 4.9 5.7 11.7 97.4 Development2 – 2 92.6 – – – – – Hotel – 1 22.4 1.3 5.7 5.1 – – Loans – 8 21.9 1.0 4.4 5.0 – – Total/average 1.4 33 673.3 30.0 5.0 5.6 11.7 97.4 Spanish portfolio summary Sector Area (m sq ft) No. of assets Portfolio value1 (£m) Ann. NOI (£m) EPRA NIY (%) Acq’n YOC (%) WAULT (years) EPRA occupancy (%) Retail 0.9 17 117.1 7.7 6.3 6.6 3.6 84.4 Development – 3 40.6 – – – – – Total/average 0.9 20 157.7 7.7 6.3 6.6 3.6 84.4 Italian portfolio summary Sector Area (m sq ft) No. of assets Portfolio value1 (£m) Ann. NOI (£m) EPRA NIY (%) Acq’n YOC (%) WAULT (years) EPRA occupancy (%) Office 1.1 9 141.6 8.9 6.0 6.3 6.9 100.0 Total/average 1.1 9 141.6 8.9 6.0 6.3 6.9 100.0 Footnote: 1. Third party valuations (RICS Red Book) have been undertaken by CBRE on direct property assets (other than FIP which was completed by Colliers); loan portfolios have been fair valued by Duff & Phelps in each case at 31 December 2015 2. Includes three development sites in Spain and two in Ireland Strategic report G overnance Financials A d d itio n al in fo rm atio n Kennedy Wilson Europe Real Estate Plc / Annual Report and Accounts 2015 147
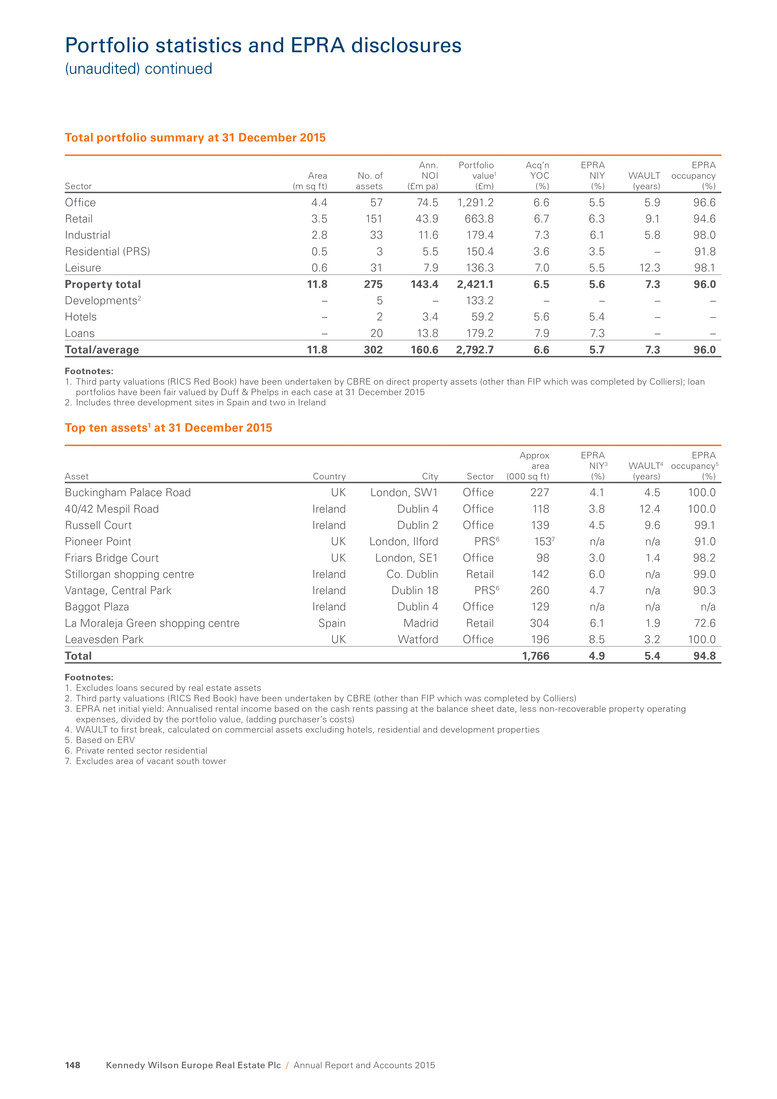
Portfolio statistics and EPRA disclosures (unaudited) continued Total portfolio summary at 31 December 2015 Sector Area (m sq ft) No. of assets Ann. NOI (£m pa) Portfolio value1 (£m) Acq’n YOC (%) EPRA NIY (%) WAULT (years) EPRA occupancy (%) Office 4.4 57 74.5 1,291.2 6.6 5.5 5.9 96.6 Retail 3.5 151 43.9 663.8 6.7 6.3 9.1 94.6 Industrial 2.8 33 11.6 179.4 7.3 6.1 5.8 98.0 Residential (PRS) 0.5 3 5.5 150.4 3.6 3.5 – 91.8 Leisure 0.6 31 7.9 136.3 7.0 5.5 12.3 98.1 Property total 11.8 275 143.4 2,421.1 6.5 5.6 7.3 96.0 Developments2 – 5 – 133.2 – – – – Hotels – 2 3.4 59.2 5.6 5.4 – – Loans – 20 13.8 179.2 7.9 7.3 – – Total/average 11.8 302 160.6 2,792.7 6.6 5.7 7.3 96.0 Footnotes: 1. Third party valuations (RICS Red Book) have been undertaken by CBRE on direct property assets (other than FIP which was completed by Colliers); loan portfolios have been fair valued by Duff & Phelps in each case at 31 December 2015 2. Includes three development sites in Spain and two in Ireland Top ten assets1 at 31 December 2015 Asset Country City Sector Approx area (000 sq ft) EPRA NIY3 (%) WAULT4 (years) EPRA occupancy5 (%) Buckingham Palace Road UK London, SW1 Office 227 4.1 4.5 100.0 40/42 Mespil Road Ireland Dublin 4 Office 118 3.8 12.4 100.0 Russell Court Ireland Dublin 2 Office 139 4.5 9.6 99.1 Pioneer Point UK London, Ilford PRS6 1537 n/a n/a 91.0 Friars Bridge Court UK London, SE1 Office 98 3.0 1.4 98.2 Stillorgan shopping centre Ireland Co. Dublin Retail 142 6.0 n/a 99.0 Vantage, Central Park Ireland Dublin 18 PRS6 260 4.7 n/a 90.3 Baggot Plaza Ireland Dublin 4 Office 129 n/a n/a n/a La Moraleja Green shopping centre Spain Madrid Retail 304 6.1 1.9 72.6 Leavesden Park UK Watford Office 196 8.5 3.2 100.0 Total 1,766 4.9 5.4 94.8 Footnotes: 1. Excludes loans secured by real estate assets 2. Third party valuations (RICS Red Book) have been undertaken by CBRE (other than FIP which was completed by Colliers) 3. EPRA net initial yield: Annualised rental income based on the cash rents passing at the balance sheet date, less non-recoverable property operating expenses, divided by the portfolio value, (adding purchaser’s costs) 4. WAULT to first break, calculated on commercial assets excluding hotels, residential and development properties 5. Based on ERV 6. Private rented sector residential 7. Excludes area of vacant south tower Kennedy Wilson Europe Real Estate Plc / Annual Report and Accounts 2015148

Top ten tenants at 31 December 2015 Tenant Total rent (£m) % of total rent Italian Government 10.2 6.7 Telegraph Media Group 5.8 3.8 British Telecommunications Plc 4.8 3.2 Carrefour 3.8 2.5 UK Government 3.6 2.4 Bank of Ireland 3.4 2.3 KPMG 3.3 2.2 Conoco (UK) Ltd 3.0 2.0 Wincanton Ltd 2.8 1.9 HSBC Plc 2.8 1.8 Top ten tenants 43.5 28.8 Remaining tenants 107.7 71.2 Total 151.2 100.0 Lease expiry profile1 at 31 December 2015 Number of leases expiring Gross annual rent (£m) % of total gross annual rent 2016 161 12.5 8 2017 95 16.3 11 2018 74 13.2 9 2019 61 12.8 9 2020 89 16.0 11 2021 41 11.0 7 2022 34 16.7 11 2023 31 5.1 4 2024 32 4.8 3 Thereafter 160 39.4 27 Total 778 147.8 100 Footnote: 1. Commercial leases only – excludes residential, hotel and development assets, loan portfolios and other miscellaneous income Other EPRA measures EPRA earnings per share (p) 26.0 EPRA NAV per share (p) 1,197.8 EPRA NNNAV per share (p) 1,194.3 EPRA NIY (%) 5.7 EPRA topped up NIY (%) 5.9 EPRA occupancy (%) 96.0 (unaudited) Strategic report G overnance Financials A d d itio n al in fo rm atio n Kennedy Wilson Europe Real Estate Plc / Annual Report and Accounts 2015 149
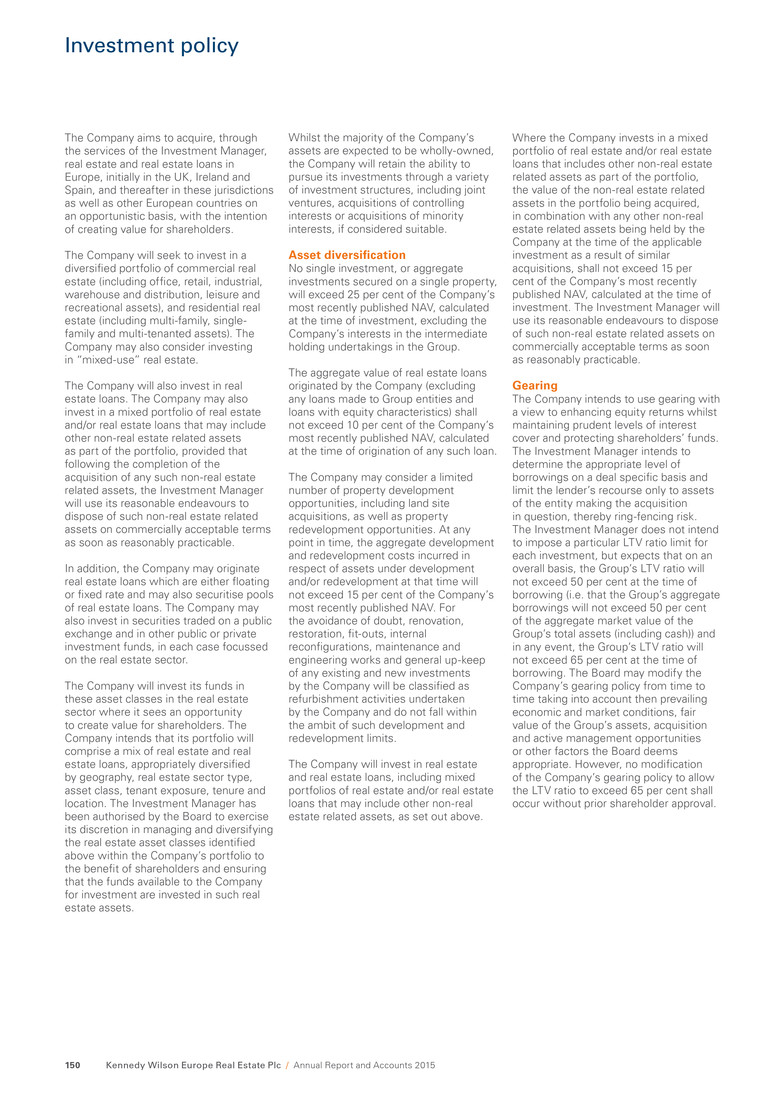
Investment policy The Company aims to acquire, through the services of the Investment Manager, real estate and real estate loans in Europe, initially in the UK, Ireland and Spain, and thereafter in these jurisdictions as well as other European countries on an opportunistic basis, with the intention of creating value for shareholders. The Company will seek to invest in a diversified portfolio of commercial real estate (including office, retail, industrial, warehouse and distribution, leisure and recreational assets), and residential real estate (including multi-family, single- family and multi-tenanted assets). The Company may also consider investing in “mixed-use” real estate. The Company will also invest in real estate loans. The Company may also invest in a mixed portfolio of real estate and/or real estate loans that may include other non-real estate related assets as part of the portfolio, provided that following the completion of the acquisition of any such non-real estate related assets, the Investment Manager will use its reasonable endeavours to dispose of such non-real estate related assets on commercially acceptable terms as soon as reasonably practicable. In addition, the Company may originate real estate loans which are either floating or fixed rate and may also securitise pools of real estate loans. The Company may also invest in securities traded on a public exchange and in other public or private investment funds, in each case focussed on the real estate sector. The Company will invest its funds in these asset classes in the real estate sector where it sees an opportunity to create value for shareholders. The Company intends that its portfolio will comprise a mix of real estate and real estate loans, appropriately diversified by geography, real estate sector type, asset class, tenant exposure, tenure and location. The Investment Manager has been authorised by the Board to exercise its discretion in managing and diversifying the real estate asset classes identified above within the Company’s portfolio to the benefit of shareholders and ensuring that the funds available to the Company for investment are invested in such real estate assets. Whilst the majority of the Company’s assets are expected to be wholly-owned, the Company will retain the ability to pursue its investments through a variety of investment structures, including joint ventures, acquisitions of controlling interests or acquisitions of minority interests, if considered suitable. Asset diversification No single investment, or aggregate investments secured on a single property, will exceed 25 per cent of the Company’s most recently published NAV, calculated at the time of investment, excluding the Company’s interests in the intermediate holding undertakings in the Group. The aggregate value of real estate loans originated by the Company (excluding any loans made to Group entities and loans with equity characteristics) shall not exceed 10 per cent of the Company’s most recently published NAV, calculated at the time of origination of any such loan. The Company may consider a limited number of property development opportunities, including land site acquisitions, as well as property redevelopment opportunities. At any point in time, the aggregate development and redevelopment costs incurred in respect of assets under development and/or redevelopment at that time will not exceed 15 per cent of the Company’s most recently published NAV. For the avoidance of doubt, renovation, restoration, fit-outs, internal reconfigurations, maintenance and engineering works and general up-keep of any existing and new investments by the Company will be classified as refurbishment activities undertaken by the Company and do not fall within the ambit of such development and redevelopment limits. The Company will invest in real estate and real estate loans, including mixed portfolios of real estate and/or real estate loans that may include other non-real estate related assets, as set out above. Where the Company invests in a mixed portfolio of real estate and/or real estate loans that includes other non-real estate related assets as part of the portfolio, the value of the non-real estate related assets in the portfolio being acquired, in combination with any other non-real estate related assets being held by the Company at the time of the applicable investment as a result of similar acquisitions, shall not exceed 15 per cent of the Company’s most recently published NAV, calculated at the time of investment. The Investment Manager will use its reasonable endeavours to dispose of such non-real estate related assets on commercially acceptable terms as soon as reasonably practicable. Gearing The Company intends to use gearing with a view to enhancing equity returns whilst maintaining prudent levels of interest cover and protecting shareholders’ funds. The Investment Manager intends to determine the appropriate level of borrowings on a deal specific basis and limit the lender’s recourse only to assets of the entity making the acquisition in question, thereby ring-fencing risk. The Investment Manager does not intend to impose a particular LTV ratio limit for each investment, but expects that on an overall basis, the Group’s LTV ratio will not exceed 50 per cent at the time of borrowing (i.e. that the Group’s aggregate borrowings will not exceed 50 per cent of the aggregate market value of the Group’s total assets (including cash)) and in any event, the Group’s LTV ratio will not exceed 65 per cent at the time of borrowing. The Board may modify the Company’s gearing policy from time to time taking into account then prevailing economic and market conditions, fair value of the Group’s assets, acquisition and active management opportunities or other factors the Board deems appropriate. However, no modification of the Company’s gearing policy to allow the LTV ratio to exceed 65 per cent shall occur without prior shareholder approval. Kennedy Wilson Europe Real Estate Plc / Annual Report and Accounts 2015150
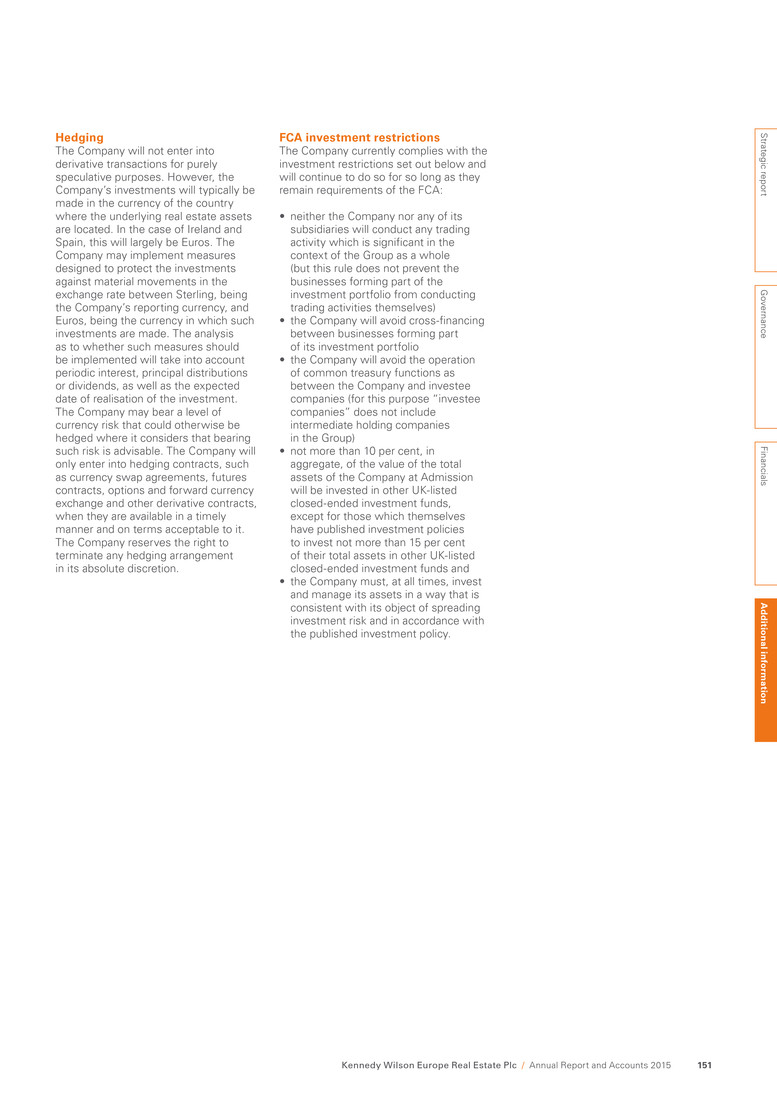
Hedging The Company will not enter into derivative transactions for purely speculative purposes. However, the Company’s investments will typically be made in the currency of the country where the underlying real estate assets are located. In the case of Ireland and Spain, this will largely be Euros. The Company may implement measures designed to protect the investments against material movements in the exchange rate between Sterling, being the Company’s reporting currency, and Euros, being the currency in which such investments are made. The analysis as to whether such measures should be implemented will take into account periodic interest, principal distributions or dividends, as well as the expected date of realisation of the investment. The Company may bear a level of currency risk that could otherwise be hedged where it considers that bearing such risk is advisable. The Company will only enter into hedging contracts, such as currency swap agreements, futures contracts, options and forward currency exchange and other derivative contracts, when they are available in a timely manner and on terms acceptable to it. The Company reserves the right to terminate any hedging arrangement in its absolute discretion. FCA investment restrictions The Company currently complies with the investment restrictions set out below and will continue to do so for so long as they remain requirements of the FCA: • neither the Company nor any of its subsidiaries will conduct any trading activity which is significant in the context of the Group as a whole (but this rule does not prevent the businesses forming part of the investment portfolio from conducting trading activities themselves) • the Company will avoid cross-financing between businesses forming part of its investment portfolio • the Company will avoid the operation of common treasury functions as between the Company and investee companies (for this purpose “investee companies” does not include intermediate holding companies in the Group) • not more than 10 per cent, in aggregate, of the value of the total assets of the Company at Admission will be invested in other UK-listed closed-ended investment funds, except for those which themselves have published investment policies to invest not more than 15 per cent of their total assets in other UK-listed closed-ended investment funds and • the Company must, at all times, invest and manage its assets in a way that is consistent with its object of spreading investment risk and in accordance with the published investment policy. Strategic report G overnance Financials A d d itio n al in fo rm atio n Kennedy Wilson Europe Real Estate Plc / Annual Report and Accounts 2015 151
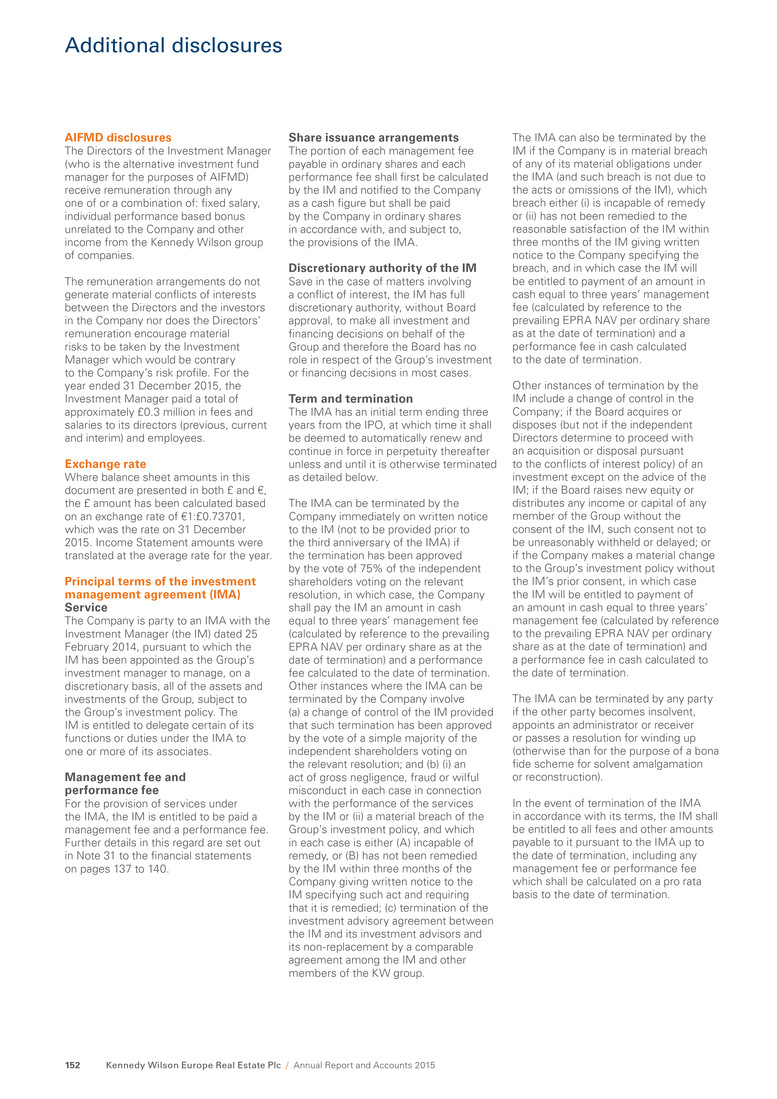
Additional disclosures AIFMD disclosures The Directors of the Investment Manager (who is the alternative investment fund manager for the purposes of AIFMD) receive remuneration through any one of or a combination of: fixed salary, individual performance based bonus unrelated to the Company and other income from the Kennedy Wilson group of companies. The remuneration arrangements do not generate material conflicts of interests between the Directors and the investors in the Company nor does the Directors’ remuneration encourage material risks to be taken by the Investment Manager which would be contrary to the Company’s risk profile. For the year ended 31 December 2015, the Investment Manager paid a total of approximately £0.3 million in fees and salaries to its directors (previous, current and interim) and employees. Exchange rate Where balance sheet amounts in this document are presented in both £ and €, the £ amount has been calculated based on an exchange rate of €1:£0.73701, which was the rate on 31 December 2015. Income Statement amounts were translated at the average rate for the year. Principal terms of the investment management agreement (IMA) Service The Company is party to an IMA with the Investment Manager (the IM) dated 25 February 2014, pursuant to which the IM has been appointed as the Group’s investment manager to manage, on a discretionary basis, all of the assets and investments of the Group, subject to the Group’s investment policy. The IM is entitled to delegate certain of its functions or duties under the IMA to one or more of its associates. Management fee and performance fee For the provision of services under the IMA, the IM is entitled to be paid a management fee and a performance fee. Further details in this regard are set out in Note 31 to the financial statements on pages 137 to 140. Share issuance arrangements The portion of each management fee payable in ordinary shares and each performance fee shall first be calculated by the IM and notified to the Company as a cash figure but shall be paid by the Company in ordinary shares in accordance with, and subject to, the provisions of the IMA. Discretionary authority of the IM Save in the case of matters involving a conflict of interest, the IM has full discretionary authority, without Board approval, to make all investment and financing decisions on behalf of the Group and therefore the Board has no role in respect of the Group’s investment or financing decisions in most cases. Term and termination The IMA has an initial term ending three years from the IPO, at which time it shall be deemed to automatically renew and continue in force in perpetuity thereafter unless and until it is otherwise terminated as detailed below. The IMA can be terminated by the Company immediately on written notice to the IM (not to be provided prior to the third anniversary of the IMA) if the termination has been approved by the vote of 75% of the independent shareholders voting on the relevant resolution, in which case, the Company shall pay the IM an amount in cash equal to three years’ management fee (calculated by reference to the prevailing EPRA NAV per ordinary share as at the date of termination) and a performance fee calculated to the date of termination. Other instances where the IMA can be terminated by the Company involve (a) a change of control of the IM provided that such termination has been approved by the vote of a simple majority of the independent shareholders voting on the relevant resolution; and (b) (i) an act of gross negligence, fraud or wilful misconduct in each case in connection with the performance of the services by the IM or (ii) a material breach of the Group’s investment policy, and which in each case is either (A) incapable of remedy, or (B) has not been remedied by the IM within three months of the Company giving written notice to the IM specifying such act and requiring that it is remedied; (c) termination of the investment advisory agreement between the IM and its investment advisors and its non-replacement by a comparable agreement among the IM and other members of the KW group. The IMA can also be terminated by the IM if the Company is in material breach of any of its material obligations under the IMA (and such breach is not due to the acts or omissions of the IM), which breach either (i) is incapable of remedy or (ii) has not been remedied to the reasonable satisfaction of the IM within three months of the IM giving written notice to the Company specifying the breach, and in which case the IM will be entitled to payment of an amount in cash equal to three years’ management fee (calculated by reference to the prevailing EPRA NAV per ordinary share as at the date of termination) and a performance fee in cash calculated to the date of termination. Other instances of termination by the IM include a change of control in the Company; if the Board acquires or disposes (but not if the independent Directors determine to proceed with an acquisition or disposal pursuant to the conflicts of interest policy) of an investment except on the advice of the IM; if the Board raises new equity or distributes any income or capital of any member of the Group without the consent of the IM, such consent not to be unreasonably withheld or delayed; or if the Company makes a material change to the Group’s investment policy without the IM’s prior consent, in which case the IM will be entitled to payment of an amount in cash equal to three years’ management fee (calculated by reference to the prevailing EPRA NAV per ordinary share as at the date of termination) and a performance fee in cash calculated to the date of termination. The IMA can be terminated by any party if the other party becomes insolvent, appoints an administrator or receiver or passes a resolution for winding up (otherwise than for the purpose of a bona fide scheme for solvent amalgamation or reconstruction). In the event of termination of the IMA in accordance with its terms, the IM shall be entitled to all fees and other amounts payable to it pursuant to the IMA up to the date of termination, including any management fee or performance fee which shall be calculated on a pro rata basis to the date of termination. Kennedy Wilson Europe Real Estate Plc / Annual Report and Accounts 2015152
Directors, advisors and Company information Directors Kennedy Wilson Europe Real Estate Plc Charlotte Valeur (Chair) William McMorrow Mark McNicholas Simon Radford Mary Ricks Investment Manager KW Investment Management Ltd Directors of the Investment Manager: Mary Ricks Mark Hodgson Andrew McNulty Registered office Kennedy Wilson Europe Real Estate Plc 47 Esplanade St Helier Jersey JE1 0BD Channel Islands Corporate broker J.P Morgan Securities plc 25 Bank Street Canary Wharf London E14 5JP United Kingdom Principal legal advisors Allen & Overy LLP (as to English law) One Bishop’s Square London E1 6AD United Kingdom Carey Olsen (as to Jersey law) 47 Esplanade St Helier Jersey JE1 0BD Channel Islands Independent valuers in the UK, Ireland, Spain and Italy Direct real estate portfolios CBRE Ltd Henrietta House Henrietta Place London W1G 0NB United Kingdom CBRE Ltd 3rd Floor, Connaught House 1 Burlington Road Dublin 4 Ireland Loan portfolios Duff & Phelps Ltd The Shard 32 London Bridge Street London SE1 9SG United Kingdom Auditor KPMG 1 Stokes Place St Stephen’s Green, Dublin 2 Ireland Administrator and Secretary Crestbridge Fund Administrators Ltd 47 Esplanade St Helier Jersey JE1 0BD Channel Islands Registrar Computershare Investor Services (Jersey) Ltd Queensway House Hilgrove Street St Helier JE1 1ES Channel Islands Financial public relations FTI Consulting 200 Aldersgate Aldersgate Street London EC1A 4HD United Kingdom Colliers Real Estate Services Italia S.r.l. con socio unico Via Durini-2 20122 Milan Italy Strategic report G overnance Financials A d d itio n al in fo rm atio n Kennedy Wilson Europe Real Estate Plc / Annual Report and Accounts 2015 153

Shareholder information Group website You can access our website at www.kennedywilson.eu to find the current share price, read the latest news in the investors section and read the Annual Report and Accounts. Registrars Administrative enquiries about the holding of Kennedy Wilson Europe Real Estate Plc shares should be directed to: Computershare Investor Services (Jersey) Queensway House Hilgrove Street St Helier JE1 1ES JERSEY Channel Islands Tel: +44 (0) 870 707 4040 A textphone facility for shareholders with hearing difficulties is available by telephoning 0870 702 0005. Shareholder profile This table sets out an analysis of the shareholder profile of the Company at 1 February 2016 Shares by size of holdings No. of holders % Shares % Kennedy-Wilson Holdings, Inc 1 0.5 24,695,597 18.2 10 million + 2 1.0 36,430,300 26.8 5-10 million 2 1.0 14,023,668 10.3 1-5 million 19 9.7 36,600,304 26.9 Less than 1 million* 171 87.7 24,184,069 17.8 Total 195 100.0 135,933,938 100.0 Footnote: * Includes 3,897,889 shares currently unknown 2016 Publication of Annual Report and Accounts and posting of AGM Notice 22 March Fourth interim dividend payment date 31 March Last date for receipt of proxy forms for AGM 25 April (10:30 am) Annual General Meeting 27 April (10:30 am) Dividends Shareholders who wish to have dividends paid directly into a bank account rather than by cheque to their registered address can complete a mandate form. To set up a dividend mandate, or change your existing mandated details, please contact the Company’s registrar, Computershare on the number provided on this page. Change of address Communications with shareholders are mailed to the addresses held on the share register. In the event of any change of address or other amendment, please notify the Company’s registrar under the signature of the registered holder. Shareholders may also register and manage their shares through Computershare’s shareholder portal – www.investorcentre.co.uk. Investment Manager The Company is advised by KW Investment Management Ltd, which is incorporated as a company limited by shares in Jersey and is wholly- owned and controlled (indirectly) by Kennedy Wilson. The Investment Manager is authorised and regulated by the Jersey Financial Services Commission under the Financial Services (Jersey) Law 1998, as amended, as an investment manager. Annual General Meeting The Annual General Meeting (AGM) of Kennedy Wilson Europe Real Estate Plc will be held at 10.30 am on 27 April 2016 at the offices of Allen & Overy LLP, One Bishops Square, London E1 6AD. Financial calendar Kennedy Wilson Europe Real Estate Plc / Annual Report and Accounts 2015154
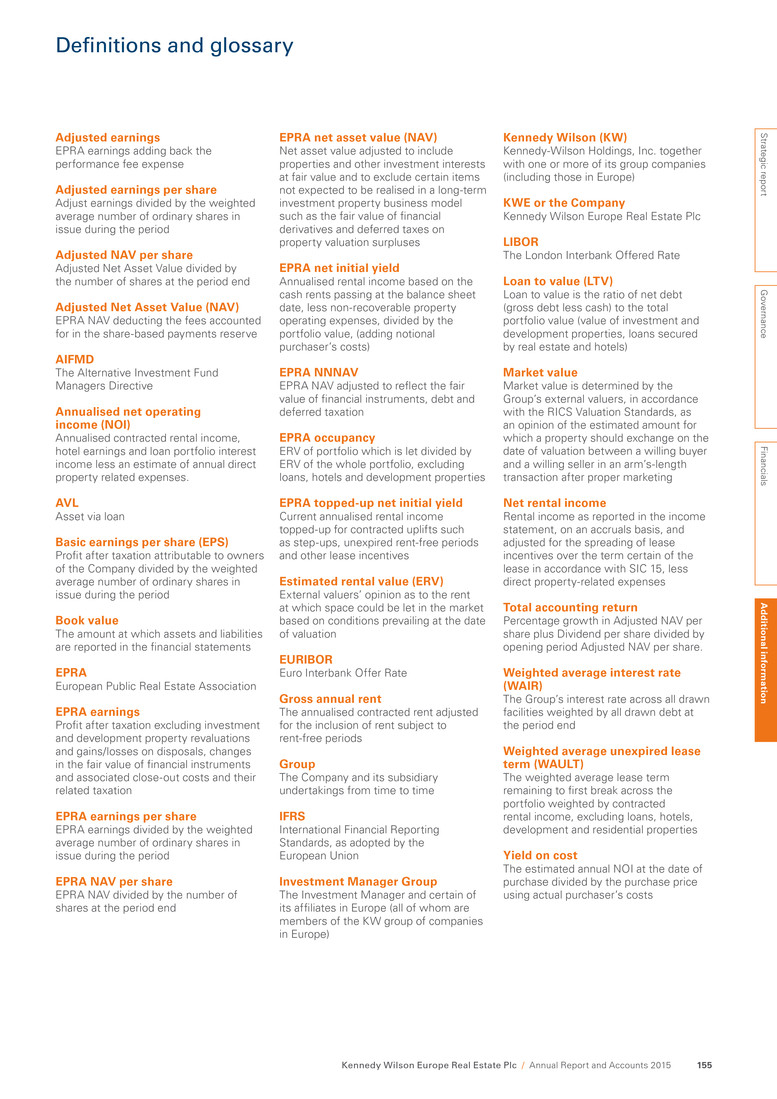
Definitions and glossary Adjusted earnings EPRA earnings adding back the performance fee expense Adjusted earnings per share Adjust earnings divided by the weighted average number of ordinary shares in issue during the period Adjusted NAV per share Adjusted Net Asset Value divided by the number of shares at the period end Adjusted Net Asset Value (NAV) EPRA NAV deducting the fees accounted for in the share-based payments reserve AIFMD The Alternative Investment Fund Managers Directive Annualised net operating income (NOI) Annualised contracted rental income, hotel earnings and loan portfolio interest income less an estimate of annual direct property related expenses. AVL Asset via loan Basic earnings per share (EPS) Profit after taxation attributable to owners of the Company divided by the weighted average number of ordinary shares in issue during the period Book value The amount at which assets and liabilities are reported in the financial statements EPRA European Public Real Estate Association EPRA earnings Profit after taxation excluding investment and development property revaluations and gains/losses on disposals, changes in the fair value of financial instruments and associated close-out costs and their related taxation EPRA earnings per share EPRA earnings divided by the weighted average number of ordinary shares in issue during the period EPRA NAV per share EPRA NAV divided by the number of shares at the period end EPRA net asset value (NAV) Net asset value adjusted to include properties and other investment interests at fair value and to exclude certain items not expected to be realised in a long-term investment property business model such as the fair value of financial derivatives and deferred taxes on property valuation surpluses EPRA net initial yield Annualised rental income based on the cash rents passing at the balance sheet date, less non-recoverable property operating expenses, divided by the portfolio value, (adding notional purchaser’s costs) EPRA NNNAV EPRA NAV adjusted to reflect the fair value of financial instruments, debt and deferred taxation EPRA occupancy ERV of portfolio which is let divided by ERV of the whole portfolio, excluding loans, hotels and development properties EPRA topped-up net initial yield Current annualised rental income topped-up for contracted uplifts such as step-ups, unexpired rent-free periods and other lease incentives Estimated rental value (ERV) External valuers’ opinion as to the rent at which space could be let in the market based on conditions prevailing at the date of valuation EURIBOR Euro Interbank Offer Rate Gross annual rent The annualised contracted rent adjusted for the inclusion of rent subject to rent-free periods Group The Company and its subsidiary undertakings from time to time IFRS International Financial Reporting Standards, as adopted by the European Union Investment Manager Group The Investment Manager and certain of its affiliates in Europe (all of whom are members of the KW group of companies in Europe) Kennedy Wilson (KW) Kennedy-Wilson Holdings, Inc. together with one or more of its group companies (including those in Europe) KWE or the Company Kennedy Wilson Europe Real Estate Plc LIBOR The London Interbank Offered Rate Loan to value (LTV) Loan to value is the ratio of net debt (gross debt less cash) to the total portfolio value (value of investment and development properties, loans secured by real estate and hotels) Market value Market value is determined by the Group’s external valuers, in accordance with the RICS Valuation Standards, as an opinion of the estimated amount for which a property should exchange on the date of valuation between a willing buyer and a willing seller in an arm’s-length transaction after proper marketing Net rental income Rental income as reported in the income statement, on an accruals basis, and adjusted for the spreading of lease incentives over the term certain of the lease in accordance with SIC 15, less direct property-related expenses Total accounting return Percentage growth in Adjusted NAV per share plus Dividend per share divided by opening period Adjusted NAV per share. Weighted average interest rate (WAIR) The Group’s interest rate across all drawn facilities weighted by all drawn debt at the period end Weighted average unexpired lease term (WAULT) The weighted average lease term remaining to first break across the portfolio weighted by contracted rental income, excluding loans, hotels, development and residential properties Yield on cost The estimated annual NOI at the date of purchase divided by the purchase price using actual purchaser’s costs Strategic report G overnance Financials A d d itio n al in fo rm atio n Kennedy Wilson Europe Real Estate Plc / Annual Report and Accounts 2015 155

Lush retail unit, Princes Street, Edinburgh, UK Acquired 30 January 2015 as part of Gatsby portfolio Kennedy Wilson Europe Real Estate Plc / Annual Report and Accounts 2015156
About KWE Kennedy Wilson Europe Real Estate Plc (LSE: KWE) is a closed-ended property investment company listed on the premium segment of the London Stock Exchange and was incorporated with limited liability in Jersey under the Companies (Jersey) Law 1991 on 23 December 2013. It aims to generate superior shareholder returns by unlocking value of under-resourced real estate across its target geographies. Its existing portfolio, in excess of £2.5 billion, is primarily invested across office and retail in the UK and Ireland, weighted towards London, the South East and Dublin. KWE is regulated in Jersey as a listed fund in accordance with the Jersey Listed Fund Guide published by the Jersey Financial Services Commission (JFSC), as amended from time to time, and the Collective Investment Funds (Jersey) Law 1988. For further information on Kennedy Wilson Europe Real Estate Plc, please visit www.kennedywilson.eu About KW Kennedy Wilson Europe Real Estate Plc is externally managed by a wholly- owned Jersey incorporated subsidiary of Kennedy Wilson. Kennedy Wilson (NYSE:KW) is a global real estate investment company. KW owns, operates, and invests in real estate both on its own and through its investment management platform. KW focuses on multifamily and commercial properties located in the Western U.S., UK, Ireland, Spain, Italy and Japan. To complement KW’s investment business, it also provides real estate services primarily to financial services clients. For further information on Kennedy Wilson, please visit www.kennedywilson.com Registered address for KWE and Investment Manager 47 Esplanade St Helier Jersey JE1 0BD Channel Islands +44 1534 835 722 Kennedy Wilson Europe offices United Kingdom 50 Grosvenor Hill London, W1K 3QT United Kingdom +44 20 7734 3993 Ireland 33 Sir John Rogerson’s Quay Dublin 2 Ireland +353 1 649 4220 Spain C/Fernando El Santo, 17 3˚ Izq. Madrid, 28010 Spain +34 91 737 2540 Jersey 29 Broad Street St Helier Jersey JE2 3RR Channel Islands +44 1534 859 442 Forward looking statements This Annual Report and Accounts has been prepared for, and only for, the members of Kennedy Wilson Europe Real Estate Plc (the Company), as a body, and no other persons. The Company, its directors, employees, agents or advisors do not accept or assume responsibility to any other person to whom this document is shown or into whose hands it may come and any such responsibility or liability is expressly disclaimed. This Annual Report and Accounts may contain certain forward- looking statements with respect to the Company and its subsidiaries (together, the Group), and the Group’s financial condition, results of operations, business, future plans and strategies, anticipated events or trends, and similar matters, that are not historical facts. Such forward-looking statements involve known and unknown risks, uncertainties and other factors, which may cause the actual results of operations, performance or achievements of the Group or industry results to be materially different from any future results, performance or achievements expressed or implied by such forward-looking statements. These forward-looking statements reflect information and knowledge available at the date of preparation of this Annual Report and Accounts. The Company undertakes no obligation to release publicly any revisions or updates to these forward-looking statements to reflect future events, circumstances, unanticipated events, new information or otherwise except as required by law or any appropriate regulatory authority. Past performance is not a guide to future performance and nothing in this Annual Report and Accounts should be construed as a profit forecast. Persons needing advice should consult an independent financial advisor. Printed by Park Communications on FSC® certified paper. Park is an EMAS certified company and its Environmental Management System is certified to ISO 14001. Designed and produced by Gather +44 (0)20 7610 6140 www.gather.london

www.kennedywilson.eu K en n ed y W ilso n E u ro p e R eal E state P lc / A n n u al R ep o rt an d A cco u n ts 2015


